colombia motion c4 - encuestalongitudinal.uniandes.edu.co
TRANSCRIPT

62
> Chiquinquirá (Boyacá).

63

64
> Luisa Fernanda lives with her family in Barrancabermeja. She shares the house with 27 people

65
chapter 4
access anD Use of health services anD health statUs
4.1 introduction
The Colombian Longitudinal Survey by Universidad de los Andes (ELCA, acronym for its name in Spanish), in addition to gathering the traditional information on affiliation to the health system and use of health servi-ces, also collects information on the perception of the population regarding the state of their health in urban and rural areas. Although the survey includes this in-formation only for heads of the households, spouses, and children under the age of 10, it is the first time that this data, with national coverage, is available for the country, even allowing for regional breakdowns. This chapter presents a descriptive analysis of the current conditions of the health system and overall health state of the Colombian adult population, focusing on the heads of the households and their spouses. First, we describe the indicators used for the analysis; then we describe the access and coverage of the health sys-tem, and evaluate the use of offered health services. Secondly, we analyze the three main health perception measures included in the survey, and we compare them with the results of the health valuation measure EQ-5D1 for urban areas, found by other studies in the international sphere.
cArmen elisA Flórez
Jorge luis cAstAñedA
------------------>
1. The EQ-5D indicator, developed by the group EuroQol, is a self-assessment tool of the state of health in five different dimensions. Its name comes from the EuroQol-5 Dimensions.
>
> Natasha Moncayo Quevedo (Córdoba, Quindío).

66
4.2. description oF the indicAtors
The current affiliation and the past year affiliation ra-tes are presented as coverage indicators of the Social Security System in health care. The first one conveys the number of individuals claiming to be beneficia-ries or to be affiliated with any entity in the system, as a proportion of total respondents. The rate of en-rollment in the last year applies to respondents who report not being currently affiliated, but were at some time during the past twelve months, and is expressed as a proportion of the total surveyed. Healthcare in Colombia comprises two types of regimes: on the one hand, affiliation to the subsidized system on which be-neficiaries, mostly among the poor, are granted free access to health services and, on the other hand, affi-liation to the contributory or special regimes (Armed Forces, National Police, Ecopetrol, public universities, and public teachers), on which users pay for their health-care plan. For those who are currently affilia-ted and those who were at some time in the past year, ELCA probes into the time they have or had been in the system. Thus, it is possible to elaborate an indicator of the average affiliation time to the health-care system in number of years.
The indicators of use of health services allow us to evaluate the practices of the population when facing
a medical eventuality, and the system’s efficiency of response (or availability) to its users, i.e., the ac-cess and quality of the health-care services. Medical needs are understood as any emergency or problem that does not require hospitalization, and are caused by sickness or chronic pain, an accident or physical injury, a dental problem, or an outpatient surgery. In response to these eventualities, those affected can either go to a health facility or a health professional (including alternative medicine), or rather resort to unskilled treatment. In this manner, the indicator for the use of services given a necessity is a first approach to the habits of the population regarding the use of the offered health-care services and, additionally, implies possible obstacles in the access to the system (costs, quality, or location). Ultimately, the indicator is defined as the percentage of individuals who access health services among those reporting a medical necessity.
A second indicator of the use of the health services is the hospitalization rate, defined as the percentage of the population surveyed who entered a hospital at least once in the last year. We considered the following causes of hospitalization: childbirth, surgeries, illnes-ses or accidents, and injuries due to violent attacks. Likewise, it is possible to calculate an indicator for the
average hospitalizations, which equals the average number of times that individuals were hospitalized in the last year for any of the reasons mentioned.
In addition to objective measures for the assessment of health, ELCA included a series of questions that in-quire about the perceived health condition of the res-pondents, based on five dimensions related to their quality of life: mobility, personal care, daily activities, pain or discomfort and stress, depression or anxiety. The respondent, according to the affliction which he or she currently believes to suffer from, must determine the severity level for each of the dimensions between high, moderate, or none. With these answers, the EQ-5D2 indicator is calculated as a synthesizing measure of the subjective assessment of the individual’s health state, where a score close to one represents a greater satisfaction with health conditions.
An alternative perception measure arises from the Visual Analogue Scale (VAS). The VAS3 score ranges from 0 to 100, representing the values for the worst and best possible health state, respectively. The res-pondent must select a number by pointing on a ruler defined in this range, which he or she considers best describes her or his current health state.
------------------>
2. It is possible to produce a total of 243 health conditions from the three response options for each of the five domains. The elaboration of the index is based on the weighting of these health conditions by the time trade-off methodology (Szende, Oppe & Devlin, 2007). Each weighting reflects the preferences that a specific population has for each of the possible health conditions. The weights used here correspond to those of the U.S. population, in order to allow for the results to be comparable with those obtained by other sources.
3. The evaluation of the psychometric VAS score, also design by the EuroQol group, is part of the standardized survey of the EQ-5D indicator.

67
4.3. coverAge And Access to the system
The health-care coverage for heads of the households and their spouses reflects similar levels between ur-ban and rural areas, with an affiliation rate close to 92%. However, when analyzing the composition of the affiliation, it emerges that in rural areas the majori-ty of the population (83%) is in the subsidized regime, while in the cities this proportion decreases to just over a third (35%). These results are consistent with the information available for the same population in the 2008 Quality of Life Survey (ECV, initialism for Encuesta de Calidad de Vida), conducted by the Na-tional Administrative Statistics Department (DANE, its Spanish acronym). According to this survey, urban coverage is around 90% of the population, with 31% in the subsidized regime and 59% in the contributory and special regimes, while coverage in rural areas is slightly lower (87%), with 70% affiliated to the subsidi-zed regime and 17% to the contributory and special re-gimes. The small discrepancy between the rural rates of the two surveys can be explained by the geographi------------------->
4. The wealth quintiles are obtained from the distribution of an index, derived from a principal component analysis of a set of variables related with the household conditions, access to utilities, and ownership of durable assets.
cal coverage of each survey. While the ECV is nationally representative, the rural ELCA is limited to four micro-regions: Mid-Atlantic, Coffee Region, East Central, and Cundiboyacense. However, both surveys reflect in essence the preponderance of the subsidized regime versus the contributory and the special regimes.
Further disaggregation of the data allows to identify particular dynamics in the urban and rural areas. When taking into account socioeco-nomic conditions4, it is possible to corroborate the differences in affiliation and in the type of regime according to the household’s level of wealth. According to Graph 4.1, especially in ur-ban areas, for lower wealth levels there is grea-ter exclusion from the health system (lower affi-liation) and a higher affiliation to the subsidized regime. As one moves up through the quintiles, the affiliation rate increases, especially to the contributory and special regimes.
>Zoila Rodriguez, Nicolás Restrepo (11 months) and psychologist Melina Mojica Santaella during testing in Bogotá.

68
Graph 4.1 AFFiliAtion rAte to the heAlth system by AreA And weAlth Quintile
Source: Own calculations based on ELCA.
Both in urban and rural areas, coverage is very homogeneous across regions, while the type of affiliation shows marked differences (see Graph 4.2). In urban areas, the affiliation rate fluctuates between 91% in the Atlantic region and 93% in the Central region, whereas by type of regime, Bogo-tá presents the lowest affiliation to the subsidized regime (20%), while the Atlantic region exhibits
the highest (53%). In rural areas, the aggregate coverage of the system is slightly more dissimi-lar: it varies between 96% in the Cundiboyacen-se region and 87% in the Mid-Atlantic. However, coverage by type of regime does not show such disparate differences as in the urban area. Affilia-tion to the subsidized regime in the rural area is between 74% in the Coffee Region and 91% in the
East Central region. These results indicate that in rural areas, in contrast to the urban area, there is a lower affiliation to the health care system but a greater equity reflected in greater homogeneity among regions, especially in the type of regime, with a preponderance of the subsidized regime. These results are consistent with previous fin-dings by Flórez et al. (2007).
Not Affiliated Subsidized Contributive and special regimes
Quintile 1 Quintile 2 Quintile 3 Quintile 4 Quintile 5 Quintile 1 Quintile 2 Quintile 3 Quintile 4 Quintile 5

69
Graph 4.2. coverAge rAte oF the heAlth system by AreA And region
ELCA shows that the affiliation to the social security system in health care is on average longer-lasting in the cities than in the farmlands, with a value close to a decade for the former (9 years), while for the latter is clearly lower (7.5 years). There are also marked differences by area in the last year affiliation rate and the type of regime of those not currently affiliated.
Source: Own calculations based on ELCA.
The affiliation rate in the last year is 95% for urban areas, while for rural areas is 93%. This implies that when we include affiliated individuals, not currently but during some point in the last year, the coverage in the cities becomes greater in comparison to ru-ral areas. This differential by area is generated by a greater increase in the affiliation to the contributory
and special regimes in urban areas, while in rural areas the affiliation to either regime (contributory or subsidized) hardly increases. In other words, in urban areas those who were not currently affiliated, but were affiliated in the previous year, were enro-lled by a greater proportion to the contributory or special regimes.
Not Affiliated Subsidized Contributive and special
Mid- Atlantic
AtlanticCundibo-yacense
EasternCoffee Region
CentralEast Central
Pacific Bogotá

70
4.4. use oF heAlth services
4.4.1. use oF proFessionAl heAlth services given A necessity
The use of health services among the heads of the households and their spouses, given a necessity that does not require hospitalization, is greater in urban areas (79%) than in rural areas (73%). This is partly explained by the greater supply of public health-care infrastructure in cities. The ECV (2008) also highlights this gap between areas, but establishes greater access in general, with rates of 87% for urban areas and of 81% for rural areas. The urban difference between the ECV and ELCA is that the latter is focused on the lowest socioeconomic levels (1 through 4), while the ECV also includes the highest socioeconomic levels (5 and 6).
In the cities there is a more uniform distribution amongst regions regarding the use of services, although the Eastern region presents a considerably lower rate: nine percentage points below the average of the remaining regions5. The wealth distribution does not seem to have a clear relation with the use of health services, although the rate for the highest wealth quin-tiles is significantly higher than that for the lowest quintile: 81% versus 72%. Finally, it is worthwhile to note that, in general, women account for greater use of ambulatory health services when compared to men: 81% vs. 76%.
Both in rural and urban areas the lowest rate is in the East Central region, although the values across the four rural regions are similar. Unlike the urban case, the wealth quintiles appear to be directly as-sociated to the use of professional health services. Hence, there is an evident increase in the use of the services as the household’s wealth increases. In particular, there is a significant difference between the extreme quintiles: 79% for the fifth quintile and 71% for the first. Again, it is found that women are the most common users of the system, with a rate of 78% compared to 67% for men. This gender diffe-rence is associated with a greater use of sexual and reproductive health services by female spouses, es-pecially those in reproductive ages, between 15 and 50 years of age.
4.4.2. hospitAlizAtion rAte And AverAge number oF hospitAlizA-tions
Hospitalizations comprises another indicator of the use of health services. In the aggregate, Colombian
household heads or their spouses in the urban area exhibit a hospitalization rate slightly higher than tho-se in the rural area, but a lower average of hospita-lizations per year. Thus, 10% of the urban head or spouse population was hospitalized in the year prior to the survey, with an average of 1.42 hospitalizations, while the figures for the rural area correspond to a rate of 9%, with an average of 1.5 hospitalizations.
By regions, the hospitalization rate and the average number of hospitalizations are fairly homogeneous in both the urban and in the rural areas. However, the Mid-Atlantic rural region presents the lowest hospitalization rate (7.6%) compared with the avera-ge for the other regions (10%), and in turn, the hig-hest average number of hospitalizations (over two per year) at a regional level.
Women generally exhibit a higher hospitalization rate than men. In urban areas, the rates are 12% for women and 8% for men, while in rural areas the va-lues are 11% for women and 6% for men. However, although women use more hospital services due to their reproductive role, men who do so are hospitali-zed a greater number of times a year.
------------------>
5. When excluding the Eastern region, the average for the urban area increases from 79% to 81%.

71
4.5. indicAtors oF the heAlth stAtus
4.5.1. dimensions oF the heAlth stAtus
The indicators for perceived health conditions re-veal that the surveyed household heads and their spouses are satisfied with the state of their health. For the five dimensions that describe the health status, the response alternatives moderate and severe are chosen by few people to describe their health problems, in comparison with the alterna-tive that establishes that the person does not pre-sent any problems.
In their respective order, the dimensions related to personal care, the fulfillment of daily activities, and the mobility capability exhibit the lesser health problems: less than 10% reported moderate or se-vere problems. On the other hand, in the anxiety dimension, between 15% and 20% suffer some type of stress or depression when surveyed, while for discomfort, the percentage rises to just over one quarter of respondents, being this dimension that of greater incidence. Thus, the surveyed population perceives greater complications related to mental health rather than to physical and motor handicaps.The differentials by area indicate that the urban population shows the highest satisfaction with the state of their health for four of the five dimensions
analyzed, as evidenced in Graph 4.3, although the statistically significant differences apply only for mobility and discomfort. For the anxiety dimension, nonetheless, the rural population manifests to be less depressed or anxious than the urban and the
difference is statistically significant. This fact takes on greater importance when taking into account that depression is the second most problematic dimension for the population, after pain and dis-comforts.
> Delfina Segura playing in a park in Patio Bonito (Bogotá) with her daughter María Isabel and her grandson Felipe.

72
Graph 4.3 moderAte or severe heAlth problems in Five dimensions by AreA
Source: Own calculations based on ELCA.
Both in the farmlands as well as in the cities, gen-der differences are important regarding stress and anxiety dimensions, and mobility to a lesser extent: women perceive more difficulties regar-ding the state of their health. The dimensions of personal care and daily activities are very simi-lar between men and women. As expected, age exhibits a direct relationship to the proportion of individuals who manifest having problems in all the dimensions analyzed. Consequently, among the younger cohorts there is a lesser report of serious problems, if any. It is worth mentioning that age has a significant impact on discomfort and anxiety dimensions.
Conversely, socioeconomic level does not show a strong relationship with the incidence of pro-blems in the dimensions of personal care and daily activities. Moreover, the dispersion is low among wealth quintiles both in the urban and in rural area. However, for the other dimensions eva luated, the dispersion increases substantia-lly, particularly for the cities and for the dimen-sion related to stress and depression. In this manner, it is the individuals in the lowest quinti-les who exhibit greater inconveniences regarding their mobility and the presence of discomfort and anxiety, in comparison with individuals from wealthier households.
Significant regional differences can be appre-ciated in each area regarding the incidence of
Per
cent
age
of p
eopl
e su
rvey
ed
Urban Rural
Mobility Personal care
Daily activities
Discomfort Anxiety

73
health problems in some of the dimensions. For the two dimensions in which the population seems to have fewer health problems, the dis-persion in both rural and urban areas is slight and the response rate remains consistent with the findings for the aggregate: low values with little incidence. However, as shown in Graph 4.4, the incidence of discomforts and anxiety is dis-similar between regions. In the first place, in the rural area, the Cundiboyacense region has one of the highest levels of incidence of discomfort and depression, while the lowest levels were found in the Coffee and the East Central regions. In the cities, the highest dispersion between regions is confirmed, compared with the rural micro-regions. The lowest urban levels are found in the central region, while the highest incidences are concentrated in the marginal regions of the Pa-cific and the East.
Graph 4.4. moderAte or severe perceived stAte oF heAlth regArding discomFort And Anxiety by AreA And region
Source: Own calculations based on ELCA..
> José María Alcaraz Borja is 74 and is an electrician, his wife Maria Aseneth Giraldo is 68 and is a housewife. The couple adopted their son Ronal, who is now 17 years old.
Discomfort Anxiety
Mid- Atlantic
AtlanticCundibo-yacense
EasternCoffee Region
CentralEast Central
Pacific Bogotá
74
4.5.2. visuAl AnAlog scAle (vAs)
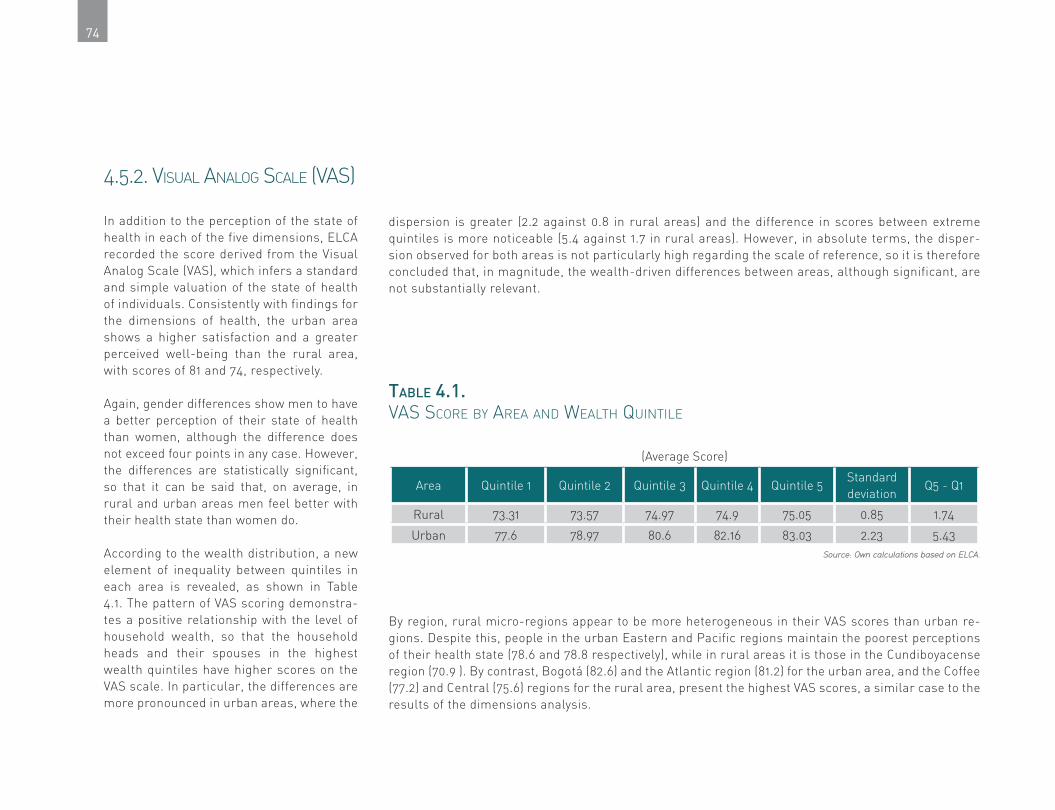
In addition to the perception of the state of health in each of the five dimensions, ELCA recorded the score derived from the Visual Analog Scale (VAS), which infers a standard and simple valuation of the state of health of individuals. Consistently with findings for the dimensions of health, the urban area shows a higher satisfaction and a greater perceived well-being than the rural area, with scores of 81 and 74, respectively.
Again, gender differences show men to have a better perception of their state of health than women, although the difference does not exceed four points in any case. However, the differences are statistically significant, so that it can be said that, on average, in rural and urban areas men feel better with their health state than women do.
According to the wealth distribution, a new element of inequality between quintiles in each area is revealed, as shown in Table 4.1. The pattern of VAS scoring demonstra-tes a positive relationship with the level of household wealth, so that the household heads and their spouses in the highest wealth quintiles have higher scores on the VAS scale. In particular, the differences are more pronounced in urban areas, where the
dispersion is greater (2.2 against 0.8 in rural areas) and the difference in scores between extreme quintiles is more noticeable (5.4 against 1.7 in rural areas). However, in absolute terms, the disper-sion observed for both areas is not particularly high regarding the scale of reference, so it is therefore concluded that, in magnitude, the wealth-driven differences between areas, although significant, are not substantially relevant.
Table 4.1. vAs score by AreA And weAlth Quintile
(Average Score)
Area Quintile 1 Quintile 2 Quintile 3 Quintile 4 Quintile 5Standard deviation
Q5 - Q1
Rural 73.31 73.57 74.97 74.9 75.05 0.85 1.74
Urban 77.6 78.97 80.6 82.16 83.03 2.23 5.43Source: Own calculations based on ELCA.
By region, rural micro-regions appear to be more heterogeneous in their VAS scores than urban re-gions. Despite this, people in the urban Eastern and Pacific regions maintain the poorest perceptions of their health state (78.6 and 78.8 respectively), while in rural areas it is those in the Cundiboyacense region (70.9 ). By contrast, Bogotá (82.6) and the Atlantic region (81.2) for the urban area, and the Coffee (77.2) and Central (75.6) regions for the rural area, present the highest VAS scores, a similar case to the results of the dimensions analysis.

75
4.5.3. eQ-5d index
Given that rural and urban areas exhibit similar sa-tisfaction levels in the different health dimensions, the EQ-5D index, which is based on a synthesis of the scores of those dimensions, shows the same pattern. Thus, the average index for urban areas is 0.925, whi-le for rural areas it is 0.919. Despite this similarity, in statistical terms the difference is significant at the hig-hest level of confidence, allowing to infer that there is a higher perceived well-being in health in cities than in farmlands. Similarly, the breakdown of results by gen-der replicates the results of the dimensions and the VAS score. Hence, men perceive a lower average level of morbidity than women, with index scores of 0.94 in urban areas and 0.93 in rural areas, while the index va-lue for women is of 0.91 in both areas.
As for regional differences, there is a greater differen-tiation of the index between urban regions than among rural micro-regions. Thus, for the cities, the Central region has the highest index (0.95) and the Pacific the lowest value (0.90). In rural areas, the Coffee Region has the highest index (0.93), while the Cundiboyacen-se has the lowest value (0.90). It is worth noting that the highest rural value is significantly lower than the maximum urban, while the minimums are equal in both areas: evidence of a greater dispersion of the in-dex in the urban area.
Table 4.2 presents the EQ-5D index by area and wealth level. As in the VAS score, both areas show a positive
relationship between the perceived state of health and the socioeconomic status of households. In this man-ner, the lowest quintiles in both geographical areas have a value of 0.91, while in the highest quintiles it is of 0.93 for the rural area and of 0.94 for the urban one. In turn, the differences between quintiles are relatively similar between areas, as evidenced by the distance between extreme quintiles. It can be said, then, that despite the unequal values between different levels of wealth, the population appears to be equally satisfied, refuting the so-called aspirations paradox, according to which the poorest have a greater tolerance for uns-table and inefficient health systems. (Deaton, 2008: 12, Graham, Higuera & Lora, 2009: 10).
Table 4.2. eQ-5d index by AreA And weAlth Quintiles
(Average Value)
AreaQuintile
1Quintile
2Quintile
3Quintile
4Quintile
5Average
Standard deviation
Quintile 5 – Quintile 1
Urban 0.91 0.92 0.93 0.93 0.94 0.92 0.01 0.03
Rural 0.91 0.91 0.92 0.92 0.93 0.92 0.01 0.02 Source: Own calculations based on ELCA.
>In urban and rural areas there are similar levels of health satisfaction.

76
4.6. a comparison of resUlts: eq-5D in the international context
The results of ELCA summarized in the previous sec-tion are particularly relevant for two reasons. First, the information necessary for the calculation of the index has until now been collected from opinion sur-veys conducted in urban areas (Deaton, 2008, Gallup, 2006 and 2007, IDB, 2008). The estimates for Colom-bia have until now omitted the rural population, which constitutes a relevant fraction of the national popu-lation and, as shown at the beginning of the chapter, is closely linked to the subsidized health system and, therefore, in a special state of dependency and vulne-rability. A wide geographical coverage and recurrent gathering of data about the perception of the state of health among the population allow for a more integral evaluation of the system.
Secondly, the adoption of an international methodolo-gy of standard valuation offers the possibility to com-pare the performance of the index among different countries. A first comparative exercise is presented below between the urban data of ELCA and the esti-mates calculated by Lora (2010), based on data from the Gallup survey conducted in 2006 and 2007 for
an urban sample of twenty Latin American and Ca-ribbean countries.
Graph 4.5 shows the percentage of individuals, living in Colombian urban areas, who report some problem of moderate or extreme severity for the five dimen-sions of health derived from ELCA and Lora’s study (2010), as well as the aggregate for Latin America and the Caribbean (LAC). It should be highlighted, in the first place, that the estimates for urban Colombia show the same pattern in both studies. The dimen-sions of personal care, daily activities, and mobility, in their respective order, show low response rates, while for anxiety and discomfort there is greater prevalence among the population. However, in three of the dimen-sions, Lora’s (2010) results establish a higher propor-tion of affected than that found in ELCA for mobility, daily activities, and discomfort; while the remaining dimensions, personal care and anxiety, show values slightly lower but very close. Thus, the results from Lora (2010) on the perception of the state of health appear to be slightly more pessimistic, even though they are in line with those presented here.

77
Graph 4.5. moderAte or severe perceived heAlth problems in Five dimensions, colombiA And totAl
Secondly, in contrast to the average of the nine-teen countries in Lora’s (2010) study, a peculia-rity is evident in the results for Colombia from both sources. In the three dimensions of lowest incidence of health problems (mobility, personal care, and daily activities), the results of the coun-try are below the LAC regional average. However, regarding discomfort and anxiety, both estimates are above the LAC regional mean, except in the case of discomfort calculated using data from ELCA, which is below but very close to the LAC average. Thus, the dimensions in which health problems are perceived by the Colombian popu-lation as moderate or severe show, in turn, levels above the LAC regional average. In other words, the mental well-being of the country’s popula-tion, as a fundamental dimension of health, is a palpable concern among individuals.
Based upon the five dimensions of health, the EQ-5D indexes are constructed and exhibited in Graph 4.6. The indexes oscillate from a minimum of 0.860 for Chile and a maximum of 0.957 for Panama. The mean for the LAC region is 0.915, with an average dispersion of 0.03, suggesting a high concentration around values that reflect a positive perception of the health state. The va-lues estimated for Colombia by the two available sources, those being Lora (2010) and ELCA, are similar; the latter (0.925) being a little higher than the former (0.914). These findings render the value for urban Colombia estimated by Lora (2010) to be found close to the aggregate of the
Source: Lora (2010) based on Gallup World Poll (2007) and own calculations based on ELCA.
Per
cent
age
of p
eopl
e su
rvey
ed
AnxietyDiscomfortDaily activitiesPersonal care
ELCA Urban Colombia Total LA & C
Mobility

78
LAC region (0.001 points below), while that for the ELCA survey is 0.01 points above the LAC re-gional average and above the estimated indexes for countries such as Uruguay, Mexico, Domini-can Republic, and Honduras. Again, Lora’s es-timate is slightly more pessimistic than that of ELCA.
A comparison with some neighboring countries allows to distinguish the influence of cultural traits in this type of subjective measures. Thus, for example, Ecuador exhibits a higher index than the two calculated for Colombia, while Peru is in the group of the five lowest values. Similarly, Panama, as noted previously, has the highest value of the sample, while Costa Rica is in a position very similar to that of Colombia.
Graph 4.6 eQ-5d index score by country
Source: Lora (2010) based on Gallup World Poll (2007) and own calculations based on ELCA.
Chile
Bolivia
Brazil
Nicaragua
Peru
Argentina
Colombia (Lora, 2010)
Latin America and Caribbean
Uruguay
Mexico
Dominican Rep.
Honduras
Colombia ELCA
Costa Rica
Guyana
Ecuador
Paraguay
Belize
Guatemala
El Salvador
Panama
EQ-5D Index score

79
reFerences
Deaton, A. (2008). “Income, Health, and Well-being around the World: Evidence from the Gallup World Poll”, Journal of Economic Perspec-tives, 22 (2): 53-72.
National Administrative Statistics De-partment (DANE by its Spanish acronym) (2008). Encuesta Nacional de Calidad de Vida (National Survey on Quality of Life).
Flórez, C. E., Soto, V. E., Acosta, O. L., Karl, C., Misas, J. D., Forero, N. and Lopera, C. (2007). Avances y desafíos de la equidad en el sistema de salud colombiano. Corona Foundation. Corona Foundation, Working paper No. 15. Corona Founda-tion–DNP– Universidad de los Andes, Universidad del Rosario.
Gallup (2007). Gallup World Poll. Avai-lable at http://www.gallup.com/consulting/worl-dpoll/24046/about.aspx
______ (2006). Gallup World Poll. Avai-lable at http://www.gallup.com/consulting/ worl-dpoll/24046/about.aspx
Graham, C., Higuera, L. and Lora, E. (2009). Valuing Health Conditions: Insights from Happi-ness Surveys across Countries and Cultures. IDB Working Papers, Series 100.
Inter-American Development Bank (IDB) (2008). Beyond Facts: Understanding Quality of Life in Latin America. Development in the Ame-ricas Report, Washington, Inter-America Develop-ment Bank, IDB.
Lora, E. (2010). Health Perceptions in La-tin America. Inter-America Development Bank,. Unpublished manuscript.
Szende, A., Oppe, M. and Devlin, N. (Eds.) (2007). EQ-5D Value Sets: Inventory, Comparative Review and User Guide, Dordrecht, Springer.