colorado state university system financial statements and
TRANSCRIPT
Colorado State University System
Financial Statements and Independent Auditors’ Reports
Financial Audit
Years Ended June 30, 2020 and 2019
COLORADO STATE UNIVERSITY SYSTEM TABLE OF CONTENTS
YEARS ENDED JUNE 30, 2020 AND 2019
FINANCIAL AUDIT REPORT SECTION
Independent Auditors’ Report 1
Management’s Discussion and Analysis (Unaudited) 3
Financial Statements
Statements of Net Position 18
Statements of Fiduciary Net Position – OPEB 20
Statements of Revenues, Expenses, and Changes in Net Position 21
Statements of Changes in Fiduciary Net Position – OPEB 23
Statements of Cash Flows 24
Notes to Basic Financial Statements 27
Required Supplemental Information
Schedule of Proportionate Share of the Net Pension Liability 109
Schedule of Pension Contributions 111
Schedule of Proportionate Share of the Net OPEB Liability and Schedule of OPEB Contributions 112
Schedule of Changes in Net OPEB Liability (Asset) and Related Ratios – Retiree Medical Subsidy for DCP Participants 113
Schedule of Changes in Net OPEB Liability (Asset) and Related Ratios – Retiree Medical Subsidy for PERA Participants 114
Schedule of Changes in Net OPEB Liability (Asset) and Related Ratios – Retiree Umbrella Prescription Plan PERA Participants 115
Schedule of Changes in Net OPEB Liability (Asset) and Related Ratios – Long-Term Disability Income Replacement Plan 116
Schedule of OPEB Contributions Retiree Medical Subsidy for DCP Participants 117
Schedule of OPEB Contributions Retiree Medical Subsidy for PERA Participants 118
Schedule of OPEB Contributions Retiree Umbrella Prescription Plan PERA Participants 119
COLORADO STATE UNIVERSITY SYSTEM TABLE OF CONTENTS
YEARS ENDED JUNE 30, 2020 AND 2019
Schedule of OPEB Contributions Long-Term Disability Income Replacement Plan 120
Schedule of Changes in the Net OPEB Liability (Asset) and Related Ratios Retiree Medical Subsidy for DCP Participants 121
Schedule of Changes in the Net OPEB Liability (Asset) and Related Ratios Retiree Medical Subsidy for PERA Participants 122
Schedule of Changes in the Net OPEB Liability (Asset) and Related Ratios Umbrella Prescription Plan PERA Participants 123
Schedule of Changes in the Net OPEB Liability (Asset) and Related Ratios Long-Term Disability Income Replacement Plan 124
125 Schedule of Investment Returns
INDEPENDENT AUDITORS' REPORT
Legislative Audit Committee & Board of Governors
Report on the Financial Statements
We have audited the accompanying financial statements of the business-type activities, the aggregate discretely presented component units, and the fiduciary fund information of the Colorado State University System (the System), as of and for the years ended June 30, 2020 and 2019, and the related notes to the financial statements, which collectively comprise the entity’s basic financial statements as listed in the table of contents.
Management’s Responsibility for the Financial Statements
Management is responsible for the preparation and fair presentation of these financial statements in accordance with accounting principles generally accepted in the United States of America; this includes the design, implementation, and maintenance of internal control relevant to the preparation and fair presentation of financial statements that are free from material misstatement, whether due to fraud or error.
Auditors’ Responsibility
Our responsibility is to express opinions on these financial statements based on our audit. We did not audit the financial statements of the Colorado State University Foundation (the CSU Foundation) or the financial statements of the Colorado State University Pueblo Foundation (CSU-Pueblo Foundation), which represent 99.67 percent, 99.67 percent, and 95.16 percent, respectively, of the assets, net position, and revenues of the component units. Those statements were audited by other auditors whose reports have been furnished to us, and our opinion, insofar as it relates to the amounts included for the aggregate discretely presented component units, is based solely on the reports of the other auditors. We conducted our audit in accordance with auditing standards generally accepted in the United States of America. Those standards require that we plan and perform the audit to obtain reasonable assurance about whether the financial statements are free from material misstatement.
An audit involves performing procedures to obtain audit evidence about the amounts and disclosures in the financial statements. The procedures selected depend on the auditors’ judgment, including the assessment of the risks of material misstatement of the financial statements, whether due to fraud or error. In making those risk assessments, the auditor considers internal control relevant to the entity’s preparation and fair presentation of the financial statements in order to design audit procedures that are appropriate in the circumstances, but not for the purpose of expressing an opinion on the effectiveness of the entity’s internal control. Accordingly, we express no such opinion. An audit also includes evaluating the appropriateness of accounting policies used and the reasonableness of significant accounting estimates made by management, as well as evaluating the overall presentation of the financial statements.
We believe that the audit evidence we have obtained is sufficient and appropriate to provide a basis for our audit opinions.
1
Legislative Audit Committee and Board of Governors Colorado State University System
Opinions
In our opinion, based on our audit and the reports of other auditors, the financial statements referred to above present fairly, in all material respects, the respective financial position of the business-type activities, the aggregate discretely presented component units, and the fiduciary fund information of the System as of June 30, 2020 and 2019, and the respective changes in financial position and, where applicable, cash flows thereof for the years then ended in accordance with accounting principles generally accepted in the United States of America.
Emphasis of a Matter
As discussed in Note 1, the financial statements of the System, an institution of higher education of the State of Colorado, are intended to present the financial position, the changes in financial position and cash flows of the business-type activities of only the System. Financial results for the State of Colorado are presented in separate state-wide financial statements prepared by the Office of the State Controller and audited by the Office of the State Auditor. Complete financial information for the State of Colorado is available in these state-wide financial statements. Our opinion is not modified with respect to this matter.
Other Matters
Required Supplementary Information
Accounting principles generally accepted in the United States of America require that the management’s discussion and analysis, other postemployment benefit information, and pension information listed in the table of contents be presented to supplement the basic financial statements. Such information, although not a part of the basic financial statements, is required by the Governmental Accounting Standards Board who considers it to be an essential part of financial reporting for placing the basic financial statements in an appropriate operational, economic, or historical context. We have applied certain limited procedures to the required supplementary information in accordance with auditing standards generally accepted in the United States of America, which consisted of inquiries of management about the methods of preparing the information and comparing the information for consistency with management’s responses to our inquiries, the basic financial statements, and other knowledge we obtained during our audit of the basic financial statements. We do not express an opinion or provide any assurance on the information because the limited procedures do not provide us with sufficient evidence to express an opinion or provide any assurance.
CliftonLarsonAllen LLP
Greenwood Village, Colorado February 12, 2021
2
COLORADO STATE UNIVERSITY SYSTEM
Management’s Discussion and Analysis
Years Ended June 30, 2020 and 2019
(Unaudited)
Management’s Discussion and Analysis
We are pleased to present this financial discussion and analysis of the Colorado State University System (the
System). It is intended to make the System’s financial statements easier to understand and communicate our
financial situation in an open and accountable manner. This section of the financial report provides an objective
discussion and analysis of the financial performance of the System for the fiscal years ended June 30, 2020 and
2019, respectively, with comparative information for fiscal year 2018. This discussion provides an analysis of
the System’s financial activities based on currently known facts, decisions, or existing conditions. University
management is responsible for the completeness and fairness of this discussion and analysis, the financial
statements, and related footnote disclosures.
The System includes Colorado State University (CSU), Colorado State University Pueblo (CSU-Pueblo), and
Colorado State University Global Campus (CSU-Global). CSU-Global issued separate audited financial
statements for the years ended June 30, 2020 and June 30, 2019.
Understanding the Financial Statements
The basic financial statements are designed to provide readers with a broad overview of the System’s finances
and are comprised of three basic statements.
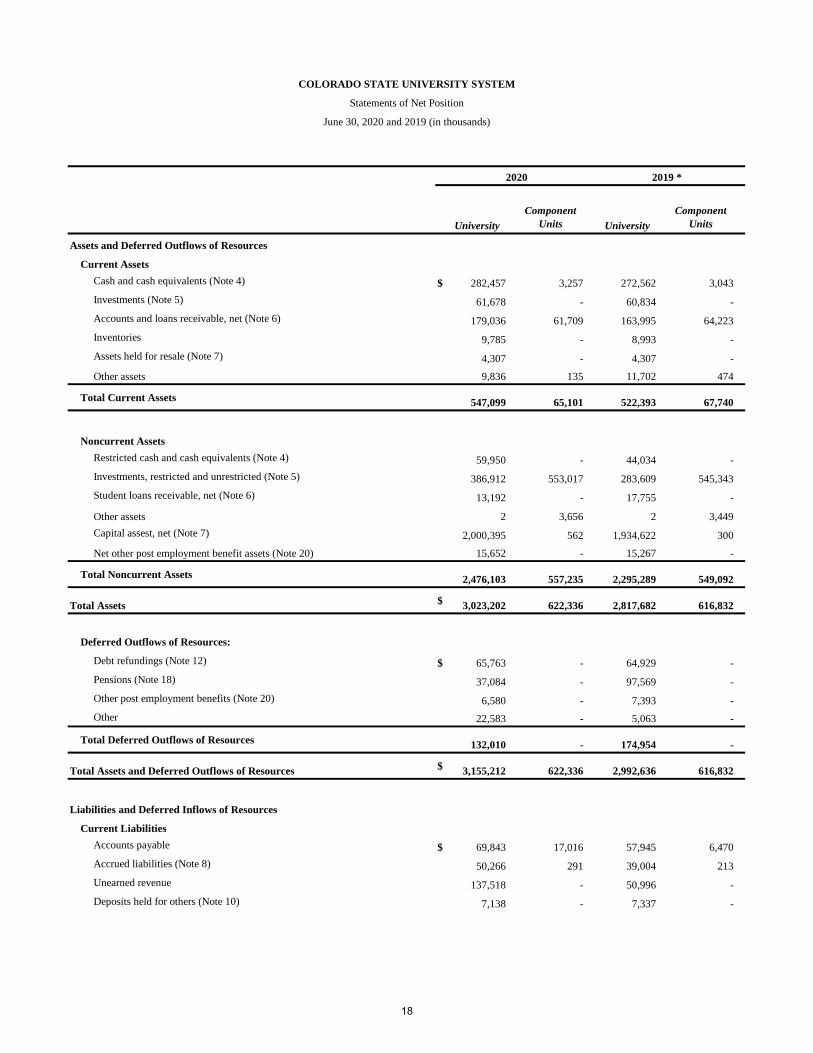
Statements of Net Position present information on all of the System’s assets, deferred outflows, liabilities, and
deferred inflows; with the difference between assets plus deferred outflows less liabilities and deferred inflows
reported as net position. Over time, increases or decreases in net position may serve as a useful indicator of
whether the financial position of the System is improving or deteriorating.
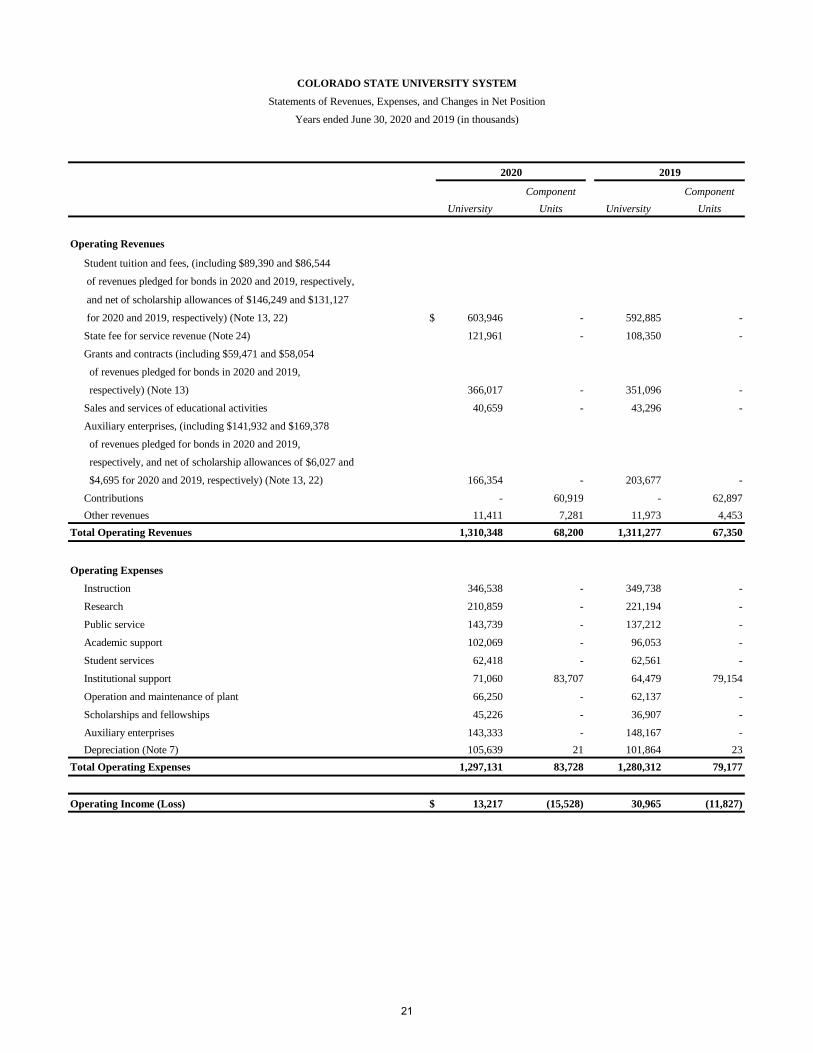
Statements of Revenues, Expenses, and Changes in Net Position present information showing how the
System’s net position changed during the two most recent fiscal years. All changes in net position are reported
as soon as the underlying event giving rise to the change occurs, regardless of the timing of related cash flows.
Thus, revenues and expenses are reported in this statement for some items that will result in cash flows in future
fiscal periods (e.g., the payment for accrued compensated absences, or the receipt of amounts due from students
and others for services rendered).
Statements of Cash Flows are reported on the direct method. The direct method of cash flows reporting
portrays cash flows from operating, noncapital financing, capital, and related financing, and investing activities.
Their purpose is to assess the System’s ability to generate net cash flows and meet its obligations as they come
due.
Notes to Financial Statements provide additional information that is essential to a full understanding of the
data provided in the basic financial statements. The notes provide information regarding both the accounting
policies and procedures the System has adopted as well as additional detail of certain amounts contained in the
financial statements. The notes to financial statements follow the basic financial statements.
Required Supplementary Information (RSI) presents additional information that differs from the basic
financial statements in that the auditor applies certain limited procedures in reviewing the information. In this
report, RSI includes schedules of the System’s proportionate share of the Public Employee’s Retirement
Association (PERA) net pension liability and contributions to the PERA pension as well as PERA’s net Other
Postemployment Benefits (OPEB) liability and contributions to PERA Health Care Trust Fund. In addition, the
3
COLORADO STATE UNIVERSITY SYSTEM
Management’s Discussion and Analysis
Years Ended June 30, 2020 and 2019
(Unaudited)
schedules for OPEB include the schedule of changes in the net OPEB liability (asset) with related ratios,
employer contributions, and investment returns.
Management’s Discussion and Analysis focuses on the primary government, which is the Colorado State
University System. The System reports its activity as a business-type activity using the economic resources
measurement focus and the accrual basis of accounting.
Financial Highlights
Financial highlights are presented in this discussion and analysis to help with the assessment of the System’s
financial activities. This analysis should be read in conjunction with the System’s financial statements and
notes thereto, which are also presented in this document.
The Colorado State Legislature established spending authority for the System in its annual Long Appropriations
Bill (Long Bill). The Long Bill appropriated funds include an amount from the State of Colorado’s College
Opportunity Fund and amounts for Student Tuition, Mandatory Fees, Western Interstate Commission for Higher
Education (WICHE), and Service Fees.
For the fiscal years ended June 30, 2020 and 2019, appropriated expenses in the System were within the
authorized spending authority. For the fiscal years ended June 30, 2020 and 2019, the System had a total state
appropriation of $669.9 million and $639.0 million, respectively. For the fiscal years ended 2020 and 2019,
the System’s appropriation from re-appropriated funds consisted of $50.4 million and $46.5 million,
respectively, received for students that qualified for stipends from the College Opportunity Fund, and $122.0
million and $108.4 million, respectively, as state fee for service contract revenue. Starting in fiscal year 2017,
the students’ share of tuition became appropriated from cash funds rather than informational only, totaling
$497.4 million in fiscal year 2020 and $484.0 million in fiscal year 2019. The appropriated portion of WICHE
funds was $145 thousand in fiscal years ended 2020 and 2019. Mandatory fees and the student fee portion of
WICHE funds, are shown in the long bill for informational purposes only. All other revenues and expenses
reported by the System represent non-appropriated funds and are excluded from the annual appropriations bill.
Non-appropriated funds include fees, grants and contracts, gifts, indirect cost recoveries, auxiliary revenues,
and other revenue sources.
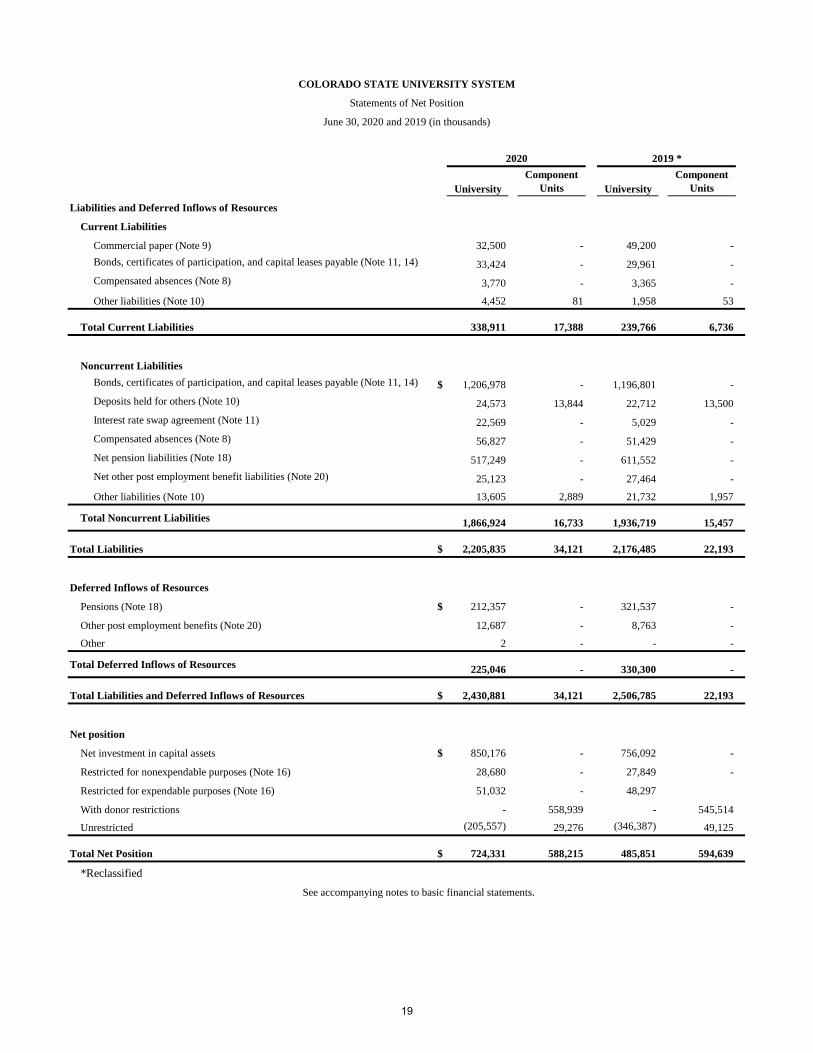
The assets and deferred outflows of the System exceeded its liabilities and deferred inflows as of June 30, 2020
by $724.3 million (net position). Of this amount, $850.2 million is related to the net investment in capital assets
and $79.7 million is restricted for purposes which the donor or grantor or other external party intended. Certain
balances as of June 30, 2019 have been reclassified to conform to the presentation of fiscal year 2020 related
to restricted net position. OPEB net assets were not restricted in fiscal year 2019, however, were restricted in
fiscal year 2020. As a result, $15.3 million has been reclassified to restricted for expendable purposes - other
for fiscal year 2019. The remaining negative $205.6 million in fiscal year 2020 is unrestricted. Although
unrestricted net position is not externally restricted, it may be internally designated by the System’s
administration for various purposes. Unrestricted net position continues to be negatively impacted by the
implementation of Governmental Accounting Standards Board (GASB) Statement No. 68, Accounting and
Financial Reporting for Pensions and GASB Statement No. 75, Accounting and Financial Reporting for
Postemployment Benefits Other Than Pensions, in the amount of $708.1 million and $849.1 million for fiscal
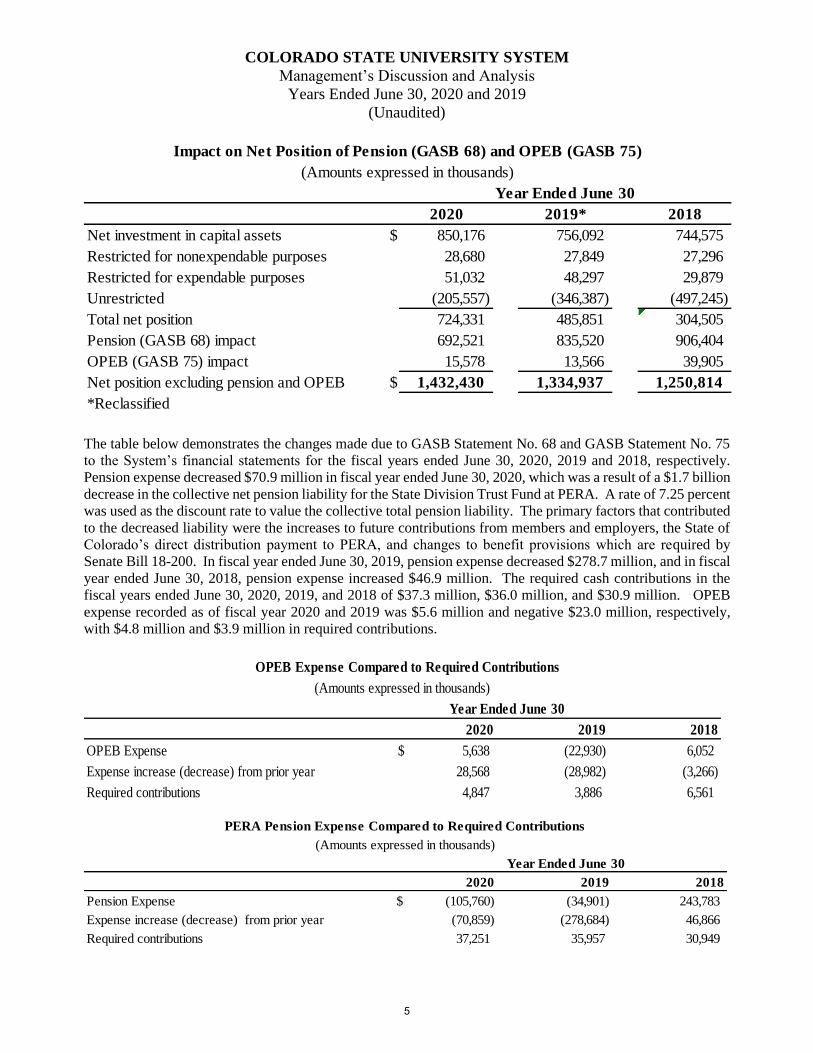
years ended June 30, 2020 and 2019, respectively. The impact on net position is shown in the following table.
4
COLORADO STATE UNIVERSITY SYSTEM
Management’s Discussion and Analysis
Years Ended June 30, 2020 and 2019
(Unaudited)
2020 2019* 2018
Net investment in capital assets $ 850,176 756,092 744,575
Restricted for nonexpendable purposes 28,680 27,849 27,296
Restricted for expendable purposes 51,032 48,297 29,879
Unrestricted (205,557) (346,387) (497,245)
Total net position 724,331 485,851 304,505
Pension (GASB 68) impact 692,521 835,520 906,404
OPEB (GASB 75) impact 15,578 13,566 39,905
Net position excluding pension and OPEB $ 1,432,430 1,334,937 1,250,814
*Reclassified
(Amounts expressed in thousands)
Impact on Net Position of Pension (GASB 68) and OPEB (GASB 75)
Year Ended June 30
The table below demonstrates the changes made due to GASB Statement No. 68 and GASB Statement No. 75
to the System’s financial statements for the fiscal years ended June 30, 2020, 2019 and 2018, respectively.
Pension expense decreased $70.9 million in fiscal year ended June 30, 2020, which was a result of a $1.7 billion
decrease in the collective net pension liability for the State Division Trust Fund at PERA. A rate of 7.25 percent
was used as the discount rate to value the collective total pension liability. The primary factors that contributed
to the decreased liability were the increases to future contributions from members and employers, the State of
Colorado’s direct distribution payment to PERA, and changes to benefit provisions which are required by
Senate Bill 18-200. In fiscal year ended June 30, 2019, pension expense decreased $278.7 million, and in fiscal
year ended June 30, 2018, pension expense increased $46.9 million. The required cash contributions in the
fiscal years ended June 30, 2020, 2019, and 2018 of $37.3 million, $36.0 million, and $30.9 million. OPEB
expense recorded as of fiscal year 2020 and 2019 was $5.6 million and negative $23.0 million, respectively,
with $4.8 million and $3.9 million in required contributions.
2020 2019 2018
OPEB Expense $ 5,638 (22,930) 6,052
Expense increase (decrease) from prior year 28,568 (28,982) (3,266)
Required contributions 4,847 3,886 6,561
Year Ended June 30
OPEB Expense Compared to Required Contributions
(Amounts expressed in thousands)
2020 2019 2018
Pension Expense $ (105,760) (34,901) 243,783
Expense increase (decrease) from prior year (70,859) (278,684) 46,866
Required contributions 37,251 35,957 30,949
PERA Pension Expense Compared to Required Contributions
(Amounts expressed in thousands)
Year Ended June 30
5
COLORADO STATE UNIVERSITY SYSTEM
Management’s Discussion and Analysis
Years Ended June 30, 2020 and 2019
(Unaudited)
Financial Analysis
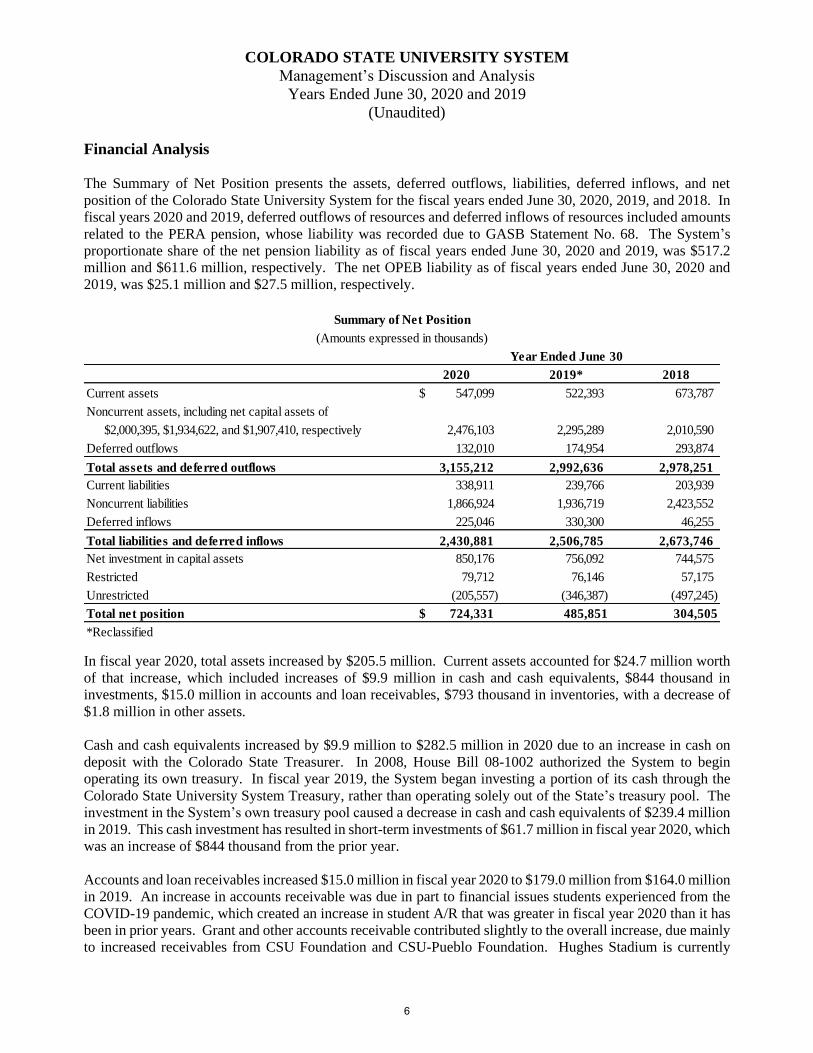
The Summary of Net Position presents the assets, deferred outflows, liabilities, deferred inflows, and net
position of the Colorado State University System for the fiscal years ended June 30, 2020, 2019, and 2018. In
fiscal years 2020 and 2019, deferred outflows of resources and deferred inflows of resources included amounts
related to the PERA pension, whose liability was recorded due to GASB Statement No. 68. The System’s
proportionate share of the net pension liability as of fiscal years ended June 30, 2020 and 2019, was $517.2
million and $611.6 million, respectively. The net OPEB liability as of fiscal years ended June 30, 2020 and
2019, was $25.1 million and $27.5 million, respectively.
2020 2019* 2018
Current assets 547,099$ 522,393 673,787
Noncurrent assets, including net capital assets of
$2,000,395, $1,934,622, and $1,907,410, respectively 2,476,103 2,295,289 2,010,590
Deferred outflows 132,010 174,954 293,874
Total assets and deferred outflows 3,155,212 2,992,636 2,978,251
Current liabilities 338,911 239,766 203,939
Noncurrent liabilities 1,866,924 1,936,719 2,423,552
Deferred inflows 225,046 330,300 46,255
Total liabilities and deferred inflows 2,430,881 2,506,785 2,673,746
Net investment in capital assets 850,176 756,092 744,575
Restricted 79,712 76,146 57,175
Unrestricted (205,557) (346,387) (497,245)
Total net position 724,331$ 485,851 304,505
*Reclassified
Summary of Net Position
(Amounts expressed in thousands)
Year Ended June 30
In fiscal year 2020, total assets increased by $205.5 million. Current assets accounted for $24.7 million worth
of that increase, which included increases of $9.9 million in cash and cash equivalents, $844 thousand in
investments, $15.0 million in accounts and loan receivables, $793 thousand in inventories, with a decrease of
$1.8 million in other assets.
Cash and cash equivalents increased by $9.9 million to $282.5 million in 2020 due to an increase in cash on
deposit with the Colorado State Treasurer. In 2008, House Bill 08-1002 authorized the System to begin
operating its own treasury. In fiscal year 2019, the System began investing a portion of its cash through the
Colorado State University System Treasury, rather than operating solely out of the State’s treasury pool. The
investment in the System’s own treasury pool caused a decrease in cash and cash equivalents of $239.4 million
in 2019. This cash investment has resulted in short-term investments of $61.7 million in fiscal year 2020, which
was an increase of $844 thousand from the prior year.
Accounts and loan receivables increased $15.0 million in fiscal year 2020 to $179.0 million from $164.0 million
in 2019. An increase in accounts receivable was due in part to financial issues students experienced from the
COVID-19 pandemic, which created an increase in student A/R that was greater in fiscal year 2020 than it has
been in prior years. Grant and other accounts receivable contributed slightly to the overall increase, due mainly
to increased receivables from CSU Foundation and CSU-Pueblo Foundation. Hughes Stadium is currently
6
COLORADO STATE UNIVERSITY SYSTEM
Management’s Discussion and Analysis
Years Ended June 30, 2020 and 2019
(Unaudited)
under contract for sale. The land and construction in progress related to Hughes Stadium of $4.3 million were
reclassified to assets held for resale as of June 30, 2019.
Noncurrent assets increased $180.8 million to $2.5 billion in fiscal year 2020. Operations of the System treasury
resulted in an increase in long-term investments of $103.3 million to $386.9 million for fiscal year 2020 over
$283.6 million for fiscal year 2019. The increase in long-term investments for 2020 was $103.3 million, as the
System treasury had gains of $13.5 million, and additional funds were added to the System treasury from cash
and short-term investments. Restricted investments decreased in fiscal year 2020 by $10.2 million primarily
due to the Center for Vector-borne Infectious Diseases Series 2018 A bond cash held and invested by a trustee
being spent down on construction related expenses.
Other contributors to the noncurrent assets increase include $15.9 million increase in restricted cash and cash
equivalents, a $65.8 million increase in capital assets, net, and a $385 thousand increase in net OPEB assets.
These increases were offset by a $4.6 million decrease in student loans receivable, net. The increase in restricted
cash and cash equivalents includes the 2019 AB bond proceeds that were issued in fiscal year 2020 and are
being held with restriction until liquidation from project related expenses.
The increase in capital assets comprised of an increase in total non-depreciable capital assets of $92.9 million,
primarily related to construction in progress, and an increase in total depreciable capital assets of $60.8 million,
primarily related to an increase in building and improvements. The changes in construction in progress and
buildings and improvements were due to ongoing construction projects, as well as the completion and
capitalization of several large projects.
Deferred outflows decreased in fiscal year 2020 from the prior fiscal year by $42.9 million. Deferred outflows
related to pension accounted for the majority of the decrease, as it declined by $60.5 million in fiscal year 2020
to a total of $37.1 million. Other deferred outflows increased by $17.5 million offsetting the decrease in
deferred outflows from pension. Other deferred outflows include amounts for asset retirement obligations
related to GASB Statement No. 83, related to assets which have not been fully depreciated that may incur future
remediation costs, as well as the swap valuation. In fiscal year 2020, the System entered into a floating to fixed
interest rate swap agreement, the 2015 A Swap Agreement. Other deferred outflows increased to $22.6 million
in fiscal year 2020 from $5.1 million in fiscal year 2019. The swap valuation makes up the majority of this
balance and increase.
Total liabilities increased $29.4 million in fiscal year 2020, compared to a decrease of $451.0 million in fiscal
year 2019. Current liabilities increased by $99.2 million, which was offset by a decrease in noncurrent liabilities
of $69.8 million.
The increase in current liabilities was due to an increase in unearned revenue of $86.5 million. Unearned
revenue increased in fiscal year 2020 due to the System receiving $90.4 million in funding from executive order
D-2020-070 from the State of Colorado to higher education institutions that was passed through from the
Coronavirus Aid, Relief, and Economic Security Act of 2020 (CARES Act). The System spent $13.4 million
of these funds in fiscal year 2020, while the remaining $77.0 million is planned to be utilized in fiscal year
2021. The CARES Act funding is used to assist governments with the impact of the COVID-19 pandemic.
Accounts payable and accrued liabilities also increased by $11.9 million and 11.3 million, respectively. The
current liability increase was offset by a $16.7 million dollar decrease in commercial paper to $32.5 million
from $49.2 million in fiscal year 2019. Principal payments of $16.7 million are related to $2.5 million for
Richardson Design Center, $9.2 million for Semester at Sea Building, and $5.0 million for WCRC Orchard
Mesa.
7
COLORADO STATE UNIVERSITY SYSTEM
Management’s Discussion and Analysis
Years Ended June 30, 2020 and 2019
(Unaudited)
Noncurrent liabilities were $1.9 billion at the end of fiscal year 2020 and $1.9 billion at the end of fiscal year
2019. Noncurrent liabilities decreased $69.8 million, which was driven by the decrease in pension liability of
$94.3 million and a decrease in net OPEB liabilities of $2.3 million, which are due to GASB Statement No. 68
and GASB Statement No. 75. Other liabilities decreased by $8.1 million to $13.6 million in fiscal year 2020.
The Perkins loan revolving fund was the primary reason for the decrease due to a lesser amount owed to the
Department of Education for the Federal share of Perkins loans funds. An increase in the interest rate swap
agreement of $17.5 million offset the overall decrease in noncurrent liabilities.
Deferred inflows decreased $105.3 million in fiscal year 2020 to $225.0 million, after increasing in fiscal year
2019 from 2018 by $284.0 million. Both the decrease and increases in the past three fiscal years were mainly
due to the impact of GASB Statement No. 68 and GASB Statement No. 75. Deferred inflows related to pensions
decreased $109.2 million, contributing to the majority of the total decrease in fiscal year 2020.
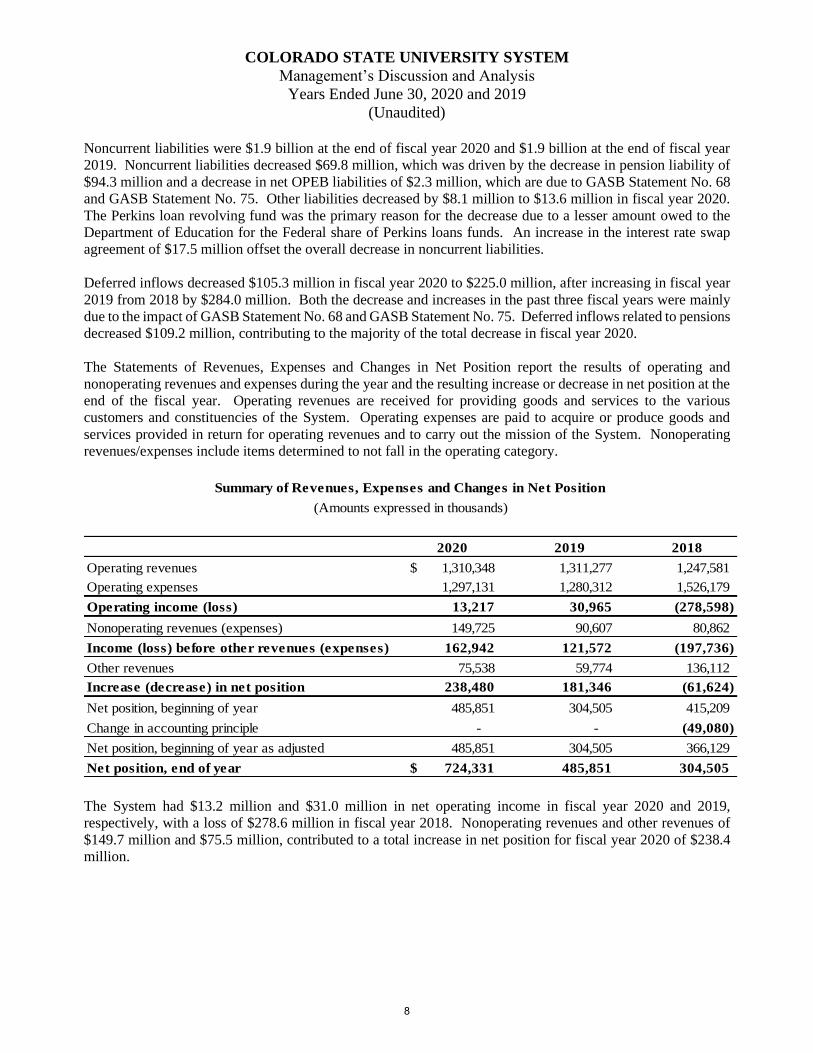
The Statements of Revenues, Expenses and Changes in Net Position report the results of operating and
nonoperating revenues and expenses during the year and the resulting increase or decrease in net position at the
end of the fiscal year. Operating revenues are received for providing goods and services to the various
customers and constituencies of the System. Operating expenses are paid to acquire or produce goods and
services provided in return for operating revenues and to carry out the mission of the System. Nonoperating
revenues/expenses include items determined to not fall in the operating category.
2020 2019 2018
Operating revenues 1,310,348$ 1,311,277 1,247,581
Operating expenses 1,297,131 1,280,312 1,526,179
Operating income (loss) 13,217 30,965 (278,598)
Nonoperating revenues (expenses) 149,725 90,607 80,862
Income (loss) before other revenues (expenses) 162,942 121,572 (197,736)
Other revenues 75,538 59,774 136,112
Increase (decrease) in net position 238,480 181,346 (61,624)
Net position, beginning of year 485,851 304,505 415,209
Change in accounting principle - - (49,080)
Net position, beginning of year as adjusted 485,851 304,505 366,129
Net position, end of year 724,331$ 485,851 304,505
Summary of Revenues, Expenses and Changes in Net Position
(Amounts expressed in thousands)
The System had $13.2 million and $31.0 million in net operating income in fiscal year 2020 and 2019,
respectively, with a loss of $278.6 million in fiscal year 2018. Nonoperating revenues and other revenues of
$149.7 million and $75.5 million, contributed to a total increase in net position for fiscal year 2020 of $238.4
million.
8
COLORADO STATE UNIVERSITY SYSTEM
Management’s Discussion and Analysis
Years Ended June 30, 2020 and 2019
(Unaudited)
2020 2019 2018
Operating revenues:
Student tuition and fees, net 603,946$ 592,885 571,011
State fee for service revenue 121,961 108,350 95,718
Grants and contracts 366,017 351,096 332,802
Sales and services of educational activities 40,659 43,296 42,923
Auxiliary enterprises 166,354 203,677 193,005
Other 11,411 11,973 12,122
Total operating revenues 1,310,348 1,311,277 1,247,581
Nonoperating revenues:
State appropriations 5,155 1,800 4,568
Gifts 57,804 51,684 82,624
Investment income 28,383 28,920 3,792
Federal nonoperating grants and contracts 76,420 46,389 45,646
State support for PERA pension 4,109 4,218 -
Other, net 23,350 4,066 (14,181)
Net nonoperating revenues 195,221 137,077 122,449
Total noncapital revenue 1,505,569$ 1,448,354 1,370,030
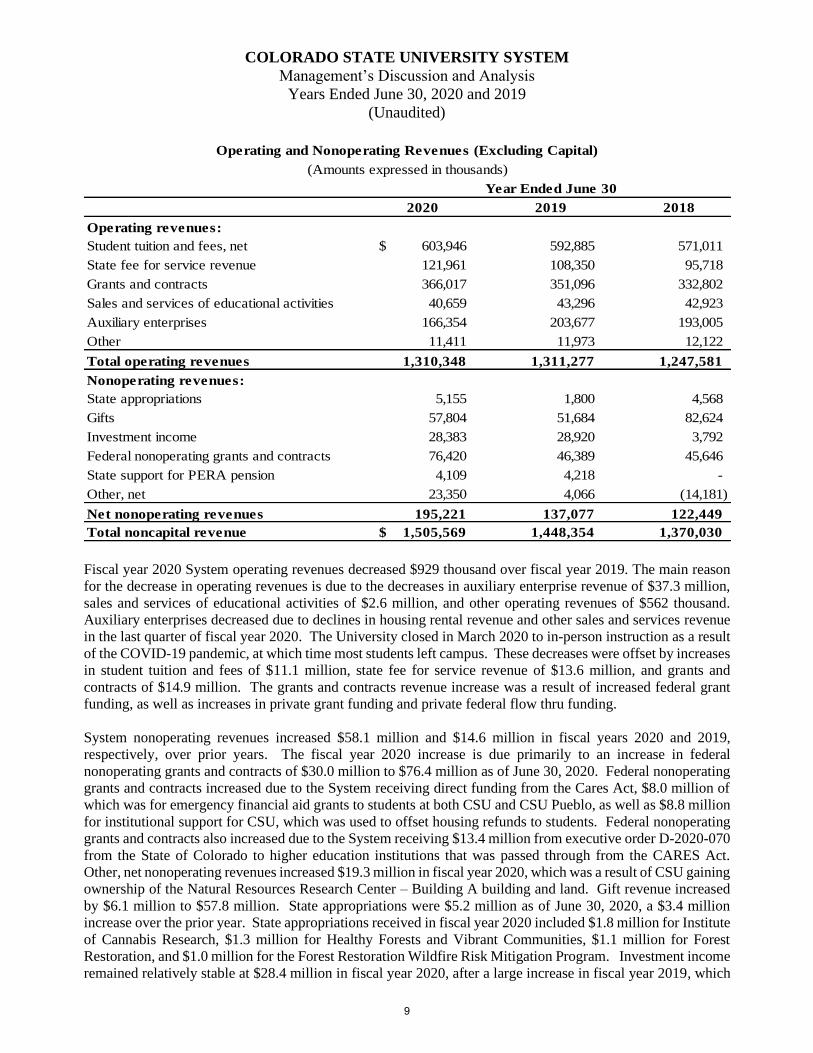
Operating and Nonoperating Revenues (Excluding Capital)
(Amounts expressed in thousands)
Year Ended June 30
Fiscal year 2020 System operating revenues decreased $929 thousand over fiscal year 2019. The main reason
for the decrease in operating revenues is due to the decreases in auxiliary enterprise revenue of $37.3 million,
sales and services of educational activities of $2.6 million, and other operating revenues of $562 thousand.
Auxiliary enterprises decreased due to declines in housing rental revenue and other sales and services revenue
in the last quarter of fiscal year 2020. The University closed in March 2020 to in-person instruction as a result
of the COVID-19 pandemic, at which time most students left campus. These decreases were offset by increases
in student tuition and fees of $11.1 million, state fee for service revenue of $13.6 million, and grants and
contracts of $14.9 million. The grants and contracts revenue increase was a result of increased federal grant
funding, as well as increases in private grant funding and private federal flow thru funding.
System nonoperating revenues increased $58.1 million and $14.6 million in fiscal years 2020 and 2019,
respectively, over prior years. The fiscal year 2020 increase is due primarily to an increase in federal
nonoperating grants and contracts of $30.0 million to $76.4 million as of June 30, 2020. Federal nonoperating
grants and contracts increased due to the System receiving direct funding from the Cares Act, $8.0 million of
which was for emergency financial aid grants to students at both CSU and CSU Pueblo, as well as $8.8 million
for institutional support for CSU, which was used to offset housing refunds to students. Federal nonoperating
grants and contracts also increased due to the System receiving $13.4 million from executive order D-2020-070
from the State of Colorado to higher education institutions that was passed through from the CARES Act.
Other, net nonoperating revenues increased $19.3 million in fiscal year 2020, which was a result of CSU gaining
ownership of the Natural Resources Research Center – Building A building and land. Gift revenue increased
by $6.1 million to $57.8 million. State appropriations were $5.2 million as of June 30, 2020, a $3.4 million
increase over the prior year. State appropriations received in fiscal year 2020 included $1.8 million for Institute
of Cannabis Research, $1.3 million for Healthy Forests and Vibrant Communities, $1.1 million for Forest
Restoration, and $1.0 million for the Forest Restoration Wildfire Risk Mitigation Program. Investment income
remained relatively stable at $28.4 million in fiscal year 2020, after a large increase in fiscal year 2019, which
9
COLORADO STATE UNIVERSITY SYSTEM
Management’s Discussion and Analysis
Years Ended June 30, 2020 and 2019
(Unaudited)
was a result of dividend revenue and gain on investments from the System starting its own treasury. In fiscal
year 2020, the System recorded $4.1 million from a direct distribution of PERA contributions made on the
System’s behalf by the State due to Senate Bill 18-200.
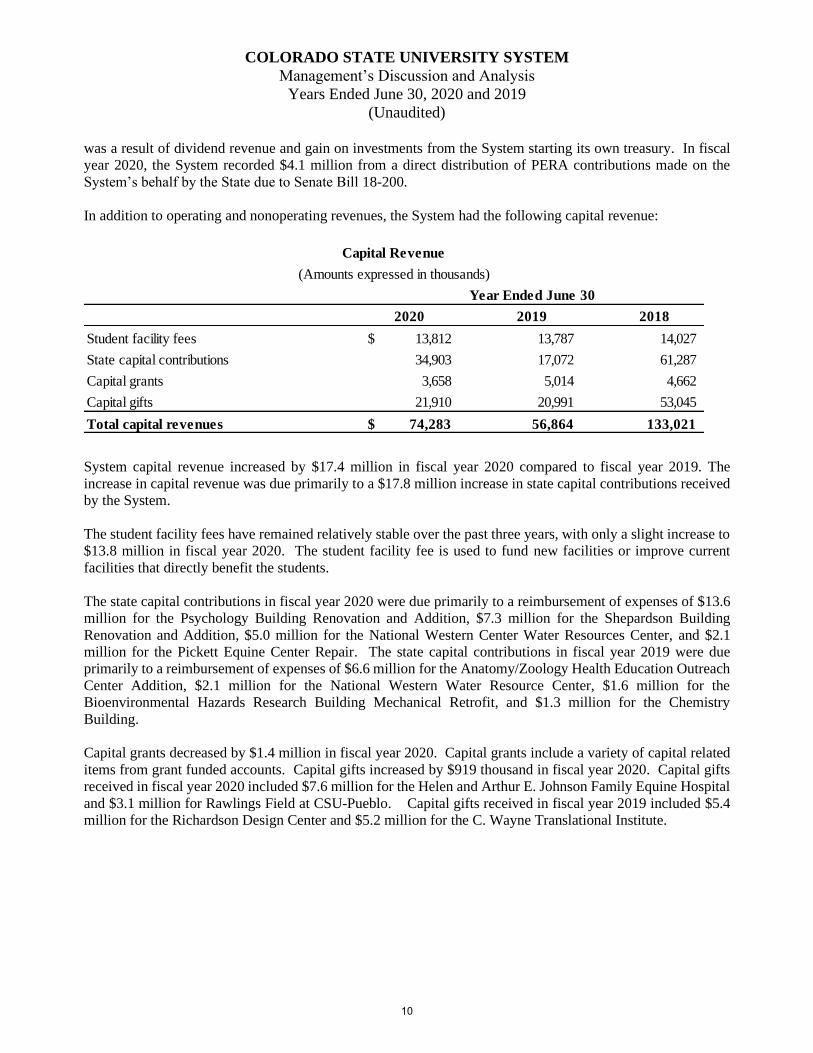
In addition to operating and nonoperating revenues, the System had the following capital revenue:
2020 2019 2018
Student facility fees 13,812$ 13,787 14,027
State capital contributions 34,903 17,072 61,287
Capital grants 3,658 5,014 4,662
Capital gifts 21,910 20,991 53,045
Total capital revenues 74,283$ 56,864 133,021
Capital Revenue
(Amounts expressed in thousands)
Year Ended June 30
System capital revenue increased by $17.4 million in fiscal year 2020 compared to fiscal year 2019. The
increase in capital revenue was due primarily to a $17.8 million increase in state capital contributions received
by the System.
The student facility fees have remained relatively stable over the past three years, with only a slight increase to
$13.8 million in fiscal year 2020. The student facility fee is used to fund new facilities or improve current
facilities that directly benefit the students.
The state capital contributions in fiscal year 2020 were due primarily to a reimbursement of expenses of $13.6
million for the Psychology Building Renovation and Addition, $7.3 million for the Shepardson Building
Renovation and Addition, $5.0 million for the National Western Center Water Resources Center, and $2.1
million for the Pickett Equine Center Repair. The state capital contributions in fiscal year 2019 were due
primarily to a reimbursement of expenses of $6.6 million for the Anatomy/Zoology Health Education Outreach
Center Addition, $2.1 million for the National Western Water Resource Center, $1.6 million for the
Bioenvironmental Hazards Research Building Mechanical Retrofit, and $1.3 million for the Chemistry
Building.
Capital grants decreased by $1.4 million in fiscal year 2020. Capital grants include a variety of capital related
items from grant funded accounts. Capital gifts increased by $919 thousand in fiscal year 2020. Capital gifts
received in fiscal year 2020 included $7.6 million for the Helen and Arthur E. Johnson Family Equine Hospital
and $3.1 million for Rawlings Field at CSU-Pueblo. Capital gifts received in fiscal year 2019 included $5.4
million for the Richardson Design Center and $5.2 million for the C. Wayne Translational Institute.
10
COLORADO STATE UNIVERSITY SYSTEM
Management’s Discussion and Analysis
Years Ended June 30, 2020 and 2019
(Unaudited)
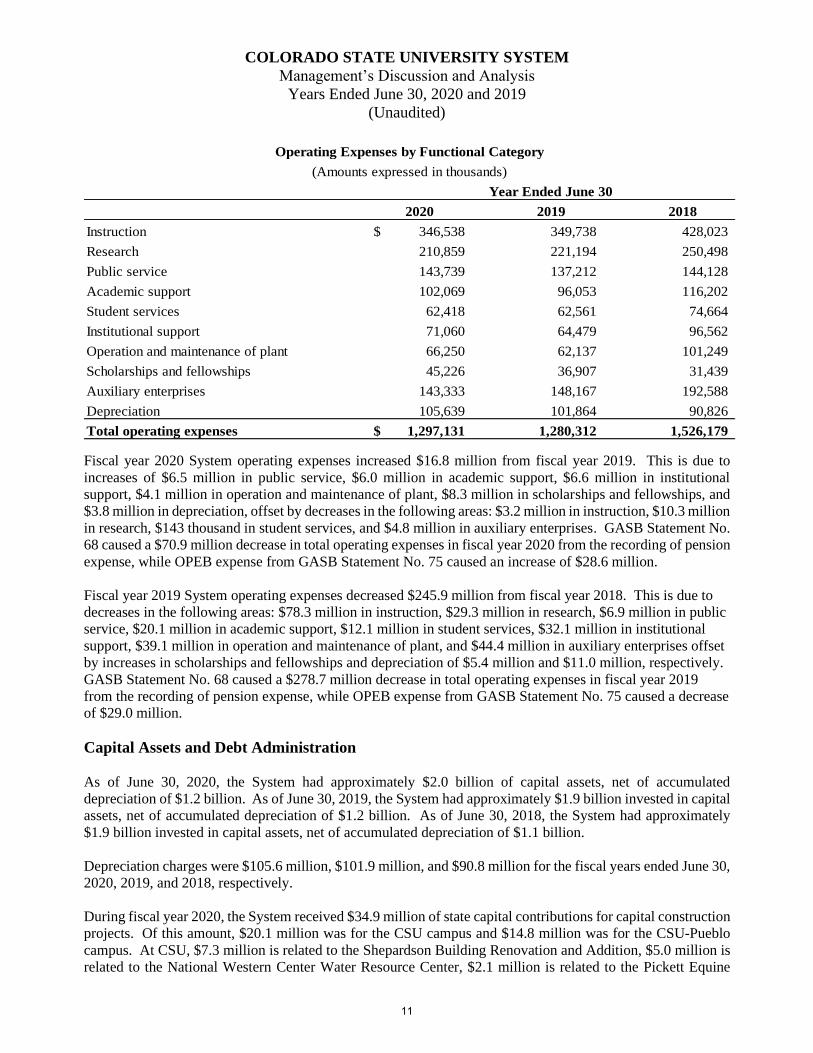
2020 2019 2018
Instruction 346,538$ 349,738 428,023
Research 210,859 221,194 250,498
Public service 143,739 137,212 144,128
Academic support 102,069 96,053 116,202
Student services 62,418 62,561 74,664
Institutional support 71,060 64,479 96,562
Operation and maintenance of plant 66,250 62,137 101,249
Scholarships and fellowships 45,226 36,907 31,439
Auxiliary enterprises 143,333 148,167 192,588
Depreciation 105,639 101,864 90,826
Total operating expenses 1,297,131$ 1,280,312 1,526,179
Operating Expenses by Functional Category
(Amounts expressed in thousands)
Year Ended June 30
Fiscal year 2020 System operating expenses increased $16.8 million from fiscal year 2019. This is due to
increases of $6.5 million in public service, $6.0 million in academic support, $6.6 million in institutional
support, $4.1 million in operation and maintenance of plant, $8.3 million in scholarships and fellowships, and
$3.8 million in depreciation, offset by decreases in the following areas: $3.2 million in instruction, $10.3 million
in research, $143 thousand in student services, and $4.8 million in auxiliary enterprises. GASB Statement No.
68 caused a $70.9 million decrease in total operating expenses in fiscal year 2020 from the recording of pension
expense, while OPEB expense from GASB Statement No. 75 caused an increase of $28.6 million.
Fiscal year 2019 System operating expenses decreased $245.9 million from fiscal year 2018. This is due to
decreases in the following areas: $78.3 million in instruction, $29.3 million in research, $6.9 million in public
service, $20.1 million in academic support, $12.1 million in student services, $32.1 million in institutional
support, $39.1 million in operation and maintenance of plant, and $44.4 million in auxiliary enterprises offset
by increases in scholarships and fellowships and depreciation of $5.4 million and $11.0 million, respectively.
GASB Statement No. 68 caused a $278.7 million decrease in total operating expenses in fiscal year 2019
from the recording of pension expense, while OPEB expense from GASB Statement No. 75 caused a decrease
of $29.0 million.
Capital Assets and Debt Administration
As of June 30, 2020, the System had approximately $2.0 billion of capital assets, net of accumulated
depreciation of $1.2 billion. As of June 30, 2019, the System had approximately $1.9 billion invested in capital
assets, net of accumulated depreciation of $1.2 billion. As of June 30, 2018, the System had approximately
$1.9 billion invested in capital assets, net of accumulated depreciation of $1.1 billion.
Depreciation charges were $105.6 million, $101.9 million, and $90.8 million for the fiscal years ended June 30,
2020, 2019, and 2018, respectively.
During fiscal year 2020, the System received $34.9 million of state capital contributions for capital construction
projects. Of this amount, $20.1 million was for the CSU campus and $14.8 million was for the CSU-Pueblo
campus. At CSU, $7.3 million is related to the Shepardson Building Renovation and Addition, $5.0 million is
related to the National Western Center Water Resource Center, $2.1 million is related to the Pickett Equine
11
COLORADO STATE UNIVERSITY SYSTEM
Management’s Discussion and Analysis
Years Ended June 30, 2020 and 2019
(Unaudited)
Center Repair, with the remaining amount related to smaller campus projects. At CSU-Pueblo, $13.6 million is
related to the Psychology Building Renovation and Addition and $430 thousand is related to technology
infrastructure upgrades, with the remaining amount related to smaller campus projects.
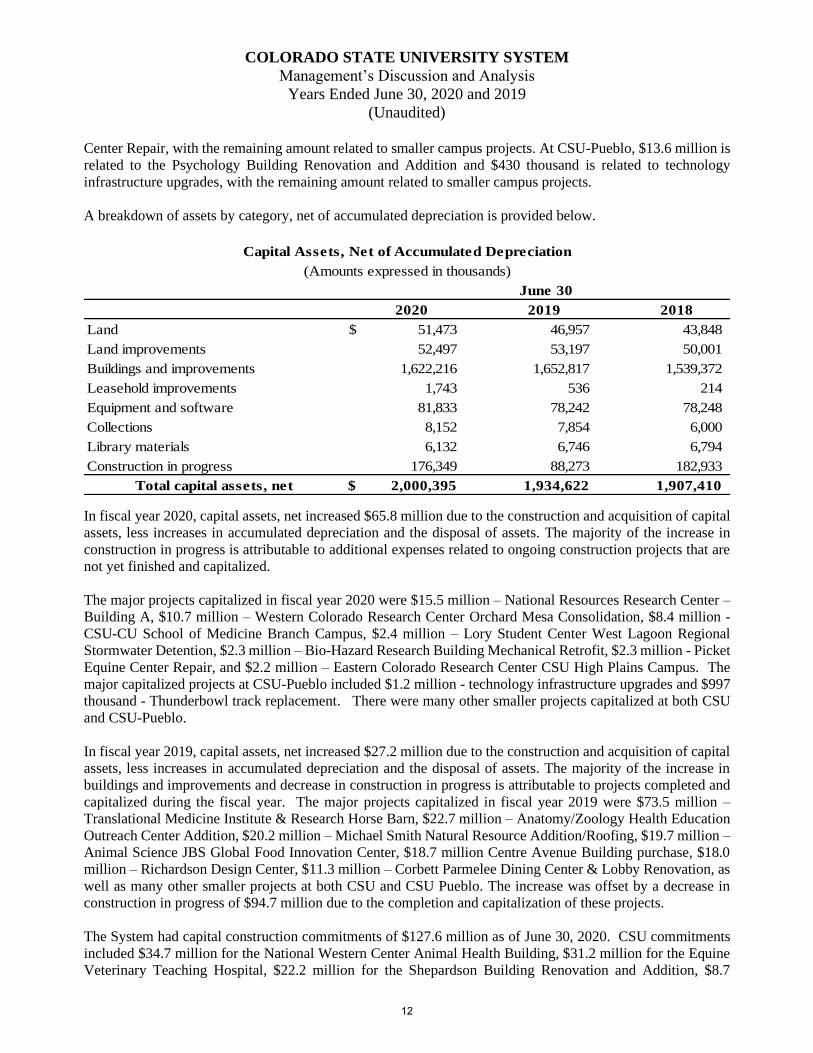
A breakdown of assets by category, net of accumulated depreciation is provided below.
2020 2019 2018
Land $ 51,473 46,957 43,848
Land improvements 52,497 53,197 50,001
Buildings and improvements 1,622,216 1,652,817 1,539,372
Leasehold improvements 1,743 536 214
Equipment and software 81,833 78,242 78,248
Collections 8,152 7,854 6,000
Library materials 6,132 6,746 6,794
Construction in progress 176,349 88,273 182,933
Total capital assets, net $ 2,000,395 1,934,622 1,907,410
Capital Assets, Net of Accumulated Depreciation
(Amounts expressed in thousands)
June 30
In fiscal year 2020, capital assets, net increased $65.8 million due to the construction and acquisition of capital
assets, less increases in accumulated depreciation and the disposal of assets. The majority of the increase in
construction in progress is attributable to additional expenses related to ongoing construction projects that are
not yet finished and capitalized.
The major projects capitalized in fiscal year 2020 were $15.5 million – National Resources Research Center –
Building A, $10.7 million – Western Colorado Research Center Orchard Mesa Consolidation, $8.4 million -
CSU-CU School of Medicine Branch Campus, $2.4 million – Lory Student Center West Lagoon Regional
Stormwater Detention, $2.3 million – Bio-Hazard Research Building Mechanical Retrofit, $2.3 million - Picket
Equine Center Repair, and $2.2 million – Eastern Colorado Research Center CSU High Plains Campus. The
major capitalized projects at CSU-Pueblo included $1.2 million - technology infrastructure upgrades and $997
thousand - Thunderbowl track replacement. There were many other smaller projects capitalized at both CSU
and CSU-Pueblo.
In fiscal year 2019, capital assets, net increased $27.2 million due to the construction and acquisition of capital
assets, less increases in accumulated depreciation and the disposal of assets. The majority of the increase in
buildings and improvements and decrease in construction in progress is attributable to projects completed and
capitalized during the fiscal year. The major projects capitalized in fiscal year 2019 were $73.5 million –
Translational Medicine Institute & Research Horse Barn, $22.7 million – Anatomy/Zoology Health Education
Outreach Center Addition, $20.2 million – Michael Smith Natural Resource Addition/Roofing, $19.7 million –
Animal Science JBS Global Food Innovation Center, $18.7 million Centre Avenue Building purchase, $18.0
million – Richardson Design Center, $11.3 million – Corbett Parmelee Dining Center & Lobby Renovation, as
well as many other smaller projects at both CSU and CSU Pueblo. The increase was offset by a decrease in
construction in progress of $94.7 million due to the completion and capitalization of these projects.
The System had capital construction commitments of $127.6 million as of June 30, 2020. CSU commitments
included $34.7 million for the National Western Center Animal Health Building, $31.2 million for the Equine
Veterinary Teaching Hospital, $22.2 million for the Shepardson Building Renovation and Addition, $8.7
12
COLORADO STATE UNIVERSITY SYSTEM
Management’s Discussion and Analysis
Years Ended June 30, 2020 and 2019
(Unaudited)
million for the Geo Exchange System, $5.8 million for Center for Vector-Borne Infectious Disease, $4 million
for the Temple Grandin Equine Center, $3.5 million for the Wastewater Treatment Plant-Mountain Campus,
$3.5 million for the National Western Center Water Resources Center, and $2.0 million for the CSU Center at
the National Western Center. CSU-Pueblo capital construction commitments included $4.2 million for the
Psychology Building Renovation & Addition. The remaining commitments are for smaller projects at the
System.
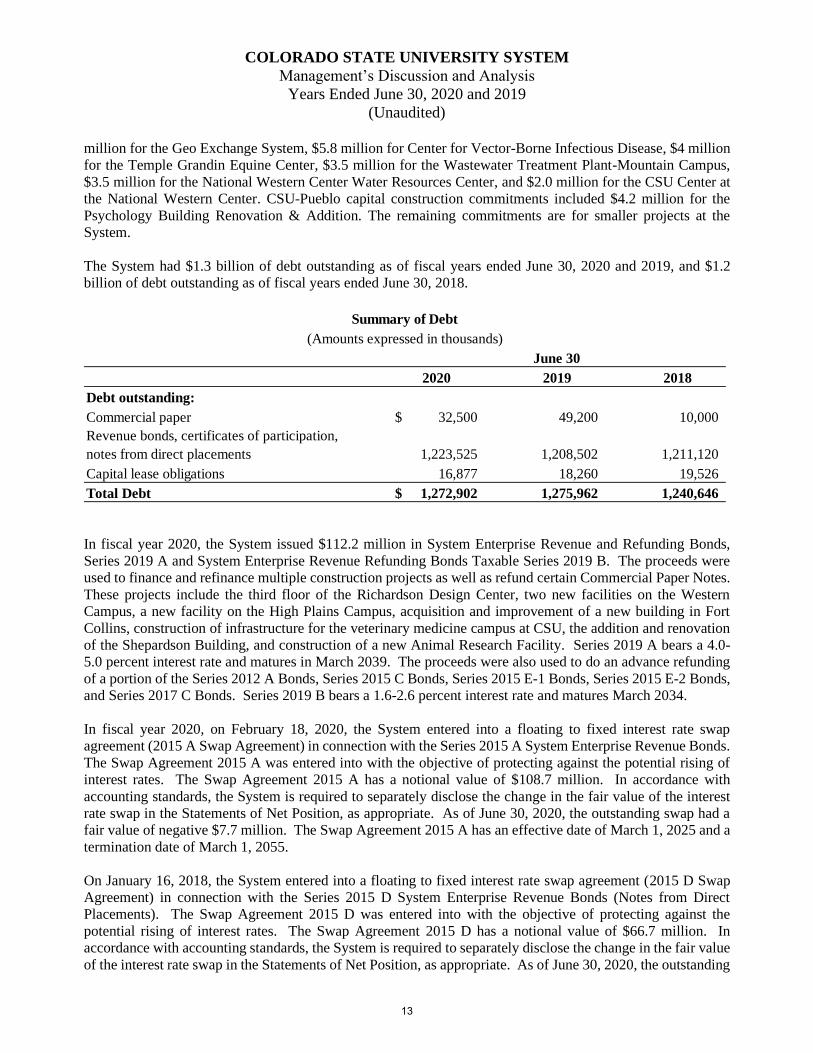
The System had $1.3 billion of debt outstanding as of fiscal years ended June 30, 2020 and 2019, and $1.2
billion of debt outstanding as of fiscal years ended June 30, 2018.
2020 2019 2018
Debt outstanding:
Commercial paper 32,500$ 49,200 10,000
Revenue bonds, certificates of participation,
notes from direct placements 1,223,525 1,208,502 1,211,120
Capital lease obligations 16,877 18,260 19,526
Total Debt 1,272,902$ 1,275,962 1,240,646
Summary of Debt
(Amounts expressed in thousands)
June 30
In fiscal year 2020, the System issued $112.2 million in System Enterprise Revenue and Refunding Bonds,
Series 2019 A and System Enterprise Revenue Refunding Bonds Taxable Series 2019 B. The proceeds were
used to finance and refinance multiple construction projects as well as refund certain Commercial Paper Notes.
These projects include the third floor of the Richardson Design Center, two new facilities on the Western
Campus, a new facility on the High Plains Campus, acquisition and improvement of a new building in Fort
Collins, construction of infrastructure for the veterinary medicine campus at CSU, the addition and renovation
of the Shepardson Building, and construction of a new Animal Research Facility. Series 2019 A bears a 4.0-
5.0 percent interest rate and matures in March 2039. The proceeds were also used to do an advance refunding
of a portion of the Series 2012 A Bonds, Series 2015 C Bonds, Series 2015 E-1 Bonds, Series 2015 E-2 Bonds,
and Series 2017 C Bonds. Series 2019 B bears a 1.6-2.6 percent interest rate and matures March 2034.
In fiscal year 2020, on February 18, 2020, the System entered into a floating to fixed interest rate swap
agreement (2015 A Swap Agreement) in connection with the Series 2015 A System Enterprise Revenue Bonds.
The Swap Agreement 2015 A was entered into with the objective of protecting against the potential rising of
interest rates. The Swap Agreement 2015 A has a notional value of $108.7 million. In accordance with
accounting standards, the System is required to separately disclose the change in the fair value of the interest
rate swap in the Statements of Net Position, as appropriate. As of June 30, 2020, the outstanding swap had a
fair value of negative $7.7 million. The Swap Agreement 2015 A has an effective date of March 1, 2025 and a
termination date of March 1, 2055.
On January 16, 2018, the System entered into a floating to fixed interest rate swap agreement (2015 D Swap
Agreement) in connection with the Series 2015 D System Enterprise Revenue Bonds (Notes from Direct
Placements). The Swap Agreement 2015 D was entered into with the objective of protecting against the
potential rising of interest rates. The Swap Agreement 2015 D has a notional value of $66.7 million. In
accordance with accounting standards, the System is required to separately disclose the change in the fair value
of the interest rate swap in the Statements of Net Position, as appropriate. As of June 30, 2020, the outstanding
13
COLORADO STATE UNIVERSITY SYSTEM
Management’s Discussion and Analysis
Years Ended June 30, 2020 and 2019
(Unaudited)
swap had a fair value of negative $14.9 million. The fair value as of June 28, 2019 was negative $5.0 million.
The Swap Agreement 2015 D has an effective date of July 1, 2019 and a termination date of March 1, 2047.
As of June 20, 2020, the commercial paper issued was $32.5 million, down from $49.2 million as of June 20,
2019. The $16.7 million reduction was due to payment of $9.2 million on the Semester at Sea Building, $5.0
million on the WCRC Orchard Mesa, and $2.5 million on the Richardson Design Center. In fiscal year 2019,
the Board of Governors authorized an increase in the aggregate principal amount to be issued of Commercial
Paper Notes to $75.0 million from $50.0 million authorized the prior fiscal year, related to the Series A (tax-
exempt) and Series B (taxable) issuance. The authorized increase to $75.0 million is effective for fiscal year
2020. The proceeds of Series A, B are used to finance certain projects, as determined by the Board, including
but not limited to: the construction, acquisition, renovation, improvement and equipping of the Michael Smith
Natural Resources Building in Fort Collins; the Richardson Design Center in Fort Collins; the Institute for
Biological and Translational Therapies in Fort Collins; the JBS Global Food Innovation Center in Honor of
Gary and Kay Smith in Fort Collins; the Residence and Dining Corbett remodel project; and the Western Slope
CVMBS/Extension Project; any other improvements to any of the campuses for which the Board has spending
authority; and such other capital projects as may be designated by the Board. Series A and Series B bear an
interest rate based on a 365/366-day year and actual number of days elapsed and shall mature on a business day
within a period not exceeding two hundred seventy days from its respective date of issue, but in no event later
than March 1, 2037.
Prior to fiscal year 2020, in fiscal year 2019, the System issued $30.4 million in taxable System Enterprise
Revenue Bonds, Series 2018 A. The proceeds were used to finance the construction of the Center for Vector-
borne Infectious Diseases on the Foothills Campus. The facility will include faculty and research infrastructure,
functional research laboratories, insectary and office space. The proceeds were also used to finance a portion
of the JBS Global Food Innovation Center addition for Animal Sciences. Series 2018 A bears a 2.6-4.2 percent
interest rate and matures in March 2033.
In fiscal year 2018, the System issued $117.6 million in System Enterprise Revenue Refunding Bonds, Series
2017 A, B. The proceeds of Series 2017 A were used to advance refund a portion of the Board’s System
Enterprise Revenue Bonds, Series 2012 A and pay costs of issuing the Series 2017 A Bonds. The proceeds of
Series 2017 B were used to advance refund a portion of the Board’s System Enterprise Revenue Bonds, Series
2013 C and pay the costs of issuing the Series 2017 B Bonds. Series 2017 A bears a 2.0-5.0 percent interest
rate and matures in March 2044, Series 2017 B bears a 2.0-5.0 percent interest rate and matures in March 2044.
In fiscal year 2018, the System issued $204.7 million in System Enterprise Revenue Refunding Bonds, Series
2017 C, D. The proceeds of Series 2017 C, D were used for the purposes of financing the payment and discharge
of all or a portion of certain bonds outstanding under the Master Resolution; and paying certain costs relating
to the issuance of the Series 2017 C, D Bonds. Series 2017 C bears a 2.5-5.0 percent interest rate and matures
in March 2047, Series 2017 D bears a 2.0-5.0 percent interest rate and matures in March 2039.
In fiscal year 2018, the System issued $55.5 million in System Enterprise Revenue Refunding Bonds, Series
2017 E, F. The proceeds of Series 2017 E, F were used for the purposes of financing the payment and discharge
of a portion of certain bonds outstanding under the Master Resolution; and paying certain costs relating to the
issuance of the Series 2017 E, F Bonds. Series 2017 E bears a 2.0-5.0 percent interest rate and matures in
March 2043, Series 2017 F bears a 2.0-5.0 percent interest rate and matures in March 2045.
Net proceeds of the above-mentioned Series 2017 A, B, Series 2017 C, D, and Series 2017 E, F and previous
Series 2016 B, Series 2015 C and Series 2013 A, B were placed in an escrow account to purchase U.S. Treasury
Securities. The principal and interest from the U.S. Treasury Securities is being used to repay the refunded
bonds which are considered to be defeased. The Escrow Agent will pay the debt service requirements on each
14
COLORADO STATE UNIVERSITY SYSTEM
Management’s Discussion and Analysis
Years Ended June 30, 2020 and 2019
(Unaudited)
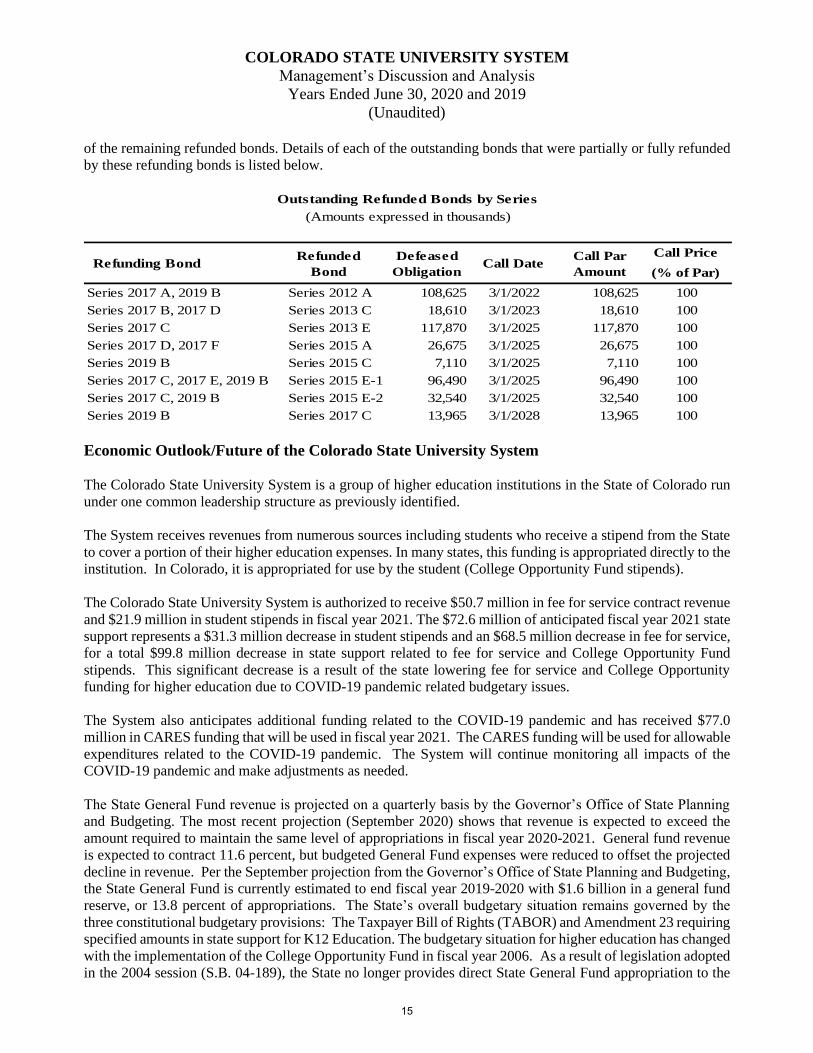
of the remaining refunded bonds. Details of each of the outstanding bonds that were partially or fully refunded
by these refunding bonds is listed below.
Call Price
(% of Par)
Series 2017 A, 2019 B Series 2012 A 108,625 3/1/2022 108,625 100
Series 2017 B, 2017 D Series 2013 C 18,610 3/1/2023 18,610 100
Series 2017 C Series 2013 E 117,870 3/1/2025 117,870 100
Series 2017 D, 2017 F Series 2015 A 26,675 3/1/2025 26,675 100
Series 2019 B Series 2015 C 7,110 3/1/2025 7,110 100
Series 2017 C, 2017 E, 2019 B Series 2015 E-1 96,490 3/1/2025 96,490 100
Series 2017 C, 2019 B Series 2015 E-2 32,540 3/1/2025 32,540 100
Series 2019 B Series 2017 C 13,965 3/1/2028 13,965 100
Outstanding Refunded Bonds by Series
(Amounts expressed in thousands)
Refunding BondRefunded
Bond
Defeased
ObligationCall Date
Call Par
Amount
Economic Outlook/Future of the Colorado State University System
The Colorado State University System is a group of higher education institutions in the State of Colorado run
under one common leadership structure as previously identified.
The System receives revenues from numerous sources including students who receive a stipend from the State
to cover a portion of their higher education expenses. In many states, this funding is appropriated directly to the
institution. In Colorado, it is appropriated for use by the student (College Opportunity Fund stipends).
The Colorado State University System is authorized to receive $50.7 million in fee for service contract revenue
and $21.9 million in student stipends in fiscal year 2021. The $72.6 million of anticipated fiscal year 2021 state
support represents a $31.3 million decrease in student stipends and an $68.5 million decrease in fee for service,
for a total $99.8 million decrease in state support related to fee for service and College Opportunity Fund
stipends. This significant decrease is a result of the state lowering fee for service and College Opportunity
funding for higher education due to COVID-19 pandemic related budgetary issues.
The System also anticipates additional funding related to the COVID-19 pandemic and has received $77.0
million in CARES funding that will be used in fiscal year 2021. The CARES funding will be used for allowable
expenditures related to the COVID-19 pandemic. The System will continue monitoring all impacts of the
COVID-19 pandemic and make adjustments as needed.
The State General Fund revenue is projected on a quarterly basis by the Governor’s Office of State Planning
and Budgeting. The most recent projection (September 2020) shows that revenue is expected to exceed the
amount required to maintain the same level of appropriations in fiscal year 2020-2021. General fund revenue
is expected to contract 11.6 percent, but budgeted General Fund expenses were reduced to offset the projected
decline in revenue. Per the September projection from the Governor’s Office of State Planning and Budgeting,
the State General Fund is currently estimated to end fiscal year 2019-2020 with $1.6 billion in a general fund
reserve, or 13.8 percent of appropriations. The State’s overall budgetary situation remains governed by the
three constitutional budgetary provisions: The Taxpayer Bill of Rights (TABOR) and Amendment 23 requiring
specified amounts in state support for K12 Education. The budgetary situation for higher education has changed
with the implementation of the College Opportunity Fund in fiscal year 2006. As a result of legislation adopted
in the 2004 session (S.B. 04-189), the State no longer provides direct State General Fund appropriation to the
15
COLORADO STATE UNIVERSITY SYSTEM
Management’s Discussion and Analysis
Years Ended June 30, 2020 and 2019
(Unaudited)
governing boards. Instead, the State provides stipends to qualified, resident undergraduate students, and
institutions receive fee for service contracts from the Colorado Commission on Higher Education for the
provision of other educational services. Finally, S.B. 04-189 also allows institutions of higher education to
become TABOR enterprises through this new funding mechanism. Enterprise status eliminates institutional
cash funds, such as tuition, from counting against the state’s TABOR limitation. As a result of S.B. 04-189,
the Colorado State University System became a qualified Tabor enterprise.
In fiscal year 2007, the System was designated a Single Enterprise providing it greater flexibility and expanded
financial capabilities in a host of areas. This designation allows the System to raise revenues and finance
projects outside of the revenue limits set for most governmental entities. With this TABOR status, the cash
funds collected by the System's institutions no longer count toward the State's overall revenue limit. In addition,
as enterprises, the institutions can consider issuing revenue bonds backed by student fees for academic
buildings.
Total full-time equivalent enrollment at the System for fiscal year 2020 was 38,111. This includes 26,393 at
CSU, 3,128 at CSU-Pueblo, and 8,590 enrolled at CSU-Global. Compared to fiscal year 2019, CSU enrollment
dropped slightly at .3 percent. CSU-Pueblo enrollment dropped by 6.9 percent, and CSU-Global saw total
enrollment grow .5 percent. Total enrollment at the System is anticipated to decrease 2.0 percent in fiscal year
2021. This includes a 4.6 percent decrease at CSU, a 4.6 percent decrease at CSU-Pueblo, and a 7.0 percent
increase at CSU-Global.
Requests for Information
The financial report is designed to provide a general overview of the Colorado State University System’s
finances for all those with an interest in the System’s finances and to demonstrate the System’s accountability
for the money it receives. Questions concerning any of the information provided in this report or requests for
additional information should be addressed to the attention of the Chief Financial Officer, Colorado State
University System, 475 Seventeenth Street, Suite 1550, Denver, CO 80202.
16
THIS PAGE LEFT BLANK INTENTIONALLY
17
University
Component
Units University
Component
Units
Assets and Deferred Outflows of Resources
Current Assets
Cash and cash equivalents (Note 4) $ 282,457 3,257 272,562 3,043
Investments (Note 5) 61,678 - 60,834 -
Accounts and loans receivable, net (Note 6) 179,036 61,709 163,995 64,223
Inventories 9,785 - 8,993 -
Assets held for resale (Note 7) 4,307 - 4,307 -
Other assets 9,836 135 11,702 474
Total Current Assets547,099 65,101 522,393 67,740
Noncurrent Assets
Restricted cash and cash equivalents (Note 4) 59,950 - 44,034 -
Investments, restricted and unrestricted (Note 5) 386,912 553,017 283,609 545,343
Student loans receivable, net (Note 6) 13,192 - 17,755 -
Other assets 2 3,656 2 3,449
Capital assest, net (Note 7) 2,000,395 562 1,934,622 300
Net other post employment benefit assets (Note 20) 15,652 - 15,267 -
Total Noncurrent Assets2,476,103 557,235 2,295,289 549,092
Total Assets$
3,023,202 622,336 2,817,682 616,832
Deferred Outflows of Resources:
Debt refundings (Note 12) $ 65,763 - 64,929 -
Pensions (Note 18) 37,084 - 97,569 -
Other post employment benefits (Note 20) 6,580 - 7,393 -
Other 22,583 - 5,063 -
Total Deferred Outflows of Resources132,010 - 174,954 -
Total Assets and Deferred Outflows of Resources$
3,155,212 622,336 2,992,636 616,832
Liabilities and Deferred Inflows of Resources
Current Liabilities
Accounts payable $ 69,843 17,016 57,945 6,470
Accrued liabilities (Note 8) 50,266 291 39,004 213
Unearned revenue 137,518 - 50,996 -
Deposits held for others (Note 10) 7,138 - 7,337 -
2019 *
COLORADO STATE UNIVERSITY SYSTEM
Statements of Net Position
June 30, 2020 and 2019 (in thousands)
2020
18
University
Component
Units University
Component
Units
Liabilities and Deferred Inflows of Resources
Current Liabilities
Commercial paper (Note 9) 32,500 - 49,200 -
Bonds, certificates of participation, and capital leases payable (Note 11, 14) 33,424 - 29,961 -
Compensated absences (Note 8) 3,770 - 3,365 -
Other liabilities (Note 10) 4,452 81 1,958 53
Total Current Liabilities 338,911 17,388 239,766 6,736
Noncurrent Liabilities
Bonds, certificates of participation, and capital leases payable (Note 11, 14) $ 1,206,978 - 1,196,801 -
Deposits held for others (Note 10) 24,573 13,844 22,712 13,500
Interest rate swap agreement (Note 11) 22,569 - 5,029 -
Compensated absences (Note 8) 56,827 - 51,429 -
Net pension liabilities (Note 18) 517,249 - 611,552 -
Net other post employment benefit liabilities (Note 20) 25,123 - 27,464 -
Other liabilities (Note 10) 13,605 2,889 21,732 1,957
Total Noncurrent Liabilities1,866,924 16,733 1,936,719 15,457
Total Liabilities $ 2,205,835 34,121 2,176,485 22,193
Deferred Inflows of Resources
Pensions (Note 18) $ 212,357 - 321,537 -
Other post employment benefits (Note 20) 12,687 - 8,763 -
Other 2 - - -
Total Deferred Inflows of Resources225,046 - 330,300 -
Total Liabilities and Deferred Inflows of Resources $ 2,430,881 34,121 2,506,785 22,193
Net position
Net investment in capital assets $ 850,176 - 756,092 -
Restricted for nonexpendable purposes (Note 16) 28,680 - 27,849 -
Restricted for expendable purposes (Note 16) 51,032 - 48,297
With donor restrictions - 558,939 - 545,514
Unrestricted (205,557) 29,276 (346,387) 49,125
Total Net Position $ 724,331 588,215 485,851 594,639
*Reclassified
COLORADO STATE UNIVERSITY SYSTEM
Statements of Net Position
June 30, 2020 and 2019 (in thousands)
See accompanying notes to basic financial statements.
2019 *2020
19
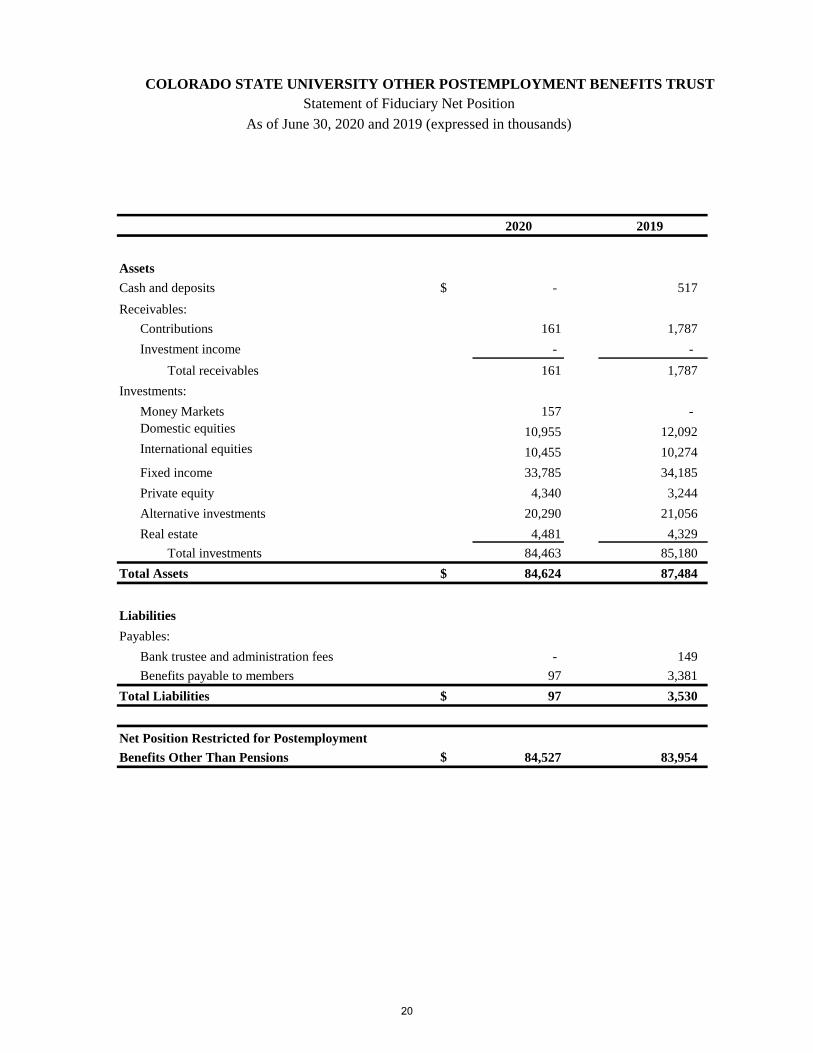
2020 2019
Assets
Cash and deposits $ - 517
Receivables:
Contributions 161 1,787
Investment income - -
Total receivables 161 1,787
Investments:
Money Markets 157 -
Domestic equities 10,955 12,092
International equities 10,455 10,274
Fixed income 33,785 34,185
Private equity 4,340 3,244
Alternative investments 20,290 21,056
Real estate 4,481 4,329
Total investments 84,463 85,180
Total Assets $ 84,624 87,484
Liabilities
Payables:
Bank trustee and administration fees - 149
Benefits payable to members 97 3,381
Total Liabilities $ 97 3,530
Net Position Restricted for Postemployment
Benefits Other Than Pensions $ 84,527 83,954
COLORADO STATE UNIVERSITY OTHER POSTEMPLOYMENT BENEFITS TRUST
Statement of Fiduciary Net Position
As of June 30, 2020 and 2019 (expressed in thousands)
20
Component Component
University Units University Units
Operating Revenues
Student tuition and fees, (including $89,390 and $86,544
of revenues pledged for bonds in 2020 and 2019, respectively,
and net of scholarship allowances of $146,249 and $131,127
for 2020 and 2019, respectively) (Note 13, 22) $ 603,946 - 592,885 -
State fee for service revenue (Note 24) 121,961 - 108,350 -
Grants and contracts (including $59,471 and $58,054
of revenues pledged for bonds in 2020 and 2019,
respectively) (Note 13) 366,017 - 351,096 -
Sales and services of educational activities 40,659 - 43,296 -
Auxiliary enterprises, (including $141,932 and $169,378
of revenues pledged for bonds in 2020 and 2019,
respectively, and net of scholarship allowances of $6,027 and
$4,695 for 2020 and 2019, respectively) (Note 13, 22) 166,354 - 203,677 -
Contributions - 60,919 - 62,897
Other revenues 11,411 7,281 11,973 4,453
Total Operating Revenues 1,310,348 68,200 1,311,277 67,350
Operating Expenses
Instruction 346,538 - 349,738 -
Research 210,859 - 221,194 -
Public service 143,739 - 137,212 -
Academic support 102,069 - 96,053 -
Student services 62,418 - 62,561 -
Institutional support 71,060 83,707 64,479 79,154
Operation and maintenance of plant 66,250 - 62,137 -
Scholarships and fellowships 45,226 - 36,907 -
Auxiliary enterprises 143,333 - 148,167 -
Depreciation (Note 7) 105,639 21 101,864 23
Total Operating Expenses 1,297,131 83,728 1,280,312 79,177
Operating Income (Loss) $ 13,217 (15,528) 30,965 (11,827)
COLORADO STATE UNIVERSITY SYSTEM
Statements of Revenues, Expenses, and Changes in Net Position
Years ended June 30, 2020 and 2019 (in thousands)
20192020
21
Component Component
University Units University Units
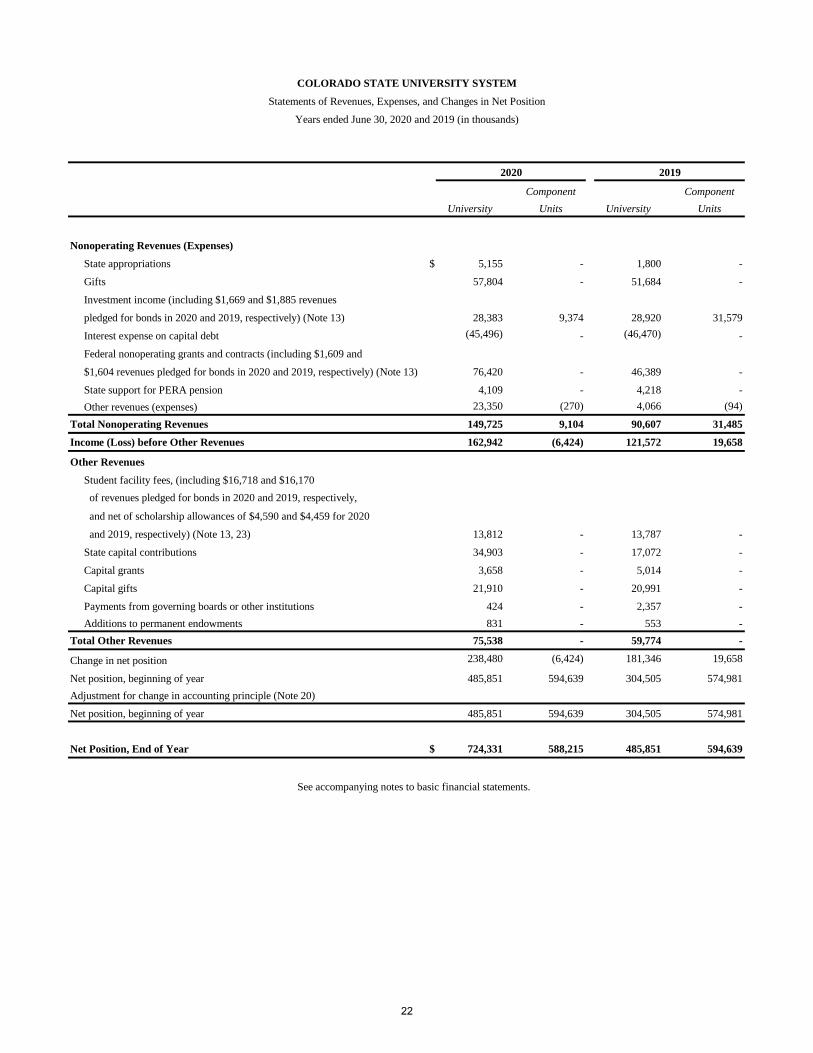
Nonoperating Revenues (Expenses)
State appropriations $ 5,155 - 1,800 -
Gifts 57,804 - 51,684 -
Investment income (including $1,669 and $1,885 revenues
pledged for bonds in 2020 and 2019, respectively) (Note 13) 28,383 9,374 28,920 31,579
Interest expense on capital debt (45,496) - (46,470) -
Federal nonoperating grants and contracts (including $1,609 and
$1,604 revenues pledged for bonds in 2020 and 2019, respectively) (Note 13) 76,420 - 46,389 -
State support for PERA pension 4,109 - 4,218 -
Other revenues (expenses) 23,350 (270) 4,066 (94)
Total Nonoperating Revenues 149,725 9,104 90,607 31,485
Income (Loss) before Other Revenues 162,942 (6,424) 121,572 19,658
Other Revenues
Student facility fees, (including $16,718 and $16,170
of revenues pledged for bonds in 2020 and 2019, respectively,
and net of scholarship allowances of $4,590 and $4,459 for 2020
and 2019, respectively) (Note 13, 23) 13,812 - 13,787 -
State capital contributions 34,903 - 17,072 -
Capital grants 3,658 - 5,014 -
Capital gifts 21,910 - 20,991 -
Payments from governing boards or other institutions 424 - 2,357 -
Additions to permanent endowments 831 - 553 -
Total Other Revenues 75,538 - 59,774 -
Change in net position 238,480 (6,424) 181,346 19,658
Net position, beginning of year 485,851 594,639 304,505 574,981
Adjustment for change in accounting principle (Note 20)
Net position, beginning of year 485,851 594,639 304,505 574,981
Net Position, End of Year $ 724,331 588,215 485,851 594,639
COLORADO STATE UNIVERSITY SYSTEM
Statements of Revenues, Expenses, and Changes in Net Position
Years ended June 30, 2020 and 2019 (in thousands)
2020 2019
See accompanying notes to basic financial statements.
22
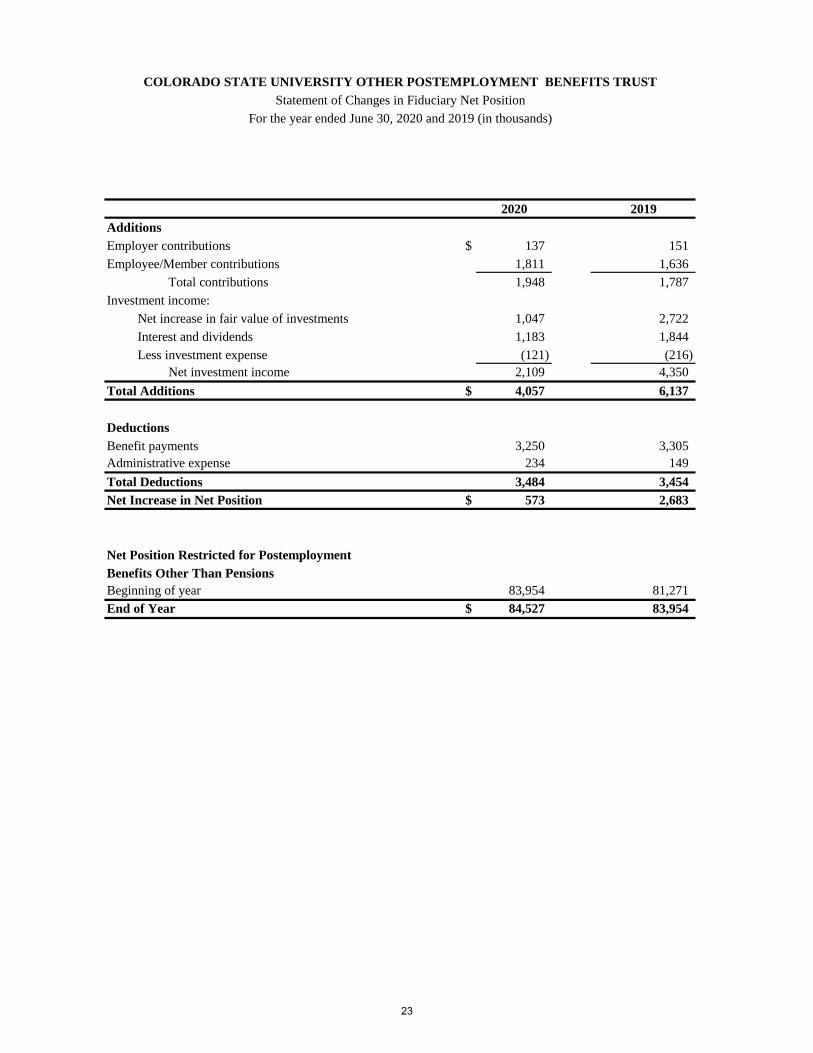
2020 2019
Additions
Employer contributions $ 137 151
Employee/Member contributions 1,811 1,636
Total contributions 1,948 1,787
Investment income:
Net increase in fair value of investments 1,047 2,722
Interest and dividends 1,183 1,844
Less investment expense (121) (216)
Net investment income 2,109 4,350
Total Additions $ 4,057 6,137
Deductions
Benefit payments 3,250 3,305
Administrative expense 234 149
Total Deductions 3,484 3,454
Net Increase in Net Position $ 573 2,683
Net Position Restricted for Postemployment
Benefits Other Than Pensions
Beginning of year 83,954 81,271
End of Year $ 84,527 83,954
COLORADO STATE UNIVERSITY OTHER POSTEMPLOYMENT BENEFITS TRUST
Statement of Changes in Fiduciary Net Position
For the year ended June 30, 2020 and 2019 (in thousands)
23
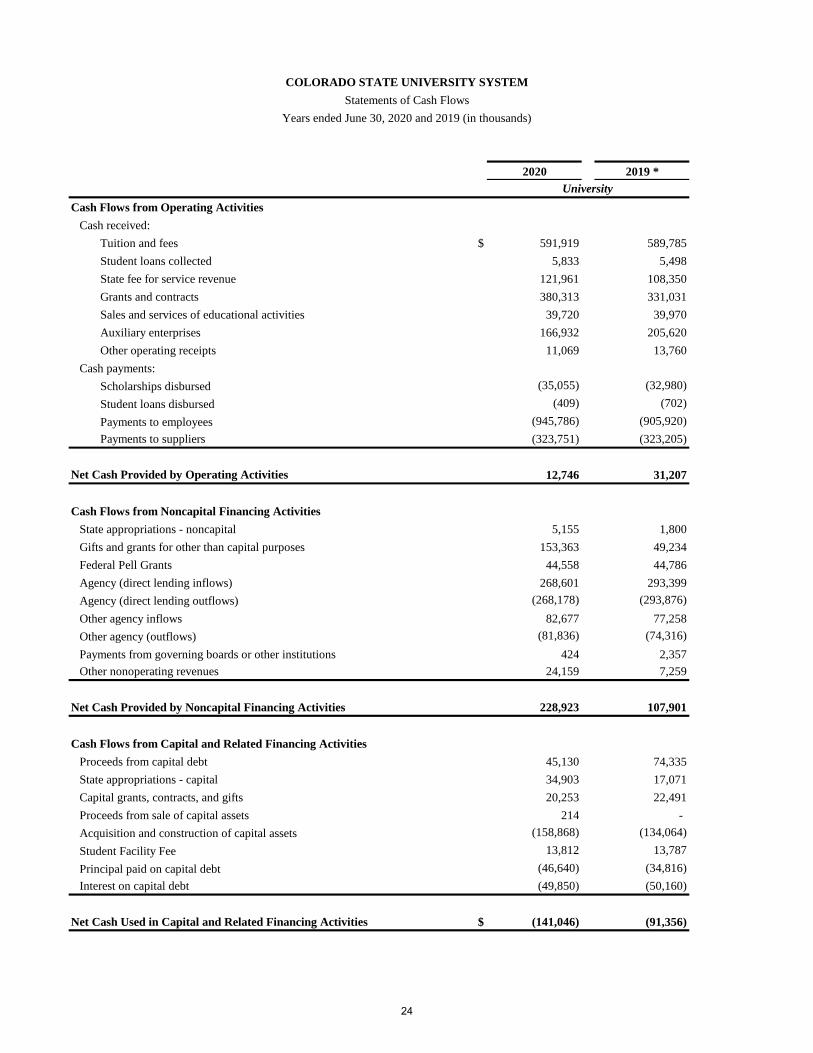
2020 2019 *
Cash Flows from Operating Activities
Cash received:
Tuition and fees $ 591,919 589,785
Student loans collected 5,833 5,498
State fee for service revenue 121,961 108,350
Grants and contracts 380,313 331,031
Sales and services of educational activities 39,720 39,970
Auxiliary enterprises 166,932 205,620
Other operating receipts 11,069 13,760
Cash payments:
Scholarships disbursed (35,055) (32,980)
Student loans disbursed (409) (702)
Payments to employees (945,786) (905,920)
Payments to suppliers (323,751) (323,205)
Net Cash Provided by Operating Activities 12,746 31,207
Cash Flows from Noncapital Financing Activities
State appropriations - noncapital 5,155 1,800
Gifts and grants for other than capital purposes 153,363 49,234
Federal Pell Grants 44,558 44,786
Agency (direct lending inflows) 268,601 293,399
Agency (direct lending outflows) (268,178) (293,876)
Other agency inflows 82,677 77,258
Other agency (outflows) (81,836) (74,316)
Payments from governing boards or other institutions 424 2,357
Other nonoperating revenues 24,159 7,259
Net Cash Provided by Noncapital Financing Activities 228,923 107,901
Cash Flows from Capital and Related Financing Activities
Proceeds from capital debt 45,130 74,335
State appropriations - capital 34,903 17,071
Capital grants, contracts, and gifts 20,253 22,491
Proceeds from sale of capital assets 214 -
Acquisition and construction of capital assets (158,868) (134,064)
Student Facility Fee 13,812 13,787
Principal paid on capital debt (46,640) (34,816)
Interest on capital debt (49,850) (50,160)
Net Cash Used in Capital and Related Financing Activities $ (141,046) (91,356)
COLORADO STATE UNIVERSITY SYSTEM
Statements of Cash Flows
Years ended June 30, 2020 and 2019 (in thousands)
University
24
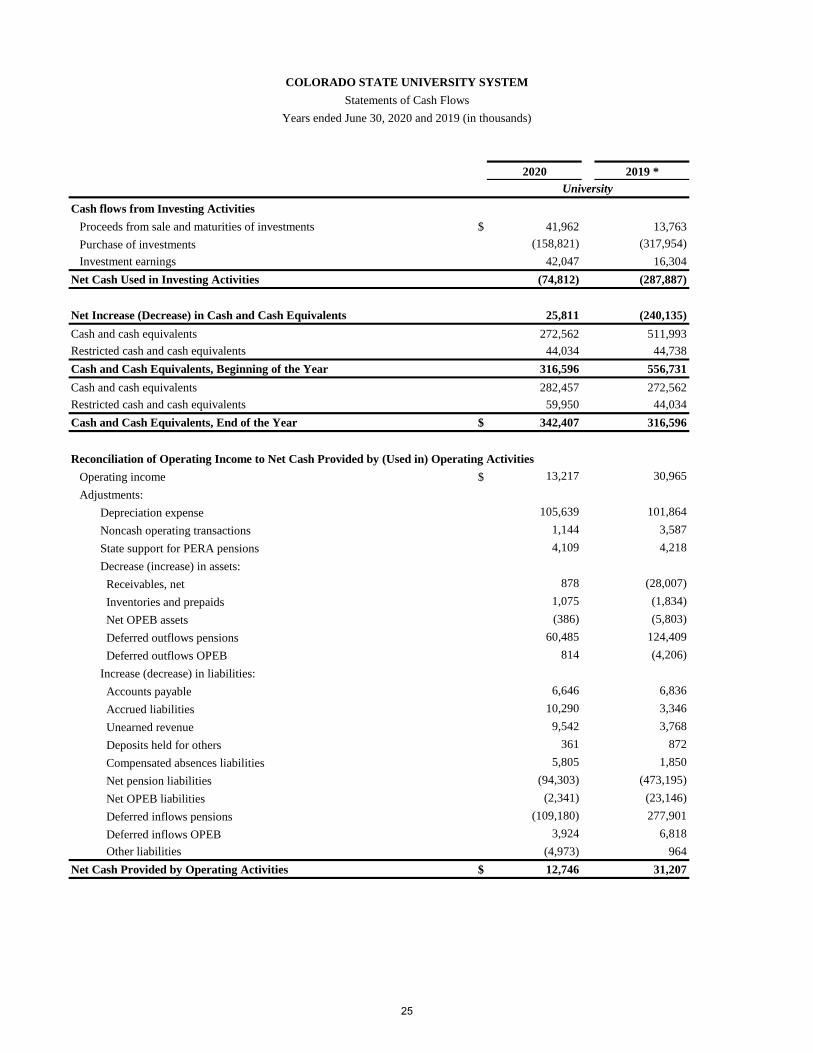
2020 2019 *
COLORADO STATE UNIVERSITY SYSTEM
Statements of Cash Flows
Years ended June 30, 2020 and 2019 (in thousands)
University
Cash flows from Investing Activities
Proceeds from sale and maturities of investments $ 41,962 13,763
Purchase of investments (158,821) (317,954)
Investment earnings 42,047 16,304
Net Cash Used in Investing Activities (74,812) (287,887)
Net Increase (Decrease) in Cash and Cash Equivalents 25,811 (240,135)
Cash and cash equivalents 272,562 511,993
Restricted cash and cash equivalents 44,034 44,738
Cash and Cash Equivalents, Beginning of the Year 316,596 556,731
Cash and cash equivalents 282,457 272,562
Restricted cash and cash equivalents 59,950 44,034
Cash and Cash Equivalents, End of the Year $ 342,407 316,596
Reconciliation of Operating Income to Net Cash Provided by (Used in) Operating Activities
Operating income $ 13,217 30,965
Adjustments:
Depreciation expense 105,639 101,864
Noncash operating transactions 1,144 3,587
State support for PERA pensions 4,109 4,218
Decrease (increase) in assets:
Receivables, net 878 (28,007)
Inventories and prepaids 1,075 (1,834)
Net OPEB assets (386) (5,803)
Deferred outflows pensions 60,485 124,409
Deferred outflows OPEB 814 (4,206)
Increase (decrease) in liabilities:
Accounts payable 6,646 6,836
Accrued liabilities 10,290 3,346
Unearned revenue 9,542 3,768
Deposits held for others 361 872
Compensated absences liabilities 5,805 1,850
Net pension liabilities (94,303) (473,195)
Net OPEB liabilities (2,341) (23,146)
Deferred inflows pensions (109,180) 277,901
Deferred inflows OPEB 3,924 6,818
Other liabilities (4,973) 964
Net Cash Provided by Operating Activities $ 12,746 31,207
25
2020 2019 *
COLORADO STATE UNIVERSITY SYSTEM
Statements of Cash Flows
Years ended June 30, 2020 and 2019 (in thousands)
University
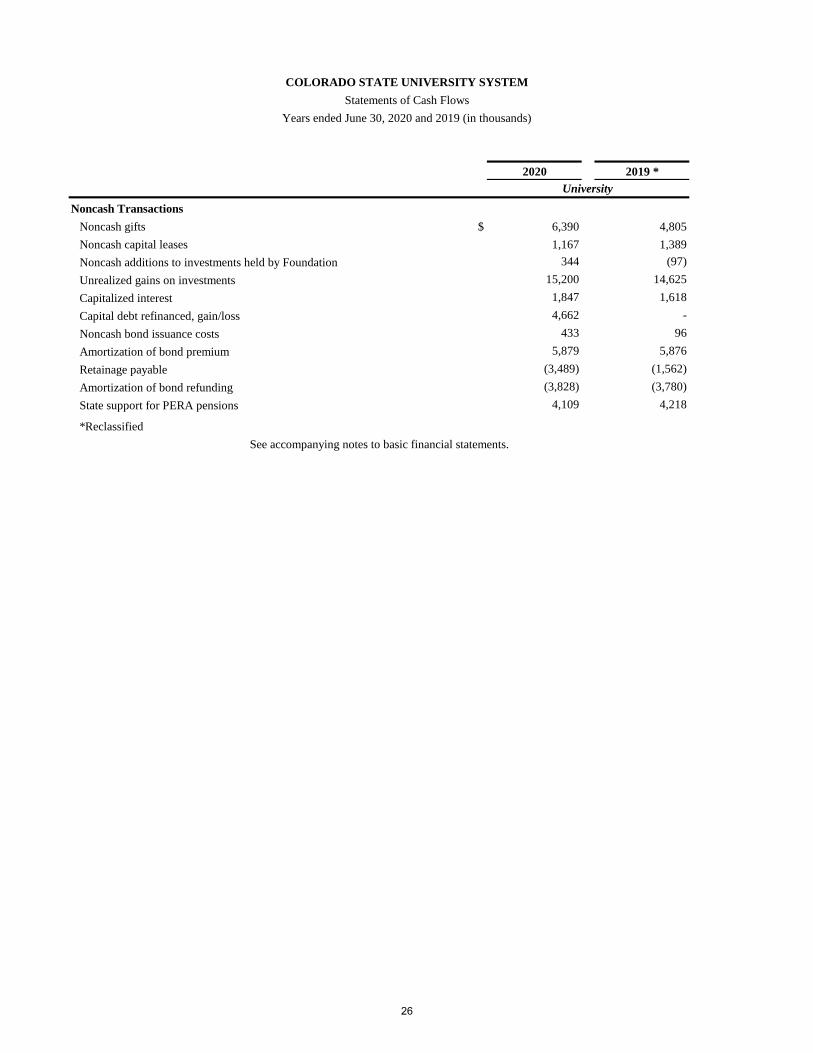
Noncash Transactions
Noncash gifts $ 6,390 4,805
Noncash capital leases 1,167 1,389
Noncash additions to investments held by Foundation 344 (97)
Unrealized gains on investments 15,200 14,625
Capitalized interest 1,847 1,618
Capital debt refinanced, gain/loss 4,662 -
Noncash bond issuance costs 433 96
Amortization of bond premium 5,879 5,876
Retainage payable (3,489) (1,562)
Amortization of bond refunding (3,828) (3,780)
State support for PERA pensions 4,109 4,218
*Reclassified
See accompanying notes to basic financial statements.
26
COLORADO STATE UNIVERSITY SYSTEM
Notes to Basic Financial Statements
Years Ended June 30, 2020 and 2019
(Amounts expressed in thousands)
(1) Governance and Reporting Entity
(a) Governance
The Colorado State University System (the System) is an institution of higher education of the State of
Colorado. For financial reporting purposes, the System is included as part of the State of Colorado’s primary
government. The Board of Governors (the Board) is the governing board of the System. The Board consists
of nine members appointed by the Governor of the State of Colorado and six nonvoting representatives from
the institutions. In addition to these financial statements, the System’s financial activity is also included in
the basic financial statements of the State of Colorado.
(b) Reporting Entity
The accompanying financial statements present the operations of the System. The System conducts its
operations through the following three institutions:
Colorado State University – (CSU)
Colorado State University – Pueblo (CSU-Pueblo)
Colorado State University – Global Campus (CSU-Global)
As the State’s land grant institution, CSU includes the Agriculture Experiment Station, CSU Extension, and
the Colorado State Forest Service. In addition, the accompanying financial statements contain the financial
activity of the System offices.
As a higher education institution of the State of Colorado, the income of the System is generally exempt
from income taxes as a governmental unit. However, income unrelated to the exempt purpose of the System
would be subject to tax under IRC Section 511(a)(2)(B). The System had no material unrelated business
income for the fiscal years ended June 30, 2020 and 2019.
(c) Discretely Presented Component Units
The System follows Governmental Accounting Standards Board (GASB) Statement No. 39, as amended by
GASB 61, The Financial Reporting Entity: Omnibus. This statement provides guidance to determine
whether certain organizations for which the System is not financially accountable should be reported as
component units based on the nature and significance of their relationship with the System. The Colorado
State University System Foundation (the CSUS Foundation), the Colorado State University Foundation (the
CSU Foundation), and the Colorado State University – Pueblo Foundation (the CSU-Pueblo Foundation)
have been determined to be component units of the System and have therefore been included as discretely
presented component units in the System financial reporting entity. The Colorado State University Research
Foundation does not meet the criteria to be reported as a component unit.
The CSUS Foundation
The CSUS Foundation, established in 2015, began operations in fiscal year 2016 as a Colorado nonprofit
entity to support the System in accordance with Colorado law as authorized by the Board. The CSUS
Foundation was created to accept transfers of intellectual property of the System, which in turn is then
licensed to a wholly owned private corporate subsidiary, Beyond Campus Innovations (the Corporation), of
the CSUS Foundation in exchange for ownership of the Corporation and a share of the revenues of the
Corporation. The CSUS Foundation will distribute monies or make grants to the System in accordance with
the rules and regulations of the internal revenue code. Uses of these distributions include funding innovation
27
COLORADO STATE UNIVERSITY SYSTEM
Notes to Basic Financial Statements
Years Ended June 30, 2020 and 2019
(Amounts expressed in thousands)
and System initiatives, investment in new technology for the benefit of the System, improvement of access
and affordability for students of the System, and other purposes as determined by the Board.
The officers of the CSUS Foundation are appointed by the Board of Directors. The Board of Directors
initially consists of seven Directors. Three members are designated as CSU Directors and four members are
designated as Independent Directors. The Board shall elect the CSU Directors and the reigning Independent
Directors shall elect future Independent Directors. The number of Directors is subject to change as
determined by the Board of Directors.
The source of the CSUS Foundation’s revenue is distributions from the Corporation. The sources for the
Corporation’s revenue are management services, applicant advising, and curriculum development. For the
fiscal years ended June 30, 2020 and 2019, net income was $502 thousand and $205 thousand, respectively.
The CSU Foundation
The CSU Foundation is a legally separate, tax-exempt entity that was established to receive, manage, and
invest philanthropic gifts on behalf of CSU. The majority of resources or income thereon that the CSU
Foundation holds and invests is restricted for use by, or for the benefit of CSU by the donors. The CSU
Foundation is a nonprofit organization that reports under Financial Accounting Standards Board (FASB)
Accounting Standards Codification (ASC), including FASB ASC 958-205, Presentation of Financial
Statements. As such, certain revenue recognition criteria and presentation requirements are different from
GASB revenue recognition criteria and presentation requirements. No modifications have been made to the
CSU Foundation’s financial information in the System’s financial reporting entity for these differences, as
permitted by GASB Statement No. 39. The CSU Foundation fully discloses the nature of its endowment
funds; both donor restricted endowment funds and board-designated endowment funds are classified and
reported based on the existence or absence of donor-imposed restrictions.
The CSU Foundation was established in 1970 as an independent 501(c)(3) organization. The officers of the
CSU Foundation are appointed by the Board of Directors. The Board of Directors consists of eleven voting
members. Ten voting members are community members elected by the Board of Directors and the eleventh
voting member is the President of the CSU Foundation. The four ex-officio, nonvoting members of the
Board of Directors serve by virtue of title: President of Colorado State University, the CSU Vice President
for University Advancement, the CSU Vice President for University Operations, and a member of the
University’s Board of Governors who holds the position of liaison to the Foundation. No person who is an
employee of CSU is eligible to serve as an officer of the CSU Foundation or as a voting Board Member.
The CSU Foundation’s major sources of revenue are contributions and net investment income. The CSU
Foundation had $57.0 million and $59.8 million in contributions and $7.7 million and $28.7 million in net
investment income for the fiscal years ended June 30, 2020 and 2019, respectively. The total support and
revenue as of June 30, 2020 and 2019 was $67.8 million and $88.9 million, respectively.
The support provided by the CSU Foundation to CSU is intended to assist in the promotion, development,
and enhancement of the facilities, and educational programs and opportunities of the faculty, students, and
alumni of CSU. Additionally, the CSU Foundation provides receipts to contributors and invests
philanthropic gifts. Approximately $69.3 million and $67.3 million was transferred to CSU for the fiscal
years ended June 30, 2020 and 2019, respectively, in pursuit of the above stated objectives.
Endowments and the related expendable accounts of CSU are held by the CSU Foundation for investment
safekeeping. These funds amounted to $13.8 million and $13.5 million as of June 30, 2020 and 2019,
28
COLORADO STATE UNIVERSITY SYSTEM
Notes to Basic Financial Statements
Years Ended June 30, 2020 and 2019
(Amounts expressed in thousands)
respectively, and are reported as deposits held in custody for CSU in the financial statements of the CSU
Foundation.
Separately issued financial statements for the CSU Foundation are available at 300 University Services
Center, Fort Collins, CO 80523.
The CSU-Pueblo Foundation
The CSU-Pueblo Foundation was established in 1954 as an independent 501(c)(3) nonprofit corporation.
The affairs of the CSU-Pueblo Foundation are conducted by up to twenty-eight voting, elected Director-
Trustees. In addition, the President of CSU-Pueblo, one member of the Board of Governors, and the
President/CEO of the CSU-Pueblo Foundation serve as nonvoting, ex-officio members. The CSU-Pueblo
Foundation is a nonprofit organization that reports under Financial Accounting Standards Board (FASB)
Accounting Standards Codification (ASC), including FASB ASC 958-205, Presentation of Financial
Statements. As such, certain revenue recognition criteria and presentation requirements are different from
GASB revenue recognition criteria and presentation requirements. No modifications have been made to the
CSU-Pueblo Foundation’s financial information in the System’s financial reporting entity for these
differences, as permitted by GASB Statement No. 39.
The CSU-Pueblo Foundation’s major sources of revenue are contributions and fundraising revenues and
net investment returns. The CSU-Pueblo Foundation had $8.6 million and $7.5 million in related revenue
as of June 30, 2020 and 2019, respectively. The total revenue and support as of June 30, 2020 and 2019 was
$8.6 million and $7.6 million, respectively.
The CSU-Pueblo Foundation was formed to advance and assist in the development, growth, and operation
of CSU-Pueblo. The CSU-Pueblo Foundation recorded $7.3 million and $4.3 million in transfers of gifts
and other assets to CSU-Pueblo during fiscal years ended June 30, 2020 and 2019, respectively, in pursuit
of the above stated objectives.
Separately issued financial statements may be obtained from the CSU-Pueblo Foundation office at 2200
Bonforte Boulevard, Pueblo, CO 81001-4901.
(d) Other Postemployment Benefits Trust
The Colorado State University Other Postemployment Benefits Trust (Trust) was established June 27, 2014,
as a single-employer other postemployment benefits (OPEB) plan, for the purpose of accumulating and
investing assets to fund certain post-retirement medical benefits for retirees and disability income
replacement for employees of CSU. The Trust, which is an entity separate from the University, is for the
exclusive purpose of providing funds to pay benefits and for paying expenses of administering the Trust.
The Colorado State University OPEB Trust Administration Committee (Administration Committee) serves
as the Trust Administrator, and a Trustee, Bank New York Mellon, has the authority over the management,
disposition and investment of Trust assets, as defined in the Trust Agreement. Members of the
Administration Committee consist of the University’s Chief Total Rewards Officer, the University’s Chief
Financial Officer, the University’s Controller, the Colorado State University System’s Treasurer, and the
University’s Executive Director of Human Resources, and any at-large members that may be appointed by
the Administration Committee.
29
COLORADO STATE UNIVERSITY SYSTEM
Notes to Basic Financial Statements
Years Ended June 30, 2020 and 2019
(Amounts expressed in thousands)
(2) Basis of Presentation
For financial reporting purposes, the System is considered a special-purpose government engaged primarily
in business-type activities. The System applies all applicable Governmental Accounting Standards Board
(GASB) pronouncements.
Any effort to reconcile this report with presentations made for other purposes, such as data submitted with
the legislative budget request of the System, must take into consideration the differences in the basis of
accounting and other requirements for the presentation of such information.
(3) Measurement Focus, Basis of Accounting, and Summary of Significant Accounting Policies
As a special-purpose government engaged primarily in business-type activities, the basic financial
statements of the System have been presented using the economic resources measurement focus and the
accrual basis of accounting. Presentation is also in accordance with the State of Colorado Higher Education
Accounting Standard No. 17. Under the accrual basis of accounting, revenues are recognized when earned,
and expenses are recorded when incurred. All significant intra-agency transactions have been eliminated.
(a) Cash and Cash Equivalents
Cash and cash equivalents are defined as cash-on-hand, demand deposits, certificates of deposit with
financial institutions, pooled cash with the State Treasurer, and all highly liquid investments with an original
maturity when purchased of three months or less. Investments in mutual funds and money market funds and
securities are presented as investments.
(b) Investments
With the implementation of GASB Statement No. 72, Fair Value Measurement and Application, the System
now provides additional fair value measurements. Investments are reported in the financial statements at fair
value, which is determined primarily based on quoted market prices as of fiscal year end. Contract value is
used for the guaranteed investment agreement. The System’s investment policy permits investments in
fixed-income and equity securities. The policy is implemented using individual securities and mutual funds.
Discretely presented component units – CSU Foundation and CSU-Pueblo Foundation investments are
accounted for at fair value, which is determined by one of the following: quoted prices in active markets for
identical assets (level 1), inputs other than quoted prices that are observable directly or indirectly (level 2),
significant unobservable inputs where level 1 and 2 inputs are unavailable (level 3), or net asset value
practical expedients not within the fair value hierarchy (NAV).
Other Postemployment Benefits Trust – Trust investments are accounted for at fair value, which is
determined by one of the following: quoted prices in active markets for identical assets (level 1), inputs other
than quoted prices that are observable directly or indirectly (level 2), or significant unobservable inputs
where level 1 and 2 inputs are unavailable (level 3).
(c) Inventories
Inventories, consisting of livestock; facilities and housing maintenance supplies; medical, pharmaceutical,
and laboratory supplies; food supplies; books; and soft-goods are stated at the lower of cost or market. Cost
is determined either on the first-in/first-out, average-cost, weighted average-cost, specific-identification, or
30
COLORADO STATE UNIVERSITY SYSTEM
Notes to Basic Financial Statements
Years Ended June 30, 2020 and 2019
(Amounts expressed in thousands)
on the retail method. Livestock inventories have been recorded at the lower of cost or market using unit
livestock costing methods and estimated animal weights.
(d) Restricted Cash and Cash Equivalents and Restricted Investments
Assets are reported as restricted when restrictions on asset use change the nature or normal understanding
of the availability of the assets. For the System, examples of restricted cash and cash equivalents and
restricted investments include self-insurance funds, unexpended bond proceeds, and endowment funds.
(e) Capital Assets
Land, land improvements, buildings and improvements, leasehold improvements, library materials,
collections, and equipment are recorded at cost at the date of acquisition or estimated acquisition at the date
of donation in the case of gifts. Capitalization limits vary at the three institutions ranging from $5 thousand
to $50 thousand. At CSU, library materials are valued at average acquisition cost. At CSU-Pueblo, library
materials are valued at actual cost.
Depreciation and amortization are computed using the straight-line with the half-year convention method
over the estimated useful lives of the assets or intangible assets, generally 10 to 70 years for buildings, 10
to 21 years for land improvements, 10 to 15 years for library materials, 2 to 12 years for equipment and
software, and 3 to 25 years for leasehold improvements. Depreciation expense was not allocated among
functional categories.
Renovations to buildings and other improvements that significantly increase the value and extend the useful
life of the structure or includes a conversion of the use of the space, are capitalized. Routine repairs and
maintenance are charged to expense. Major outlays for capital assets and improvements are capitalized as
construction in progress throughout the building project.
During capital construction, interest cost is capitalized from the date of the borrowing to the date the
qualifying asset is ready for use. In addition, interest earnings are capitalized from the date of the tax-exempt
borrowing to the date the qualifying asset is ready to use. Once the capital asset is ready for use, the net cost
of interest on the borrowing is capitalized and added to the acquisition cost of the asset.
The System has capitalized collections such as works of art and historical artifacts. The nature of certain
collections is such that the value and usefulness of the collection does not change over time. These
collections have not been depreciated in the System’s financial statements.
Assets under capital leases are recorded at the present value of the future minimum lease payments and are
amortized using the straight-line with the half-year convention method over the estimated useful life of the
asset being leased.
The System evaluates prominent events or changes in circumstances affecting capital assets to determine
whether impairment of a capital asset has occurred. Capital assets are generally considered impaired if a
decline in service utility occurs, the impairment is material, and the event or change in circumstance is
outside the normal life cycle of the capital asset. Impaired capital assets that will no longer be used by the
System are reported at the lower of carrying value or fair value. Impairment losses on capital assets that will
continue to be used by the System are measured using the method that best reflects the diminished service
utility of the capital asset. If evidence is available to demonstrate that impairment will be temporary, the
capital asset is not written down. There were no material impairments of capital assets for fiscal year ended
June 30, 2020. Hughes Stadium land held a book value of $6 thousand and the demolition of Hughes
31
COLORADO STATE UNIVERSITY SYSTEM
Notes to Basic Financial Statements
Years Ended June 30, 2020 and 2019
(Amounts expressed in thousands)
Stadium held a construction in progress balance of $4.3 million that were moved to assets held for resale
for fiscal year ended June 30, 2019.
(f) Deferred Outflows and Inflows of Resources
With the implementation of GASB Statement No. 65, Items Previously Reported as Assets and Liabilities,
the System now carries a deferred outflow of resources related to the loss on bond refundings as well as the
mark to market valuation of the System’s Swap Agreement. For refundings resulting in defeasance of debt,
the difference between the reacquisition price and the net carrying amount of the old debt is reported on the
Statements of Net Position and amortized as a component of interest expense over the lesser of the remaining
life of the old debt or the life of the new debt. With the implementation of GASB Statement No. 83, Certain
Asset Retirement Obligations, the System now carries a deferred outflow of resources related to assets which
have not been fully depreciated that may incur future remediation costs. With the implementation of GASB
Statement No. 68, Accounting and Financial Reporting for Pensions – an amendment to GASB Statement
No. 27, the System now carries a deferred outflow of resources and deferred inflow of resources related to
pensions. With the implementation of GASB Statement No. 75, Accounting and Financial Reporting for
Postemployment Benefits Other Than Pensions, the System now carries a deferred outflow of resources and
deferred inflow of resources related to OPEB. As applicable, the difference between expected and actual
experiences, the difference between projected and actual earnings on pension or OPEB plan investments, the
impact on the net pension liability, net OPEB liability, or net OPEB asset resulting from changes in plan
related assumptions, the changes in the System’s proportionate share of the net pension or OPEB liability,
the difference between the proportionate share of the collective contributions and the actual contributions,
and contributions paid to PERA and the Trust subsequent to the plan’s measurement date are all reported on
the Statements of Net Position in relation to a net pension liability, net OPEB liability, or net OPEB asset. All
the above-mentioned deferrals are amortized as a component of pension and OPEB expense over varying
amounts of time with the exception of contributions paid to PERA and the Trust subsequent to the plan’s
measurement date which are a component of pension and OPEB expense in the current year.
(g) Compensated Absences Liabilities
Employees accrue and vest in annual and sick leave earnings based on their hire date and length of
service. Compensated absences and related personnel expenses are recognized based on estimated balances
due to employees as of fiscal year end. The value of annual leave liability is computed as the lesser of total
days earned but not taken or the maximum amount of days allowed to be paid out based on employment type
and university policy, multiplied by the salary rate as well as an additional amount for the State’s share of
PERA and Medicare as applicable. The value of sick leave liability is computed as the lesser of total days
earned but not taken or the maximum amount of days allowed to be paid out based on employment type and
university policy, multiplied by the salary rate and the State’s estimated retirement rate as well as an
additional amount for the State’s share of PERA and Medicare as applicable. The amount of compensated
absence liabilities that are recorded as a current liability on the Statements of Net Position are a three-year
rolling average of actual payouts. The remaining balance of the compensated absence liabilities is recorded
as a noncurrent liability on the Statements of Net Position.
(h) Net Position
Net position of the System is classified as follows:
Net investment in capital assets – This represents the total investment in capital assets, net of accumulated
depreciation and outstanding debt obligations related to those capital assets.
32
COLORADO STATE UNIVERSITY SYSTEM
Notes to Basic Financial Statements
Years Ended June 30, 2020 and 2019
(Amounts expressed in thousands)
Restricted net position – nonexpendable – Nonexpendable restricted net position consists of endowment
and similar type funds in which donors or other outside sources have stipulated, as a condition of the gift
instrument, that the principal is to be maintained inviolate and in perpetuity, and invested for the purpose
of producing future income, which may either be expended or added to principal.
Restricted net position – expendable – Restricted expendable net position includes resources in which
the System is legally or contractually obligated to spend resources in accordance with restrictions imposed
by external third parties.
Unrestricted net position – Unrestricted net position represents resources derived from student tuition
and fees, state fee for service reserves, and sales and services of educational activities. These resources
are used for transactions relating to the educational and general operations of the System and may be used
to meet current expenses for any purpose. These resources also include auxiliary enterprises, which are
substantially self-supporting activities that provide services for students, faculty, and staff. Unrestricted
net position may be designated by actions of the Board.
Discretely presented component units – Net assets of the CSUS Foundation, the CSU Foundation, and
the CSU-Pueblo Foundation and the changes therein are classified and reported as follows:
Net assets without donor restrictions – Net assets that are not subject to donor-imposed restrictions or
the donor-imposed restrictions have expired or been fulfilled. Net assets in this category may be
expended for any purpose in performing the primary objectives of the Foundation.
Net assets with donor restrictions – Net assets subject to stipulations imposed by donors and grantors.
Some donor restrictions are temporary in nature; those restrictions will be met by actions of the
Foundation or by the passage of time. Other donor restrictions are perpetual in nature, whereby the
donor has stipulated the funds be maintained in perpetuity.
Other Postemployment Benefits Trust – Net position of the Trust is classified as restricted for
postemployment benefits other than pensions.
(i) Classification of Revenues
The System has classified revenues as either operating or nonoperating according to the following criteria:
Operating revenues consist of services and sales related to teaching, research, and public service, along
with auxiliary activities of student, faculty, and staff support. These revenues primarily include: 1) tuition
and fees from students (after reduction for scholarship allowances provided with institutional funds);
2) state fee for service revenues; 3) grants and contracts from federal, state, and local governments, and
private sources including businesses, individuals, and foundations; 4) sales and services of the Veterinary
Teaching Hospital and Diagnostic Laboratory; and 5) fees for goods and services of auxiliary operations
such as student housing and dining, student center retail stores, health services, and athletics. Revenues
from exchange transactions are recognized when they are earned and measurable.
Operating expenses represent the full cost of providing the services and goods associated with operating
revenues. These expenses are accrued when incurred and measurable and reported using functional
classifications.
33
COLORADO STATE UNIVERSITY SYSTEM
Notes to Basic Financial Statements
Years Ended June 30, 2020 and 2019
(Amounts expressed in thousands)
Nonoperating revenues are those not included as operating revenues or other revenues. Nonoperating
revenues consist primarily of gifts from grantors and donors, and investment income that are relied upon
and budgeted for support of operating expenses. Also included in nonoperating revenues are State
appropriations and Federal grants including Pell and bond subsidies. Nonoperating expenses are those not
included as operating expenses or other expenses. Nonoperating expenses include interest expense on
capital debt.
Other revenues include student facility fees, state capital construction and controlled maintenance
appropriations, capital gifts, and grants primarily designated for capital purposes. This classification also
includes payments from (to) governing boards or other institutions as well as additions (reductions) to
permanent endowments.
(j) Summer Session Revenue and Related Expenses
The System prorates the summer session revenues and expenses based on the number of days between the
first day of the summer session and the last day of the summer session which falls before or after June 30.
(k) Application of Restricted and Unrestricted Resources
This application is made on a case-by-case basis by management depending on overall program
requirements and resources. Generally, management applies restricted resources then unrestricted resources
when both restricted and unrestricted resources are available to pay an expense.
(l) Use of Estimates
The preparation of financial statements in conformity with accounting principles generally accepted in the
United States of America requires management to make estimates and assumptions that affect the reported
amounts of assets and liabilities at the date of the financial statements and the reported amounts of revenues
and expenses during the reporting period. Actual results could differ from those estimates.
(m) Reclassifications
Certain balances as of June 30, 2019 have been reclassified to conform to the presentation of fiscal year
2020. OPEB net assets were not restricted in fiscal year 2019, however, were restricted in fiscal year
2020. As a result, $15.3 million has been reclassified to restricted for expendable purposes - other in the
Statements of Net Position. Sales of products and sales of services have been redefined as sales and services
of educational activities and auxiliary enterprises in the Statements of Cash Flows in order to present
information in line with the Statements of Revenues, Expenses, and Changes in Net Position. As a result,
$16.4 million has been reclassified between these two lines. Also, federal Pell grants and student facility
fees are now discretely presented in the Statements of Cash Flows as material and distinct activities. As a
result, $44.8 million and $13.8 million have been reclassified from other nonoperating revenues and
acquisition and construction of capital assets, respectively.
(4) Cash and Cash Equivalents
The System deposits a portion of its cash and cash equivalents with the Colorado State Treasurer. The State
Treasurer pools these deposits and invests them in securities authorized by CRS 24-75-601.1. The State
Treasury acts as a bank for all state agencies and institutions of higher education, with the exception of the
University of Colorado. Monies deposited in the Treasury are invested until the cash is needed.
As of June 30, 2020, the System had cash on deposit with the State Treasurer of $298.7 million which
represented approximately 3.1 percent of the total $9.6 billion fair value of deposits in the State Treasurer’s
34
COLORADO STATE UNIVERSITY SYSTEM
Notes to Basic Financial Statements
Years Ended June 30, 2020 and 2019
(Amounts expressed in thousands)
Pool (Pool). As of June 30, 2019, the System had cash on deposit with the State Treasurer of $276.2 million
which represented approximately 3.0 percent of the total $9.1 billion fair value of deposits in the Pool. As
of June 30, 2020, the Pool’s resources included $16.0 million of cash on hand and $9.6 billion of
investments.
On the basis of the System’s participation in the Pool, the System reports as an increase or decrease in cash
and cash equivalents its share of the Treasurer’s unrealized gains and losses on the Pool’s underlying
investments. The State Treasurer does not invest any of the Pool’s resources in any external investment
pool, and there is no assignment of income related to participation in the Pool. The unrealized gains or
losses included in income reflect only the change in fair value for the fiscal year.
The difference between the System’s cash carrying value, deposits with the State Treasurer and balances at
other banks is due to outstanding checks and deposits in transit. Interest earned on deposits with the State
Treasurer for the fiscal years ended June 30, 2020 and 2019 was approximately $5.6 million and $7.8
million, respectively. These amounts reflect increases in cash and cash equivalents and increases in
investment income. The System also records unrealized gains or losses on deposits with the State Treasurer.
The System reflected an unrealized gain on cash and cash equivalents on deposit with the State Treasurer
for the fiscal years ended June 30, 2020 and 2019 of $8.8 million and $1.3 million, respectively. The
unrealized gain on investment income for the fiscal year ended June 30, 2020 was $7.5 million and the
unrealized gain on investment income for the fiscal year ended June 30, 2019 was $7.4 million.
Custodial credit risk for deposits is the risk that in the event of a bank failure, the System’s deposits may
not be returned to it. To manage custodial risk, deposits with financial institutions are made in accordance
with the Colorado Public Deposit Protection Act (PDPA) of 1975. PDPA requires all eligible depositories
holding public deposits to pledge designated eligible collateral having a market value equal to at least 102
percent of the deposits exceeding those amounts insured by federal depository insurance. Deposits
collateralized under PDPA are considered to be collateralized with securities held by the pledging
institutions in the System’s name. Deposits held in money market funds are not PDPA eligible deposits.
As of June 30, 2020 and 2019, the System’s book value of cash not on deposit with the State Treasurer was
$43.7 million and $40.4 million, respectively. Cash not on deposit included petty cash/change funds and
bank account balances of $108 thousand and $43.6 million as of June 30, 2020 and $110 thousand and $40.3
million as of June 30, 2019, respectively. Bank account balances per the bank as of June 30, 2020 and 2019
were $51.0 million and $44.4 million, respectively. Of the June 30, 2020 deposits, $775 thousand were
covered by depository insurance and were not exposed to custodial credit risk, and the remaining $50.3
million were collateralized with securities held by the pledging institution’s trust department or agent in the
System’s name. Of the June 30, 2019 deposits, $779 thousand were covered by depository insurance and
were not exposed to custodial credit risk, and the remaining $43.6 million were collateralized with securities
held by the pledging institution’s trust department or agent in the System’s name.
Credit quality risk is the risk that the issuer or other counterparty to a debt security will not fulfill its
obligations. This risk is assessed by national rating agencies which assign a credit quality rating for many
investments. Credit quality ratings for obligations of the U.S. government or obligations explicitly
guaranteed by the U.S. government are not reported; however, credit quality ratings are reported for
obligations of U.S. government agencies that are not explicitly guaranteed by the U.S. government.
In June 2008, House Bill 08-1002 authorized the System to establish its own Treasury function, withdrawing
funds from the State Treasurer’s Pool to invest its operating portfolio internally. In February 2015, the
Board approved the formation of the Colorado State University System Treasury. The Board authorized
35
COLORADO STATE UNIVERSITY SYSTEM
Notes to Basic Financial Statements
Years Ended June 30, 2020 and 2019
(Amounts expressed in thousands)
the System to execute investment transactions within the parameters set out in the System’s Operating
Portfolio Investment Policy Statement in May 2018.
As of June 30, 2020, the System has withdrawn $380.0 million from the Pool. As of June 30, 2019, the
System had withdrawn $280.0 million from the Pool.
Additional information on investments of the State Treasurer’s Pool may be obtained in the State’s
Comprehensive Annual Financial Report for the fiscal year ended June 30, 2020.
Other Postemployment Benefits Trust – There was no cash and deposits for the Trust as of June 30, 2020.
Cash and deposits for the Trust as of June 30, 2019 was $517 thousand.
(5) Investments
As of June 30, 2020, and 2019, the System’s investments had a fair value of $448.6 million and $344.4
million, respectively. Of the $448.6 million and $344.4 million, $41.3 million and $51.5 million were
restricted and $407.3 million and $292.9 million were unrestricted, respectively. Restricted investments
consist of treasury bills, a guaranteed investment contract, and investments held with the CSU Foundation.
Unrestricted investments consist of investments held by the CSU System. Investment earnings consist of
land fund interest and unrealized gains/losses, income/loss from investments held by the CSU Foundation,
and dividends and gains/losses on investments held by the CSU System, net of expenses. For the fiscal
years ended June 30, 2020 and 2019 there was a net investment gain of $14.9 million and $13.4 million,
respectively.
With the implementation of GASB Statement No. 72, Fair Value Measurement and Application, the System
reports investments using the fair value hierarchy. Fair value is the price that would be received to sell an
asset in an orderly transaction between market participants at the measurement date. Valuation techniques
are used to determine fair value by maximizing the use of relevant observable inputs and minimize the use
of unobservable inputs. A three-tier hierarchy categorizes the inputs as follows:
Level 1 – quoted prices for identical assets in an active market.
Level 2 – quoted prices for similar assets in active markets, or identical or similar assets in markets that
are not active, or inputs other than quoted prices that are observable for the asset such as interest rates.
Level 3 – unobservable inputs. In these situations, the organization develops inputs using the best
information available in the circumstances. The System’s interest in investments held at the CSU
Foundation fair value is determined by the Foundation as a proportionate share of total investments at
fiscal year end.
The following details the hierarchy of each major category of the System’s investments at fair value as of
June 30, 2020 and 2019:
36
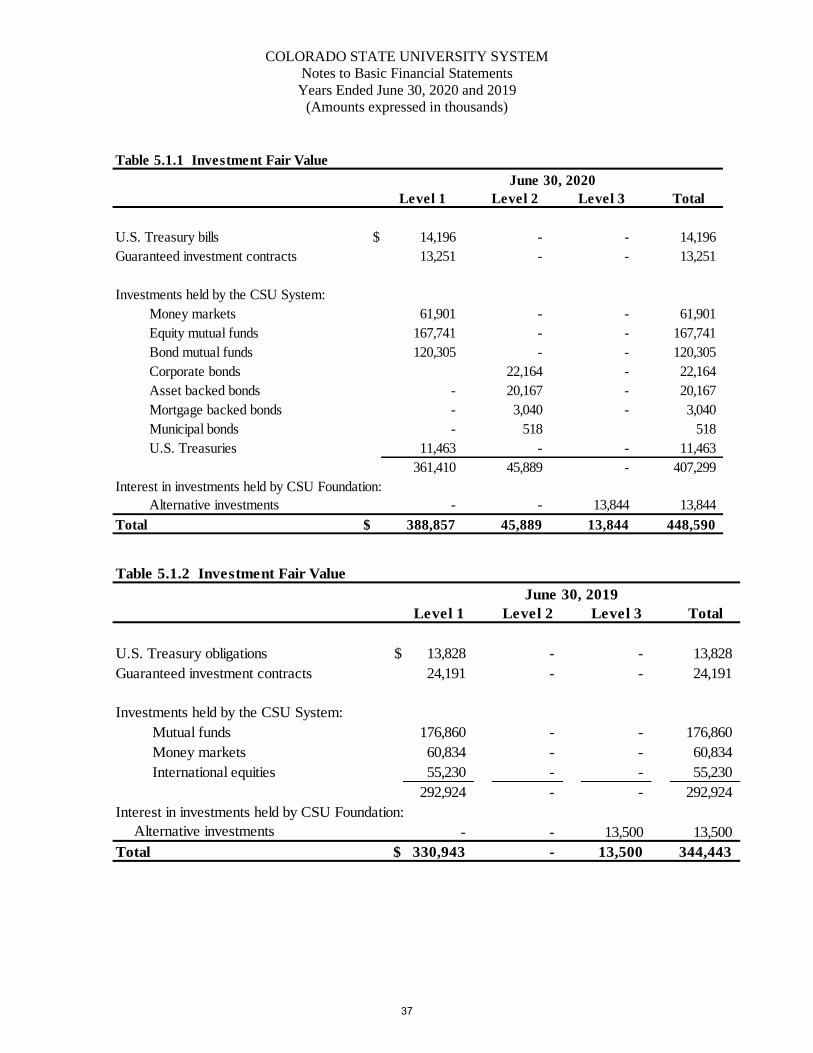
COLORADO STATE UNIVERSITY SYSTEM
Notes to Basic Financial Statements
Years Ended June 30, 2020 and 2019
(Amounts expressed in thousands)
Table 5.1.1 Investment Fair Value
Level 1 Level 2 Level 3 Total
U.S. Treasury bills $ 14,196 - - 14,196
Guaranteed investment contracts 13,251 - - 13,251
Investments held by the CSU System:
Money markets 61,901 - - 61,901
Equity mutual funds 167,741 - - 167,741
Bond mutual funds 120,305 - - 120,305
Corporate bonds 22,164 - 22,164
Asset backed bonds - 20,167 - 20,167
Mortgage backed bonds - 3,040 - 3,040
Municipal bonds - 518 518
U.S. Treasuries 11,463 - - 11,463
361,410 45,889 - 407,299
Interest in investments held by CSU Foundation:
Alternative investments - - 13,844 13,844
Total $ 388,857 45,889 13,844 448,590
June 30, 2020
Table 5.1.2 Investment Fair Value
Level 1 Level 2 Level 3 Total
U.S. Treasury obligations $ 13,828 - - 13,828
Guaranteed investment contracts 24,191 - - 24,191
Investments held by the CSU System:
Mutual funds 176,860 - - 176,860
Money markets 60,834 - - 60,834
International equities 55,230 - - 55,230
292,924 - - 292,924
Interest in investments held by CSU Foundation:
Alternative investments - - 13,500 13,500
Total $ 330,943 - 13,500 344,443
June 30, 2019
37
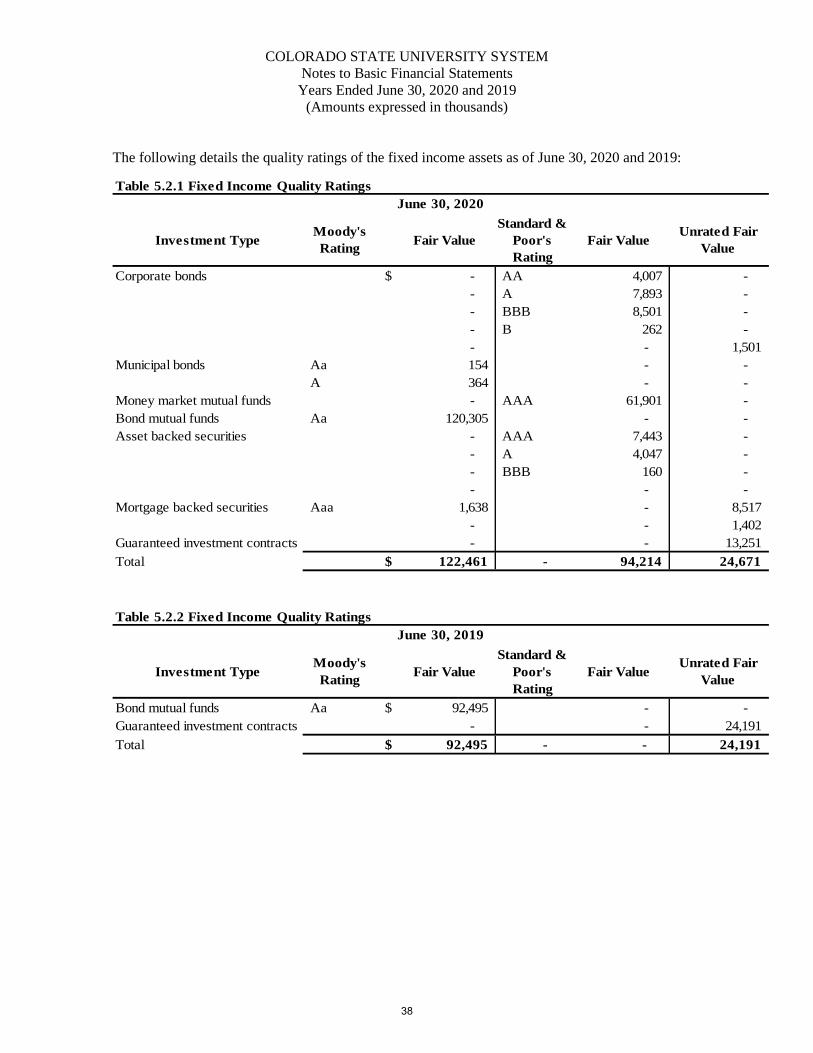
COLORADO STATE UNIVERSITY SYSTEM
Notes to Basic Financial Statements
Years Ended June 30, 2020 and 2019
(Amounts expressed in thousands)
The following details the quality ratings of the fixed income assets as of June 30, 2020 and 2019:
Table 5.2.1 Fixed Income Quality Ratings
Investment TypeMoody's
RatingFair Value
Standard &
Poor's
Rating
Fair ValueUnrated Fair
Value
Corporate bonds $ - AA 4,007 -
- A 7,893 -
- BBB 8,501 -
- B 262 -
- - 1,501
Municipal bonds Aa 154 - -
A 364 - -
Money market mutual funds - AAA 61,901 -
Bond mutual funds Aa 120,305 - -
Asset backed securities - AAA 7,443 -
- A 4,047 -
- BBB 160 -
- - -
Mortgage backed securities Aaa 1,638 - 8,517
- - 1,402
Guaranteed investment contracts - - 13,251
Total $ 122,461 - 94,214 24,671
June 30, 2020
FN20RamsFra
Table 5.2.2 Fixed Income Quality Ratings
Investment TypeMoody's
RatingFair Value
Standard &
Poor's
Rating
Fair ValueUnrated Fair
Value
Bond mutual funds Aa $ 92,495 - -
Guaranteed investment contracts - - 24,191
Total $ 92,495 - - 24,191
June 30, 2019
38
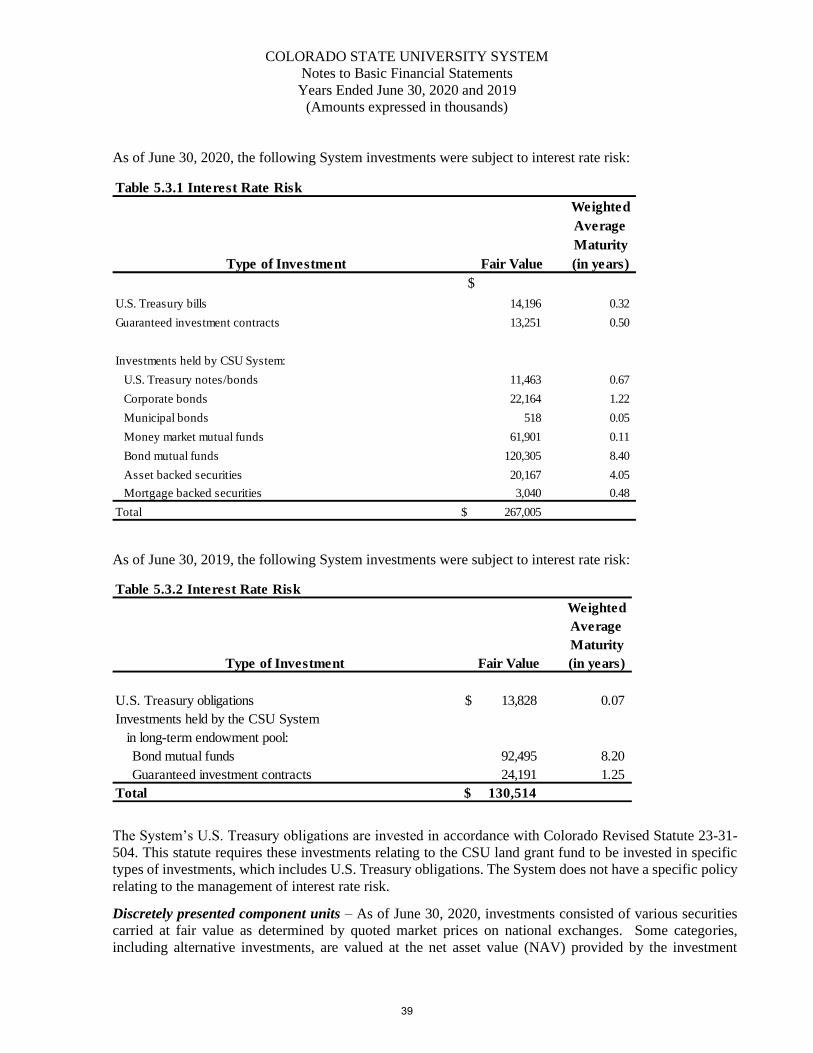
COLORADO STATE UNIVERSITY SYSTEM
Notes to Basic Financial Statements
Years Ended June 30, 2020 and 2019
(Amounts expressed in thousands)
As of June 30, 2020, the following System investments were subject to interest rate risk:
Table 5.3.1 Interest Rate Risk
Weighted
Average
Maturity
Fair Value (in years)
$
U.S. Treasury bills 14,196 0.32
Guaranteed investment contracts 13,251 0.50
Investments held by CSU System:
U.S. Treasury notes/bonds 11,463 0.67
Corporate bonds 22,164 1.22
Municipal bonds 518 0.05
Money market mutual funds 61,901 0.11
Bond mutual funds 120,305 8.40
Asset backed securities 20,167 4.05
Mortgage backed securities 3,040 0.48
Total $ 267,005
Type of Investment
As of June 30, 2019, the following System investments were subject to interest rate risk:
Table 5.3.2 Interest Rate Risk
Weighted
Average
Maturity
Fair Value (in years)
U.S. Treasury obligations $ 13,828 0.07
Investments held by the CSU System
in long-term endowment pool:
Bond mutual funds 92,495 8.20
Guaranteed investment contracts 24,191 1.25
Total $ 130,514
Type of Investment
The System’s U.S. Treasury obligations are invested in accordance with Colorado Revised Statute 23-31-
504. This statute requires these investments relating to the CSU land grant fund to be invested in specific
types of investments, which includes U.S. Treasury obligations. The System does not have a specific policy
relating to the management of interest rate risk.
Discretely presented component units – As of June 30, 2020, investments consisted of various securities
carried at fair value as determined by quoted market prices on national exchanges. Some categories,
including alternative investments, are valued at the net asset value (NAV) provided by the investment
39
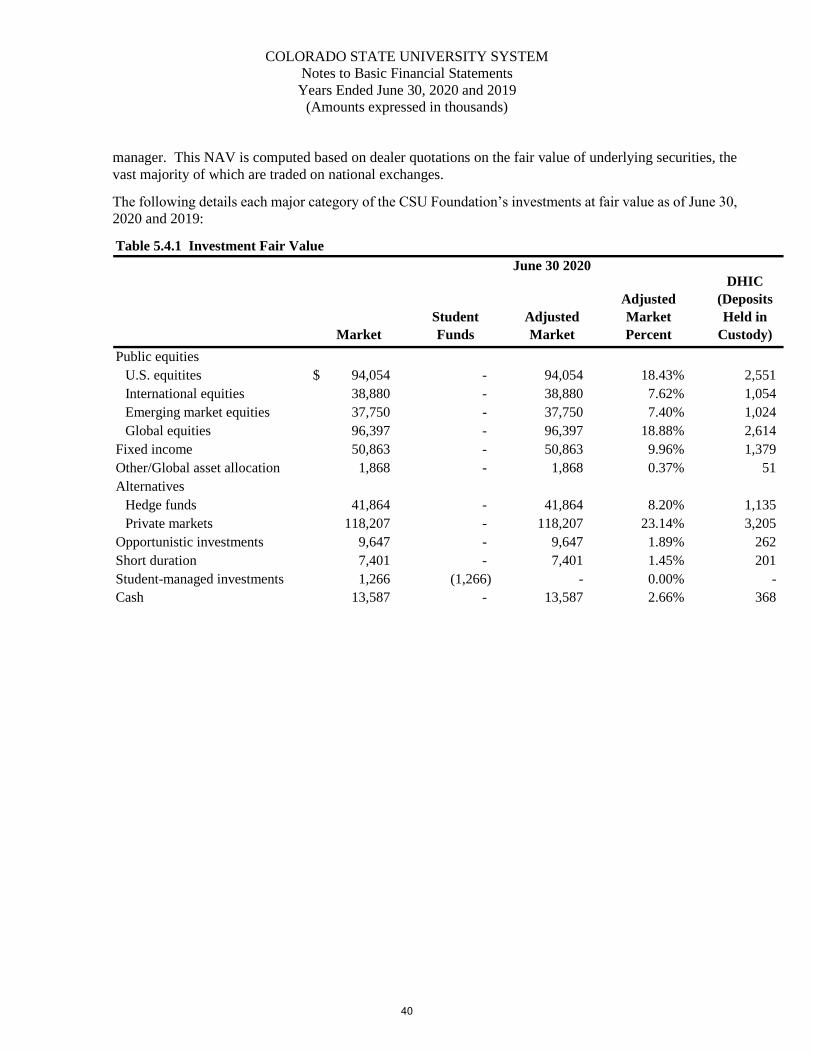
COLORADO STATE UNIVERSITY SYSTEM
Notes to Basic Financial Statements
Years Ended June 30, 2020 and 2019
(Amounts expressed in thousands)
manager. This NAV is computed based on dealer quotations on the fair value of underlying securities, the
vast majority of which are traded on national exchanges.
The following details each major category of the CSU Foundation’s investments at fair value as of June 30,
2020 and 2019:
Table 5.4.1 Investment Fair Value
Market
Student
Funds
Adjusted
Market
Adjusted
Market
Percent
DHIC
(Deposits
Held in
Custody)
Public equities
U.S. equitites $ 94,054 - 94,054 18.43% 2,551
International equities 38,880 - 38,880 7.62% 1,054
Emerging market equities 37,750 - 37,750 7.40% 1,024
Global equities 96,397 - 96,397 18.88% 2,614
Fixed income 50,863 - 50,863 9.96% 1,379
Other/Global asset allocation 1,868 - 1,868 0.37% 51
Alternatives
Hedge funds 41,864 - 41,864 8.20% 1,135
Private markets 118,207 - 118,207 23.14% 3,205
Opportunistic investments 9,647 - 9,647 1.89% 262
Short duration 7,401 - 7,401 1.45% 201
Student-managed investments 1,266 (1,266) - 0.00% -
Cash 13,587 - 13,587 2.66% 368
June 30 2020
40
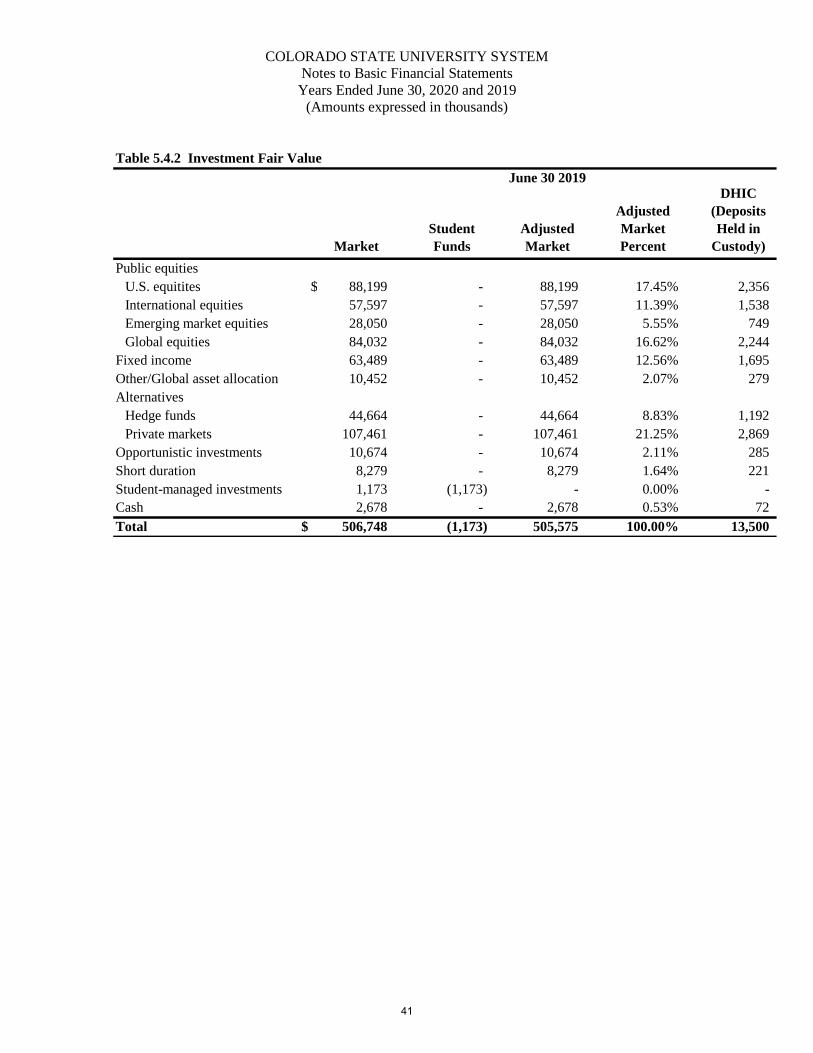
COLORADO STATE UNIVERSITY SYSTEM
Notes to Basic Financial Statements
Years Ended June 30, 2020 and 2019
(Amounts expressed in thousands)
Table 5.4.2 Investment Fair Value
Market
Student
Funds
Adjusted
Market
Adjusted
Market
Percent
DHIC
(Deposits
Held in
Custody)
Public equities
U.S. equitites $ 88,199 - 88,199 17.45% 2,356
International equities 57,597 - 57,597 11.39% 1,538
Emerging market equities 28,050 - 28,050 5.55% 749
Global equities 84,032 - 84,032 16.62% 2,244
Fixed income 63,489 - 63,489 12.56% 1,695
Other/Global asset allocation 10,452 - 10,452 2.07% 279
Alternatives
Hedge funds 44,664 - 44,664 8.83% 1,192
Private markets 107,461 - 107,461 21.25% 2,869
Opportunistic investments 10,674 - 10,674 2.11% 285
Short duration 8,279 - 8,279 1.64% 221
Student-managed investments 1,173 (1,173) - 0.00% -
Cash 2,678 - 2,678 0.53% 72
Total $ 506,748 (1,173) 505,575 100.00% 13,500
June 30 2019
41
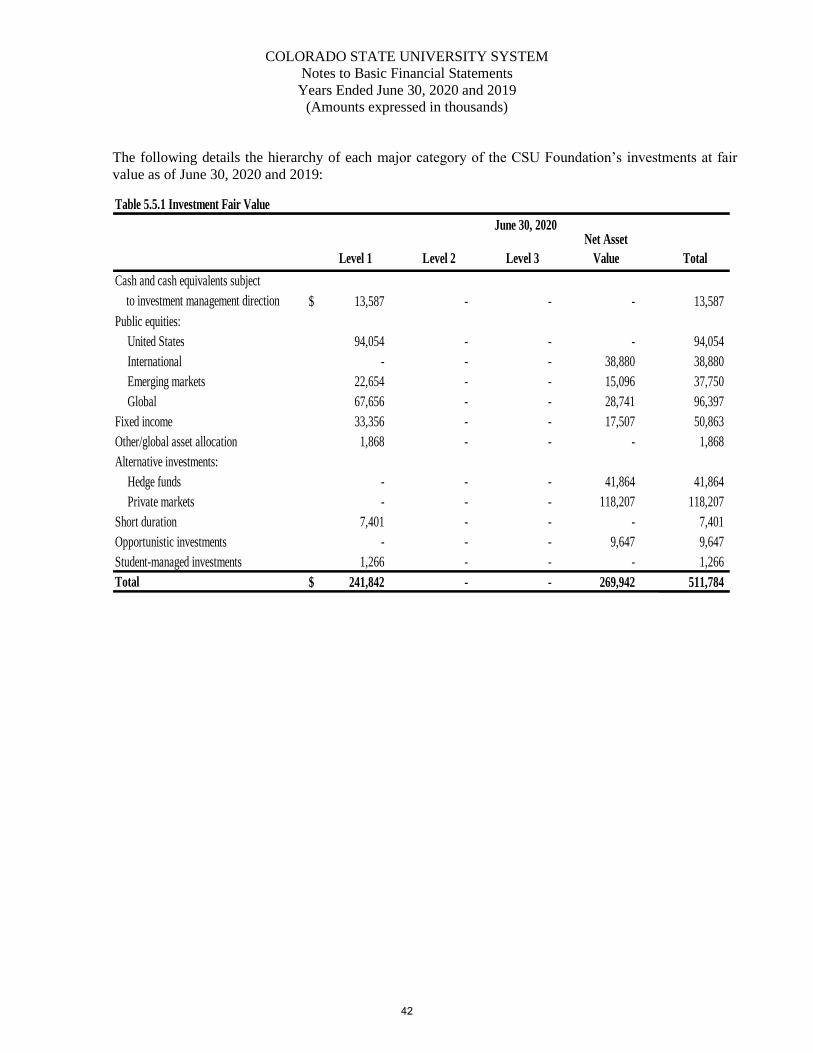
COLORADO STATE UNIVERSITY SYSTEM
Notes to Basic Financial Statements
Years Ended June 30, 2020 and 2019
(Amounts expressed in thousands)
The following details the hierarchy of each major category of the CSU Foundation’s investments at fair
value as of June 30, 2020 and 2019:
Table 5.5.1 Investment Fair Value
Level 1 Level 2 Level 3
Net Asset
Value Total
$ 13,587 - - - 13,587
Public equities:
United States 94,054 - - - 94,054
International - - - 38,880 38,880
Emerging markets 22,654 - - 15,096 37,750
Global 67,656 - - 28,741 96,397
Fixed income 33,356 - - 17,507 50,863
Other/global asset allocation 1,868 - - - 1,868
Alternative investments:
Hedge funds - - - 41,864 41,864
Private markets - - - 118,207 118,207
Short duration 7,401 - - - 7,401
Opportunistic investments - - - 9,647 9,647
Student-managed investments 1,266 - - - 1,266
Total $ 241,842 - - 269,942 511,784
to investment management direction
Cash and cash equivalents subject
June 30, 2020
42
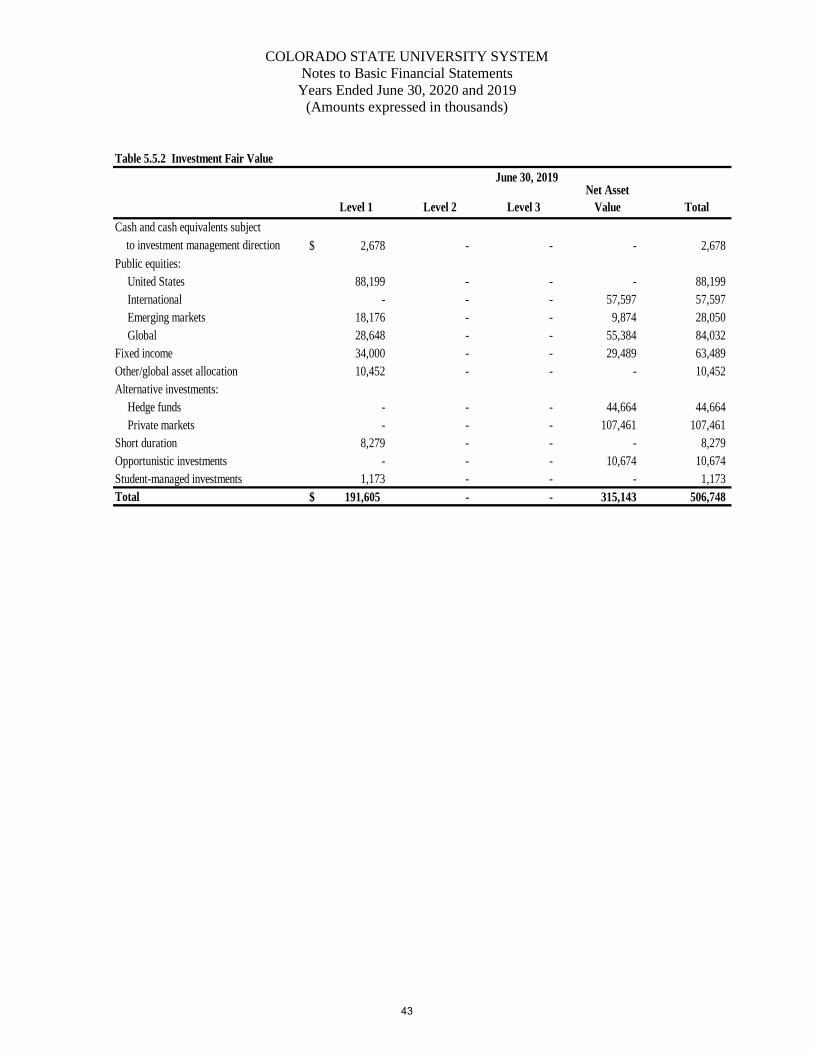
COLORADO STATE UNIVERSITY SYSTEM
Notes to Basic Financial Statements
Years Ended June 30, 2020 and 2019
(Amounts expressed in thousands)
Table 5.5.2 Investment Fair Value
Level 1 Level 2 Level 3
Net Asset
Value Total
$ 2,678 - - - 2,678
Public equities:
United States 88,199 - - - 88,199
International - - - 57,597 57,597
Emerging markets 18,176 - - 9,874 28,050
Global 28,648 - - 55,384 84,032
Fixed income 34,000 - - 29,489 63,489
Other/global asset allocation 10,452 - - - 10,452
Alternative investments:
Hedge funds - - - 44,664 44,664
Private markets - - - 107,461 107,461
Short duration 8,279 - - - 8,279
Opportunistic investments - - - 10,674 10,674
Student-managed investments 1,173 - - - 1,173
Total $ 191,605 - - 315,143 506,748
Cash and cash equivalents subject
June 30, 2019
to investment management direction
43
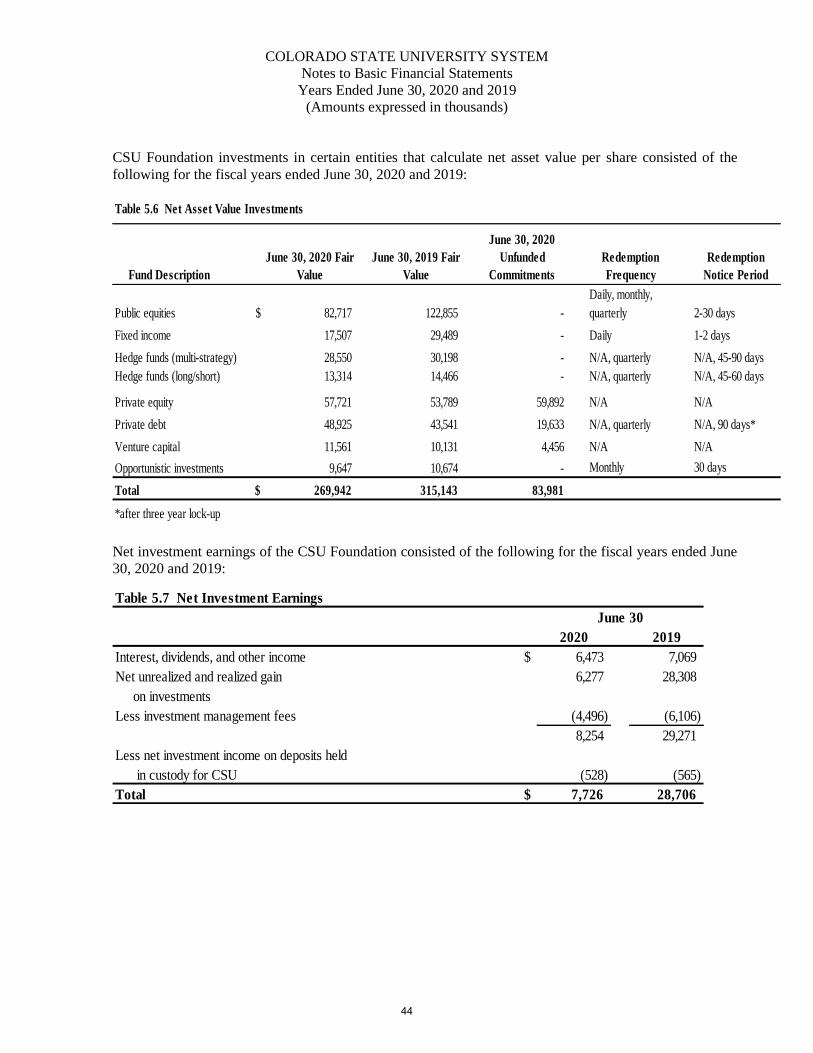
COLORADO STATE UNIVERSITY SYSTEM
Notes to Basic Financial Statements
Years Ended June 30, 2020 and 2019
(Amounts expressed in thousands)
CSU Foundation investments in certain entities that calculate net asset value per share consisted of the
following for the fiscal years ended June 30, 2020 and 2019:
Fund Description
June 30, 2020 Fair
Value
June 30, 2019 Fair
Value
June 30, 2020
Unfunded
Commitments
Redemption
Frequency
Redemption
Notice Period
Public equities $ 82,717 122,855 -
Daily, monthly,
quarterly 2-30 days
Fixed income 17,507 29,489 - Daily 1-2 days
Hedge funds (multi-strategy) 28,550 30,198 - N/A, quarterly N/A, 45-90 days
Hedge funds (long/short) 13,314 14,466 - N/A, quarterly N/A, 45-60 days
Private equity 57,721 53,789 59,892 N/A N/A
Private debt 48,925 43,541 19,633 N/A, quarterly N/A, 90 days*
Venture capital 11,561 10,131 4,456 N/A N/A
Opportunistic investments 9,647 10,674 - Monthly 30 days
Total $ 269,942 315,143 83,981
*after three year lock-up
Table 5.6 Net Asset Value Investments
Net investment earnings of the CSU Foundation consisted of the following for the fiscal years ended June
30, 2020 and 2019:
Table 5.7 Net Investment Earnings
2020 2019
Interest, dividends, and other income $ 6,473 7,069
Net unrealized and realized gain 6,277 28,308
on investments
Less investment management fees (4,496) (6,106)
8,254 29,271
Less net investment income on deposits held
in custody for CSU (528) (565)
Total $ 7,726 28,706
June 30
44
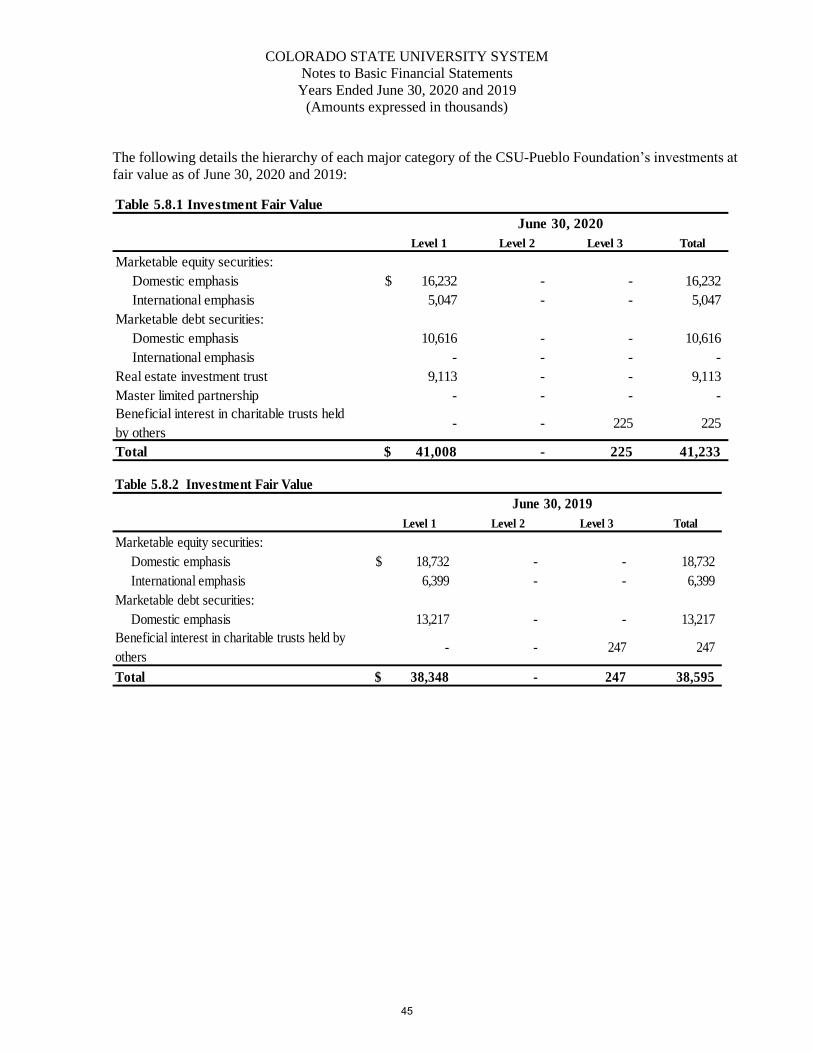
COLORADO STATE UNIVERSITY SYSTEM
Notes to Basic Financial Statements
Years Ended June 30, 2020 and 2019
(Amounts expressed in thousands)
The following details the hierarchy of each major category of the CSU-Pueblo Foundation’s investments at
fair value as of June 30, 2020 and 2019:
Table 5.8.1 Investment Fair Value
Level 1 Level 2 Level 3 Total
Marketable equity securities:
Domestic emphasis $ 16,232 - - 16,232
International emphasis 5,047 - - 5,047
Marketable debt securities:
Domestic emphasis 10,616 - - 10,616
International emphasis - - - -
Real estate investment trust 9,113 - - 9,113
Master limited partnership - - - -
- - 225 225
Total $ 41,008 - 225 41,233
June 30, 2020
Beneficial interest in charitable trusts held
by others
Table 5.8.2 Investment Fair Value
Level 1 Level 2 Level 3 Total
Marketable equity securities:
Domestic emphasis $ 18,732 - - 18,732
International emphasis 6,399 - - 6,399
Marketable debt securities:
Domestic emphasis 13,217 - - 13,217
- - 247 247
Total $ 38,348 - 247 38,595
June 30, 2019
Beneficial interest in charitable trusts held by
others
45
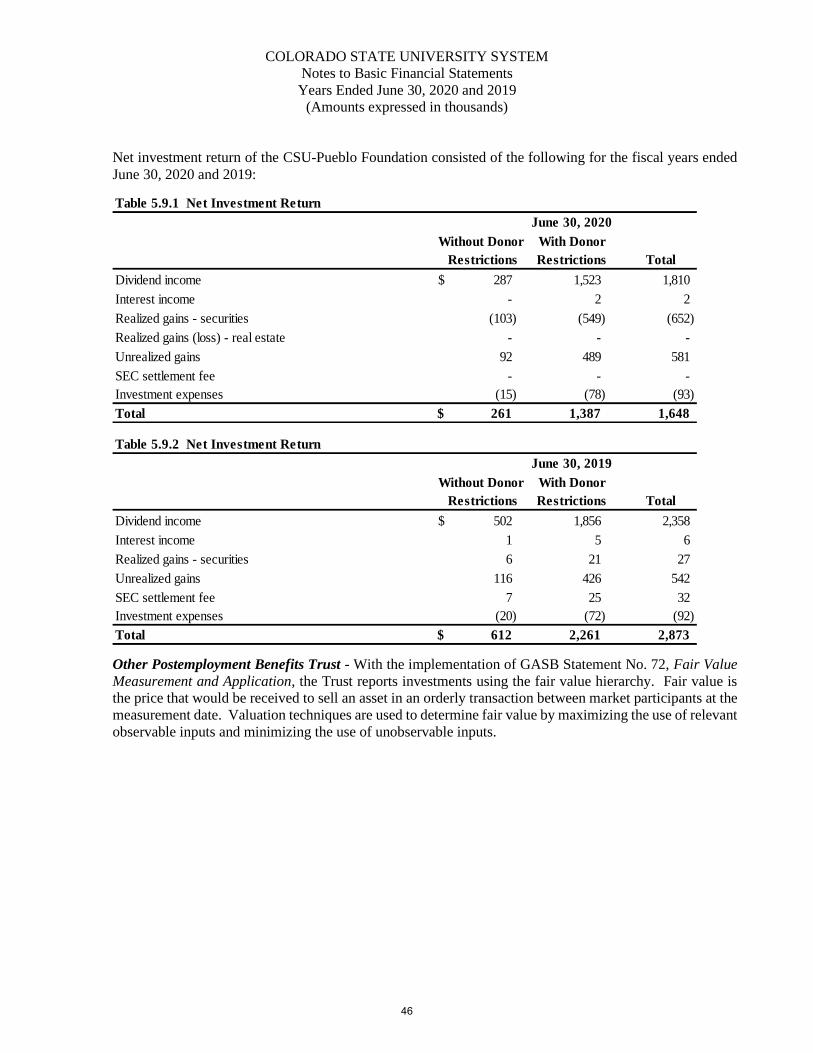
COLORADO STATE UNIVERSITY SYSTEM
Notes to Basic Financial Statements
Years Ended June 30, 2020 and 2019
(Amounts expressed in thousands)
Net investment return of the CSU-Pueblo Foundation consisted of the following for the fiscal years ended
June 30, 2020 and 2019:
Table 5.9.1 Net Investment Return
Without Donor With Donor
Restrictions Restrictions Total
Dividend income $ 287 1,523 1,810
Interest income - 2 2
Realized gains - securities (103) (549) (652)
Realized gains (loss) - real estate - - -
Unrealized gains 92 489 581
SEC settlement fee - - -
Investment expenses (15) (78) (93)
Total $ 261 1,387 1,648
June 30, 2020
Table 5.9.2 Net Investment Return
Without Donor With Donor
Restrictions Restrictions Total
Dividend income $ 502 1,856 2,358
Interest income 1 5 6
Realized gains - securities 6 21 27
Unrealized gains 116 426 542
SEC settlement fee 7 25 32
Investment expenses (20) (72) (92)
Total $ 612 2,261 2,873
June 30, 2019
Other Postemployment Benefits Trust - With the implementation of GASB Statement No. 72, Fair Value
Measurement and Application, the Trust reports investments using the fair value hierarchy. Fair value is
the price that would be received to sell an asset in an orderly transaction between market participants at the
measurement date. Valuation techniques are used to determine fair value by maximizing the use of relevant
observable inputs and minimizing the use of unobservable inputs.
46
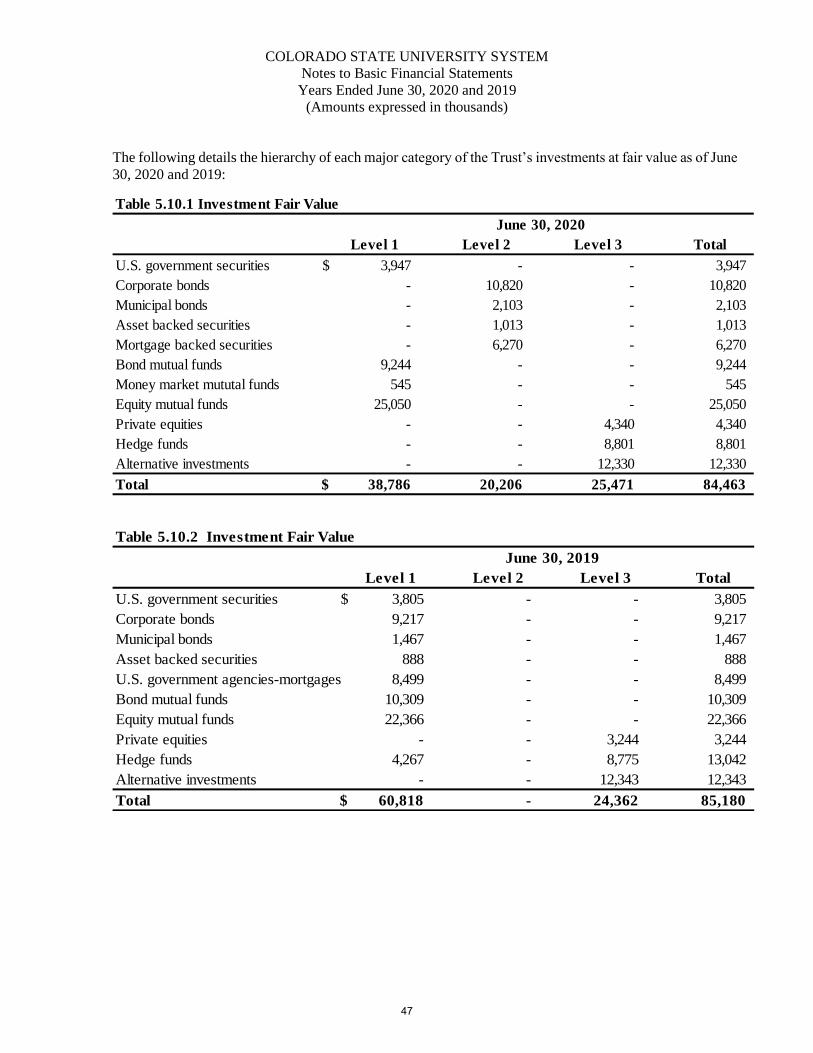
COLORADO STATE UNIVERSITY SYSTEM
Notes to Basic Financial Statements
Years Ended June 30, 2020 and 2019
(Amounts expressed in thousands)
The following details the hierarchy of each major category of the Trust’s investments at fair value as of June
30, 2020 and 2019:
Level 1 Level 2 Level 3 Total
U.S. government securities $ 3,947 - - 3,947
Corporate bonds - 10,820 - 10,820
Municipal bonds - 2,103 - 2,103
Asset backed securities - 1,013 - 1,013
Mortgage backed securities - 6,270 - 6,270
Bond mutual funds 9,244 - - 9,244
Money market mututal funds 545 - - 545
Equity mutual funds 25,050 - - 25,050
Private equities - - 4,340 4,340
Hedge funds - - 8,801 8,801
Alternative investments - - 12,330 12,330
Total $ 38,786 20,206 25,471 84,463
June 30, 2020
Table 5.10.1 Investment Fair Value
Table 5.10.2 Investment Fair Value
Level 1 Level 2 Level 3 Total
U.S. government securities $ 3,805 - - 3,805
Corporate bonds 9,217 - - 9,217
Municipal bonds 1,467 - - 1,467
Asset backed securities 888 - - 888
U.S. government agencies-mortgages 8,499 - - 8,499
Bond mutual funds 10,309 - - 10,309
Equity mutual funds 22,366 - - 22,366
Private equities - - 3,244 3,244
Hedge funds 4,267 - 8,775 13,042
Alternative investments - - 12,343 12,343
Total $ 60,818 - 24,362 85,180
June 30, 2019
47
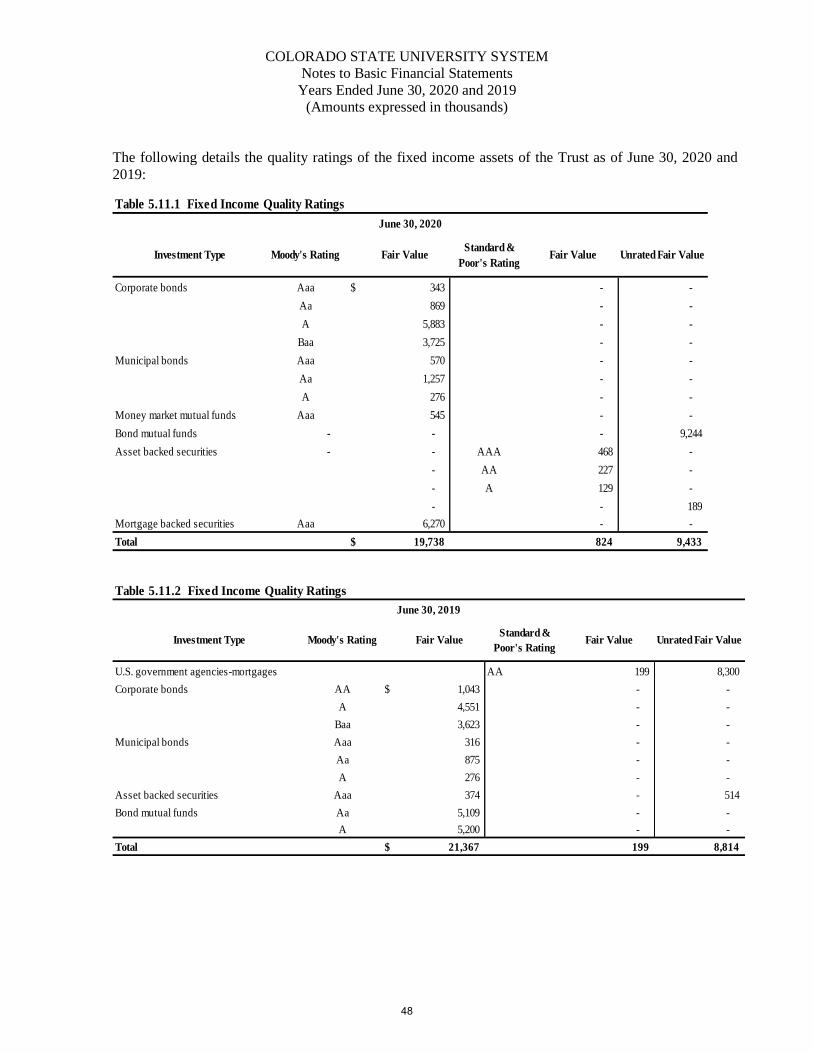
COLORADO STATE UNIVERSITY SYSTEM
Notes to Basic Financial Statements
Years Ended June 30, 2020 and 2019
(Amounts expressed in thousands)
The following details the quality ratings of the fixed income assets of the Trust as of June 30, 2020 and
2019:
Table 5.11.1 Fixed Income Quality Ratings
Investment Type Moody's Rating Fair ValueStandard &
Poor's RatingFair Value Unrated Fair Value
Corporate bonds Aaa $ 343 - -
Aa 869 - -
A 5,883 - -
Baa 3,725 - -
Municipal bonds Aaa 570 - -
Aa 1,257 - -
A 276 - -
Money market mutual funds Aaa 545 - -
Bond mutual funds - - - 9,244
Asset backed securities - - AAA 468 -
- AA 227 -
- A 129 -
- - 189
Mortgage backed securities Aaa 6,270 - -
Total $ 19,738 824 9,433
June 30, 2020
Table 5.11.2 Fixed Income Quality Ratings
Investment Type Moody's Rating Fair ValueStandard &
Poor's RatingFair Value Unrated Fair Value
U.S. government agencies-mortgages AA 199 8,300
Corporate bonds AA $ 1,043 - -
A 4,551 - -
Baa 3,623 - -
Municipal bonds Aaa 316 - -
Aa 875 - -
A 276 - -
Asset backed securities Aaa 374 - 514
Bond mutual funds Aa 5,109 - -
A 5,200 - -
Total $ 21,367 199 8,814
June 30, 2019
48
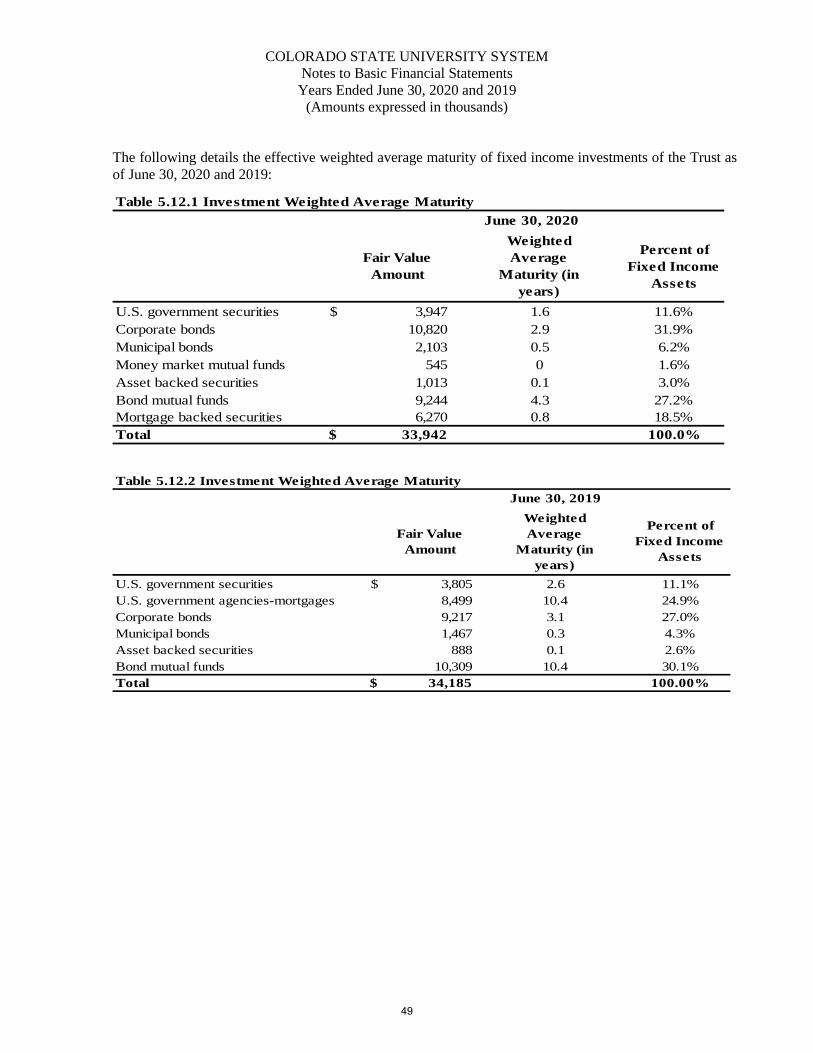
COLORADO STATE UNIVERSITY SYSTEM
Notes to Basic Financial Statements
Years Ended June 30, 2020 and 2019
(Amounts expressed in thousands)
The following details the effective weighted average maturity of fixed income investments of the Trust as
of June 30, 2020 and 2019:
Table 5.12.1 Investment Weighted Average Maturity
Fair Value
Amount
Weighted
Average
Maturity (in
years)
Percent of
Fixed Income
Assets
U.S. government securities $ 3,947 1.6 11.6%
Corporate bonds 10,820 2.9 31.9%
Municipal bonds 2,103 0.5 6.2%
Money market mutual funds 545 0 1.6%
Asset backed securities 1,013 0.1 3.0%
Bond mutual funds 9,244 4.3 27.2%
Mortgage backed securities 6,270 0.8 18.5%
Total $ 33,942 100.0%
June 30, 2020
Table 5.12.2 Investment Weighted Average Maturity
Fair Value
Amount
Weighted
Average
Maturity (in
years)
Percent of
Fixed Income
Assets
U.S. government securities $ 3,805 2.6 11.1%
U.S. government agencies-mortgages 8,499 10.4 24.9%
Corporate bonds 9,217 3.1 27.0%
Municipal bonds 1,467 0.3 4.3%
Asset backed securities 888 0.1 2.6%
Bond mutual funds 10,309 10.4 30.1%
Total $ 34,185 100.00%
June 30, 2019
49
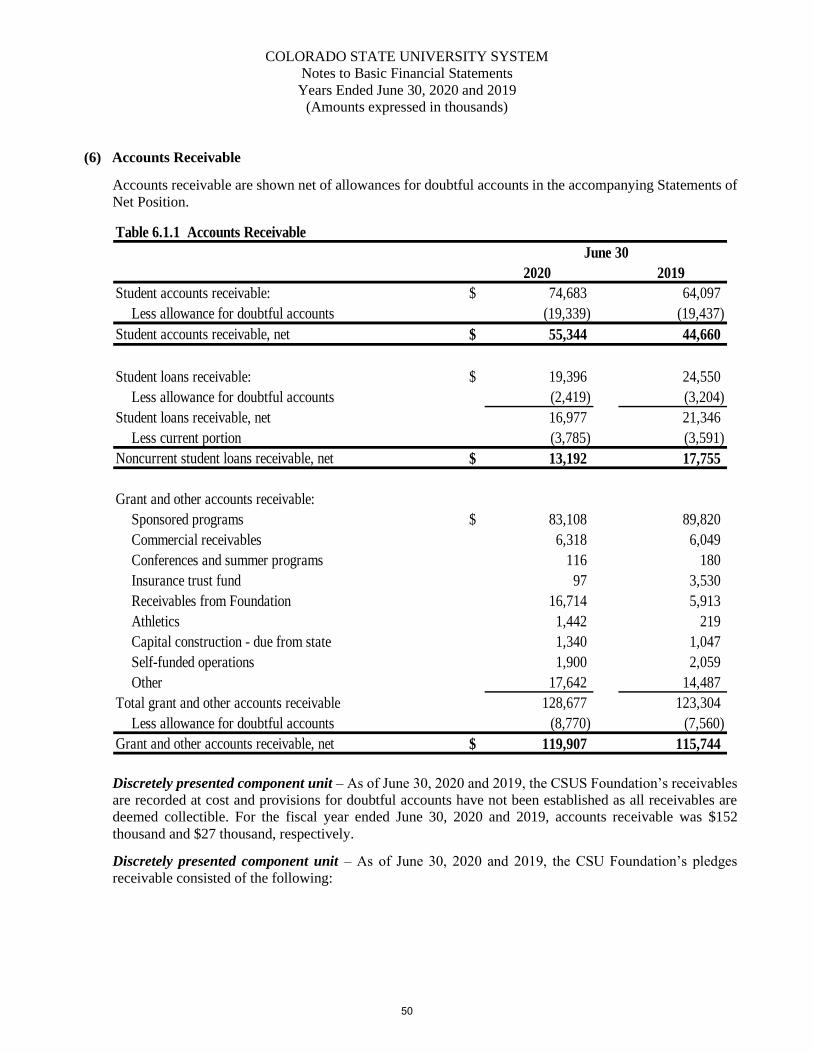
COLORADO STATE UNIVERSITY SYSTEM
Notes to Basic Financial Statements
Years Ended June 30, 2020 and 2019
(Amounts expressed in thousands)
(6) Accounts Receivable
Accounts receivable are shown net of allowances for doubtful accounts in the accompanying Statements of
Net Position.
Table 6.1.1 Accounts Receivable
June 30
2020 2019
Student accounts receivable: $ 74,683 64,097
Less allowance for doubtful accounts (19,339) (19,437)
Student accounts receivable, net $ 55,344 44,660
Student loans receivable: $ 19,396 24,550
Less allowance for doubtful accounts (2,419) (3,204)
Student loans receivable, net 16,977 21,346
Less current portion (3,785) (3,591)
Noncurrent student loans receivable, net $ 13,192 17,755
Grant and other accounts receivable:
Sponsored programs $ 83,108 89,820
Commercial receivables 6,318 6,049
Conferences and summer programs 116 180
Insurance trust fund 97 3,530
Receivables from Foundation 16,714 5,913
Athletics 1,442 219
Capital construction - due from state 1,340 1,047
Self-funded operations 1,900 2,059
Other 17,642 14,487
Total grant and other accounts receivable 128,677 123,304
Less allowance for doubtful accounts (8,770) (7,560)
Grant and other accounts receivable, net $ 119,907 115,744
Discretely presented component unit – As of June 30, 2020 and 2019, the CSUS Foundation’s receivables
are recorded at cost and provisions for doubtful accounts have not been established as all receivables are
deemed collectible. For the fiscal year ended June 30, 2020 and 2019, accounts receivable was $152
thousand and $27 thousand, respectively.
Discretely presented component unit – As of June 30, 2020 and 2019, the CSU Foundation’s pledges
receivable consisted of the following:
50
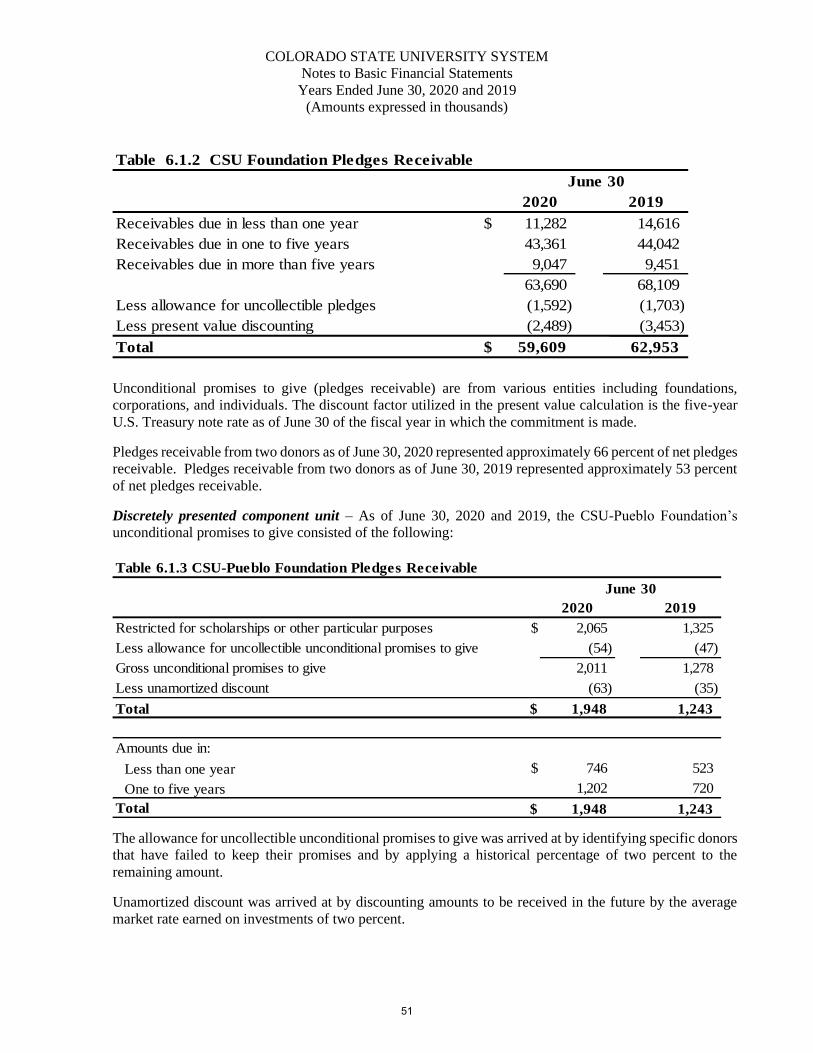
COLORADO STATE UNIVERSITY SYSTEM
Notes to Basic Financial Statements
Years Ended June 30, 2020 and 2019
(Amounts expressed in thousands)
Table 6.1.2 CSU Foundation Pledges Receivable
2020 2019
Receivables due in less than one year $ 11,282 14,616
Receivables due in one to five years 43,361 44,042
Receivables due in more than five years 9,047 9,451
63,690 68,109
Less allowance for uncollectible pledges (1,592) (1,703)
Less present value discounting (2,489) (3,453)
Total $ 59,609 62,953
June 30
Unconditional promises to give (pledges receivable) are from various entities including foundations,
corporations, and individuals. The discount factor utilized in the present value calculation is the five-year
U.S. Treasury note rate as of June 30 of the fiscal year in which the commitment is made.
Pledges receivable from two donors as of June 30, 2020 represented approximately 66 percent of net pledges
receivable. Pledges receivable from two donors as of June 30, 2019 represented approximately 53 percent
of net pledges receivable.
Discretely presented component unit – As of June 30, 2020 and 2019, the CSU-Pueblo Foundation’s
unconditional promises to give consisted of the following:
Table 6.1.3 CSU-Pueblo Foundation Pledges Receivable
June 30
2020 2019
Restricted for scholarships or other particular purposes $ 2,065 1,325
Less allowance for uncollectible unconditional promises to give (54) (47)
Gross unconditional promises to give 2,011 1,278
Less unamortized discount (63) (35)
Total $ 1,948 1,243
Amounts due in:
Less than one year $ 746 523
One to five years 1,202 720
Total $ 1,948 1,243
The allowance for uncollectible unconditional promises to give was arrived at by identifying specific donors
that have failed to keep their promises and by applying a historical percentage of two percent to the
remaining amount.
Unamortized discount was arrived at by discounting amounts to be received in the future by the average
market rate earned on investments of two percent.
51
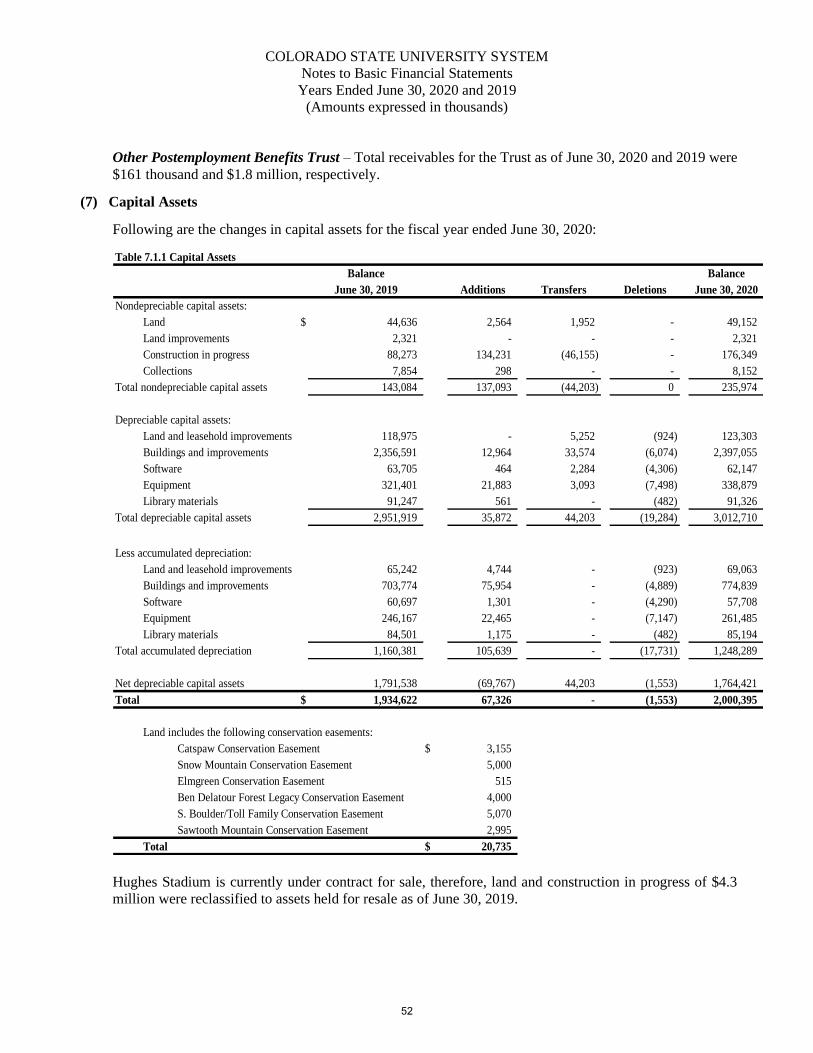
COLORADO STATE UNIVERSITY SYSTEM
Notes to Basic Financial Statements
Years Ended June 30, 2020 and 2019
(Amounts expressed in thousands)
Other Postemployment Benefits Trust – Total receivables for the Trust as of June 30, 2020 and 2019 were
$161 thousand and $1.8 million, respectively.
(7) Capital Assets
Following are the changes in capital assets for the fiscal year ended June 30, 2020:
Table 7.1.1 Capital Assets
Balance Balance
June 30, 2019 Additions Transfers Deletions June 30, 2020
Nondepreciable capital assets:
Land $ 44,636 2,564 1,952 - 49,152
Land improvements 2,321 - - - 2,321
Construction in progress 88,273 134,231 (46,155) - 176,349
Collections 7,854 298 - - 8,152
Total nondepreciable capital assets 143,084 137,093 (44,203) 0 235,974
Depreciable capital assets:
Land and leasehold improvements 118,975 - 5,252 (924) 123,303
Buildings and improvements 2,356,591 12,964 33,574 (6,074) 2,397,055
Software 63,705 464 2,284 (4,306) 62,147
Equipment 321,401 21,883 3,093 (7,498) 338,879
Library materials 91,247 561 - (482) 91,326
Total depreciable capital assets 2,951,919 35,872 44,203 (19,284) 3,012,710
Less accumulated depreciation:
Land and leasehold improvements 65,242 4,744 - (923) 69,063
Buildings and improvements 703,774 75,954 - (4,889) 774,839
Software 60,697 1,301 - (4,290) 57,708
Equipment 246,167 22,465 - (7,147) 261,485
Library materials 84,501 1,175 - (482) 85,194
Total accumulated depreciation 1,160,381 105,639 - (17,731) 1,248,289
Net depreciable capital assets 1,791,538 (69,767) 44,203 (1,553) 1,764,421
Total $ 1,934,622 67,326 - (1,553) 2,000,395
Land includes the following conservation easements:
Catspaw Conservation Easement $ 3,155
Snow Mountain Conservation Easement 5,000
Elmgreen Conservation Easement 515
Ben Delatour Forest Legacy Conservation Easement 4,000
S. Boulder/Toll Family Conservation Easement 5,070
Sawtooth Mountain Conservation Easement 2,995
Total $ 20,735
Hughes Stadium is currently under contract for sale, therefore, land and construction in progress of $4.3
million were reclassified to assets held for resale as of June 30, 2019.
52
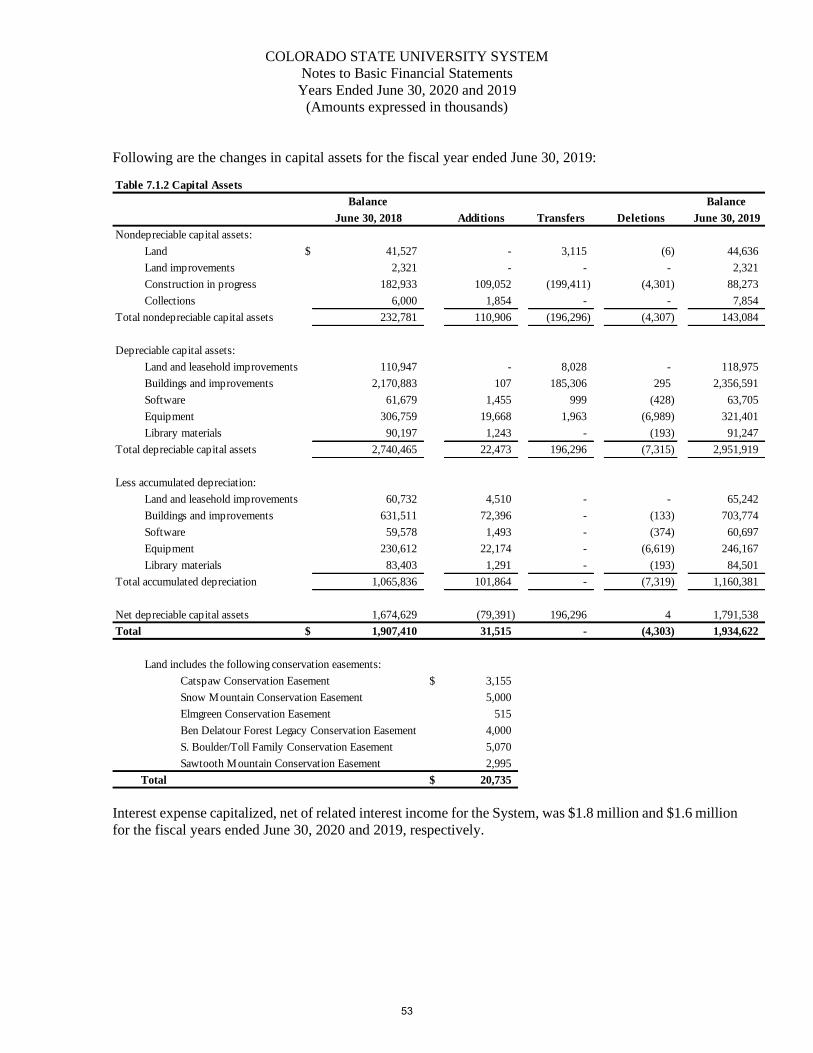
COLORADO STATE UNIVERSITY SYSTEM
Notes to Basic Financial Statements
Years Ended June 30, 2020 and 2019
(Amounts expressed in thousands)
Following are the changes in capital assets for the fiscal year ended June 30, 2019:
Table 7.1.2 Capital Assets
Balance Balance
June 30, 2018 Additions Transfers Deletions June 30, 2019
Nondepreciable capital assets:
Land $ 41,527 - 3,115 (6) 44,636
Land improvements 2,321 - - - 2,321
Construction in progress 182,933 109,052 (199,411) (4,301) 88,273
Collections 6,000 1,854 - - 7,854
Total nondepreciable capital assets 232,781 110,906 (196,296) (4,307) 143,084
Depreciable capital assets:
Land and leasehold improvements 110,947 - 8,028 - 118,975
Buildings and improvements 2,170,883 107 185,306 295 2,356,591
Software 61,679 1,455 999 (428) 63,705
Equipment 306,759 19,668 1,963 (6,989) 321,401
Library materials 90,197 1,243 - (193) 91,247
Total depreciable capital assets 2,740,465 22,473 196,296 (7,315) 2,951,919
Less accumulated depreciation:
Land and leasehold improvements 60,732 4,510 - - 65,242
Buildings and improvements 631,511 72,396 - (133) 703,774
Software 59,578 1,493 - (374) 60,697
Equipment 230,612 22,174 - (6,619) 246,167
Library materials 83,403 1,291 - (193) 84,501
Total accumulated depreciation 1,065,836 101,864 - (7,319) 1,160,381
Net depreciable capital assets 1,674,629 (79,391) 196,296 4 1,791,538
Total $ 1,907,410 31,515 - (4,303) 1,934,622
Land includes the following conservation easements:
Catspaw Conservation Easement $ 3,155
Snow Mountain Conservation Easement 5,000
Elmgreen Conservation Easement 515
Ben Delatour Forest Legacy Conservation Easement 4,000
S. Boulder/Toll Family Conservation Easement 5,070
Sawtooth Mountain Conservation Easement 2,995
Total $ 20,735
Interest expense capitalized, net of related interest income for the System, was $1.8 million and $1.6 million
for the fiscal years ended June 30, 2020 and 2019, respectively.
53
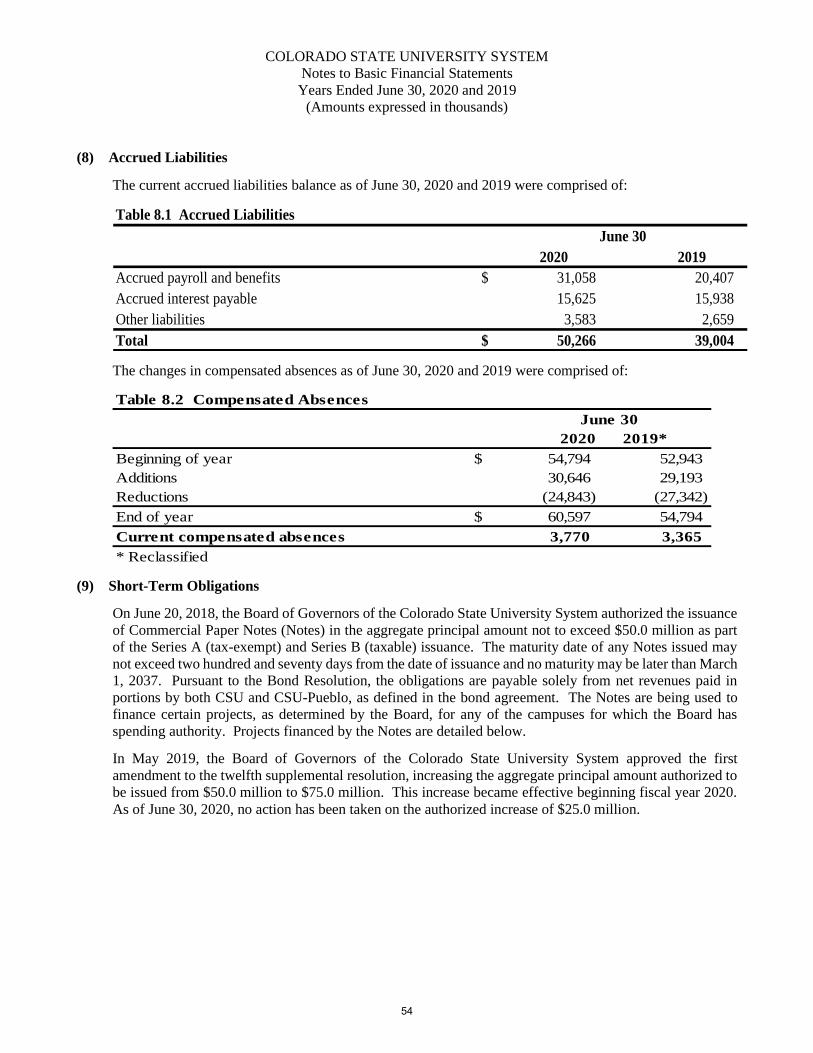
COLORADO STATE UNIVERSITY SYSTEM
Notes to Basic Financial Statements
Years Ended June 30, 2020 and 2019
(Amounts expressed in thousands)
(8) Accrued Liabilities
The current accrued liabilities balance as of June 30, 2020 and 2019 were comprised of:
June 30
2020 2019
Accrued payroll and benefits $ 31,058 20,407
Accrued interest payable 15,625 15,938
Other liabilities 3,583 2,659
Total $ 50,266 39,004
Table 8.1 Accrued Liabilities
The changes in compensated absences as of June 30, 2020 and 2019 were comprised of:
Table 8.2 Compensated Absences
2020 2019*
Beginning of year $ 54,794 52,943
Additions 30,646 29,193
Reductions (24,843) (27,342)
End of year $ 60,597 54,794
Current compensated absences 3,770 3,365
* Reclassified
June 30
(9) Short-Term Obligations
On June 20, 2018, the Board of Governors of the Colorado State University System authorized the issuance
of Commercial Paper Notes (Notes) in the aggregate principal amount not to exceed $50.0 million as part
of the Series A (tax-exempt) and Series B (taxable) issuance. The maturity date of any Notes issued may
not exceed two hundred and seventy days from the date of issuance and no maturity may be later than March
1, 2037. Pursuant to the Bond Resolution, the obligations are payable solely from net revenues paid in
portions by both CSU and CSU-Pueblo, as defined in the bond agreement. The Notes are being used to
finance certain projects, as determined by the Board, for any of the campuses for which the Board has
spending authority. Projects financed by the Notes are detailed below.
In May 2019, the Board of Governors of the Colorado State University System approved the first
amendment to the twelfth supplemental resolution, increasing the aggregate principal amount authorized to
be issued from $50.0 million to $75.0 million. This increase became effective beginning fiscal year 2020.
As of June 30, 2020, no action has been taken on the authorized increase of $25.0 million.
54
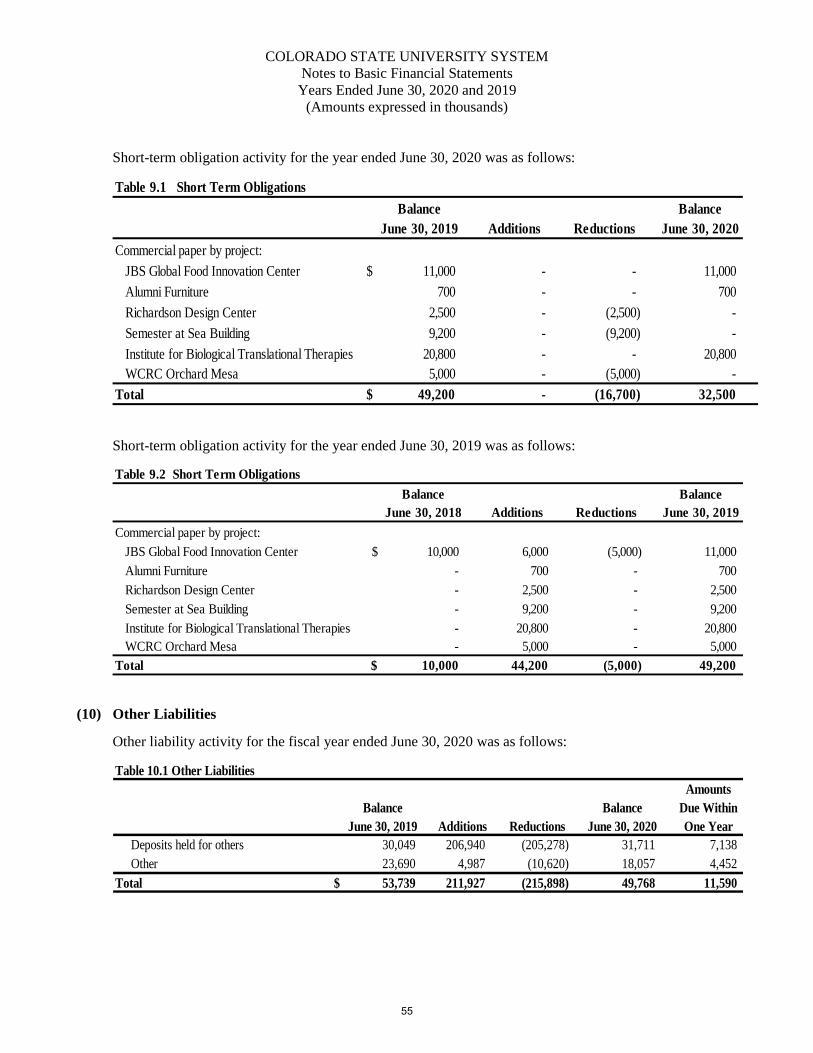
COLORADO STATE UNIVERSITY SYSTEM
Notes to Basic Financial Statements
Years Ended June 30, 2020 and 2019
(Amounts expressed in thousands)
Short-term obligation activity for the year ended June 30, 2020 was as follows:
Table 9.1 Short Term Obligations
Balance Balance
June 30, 2019 Additions Reductions June 30, 2020
Commercial paper by project:
JBS Global Food Innovation Center $ 11,000 - - 11,000
Alumni Furniture 700 - - 700
Richardson Design Center 2,500 - (2,500) -
Semester at Sea Building 9,200 - (9,200) -
Institute for Biological Translational Therapies 20,800 - - 20,800
WCRC Orchard Mesa 5,000 - (5,000) -
Total $ 49,200 - (16,700) 32,500
Short-term obligation activity for the year ended June 30, 2019 was as follows:
Table 9.2 Short Term Obligations
Balance Balance
June 30, 2018 Additions Reductions June 30, 2019
Commercial paper by project:
JBS Global Food Innovation Center $ 10,000 6,000 (5,000) 11,000
Alumni Furniture - 700 - 700
Richardson Design Center - 2,500 - 2,500
Semester at Sea Building - 9,200 - 9,200
Institute for Biological Translational Therapies - 20,800 - 20,800
WCRC Orchard Mesa - 5,000 - 5,000
Total $ 10,000 44,200 (5,000) 49,200
(10) Other Liabilities
Other liability activity for the fiscal year ended June 30, 2020 was as follows:
Table 10.1 Other Liabilities
Amounts
Balance Balance Due Within
June 30, 2019 Additions Reductions June 30, 2020 One Year
Deposits held for others 30,049 206,940 (205,278) 31,711 7,138
Other 23,690 4,987 (10,620) 18,057 4,452
Total $ 53,739 211,927 (215,898) 49,768 11,590
55
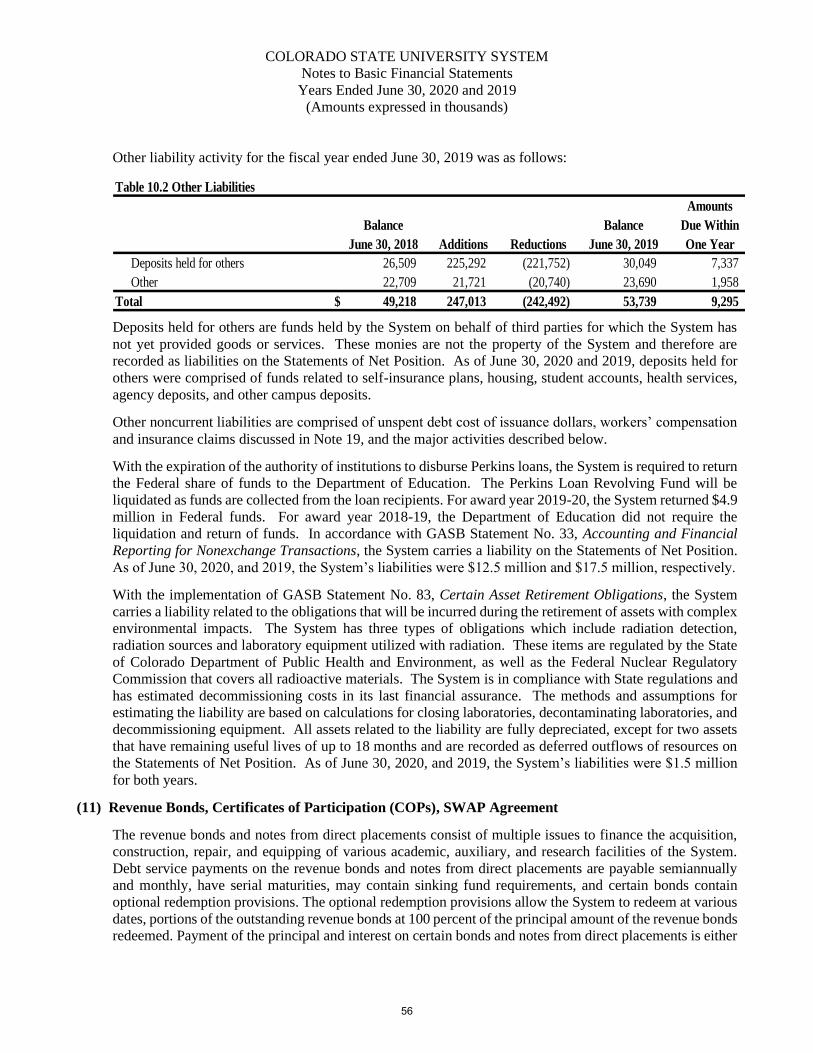
COLORADO STATE UNIVERSITY SYSTEM
Notes to Basic Financial Statements
Years Ended June 30, 2020 and 2019
(Amounts expressed in thousands)
Other liability activity for the fiscal year ended June 30, 2019 was as follows:
Table 10.2 Other Liabilities
Amounts
Balance Balance Due Within
June 30, 2018 Additions Reductions June 30, 2019 One Year
Deposits held for others 26,509 225,292 (221,752) 30,049 7,337
Other 22,709 21,721 (20,740) 23,690 1,958
Total $ 49,218 247,013 (242,492) 53,739 9,295
Deposits held for others are funds held by the System on behalf of third parties for which the System has
not yet provided goods or services. These monies are not the property of the System and therefore are
recorded as liabilities on the Statements of Net Position. As of June 30, 2020 and 2019, deposits held for
others were comprised of funds related to self-insurance plans, housing, student accounts, health services,
agency deposits, and other campus deposits.
Other noncurrent liabilities are comprised of unspent debt cost of issuance dollars, workers’ compensation
and insurance claims discussed in Note 19, and the major activities described below.
With the expiration of the authority of institutions to disburse Perkins loans, the System is required to return
the Federal share of funds to the Department of Education. The Perkins Loan Revolving Fund will be
liquidated as funds are collected from the loan recipients. For award year 2019-20, the System returned $4.9
million in Federal funds. For award year 2018-19, the Department of Education did not require the
liquidation and return of funds. In accordance with GASB Statement No. 33, Accounting and Financial
Reporting for Nonexchange Transactions, the System carries a liability on the Statements of Net Position.
As of June 30, 2020, and 2019, the System’s liabilities were $12.5 million and $17.5 million, respectively.
With the implementation of GASB Statement No. 83, Certain Asset Retirement Obligations, the System
carries a liability related to the obligations that will be incurred during the retirement of assets with complex
environmental impacts. The System has three types of obligations which include radiation detection,
radiation sources and laboratory equipment utilized with radiation. These items are regulated by the State
of Colorado Department of Public Health and Environment, as well as the Federal Nuclear Regulatory
Commission that covers all radioactive materials. The System is in compliance with State regulations and
has estimated decommissioning costs in its last financial assurance. The methods and assumptions for
estimating the liability are based on calculations for closing laboratories, decontaminating laboratories, and
decommissioning equipment. All assets related to the liability are fully depreciated, except for two assets
that have remaining useful lives of up to 18 months and are recorded as deferred outflows of resources on
the Statements of Net Position. As of June 30, 2020, and 2019, the System’s liabilities were $1.5 million
for both years.
(11) Revenue Bonds, Certificates of Participation (COPs), SWAP Agreement
The revenue bonds and notes from direct placements consist of multiple issues to finance the acquisition,
construction, repair, and equipping of various academic, auxiliary, and research facilities of the System.
Debt service payments on the revenue bonds and notes from direct placements are payable semiannually
and monthly, have serial maturities, may contain sinking fund requirements, and certain bonds contain
optional redemption provisions. The optional redemption provisions allow the System to redeem at various
dates, portions of the outstanding revenue bonds at 100 percent of the principal amount of the revenue bonds
redeemed. Payment of the principal and interest on certain bonds and notes from direct placements is either
56
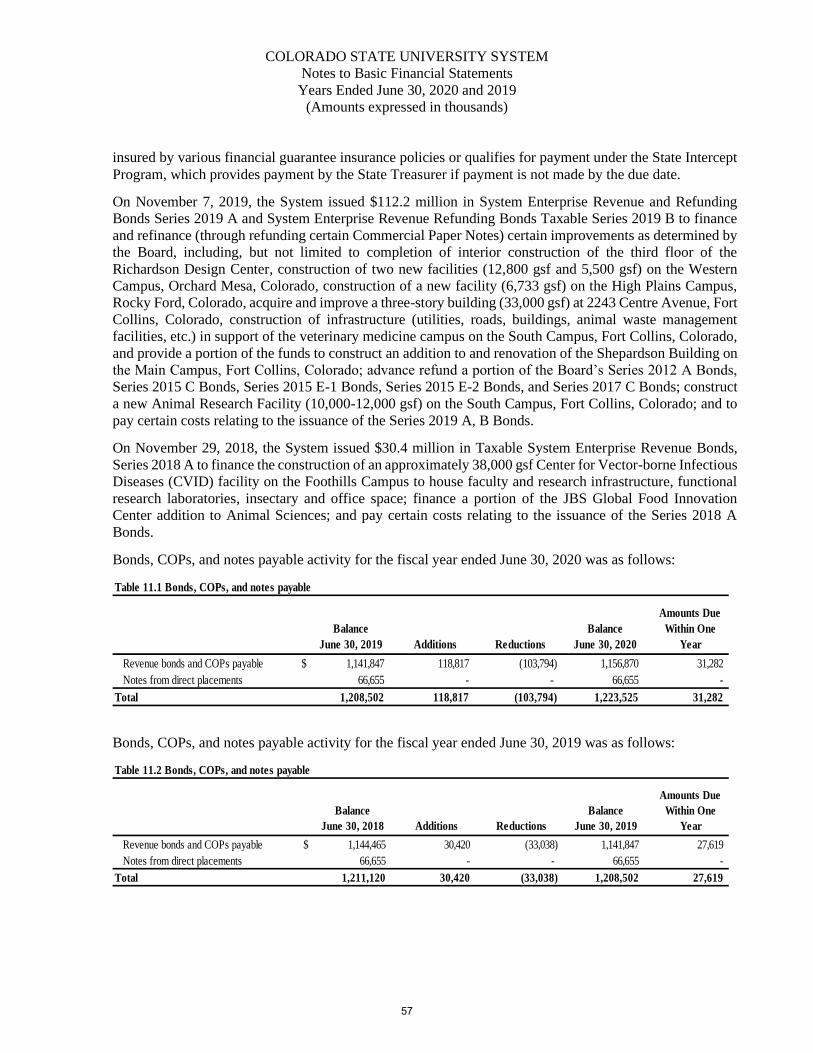
COLORADO STATE UNIVERSITY SYSTEM
Notes to Basic Financial Statements
Years Ended June 30, 2020 and 2019
(Amounts expressed in thousands)
insured by various financial guarantee insurance policies or qualifies for payment under the State Intercept
Program, which provides payment by the State Treasurer if payment is not made by the due date.
On November 7, 2019, the System issued $112.2 million in System Enterprise Revenue and Refunding
Bonds Series 2019 A and System Enterprise Revenue Refunding Bonds Taxable Series 2019 B to finance
and refinance (through refunding certain Commercial Paper Notes) certain improvements as determined by
the Board, including, but not limited to completion of interior construction of the third floor of the
Richardson Design Center, construction of two new facilities (12,800 gsf and 5,500 gsf) on the Western
Campus, Orchard Mesa, Colorado, construction of a new facility (6,733 gsf) on the High Plains Campus,
Rocky Ford, Colorado, acquire and improve a three-story building (33,000 gsf) at 2243 Centre Avenue, Fort
Collins, Colorado, construction of infrastructure (utilities, roads, buildings, animal waste management
facilities, etc.) in support of the veterinary medicine campus on the South Campus, Fort Collins, Colorado,
and provide a portion of the funds to construct an addition to and renovation of the Shepardson Building on
the Main Campus, Fort Collins, Colorado; advance refund a portion of the Board’s Series 2012 A Bonds,
Series 2015 C Bonds, Series 2015 E-1 Bonds, Series 2015 E-2 Bonds, and Series 2017 C Bonds; construct
a new Animal Research Facility (10,000-12,000 gsf) on the South Campus, Fort Collins, Colorado; and to
pay certain costs relating to the issuance of the Series 2019 A, B Bonds.
On November 29, 2018, the System issued $30.4 million in Taxable System Enterprise Revenue Bonds,
Series 2018 A to finance the construction of an approximately 38,000 gsf Center for Vector-borne Infectious
Diseases (CVID) facility on the Foothills Campus to house faculty and research infrastructure, functional
research laboratories, insectary and office space; finance a portion of the JBS Global Food Innovation
Center addition to Animal Sciences; and pay certain costs relating to the issuance of the Series 2018 A
Bonds.
Bonds, COPs, and notes payable activity for the fiscal year ended June 30, 2020 was as follows:
Table 11.1 Bonds, COPs, and notes payable
Balance
June 30, 2019 Additions Reductions
Balance
June 30, 2020
Amounts Due
Within One
Year
Revenue bonds and COPs payable $ 1,141,847 118,817 (103,794) 1,156,870 31,282
Notes from direct placements 66,655 - - 66,655 -
Total 1,208,502 118,817 (103,794) 1,223,525 31,282
Bonds, COPs, and notes payable activity for the fiscal year ended June 30, 2019 was as follows:
Table 11.2 Bonds, COPs, and notes payable
Balance
June 30, 2018 Additions Reductions
Balance
June 30, 2019
Amounts Due
Within One
Year
Revenue bonds and COPs payable $ 1,144,465 30,420 (33,038) 1,141,847 27,619
Notes from direct placements 66,655 - - 66,655 -
Total 1,211,120 30,420 (33,038) 1,208,502 27,619
57
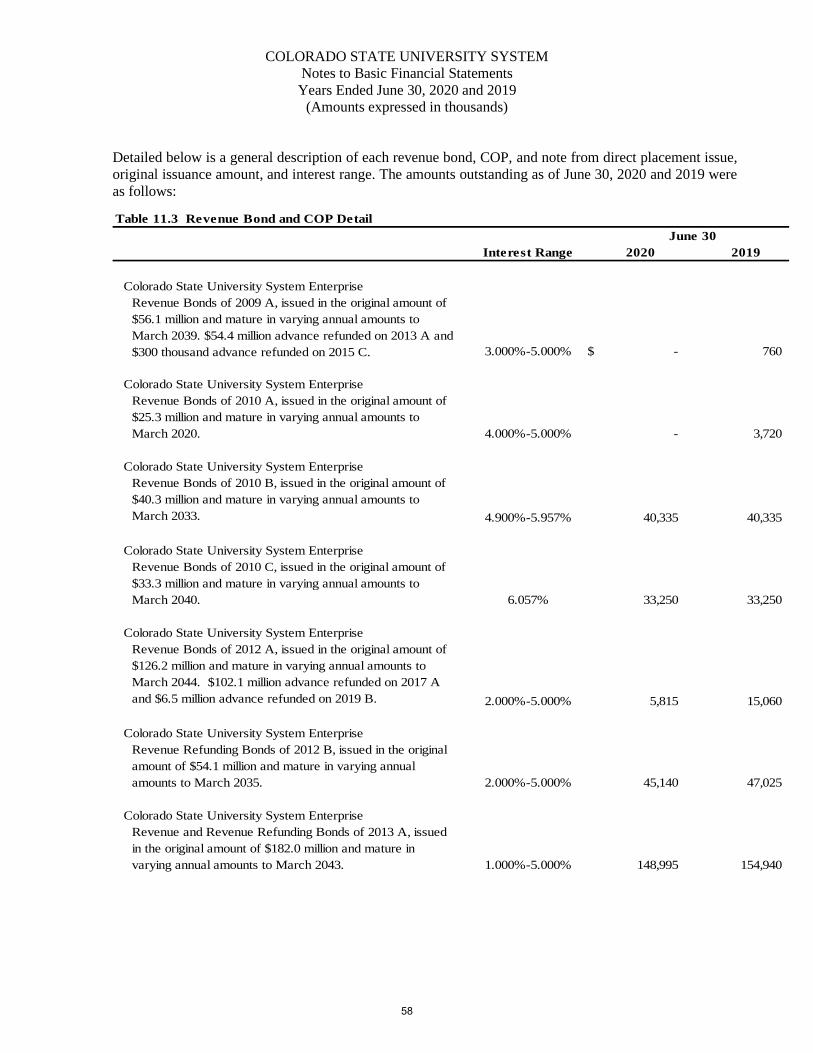
COLORADO STATE UNIVERSITY SYSTEM
Notes to Basic Financial Statements
Years Ended June 30, 2020 and 2019
(Amounts expressed in thousands)
Detailed below is a general description of each revenue bond, COP, and note from direct placement issue,
original issuance amount, and interest range. The amounts outstanding as of June 30, 2020 and 2019 were
as follows:
Table 11.3 Revenue Bond and COP Detail
Interest Range 2020 2019
Colorado State University System Enterprise
3.000%-5.000% $ - 760
Colorado State University System Enterprise
4.000%-5.000% - 3,720
Colorado State University System Enterprise
Revenue Bonds of 2010 B, issued in the original amount of
$40.3 million and mature in varying annual amounts to
March 2033. 4.900%-5.957% 40,335 40,335
Colorado State University System Enterprise
Revenue Bonds of 2010 C, issued in the original amount of
$33.3 million and mature in varying annual amounts to
March 2040. 6.057% 33,250 33,250
Colorado State University System Enterprise
Revenue Bonds of 2012 A, issued in the original amount of
$126.2 million and mature in varying annual amounts to
March 2044. $102.1 million advance refunded on 2017 A
and $6.5 million advance refunded on 2019 B. 2.000%-5.000% 5,815 15,060
Colorado State University System Enterprise
Revenue Refunding Bonds of 2012 B, issued in the original
amount of $54.1 million and mature in varying annual
amounts to March 2035. 2.000%-5.000% 45,140 47,025
Colorado State University System Enterprise
Revenue and Revenue Refunding Bonds of 2013 A, issued
in the original amount of $182.0 million and mature in
varying annual amounts to March 2043. 1.000%-5.000% 148,995 154,940
June 30
Revenue Bonds of 2009 A, issued in the original amount of
$56.1 million and mature in varying annual amounts to
March 2039. $54.4 million advance refunded on 2013 A and
$300 thousand advance refunded on 2015 C.
Revenue Bonds of 2010 A, issued in the original amount of
$25.3 million and mature in varying annual amounts to
March 2020.
58
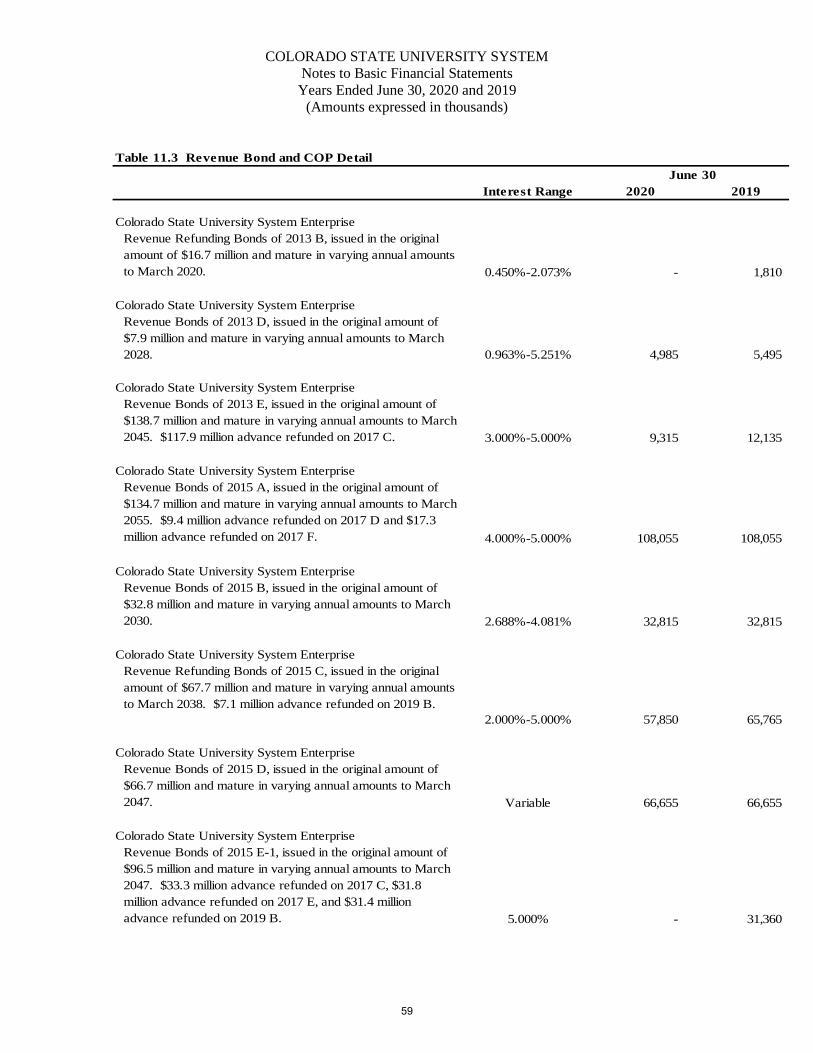
COLORADO STATE UNIVERSITY SYSTEM
Notes to Basic Financial Statements
Years Ended June 30, 2020 and 2019
(Amounts expressed in thousands)
Table 11.3 Revenue Bond and COP Detail
Interest Range 2020 2019
Colorado State University System Enterprise
Revenue Refunding Bonds of 2013 B, issued in the original
amount of $16.7 million and mature in varying annual amounts
to March 2020. 0.450%-2.073% - 1,810
Colorado State University System Enterprise
Revenue Bonds of 2013 D, issued in the original amount of
$7.9 million and mature in varying annual amounts to March
2028. 0.963%-5.251% 4,985 5,495
Colorado State University System Enterprise
Revenue Bonds of 2013 E, issued in the original amount of
$138.7 million and mature in varying annual amounts to March
2045. $117.9 million advance refunded on 2017 C. 3.000%-5.000% 9,315 12,135
Colorado State University System Enterprise
Revenue Bonds of 2015 A, issued in the original amount of
$134.7 million and mature in varying annual amounts to March
2055. $9.4 million advance refunded on 2017 D and $17.3
million advance refunded on 2017 F. 4.000%-5.000% 108,055 108,055
Colorado State University System Enterprise
Revenue Bonds of 2015 B, issued in the original amount of
$32.8 million and mature in varying annual amounts to March
2030. 2.688%-4.081% 32,815 32,815
Colorado State University System Enterprise
Revenue Refunding Bonds of 2015 C, issued in the original
amount of $67.7 million and mature in varying annual amounts
to March 2038. $7.1 million advance refunded on 2019 B.
2.000%-5.000% 57,850 65,765
Colorado State University System Enterprise
Revenue Bonds of 2015 D, issued in the original amount of
$66.7 million and mature in varying annual amounts to March
2047. Variable 66,655 66,655
Colorado State University System Enterprise
Revenue Bonds of 2015 E-1, issued in the original amount of
$96.5 million and mature in varying annual amounts to March
2047. $33.3 million advance refunded on 2017 C, $31.8
million advance refunded on 2017 E, and $31.4 million
advance refunded on 2019 B. 5.000% - 31,360
June 30
59
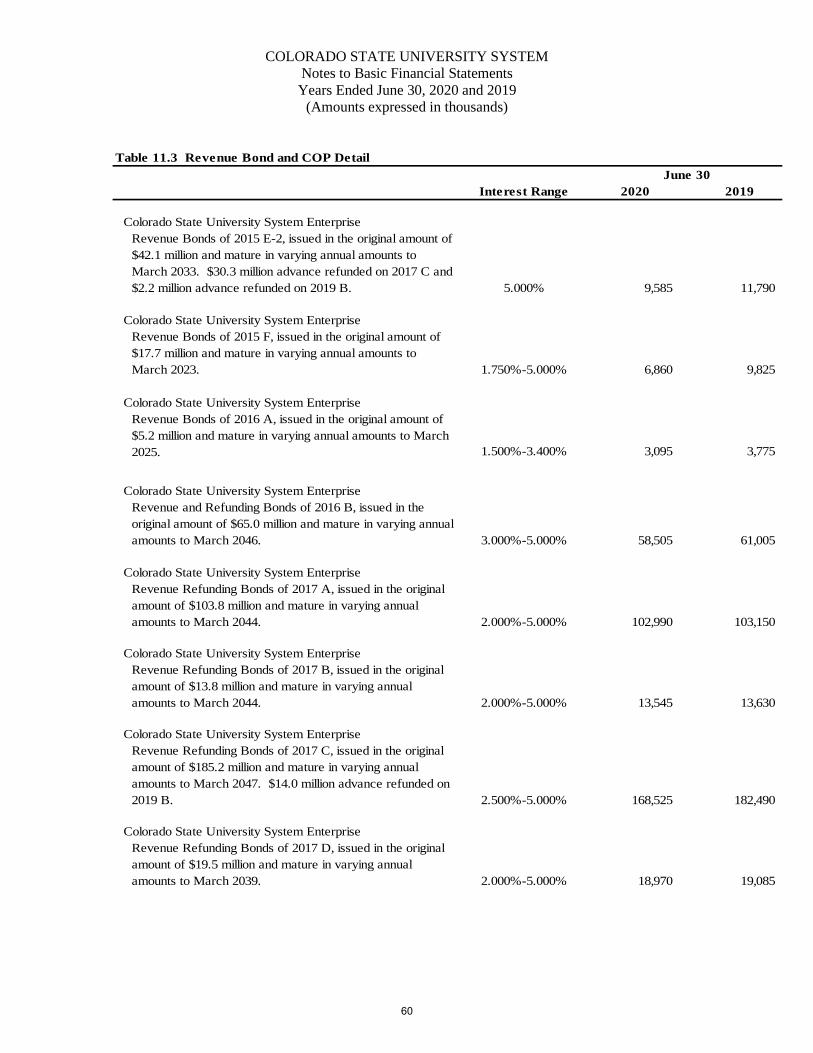
COLORADO STATE UNIVERSITY SYSTEM
Notes to Basic Financial Statements
Years Ended June 30, 2020 and 2019
(Amounts expressed in thousands)
Table 11.3 Revenue Bond and COP Detail
Interest Range 2020 2019
Colorado State University System Enterprise
Revenue Bonds of 2015 E-2, issued in the original amount of
$42.1 million and mature in varying annual amounts to
March 2033. $30.3 million advance refunded on 2017 C and
$2.2 million advance refunded on 2019 B. 5.000% 9,585 11,790
Colorado State University System Enterprise
Revenue Bonds of 2015 F, issued in the original amount of
$17.7 million and mature in varying annual amounts to
March 2023. 1.750%-5.000% 6,860 9,825
Colorado State University System Enterprise
Revenue Bonds of 2016 A, issued in the original amount of
$5.2 million and mature in varying annual amounts to March
2025. 1.500%-3.400% 3,095 3,775
Colorado State University System Enterprise
Revenue and Refunding Bonds of 2016 B, issued in the
original amount of $65.0 million and mature in varying annual
amounts to March 2046. 3.000%-5.000% 58,505 61,005
Colorado State University System Enterprise
Revenue Refunding Bonds of 2017 A, issued in the original
amount of $103.8 million and mature in varying annual
amounts to March 2044. 2.000%-5.000% 102,990 103,150
Colorado State University System Enterprise
Revenue Refunding Bonds of 2017 B, issued in the original
amount of $13.8 million and mature in varying annual
amounts to March 2044. 2.000%-5.000% 13,545 13,630
Colorado State University System Enterprise
Revenue Refunding Bonds of 2017 C, issued in the original
amount of $185.2 million and mature in varying annual
amounts to March 2047. $14.0 million advance refunded on
2019 B. 2.500%-5.000% 168,525 182,490
Colorado State University System Enterprise
Revenue Refunding Bonds of 2017 D, issued in the original
amount of $19.5 million and mature in varying annual
amounts to March 2039. 2.000%-5.000% 18,970 19,085
June 30
60
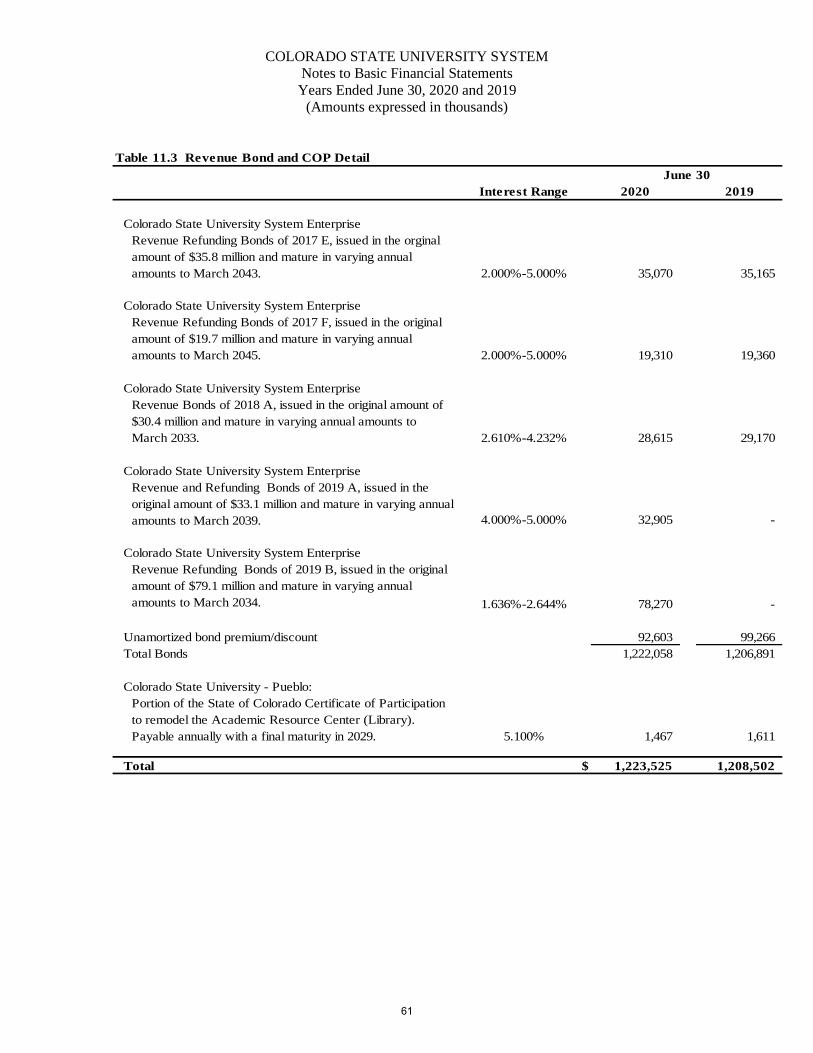
COLORADO STATE UNIVERSITY SYSTEM
Notes to Basic Financial Statements
Years Ended June 30, 2020 and 2019
(Amounts expressed in thousands)
Table 11.3 Revenue Bond and COP Detail
Interest Range 2020 2019
Colorado State University System Enterprise
Revenue Refunding Bonds of 2017 E, issued in the orginal
amount of $35.8 million and mature in varying annual
amounts to March 2043. 2.000%-5.000% 35,070 35,165
Colorado State University System Enterprise
Revenue Refunding Bonds of 2017 F, issued in the original
amount of $19.7 million and mature in varying annual
amounts to March 2045. 2.000%-5.000% 19,310 19,360
Colorado State University System Enterprise
Revenue Bonds of 2018 A, issued in the original amount of
$30.4 million and mature in varying annual amounts to
March 2033. 2.610%-4.232% 28,615 29,170
Colorado State University System Enterprise
Revenue and Refunding Bonds of 2019 A, issued in the
original amount of $33.1 million and mature in varying annual
amounts to March 2039. 4.000%-5.000% 32,905 -
Colorado State University System Enterprise
Revenue Refunding Bonds of 2019 B, issued in the original
amount of $79.1 million and mature in varying annual
amounts to March 2034. 1.636%-2.644% 78,270 -
Unamortized bond premium/discount 92,603 99,266
Total Bonds 1,222,058 1,206,891
Colorado State University - Pueblo:
Portion of the State of Colorado Certificate of Participation
to remodel the Academic Resource Center (Library).
Payable annually with a final maturity in 2029. 5.100% 1,467 1,611
Total $ 1,223,525 1,208,502
June 30
61
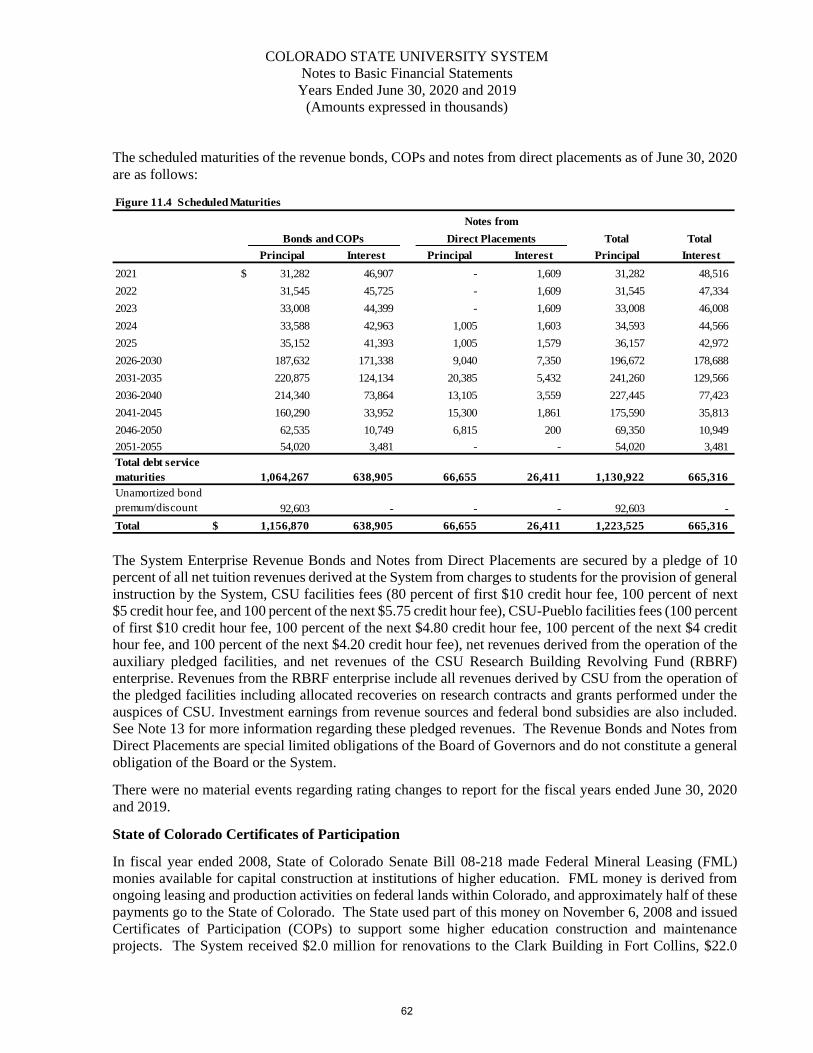
COLORADO STATE UNIVERSITY SYSTEM
Notes to Basic Financial Statements
Years Ended June 30, 2020 and 2019
(Amounts expressed in thousands)
The scheduled maturities of the revenue bonds, COPs and notes from direct placements as of June 30, 2020
are as follows:
Figure 11.4 Scheduled Maturities
Total Total
Principal Interest Principal Interest Principal Interest
2021 $ 31,282 46,907 - 1,609 31,282 48,516
2022 31,545 45,725 - 1,609 31,545 47,334
2023 33,008 44,399 - 1,609 33,008 46,008
2024 33,588 42,963 1,005 1,603 34,593 44,566
2025 35,152 41,393 1,005 1,579 36,157 42,972
2026-2030 187,632 171,338 9,040 7,350 196,672 178,688
2031-2035 220,875 124,134 20,385 5,432 241,260 129,566
2036-2040 214,340 73,864 13,105 3,559 227,445 77,423
2041-2045 160,290 33,952 15,300 1,861 175,590 35,813
2046-2050 62,535 10,749 6,815 200 69,350 10,949
2051-2055 54,020 3,481 - - 54,020 3,481
1,064,267 638,905 66,655 26,411 1,130,922 665,316
92,603 - - - 92,603 -
Total $ 1,156,870 638,905 66,655 26,411 1,223,525 665,316
Notes from
Bonds and COPs Direct Placements
Unamortized bond
premum/discount
Total debt service
maturities
The System Enterprise Revenue Bonds and Notes from Direct Placements are secured by a pledge of 10
percent of all net tuition revenues derived at the System from charges to students for the provision of general
instruction by the System, CSU facilities fees (80 percent of first $10 credit hour fee, 100 percent of next
$5 credit hour fee, and 100 percent of the next $5.75 credit hour fee), CSU-Pueblo facilities fees (100 percent
of first $10 credit hour fee, 100 percent of the next $4.80 credit hour fee, 100 percent of the next $4 credit
hour fee, and 100 percent of the next $4.20 credit hour fee), net revenues derived from the operation of the
auxiliary pledged facilities, and net revenues of the CSU Research Building Revolving Fund (RBRF)
enterprise. Revenues from the RBRF enterprise include all revenues derived by CSU from the operation of
the pledged facilities including allocated recoveries on research contracts and grants performed under the
auspices of CSU. Investment earnings from revenue sources and federal bond subsidies are also included.
See Note 13 for more information regarding these pledged revenues. The Revenue Bonds and Notes from
Direct Placements are special limited obligations of the Board of Governors and do not constitute a general
obligation of the Board or the System.
There were no material events regarding rating changes to report for the fiscal years ended June 30, 2020
and 2019.
State of Colorado Certificates of Participation
In fiscal year ended 2008, State of Colorado Senate Bill 08-218 made Federal Mineral Leasing (FML)
monies available for capital construction at institutions of higher education. FML money is derived from
ongoing leasing and production activities on federal lands within Colorado, and approximately half of these
payments go to the State of Colorado. The State used part of this money on November 6, 2008 and issued
Certificates of Participation (COPs) to support some higher education construction and maintenance
projects. The System received $2.0 million for renovations to the Clark Building in Fort Collins, $22.0
62
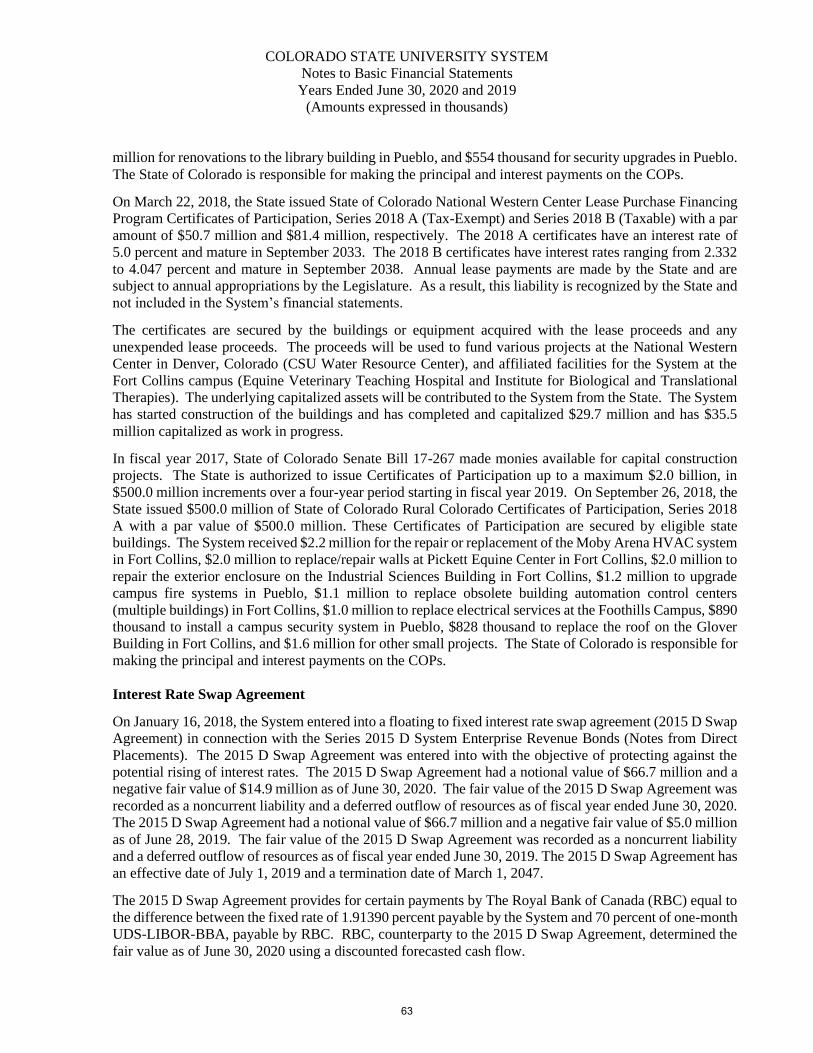
COLORADO STATE UNIVERSITY SYSTEM
Notes to Basic Financial Statements
Years Ended June 30, 2020 and 2019
(Amounts expressed in thousands)
million for renovations to the library building in Pueblo, and $554 thousand for security upgrades in Pueblo.
The State of Colorado is responsible for making the principal and interest payments on the COPs.
On March 22, 2018, the State issued State of Colorado National Western Center Lease Purchase Financing
Program Certificates of Participation, Series 2018 A (Tax-Exempt) and Series 2018 B (Taxable) with a par
amount of $50.7 million and $81.4 million, respectively. The 2018 A certificates have an interest rate of
5.0 percent and mature in September 2033. The 2018 B certificates have interest rates ranging from 2.332
to 4.047 percent and mature in September 2038. Annual lease payments are made by the State and are
subject to annual appropriations by the Legislature. As a result, this liability is recognized by the State and
not included in the System’s financial statements.
The certificates are secured by the buildings or equipment acquired with the lease proceeds and any
unexpended lease proceeds. The proceeds will be used to fund various projects at the National Western
Center in Denver, Colorado (CSU Water Resource Center), and affiliated facilities for the System at the
Fort Collins campus (Equine Veterinary Teaching Hospital and Institute for Biological and Translational
Therapies). The underlying capitalized assets will be contributed to the System from the State. The System
has started construction of the buildings and has completed and capitalized $29.7 million and has $35.5
million capitalized as work in progress.
In fiscal year 2017, State of Colorado Senate Bill 17-267 made monies available for capital construction
projects. The State is authorized to issue Certificates of Participation up to a maximum $2.0 billion, in
$500.0 million increments over a four-year period starting in fiscal year 2019. On September 26, 2018, the
State issued $500.0 million of State of Colorado Rural Colorado Certificates of Participation, Series 2018
A with a par value of $500.0 million. These Certificates of Participation are secured by eligible state
buildings. The System received $2.2 million for the repair or replacement of the Moby Arena HVAC system
in Fort Collins, $2.0 million to replace/repair walls at Pickett Equine Center in Fort Collins, $2.0 million to
repair the exterior enclosure on the Industrial Sciences Building in Fort Collins, $1.2 million to upgrade
campus fire systems in Pueblo, $1.1 million to replace obsolete building automation control centers
(multiple buildings) in Fort Collins, $1.0 million to replace electrical services at the Foothills Campus, $890
thousand to install a campus security system in Pueblo, $828 thousand to replace the roof on the Glover
Building in Fort Collins, and $1.6 million for other small projects. The State of Colorado is responsible for
making the principal and interest payments on the COPs.
Interest Rate Swap Agreement
On January 16, 2018, the System entered into a floating to fixed interest rate swap agreement (2015 D Swap
Agreement) in connection with the Series 2015 D System Enterprise Revenue Bonds (Notes from Direct
Placements). The 2015 D Swap Agreement was entered into with the objective of protecting against the
potential rising of interest rates. The 2015 D Swap Agreement had a notional value of $66.7 million and a
negative fair value of $14.9 million as of June 30, 2020. The fair value of the 2015 D Swap Agreement was
recorded as a noncurrent liability and a deferred outflow of resources as of fiscal year ended June 30, 2020.
The 2015 D Swap Agreement had a notional value of $66.7 million and a negative fair value of $5.0 million
as of June 28, 2019. The fair value of the 2015 D Swap Agreement was recorded as a noncurrent liability
and a deferred outflow of resources as of fiscal year ended June 30, 2019. The 2015 D Swap Agreement has
an effective date of July 1, 2019 and a termination date of March 1, 2047.
The 2015 D Swap Agreement provides for certain payments by The Royal Bank of Canada (RBC) equal to
the difference between the fixed rate of 1.91390 percent payable by the System and 70 percent of one-month
UDS-LIBOR-BBA, payable by RBC. RBC, counterparty to the 2015 D Swap Agreement, determined the
fair value as of June 30, 2020 using a discounted forecasted cash flow.
63
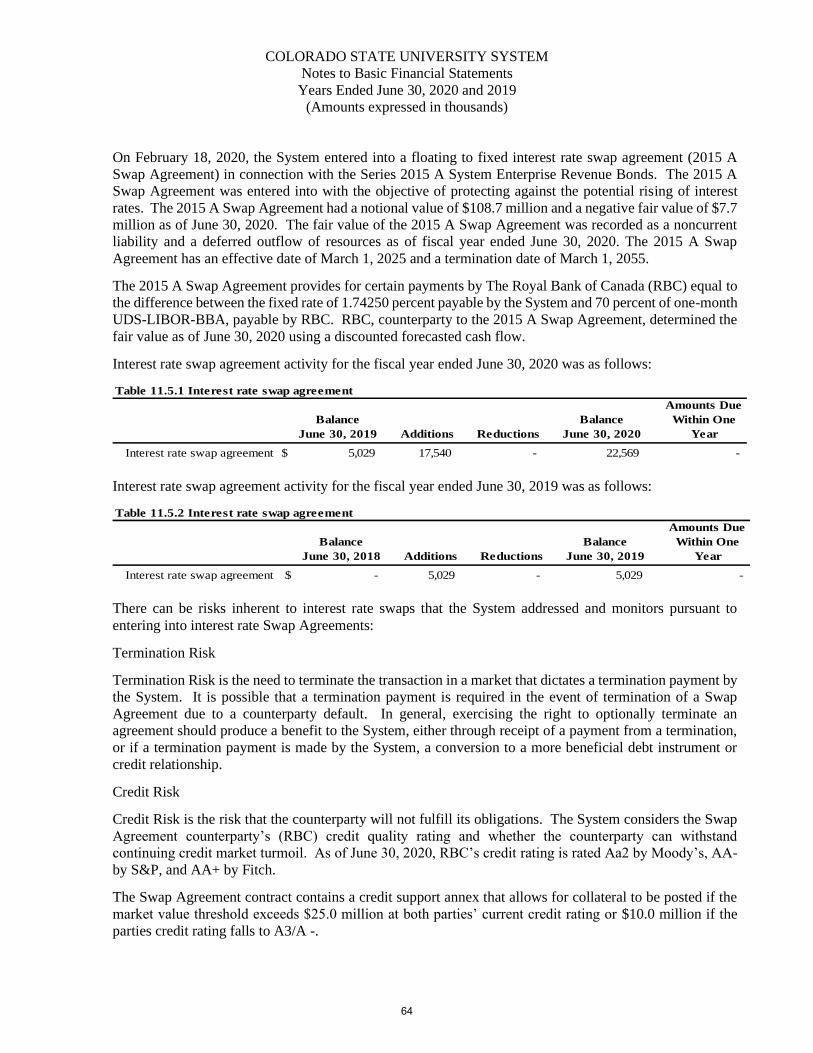
COLORADO STATE UNIVERSITY SYSTEM
Notes to Basic Financial Statements
Years Ended June 30, 2020 and 2019
(Amounts expressed in thousands)
On February 18, 2020, the System entered into a floating to fixed interest rate swap agreement (2015 A
Swap Agreement) in connection with the Series 2015 A System Enterprise Revenue Bonds. The 2015 A
Swap Agreement was entered into with the objective of protecting against the potential rising of interest
rates. The 2015 A Swap Agreement had a notional value of $108.7 million and a negative fair value of $7.7
million as of June 30, 2020. The fair value of the 2015 A Swap Agreement was recorded as a noncurrent
liability and a deferred outflow of resources as of fiscal year ended June 30, 2020. The 2015 A Swap
Agreement has an effective date of March 1, 2025 and a termination date of March 1, 2055.
The 2015 A Swap Agreement provides for certain payments by The Royal Bank of Canada (RBC) equal to
the difference between the fixed rate of 1.74250 percent payable by the System and 70 percent of one-month
UDS-LIBOR-BBA, payable by RBC. RBC, counterparty to the 2015 A Swap Agreement, determined the
fair value as of June 30, 2020 using a discounted forecasted cash flow.
Interest rate swap agreement activity for the fiscal year ended June 30, 2020 was as follows:
Table 11.5.1 Interest rate swap agreement
Balance
June 30, 2019 Additions Reductions
Balance
June 30, 2020
Amounts Due
Within One
Year
Interest rate swap agreement $ 5,029 17,540 - 22,569 -
Interest rate swap agreement activity for the fiscal year ended June 30, 2019 was as follows:
Table 11.5.2 Interest rate swap agreement
Balance
June 30, 2018 Additions Reductions
Balance
June 30, 2019
Amounts Due
Within One
Year
Interest rate swap agreement $ - 5,029 - 5,029 -
There can be risks inherent to interest rate swaps that the System addressed and monitors pursuant to
entering into interest rate Swap Agreements:
Termination Risk
Termination Risk is the need to terminate the transaction in a market that dictates a termination payment by
the System. It is possible that a termination payment is required in the event of termination of a Swap
Agreement due to a counterparty default. In general, exercising the right to optionally terminate an
agreement should produce a benefit to the System, either through receipt of a payment from a termination,
or if a termination payment is made by the System, a conversion to a more beneficial debt instrument or
credit relationship.
Credit Risk
Credit Risk is the risk that the counterparty will not fulfill its obligations. The System considers the Swap
Agreement counterparty’s (RBC) credit quality rating and whether the counterparty can withstand
continuing credit market turmoil. As of June 30, 2020, RBC’s credit rating is rated Aa2 by Moody’s, AA-
by S&P, and AA+ by Fitch.
The Swap Agreement contract contains a credit support annex that allows for collateral to be posted if the
market value threshold exceeds $25.0 million at both parties’ current credit rating or $10.0 million if the
parties credit rating falls to A3/A -.
64
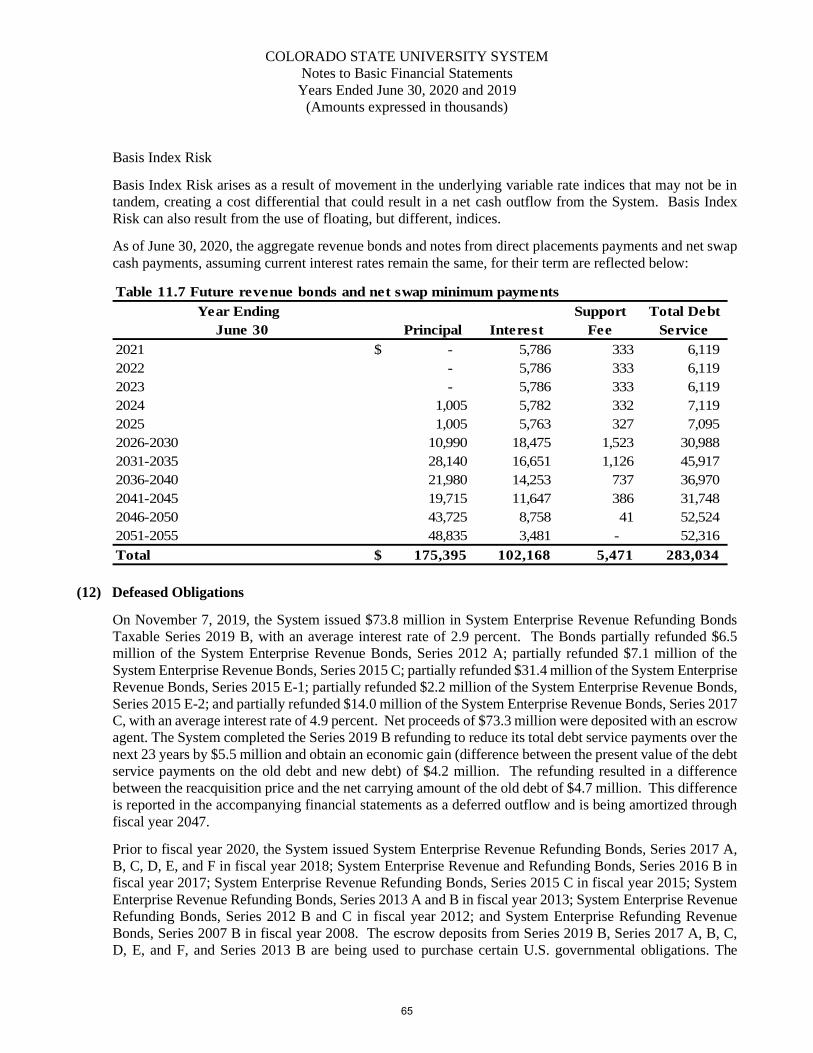
COLORADO STATE UNIVERSITY SYSTEM
Notes to Basic Financial Statements
Years Ended June 30, 2020 and 2019
(Amounts expressed in thousands)
Basis Index Risk
Basis Index Risk arises as a result of movement in the underlying variable rate indices that may not be in
tandem, creating a cost differential that could result in a net cash outflow from the System. Basis Index
Risk can also result from the use of floating, but different, indices.
As of June 30, 2020, the aggregate revenue bonds and notes from direct placements payments and net swap
cash payments, assuming current interest rates remain the same, for their term are reflected below:
Table 11.7 Future revenue bonds and net swap minimum payments
Year Ending Support Total Debt
June 30 Principal Interest Fee Service
2021 $ - 5,786 333 6,119
2022 - 5,786 333 6,119
2023 - 5,786 333 6,119
2024 1,005 5,782 332 7,119
2025 1,005 5,763 327 7,095
2026-2030 10,990 18,475 1,523 30,988
2031-2035 28,140 16,651 1,126 45,917
2036-2040 21,980 14,253 737 36,970
2041-2045 19,715 11,647 386 31,748
2046-2050 43,725 8,758 41 52,524
2051-2055 48,835 3,481 - 52,316
Total $ 175,395 102,168 5,471 283,034
(12) Defeased Obligations
On November 7, 2019, the System issued $73.8 million in System Enterprise Revenue Refunding Bonds
Taxable Series 2019 B, with an average interest rate of 2.9 percent. The Bonds partially refunded $6.5
million of the System Enterprise Revenue Bonds, Series 2012 A; partially refunded $7.1 million of the
System Enterprise Revenue Bonds, Series 2015 C; partially refunded $31.4 million of the System Enterprise
Revenue Bonds, Series 2015 E-1; partially refunded $2.2 million of the System Enterprise Revenue Bonds,
Series 2015 E-2; and partially refunded $14.0 million of the System Enterprise Revenue Bonds, Series 2017
C, with an average interest rate of 4.9 percent. Net proceeds of $73.3 million were deposited with an escrow
agent. The System completed the Series 2019 B refunding to reduce its total debt service payments over the
next 23 years by $5.5 million and obtain an economic gain (difference between the present value of the debt
service payments on the old debt and new debt) of $4.2 million. The refunding resulted in a difference
between the reacquisition price and the net carrying amount of the old debt of $4.7 million. This difference
is reported in the accompanying financial statements as a deferred outflow and is being amortized through
fiscal year 2047.
Prior to fiscal year 2020, the System issued System Enterprise Revenue Refunding Bonds, Series 2017 A,
B, C, D, E, and F in fiscal year 2018; System Enterprise Revenue and Refunding Bonds, Series 2016 B in
fiscal year 2017; System Enterprise Revenue Refunding Bonds, Series 2015 C in fiscal year 2015; System
Enterprise Revenue Refunding Bonds, Series 2013 A and B in fiscal year 2013; System Enterprise Revenue
Refunding Bonds, Series 2012 B and C in fiscal year 2012; and System Enterprise Refunding Revenue
Bonds, Series 2007 B in fiscal year 2008. The escrow deposits from Series 2019 B, Series 2017 A, B, C,
D, E, and F, and Series 2013 B are being used to purchase certain U.S. governmental obligations. The
65
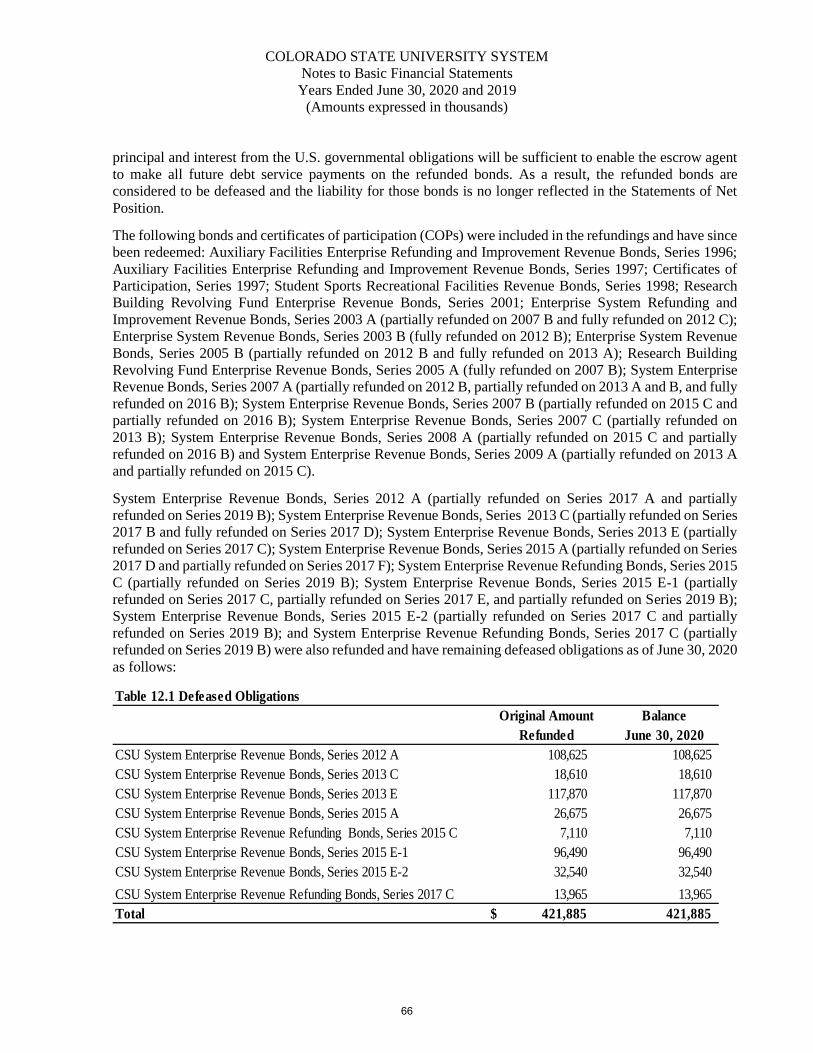
COLORADO STATE UNIVERSITY SYSTEM
Notes to Basic Financial Statements
Years Ended June 30, 2020 and 2019
(Amounts expressed in thousands)
principal and interest from the U.S. governmental obligations will be sufficient to enable the escrow agent
to make all future debt service payments on the refunded bonds. As a result, the refunded bonds are
considered to be defeased and the liability for those bonds is no longer reflected in the Statements of Net
Position.
The following bonds and certificates of participation (COPs) were included in the refundings and have since
been redeemed: Auxiliary Facilities Enterprise Refunding and Improvement Revenue Bonds, Series 1996;
Auxiliary Facilities Enterprise Refunding and Improvement Revenue Bonds, Series 1997; Certificates of
Participation, Series 1997; Student Sports Recreational Facilities Revenue Bonds, Series 1998; Research
Building Revolving Fund Enterprise Revenue Bonds, Series 2001; Enterprise System Refunding and
Improvement Revenue Bonds, Series 2003 A (partially refunded on 2007 B and fully refunded on 2012 C);
Enterprise System Revenue Bonds, Series 2003 B (fully refunded on 2012 B); Enterprise System Revenue
Bonds, Series 2005 B (partially refunded on 2012 B and fully refunded on 2013 A); Research Building
Revolving Fund Enterprise Revenue Bonds, Series 2005 A (fully refunded on 2007 B); System Enterprise
Revenue Bonds, Series 2007 A (partially refunded on 2012 B, partially refunded on 2013 A and B, and fully
refunded on 2016 B); System Enterprise Revenue Bonds, Series 2007 B (partially refunded on 2015 C and
partially refunded on 2016 B); System Enterprise Revenue Bonds, Series 2007 C (partially refunded on
2013 B); System Enterprise Revenue Bonds, Series 2008 A (partially refunded on 2015 C and partially
refunded on 2016 B) and System Enterprise Revenue Bonds, Series 2009 A (partially refunded on 2013 A
and partially refunded on 2015 C).
System Enterprise Revenue Bonds, Series 2012 A (partially refunded on Series 2017 A and partially
refunded on Series 2019 B); System Enterprise Revenue Bonds, Series 2013 C (partially refunded on Series
2017 B and fully refunded on Series 2017 D); System Enterprise Revenue Bonds, Series 2013 E (partially
refunded on Series 2017 C); System Enterprise Revenue Bonds, Series 2015 A (partially refunded on Series
2017 D and partially refunded on Series 2017 F); System Enterprise Revenue Refunding Bonds, Series 2015
C (partially refunded on Series 2019 B); System Enterprise Revenue Bonds, Series 2015 E-1 (partially
refunded on Series 2017 C, partially refunded on Series 2017 E, and partially refunded on Series 2019 B);
System Enterprise Revenue Bonds, Series 2015 E-2 (partially refunded on Series 2017 C and partially
refunded on Series 2019 B); and System Enterprise Revenue Refunding Bonds, Series 2017 C (partially
refunded on Series 2019 B) were also refunded and have remaining defeased obligations as of June 30, 2020
as follows:
Table 12.1 Defeased Obligations
Original Amount Balance
Refunded June 30, 2020
CSU System Enterprise Revenue Bonds, Series 2012 A 108,625 108,625
CSU System Enterprise Revenue Bonds, Series 2013 C 18,610 18,610
CSU System Enterprise Revenue Bonds, Series 2013 E 117,870 117,870
CSU System Enterprise Revenue Bonds, Series 2015 A 26,675 26,675
CSU System Enterprise Revenue Refunding Bonds, Series 2015 C 7,110 7,110
CSU System Enterprise Revenue Bonds, Series 2015 E-1 96,490 96,490
CSU System Enterprise Revenue Bonds, Series 2015 E-2 32,540 32,540
CSU System Enterprise Revenue Refunding Bonds, Series 2017 C 13,965 13,965
Total $ 421,885 421,885
66
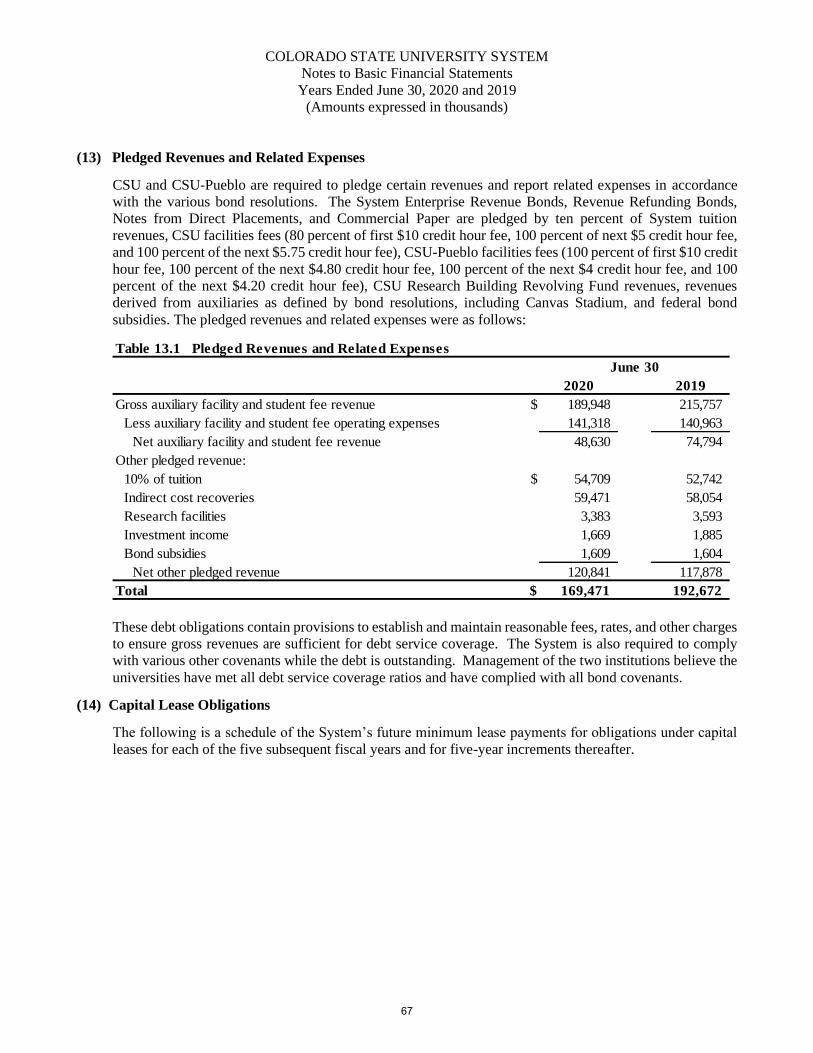
COLORADO STATE UNIVERSITY SYSTEM
Notes to Basic Financial Statements
Years Ended June 30, 2020 and 2019
(Amounts expressed in thousands)
(13) Pledged Revenues and Related Expenses
CSU and CSU-Pueblo are required to pledge certain revenues and report related expenses in accordance
with the various bond resolutions. The System Enterprise Revenue Bonds, Revenue Refunding Bonds,
Notes from Direct Placements, and Commercial Paper are pledged by ten percent of System tuition
revenues, CSU facilities fees (80 percent of first $10 credit hour fee, 100 percent of next $5 credit hour fee,
and 100 percent of the next $5.75 credit hour fee), CSU-Pueblo facilities fees (100 percent of first $10 credit
hour fee, 100 percent of the next $4.80 credit hour fee, 100 percent of the next $4 credit hour fee, and 100
percent of the next $4.20 credit hour fee), CSU Research Building Revolving Fund revenues, revenues
derived from auxiliaries as defined by bond resolutions, including Canvas Stadium, and federal bond
subsidies. The pledged revenues and related expenses were as follows:
Table 13.1 Pledged Revenues and Related Expenses
2020 2019
Gross auxiliary facility and student fee revenue $ 189,948 215,757
Less auxiliary facility and student fee operating expenses 141,318 140,963
Net auxiliary facility and student fee revenue 48,630 74,794
Other pledged revenue:
10% of tuition $ 54,709 52,742
Indirect cost recoveries 59,471 58,054
Research facilities 3,383 3,593
Investment income 1,669 1,885
Bond subsidies 1,609 1,604
Net other pledged revenue 120,841 117,878
Total $ 169,471 192,672
June 30
These debt obligations contain provisions to establish and maintain reasonable fees, rates, and other charges
to ensure gross revenues are sufficient for debt service coverage. The System is also required to comply
with various other covenants while the debt is outstanding. Management of the two institutions believe the
universities have met all debt service coverage ratios and have complied with all bond covenants.
(14) Capital Lease Obligations
The following is a schedule of the System’s future minimum lease payments for obligations under capital
leases for each of the five subsequent fiscal years and for five-year increments thereafter.
67
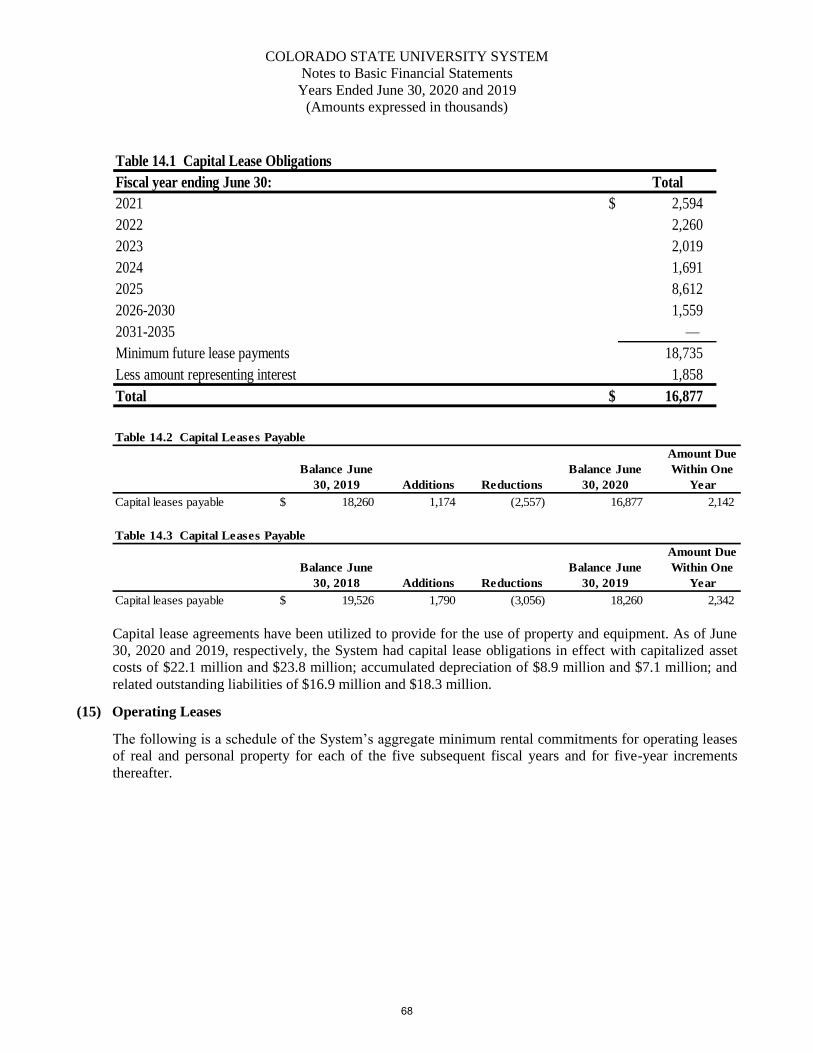
COLORADO STATE UNIVERSITY SYSTEM
Notes to Basic Financial Statements
Years Ended June 30, 2020 and 2019
(Amounts expressed in thousands)
Table 14.1 Capital Lease Obligations
Fiscal year ending June 30: Total
2021 $ 2,594
2022 2,260
2023 2,019
2024 1,691
2025 8,612
2026-2030 1,559
2031-2035 —
Minimum future lease payments 18,735
Less amount representing interest 1,858
Total $ 16,877
Table 14.2 Capital Leases Payable
Balance June
30, 2019 Additions Reductions
Balance June
30, 2020
Amount Due
Within One
Year
Capital leases payable $ 18,260 1,174 (2,557) 16,877 2,142
Table 14.3 Capital Leases Payable
Balance June
30, 2018 Additions Reductions
Balance June
30, 2019
Amount Due
Within One
Year
Capital leases payable $ 19,526 1,790 (3,056) 18,260 2,342
Capital lease agreements have been utilized to provide for the use of property and equipment. As of June
30, 2020 and 2019, respectively, the System had capital lease obligations in effect with capitalized asset
costs of $22.1 million and $23.8 million; accumulated depreciation of $8.9 million and $7.1 million; and
related outstanding liabilities of $16.9 million and $18.3 million.
(15) Operating Leases
The following is a schedule of the System’s aggregate minimum rental commitments for operating leases
of real and personal property for each of the five subsequent fiscal years and for five-year increments
thereafter.
68
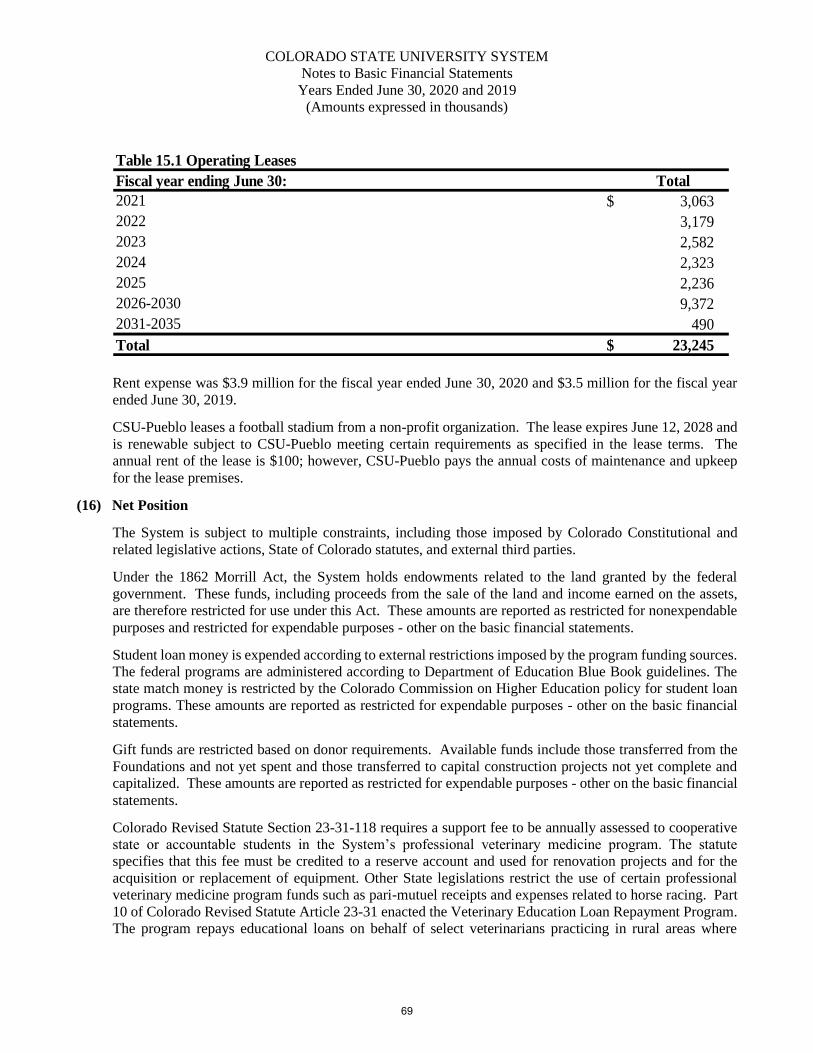
COLORADO STATE UNIVERSITY SYSTEM
Notes to Basic Financial Statements
Years Ended June 30, 2020 and 2019
(Amounts expressed in thousands)
Table 15.1 Operating Leases
Fiscal year ending June 30: Total
$ 3,063
3,179
2,582
2,323
2,236
9,372
490
Total $ 23,245
2021
2022
2023
2024
2025
2031-2035
2026-2030
Rent expense was $3.9 million for the fiscal year ended June 30, 2020 and $3.5 million for the fiscal year
ended June 30, 2019.
CSU-Pueblo leases a football stadium from a non-profit organization. The lease expires June 12, 2028 and
is renewable subject to CSU-Pueblo meeting certain requirements as specified in the lease terms. The
annual rent of the lease is $100; however, CSU-Pueblo pays the annual costs of maintenance and upkeep
for the lease premises.
(16) Net Position
The System is subject to multiple constraints, including those imposed by Colorado Constitutional and
related legislative actions, State of Colorado statutes, and external third parties.
Under the 1862 Morrill Act, the System holds endowments related to the land granted by the federal
government. These funds, including proceeds from the sale of the land and income earned on the assets,
are therefore restricted for use under this Act. These amounts are reported as restricted for nonexpendable
purposes and restricted for expendable purposes - other on the basic financial statements.
Student loan money is expended according to external restrictions imposed by the program funding sources.
The federal programs are administered according to Department of Education Blue Book guidelines. The
state match money is restricted by the Colorado Commission on Higher Education policy for student loan
programs. These amounts are reported as restricted for expendable purposes - other on the basic financial
statements.
Gift funds are restricted based on donor requirements. Available funds include those transferred from the
Foundations and not yet spent and those transferred to capital construction projects not yet complete and
capitalized. These amounts are reported as restricted for expendable purposes - other on the basic financial
statements.
Colorado Revised Statute Section 23-31-118 requires a support fee to be annually assessed to cooperative
state or accountable students in the System’s professional veterinary medicine program. The statute
specifies that this fee must be credited to a reserve account and used for renovation projects and for the
acquisition or replacement of equipment. Other State legislations restrict the use of certain professional
veterinary medicine program funds such as pari-mutuel receipts and expenses related to horse racing. Part
10 of Colorado Revised Statute Article 23-31 enacted the Veterinary Education Loan Repayment Program.
The program repays educational loans on behalf of select veterinarians practicing in rural areas where
69
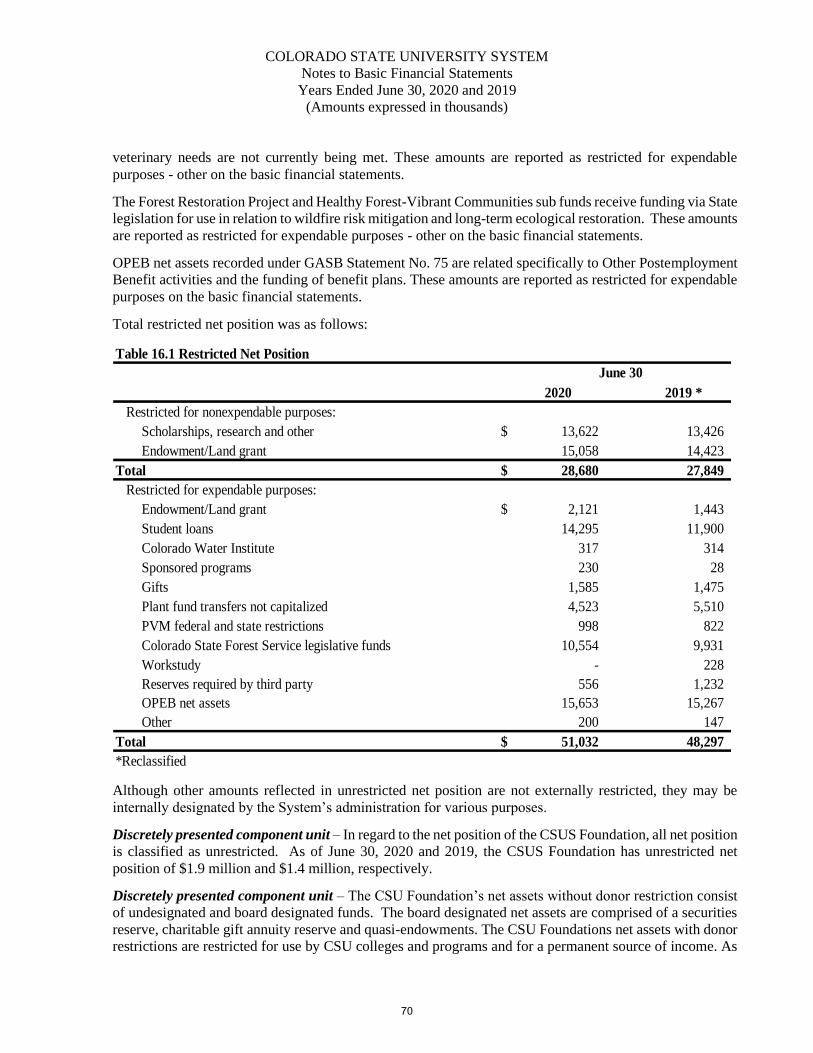
COLORADO STATE UNIVERSITY SYSTEM
Notes to Basic Financial Statements
Years Ended June 30, 2020 and 2019
(Amounts expressed in thousands)
veterinary needs are not currently being met. These amounts are reported as restricted for expendable
purposes - other on the basic financial statements.
The Forest Restoration Project and Healthy Forest-Vibrant Communities sub funds receive funding via State
legislation for use in relation to wildfire risk mitigation and long-term ecological restoration. These amounts
are reported as restricted for expendable purposes - other on the basic financial statements.
OPEB net assets recorded under GASB Statement No. 75 are related specifically to Other Postemployment
Benefit activities and the funding of benefit plans. These amounts are reported as restricted for expendable
purposes on the basic financial statements.
Total restricted net position was as follows:
Table 16.1 Restricted Net Position
2020 2019 *
Restricted for nonexpendable purposes:
Scholarships, research and other $ 13,622 13,426
Endowment/Land grant 15,058 14,423
Total $ 28,680 27,849
Restricted for expendable purposes:
Endowment/Land grant $ 2,121 1,443
Student loans 14,295 11,900
Colorado Water Institute 317 314
Sponsored programs 230 28
Gifts 1,585 1,475
Plant fund transfers not capitalized 4,523 5,510
PVM federal and state restrictions 998 822
Colorado State Forest Service legislative funds 10,554 9,931
Workstudy - 228
Reserves required by third party 556 1,232
OPEB net assets 15,653 15,267
Other 200 147
Total $ 51,032 48,297
*Reclassified
June 30
Although other amounts reflected in unrestricted net position are not externally restricted, they may be
internally designated by the System’s administration for various purposes.
Discretely presented component unit – In regard to the net position of the CSUS Foundation, all net position
is classified as unrestricted. As of June 30, 2020 and 2019, the CSUS Foundation has unrestricted net
position of $1.9 million and $1.4 million, respectively.
Discretely presented component unit – The CSU Foundation’s net assets without donor restriction consist
of undesignated and board designated funds. The board designated net assets are comprised of a securities
reserve, charitable gift annuity reserve and quasi-endowments. The CSU Foundations net assets with donor
restrictions are restricted for use by CSU colleges and programs and for a permanent source of income. As
70
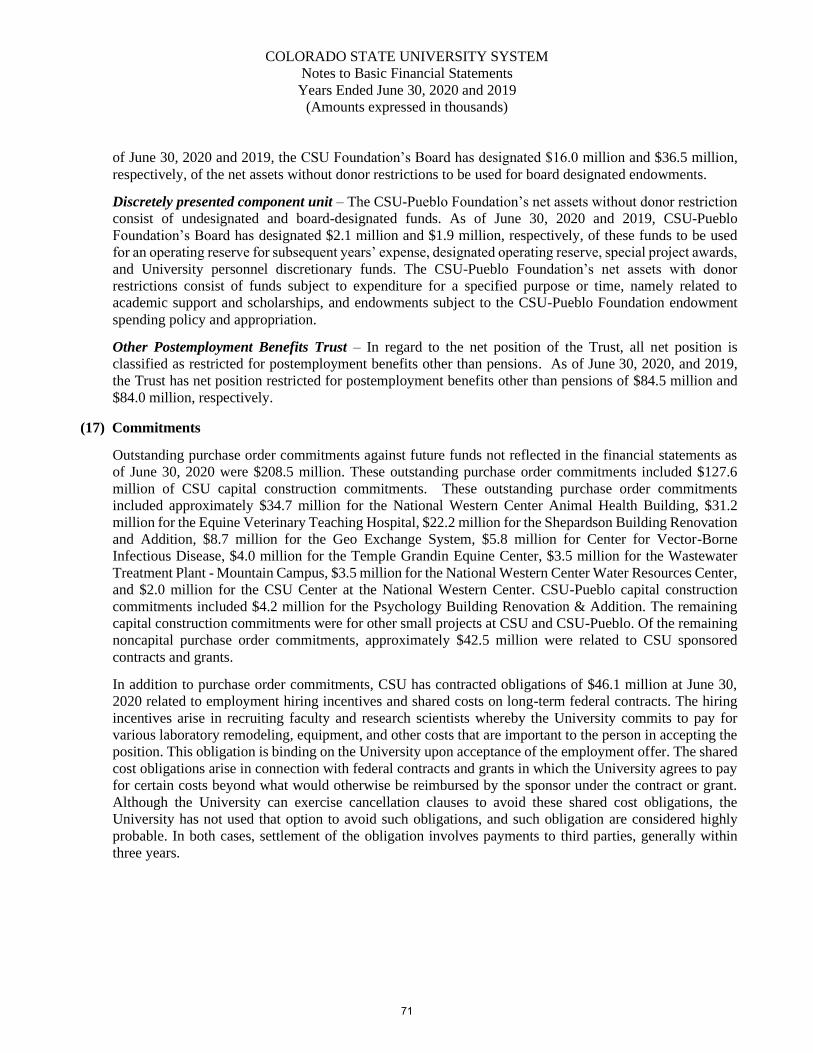
COLORADO STATE UNIVERSITY SYSTEM
Notes to Basic Financial Statements
Years Ended June 30, 2020 and 2019
(Amounts expressed in thousands)
of June 30, 2020 and 2019, the CSU Foundation’s Board has designated $16.0 million and $36.5 million,
respectively, of the net assets without donor restrictions to be used for board designated endowments.
Discretely presented component unit – The CSU-Pueblo Foundation’s net assets without donor restriction
consist of undesignated and board-designated funds. As of June 30, 2020 and 2019, CSU-Pueblo
Foundation’s Board has designated $2.1 million and $1.9 million, respectively, of these funds to be used
for an operating reserve for subsequent years’ expense, designated operating reserve, special project awards,
and University personnel discretionary funds. The CSU-Pueblo Foundation’s net assets with donor
restrictions consist of funds subject to expenditure for a specified purpose or time, namely related to
academic support and scholarships, and endowments subject to the CSU-Pueblo Foundation endowment
spending policy and appropriation.
Other Postemployment Benefits Trust – In regard to the net position of the Trust, all net position is
classified as restricted for postemployment benefits other than pensions. As of June 30, 2020, and 2019,
the Trust has net position restricted for postemployment benefits other than pensions of $84.5 million and
$84.0 million, respectively.
(17) Commitments
Outstanding purchase order commitments against future funds not reflected in the financial statements as
of June 30, 2020 were $208.5 million. These outstanding purchase order commitments included $127.6
million of CSU capital construction commitments. These outstanding purchase order commitments
included approximately $34.7 million for the National Western Center Animal Health Building, $31.2
million for the Equine Veterinary Teaching Hospital, $22.2 million for the Shepardson Building Renovation
and Addition, $8.7 million for the Geo Exchange System, $5.8 million for Center for Vector-Borne
Infectious Disease, $4.0 million for the Temple Grandin Equine Center, $3.5 million for the Wastewater
Treatment Plant - Mountain Campus, $3.5 million for the National Western Center Water Resources Center,
and $2.0 million for the CSU Center at the National Western Center. CSU-Pueblo capital construction
commitments included $4.2 million for the Psychology Building Renovation & Addition. The remaining
capital construction commitments were for other small projects at CSU and CSU-Pueblo. Of the remaining
noncapital purchase order commitments, approximately $42.5 million were related to CSU sponsored
contracts and grants.
In addition to purchase order commitments, CSU has contracted obligations of $46.1 million at June 30,
2020 related to employment hiring incentives and shared costs on long-term federal contracts. The hiring
incentives arise in recruiting faculty and research scientists whereby the University commits to pay for
various laboratory remodeling, equipment, and other costs that are important to the person in accepting the
position. This obligation is binding on the University upon acceptance of the employment offer. The shared
cost obligations arise in connection with federal contracts and grants in which the University agrees to pay
for certain costs beyond what would otherwise be reimbursed by the sponsor under the contract or grant.
Although the University can exercise cancellation clauses to avoid these shared cost obligations, the
University has not used that option to avoid such obligations, and such obligation are considered highly
probable. In both cases, settlement of the obligation involves payments to third parties, generally within
three years.
71
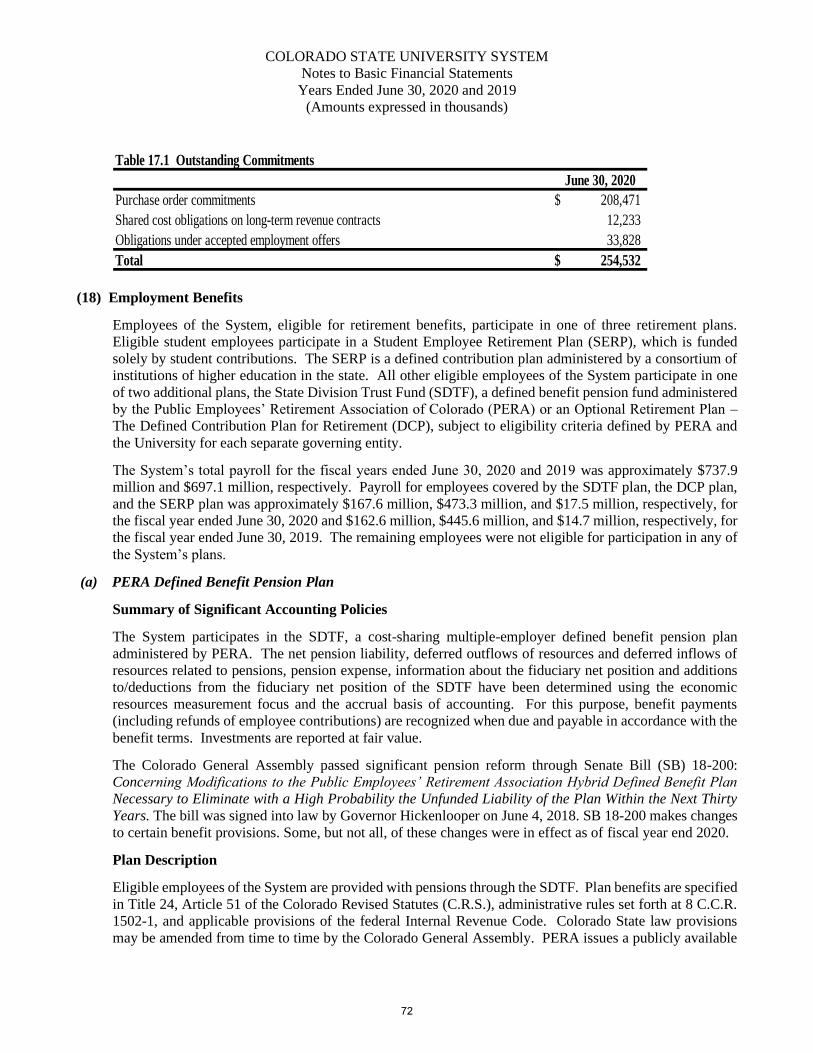
COLORADO STATE UNIVERSITY SYSTEM
Notes to Basic Financial Statements
Years Ended June 30, 2020 and 2019
(Amounts expressed in thousands)
Table 17.1 Outstanding Commitments
June 30, 2020
Purchase order commitments $ 208,471
Shared cost obligations on long-term revenue contracts 12,233
Obligations under accepted employment offers 33,828
Total $ 254,532
(18) Employment Benefits
Employees of the System, eligible for retirement benefits, participate in one of three retirement plans.
Eligible student employees participate in a Student Employee Retirement Plan (SERP), which is funded
solely by student contributions. The SERP is a defined contribution plan administered by a consortium of
institutions of higher education in the state. All other eligible employees of the System participate in one
of two additional plans, the State Division Trust Fund (SDTF), a defined benefit pension fund administered
by the Public Employees’ Retirement Association of Colorado (PERA) or an Optional Retirement Plan –
The Defined Contribution Plan for Retirement (DCP), subject to eligibility criteria defined by PERA and
the University for each separate governing entity.
The System’s total payroll for the fiscal years ended June 30, 2020 and 2019 was approximately $737.9
million and $697.1 million, respectively. Payroll for employees covered by the SDTF plan, the DCP plan,
and the SERP plan was approximately $167.6 million, $473.3 million, and $17.5 million, respectively, for
the fiscal year ended June 30, 2020 and $162.6 million, $445.6 million, and $14.7 million, respectively, for
the fiscal year ended June 30, 2019. The remaining employees were not eligible for participation in any of
the System’s plans.
(a) PERA Defined Benefit Pension Plan
Summary of Significant Accounting Policies
The System participates in the SDTF, a cost-sharing multiple-employer defined benefit pension plan
administered by PERA. The net pension liability, deferred outflows of resources and deferred inflows of
resources related to pensions, pension expense, information about the fiduciary net position and additions
to/deductions from the fiduciary net position of the SDTF have been determined using the economic
resources measurement focus and the accrual basis of accounting. For this purpose, benefit payments
(including refunds of employee contributions) are recognized when due and payable in accordance with the
benefit terms. Investments are reported at fair value.
The Colorado General Assembly passed significant pension reform through Senate Bill (SB) 18-200:
Concerning Modifications to the Public Employees’ Retirement Association Hybrid Defined Benefit Plan
Necessary to Eliminate with a High Probability the Unfunded Liability of the Plan Within the Next Thirty
Years. The bill was signed into law by Governor Hickenlooper on June 4, 2018. SB 18-200 makes changes
to certain benefit provisions. Some, but not all, of these changes were in effect as of fiscal year end 2020.
Plan Description
Eligible employees of the System are provided with pensions through the SDTF. Plan benefits are specified
in Title 24, Article 51 of the Colorado Revised Statutes (C.R.S.), administrative rules set forth at 8 C.C.R.
1502-1, and applicable provisions of the federal Internal Revenue Code. Colorado State law provisions
may be amended from time to time by the Colorado General Assembly. PERA issues a publicly available
72
COLORADO STATE UNIVERSITY SYSTEM
Notes to Basic Financial Statements
Years Ended June 30, 2020 and 2019
(Amounts expressed in thousands)
comprehensive annual financial report (CAFR) that can be obtained at www.copera.org/investments/pera-
financial-reports.
Benefits Provided
PERA provides retirement, disability, and survivor benefits. Retirement benefits are determined by the
amount of service credit earned and/or purchased, highest average salary, the benefit structure(s) under
which the member retires, the benefit option selected at retirement, and age at retirement. Retirement
eligibility is specified in tables set forth at C.R.S. § 24-51-602, 604, 1713, and 1714.
The lifetime retirement benefit for all eligible retiring employees under the PERA benefit structure is the
greater of the:
• Highest average salary multiplied by 2.5 percent and then multiplied by years of service credit.
• The value of the retiring employee’s member contribution account plus a 100.0 percent match on
eligible amounts as of the retirement date. This amount is then annuitized into a monthly benefit based
on life expectancy and other actuarial factors.
In all cases the service retirement benefit is limited to 100.0 percent of highest average salary and also
cannot exceed the maximum benefit allowed by federal Internal Revenue Code.
Members may elect to withdraw their member contribution accounts upon termination of employment with
all PERA employers; waiving rights to any lifetime retirement benefits earned. If eligible, the member may
receive a match of either 50.0 percent or 100.0 percent on eligible amounts depending on when contributions
were remitted to PERA, the date employment was terminated, whether five years of service credit has been
obtained and the benefit structure under which contributions were made.
As of December 31, 2019, benefit recipients who elect to receive a lifetime retirement benefit are generally
eligible to receive post-retirement cost-of-living adjustments in certain years, referred to as annual increases
in the C.R.S. once certain criteria are met. Pursuant to SB 18-200, the annual increase for 2019 is 0.00
percent for all benefit recipients. Thereafter, benefit recipients under the PERA benefit structure who began
eligible employment before January 1, 2007, will receive an annual increase of 1.25 percent unless adjusted
by the automatic adjustment provision (AAP) pursuant C.R.S. § 24-51-413. Benefit recipients under the
PERA benefit structure who began eligible employment on or after January 1, 2007, will receive the lesser
of an annual increase of 1.25 percent or the average of the Consumer Price Index for Urban Wage Earners
and Clerical Workers for the prior calendar year, not to exceed 10.0 percent of PERA’s Annual Increase
Reserve (AIR) for the SDTF. The AAP may raise or lower the aforementioned annual increase by up to
0.25 percent based on the parameters specified in C.R.S. § 24-51-413.
Disability benefits are available for eligible employees once they reach five years of earned service credit
and are determined to meet the definition of disability.
Survivor benefits are determined by several factors, which include the amount of earned service credit,
highest average salary of the deceased, the benefit structure(s) under which service credit was obtained, and
the qualified survivor(s) who will receive the benefits.
Contributions
Eligible employees of the System and the State are required to contribute to the SDTF at a rate set by
Colorado statute. The contribution requirements for the SDTF are established under C.R.S. § 24-51-401, et
seq. and § 24-51-413. Employee contribution rates are summarized in the table below:
73
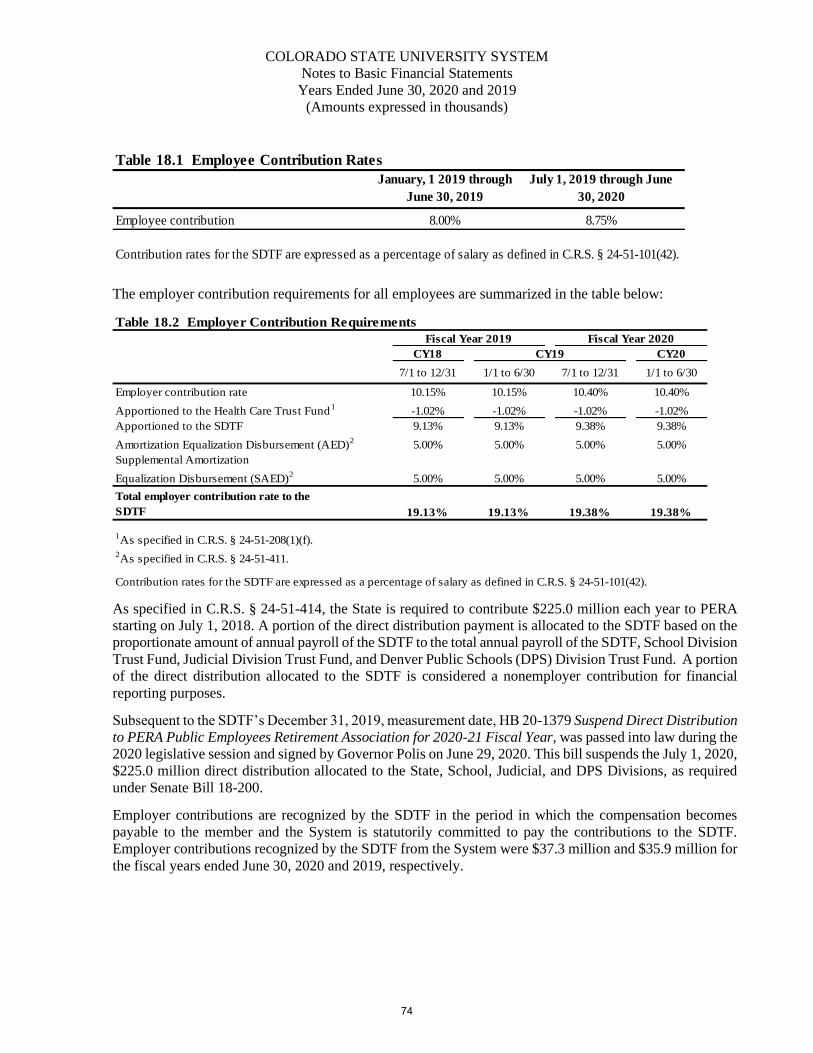
COLORADO STATE UNIVERSITY SYSTEM
Notes to Basic Financial Statements
Years Ended June 30, 2020 and 2019
(Amounts expressed in thousands)
Table 18.1 Employee Contribution Rates
January, 1 2019 through
June 30, 2019
July 1, 2019 through June
30, 2020
Employee contribution 8.00% 8.75%
Contribution rates for the SDTF are expressed as a percentage of salary as defined in C.R.S. § 24-51-101(42).
The employer contribution requirements for all employees are summarized in the table below:
Table 18.2 Employer Contribution Requirements
CY18 CY20
7/1 to 12/31 1/1 to 6/30 7/1 to 12/31 1/1 to 6/30
Employer contribution rate 10.15% 10.15% 10.40% 10.40%
Apportioned to the Health Care Trust Fund1
-1.02% -1.02% -1.02% -1.02%
Apportioned to the SDTF 9.13% 9.13% 9.38% 9.38%
Amortization Equalization Disbursement (AED)2
5.00% 5.00% 5.00% 5.00%
Supplemental Amortization
Equalization Disbursement (SAED)2
5.00% 5.00% 5.00% 5.00%
Total employer contribution rate to the
SDTF 19.13% 19.13% 19.38% 19.38%
1As specified in C.R.S. § 24-51-208(1)(f).
2As specified in C.R.S. § 24-51-411.
Contribution rates for the SDTF are expressed as a percentage of salary as defined in C.R.S. § 24-51-101(42).
Fiscal Year 2019 Fiscal Year 2020
CY19
As specified in C.R.S. § 24-51-414, the State is required to contribute $225.0 million each year to PERA
starting on July 1, 2018. A portion of the direct distribution payment is allocated to the SDTF based on the
proportionate amount of annual payroll of the SDTF to the total annual payroll of the SDTF, School Division
Trust Fund, Judicial Division Trust Fund, and Denver Public Schools (DPS) Division Trust Fund. A portion
of the direct distribution allocated to the SDTF is considered a nonemployer contribution for financial
reporting purposes.
Subsequent to the SDTF’s December 31, 2019, measurement date, HB 20-1379 Suspend Direct Distribution
to PERA Public Employees Retirement Association for 2020-21 Fiscal Year, was passed into law during the
2020 legislative session and signed by Governor Polis on June 29, 2020. This bill suspends the July 1, 2020,
$225.0 million direct distribution allocated to the State, School, Judicial, and DPS Divisions, as required
under Senate Bill 18-200.
Employer contributions are recognized by the SDTF in the period in which the compensation becomes
payable to the member and the System is statutorily committed to pay the contributions to the SDTF.
Employer contributions recognized by the SDTF from the System were $37.3 million and $35.9 million for
the fiscal years ended June 30, 2020 and 2019, respectively.
74
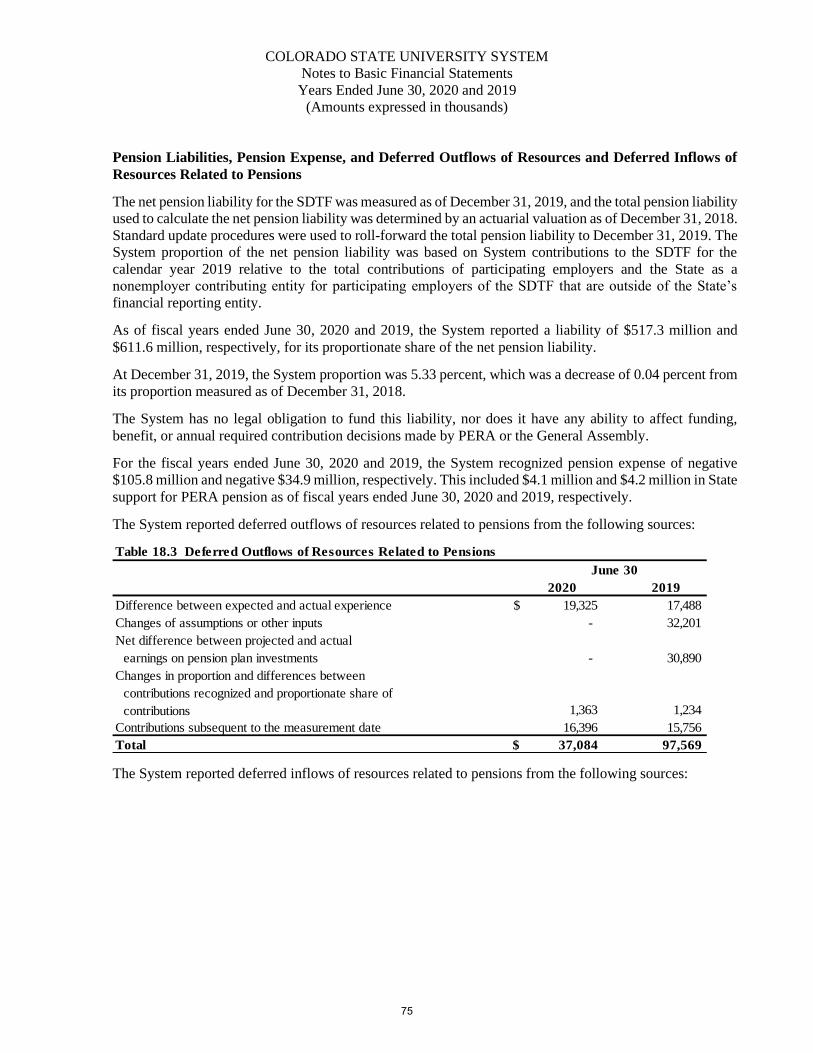
COLORADO STATE UNIVERSITY SYSTEM
Notes to Basic Financial Statements
Years Ended June 30, 2020 and 2019
(Amounts expressed in thousands)
Pension Liabilities, Pension Expense, and Deferred Outflows of Resources and Deferred Inflows of
Resources Related to Pensions
The net pension liability for the SDTF was measured as of December 31, 2019, and the total pension liability
used to calculate the net pension liability was determined by an actuarial valuation as of December 31, 2018.
Standard update procedures were used to roll-forward the total pension liability to December 31, 2019. The
System proportion of the net pension liability was based on System contributions to the SDTF for the
calendar year 2019 relative to the total contributions of participating employers and the State as a
nonemployer contributing entity for participating employers of the SDTF that are outside of the State’s
financial reporting entity.
As of fiscal years ended June 30, 2020 and 2019, the System reported a liability of $517.3 million and
$611.6 million, respectively, for its proportionate share of the net pension liability.
At December 31, 2019, the System proportion was 5.33 percent, which was a decrease of 0.04 percent from
its proportion measured as of December 31, 2018.
The System has no legal obligation to fund this liability, nor does it have any ability to affect funding,
benefit, or annual required contribution decisions made by PERA or the General Assembly.
For the fiscal years ended June 30, 2020 and 2019, the System recognized pension expense of negative
$105.8 million and negative $34.9 million, respectively. This included $4.1 million and $4.2 million in State
support for PERA pension as of fiscal years ended June 30, 2020 and 2019, respectively.
The System reported deferred outflows of resources related to pensions from the following sources:
Table 18.3 Deferred Outflows of Resources Related to Pensions
2020 2019
Difference between expected and actual experience $ 19,325 17,488
Changes of assumptions or other inputs - 32,201
Net difference between projected and actual
earnings on pension plan investments - 30,890
Changes in proportion and differences between
contributions recognized and proportionate share of
contributions 1,363 1,234
Contributions subsequent to the measurement date 16,396 15,756
Total $ 37,084 97,569
June 30
The System reported deferred inflows of resources related to pensions from the following sources:
75
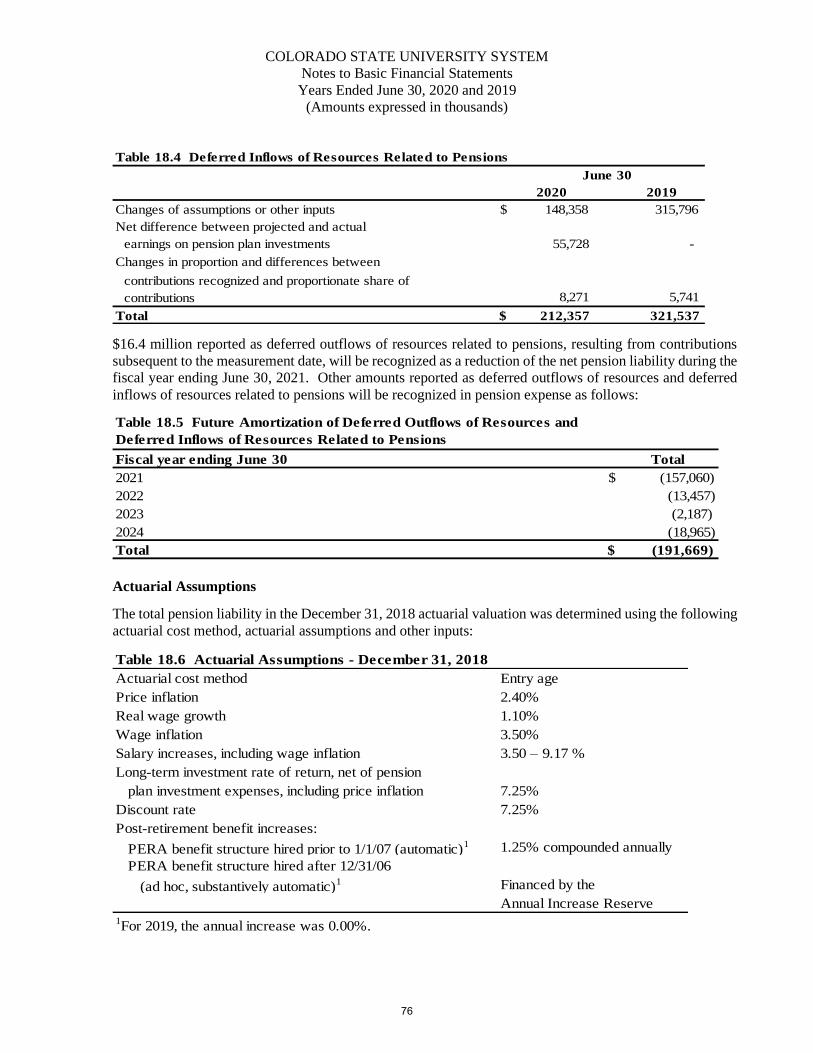
COLORADO STATE UNIVERSITY SYSTEM
Notes to Basic Financial Statements
Years Ended June 30, 2020 and 2019
(Amounts expressed in thousands)
Table 18.4 Deferred Inflows of Resources Related to Pensions
2020 2019
Changes of assumptions or other inputs $ 148,358 315,796
Net difference between projected and actual
earnings on pension plan investments 55,728 -
Changes in proportion and differences between
contributions recognized and proportionate share of
contributions 8,271 5,741
Total $ 212,357 321,537
June 30
$16.4 million reported as deferred outflows of resources related to pensions, resulting from contributions
subsequent to the measurement date, will be recognized as a reduction of the net pension liability during the
fiscal year ending June 30, 2021. Other amounts reported as deferred outflows of resources and deferred
inflows of resources related to pensions will be recognized in pension expense as follows:
Fiscal year ending June 30 Total
2021 $ (157,060)
2022 (13,457)
2023 (2,187)
2024 (18,965)
Total $ (191,669)
Table 18.5 Future Amortization of Deferred Outflows of Resources and
Deferred Inflows of Resources Related to Pensions
Actuarial Assumptions
The total pension liability in the December 31, 2018 actuarial valuation was determined using the following
actuarial cost method, actuarial assumptions and other inputs:
Table 18.6 Actuarial Assumptions - December 31, 2018
Actuarial cost method Entry age
Price inflation 2.40%
Real wage growth 1.10%
Wage inflation 3.50%
Salary increases, including wage inflation 3.50 – 9.17 %
Long-term investment rate of return, net of pension
plan investment expenses, including price inflation 7.25%
Discount rate 7.25%
Post-retirement benefit increases:
PERA benefit structure hired prior to 1/1/07 (automatic)1 1.25% compounded annually
PERA benefit structure hired after 12/31/06
(ad hoc, substantively automatic)1 Financed by the
Annual Increase Reserve1For 2019, the annual increase was 0.00%.
76
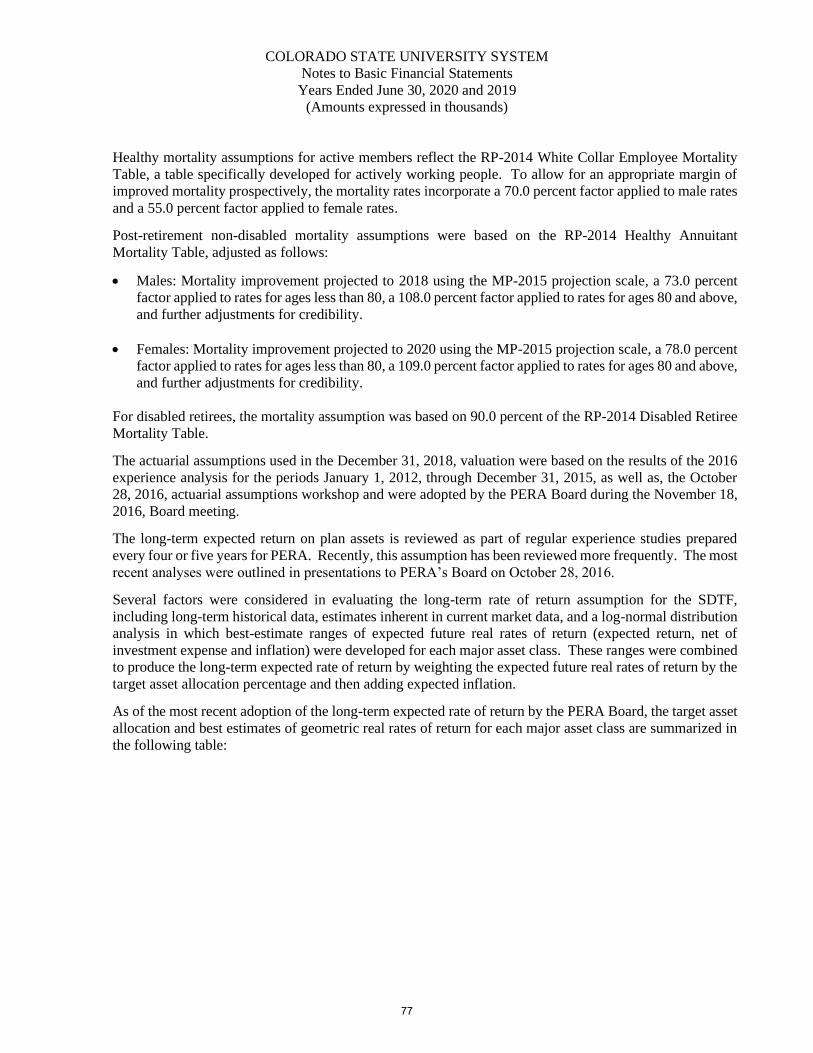
COLORADO STATE UNIVERSITY SYSTEM
Notes to Basic Financial Statements
Years Ended June 30, 2020 and 2019
(Amounts expressed in thousands)
Healthy mortality assumptions for active members reflect the RP-2014 White Collar Employee Mortality
Table, a table specifically developed for actively working people. To allow for an appropriate margin of
improved mortality prospectively, the mortality rates incorporate a 70.0 percent factor applied to male rates
and a 55.0 percent factor applied to female rates.
Post-retirement non-disabled mortality assumptions were based on the RP-2014 Healthy Annuitant
Mortality Table, adjusted as follows:
• Males: Mortality improvement projected to 2018 using the MP-2015 projection scale, a 73.0 percent
factor applied to rates for ages less than 80, a 108.0 percent factor applied to rates for ages 80 and above,
and further adjustments for credibility.
• Females: Mortality improvement projected to 2020 using the MP-2015 projection scale, a 78.0 percent
factor applied to rates for ages less than 80, a 109.0 percent factor applied to rates for ages 80 and above,
and further adjustments for credibility.
For disabled retirees, the mortality assumption was based on 90.0 percent of the RP-2014 Disabled Retiree
Mortality Table.
The actuarial assumptions used in the December 31, 2018, valuation were based on the results of the 2016
experience analysis for the periods January 1, 2012, through December 31, 2015, as well as, the October
28, 2016, actuarial assumptions workshop and were adopted by the PERA Board during the November 18,
2016, Board meeting.
The long-term expected return on plan assets is reviewed as part of regular experience studies prepared
every four or five years for PERA. Recently, this assumption has been reviewed more frequently. The most
recent analyses were outlined in presentations to PERA’s Board on October 28, 2016.
Several factors were considered in evaluating the long-term rate of return assumption for the SDTF,
including long-term historical data, estimates inherent in current market data, and a log-normal distribution
analysis in which best-estimate ranges of expected future real rates of return (expected return, net of
investment expense and inflation) were developed for each major asset class. These ranges were combined
to produce the long-term expected rate of return by weighting the expected future real rates of return by the
target asset allocation percentage and then adding expected inflation.
As of the most recent adoption of the long-term expected rate of return by the PERA Board, the target asset
allocation and best estimates of geometric real rates of return for each major asset class are summarized in
the following table:
77
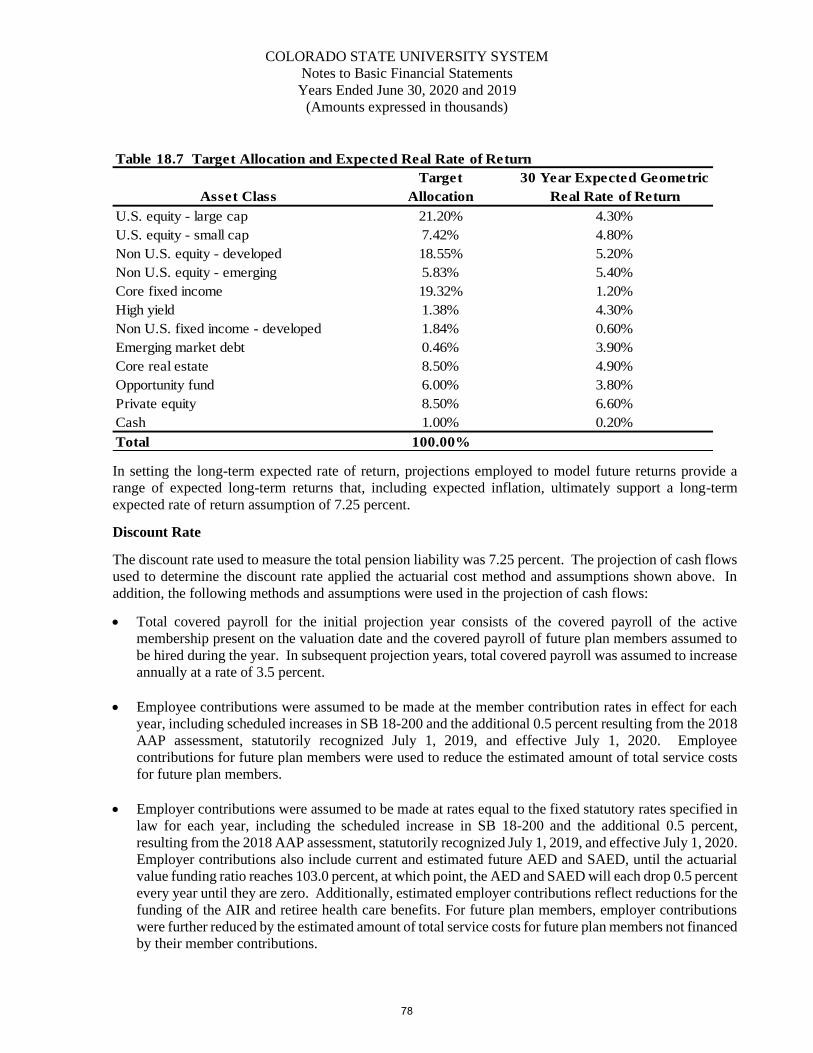
COLORADO STATE UNIVERSITY SYSTEM
Notes to Basic Financial Statements
Years Ended June 30, 2020 and 2019
(Amounts expressed in thousands)
Table 18.7 Target Allocation and Expected Real Rate of Return
Target 30 Year Expected Geometric
Asset Class Allocation Real Rate of Return
U.S. equity - large cap 21.20% 4.30%
U.S. equity - small cap 7.42% 4.80%
Non U.S. equity - developed 18.55% 5.20%
Non U.S. equity - emerging 5.83% 5.40%
Core fixed income 19.32% 1.20%
High yield 1.38% 4.30%
Non U.S. fixed income - developed 1.84% 0.60%
Emerging market debt 0.46% 3.90%
Core real estate 8.50% 4.90%
Opportunity fund 6.00% 3.80%
Private equity 8.50% 6.60%
Cash 1.00% 0.20%
Total 100.00%
In setting the long-term expected rate of return, projections employed to model future returns provide a
range of expected long-term returns that, including expected inflation, ultimately support a long-term
expected rate of return assumption of 7.25 percent.
Discount Rate
The discount rate used to measure the total pension liability was 7.25 percent. The projection of cash flows
used to determine the discount rate applied the actuarial cost method and assumptions shown above. In
addition, the following methods and assumptions were used in the projection of cash flows:
• Total covered payroll for the initial projection year consists of the covered payroll of the active
membership present on the valuation date and the covered payroll of future plan members assumed to
be hired during the year. In subsequent projection years, total covered payroll was assumed to increase
annually at a rate of 3.5 percent.
• Employee contributions were assumed to be made at the member contribution rates in effect for each
year, including scheduled increases in SB 18-200 and the additional 0.5 percent resulting from the 2018
AAP assessment, statutorily recognized July 1, 2019, and effective July 1, 2020. Employee
contributions for future plan members were used to reduce the estimated amount of total service costs
for future plan members.
• Employer contributions were assumed to be made at rates equal to the fixed statutory rates specified in
law for each year, including the scheduled increase in SB 18-200 and the additional 0.5 percent,
resulting from the 2018 AAP assessment, statutorily recognized July 1, 2019, and effective July 1, 2020.
Employer contributions also include current and estimated future AED and SAED, until the actuarial
value funding ratio reaches 103.0 percent, at which point, the AED and SAED will each drop 0.5 percent
every year until they are zero. Additionally, estimated employer contributions reflect reductions for the
funding of the AIR and retiree health care benefits. For future plan members, employer contributions
were further reduced by the estimated amount of total service costs for future plan members not financed
by their member contributions.
78
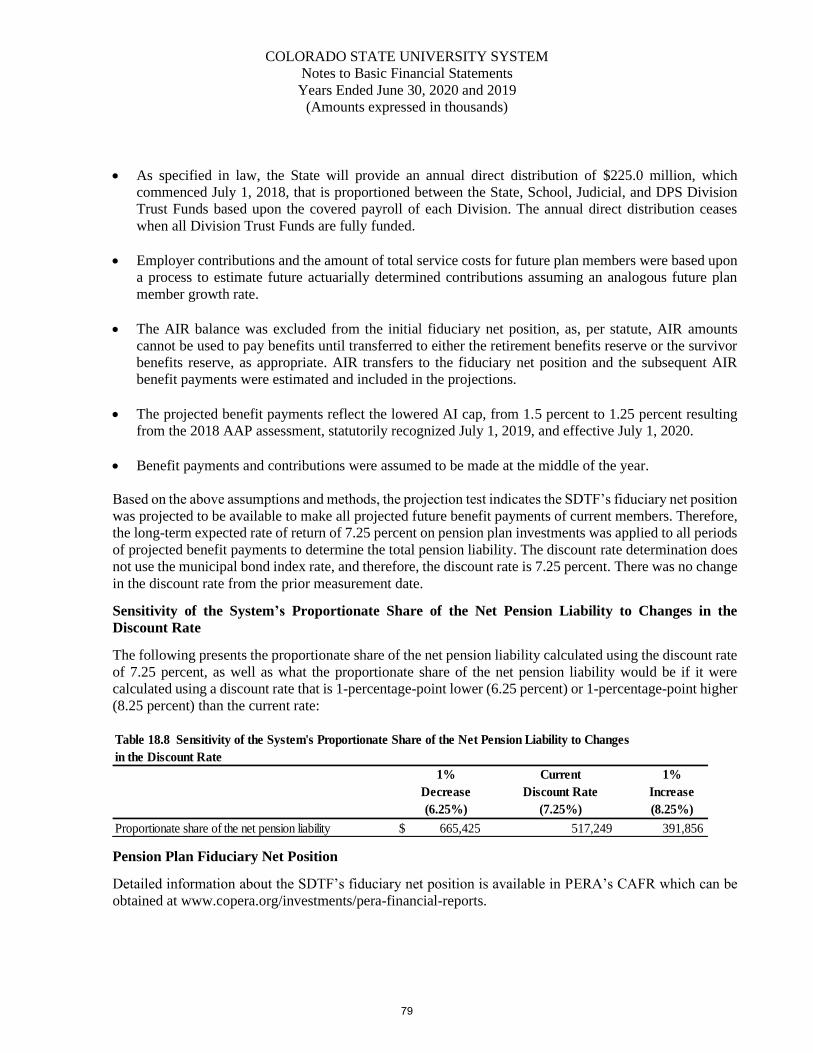
COLORADO STATE UNIVERSITY SYSTEM
Notes to Basic Financial Statements
Years Ended June 30, 2020 and 2019
(Amounts expressed in thousands)
• As specified in law, the State will provide an annual direct distribution of $225.0 million, which
commenced July 1, 2018, that is proportioned between the State, School, Judicial, and DPS Division
Trust Funds based upon the covered payroll of each Division. The annual direct distribution ceases
when all Division Trust Funds are fully funded.
• Employer contributions and the amount of total service costs for future plan members were based upon
a process to estimate future actuarially determined contributions assuming an analogous future plan
member growth rate.
• The AIR balance was excluded from the initial fiduciary net position, as, per statute, AIR amounts
cannot be used to pay benefits until transferred to either the retirement benefits reserve or the survivor
benefits reserve, as appropriate. AIR transfers to the fiduciary net position and the subsequent AIR
benefit payments were estimated and included in the projections.
• The projected benefit payments reflect the lowered AI cap, from 1.5 percent to 1.25 percent resulting
from the 2018 AAP assessment, statutorily recognized July 1, 2019, and effective July 1, 2020.
• Benefit payments and contributions were assumed to be made at the middle of the year.
Based on the above assumptions and methods, the projection test indicates the SDTF’s fiduciary net position
was projected to be available to make all projected future benefit payments of current members. Therefore,
the long-term expected rate of return of 7.25 percent on pension plan investments was applied to all periods
of projected benefit payments to determine the total pension liability. The discount rate determination does
not use the municipal bond index rate, and therefore, the discount rate is 7.25 percent. There was no change
in the discount rate from the prior measurement date.
Sensitivity of the System’s Proportionate Share of the Net Pension Liability to Changes in the
Discount Rate
The following presents the proportionate share of the net pension liability calculated using the discount rate
of 7.25 percent, as well as what the proportionate share of the net pension liability would be if it were
calculated using a discount rate that is 1-percentage-point lower (6.25 percent) or 1-percentage-point higher
(8.25 percent) than the current rate:
1%
Decrease
(6.25%)
Current
Discount Rate
(7.25%)
1%
Increase
(8.25%)
Proportionate share of the net pension liability $ 665,425 517,249 391,856
Table 18.8 Sensitivity of the System's Proportionate Share of the Net Pension Liability to Changes
in the Discount Rate
Pension Plan Fiduciary Net Position
Detailed information about the SDTF’s fiduciary net position is available in PERA’s CAFR which can be
obtained at www.copera.org/investments/pera-financial-reports.
79
COLORADO STATE UNIVERSITY SYSTEM
Notes to Basic Financial Statements
Years Ended June 30, 2020 and 2019
(Amounts expressed in thousands)
Payables to the Pension Plan
The System reported a payable of $2.7 million and $2.5 million for the outstanding amount of contributions
to the PERA SDTF required for the fiscal year ended June 30, 2020 and 2019, respectively.
(b) Other Retirement Plans
Voluntary Investment Program (PERAPlus 401(K) Plan)
Plan Description
Employees of the System that are also members of the SDTF may voluntarily contribute to the Voluntary
Investment Program, an Internal Revenue Code Section 401(k) defined contribution plan administered by
PERA. Title 24, Article 51, Part 14 of the C.R.S., as amended, assigns the authority to establish the Plan
provisions to the PERA Board of Trustees. PERA issues a publicly available CAFR which includes
additional information on the Voluntary Investment Program. That report can be obtained at
www.copera.org/investments/pera-financial-reports.
Funding Policy
The Voluntary Investment Program is funded by voluntary member contributions up to the maximum limits
set by the Internal Revenue Service, as established under Title 24, Article 51, Section 1402 of the C.R.S.,
as amended. Employees are immediately vested in their own contributions and investment earnings. For the
fiscal years ended June 30, 2020 and 2019, program members contributed $1.6 million in both years for the
Voluntary Investment Program.
Defined Contribution Retirement Plan (PERA DC Plan)
Plan Description
Employees of the State of Colorado that were hired on or after January 1, 2006, and employees of certain
community colleges that were hired on or after January 1, 2008, which were eligible to participate in the
SDTF, a cost-sharing multiple-employer defined benefit pension plan, have the option to participate in the
SDTF or the Defined Contribution Retirement Plan (PERA DC Plan). Pursuant to C.R.S. § 24-51-1501(4),
the PERA DC Plan eligibility was extended to certain new classified employees at State Colleges and
Universities beginning on January 1, 2019. The PERA DC Plan is an Internal Revenue Code Section 401(a)
governmental profit-sharing defined contribution plan. Title 24, Article 51, Part 15 of the C.R.S., as
amended, assigns the authority to establish Plan provisions to the PERA Board of Trustees. The DC Plan is
also included in PERA’s CAFR as referred to above.
Funding Policy
All participating employees in the PERA DC Plan and the System are required to contribute a percentage
of the participating employees’ PERA-includable salary to the PERA DC Plan. The employee and employer
contribution rates are summarized in the tables below:
80
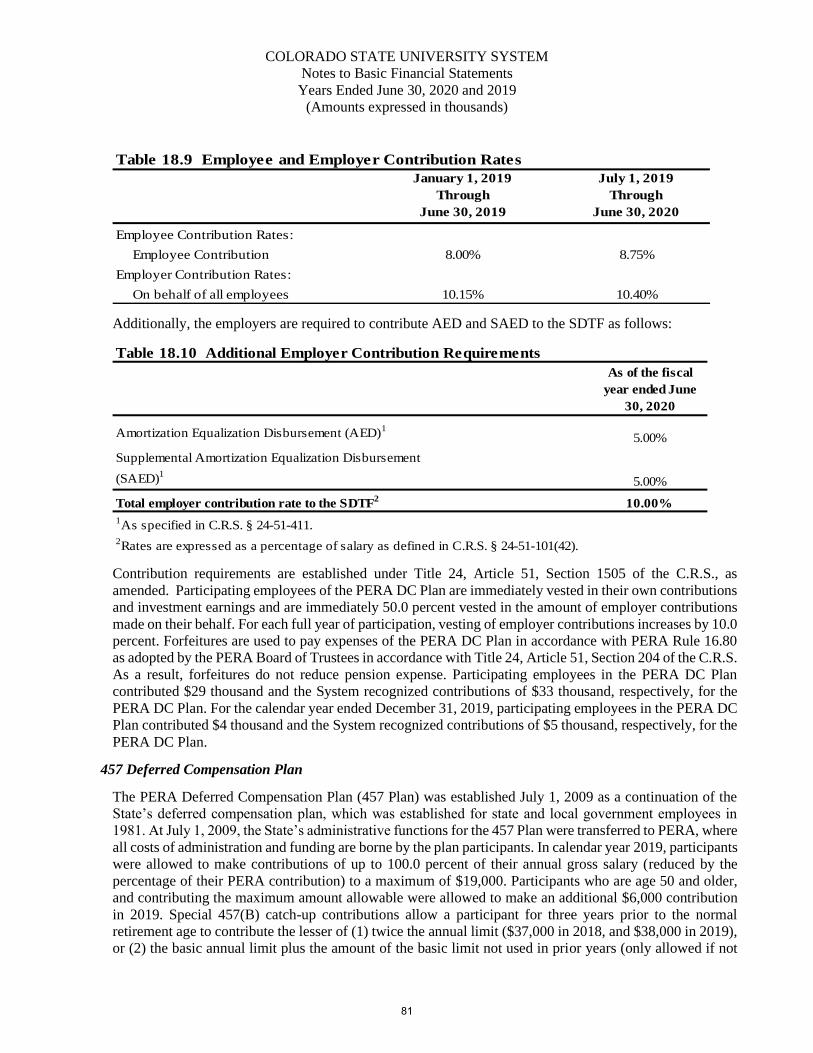
COLORADO STATE UNIVERSITY SYSTEM
Notes to Basic Financial Statements
Years Ended June 30, 2020 and 2019
(Amounts expressed in thousands)
Table 18.9 Employee and Employer Contribution Rates
January 1, 2019
Through
June 30, 2019
July 1, 2019
Through
June 30, 2020
Employee Contribution Rates:
Employee Contribution 8.00% 8.75%
Employer Contribution Rates:
On behalf of all employees 10.15% 10.40%
Additionally, the employers are required to contribute AED and SAED to the SDTF as follows:
Table 18.10 Additional Employer Contribution Requirements
As of the fiscal
year ended June
30, 2020
Amortization Equalization Disbursement (AED)1
5.00%
Supplemental Amortization Equalization Disbursement
(SAED)1
5.00%
Total employer contribution rate to the SDTF2
10.00%
1As specified in C.R.S. § 24-51-411.
2Rates are expressed as a percentage of salary as defined in C.R.S. § 24-51-101(42).
Contribution requirements are established under Title 24, Article 51, Section 1505 of the C.R.S., as
amended. Participating employees of the PERA DC Plan are immediately vested in their own contributions
and investment earnings and are immediately 50.0 percent vested in the amount of employer contributions
made on their behalf. For each full year of participation, vesting of employer contributions increases by 10.0
percent. Forfeitures are used to pay expenses of the PERA DC Plan in accordance with PERA Rule 16.80
as adopted by the PERA Board of Trustees in accordance with Title 24, Article 51, Section 204 of the C.R.S.
As a result, forfeitures do not reduce pension expense. Participating employees in the PERA DC Plan
contributed $29 thousand and the System recognized contributions of $33 thousand, respectively, for the
PERA DC Plan. For the calendar year ended December 31, 2019, participating employees in the PERA DC
Plan contributed $4 thousand and the System recognized contributions of $5 thousand, respectively, for the
PERA DC Plan.
457 Deferred Compensation Plan
The PERA Deferred Compensation Plan (457 Plan) was established July 1, 2009 as a continuation of the
State’s deferred compensation plan, which was established for state and local government employees in
1981. At July 1, 2009, the State’s administrative functions for the 457 Plan were transferred to PERA, where
all costs of administration and funding are borne by the plan participants. In calendar year 2019, participants
were allowed to make contributions of up to 100.0 percent of their annual gross salary (reduced by the
percentage of their PERA contribution) to a maximum of $19,000. Participants who are age 50 and older,
and contributing the maximum amount allowable were allowed to make an additional $6,000 contribution
in 2019. Special 457(B) catch-up contributions allow a participant for three years prior to the normal
retirement age to contribute the lesser of (1) twice the annual limit ($37,000 in 2018, and $38,000 in 2019),
or (2) the basic annual limit plus the amount of the basic limit not used in prior years (only allowed if not
81
COLORADO STATE UNIVERSITY SYSTEM
Notes to Basic Financial Statements
Years Ended June 30, 2020 and 2019
(Amounts expressed in thousands)
using age 50 or over catch-up contributions). Contributions and earnings are tax deferred. At December 31,
2019, the Plan had 280 participants and 273 participants at December 31, 2018.
(c) Optional Retirement Plan – The Defined Contribution Plan for Retirement (DCP)
Under each University’s optional retirement plan, all Academic Faculty, Administrative Professionals, Post-
Doctoral Fellows, Veterinary Interns and Clinical Psychology Interns appointed on or after April 1, 1993,
are required as a condition of employment under Colorado law to participate in either the Defined
Contribution Plan (DCP) for Retirement or, in very limited cases, in the PERA Defined Benefit plan (as
eligibility permits). DCP participants may select from three investment companies as follows:
1. Fidelity Investments / MetLife (eligible Faculty/Staff at CSU-Pueblo do not have access to this
investment company)
2. Teachers Insurance and Annuity Association (TIAA)
3. AIG Retirement Services (AIG)
The defined contribution retirement plans are established pursuant to state statute (C.R.S. § 24-54.5-101 to
24-54.5-107). The CSU plan was adopted by the Board of Governors in December 1992 and the CSU-
Pueblo plan was adopted in April 1993. The Defined Contribution Retirement Plan is a qualified plan under
Section 401(a) of the IRC. CSU and CSU-Pueblo are the Plan Sponsors. All participants contribute the
required 8.0 percent of eligible salary. As required, CSU provides a matching contribution of 12.0 percent
of eligible salary for all “permanent” appointees (those with regular, special and senior teaching
appointments at half time or greater) and for temporary appointees with appointments of half time or greater
for the second and subsequent consecutive year(s). CSU-Pueblo provides a matching contribution of 10.8
percent, as required, of eligible salary for all nonstudent employees, including those employees at less than
half time and nonstudent temporary, hourly employees. Both employee and employer contributions are
vested immediately. Investments are participant directed within the funds available through the authorized
investment companies. The System’s aggregate contribution to the above three vendors was equal to 11.5
percent of covered payroll or approximately $54.4 million for the fiscal year ended June 30, 2020 and 11.5
percent of covered payroll or approximately $51.1 million for the fiscal year ended June 30, 2019. The
employee aggregate contribution to the above three vendors was equal to 8.0 percent of covered payroll or
approximately $37.9 million for the fiscal year ended June 30, 2020 and $35.6 million for the fiscal year
ended June 30, 2019.
The Federal retirement system covers a very limited number of employees at CSU Extension. The System’s
contribution to this plan was approximately $50 thousand for the fiscal year ended June 30, 2020 and $51
thousand for the fiscal year ended June 30, 2019.
(d) Student Employee Retirement Program
Eligible student employees contribute 7.5 percent of covered payroll to the student employee retirement
program (SERP). The SERP is funded entirely through employee contributions with no employer match.
The SERP is a mandatory plan for all student employees who are enrolled at CSU but are not classified as
a half time student or greater. The SERP was established pursuant to state statute (C.R.S. § 24-54.6-101
through 24-54.6-106) as a mandatory nonqualified plan under 403(b) of the IRC in lieu of mandatory old
age, survivors, and disability insurance (OASDI) coverage. The student retirement plan is a defined
contribution plan administered by the individual agencies that make up the System, as applicable. All
contributions are vested immediately and are participant directed within the funds available through the sole
investment company, TIAA CREF. The contribution by student employees for the fiscal years ended June
30, 2020 and 2019 was approximately $1.3 million and $1.1 million, respectively.
82
COLORADO STATE UNIVERSITY SYSTEM
Notes to Basic Financial Statements
Years Ended June 30, 2020 and 2019
(Amounts expressed in thousands)
(e) Health Insurance Programs
The System’s contribution to the various third-party health insurance programs was approximately $24.9
million and $23.0 million for the fiscal years ended June 30, 2020 and 2019, respectively.
(19) Risk Financing and Insurance Related Activities
CSU manages a combination of self-insured and fully-insured property and casualty insurance programs to
best protect the University’s assets. At CSU, separate accounts currently make up the self-insured program:
workers’ compensation, liability, auto comprehensive/collision and property. CSU contracts various day-
to-day operations of the self-funded benefit plan, including claims processing, to third-party administrators.
CSU carries excess insurance for liability and workers’ compensation claims over $500 thousand per
occurrence, including claims arising from employment practices. CSU’s excess liability limits for this
insurance are $25.0 million per occurrence. CSU self-insures for property insurance claims less than $100
thousand per occurrence with a $1 thousand deductible per occurrence paid by the university department
incurring the loss. CSU purchases property insurance with limits of $1.0 billion. In addition to this, CSU
carries auto insurance for out-of-state vehicles and workers’ compensation for out-of-state employees,
student intern professional liability, professional liability insurance (Architects & Engineers), crime
insurance, foreign liability insurance, Cyber Liability, Aviation Liability, Unmanned Aerial Vehicles
Liability, TULIP (Tenant User Liability Insurance Program), and self-insures for in-state auto insurance.
As of March 1, 2016, CSU purchased liability, professional liability, and pollution liability for The Center
for Environmental Management Military Lands (CEMML) operations, including their prescribed burn
operations. This insurance included a primary layer of $2.0 million aggregate, an umbrella layer of $5.0
million, and an excess layer of $5.0 million. In October 2017, after Board approval, additional limits were
purchased so that CEMML could manage, and otherwise supervise prescribed burn activities. This resulted
in insurance placed with total limits of liability equaling $50.0 million for CEMML.
In addition to the above, CSU is self-insured for various other risks of loss. At CSU, separate accounts
currently make up the self-insured program: healthcare, dental, short-term disability, and an unallocated
reserve fund. CSU contracts various day-to-day operations of the self-funded benefit plans, including claims
processing, to third-party administrators. Program funding is derived from a combination of premiums paid
by benefit plan participants and various institutional match amounts. The self-funded benefit plans are fully
self-insured except for healthcare coverage, which is reinsured for claims expenses above $350 thousand
per covered employee per year. The Unallocated Reserve Account is a general contingency reserve fund for
miscellaneous and unanticipated expenses of the other health related accounts.
The amount of claims and administrative costs for the self-funded plans for the fiscal years ended June 30,
2020 and 2019 did not exceed plan revenues and reserves. Eligible faculty and nonclassified staff employees
may select from various benefit plans and may elect to make premium contributions in the form of a pre-tax
salary reduction.
The above health related programs had estimated claim liabilities of $33.6 million and $30.6 million at
June 30, 2020 and 2019, respectively, which include incurred but not reported claims (IBNR) along with
known claims at year end. These estimates are made through a combination of analyzing payments in early
months of the subsequent year, historical trends, industry guidelines, and underwriting advice from our
third-party administrator and benefits consultant.
In addition to these claims, workers’ compensation had estimated claim liabilities of $3.1 million and $3.5
million at June 30, 2020 and 2019, respectively. Liability self-insurance had estimated claim liabilities of
$406 thousand and $895 thousand at June 30, 2020 and 2019, respectively. These estimates are based on
83
COLORADO STATE UNIVERSITY SYSTEM
Notes to Basic Financial Statements
Years Ended June 30, 2020 and 2019
(Amounts expressed in thousands)
current data and actuarial reports. Property self-insurance had no estimated claim liabilities at June 30, 2020
and 2019.
The changes in the balance of claim liabilities were as follows:
Table 19.1 Claim Liabilities
2020 2019
Claim liabilities, beginning of year $ 34,975 30,548
Incurred claims (including IBNR) 62,264 62,504
Claim payments (60,165) (58,077)
Claim liabilities, end of year $ 37,074 34,975
Claims liabilities are recorded in accrued liabilities, deposits held for others, and other noncurrent liabilities
on the Statements of Net Position.
(20) Postemployment Healthcare and Life Insurance Benefits
(a) PERA Postemployment Healthcare Plan
Summary of Significant Accounting Policies
The System participates in the Health Care Trust Fund (HCTF), a cost-sharing multiple-employer defined
benefit OPEB fund administered by the Public Employees’ Retirement Association of Colorado (“PERA”).
The net OPEB liability, deferred outflows of resources and deferred inflows of resources related to OPEB,
OPEB expense, information about the fiduciary net position and additions to/deductions from the fiduciary
net position of the HCTF have been determined using the economic resources measurement focus and the
accrual basis of accounting. For this purpose, benefits paid on behalf of healthcare participants are
recognized when due and/or payable in accordance with the benefit terms. Investments are reported at fair
value.
Plan Description
Eligible employees of the System are provided with OPEB through the HCTF—a cost-sharing multiple-
employer defined benefit OPEB plan administered by PERA. The HCTF is established under Title 24,
Article 51, Part 12 of the Colorado Revised Statutes (C.R.S.), as amended. Colorado State law provisions
may be amended from time to time by the Colorado General Assembly. Title 24, Article 51, Part 12 of the
C.R.S., as amended, sets forth a framework that grants authority to the PERA Board to contract, self-insure,
and authorize disbursements necessary in order to carry out the purposes of the PERACare program,
including the administration of the premium subsidies. Colorado State law provisions may be amended from
time to time by the Colorado General Assembly. PERA issues a publicly available comprehensive annual
financial report (CAFR) that can be obtained at www.copera.org/investments/pera-financial-reports.
Benefits Provided
The HCTF provides a healthcare premium subsidy to eligible participating PERA benefit recipients and
retirees who choose to enroll in one of the PERA healthcare plans, however, the subsidy is not available if
only enrolled in the dental and/or vision plan(s). The healthcare premium subsidy is based upon the benefit
structure under which the member retires and the member’s years of service credit. For members who retire
having service credit with employers in the Denver Public Schools (DPS) Division and one or more of the
other four Divisions (State, School, Local Government, and Judicial), the premium subsidy is allocated
between the HCTF and the Denver Public Schools Health Care Trust Fund (DPS HCTF). The basis for the
84
COLORADO STATE UNIVERSITY SYSTEM
Notes to Basic Financial Statements
Years Ended June 30, 2020 and 2019
(Amounts expressed in thousands)
amount of the premium subsidy funded by each trust fund is the percentage of the member contribution
account balance from each division as it relates to the total member contribution account balance from
which the retirement benefit is paid.
C.R.S. § 24-51-1202 et seq. specifies the eligibility for enrollment in the healthcare plans offered by PERA
and the amount of the premium subsidy. The law governing a benefit recipient’s eligibility for the subsidy
and the amount of the subsidy differs slightly depending under which benefit structure the benefits are
calculated. All benefit recipients under the PERA benefit structure are eligible for a premium subsidy, if
enrolled in a healthcare plan under PERACare.
Enrollment in PERACare is voluntary and is available to benefit recipients and their eligible dependents,
certain surviving spouses, and divorced spouses and guardians, among others. Eligible benefit recipients
may enroll in the program upon retirement, upon the occurrence of certain life events, or on an annual basis
during an open enrollment period.
The maximum service-based premium subsidy is $230 per month for benefit recipients who are under 65
years of age and who are not entitled to Medicare; the maximum service-based subsidy is $115 per month
for benefit recipients who are 65 years of age or older or who are under 65 years of age and entitled to
Medicare. The basis for the maximum service-based subsidy, in each case, is for benefit recipients with
retirement benefits based on 20 or more years of service credit. There is a 5.0 percent reduction in the
subsidy for each year less than 20. The benefit recipient pays the remaining portion of the premium to the
extent the subsidy does not cover the entire amount.
For benefit recipients who have not participated in Social Security and who are not otherwise eligible for
premium-free Medicare Part A for hospital-related services, C.R.S. § 24-51-1206(4) provides an additional
subsidy. According to the statute, PERA cannot charge premiums to benefit recipients without Medicare
Part A that are greater than premiums charged to benefit recipients with Part A for the same plan option,
coverage level, and service credit. Currently, for each individual PERACare enrollee, the total premium for
Medicare coverage is determined assuming plan participants have both Medicare Part A and Part B and the
difference in premium cost is paid by the HCTF on behalf of benefit recipients not covered by Medicare
Part A.
Contributions
Pursuant to Title 24, Article 51, Section 208(1)(f) of the C.R.S., as amended, certain contributions are
apportioned to the HCTF. PERA-affiliated employers of the State, School, Local Government, and Judicial
Divisions are required to contribute at a rate of 1.02 percent of PERA-includable salary into the HCTF.
Employer contributions are recognized by the HCTF in the period in which the compensation becomes
payable to the member and the System is statutorily committed to pay the contributions. Employer
contributions recognized by the HCTF from the System were $1.7 million for both fiscal years ended June
30, 2020 and 2019.
OPEB Liabilities, OPEB Expense, and Deferred Outflows of Resources and Deferred Inflows of
Resources Related to OPEB
As of fiscal years ended June 30, 2020 and 2019, the System reported a liability of $20.6 million and $25.7
million, respectively, for its proportionate share of the net OPEB liability. The net OPEB liability for the
HCTF was measured as of December 31, 2019, and the total OPEB liability used to calculate the net OPEB
liability was determined by an actuarial valuation as of December 31, 2018. Standard update procedures
were used to roll-forward the total OPEB liability to December 31, 2019. The System’s proportion of the
85
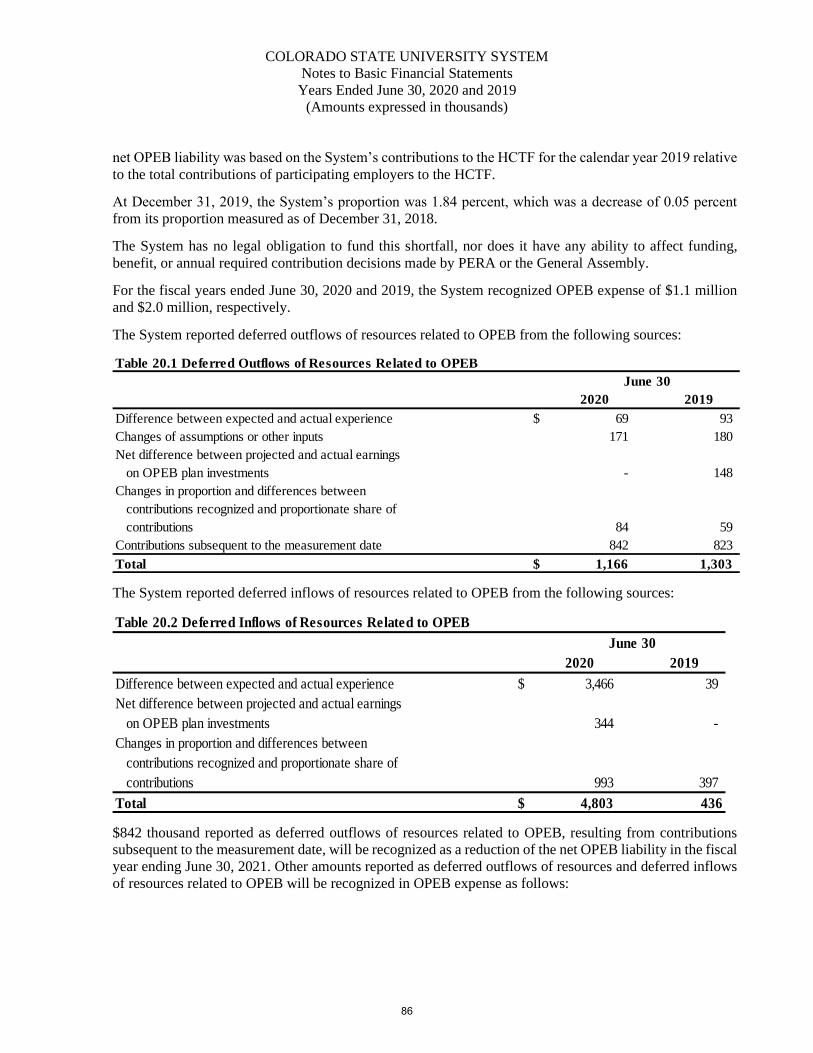
COLORADO STATE UNIVERSITY SYSTEM
Notes to Basic Financial Statements
Years Ended June 30, 2020 and 2019
(Amounts expressed in thousands)
net OPEB liability was based on the System’s contributions to the HCTF for the calendar year 2019 relative
to the total contributions of participating employers to the HCTF.
At December 31, 2019, the System’s proportion was 1.84 percent, which was a decrease of 0.05 percent
from its proportion measured as of December 31, 2018.
The System has no legal obligation to fund this shortfall, nor does it have any ability to affect funding,
benefit, or annual required contribution decisions made by PERA or the General Assembly.
For the fiscal years ended June 30, 2020 and 2019, the System recognized OPEB expense of $1.1 million
and $2.0 million, respectively.
The System reported deferred outflows of resources related to OPEB from the following sources:
Table 20.1 Deferred Outflows of Resources Related to OPEB
2020 2019
Difference between expected and actual experience $ 69 93
Changes of assumptions or other inputs 171 180
Net difference between projected and actual earnings
on OPEB plan investments - 148
Changes in proportion and differences between
contributions recognized and proportionate share of
contributions 84 59
Contributions subsequent to the measurement date 842 823
Total $ 1,166 1,303
June 30
The System reported deferred inflows of resources related to OPEB from the following sources:
Table 20.2 Deferred Inflows of Resources Related to OPEB
2020 2019
Difference between expected and actual experience $ 3,466 39
Net difference between projected and actual earnings
on OPEB plan investments 344 -
Changes in proportion and differences between
contributions recognized and proportionate share of
contributions 993 397
Total $ 4,803 436
June 30
$842 thousand reported as deferred outflows of resources related to OPEB, resulting from contributions
subsequent to the measurement date, will be recognized as a reduction of the net OPEB liability in the fiscal
year ending June 30, 2021. Other amounts reported as deferred outflows of resources and deferred inflows
of resources related to OPEB will be recognized in OPEB expense as follows:
86
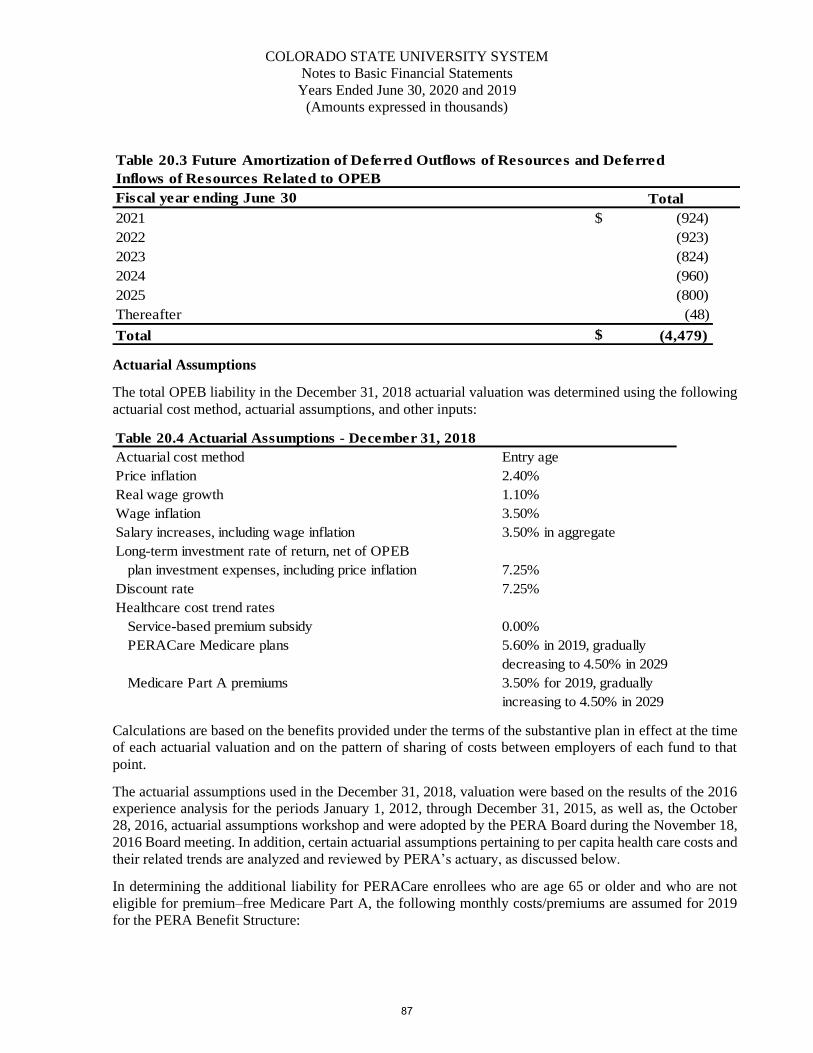
COLORADO STATE UNIVERSITY SYSTEM
Notes to Basic Financial Statements
Years Ended June 30, 2020 and 2019
(Amounts expressed in thousands)
Fiscal year ending June 30 Total
2021 $ (924)
2022 (923)
2023 (824)
2024 (960)
2025 (800)
Thereafter (48)
Total $ (4,479)
Table 20.3 Future Amortization of Deferred Outflows of Resources and Deferred
Inflows of Resources Related to OPEB
Actuarial Assumptions
The total OPEB liability in the December 31, 2018 actuarial valuation was determined using the following
actuarial cost method, actuarial assumptions, and other inputs:
Table 20.4 Actuarial Assumptions - December 31, 2018
Actuarial cost method Entry age
Price inflation 2.40%
Real wage growth 1.10%
Wage inflation 3.50%
Salary increases, including wage inflation 3.50% in aggregate
Long-term investment rate of return, net of OPEB
plan investment expenses, including price inflation 7.25%
Discount rate 7.25%
Healthcare cost trend rates
Service-based premium subsidy 0.00%
PERACare Medicare plans 5.60% in 2019, gradually
decreasing to 4.50% in 2029
Medicare Part A premiums 3.50% for 2019, gradually
increasing to 4.50% in 2029
Calculations are based on the benefits provided under the terms of the substantive plan in effect at the time
of each actuarial valuation and on the pattern of sharing of costs between employers of each fund to that
point.
The actuarial assumptions used in the December 31, 2018, valuation were based on the results of the 2016
experience analysis for the periods January 1, 2012, through December 31, 2015, as well as, the October
28, 2016, actuarial assumptions workshop and were adopted by the PERA Board during the November 18,
2016 Board meeting. In addition, certain actuarial assumptions pertaining to per capita health care costs and
their related trends are analyzed and reviewed by PERA’s actuary, as discussed below.
In determining the additional liability for PERACare enrollees who are age 65 or older and who are not
eligible for premium–free Medicare Part A, the following monthly costs/premiums are assumed for 2019
for the PERA Benefit Structure:
87
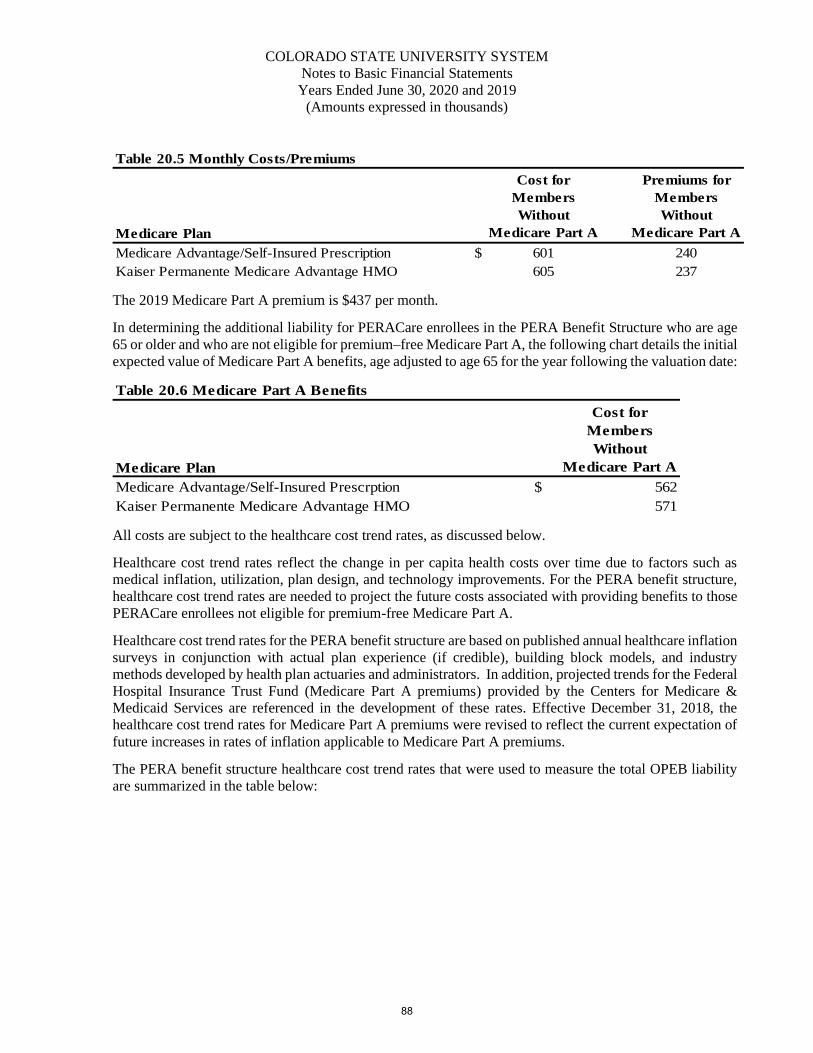
COLORADO STATE UNIVERSITY SYSTEM
Notes to Basic Financial Statements
Years Ended June 30, 2020 and 2019
(Amounts expressed in thousands)
Table 20.5 Monthly Costs/Premiums
Medicare Plan
Cost for
Members
Without
Medicare Part A
Premiums for
Members
Without
Medicare Part A
Medicare Advantage/Self-Insured Prescription $ 601 240
Kaiser Permanente Medicare Advantage HMO 605 237
The 2019 Medicare Part A premium is $437 per month.
In determining the additional liability for PERACare enrollees in the PERA Benefit Structure who are age
65 or older and who are not eligible for premium–free Medicare Part A, the following chart details the initial
expected value of Medicare Part A benefits, age adjusted to age 65 for the year following the valuation date:
Table 20.6 Medicare Part A Benefits
Medicare Plan
Cost for
Members
Without
Medicare Part A
Medicare Advantage/Self-Insured Prescrption $ 562
Kaiser Permanente Medicare Advantage HMO 571
All costs are subject to the healthcare cost trend rates, as discussed below.
Healthcare cost trend rates reflect the change in per capita health costs over time due to factors such as
medical inflation, utilization, plan design, and technology improvements. For the PERA benefit structure,
healthcare cost trend rates are needed to project the future costs associated with providing benefits to those
PERACare enrollees not eligible for premium-free Medicare Part A.
Healthcare cost trend rates for the PERA benefit structure are based on published annual healthcare inflation
surveys in conjunction with actual plan experience (if credible), building block models, and industry
methods developed by health plan actuaries and administrators. In addition, projected trends for the Federal
Hospital Insurance Trust Fund (Medicare Part A premiums) provided by the Centers for Medicare &
Medicaid Services are referenced in the development of these rates. Effective December 31, 2018, the
healthcare cost trend rates for Medicare Part A premiums were revised to reflect the current expectation of
future increases in rates of inflation applicable to Medicare Part A premiums.
The PERA benefit structure healthcare cost trend rates that were used to measure the total OPEB liability
are summarized in the table below:
88
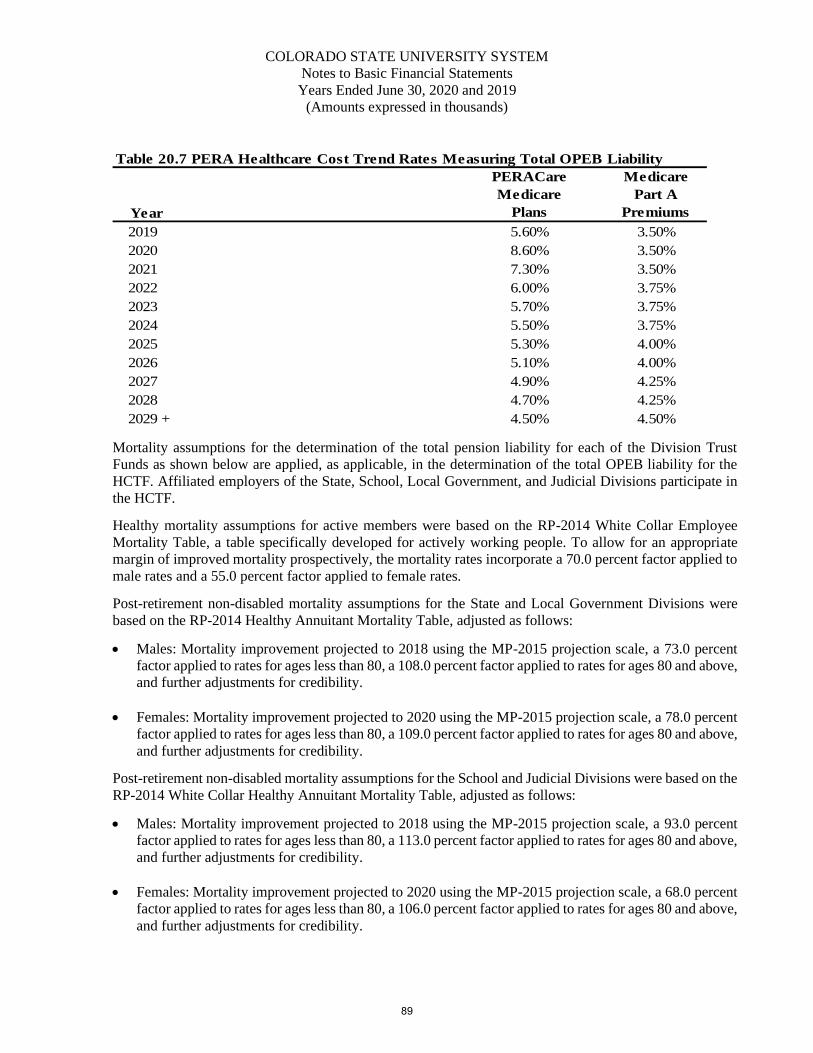
COLORADO STATE UNIVERSITY SYSTEM
Notes to Basic Financial Statements
Years Ended June 30, 2020 and 2019
(Amounts expressed in thousands)
Table 20.7 PERA Healthcare Cost Trend Rates Measuring Total OPEB Liability
Year
PERACare
Medicare
Plans
Medicare
Part A
Premiums
2019 5.60% 3.50%
2020 8.60% 3.50%
2021 7.30% 3.50%
2022 6.00% 3.75%
2023 5.70% 3.75%
2024 5.50% 3.75%
2025 5.30% 4.00%
2026 5.10% 4.00%
2027 4.90% 4.25%
2028 4.70% 4.25%
2029 + 4.50% 4.50%
Mortality assumptions for the determination of the total pension liability for each of the Division Trust
Funds as shown below are applied, as applicable, in the determination of the total OPEB liability for the
HCTF. Affiliated employers of the State, School, Local Government, and Judicial Divisions participate in
the HCTF.
Healthy mortality assumptions for active members were based on the RP-2014 White Collar Employee
Mortality Table, a table specifically developed for actively working people. To allow for an appropriate
margin of improved mortality prospectively, the mortality rates incorporate a 70.0 percent factor applied to
male rates and a 55.0 percent factor applied to female rates.
Post-retirement non-disabled mortality assumptions for the State and Local Government Divisions were
based on the RP-2014 Healthy Annuitant Mortality Table, adjusted as follows:
• Males: Mortality improvement projected to 2018 using the MP-2015 projection scale, a 73.0 percent
factor applied to rates for ages less than 80, a 108.0 percent factor applied to rates for ages 80 and above,
and further adjustments for credibility.
• Females: Mortality improvement projected to 2020 using the MP-2015 projection scale, a 78.0 percent
factor applied to rates for ages less than 80, a 109.0 percent factor applied to rates for ages 80 and above,
and further adjustments for credibility.
Post-retirement non-disabled mortality assumptions for the School and Judicial Divisions were based on the
RP-2014 White Collar Healthy Annuitant Mortality Table, adjusted as follows:
• Males: Mortality improvement projected to 2018 using the MP-2015 projection scale, a 93.0 percent
factor applied to rates for ages less than 80, a 113.0 percent factor applied to rates for ages 80 and above,
and further adjustments for credibility.
• Females: Mortality improvement projected to 2020 using the MP-2015 projection scale, a 68.0 percent
factor applied to rates for ages less than 80, a 106.0 percent factor applied to rates for ages 80 and above,
and further adjustments for credibility.
89
COLORADO STATE UNIVERSITY SYSTEM
Notes to Basic Financial Statements
Years Ended June 30, 2020 and 2019
(Amounts expressed in thousands)
For disabled retirees, the mortality assumption was based on 90.0 percent of the RP-2014 Disabled Retiree
Mortality Table.
The following healthcare costs assumptions were updated and used in the measurement of the obligations
for the HCTF:
• Initial per capita healthcare costs for those PERACare enrollees under the PERA benefit structure who
are expected to attain age 65 and older ages and are not eligible for premium-free Medicare Part A
benefits were updated to reflect the change in costs for the 2019 plan year.
• The morbidity assumptions were updated to reflect the assumed standard aging factors.
• The healthcare cost trend rates for Medicare Part A premiums were revised to reflect the then-current
expectation of future increases in rates of inflation applicable to Medicare Part A premiums.
The long-term expected return on plan assets is reviewed as part of regular experience studies prepared
every four or five years for PERA. Recently, this assumption has been reviewed more frequently. The most
recent analyses were outlined in presentations to PERA’s Board on October 28, 2016.
Several factors were considered in evaluating the long-term rate of return assumption for the HCTF,
including long-term historical data, estimates inherent in current market data, and a log-normal distribution
analysis in which best-estimate ranges of expected future real rates of return (expected return, net of
investment expense and inflation) were developed for each major asset class. These ranges were combined
to produce the long-term expected rate of return by weighting the expected future real rates of return by the
target asset allocation percentage and then adding expected inflation.
As of the most recent adoption of the long-term expected rate of return by the PERA Board, the target asset
allocation and best estimates of geometric real rates of return for each major asset class are summarized in
the following table:
90
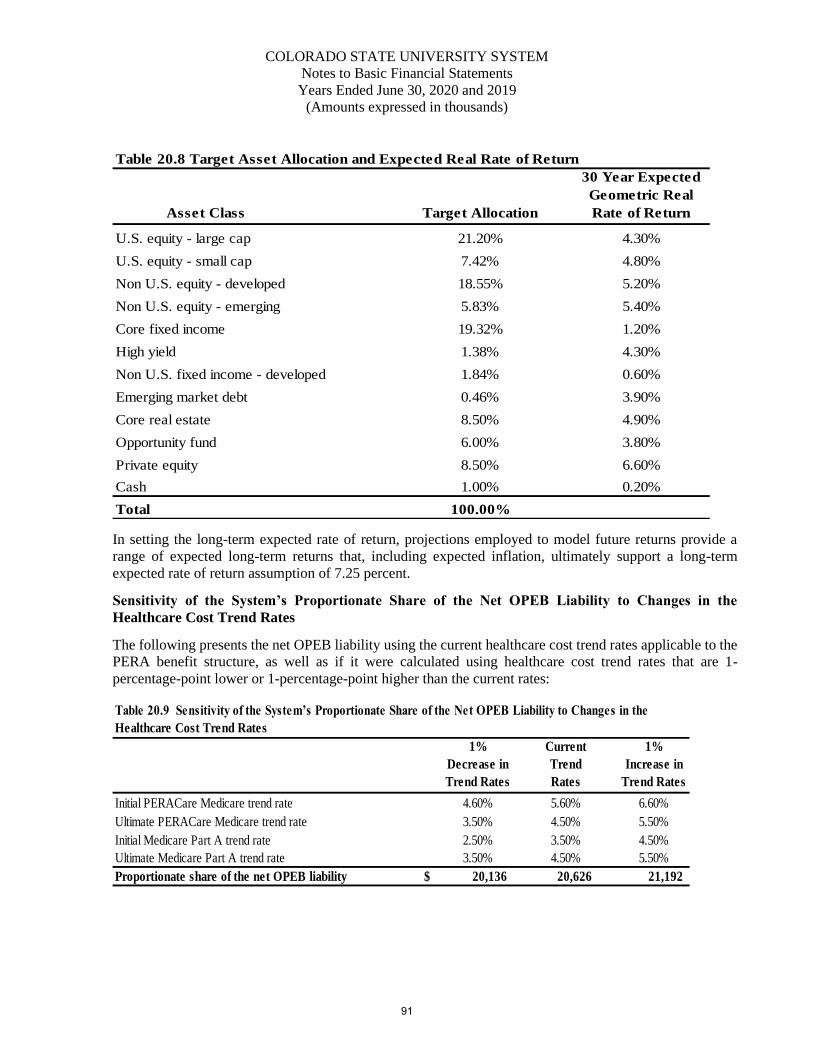
COLORADO STATE UNIVERSITY SYSTEM
Notes to Basic Financial Statements
Years Ended June 30, 2020 and 2019
(Amounts expressed in thousands)
Table 20.8 Target Asset Allocation and Expected Real Rate of Return
Asset Class Target Allocation
30 Year Expected
Geometric Real
Rate of Return
U.S. equity - large cap 21.20% 4.30%
U.S. equity - small cap 7.42% 4.80%
Non U.S. equity - developed 18.55% 5.20%
Non U.S. equity - emerging 5.83% 5.40%
Core fixed income 19.32% 1.20%
High yield 1.38% 4.30%
Non U.S. fixed income - developed 1.84% 0.60%
Emerging market debt 0.46% 3.90%
Core real estate 8.50% 4.90%
Opportunity fund 6.00% 3.80%
Private equity 8.50% 6.60%
Cash 1.00% 0.20%
Total 100.00%
In setting the long-term expected rate of return, projections employed to model future returns provide a
range of expected long-term returns that, including expected inflation, ultimately support a long-term
expected rate of return assumption of 7.25 percent.
Sensitivity of the System’s Proportionate Share of the Net OPEB Liability to Changes in the
Healthcare Cost Trend Rates
The following presents the net OPEB liability using the current healthcare cost trend rates applicable to the
PERA benefit structure, as well as if it were calculated using healthcare cost trend rates that are 1-
percentage-point lower or 1-percentage-point higher than the current rates:
1%
Decrease in
Trend Rates
Current
Trend
Rates
1%
Increase in
Trend Rates
Initial PERACare Medicare trend rate 4.60% 5.60% 6.60%
Ultimate PERACare Medicare trend rate 3.50% 4.50% 5.50%
Initial Medicare Part A trend rate 2.50% 3.50% 4.50%
Ultimate Medicare Part A trend rate 3.50% 4.50% 5.50%
Proportionate share of the net OPEB liability $ 20,136 20,626 21,192
Table 20.9 Sensitivity of the System’s Proportionate Share of the Net OPEB Liability to Changes in the
Healthcare Cost Trend Rates
91
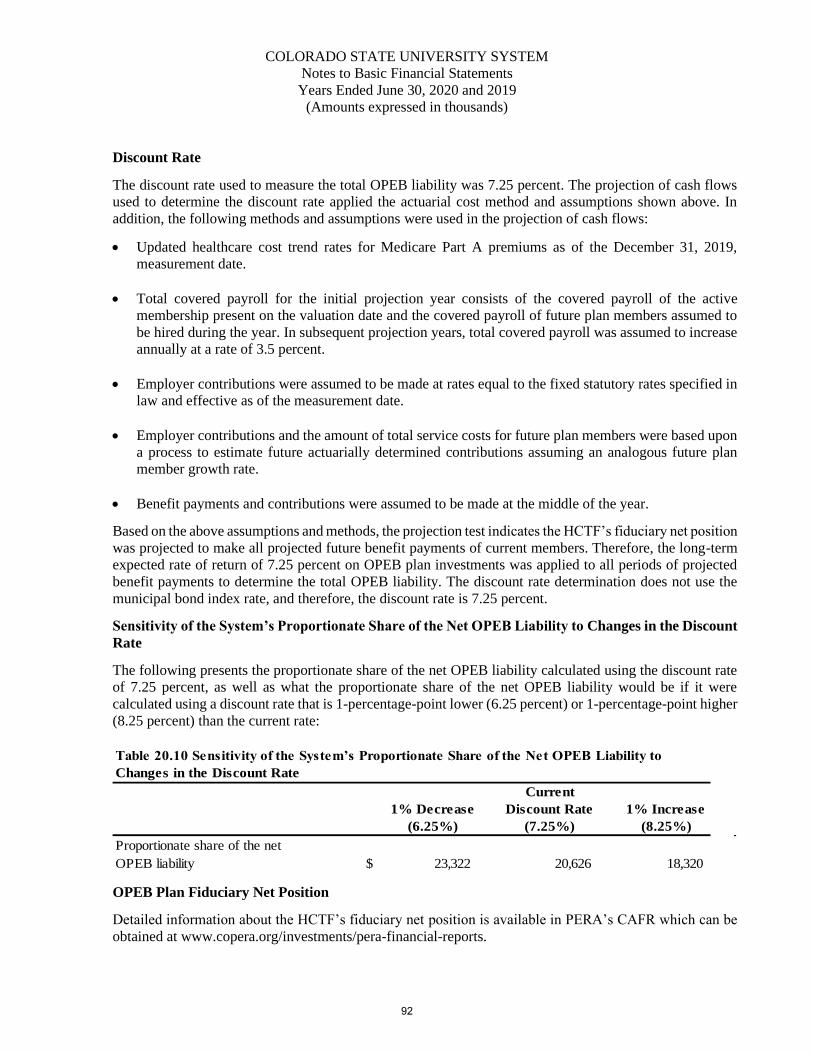
COLORADO STATE UNIVERSITY SYSTEM
Notes to Basic Financial Statements
Years Ended June 30, 2020 and 2019
(Amounts expressed in thousands)
Discount Rate
The discount rate used to measure the total OPEB liability was 7.25 percent. The projection of cash flows
used to determine the discount rate applied the actuarial cost method and assumptions shown above. In
addition, the following methods and assumptions were used in the projection of cash flows:
• Updated healthcare cost trend rates for Medicare Part A premiums as of the December 31, 2019,
measurement date.
• Total covered payroll for the initial projection year consists of the covered payroll of the active
membership present on the valuation date and the covered payroll of future plan members assumed to
be hired during the year. In subsequent projection years, total covered payroll was assumed to increase
annually at a rate of 3.5 percent.
• Employer contributions were assumed to be made at rates equal to the fixed statutory rates specified in
law and effective as of the measurement date.
• Employer contributions and the amount of total service costs for future plan members were based upon
a process to estimate future actuarially determined contributions assuming an analogous future plan
member growth rate.
• Benefit payments and contributions were assumed to be made at the middle of the year.
Based on the above assumptions and methods, the projection test indicates the HCTF’s fiduciary net position
was projected to make all projected future benefit payments of current members. Therefore, the long-term
expected rate of return of 7.25 percent on OPEB plan investments was applied to all periods of projected
benefit payments to determine the total OPEB liability. The discount rate determination does not use the
municipal bond index rate, and therefore, the discount rate is 7.25 percent.
Sensitivity of the System’s Proportionate Share of the Net OPEB Liability to Changes in the Discount
Rate
The following presents the proportionate share of the net OPEB liability calculated using the discount rate
of 7.25 percent, as well as what the proportionate share of the net OPEB liability would be if it were
calculated using a discount rate that is 1-percentage-point lower (6.25 percent) or 1-percentage-point higher
(8.25 percent) than the current rate:
1% Decrease
(6.25%)
Current
Discount Rate
(7.25%)
1% Increase
(8.25%)
Proportionate share of the net
OPEB liability $ 23,322 20,626 18,320
Table 20.10 Sensitivity of the System’s Proportionate Share of the Net OPEB Liability to
Changes in the Discount Rate
OPEB Plan Fiduciary Net Position
Detailed information about the HCTF’s fiduciary net position is available in PERA’s CAFR which can be
obtained at www.copera.org/investments/pera-financial-reports.
92
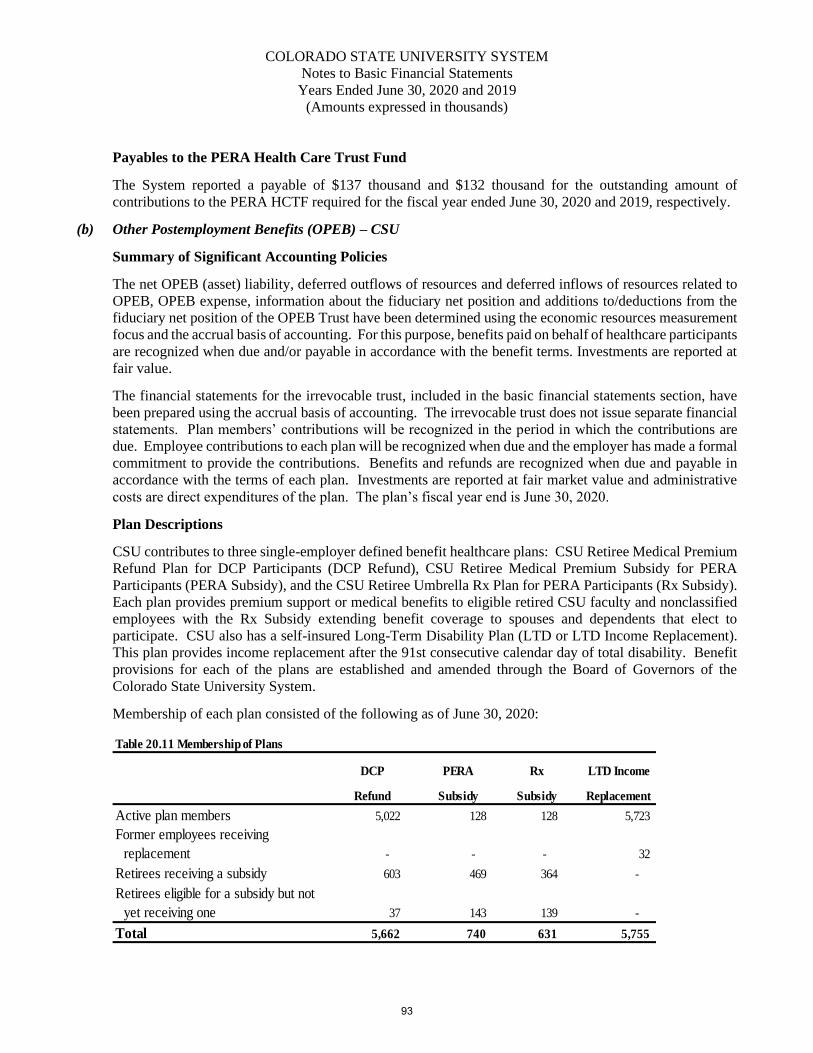
COLORADO STATE UNIVERSITY SYSTEM
Notes to Basic Financial Statements
Years Ended June 30, 2020 and 2019
(Amounts expressed in thousands)
Payables to the PERA Health Care Trust Fund
The System reported a payable of $137 thousand and $132 thousand for the outstanding amount of
contributions to the PERA HCTF required for the fiscal year ended June 30, 2020 and 2019, respectively.
(b) Other Postemployment Benefits (OPEB) – CSU
Summary of Significant Accounting Policies
The net OPEB (asset) liability, deferred outflows of resources and deferred inflows of resources related to
OPEB, OPEB expense, information about the fiduciary net position and additions to/deductions from the
fiduciary net position of the OPEB Trust have been determined using the economic resources measurement
focus and the accrual basis of accounting. For this purpose, benefits paid on behalf of healthcare participants
are recognized when due and/or payable in accordance with the benefit terms. Investments are reported at
fair value.
The financial statements for the irrevocable trust, included in the basic financial statements section, have
been prepared using the accrual basis of accounting. The irrevocable trust does not issue separate financial
statements. Plan members’ contributions will be recognized in the period in which the contributions are
due. Employee contributions to each plan will be recognized when due and the employer has made a formal
commitment to provide the contributions. Benefits and refunds are recognized when due and payable in
accordance with the terms of each plan. Investments are reported at fair market value and administrative
costs are direct expenditures of the plan. The plan’s fiscal year end is June 30, 2020.
Plan Descriptions
CSU contributes to three single-employer defined benefit healthcare plans: CSU Retiree Medical Premium
Refund Plan for DCP Participants (DCP Refund), CSU Retiree Medical Premium Subsidy for PERA
Participants (PERA Subsidy), and the CSU Retiree Umbrella Rx Plan for PERA Participants (Rx Subsidy).
Each plan provides premium support or medical benefits to eligible retired CSU faculty and nonclassified
employees with the Rx Subsidy extending benefit coverage to spouses and dependents that elect to
participate. CSU also has a self-insured Long-Term Disability Plan (LTD or LTD Income Replacement).
This plan provides income replacement after the 91st consecutive calendar day of total disability. Benefit
provisions for each of the plans are established and amended through the Board of Governors of the
Colorado State University System.
Membership of each plan consisted of the following as of June 30, 2020:
Table 20.11 Membership of Plans
DCP PERA Rx LTD Income
Refund Subsidy Subsidy Replacement
Active plan members 5,022 128 128 5,723
Former employees receiving
replacement - - - 32
Retirees receiving a subsidy 603 469 364 -
Retirees eligible for a subsidy but not
yet receiving one 37 143 139 -
Total 5,662 740 631 5,755
93
COLORADO STATE UNIVERSITY SYSTEM
Notes to Basic Financial Statements
Years Ended June 30, 2020 and 2019
(Amounts expressed in thousands)
CSU Retiree Medical Premium Refund Plan for DCP Participants
Employees who retire from the University at age 55 with 20 or more years of service or age 60 with 5 or
more years of service are eligible for this benefit. For eligible retirees with 20 or more years of service,
CSU pays a healthcare premium refund of the lesser of $200 per month or the actual cost of the retiree’s
(not including dependents) health insurance. Benefits are prorated for service between 5 and 20 years. DCP
Refund plan participants include employees who were hired after April 1, 1993, who have no previous
participation in PERA or have less than one year of participation in PERA or employees with at least one
year of previous participation in PERA who elect to enroll in the DCP Refund plan at the time of
appointment. DCP Refund plan participants also include certain employees hired prior to April 1, 1993
who made a one-time, irrevocable election at the time of implementation to terminate participation in PERA
and join the DCP Refund plan. The DCP Refund plan is administered by HealthSmart.
On an annual basis, funds equal to the actuarially determined contribution (ADC), provided by the actuarial
valuation, are transferred to the irrevocable trust. The funds available to cover the plan benefits were $47.3
million for both fiscal years ended June 30, 2020 and 2019. No funds were provided for the benefit of the
program for the fiscal years ended June 30, 2020 and 2019. Total amounts paid to retirees for this healthcare
subsidy were $1.2 million and $1.1 million for the fiscal years ended June 30, 2020 and 2019, respectively.
For the fiscal years ended June 30, 2020 and 2019, the DCP Refund plan had a total OPEB liability of $39.8
million and $34.1 million, respectively, a fiduciary net position of $47.3 million for both years, and a net
OPEB asset of $7.5 million and $13.2 million, respectively. The fiduciary net position as a percentage of
the total OPEB liability was 118.8 percent and 138.7 percent for the fiscal years ended June 30, 2020 and
2019, respectively.
CSU Retiree Medical Premium Subsidy for PERA Participants
University faculty and nonclassified staff participating in the PERA retirement plan who meet CSU’s age
and years of service requirements and retire from the University with at least 10 years of University service,
are eligible to receive a subsidy. Future enrollments are further restricted to those academic faculty and
administrative professional staff participating in the PERA retirement plan and holding benefit eligible
appointments on June 30, 2009. The amount of the subsidy for eligible retirees is their out-of-pocket
expenses for retiree only coverage or an amount equal to the premium for single coverage under the lowest
cost plan available to active faculty and nonclassified staff, whichever is less. The plan is administered by
PERA which bills CSU on a monthly basis for the applicable premiums.
On an annual basis, funds equal to the ADC, provided by the actuarial valuation, are transferred to the
irrevocable trust. The funds available to cover the plan benefits were $24.5 million and $24.8 million for
the fiscal years ended June 30, 2020 and 2019, respectively. No funds were contributed to the plan for the
fiscal years ended June 30, 2020 and 2019. The benefits paid by the University were $900 thousand and
$1.2 million for the fiscal years ended June 30, 2020 and 2019, respectively. For the fiscal years ended June
30, 2020 and 2019, the PERA Subsidy plan had a total OPEB liability of $19.3 million and $19.0 million,
respectively, a fiduciary net position of $24.5 million and $24.8 million, respectively, and a net OPEB asset
of $5.2 million and $5.8 million, respectively. The fiduciary net position as a percentage of the total OPEB
liability was 127.0 percent and 130.9 percent for the fiscal years ended June 30, 2020 and 2019, respectively.
CSU Retiree Umbrella Rx Plan for PERA Participants
The University provides reimbursement for the prescription copayments made by eligible faculty and
nonclassified staff who retire from the University under the PERA retirement plan with at least 10 years of
service. Retirees have to be age 65 or older or eligible for Medicare and enrolled in the PERA Medicare
supplement plan to be eligible for this plan. Future enrollments are further restricted to those academic
94
COLORADO STATE UNIVERSITY SYSTEM
Notes to Basic Financial Statements
Years Ended June 30, 2020 and 2019
(Amounts expressed in thousands)
faculty and administrative professional staff participating in the PERA retirement plan and holding benefit
eligible appointments on June 30, 2009. PERA provides a prescription insurance program for retirees
enrolled in any medical insurance plan. The PERACare Prescription insurance program covers the cost of
prescriptions after the member pays a copay which varies depending on whether the prescription is
purchased through a local retail pharmacy or through a mail-order pharmacy, and whether the drug is generic
or a brand-name drug. The Umbrella Rx plan reimburses the retiree for the complete cost of the prescription
copay less a $10 copay for retail and a $20 copay for mail-order drugs. Spouses and dependents of retirees
enrolled in the plan can be covered with the payment of $44 per month for those enrolled in Medicare or
$99 per month for those not enrolled in Medicare. The plan is administered by Employee Benefit
Management Services, Inc.
On an annual basis, funds equal to the ADC, provided by the actuarial valuation, are transferred to the
irrevocable trust. The funds contributed to the plan for the fiscal years ended June 30, 2020 and 2019 were
$160 thousand and $177 thousand, respectively. These funds, along with the amounts paid in by participants
of $24 thousand in fiscal year 2020, and the related interest income, have resulted in total funds available
of $1.1 million and $1.0 million as of fiscal years ended June 30, 2020 and 2019, respectively, for this plan.
Plan members were reimbursed $75 thousand and $80 thousand for prescription claims for the fiscal years
ended June 30, 2020 and 2019, respectively. For the fiscal years ended June 30, 2020 and 2019, the Rx
Subsidy plan had a total OPEB liability of $2.6 million for both years, a fiduciary net position of $1.1 million
and $1.0 million, respectively, and a net OPEB liability of $1.5 million and $1.6 million, respectively. The
fiduciary net position as a percentage of the total OPEB liability was 40.8 percent and 38.5 percent for the
fiscal years ended June 30, 2020 and 2019, respectively.
CSU Long-Term Disability Plan
The University contributes to the LTD Income Replacement plan. This plan provides a monthly income
replacement benefit which begins on the 91st consecutive calendar day of total disability. The LTD
coverage provides the eligible PERA or Federal Retirement Plan participants with up to 60.0 percent of pre-
disability covered monthly salary, not to exceed $22,500 per month, or up to 69.0 percent of covered
monthly salary, not to exceed $25,875 per month for DCP participants. The income replacement benefit
will increase 3.0 percent annually. The plan is offset by any other benefits or earnings received or eligible
to be received from other sources such as PERA, Federal Retirement, Social Security, or Workers’
Compensation. The minimum income replacement benefit is $50 per month. Employees are eligible to
receive benefits until one of the following circumstances occur: recovery, death, age 65 if disabled when
less than 60, four and three-fourths years if disabled between the ages of 60 and 65, or age 70 if disabled
between the ages of 65 and 68 ¾. This plan is administered by SunLife Financial.
CSU funds the LTD Income Replacement plan by providing an allowance to each employee and then
deducting the cost of the premium. The premiums collected are transferred to the irrevocable trust as an
employee contribution. The funds contributed to the plan for the fiscal years ended June 30, 2020 and 2019
were $1.8 million and $1.6 million, respectively. These funds, which include those previously set aside and
the related interest income, have resulted in total funds available of $11.7 million and $10.8 million as of
fiscal years ended June 30, 2020 and 2019, respectively. Plan members received $1.1 million and $896
thousand in benefits for the fiscal years ended June 30, 2020 and 2019, respectively. For the fiscal years
ended June 30, 2020 and 2019, the LTD Income Replacement plan had a total OPEB liability of $15.3
million and $10.0 million, respectively, a fiduciary net position of $11.7 million and $10.8 million,
respectively, and a net OPEB liability of $3.6 million and a net OPEB asset of $841 thousand, respectively.
The fiduciary net position as a percentage of the total OPEB liability was 76.7 percent and 108.4 percent
for the fiscal years ended June 30, 2020 and 2019, respectively.
95
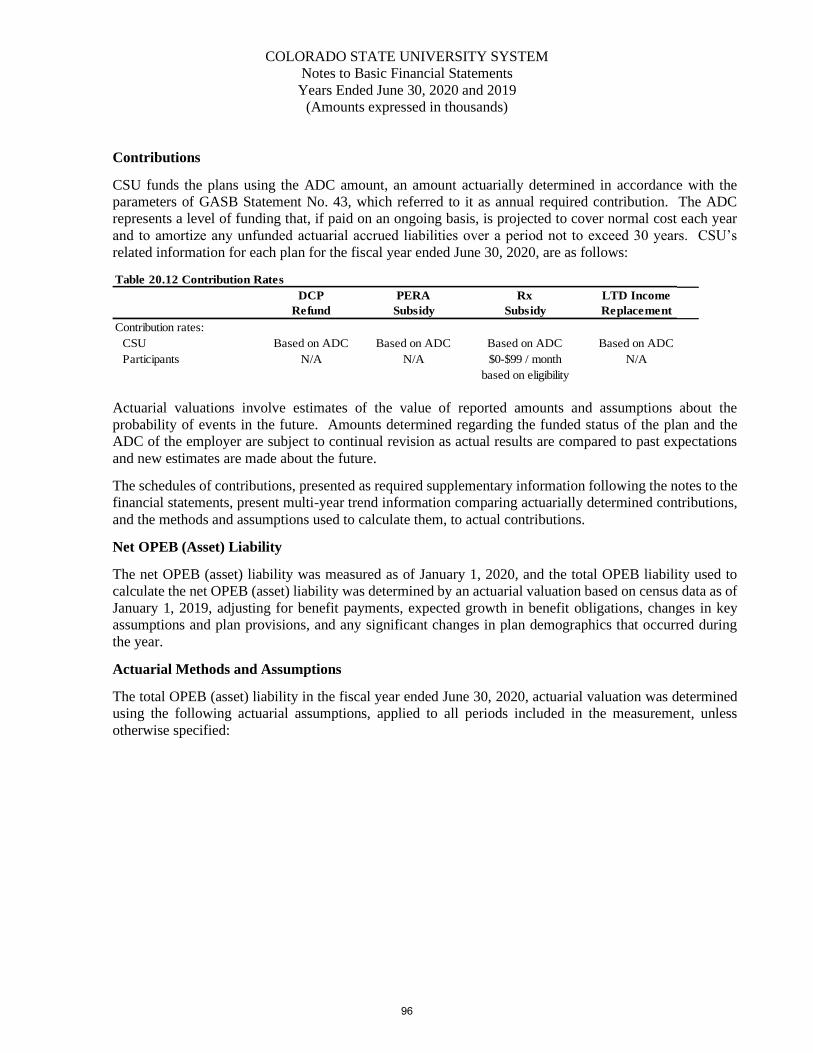
COLORADO STATE UNIVERSITY SYSTEM
Notes to Basic Financial Statements
Years Ended June 30, 2020 and 2019
(Amounts expressed in thousands)
Contributions
CSU funds the plans using the ADC amount, an amount actuarially determined in accordance with the
parameters of GASB Statement No. 43, which referred to it as annual required contribution. The ADC
represents a level of funding that, if paid on an ongoing basis, is projected to cover normal cost each year
and to amortize any unfunded actuarial accrued liabilities over a period not to exceed 30 years. CSU’s
related information for each plan for the fiscal year ended June 30, 2020, are as follows:
Table 20.12 Contribution Rates
DCP PERA Rx LTD Income
Refund Subsidy Subsidy Replacement
Contribution rates:
CSU Based on ADC Based on ADC Based on ADC Based on ADC
Participants N/A N/A $0-$99 / month N/A
based on eligibility
Actuarial valuations involve estimates of the value of reported amounts and assumptions about the
probability of events in the future. Amounts determined regarding the funded status of the plan and the
ADC of the employer are subject to continual revision as actual results are compared to past expectations
and new estimates are made about the future.
The schedules of contributions, presented as required supplementary information following the notes to the
financial statements, present multi-year trend information comparing actuarially determined contributions,
and the methods and assumptions used to calculate them, to actual contributions.
Net OPEB (Asset) Liability
The net OPEB (asset) liability was measured as of January 1, 2020, and the total OPEB liability used to
calculate the net OPEB (asset) liability was determined by an actuarial valuation based on census data as of
January 1, 2019, adjusting for benefit payments, expected growth in benefit obligations, changes in key
assumptions and plan provisions, and any significant changes in plan demographics that occurred during
the year.
Actuarial Methods and Assumptions
The total OPEB (asset) liability in the fiscal year ended June 30, 2020, actuarial valuation was determined
using the following actuarial assumptions, applied to all periods included in the measurement, unless
otherwise specified:
96
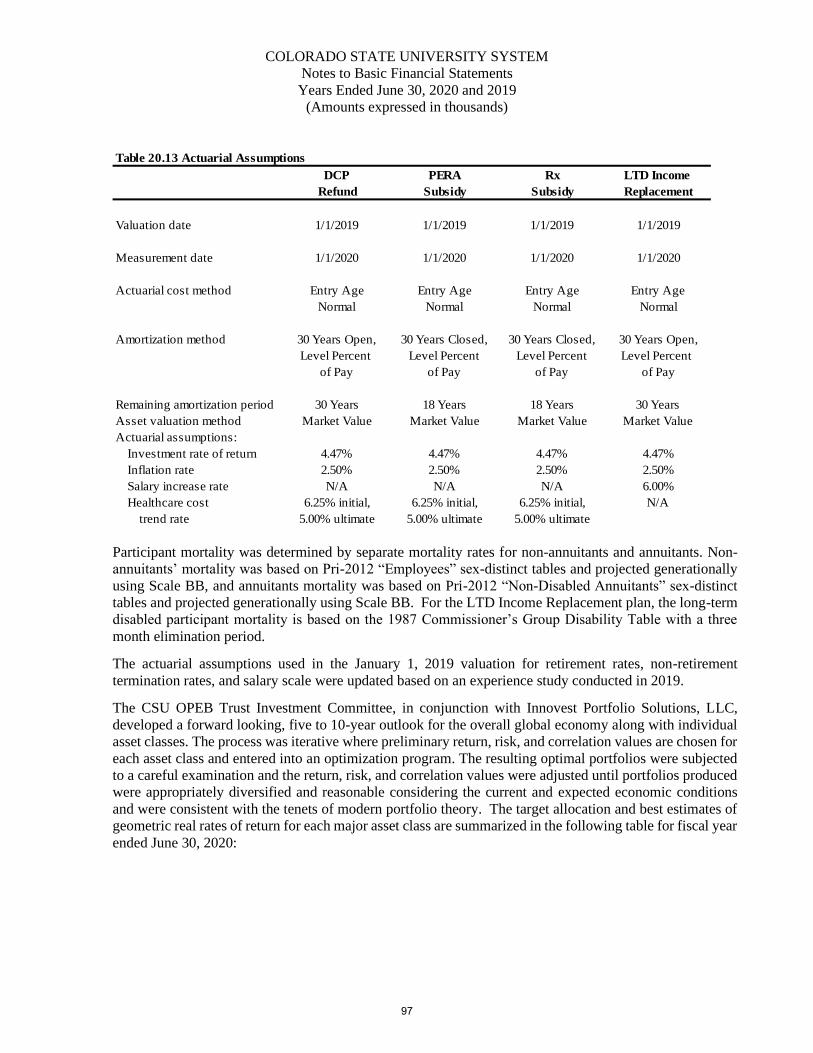
COLORADO STATE UNIVERSITY SYSTEM
Notes to Basic Financial Statements
Years Ended June 30, 2020 and 2019
(Amounts expressed in thousands)
Table 20.13 Actuarial Assumptions
DCP PERA Rx LTD Income
Refund Subsidy Subsidy Replacement
Valuation date 1/1/2019 1/1/2019 1/1/2019 1/1/2019
Measurement date 1/1/2020 1/1/2020 1/1/2020 1/1/2020
Actuarial cost method Entry Age Entry Age Entry Age Entry Age
Normal Normal Normal Normal
Amortization method 30 Years Open, 30 Years Closed, 30 Years Closed, 30 Years Open,
Level Percent Level Percent Level Percent Level Percent
of Pay of Pay of Pay of Pay
Remaining amortization period 30 Years 18 Years 18 Years 30 Years
Asset valuation method Market Value Market Value Market Value Market Value
Actuarial assumptions:
Investment rate of return 4.47% 4.47% 4.47% 4.47%
Inflation rate 2.50% 2.50% 2.50% 2.50%
Salary increase rate N/A N/A N/A 6.00%
Healthcare cost 6.25% initial, 6.25% initial, 6.25% initial, N/A
trend rate 5.00% ultimate 5.00% ultimate 5.00% ultimate
Participant mortality was determined by separate mortality rates for non-annuitants and annuitants. Non-
annuitants’ mortality was based on Pri-2012 “Employees” sex-distinct tables and projected generationally
using Scale BB, and annuitants mortality was based on Pri-2012 “Non-Disabled Annuitants” sex-distinct
tables and projected generationally using Scale BB. For the LTD Income Replacement plan, the long-term
disabled participant mortality is based on the 1987 Commissioner’s Group Disability Table with a three
month elimination period.
The actuarial assumptions used in the January 1, 2019 valuation for retirement rates, non-retirement
termination rates, and salary scale were updated based on an experience study conducted in 2019.
The CSU OPEB Trust Investment Committee, in conjunction with Innovest Portfolio Solutions, LLC,
developed a forward looking, five to 10-year outlook for the overall global economy along with individual
asset classes. The process was iterative where preliminary return, risk, and correlation values are chosen for
each asset class and entered into an optimization program. The resulting optimal portfolios were subjected
to a careful examination and the return, risk, and correlation values were adjusted until portfolios produced
were appropriately diversified and reasonable considering the current and expected economic conditions
and were consistent with the tenets of modern portfolio theory. The target allocation and best estimates of
geometric real rates of return for each major asset class are summarized in the following table for fiscal year
ended June 30, 2020:
97
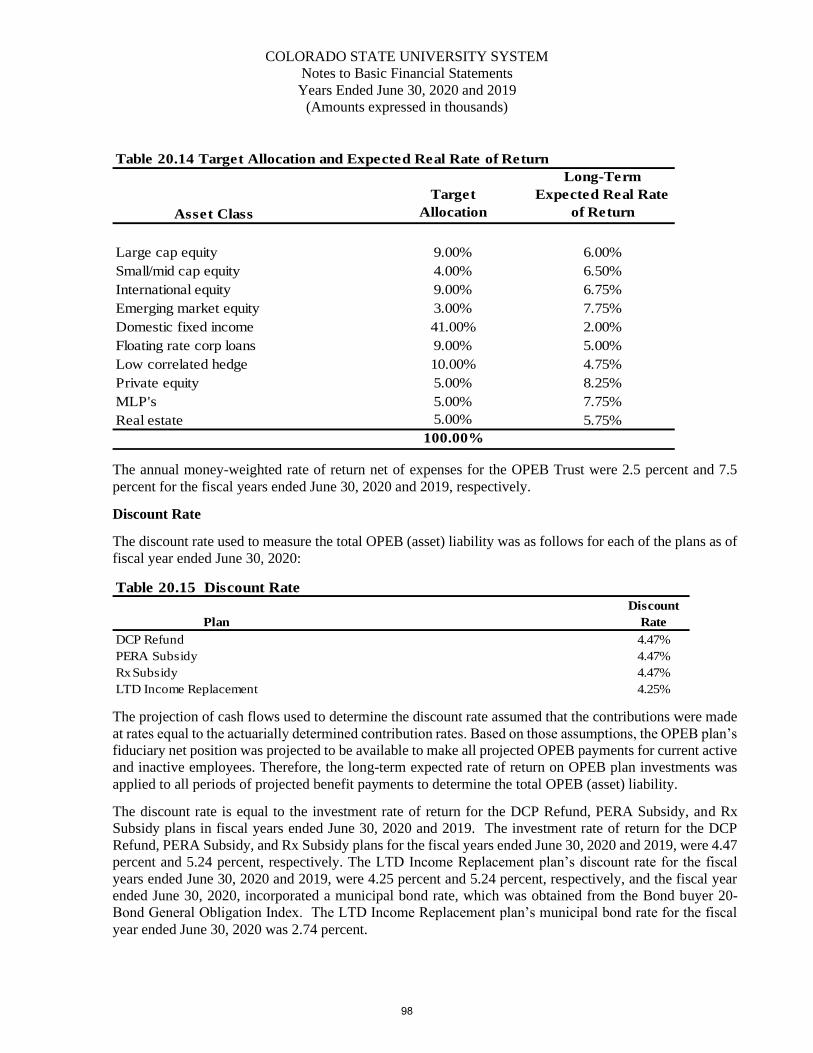
COLORADO STATE UNIVERSITY SYSTEM
Notes to Basic Financial Statements
Years Ended June 30, 2020 and 2019
(Amounts expressed in thousands)
Table 20.14 Target Allocation and Expected Real Rate of Return
Asset Class
Target
Allocation
Long-Term
Expected Real Rate
of Return
Large cap equity 9.00% 6.00%
Small/mid cap equity 4.00% 6.50%
International equity 9.00% 6.75%
Emerging market equity 3.00% 7.75%
Domestic fixed income 41.00% 2.00%
Floating rate corp loans 9.00% 5.00%
Low correlated hedge 10.00% 4.75%
Private equity 5.00% 8.25%
MLP's 5.00% 7.75%
Real estate 5.00% 5.75%
100.00%
The annual money-weighted rate of return net of expenses for the OPEB Trust were 2.5 percent and 7.5
percent for the fiscal years ended June 30, 2020 and 2019, respectively.
Discount Rate
The discount rate used to measure the total OPEB (asset) liability was as follows for each of the plans as of
fiscal year ended June 30, 2020:
Table 20.15 Discount Rate
Discount
Plan Rate
DCP Refund 4.47%
PERA Subsidy 4.47%
Rx Subsidy 4.47%
LTD Income Replacement 4.25%
The projection of cash flows used to determine the discount rate assumed that the contributions were made
at rates equal to the actuarially determined contribution rates. Based on those assumptions, the OPEB plan’s
fiduciary net position was projected to be available to make all projected OPEB payments for current active
and inactive employees. Therefore, the long-term expected rate of return on OPEB plan investments was
applied to all periods of projected benefit payments to determine the total OPEB (asset) liability.
The discount rate is equal to the investment rate of return for the DCP Refund, PERA Subsidy, and Rx
Subsidy plans in fiscal years ended June 30, 2020 and 2019. The investment rate of return for the DCP
Refund, PERA Subsidy, and Rx Subsidy plans for the fiscal years ended June 30, 2020 and 2019, were 4.47
percent and 5.24 percent, respectively. The LTD Income Replacement plan’s discount rate for the fiscal
years ended June 30, 2020 and 2019, were 4.25 percent and 5.24 percent, respectively, and the fiscal year
ended June 30, 2020, incorporated a municipal bond rate, which was obtained from the Bond buyer 20-
Bond General Obligation Index. The LTD Income Replacement plan’s municipal bond rate for the fiscal
year ended June 30, 2020 was 2.74 percent.
98
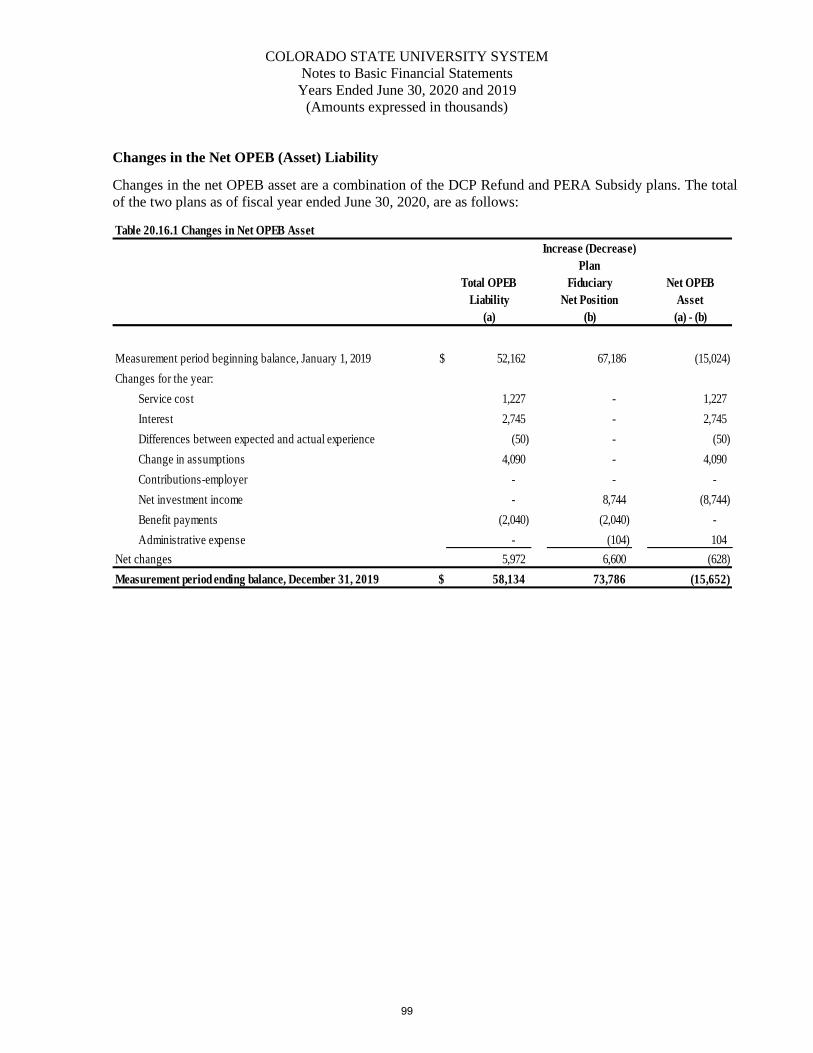
COLORADO STATE UNIVERSITY SYSTEM
Notes to Basic Financial Statements
Years Ended June 30, 2020 and 2019
(Amounts expressed in thousands)
Changes in the Net OPEB (Asset) Liability
Changes in the net OPEB asset are a combination of the DCP Refund and PERA Subsidy plans. The total
of the two plans as of fiscal year ended June 30, 2020, are as follows:
Table 20.16.1 Changes in Net OPEB Asset
Plan
Total OPEB Fiduciary Net OPEB
Liability Net Position Asset
(a) (b) (a) - (b)
Measurement period beginning balance, January 1, 2019 $ 52,162 67,186 (15,024)
Changes for the year:
Service cost 1,227 - 1,227
Interest 2,745 - 2,745
Differences between expected and actual experience (50) - (50)
Change in assumptions 4,090 - 4,090
Contributions-employer - - -
Net investment income - 8,744 (8,744)
Benefit payments (2,040) (2,040) -
Administrative expense - (104) 104
Net changes 5,972 6,600 (628)
Measurement period ending balance, December 31, 2019 $ 58,134 73,786 (15,652)
Increase (Decrease)
99
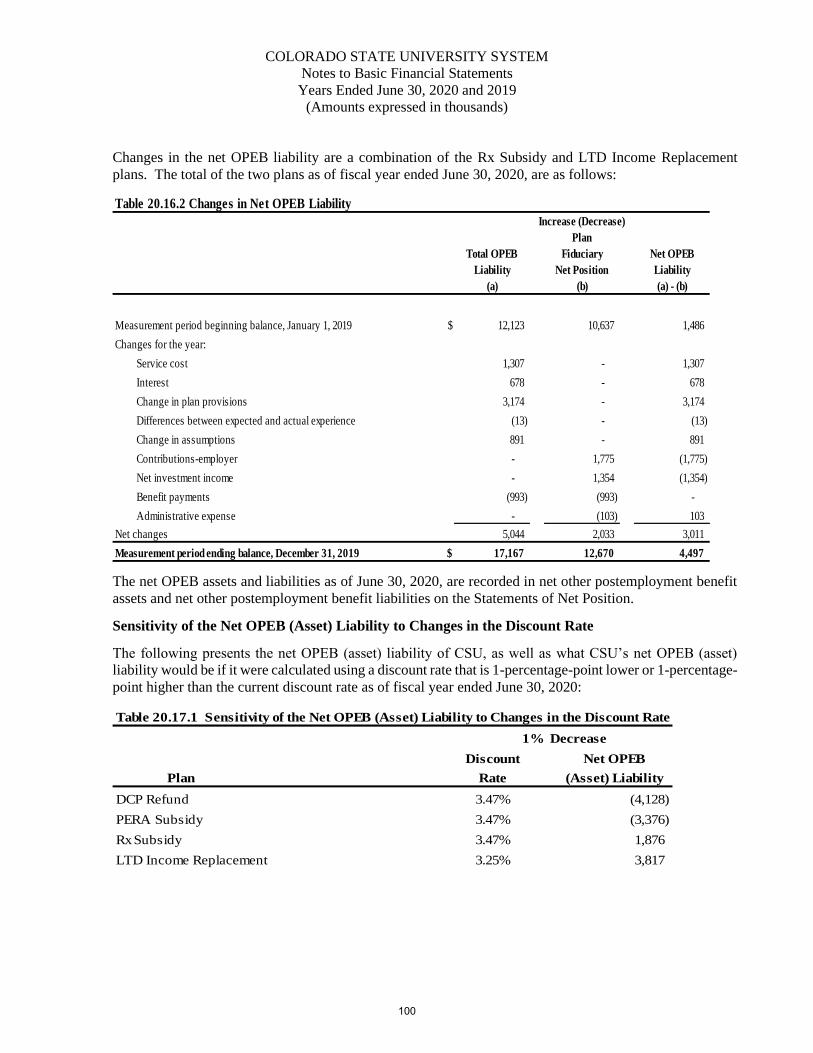
COLORADO STATE UNIVERSITY SYSTEM
Notes to Basic Financial Statements
Years Ended June 30, 2020 and 2019
(Amounts expressed in thousands)
Changes in the net OPEB liability are a combination of the Rx Subsidy and LTD Income Replacement
plans. The total of the two plans as of fiscal year ended June 30, 2020, are as follows:
Table 20.16.2 Changes in Net OPEB Liability
Plan
Total OPEB Fiduciary Net OPEB
Liability Net Position Liability
(a) (b) (a) - (b)
Measurement period beginning balance, January 1, 2019 $ 12,123 10,637 1,486
Changes for the year:
Service cost 1,307 - 1,307
Interest 678 - 678
Change in plan provisions 3,174 - 3,174
Differences between expected and actual experience (13) - (13)
Change in assumptions 891 - 891
Contributions-employer - 1,775 (1,775)
Net investment income - 1,354 (1,354)
Benefit payments (993) (993) -
Administrative expense - (103) 103
Net changes 5,044 2,033 3,011
Measurement period ending balance, December 31, 2019 $ 17,167 12,670 4,497
Increase (Decrease)
The net OPEB assets and liabilities as of June 30, 2020, are recorded in net other postemployment benefit
assets and net other postemployment benefit liabilities on the Statements of Net Position.
Sensitivity of the Net OPEB (Asset) Liability to Changes in the Discount Rate
The following presents the net OPEB (asset) liability of CSU, as well as what CSU’s net OPEB (asset)
liability would be if it were calculated using a discount rate that is 1-percentage-point lower or 1-percentage-
point higher than the current discount rate as of fiscal year ended June 30, 2020:
Table 20.17.1 Sensitivity of the Net OPEB (Asset) Liability to Changes in the Discount Rate
Discount Net OPEB
Plan Rate (Asset) Liability
DCP Refund 3.47% (4,128)
PERA Subsidy 3.47% (3,376)
Rx Subsidy 3.47% 1,876
LTD Income Replacement 3.25% 3,817
1% Decrease
100
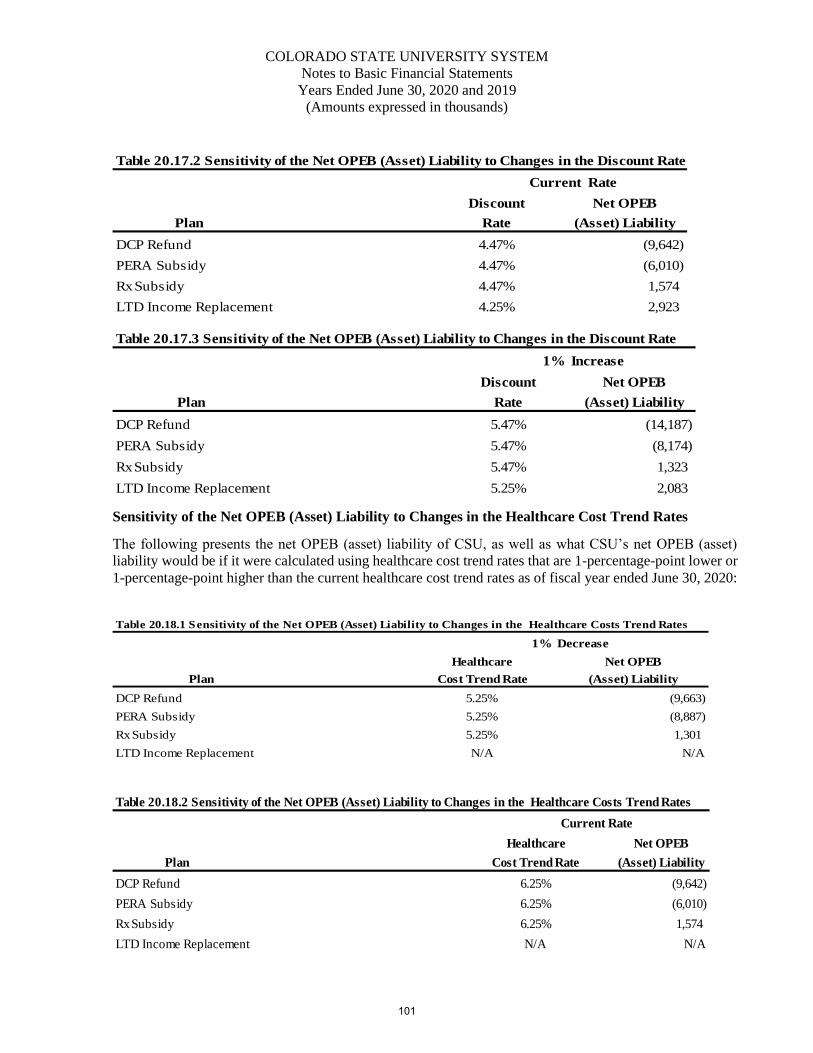
COLORADO STATE UNIVERSITY SYSTEM
Notes to Basic Financial Statements
Years Ended June 30, 2020 and 2019
(Amounts expressed in thousands)
Table 20.17.2 Sensitivity of the Net OPEB (Asset) Liability to Changes in the Discount Rate
Discount Net OPEB
Plan Rate (Asset) Liability
DCP Refund 4.47% (9,642)
PERA Subsidy 4.47% (6,010)
Rx Subsidy 4.47% 1,574
LTD Income Replacement 4.25% 2,923
Current Rate
Table 20.17.3 Sensitivity of the Net OPEB (Asset) Liability to Changes in the Discount Rate
Discount Net OPEB
Plan Rate (Asset) Liability
DCP Refund 5.47% (14,187)
PERA Subsidy 5.47% (8,174)
Rx Subsidy 5.47% 1,323
LTD Income Replacement 5.25% 2,083
1% Increase
Sensitivity of the Net OPEB (Asset) Liability to Changes in the Healthcare Cost Trend Rates
The following presents the net OPEB (asset) liability of CSU, as well as what CSU’s net OPEB (asset)
liability would be if it were calculated using healthcare cost trend rates that are 1-percentage-point lower or
1-percentage-point higher than the current healthcare cost trend rates as of fiscal year ended June 30, 2020:
Healthcare Net OPEB
Plan Cost Trend Rate (Asset) Liability
DCP Refund 5.25% (9,663)
PERA Subsidy 5.25% (8,887)
Rx Subsidy 5.25% 1,301
LTD Income Replacement N/A N/A
1% Decrease
Table 20.18.1 Sensitivity of the Net OPEB (Asset) Liability to Changes in the Healthcare Costs Trend Rates
Healthcare Net OPEB
Plan Cost Trend Rate (Asset) Liability
DCP Refund 6.25% (9,642)
PERA Subsidy 6.25% (6,010)
Rx Subsidy 6.25% 1,574
LTD Income Replacement N/A N/A
Current Rate
Table 20.18.2 Sensitivity of the Net OPEB (Asset) Liability to Changes in the Healthcare Costs Trend Rates
101
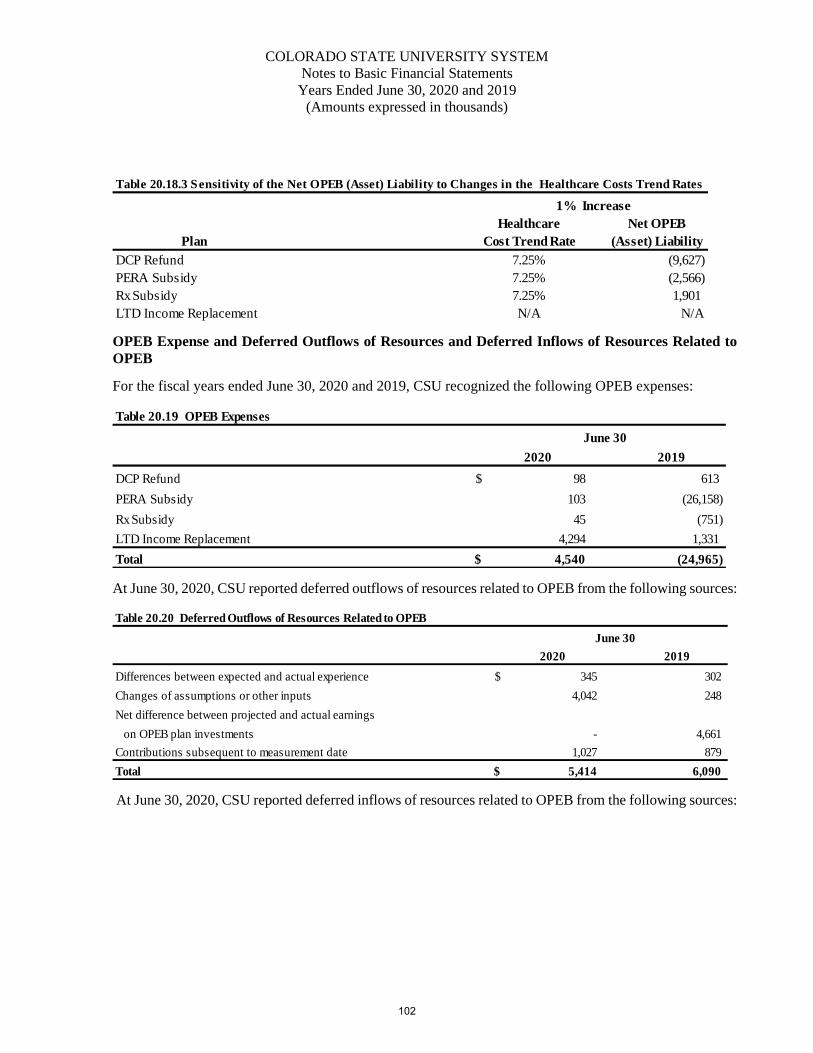
COLORADO STATE UNIVERSITY SYSTEM
Notes to Basic Financial Statements
Years Ended June 30, 2020 and 2019
(Amounts expressed in thousands)
Healthcare Net OPEB
Plan Cost Trend Rate (Asset) Liability
DCP Refund 7.25% (9,627)
PERA Subsidy 7.25% (2,566)
Rx Subsidy 7.25% 1,901
LTD Income Replacement N/A N/A
1% Increase
Table 20.18.3 Sensitivity of the Net OPEB (Asset) Liability to Changes in the Healthcare Costs Trend Rates
OPEB Expense and Deferred Outflows of Resources and Deferred Inflows of Resources Related to
OPEB
For the fiscal years ended June 30, 2020 and 2019, CSU recognized the following OPEB expenses:
Table 20.19 OPEB Expenses
2020 2019
DCP Refund $ 98 613
PERA Subsidy 103 (26,158)
Rx Subsidy 45 (751)
LTD Income Replacement 4,294 1,331
Total $ 4,540 (24,965)
June 30
At June 30, 2020, CSU reported deferred outflows of resources related to OPEB from the following sources:
Table 20.20 Deferred Outflows of Resources Related to OPEB
2020 2019
Differences between expected and actual experience $ 345 302
Changes of assumptions or other inputs 4,042 248
Net difference between projected and actual earnings
on OPEB plan investments - 4,661
Contributions subsequent to measurement date 1,027 879
Total $ 5,414 6,090
June 30
At June 30, 2020, CSU reported deferred inflows of resources related to OPEB from the following sources:
102
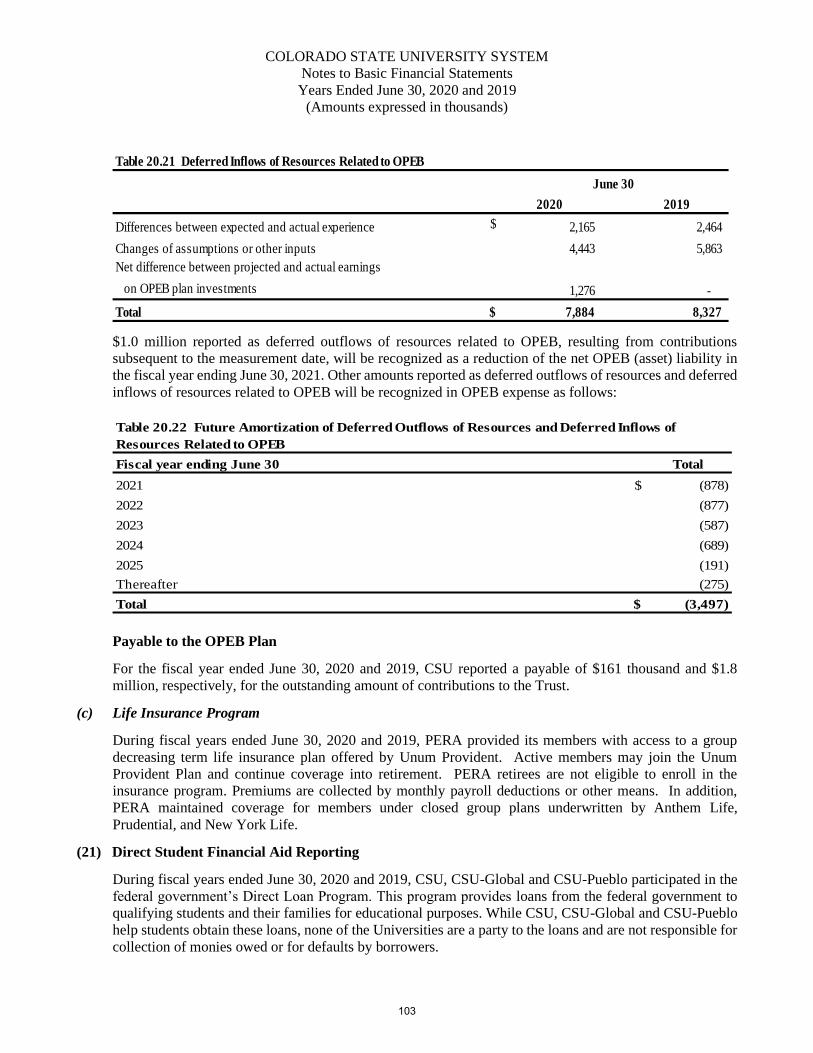
COLORADO STATE UNIVERSITY SYSTEM
Notes to Basic Financial Statements
Years Ended June 30, 2020 and 2019
(Amounts expressed in thousands)
Table 20.21 Deferred Inflows of Resources Related to OPEB
2020 2019
Differences between expected and actual experience $ 2,165 2,464
Changes of assumptions or other inputs 4,443 5,863
Net difference between projected and actual earnings
on OPEB plan investments 1,276 -
Total $ 7,884 8,327
June 30
$1.0 million reported as deferred outflows of resources related to OPEB, resulting from contributions
subsequent to the measurement date, will be recognized as a reduction of the net OPEB (asset) liability in
the fiscal year ending June 30, 2021. Other amounts reported as deferred outflows of resources and deferred
inflows of resources related to OPEB will be recognized in OPEB expense as follows:
Fiscal year ending June 30 Total
2021 $ (878)
2022 (877)
2023 (587)
2024 (689)
2025 (191)
Thereafter (275)
Total $ (3,497)
Table 20.22 Future Amortization of Deferred Outflows of Resources and Deferred Inflows of
Resources Related to OPEB
Payable to the OPEB Plan
For the fiscal year ended June 30, 2020 and 2019, CSU reported a payable of $161 thousand and $1.8
million, respectively, for the outstanding amount of contributions to the Trust.
(c) Life Insurance Program
During fiscal years ended June 30, 2020 and 2019, PERA provided its members with access to a group
decreasing term life insurance plan offered by Unum Provident. Active members may join the Unum
Provident Plan and continue coverage into retirement. PERA retirees are not eligible to enroll in the
insurance program. Premiums are collected by monthly payroll deductions or other means. In addition,
PERA maintained coverage for members under closed group plans underwritten by Anthem Life,
Prudential, and New York Life.
(21) Direct Student Financial Aid Reporting
During fiscal years ended June 30, 2020 and 2019, CSU, CSU-Global and CSU-Pueblo participated in the
federal government’s Direct Loan Program. This program provides loans from the federal government to
qualifying students and their families for educational purposes. While CSU, CSU-Global and CSU-Pueblo
help students obtain these loans, none of the Universities are a party to the loans and are not responsible for
collection of monies owed or for defaults by borrowers.
103
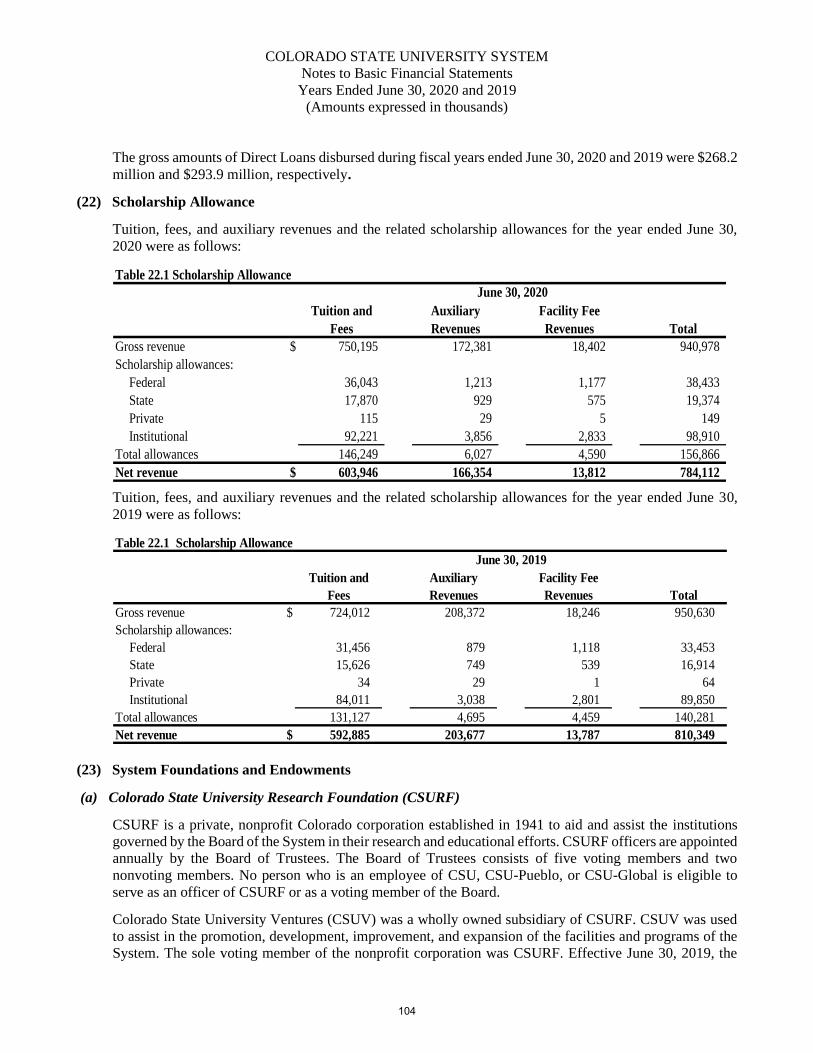
COLORADO STATE UNIVERSITY SYSTEM
Notes to Basic Financial Statements
Years Ended June 30, 2020 and 2019
(Amounts expressed in thousands)
The gross amounts of Direct Loans disbursed during fiscal years ended June 30, 2020 and 2019 were $268.2
million and $293.9 million, respectively.
(22) Scholarship Allowance
Tuition, fees, and auxiliary revenues and the related scholarship allowances for the year ended June 30,
2020 were as follows:
Table 22.1 Scholarship Allowance
Tuition and Auxiliary Facility Fee
Fees Revenues Revenues Total
Gross revenue $ 750,195 172,381 18,402 940,978
Scholarship allowances:
Federal 36,043 1,213 1,177 38,433
State 17,870 929 575 19,374
Private 115 29 5 149
Institutional 92,221 3,856 2,833 98,910
Total allowances 146,249 6,027 4,590 156,866
Net revenue $ 603,946 166,354 13,812 784,112
June 30, 2020
Tuition, fees, and auxiliary revenues and the related scholarship allowances for the year ended June 30,
2019 were as follows:
Table 22.1 Scholarship Allowance
Tuition and Auxiliary Facility Fee
Fees Revenues Revenues Total
Gross revenue $ 724,012 208,372 18,246 950,630
Scholarship allowances:
Federal 31,456 879 1,118 33,453
State 15,626 749 539 16,914
Private 34 29 1 64
Institutional 84,011 3,038 2,801 89,850
Total allowances 131,127 4,695 4,459 140,281
Net revenue $ 592,885 203,677 13,787 810,349
June 30, 2019
(23) System Foundations and Endowments
(a) Colorado State University Research Foundation (CSURF)
CSURF is a private, nonprofit Colorado corporation established in 1941 to aid and assist the institutions
governed by the Board of the System in their research and educational efforts. CSURF officers are appointed
annually by the Board of Trustees. The Board of Trustees consists of five voting members and two
nonvoting members. No person who is an employee of CSU, CSU-Pueblo, or CSU-Global is eligible to
serve as an officer of CSURF or as a voting member of the Board.
Colorado State University Ventures (CSUV) was a wholly owned subsidiary of CSURF. CSUV was used
to assist in the promotion, development, improvement, and expansion of the facilities and programs of the
System. The sole voting member of the nonprofit corporation was CSURF. Effective June 30, 2019, the
104
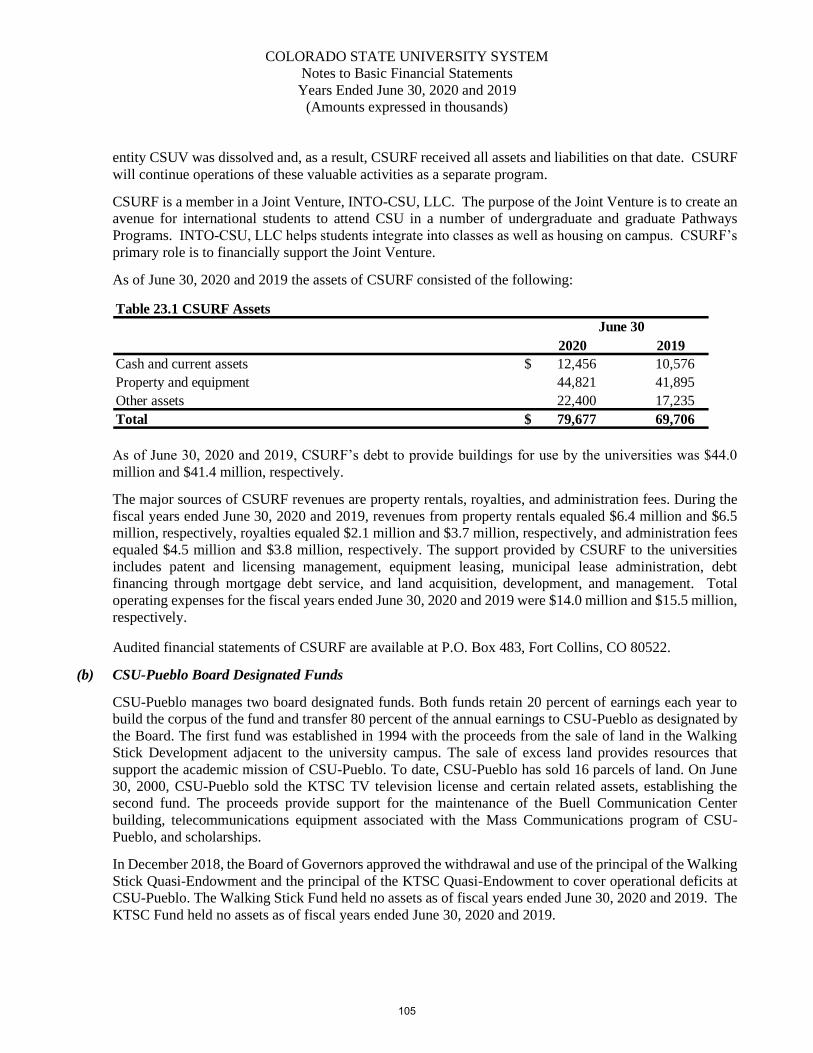
COLORADO STATE UNIVERSITY SYSTEM
Notes to Basic Financial Statements
Years Ended June 30, 2020 and 2019
(Amounts expressed in thousands)
entity CSUV was dissolved and, as a result, CSURF received all assets and liabilities on that date. CSURF
will continue operations of these valuable activities as a separate program.
CSURF is a member in a Joint Venture, INTO-CSU, LLC. The purpose of the Joint Venture is to create an
avenue for international students to attend CSU in a number of undergraduate and graduate Pathways
Programs. INTO-CSU, LLC helps students integrate into classes as well as housing on campus. CSURF’s
primary role is to financially support the Joint Venture.
As of June 30, 2020 and 2019 the assets of CSURF consisted of the following:
Table 23.1 CSURF Assets
2020 2019
Cash and current assets $ 12,456 10,576
Property and equipment 44,821 41,895
Other assets 22,400 17,235
Total $ 79,677 69,706
June 30
As of June 30, 2020 and 2019, CSURF’s debt to provide buildings for use by the universities was $44.0
million and $41.4 million, respectively.
The major sources of CSURF revenues are property rentals, royalties, and administration fees. During the
fiscal years ended June 30, 2020 and 2019, revenues from property rentals equaled $6.4 million and $6.5
million, respectively, royalties equaled $2.1 million and $3.7 million, respectively, and administration fees
equaled $4.5 million and $3.8 million, respectively. The support provided by CSURF to the universities
includes patent and licensing management, equipment leasing, municipal lease administration, debt
financing through mortgage debt service, and land acquisition, development, and management. Total
operating expenses for the fiscal years ended June 30, 2020 and 2019 were $14.0 million and $15.5 million,
respectively.
Audited financial statements of CSURF are available at P.O. Box 483, Fort Collins, CO 80522.
(b) CSU-Pueblo Board Designated Funds
CSU-Pueblo manages two board designated funds. Both funds retain 20 percent of earnings each year to
build the corpus of the fund and transfer 80 percent of the annual earnings to CSU-Pueblo as designated by
the Board. The first fund was established in 1994 with the proceeds from the sale of land in the Walking
Stick Development adjacent to the university campus. The sale of excess land provides resources that
support the academic mission of CSU-Pueblo. To date, CSU-Pueblo has sold 16 parcels of land. On June
30, 2000, CSU-Pueblo sold the KTSC TV television license and certain related assets, establishing the
second fund. The proceeds provide support for the maintenance of the Buell Communication Center
building, telecommunications equipment associated with the Mass Communications program of CSU-
Pueblo, and scholarships.
In December 2018, the Board of Governors approved the withdrawal and use of the principal of the Walking
Stick Quasi-Endowment and the principal of the KTSC Quasi-Endowment to cover operational deficits at
CSU-Pueblo. The Walking Stick Fund held no assets as of fiscal years ended June 30, 2020 and 2019. The
KTSC Fund held no assets as of fiscal years ended June 30, 2020 and 2019.
105
COLORADO STATE UNIVERSITY SYSTEM
Notes to Basic Financial Statements
Years Ended June 30, 2020 and 2019
(Amounts expressed in thousands)
(c) INTO-CSU, LLC
INTO-CSU, LLC is a limited liability company in which CSURF and INTO USA, LLC are members.
CSURF and INTO-USA, LLC each own 50 percent of the common units. INTO-CSU, LLC has entered
into a service agreement with Colorado State University and INTO University Partnerships Limited (IUP)
whereby INTO-CSU, LLC will manage an international student center, located on campus and, in
connection with the services of IUP, be the exclusive provider of marketing and student recruitment services
for the INTO-CSU programs.
As part of the LLC Agreement, CSURF agreed to loan the Joint Venture up to $1.5 million. The promissory
note matures February 2027 with monthly interest payments of five percent due beginning March 2017. In
connection with the agreement for CSURF to loan funds to INTO-CSU, LLC, Colorado State University
has agreed to reimburse CSURF for net funds loaned to the Joint Venture. As of June 30, 2020 and 2019,
the University has booked a receivable for $1.2 million due from CSURF relating to amounts that have been
loaned to the Joint Venture by CSURF. The University has also established a bad debt reserve for $1.2
million. As of June 30, 2020 and 2019, the University has also booked a receivable for $302 thousand and
$243 thousand, respectively, due from CSURF relating to unpaid interest. As of June 30, 2020 and 2019,
the University has also established a bad debt reserve of $302 thousand and $243 thousand, respectively.
The CSURF payment to the University is contingent upon CSURF receiving payments from INTO USA,
LLC. No payments have been received as of June 30, 2020.
(d) CSURF de Mexico, Association Civil (CSURF AC)
CSURF AC operates the campus in Todos Santos Mexico which will further aid CSU in its mission of
teaching, research, and outreach. Education abroad opportunities for CSU students will be available in
wildlife ecology and conservation, agriculture, hospitality, nutrition, ecology, human development and
family studies, the arts and more. The campus in Todos Santos was held in a Trust by a Mexican bank.
During 2015, CSURF AC entered into certain promissory notes with a development partner (MIRA)
whereby CSURF AC borrowed funds from MIRA for the development of the property. The land for the
campus and research farm was to be transferred to the Trust in various phases upon completion and, upon
transfer, MIRA was to forgive the debt. As of March 19, 2019, MIRA transferred the assets to the Trust
and forgave the related debt. Upon those actions, the Trust was dissolved and CSURF gained control of the
remaining portion of this investment and now own 100% of CSURF AC.
(24) State Support
In fiscal year 2006 state support for higher education changed with the implementation of the College
Opportunity Fund. As a result of this legislation, which was adopted in S.B. 04-189 passed in the 2004 state
legislative session, the State no longer provides a direct state general fund appropriation to the System.
Instead, state support is provided to the System in the form of fee for service contracts with the State for the
delivery of special programs, graduate programs, and high cost/high demand programs. In the fiscal years
ended June 30, 2020 and 2019, the System received $122.0 million and $108.4 million, respectively, in state
fee for service contract revenue.
State support was also provided to the System in the form of student tuition stipends provided to students
by the state College Opportunity Fund. In the fiscal years ended June 30, 2020 and 2019, stipends were
provided to students attending classes at Colorado State University and Colorado State University-Pueblo
in the amount of $50.4 million and $46.5 million, respectively.
106
COLORADO STATE UNIVERSITY SYSTEM
Notes to Basic Financial Statements
Years Ended June 30, 2020 and 2019
(Amounts expressed in thousands)
(25) Contingencies
Contingencies include those in which the System is a defendant in several lawsuits including various claims
related to activities or employees of the System. The System believes that final settlement of matters not
covered by insurance will not materially or adversely affect its financial condition or operations.
During the current fiscal year, a student brought a class action suit against CSU on behalf of a class of
similarly situated students who paid tuition and fees to CSU during the Spring 2020 semester. The dispute
centers around CSU’s transition to remote delivery of educational services for the latter portion of the Spring
2020 semester in response to the COVID-19 pandemic. The Plaintiff claims that CSU’s actions, including
canceling campus events and closing or limiting access to certain buildings, breached its contract with
students. CSU denies any wrongdoing and is defending against the lawsuit. CSU has filed a motion to
dismiss the class action case and anticipates a favorable disposition; however, even if there were an adverse
determination, it would not have a material impact upon its financial condition.
Financial Awards from Federal and State Agencies
The System receives significant financial awards from federal and state agencies in the form of grants.
Expenditures of funds under those programs require compliance with the grant agreements and are subject
to audit. Any disallowed expenditures resulting from such audits become a liability of the System. In the
opinion of management, such adjustments, if any, are not expected to materially affect the financial
condition or operations of the System.
(26) Subsequent Event Footnote
On July 16, 2020, Colorado State University System issued $230.0 million in Taxable Series 2020 A System
Enterprise Refunding Bonds. The 2020 A bonds will be used to (a) refund a portion of the debt service for
the following series: 2010 B, 2012 A, 2012 B, 2013 A, 2013 D, 2013 E, 2015 B, 2015 C, 2015 E-2, 2015
F, 2016 A, 2016 B, 2017 A, 2017 B, 2017 D, 2017 E, 2017 F, 2018 A, 2019 A and 2019 B; and (b) to pay
certain costs relating to the issuance of the 2020 A Series Bonds.
107
REQUIRED SUPPLEMENTAL INFORMATION
108
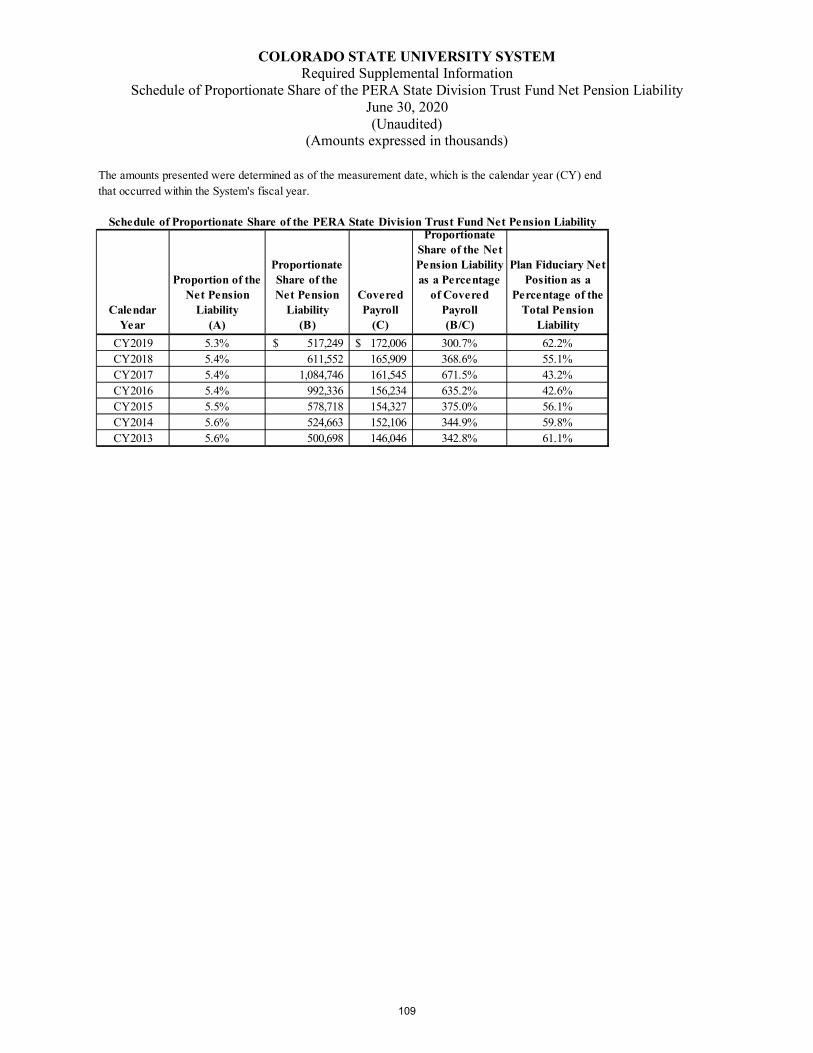
COLORADO STATE UNIVERSITY SYSTEM Required Supplemental Information
Schedule of Proportionate Share of the PERA State Division Trust Fund Net Pension Liability June 30, 2020 (Unaudited)
(Amounts expressed in thousands)
Calendar Year
Proportion of the Net Pension
Liability (A)
Proportionate Share of the Net Pension
Liability (B)
Covered Payroll
(C)
ProportionateShare of the Net Pension Liability as a Percentage
of Covered Payroll (B/C)
Plan Fiduciary Net Position as a
Percentage of the Total Pension
LiabilityCY2019 5.3% 517,249$ 172,006$ 300.7% 62.2%CY2018 5.4% 611,552 165,909 368.6% 55.1%CY2017 5.4% 1,084,746 161,545 671.5% 43.2%CY2016 5.4% 992,336 156,234 635.2% 42.6%CY2015 5.5% 578,718 154,327 375.0% 56.1%CY2014 5.6% 524,663 152,106 344.9% 59.8%CY2013 5.6% 500,698 146,046 342.8% 61.1%
The amounts presented were determined as of the measurement date, which is the calendar year (CY) end that occurred within the System's fiscal year.
Schedule of Proportionate Share of the PERA State Division Trust Fund Net Pension Liability
109
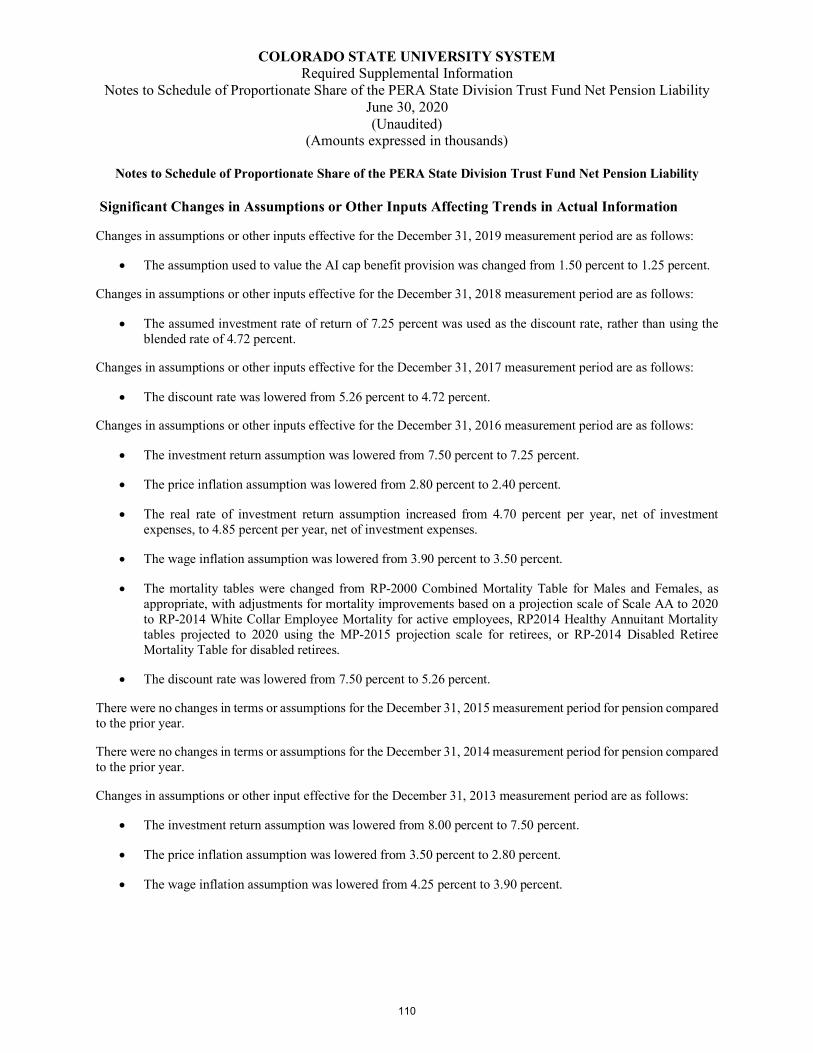
COLORADO STATE UNIVERSITY SYSTEM Required Supplemental Information
Notes to Schedule of Proportionate Share of the PERA State Division Trust Fund Net Pension Liability June 30, 2020 (Unaudited)
(Amounts expressed in thousands)
Notes to Schedule of Proportionate Share of the PERA State Division Trust Fund Net Pension Liability
Significant Changes in Assumptions or Other Inputs Affecting Trends in Actual Information
Changes in assumptions or other inputs effective for the December 31, 2019 measurement period are as follows:
• The assumption used to value the AI cap benefit provision was changed from 1.50 percent to 1.25 percent.
Changes in assumptions or other inputs effective for the December 31, 2018 measurement period are as follows:
• The assumed investment rate of return of 7.25 percent was used as the discount rate, rather than using theblended rate of 4.72 percent.
Changes in assumptions or other inputs effective for the December 31, 2017 measurement period are as follows:
• The discount rate was lowered from 5.26 percent to 4.72 percent.
Changes in assumptions or other inputs effective for the December 31, 2016 measurement period are as follows:
• The investment return assumption was lowered from 7.50 percent to 7.25 percent.
• The price inflation assumption was lowered from 2.80 percent to 2.40 percent.
• The real rate of investment return assumption increased from 4.70 percent per year, net of investmentexpenses, to 4.85 percent per year, net of investment expenses.
• The wage inflation assumption was lowered from 3.90 percent to 3.50 percent.
• The mortality tables were changed from RP-2000 Combined Mortality Table for Males and Females, asappropriate, with adjustments for mortality improvements based on a projection scale of Scale AA to 2020to RP-2014 White Collar Employee Mortality for active employees, RP2014 Healthy Annuitant Mortalitytables projected to 2020 using the MP-2015 projection scale for retirees, or RP-2014 Disabled RetireeMortality Table for disabled retirees.
• The discount rate was lowered from 7.50 percent to 5.26 percent.
There were no changes in terms or assumptions for the December 31, 2015 measurement period for pension compared to the prior year.
There were no changes in terms or assumptions for the December 31, 2014 measurement period for pension compared to the prior year.
Changes in assumptions or other input effective for the December 31, 2013 measurement period are as follows:
• The investment return assumption was lowered from 8.00 percent to 7.50 percent.
• The price inflation assumption was lowered from 3.50 percent to 2.80 percent.
• The wage inflation assumption was lowered from 4.25 percent to 3.90 percent.
110
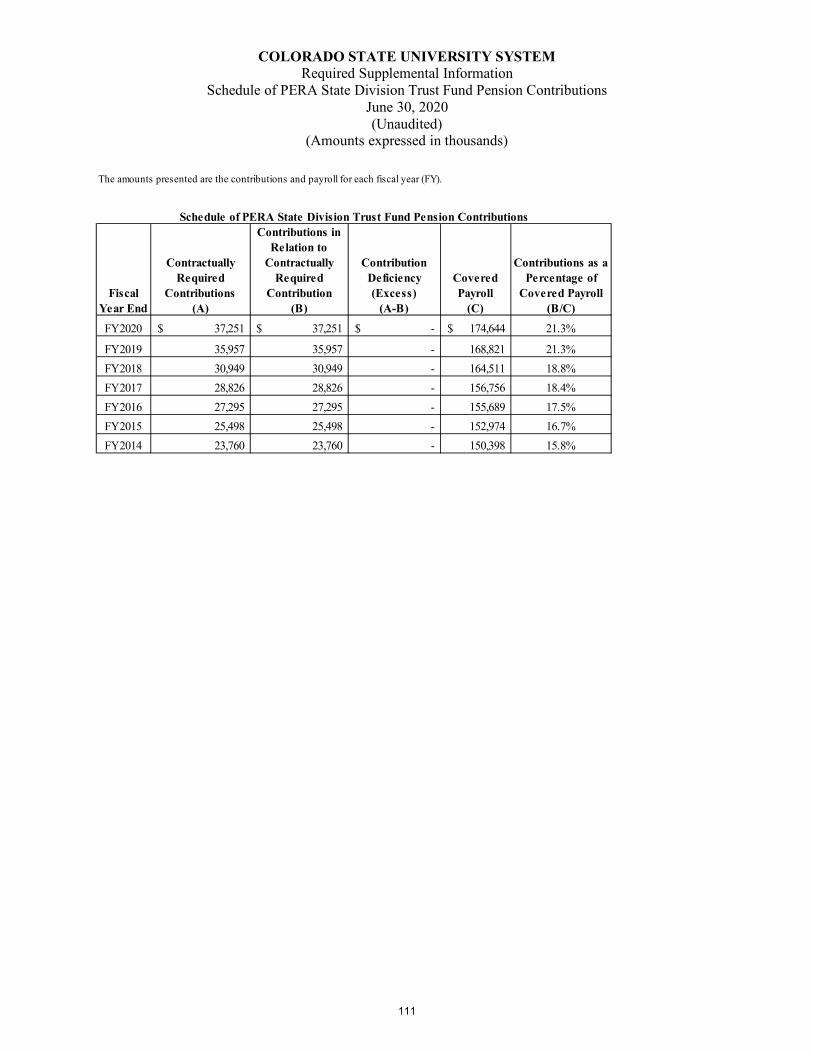
COLORADO STATE UNIVERSITY SYSTEM Required Supplemental Information
Schedule of PERA State Division Trust Fund Pension Contributions June 30, 2020 (Unaudited)
(Amounts expressed in thousands)
The amounts presented are the contributions and payroll for each fiscal year (FY).
Fiscal Year End
Contractually Required
Contributions (A)
Contributions in Relation to
Contractually Required
Contribution (B)
Contribution Deficiency (Excess)
(A-B)
Covered Payroll
(C)
Contributions as a Percentage of
Covered Payroll (B/C)
FY2020 37,251$ 37,251$ -$ 174,644$ 21.3%
FY2019 35,957 35,957 - 168,821 21.3%FY2018 30,949 30,949 - 164,511 18.8%FY2017 28,826 28,826 - 156,756 18.4%FY2016 27,295 27,295 - 155,689 17.5%FY2015 25,498 25,498 - 152,974 16.7%FY2014 23,760 23,760 - 150,398 15.8%
Schedule of PERA State Division Trust Fund Pension Contributions
111
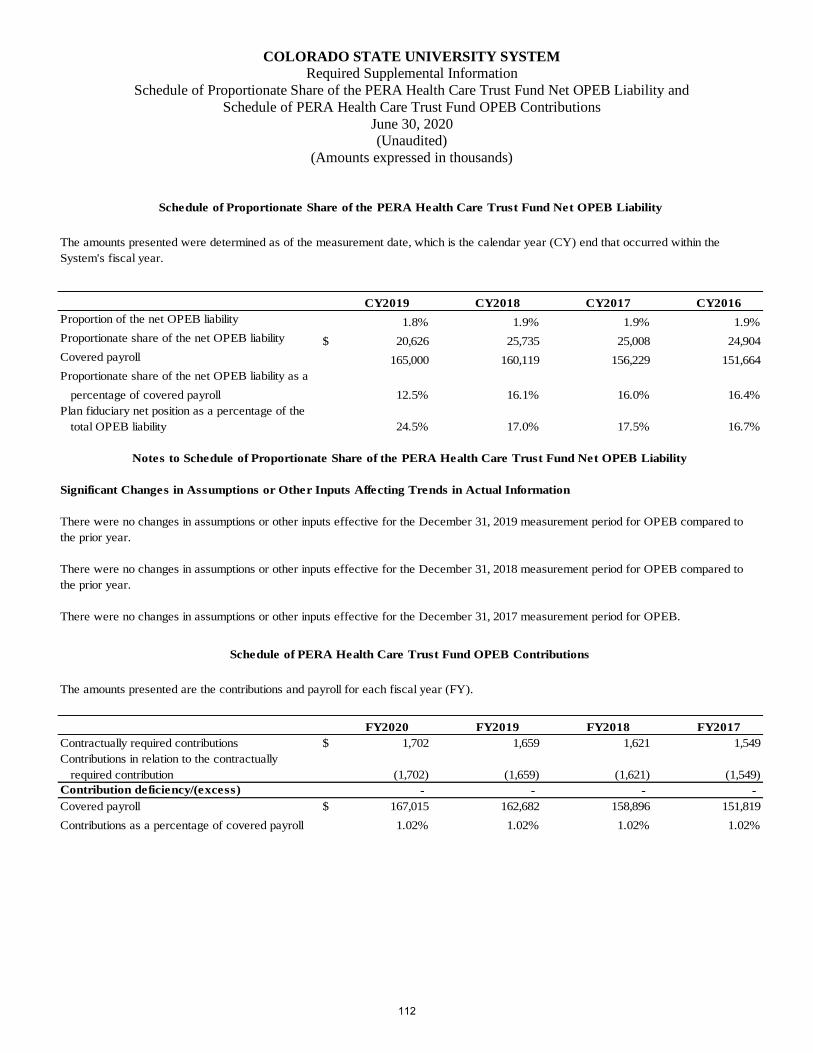
COLORADO STATE UNIVERSITY SYSTEM
Required Supplemental Information
Schedule of Proportionate Share of the PERA Health Care Trust Fund Net OPEB Liability and
Schedule of PERA Health Care Trust Fund OPEB Contributions
June 30, 2020 (Unaudited)
(Amounts expressed in thousands)
CY2019 CY2018 CY2017 CY2016
Proportion of the net OPEB liability 1.8% 1.9% 1.9% 1.9%
Proportionate share of the net OPEB liability $ 20,626 25,735 25,008 24,904
Covered payroll 165,000 160,119 156,229 151,664
Proportionate share of the net OPEB liability as a
percentage of covered payroll 12.5% 16.1% 16.0% 16.4%
Plan fiduciary net position as a percentage of the
total OPEB liability 24.5% 17.0% 17.5% 16.7%
The amounts presented are the contributions and payroll for each fiscal year (FY).
FY2020 FY2019 FY2018 FY2017
Contractually required contributions $ 1,702 1,659 1,621 1,549
Contributions in relation to the contractually
required contribution (1,702) (1,659) (1,621) (1,549)
Contribution deficiency/(excess) - - - -
Covered payroll $ 167,015 162,682 158,896 151,819
Contributions as a percentage of covered payroll 1.02% 1.02% 1.02% 1.02%
Schedule of Proportionate Share of the PERA Health Care Trust Fund Net OPEB Liability
The amounts presented were determined as of the measurement date, which is the calendar year (CY) end that occurred within the
System's fiscal year.
Schedule of PERA Health Care Trust Fund OPEB Contributions
Notes to Schedule of Proportionate Share of the PERA Health Care Trust Fund Net OPEB Liability
Significant Changes in Assumptions or Other Inputs Affecting Trends in Actual Information
There were no changes in assumptions or other inputs effective for the December 31, 2018 measurement period for OPEB compared to
the prior year.
There were no changes in assumptions or other inputs effective for the December 31, 2017 measurement period for OPEB.
There were no changes in assumptions or other inputs effective for the December 31, 2019 measurement period for OPEB compared to
the prior year.
112
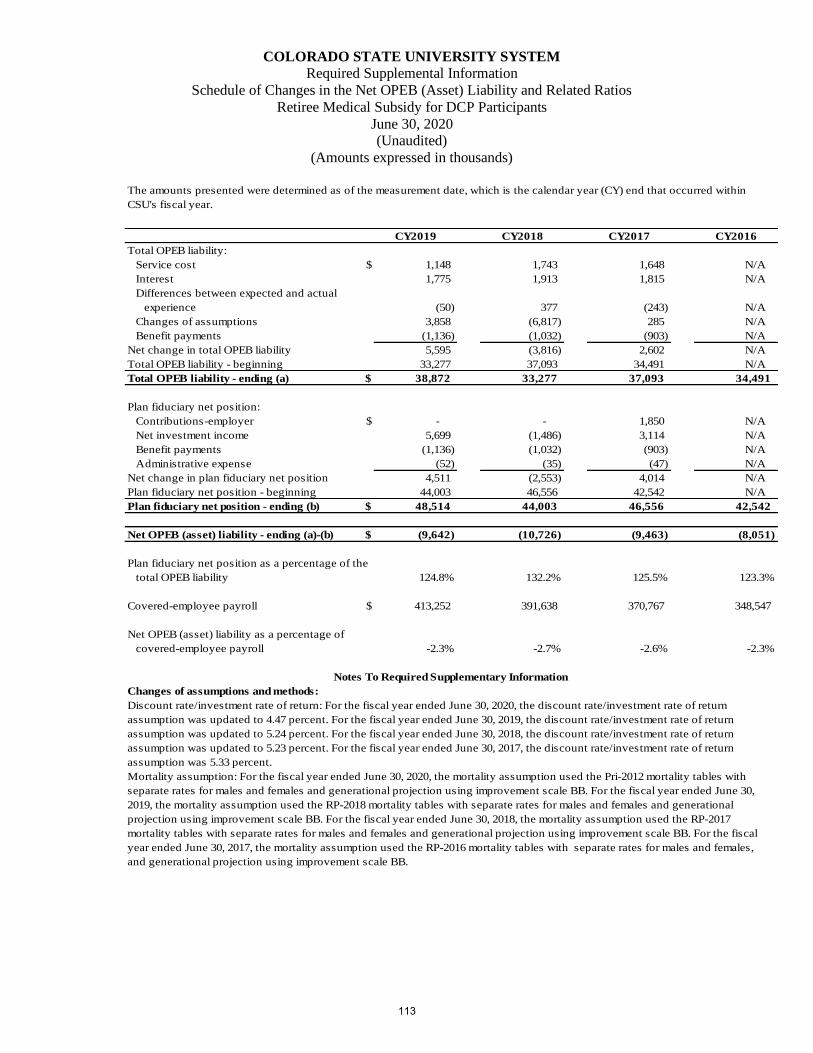
COLORADO STATE UNIVERSITY SYSTEM
Required Supplemental Information
Schedule of Changes in the Net OPEB (Asset) Liability and Related Ratios
Retiree Medical Subsidy for DCP Participants
June 30, 2020 (Unaudited)
(Amounts expressed in thousands)
CY2019 CY2018 CY2017 CY2016
Total OPEB liability:
Service cost $ 1,148 1,743 1,648 N/A
Interest 1,775 1,913 1,815 N/A
Differences between expected and actual
experience (50) 377 (243) N/A
Changes of assumptions 3,858 (6,817) 285 N/A
Benefit payments (1,136) (1,032) (903) N/A
Net change in total OPEB liability 5,595 (3,816) 2,602 N/A
Total OPEB liability - beginning 33,277 37,093 34,491 N/A
Total OPEB liability - ending (a) $ 38,872 33,277 37,093 34,491
Plan fiduciary net position:
Contributions-employer $ - - 1,850 N/A
Net investment income 5,699 (1,486) 3,114 N/A
Benefit payments (1,136) (1,032) (903) N/A
Administrative expense (52) (35) (47) N/A
Net change in plan fiduciary net position 4,511 (2,553) 4,014 N/A
Plan fiduciary net position - beginning 44,003 46,556 42,542 N/A
Plan fiduciary net position - ending (b) $ 48,514 44,003 46,556 42,542
Net OPEB (asset) liability - ending (a)-(b) $ (9,642) (10,726) (9,463) (8,051)
Plan fiduciary net position as a percentage of the
total OPEB liability 124.8% 132.2% 125.5% 123.3%
Covered-employee payroll $ 413,252 391,638 370,767 348,547
Net OPEB (asset) liability as a percentage of
covered-employee payroll -2.3% -2.7% -2.6% -2.3%
Changes of assumptions and methods:
Notes To Required Supplementary Information
The amounts presented were determined as of the measurement date, which is the calendar year (CY) end that occurred within
CSU's fiscal year.
Discount rate/investment rate of return: For the fiscal year ended June 30, 2020, the discount rate/investment rate of return
assumption was updated to 4.47 percent. For the fiscal year ended June 30, 2019, the discount rate/investment rate of return
assumption was updated to 5.24 percent. For the fiscal year ended June 30, 2018, the discount rate/investment rate of return
assumption was updated to 5.23 percent. For the fiscal year ended June 30, 2017, the discount rate/investment rate of return
assumption was 5.33 percent.
Mortality assumption: For the fiscal year ended June 30, 2020, the mortality assumption used the Pri-2012 mortality tables with
separate rates for males and females and generational projection using improvement scale BB. For the fiscal year ended June 30,
2019, the mortality assumption used the RP-2018 mortality tables with separate rates for males and females and generational
projection using improvement scale BB. For the fiscal year ended June 30, 2018, the mortality assumption used the RP-2017
mortality tables with separate rates for males and females and generational projection using improvement scale BB. For the fiscal
year ended June 30, 2017, the mortality assumption used the RP-2016 mortality tables with separate rates for males and females,
and generational projection using improvement scale BB.
113
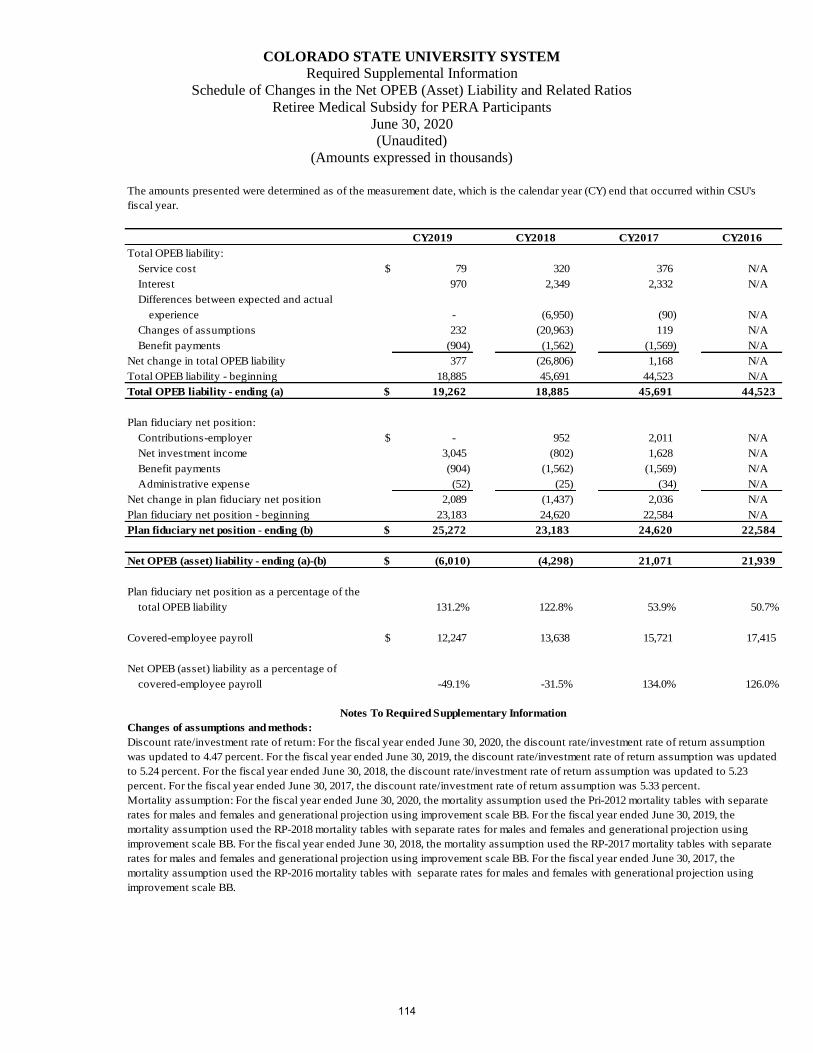
COLORADO STATE UNIVERSITY SYSTEM
Required Supplemental Information
Schedule of Changes in the Net OPEB (Asset) Liability and Related Ratios
Retiree Medical Subsidy for PERA Participants
June 30, 2020 (Unaudited)
(Amounts expressed in thousands)
CY2019 CY2018 CY2017 CY2016
Total OPEB liability:
Service cost $ 79 320 376 N/A
Interest 970 2,349 2,332 N/A
Differences between expected and actual
experience - (6,950) (90) N/A
Changes of assumptions 232 (20,963) 119 N/A
Benefit payments (904) (1,562) (1,569) N/A
Net change in total OPEB liability 377 (26,806) 1,168 N/A
Total OPEB liability - beginning 18,885 45,691 44,523 N/A
Total OPEB liability - ending (a) $ 19,262 18,885 45,691 44,523
Plan fiduciary net position:
Contributions-employer $ - 952 2,011 N/A
Net investment income 3,045 (802) 1,628 N/A
Benefit payments (904) (1,562) (1,569) N/A
Administrative expense (52) (25) (34) N/A
Net change in plan fiduciary net position 2,089 (1,437) 2,036 N/A
Plan fiduciary net position - beginning 23,183 24,620 22,584 N/A
Plan fiduciary net position - ending (b) $ 25,272 23,183 24,620 22,584
Net OPEB (asset) liability - ending (a)-(b) $ (6,010) (4,298) 21,071 21,939
Plan fiduciary net position as a percentage of the
total OPEB liability 131.2% 122.8% 53.9% 50.7%
Covered-employee payroll $ 12,247 13,638 15,721 17,415
Net OPEB (asset) liability as a percentage of
covered-employee payroll -49.1% -31.5% 134.0% 126.0%
Changes of assumptions and methods:
The amounts presented were determined as of the measurement date, which is the calendar year (CY) end that occurred within CSU's
fiscal year.
Notes To Required Supplementary Information
Discount rate/investment rate of return: For the fiscal year ended June 30, 2020, the discount rate/investment rate of return assumption
was updated to 4.47 percent. For the fiscal year ended June 30, 2019, the discount rate/investment rate of return assumption was updated
to 5.24 percent. For the fiscal year ended June 30, 2018, the discount rate/investment rate of return assumption was updated to 5.23
percent. For the fiscal year ended June 30, 2017, the discount rate/investment rate of return assumption was 5.33 percent.
Mortality assumption: For the fiscal year ended June 30, 2020, the mortality assumption used the Pri-2012 mortality tables with separate
rates for males and females and generational projection using improvement scale BB. For the fiscal year ended June 30, 2019, the
mortality assumption used the RP-2018 mortality tables with separate rates for males and females and generational projection using
improvement scale BB. For the fiscal year ended June 30, 2018, the mortality assumption used the RP-2017 mortality tables with separate
rates for males and females and generational projection using improvement scale BB. For the fiscal year ended June 30, 2017, the
mortality assumption used the RP-2016 mortality tables with separate rates for males and females with generational projection using
improvement scale BB.
114
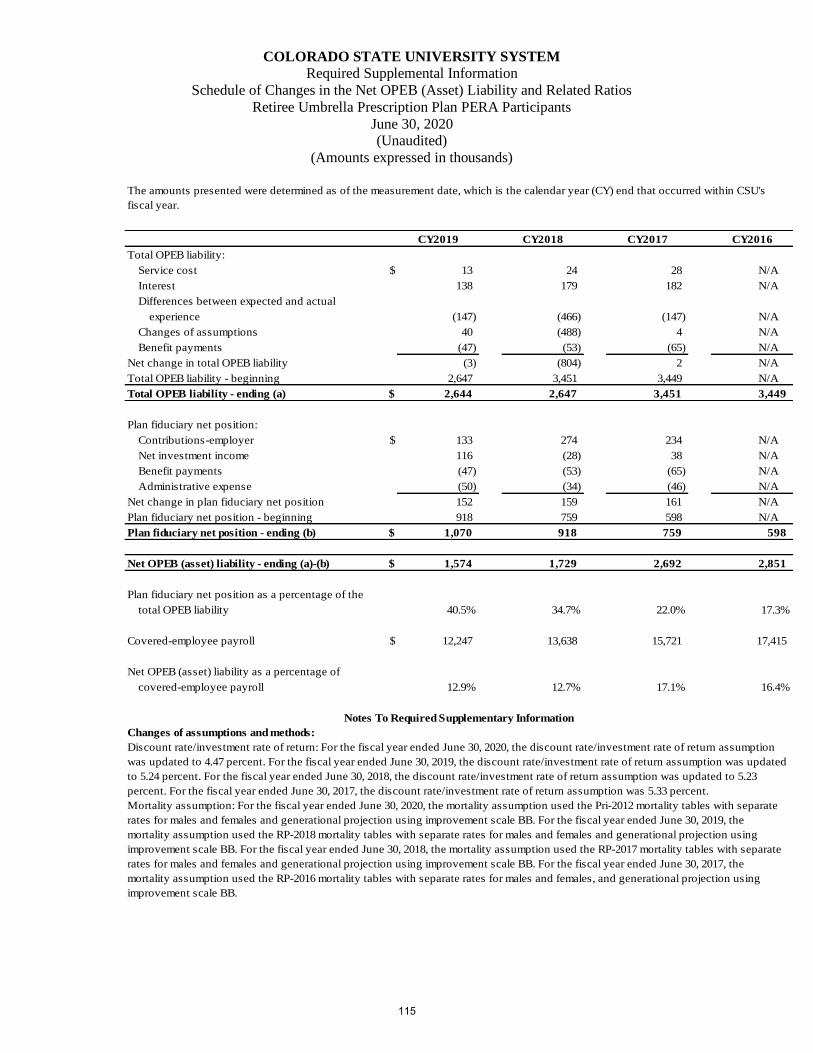
COLORADO STATE UNIVERSITY SYSTEM
Required Supplemental Information
Schedule of Changes in the Net OPEB (Asset) Liability and Related Ratios
Retiree Umbrella Prescription Plan PERA Participants
June 30, 2020 (Unaudited)
(Amounts expressed in thousands)
CY2019 CY2018 CY2017 CY2016
Total OPEB liability:
Service cost $ 13 24 28 N/A
Interest 138 179 182 N/A
Differences between expected and actual
experience (147) (466) (147) N/A
Changes of assumptions 40 (488) 4 N/A
Benefit payments (47) (53) (65) N/A
Net change in total OPEB liability (3) (804) 2 N/A
Total OPEB liability - beginning 2,647 3,451 3,449 N/A
Total OPEB liability - ending (a) $ 2,644 2,647 3,451 3,449
Plan fiduciary net position:
Contributions-employer $ 133 274 234 N/A
Net investment income 116 (28) 38 N/A
Benefit payments (47) (53) (65) N/A
Administrative expense (50) (34) (46) N/A
Net change in plan fiduciary net position 152 159 161 N/A
Plan fiduciary net position - beginning 918 759 598 N/A
Plan fiduciary net position - ending (b) $ 1,070 918 759 598
Net OPEB (asset) liability - ending (a)-(b) $ 1,574 1,729 2,692 2,851
Plan fiduciary net position as a percentage of the
total OPEB liability 40.5% 34.7% 22.0% 17.3%
Covered-employee payroll $ 12,247 13,638 15,721 17,415
Net OPEB (asset) liability as a percentage of
covered-employee payroll 12.9% 12.7% 17.1% 16.4%
Changes of assumptions and methods:
The amounts presented were determined as of the measurement date, which is the calendar year (CY) end that occurred within CSU's
fiscal year.
Notes To Required Supplementary Information
Discount rate/investment rate of return: For the fiscal year ended June 30, 2020, the discount rate/investment rate of return assumption
was updated to 4.47 percent. For the fiscal year ended June 30, 2019, the discount rate/investment rate of return assumption was updated
to 5.24 percent. For the fiscal year ended June 30, 2018, the discount rate/investment rate of return assumption was updated to 5.23
percent. For the fiscal year ended June 30, 2017, the discount rate/investment rate of return assumption was 5.33 percent.
Mortality assumption: For the fiscal year ended June 30, 2020, the mortality assumption used the Pri-2012 mortality tables with separate
rates for males and females and generational projection using improvement scale BB. For the fiscal year ended June 30, 2019, the
mortality assumption used the RP-2018 mortality tables with separate rates for males and females and generational projection using
improvement scale BB. For the fiscal year ended June 30, 2018, the mortality assumption used the RP-2017 mortality tables with separate
rates for males and females and generational projection using improvement scale BB. For the fiscal year ended June 30, 2017, the
mortality assumption used the RP-2016 mortality tables with separate rates for males and females, and generational projection using
improvement scale BB.
115
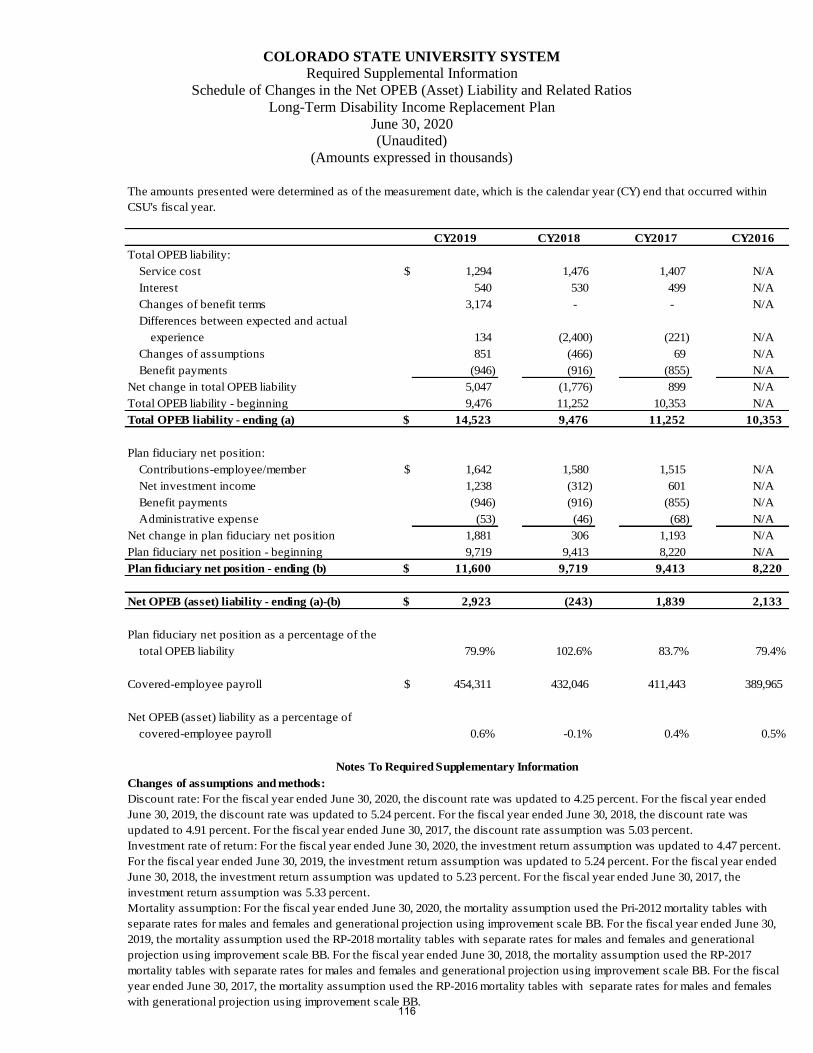
COLORADO STATE UNIVERSITY SYSTEM
Required Supplemental Information
Schedule of Changes in the Net OPEB (Asset) Liability and Related Ratios
Long-Term Disability Income Replacement Plan
June 30, 2020 (Unaudited)
(Amounts expressed in thousands)
CY2019 CY2018 CY2017 CY2016
Total OPEB liability:
Service cost $ 1,294 1,476 1,407 N/A
Interest 540 530 499 N/A
Changes of benefit terms 3,174 - - N/A
Differences between expected and actual
experience 134 (2,400) (221) N/A
Changes of assumptions 851 (466) 69 N/A
Benefit payments (946) (916) (855) N/A
Net change in total OPEB liability 5,047 (1,776) 899 N/A
Total OPEB liability - beginning 9,476 11,252 10,353 N/A
Total OPEB liability - ending (a) $ 14,523 9,476 11,252 10,353
Plan fiduciary net position:
Contributions-employee/member $ 1,642 1,580 1,515 N/A
Net investment income 1,238 (312) 601 N/A
Benefit payments (946) (916) (855) N/A
Administrative expense (53) (46) (68) N/A
Net change in plan fiduciary net position 1,881 306 1,193 N/A
Plan fiduciary net position - beginning 9,719 9,413 8,220 N/A
Plan fiduciary net position - ending (b) $ 11,600 9,719 9,413 8,220
Net OPEB (asset) liability - ending (a)-(b) $ 2,923 (243) 1,839 2,133
Plan fiduciary net position as a percentage of the
total OPEB liability 79.9% 102.6% 83.7% 79.4%
Covered-employee payroll $ 454,311 432,046 411,443 389,965
Net OPEB (asset) liability as a percentage of
covered-employee payroll 0.6% -0.1% 0.4% 0.5%
Changes of assumptions and methods:
The amounts presented were determined as of the measurement date, which is the calendar year (CY) end that occurred within
CSU's fiscal year.
Notes To Required Supplementary Information
Discount rate: For the fiscal year ended June 30, 2020, the discount rate was updated to 4.25 percent. For the fiscal year ended
June 30, 2019, the discount rate was updated to 5.24 percent. For the fiscal year ended June 30, 2018, the discount rate was
updated to 4.91 percent. For the fiscal year ended June 30, 2017, the discount rate assumption was 5.03 percent.
Investment rate of return: For the fiscal year ended June 30, 2020, the investment return assumption was updated to 4.47 percent.
For the fiscal year ended June 30, 2019, the investment return assumption was updated to 5.24 percent. For the fiscal year ended
June 30, 2018, the investment return assumption was updated to 5.23 percent. For the fiscal year ended June 30, 2017, the
investment return assumption was 5.33 percent.
Mortality assumption: For the fiscal year ended June 30, 2020, the mortality assumption used the Pri-2012 mortality tables with
separate rates for males and females and generational projection using improvement scale BB. For the fiscal year ended June 30,
2019, the mortality assumption used the RP-2018 mortality tables with separate rates for males and females and generational
projection using improvement scale BB. For the fiscal year ended June 30, 2018, the mortality assumption used the RP-2017
mortality tables with separate rates for males and females and generational projection using improvement scale BB. For the fiscal
year ended June 30, 2017, the mortality assumption used the RP-2016 mortality tables with separate rates for males and females
with generational projection using improvement scale BB.116
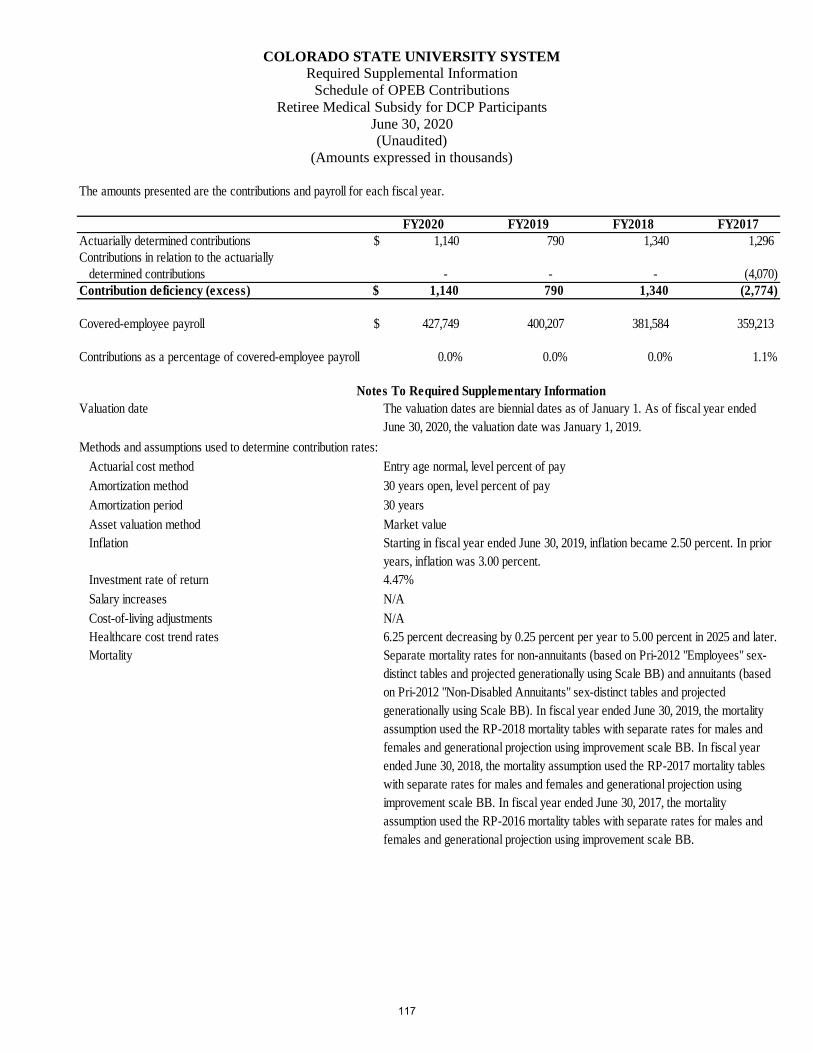
COLORADO STATE UNIVERSITY SYSTEM
Required Supplemental Information
Schedule of OPEB Contributions
Retiree Medical Subsidy for DCP Participants
June 30, 2020 (Unaudited)
(Amounts expressed in thousands)
The amounts presented are the contributions and payroll for each fiscal year.
FY2020 FY2019 FY2018 FY2017
Actuarially determined contributions $ 1,140 790 1,340 1,296
Contributions in relation to the actuarially
determined contributions - - - (4,070)
Contribution deficiency (excess) $ 1,140 790 1,340 (2,774)
Covered-employee payroll $ 427,749 400,207 381,584 359,213
Contributions as a percentage of covered-employee payroll 0.0% 0.0% 0.0% 1.1%
Valuation date
Methods and assumptions used to determine contribution rates:
Actuarial cost method Entry age normal, level percent of pay
Amortization method 30 years open, level percent of pay
Amortization period 30 years
Asset valuation method Market value
Inflation
Investment rate of return 4.47%
Salary increases N/A
Cost-of-living adjustments N/A
Healthcare cost trend rates
Mortality Separate mortality rates for non-annuitants (based on Pri-2012 "Employees" sex-
distinct tables and projected generationally using Scale BB) and annuitants (based
on Pri-2012 "Non-Disabled Annuitants" sex-distinct tables and projected
generationally using Scale BB). In fiscal year ended June 30, 2019, the mortality
assumption used the RP-2018 mortality tables with separate rates for males and
females and generational projection using improvement scale BB. In fiscal year
ended June 30, 2018, the mortality assumption used the RP-2017 mortality tables
with separate rates for males and females and generational projection using
improvement scale BB. In fiscal year ended June 30, 2017, the mortality
assumption used the RP-2016 mortality tables with separate rates for males and
females and generational projection using improvement scale BB.
Notes To Required Supplementary Information
The valuation dates are biennial dates as of January 1. As of fiscal year ended
June 30, 2020, the valuation date was January 1, 2019.
Starting in fiscal year ended June 30, 2019, inflation became 2.50 percent. In prior
years, inflation was 3.00 percent.
6.25 percent decreasing by 0.25 percent per year to 5.00 percent in 2025 and later.
117
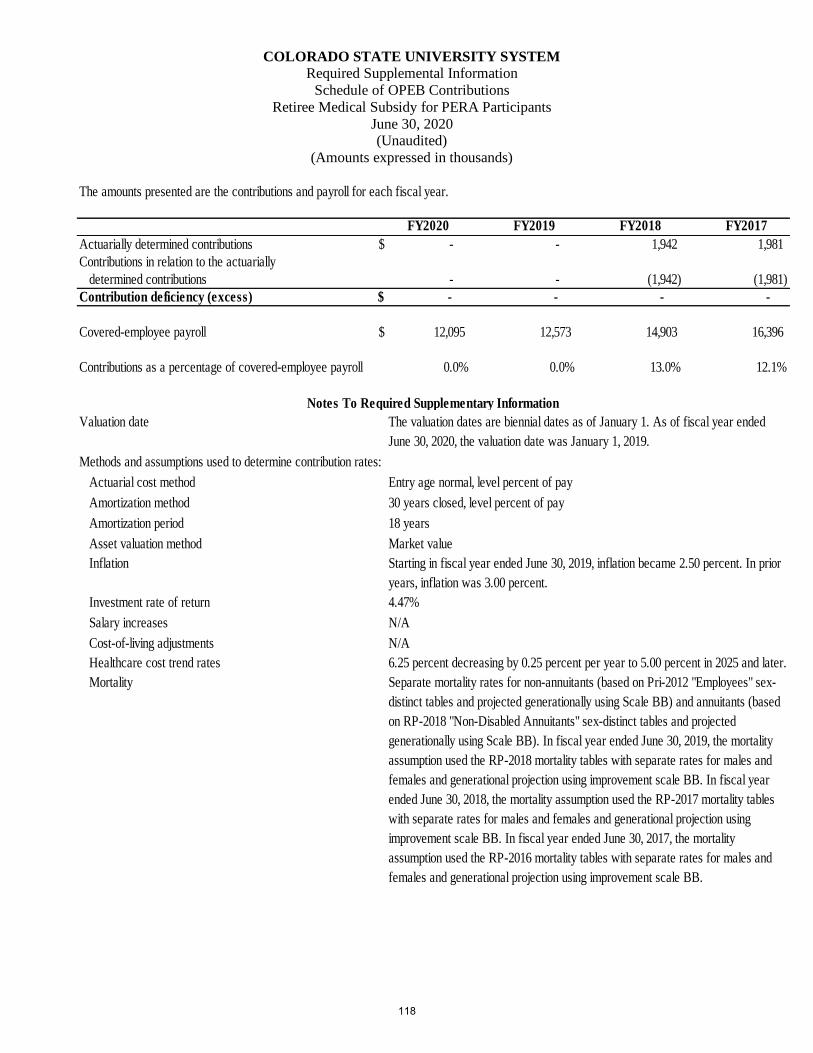
COLORADO STATE UNIVERSITY SYSTEM
Required Supplemental Information
Schedule of OPEB Contributions
Retiree Medical Subsidy for PERA Participants
June 30, 2020 (Unaudited)
(Amounts expressed in thousands)
The amounts presented are the contributions and payroll for each fiscal year.
FY2020 FY2019 FY2018 FY2017
Actuarially determined contributions $ - - 1,942 1,981
Contributions in relation to the actuarially
determined contributions - - (1,942) (1,981)
Contribution deficiency (excess) $ - - - -
Covered-employee payroll $ 12,095 12,573 14,903 16,396
Contributions as a percentage of covered-employee payroll 0.0% 0.0% 13.0% 12.1%
Valuation date
Methods and assumptions used to determine contribution rates:
Actuarial cost method Entry age normal, level percent of pay
Amortization method 30 years closed, level percent of pay
Amortization period 18 years
Asset valuation method Market value
Inflation
Investment rate of return 4.47%
Salary increases N/A
Cost-of-living adjustments N/A
Healthcare cost trend rates
Mortality Separate mortality rates for non-annuitants (based on Pri-2012 "Employees" sex-
distinct tables and projected generationally using Scale BB) and annuitants (based
on RP-2018 "Non-Disabled Annuitants" sex-distinct tables and projected
generationally using Scale BB). In fiscal year ended June 30, 2019, the mortality
assumption used the RP-2018 mortality tables with separate rates for males and
females and generational projection using improvement scale BB. In fiscal year
ended June 30, 2018, the mortality assumption used the RP-2017 mortality tables
with separate rates for males and females and generational projection using
improvement scale BB. In fiscal year ended June 30, 2017, the mortality
assumption used the RP-2016 mortality tables with separate rates for males and
females and generational projection using improvement scale BB.
Notes To Required Supplementary Information
The valuation dates are biennial dates as of January 1. As of fiscal year ended
June 30, 2020, the valuation date was January 1, 2019.
Starting in fiscal year ended June 30, 2019, inflation became 2.50 percent. In prior
years, inflation was 3.00 percent.
6.25 percent decreasing by 0.25 percent per year to 5.00 percent in 2025 and later.
118
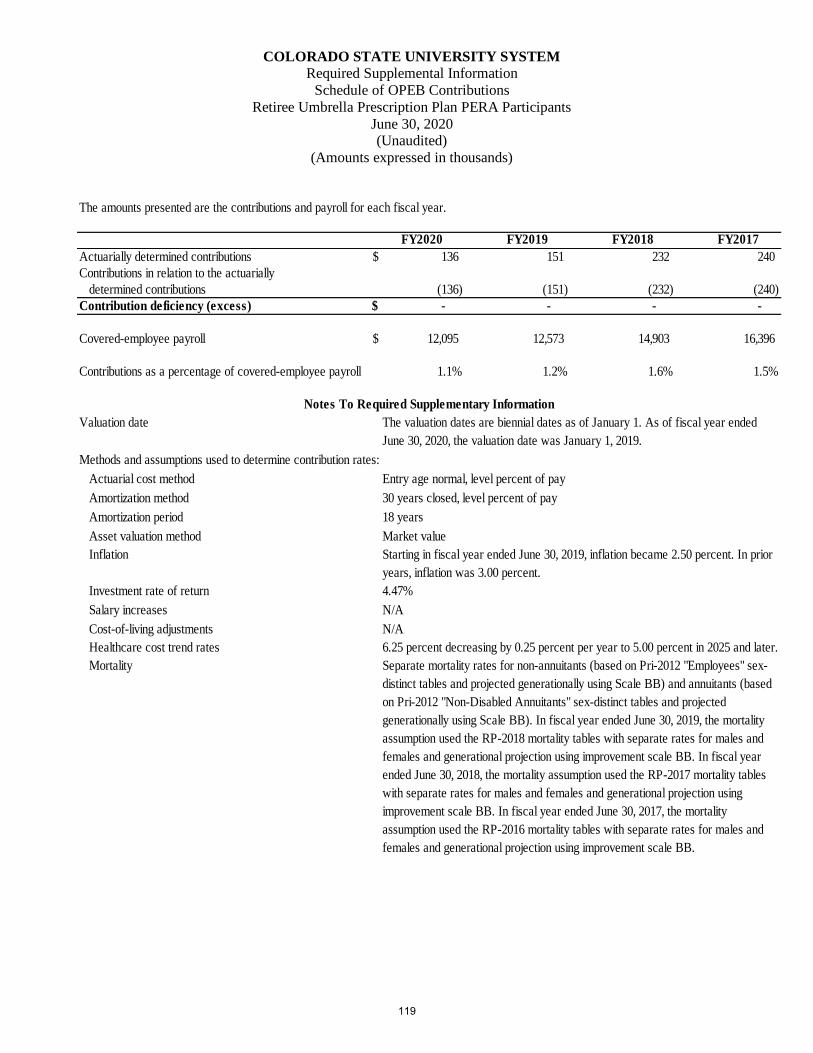
COLORADO STATE UNIVERSITY SYSTEM
Required Supplemental Information
Schedule of OPEB Contributions
Retiree Umbrella Prescription Plan PERA Participants
June 30, 2020 (Unaudited)
(Amounts expressed in thousands)
The amounts presented are the contributions and payroll for each fiscal year.
FY2020 FY2019 FY2018 FY2017
Actuarially determined contributions $ 136 151 232 240
Contributions in relation to the actuarially
determined contributions (136) (151) (232) (240)
Contribution deficiency (excess) $ - - - -
Covered-employee payroll $ 12,095 12,573 14,903 16,396
Contributions as a percentage of covered-employee payroll 1.1% 1.2% 1.6% 1.5%
Valuation date
Methods and assumptions used to determine contribution rates:
Actuarial cost method Entry age normal, level percent of pay
Amortization method 30 years closed, level percent of pay
Amortization period 18 years
Asset valuation method Market value
Inflation
Investment rate of return 4.47%
Salary increases N/A
Cost-of-living adjustments N/A
Healthcare cost trend rates
Mortality
Notes To Required Supplementary Information
The valuation dates are biennial dates as of January 1. As of fiscal year ended
June 30, 2020, the valuation date was January 1, 2019.
Starting in fiscal year ended June 30, 2019, inflation became 2.50 percent. In prior
years, inflation was 3.00 percent.
6.25 percent decreasing by 0.25 percent per year to 5.00 percent in 2025 and later.
Separate mortality rates for non-annuitants (based on Pri-2012 "Employees" sex-
distinct tables and projected generationally using Scale BB) and annuitants (based
on Pri-2012 "Non-Disabled Annuitants" sex-distinct tables and projected
generationally using Scale BB). In fiscal year ended June 30, 2019, the mortality
assumption used the RP-2018 mortality tables with separate rates for males and
females and generational projection using improvement scale BB. In fiscal year
ended June 30, 2018, the mortality assumption used the RP-2017 mortality tables
with separate rates for males and females and generational projection using
improvement scale BB. In fiscal year ended June 30, 2017, the mortality
assumption used the RP-2016 mortality tables with separate rates for males and
females and generational projection using improvement scale BB.
119
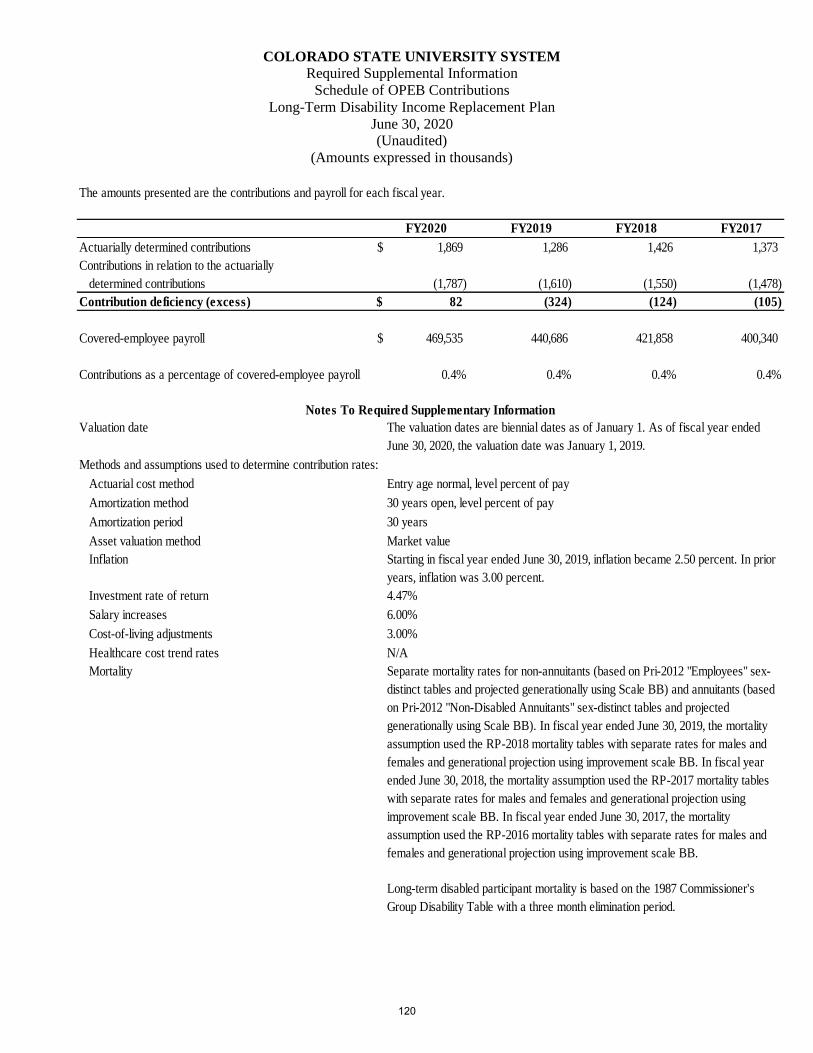
COLORADO STATE UNIVERSITY SYSTEM
Required Supplemental Information
Schedule of OPEB Contributions
Long-Term Disability Income Replacement Plan
June 30, 2020 (Unaudited)
(Amounts expressed in thousands)
The amounts presented are the contributions and payroll for each fiscal year.
FY2020 FY2019 FY2018 FY2017
Actuarially determined contributions $ 1,869 1,286 1,426 1,373
Contributions in relation to the actuarially
determined contributions (1,787) (1,610) (1,550) (1,478)
Contribution deficiency (excess) $ 82 (324) (124) (105)
Covered-employee payroll $ 469,535 440,686 421,858 400,340
Contributions as a percentage of covered-employee payroll 0.4% 0.4% 0.4% 0.4%
Valuation date
Methods and assumptions used to determine contribution rates:
Actuarial cost method Entry age normal, level percent of pay
Amortization method 30 years open, level percent of pay
Amortization period 30 years
Asset valuation method Market value
Inflation
Investment rate of return 4.47%
Salary increases 6.00%
Cost-of-living adjustments 3.00%
Healthcare cost trend rates N/A
Mortality
Notes To Required Supplementary Information
The valuation dates are biennial dates as of January 1. As of fiscal year ended
June 30, 2020, the valuation date was January 1, 2019.
Starting in fiscal year ended June 30, 2019, inflation became 2.50 percent. In prior
years, inflation was 3.00 percent.
Separate mortality rates for non-annuitants (based on Pri-2012 "Employees" sex-
distinct tables and projected generationally using Scale BB) and annuitants (based
on Pri-2012 "Non-Disabled Annuitants" sex-distinct tables and projected
generationally using Scale BB). In fiscal year ended June 30, 2019, the mortality
assumption used the RP-2018 mortality tables with separate rates for males and
females and generational projection using improvement scale BB. In fiscal year
ended June 30, 2018, the mortality assumption used the RP-2017 mortality tables
with separate rates for males and females and generational projection using
improvement scale BB. In fiscal year ended June 30, 2017, the mortality
assumption used the RP-2016 mortality tables with separate rates for males and
females and generational projection using improvement scale BB.
Long-term disabled participant mortality is based on the 1987 Commissioner's
Group Disability Table with a three month elimination period.
120
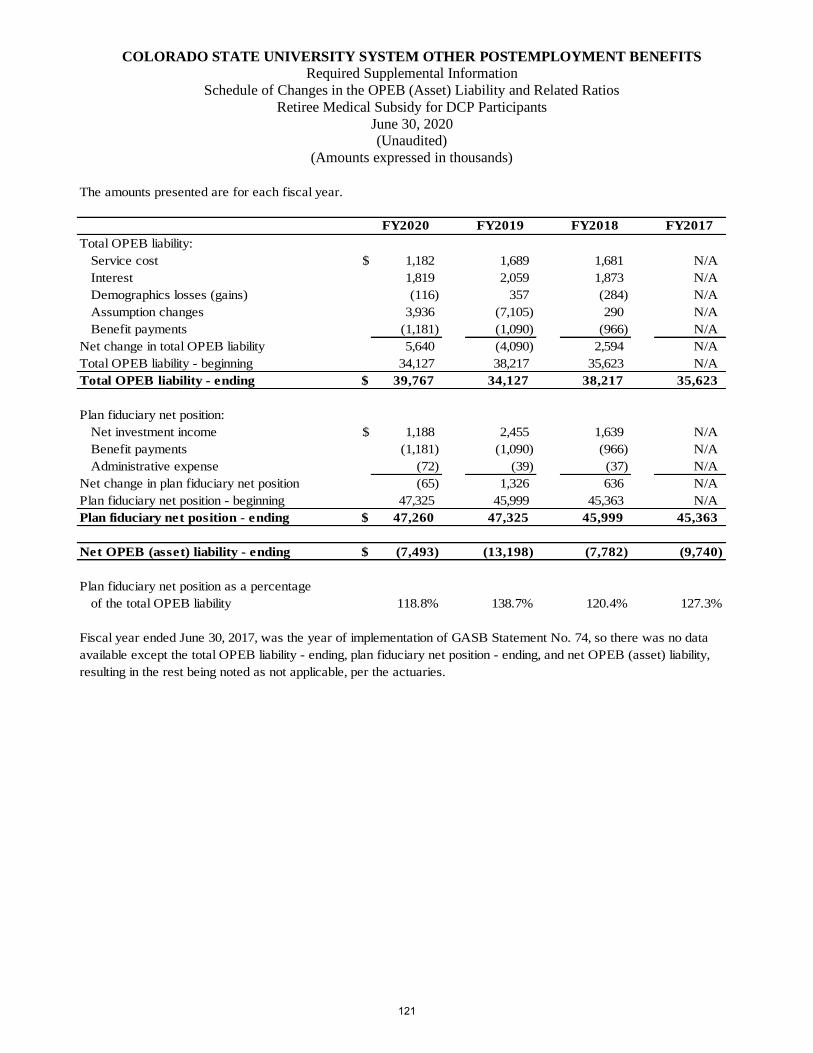
COLORADO STATE UNIVERSITY SYSTEM OTHER POSTEMPLOYMENT BENEFITS
Required Supplemental Information
Schedule of Changes in the OPEB (Asset) Liability and Related Ratios
Retiree Medical Subsidy for DCP Participants
June 30, 2020 (Unaudited)
(Amounts expressed in thousands)
The amounts presented are for each fiscal year.
FY2020 FY2019 FY2018 FY2017
Total OPEB liability:
Service cost $ 1,182 1,689 1,681 N/A
Interest 1,819 2,059 1,873 N/A
Demographics losses (gains) (116) 357 (284) N/A
Assumption changes 3,936 (7,105) 290 N/A
Benefit payments (1,181) (1,090) (966) N/A
Net change in total OPEB liability 5,640 (4,090) 2,594 N/A
Total OPEB liability - beginning 34,127 38,217 35,623 N/A
Total OPEB liability - ending $ 39,767 34,127 38,217 35,623
Plan fiduciary net position:
Net investment income $ 1,188 2,455 1,639 N/A
Benefit payments (1,181) (1,090) (966) N/A
Administrative expense (72) (39) (37) N/A
Net change in plan fiduciary net position (65) 1,326 636 N/A
Plan fiduciary net position - beginning 47,325 45,999 45,363 N/A
Plan fiduciary net position - ending $ 47,260 47,325 45,999 45,363
Net OPEB (asset) liability - ending $ (7,493) (13,198) (7,782) (9,740)
Plan fiduciary net position as a percentage
of the total OPEB liability 118.8% 138.7% 120.4% 127.3%
Fiscal year ended June 30, 2017, was the year of implementation of GASB Statement No. 74, so there was no data
available except the total OPEB liability - ending, plan fiduciary net position - ending, and net OPEB (asset) liability,
resulting in the rest being noted as not applicable, per the actuaries.
121
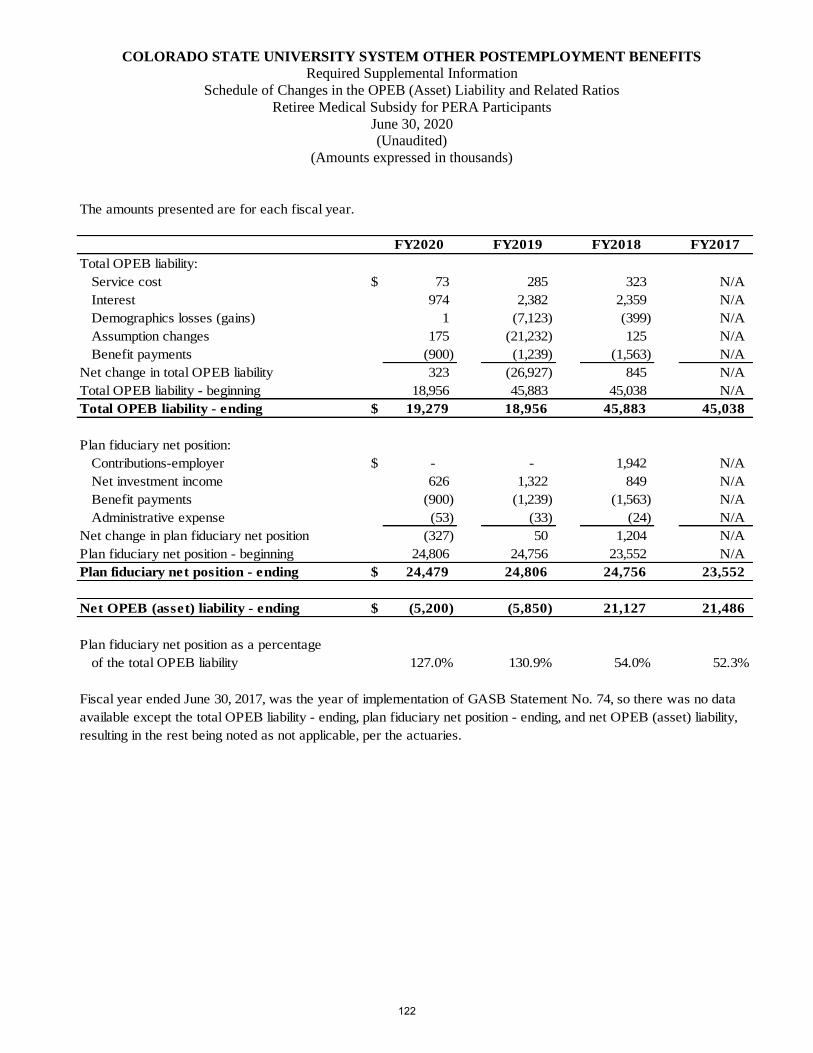
COLORADO STATE UNIVERSITY SYSTEM OTHER POSTEMPLOYMENT BENEFITS
Required Supplemental Information
Schedule of Changes in the OPEB (Asset) Liability and Related Ratios
Retiree Medical Subsidy for PERA Participants
June 30, 2020 (Unaudited)
(Amounts expressed in thousands)
The amounts presented are for each fiscal year.
FY2020 FY2019 FY2018 FY2017
Total OPEB liability:
Service cost $ 73 285 323 N/A
Interest 974 2,382 2,359 N/A
Demographics losses (gains) 1 (7,123) (399) N/A
Assumption changes 175 (21,232) 125 N/A
Benefit payments (900) (1,239) (1,563) N/A
Net change in total OPEB liability 323 (26,927) 845 N/A
Total OPEB liability - beginning 18,956 45,883 45,038 N/A
Total OPEB liability - ending $ 19,279 18,956 45,883 45,038
Plan fiduciary net position:
Contributions-employer $ - - 1,942 N/A
Net investment income 626 1,322 849 N/A
Benefit payments (900) (1,239) (1,563) N/A
Administrative expense (53) (33) (24) N/A
Net change in plan fiduciary net position (327) 50 1,204 N/A
Plan fiduciary net position - beginning 24,806 24,756 23,552 N/A
Plan fiduciary net position - ending $ 24,479 24,806 24,756 23,552
Net OPEB (asset) liability - ending $ (5,200) (5,850) 21,127 21,486
Plan fiduciary net position as a percentage
of the total OPEB liability 127.0% 130.9% 54.0% 52.3%
Fiscal year ended June 30, 2017, was the year of implementation of GASB Statement No. 74, so there was no data
available except the total OPEB liability - ending, plan fiduciary net position - ending, and net OPEB (asset) liability,
resulting in the rest being noted as not applicable, per the actuaries.
122
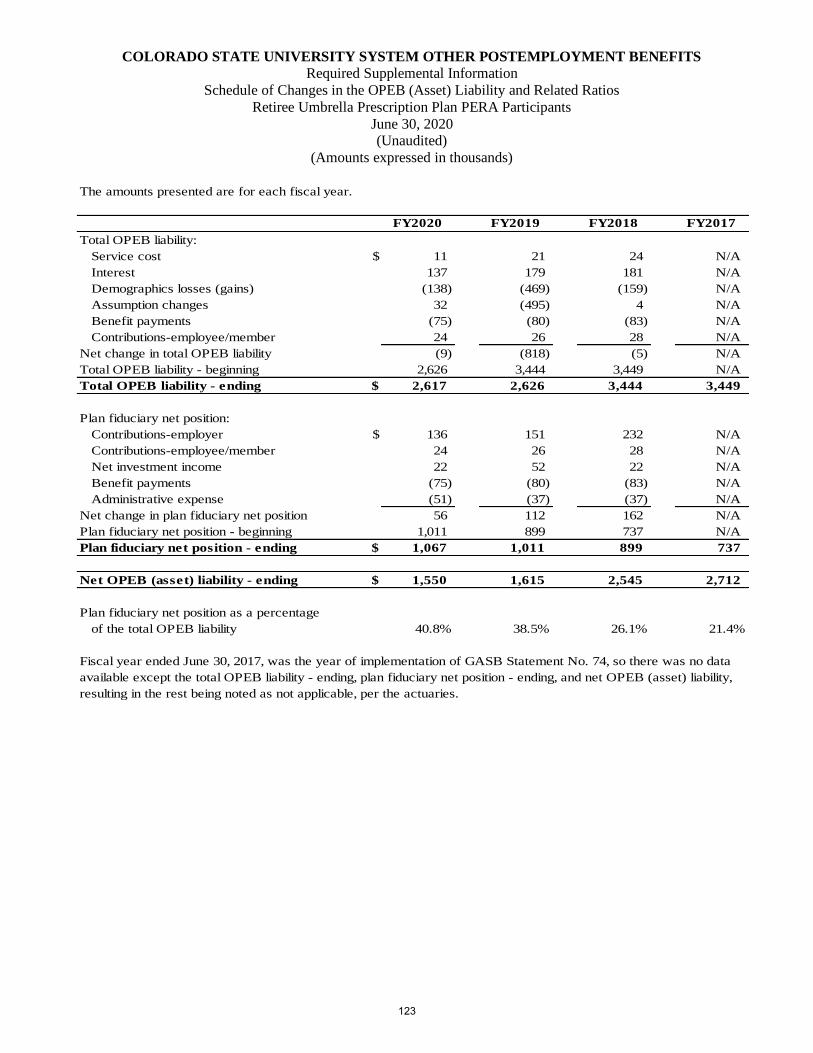
COLORADO STATE UNIVERSITY SYSTEM OTHER POSTEMPLOYMENT BENEFITS
Required Supplemental Information
Schedule of Changes in the OPEB (Asset) Liability and Related Ratios
Retiree Umbrella Prescription Plan PERA Participants
June 30, 2020 (Unaudited)
(Amounts expressed in thousands)
The amounts presented are for each fiscal year.
FY2020 FY2019 FY2018 FY2017
Total OPEB liability:
Service cost $ 11 21 24 N/A
Interest 137 179 181 N/A
Demographics losses (gains) (138) (469) (159) N/A
Assumption changes 32 (495) 4 N/A
Benefit payments (75) (80) (83) N/A
Contributions-employee/member 24 26 28 N/A
Net change in total OPEB liability (9) (818) (5) N/A
Total OPEB liability - beginning 2,626 3,444 3,449 N/A
Total OPEB liability - ending $ 2,617 2,626 3,444 3,449
Plan fiduciary net position:
Contributions-employer $ 136 151 232 N/A
Contributions-employee/member 24 26 28 N/A
Net investment income 22 52 22 N/A
Benefit payments (75) (80) (83) N/A
Administrative expense (51) (37) (37) N/A
Net change in plan fiduciary net position 56 112 162 N/A
Plan fiduciary net position - beginning 1,011 899 737 N/A
Plan fiduciary net position - ending $ 1,067 1,011 899 737
Net OPEB (asset) liability - ending $ 1,550 1,615 2,545 2,712
Plan fiduciary net position as a percentage
of the total OPEB liability 40.8% 38.5% 26.1% 21.4%
Fiscal year ended June 30, 2017, was the year of implementation of GASB Statement No. 74, so there was no data
available except the total OPEB liability - ending, plan fiduciary net position - ending, and net OPEB (asset) liability,
resulting in the rest being noted as not applicable, per the actuaries.
123
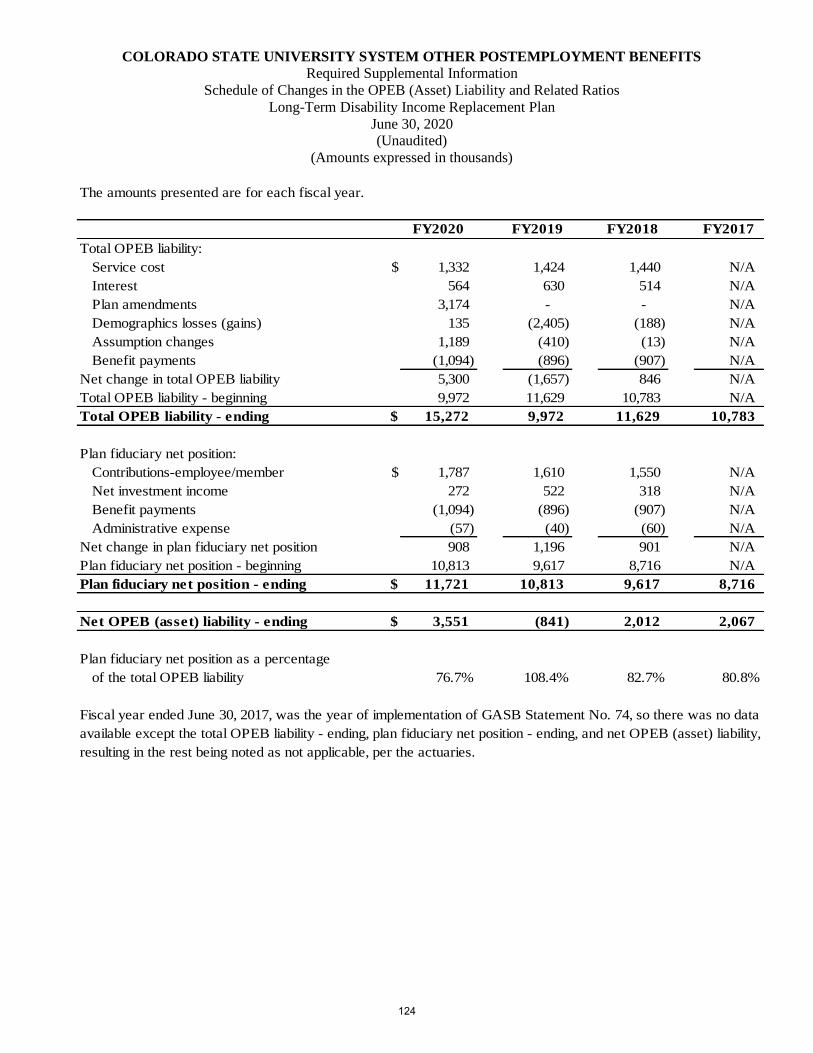
COLORADO STATE UNIVERSITY SYSTEM OTHER POSTEMPLOYMENT BENEFITS
Required Supplemental Information
Schedule of Changes in the OPEB (Asset) Liability and Related Ratios
Long-Term Disability Income Replacement Plan
June 30, 2020 (Unaudited)
(Amounts expressed in thousands)
The amounts presented are for each fiscal year.
FY2020 FY2019 FY2018 FY2017
Total OPEB liability:
Service cost $ 1,332 1,424 1,440 N/A
Interest 564 630 514 N/A
Plan amendments 3,174 - - N/A
Demographics losses (gains) 135 (2,405) (188) N/A
Assumption changes 1,189 (410) (13) N/A
Benefit payments (1,094) (896) (907) N/A
Net change in total OPEB liability 5,300 (1,657) 846 N/A
Total OPEB liability - beginning 9,972 11,629 10,783 N/A
Total OPEB liability - ending $ 15,272 9,972 11,629 10,783
Plan fiduciary net position:
Contributions-employee/member $ 1,787 1,610 1,550 N/A
Net investment income 272 522 318 N/A
Benefit payments (1,094) (896) (907) N/A
Administrative expense (57) (40) (60) N/A
Net change in plan fiduciary net position 908 1,196 901 N/A
Plan fiduciary net position - beginning 10,813 9,617 8,716 N/A
Plan fiduciary net position - ending $ 11,721 10,813 9,617 8,716
Net OPEB (asset) liability - ending $ 3,551 (841) 2,012 2,067
Plan fiduciary net position as a percentage
of the total OPEB liability 76.7% 108.4% 82.7% 80.8%
Fiscal year ended June 30, 2017, was the year of implementation of GASB Statement No. 74, so there was no data
available except the total OPEB liability - ending, plan fiduciary net position - ending, and net OPEB (asset) liability,
resulting in the rest being noted as not applicable, per the actuaries.
124
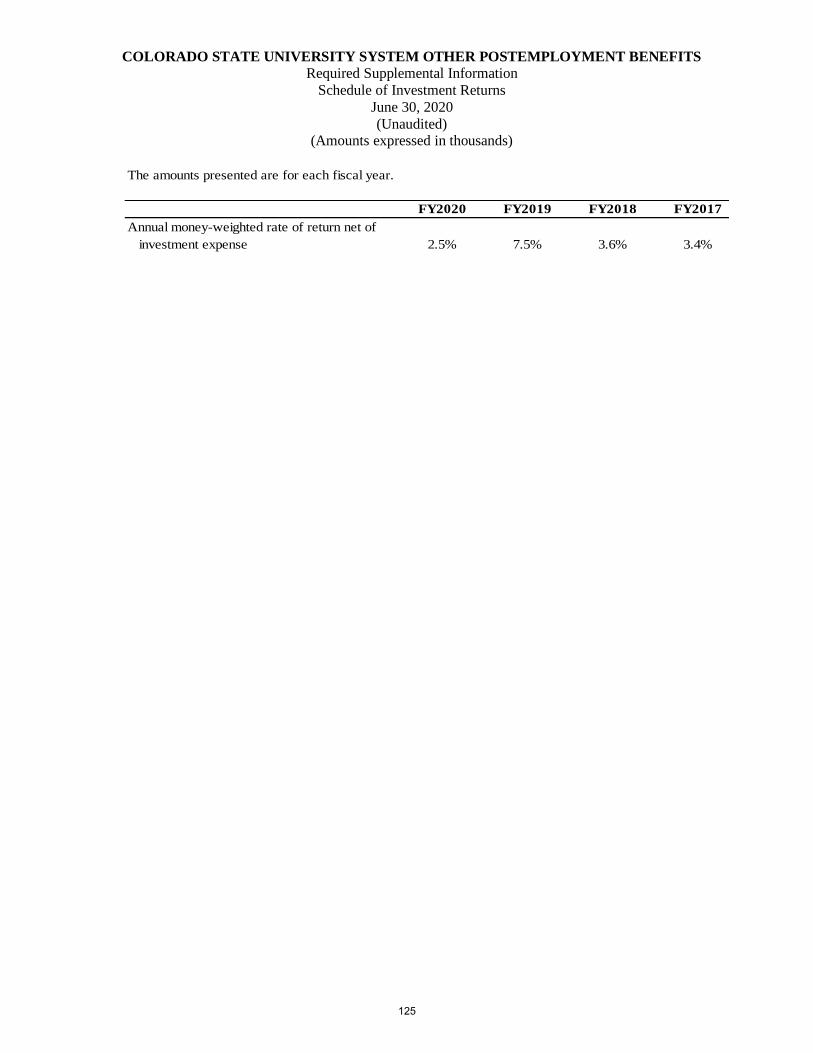
COLORADO STATE UNIVERSITY SYSTEM OTHER POSTEMPLOYMENT BENEFITS
Required Supplemental Information
Schedule of Investment Returns
June 30, 2020
(Unaudited) (Amounts expressed in thousands)
The amounts presented are for each fiscal year.
FY2020 FY2019 FY2018 FY2017
Annual money-weighted rate of return net of
investment expense 2.5% 7.5% 3.6% 3.4%
125