colorectal cancer disparities in maryland · colorectal cancer disparities in maryland ... changes...
TRANSCRIPT

Center for Cancer Surveillance and ControlMaryland Department of Health and Mental Hygiene
Colorectal Cancer Disparities in Maryland
2002-2010
ColoreCtal CanCer Disparities Workgroup MeMbers
Diane Dwyer, MD Joshua roth, bs Carmela groves, rn, Ms ida sahlu, MpH ravindra gopaul, Mba, MpH sarah saxton, Ma, Med Dawn Henninger, rn, Ms andrea shapiro, MD, Ms sarah Conolly Hokenmaier, Mpa eileen steinberger, MD, Ms Maya king, MpH kimberly stern, MHa, CtrCourtney lewis, MpH, CHes ann Walsh, MHs, CHesMargo nathan, ba
acknowledgementsThe Maryland Department of Health and Mental Hygiene, Center for Cancer Surveillance and Control, is pleased to present Colorectal Cancer Disparities in Maryland 2002-2010.
We thank all the individuals who contributed to the development and careful review of this publication. Various units within the Maryland Department of Health and Mental Hygiene contributed staff resources to the creation of this report, including:
• Center for Cancer Surveillance and Control, Maryland Cancer Registry• Office of Information Technology• Office of Chronic Disease Prevention, Maryland Behavioral Risk Factor
Surveillance System• Office of Minority Health and Health Disparities
statement of FundingThis publication was supported by CDC Grant Number 5U58DP002068. Its contents are solely the responsibility of the authors and do not necessarily represent the official views of the Centers for Disease Control and Prevention.

1
the Colon The colon is a hollow tube-like organ that is connected to the small intestine at the cecum. The colon starts on the lower right side of the abdomen, continues across the top under the ribs, and down the left side of the abdomen, where it ends at the rectum. The colon is divided into three parts: the right colon, transverse colon, and left colon (Figure 1).
Colorectal Cancer (CrC) CRC is cancer of the colon and rectum. Genetic changes in the normal cells of the colon can cause abnormal cell growth resulting in adenomas, or benign tumors. These adenomas may eventually progress into cancer. Seventy to 90% of CRC is believed to arise from these adenomas.2
preventing Colorectal Cancer Maryland has made great progress in reducing incidence and mortality from CRC and in reducing the disparities seen by race and gender. In order to continue these gains, there must be ongoing progress in the areas of primary and secondary prevention and assuring the best quality of care for all residents in Maryland.
Risk Factors Several risk factors may increase the chance of developing CRC, including:3
• Age (50 years and older)• Family history of CRC and/or adenomas• Personal history of adenomas, inflammatory
bowel disease (ulcerative colitis or Crohn’s colitis), or prior ovarian/endometrial cancer before age 50
• Lifestyle factors including: excessive alcohol intake, sedentary lifestyle, physical inactivity, obesity, and cigarette smoking4
The following behaviors that are associated with CRC risk were reported by Marylanders in 2010. Differences were seen by race, gender, income and education:5
• A higher proportion of African American or Black males reported being current smokers.
• A higher proportion of White males reported high-risk alcohol consumption.
• A lower proportion of African American or Black females reported being physically active.
• A higher proportion of African American or Black females were categorized as obese.
1
2
3
introDuCtion
Colorectal cancer (CRC) is the third most commonly diagnosed cancer in Maryland among both men and women, and the second leading cause of cancer-related mortality.1
1. Right colon: cecum and ascending colon2. Transverse colon3. Left colon: descending colon, sigmoid colon,
and rectum
Figure 1. parts of the Colon
2
• Cigarette smoking was highest among those age 18 and older with the lowest incomes (less than $25,000 per year) and among those with lower education attainment (high school graduate or less).
Primary Prevention Maintaining a healthy lifestyle is important, not only for the prevention of cancer, but also preventing heart disease, stroke, and diabetes. In 2004, the American Cancer Society, American Heart Association, and the American Diabetes Association supported a common agenda for primary prevention through the maintenance of body mass index (BMI) in the healthy range, tobacco avoidance and cessation, increased physical activity, and diets with increased intake of fruits and vegetables.6
Secondary Prevention of CRC through ScreeningScreening has been shown to reduce mortality from CRC, either by detecting cancer early or by detecting pre-cancerous adenomas. Currently, screening to detect CRC consists of either viewing the inside of the colon or testing for blood in the stool. The benefits, risks, and frequency of screening depend on the type of screening test. It is recommended that people at higher risk for developing CRC, due to personal or family history, should have colonoscopy screenings earlier and/or more often, at the guidance of their medical providers. Colorectal Cancer burden In 2012, it is estimated that more than 143,000 people will be diagnosed with CRC and 51,000 people will die of the disease in the U.S.7
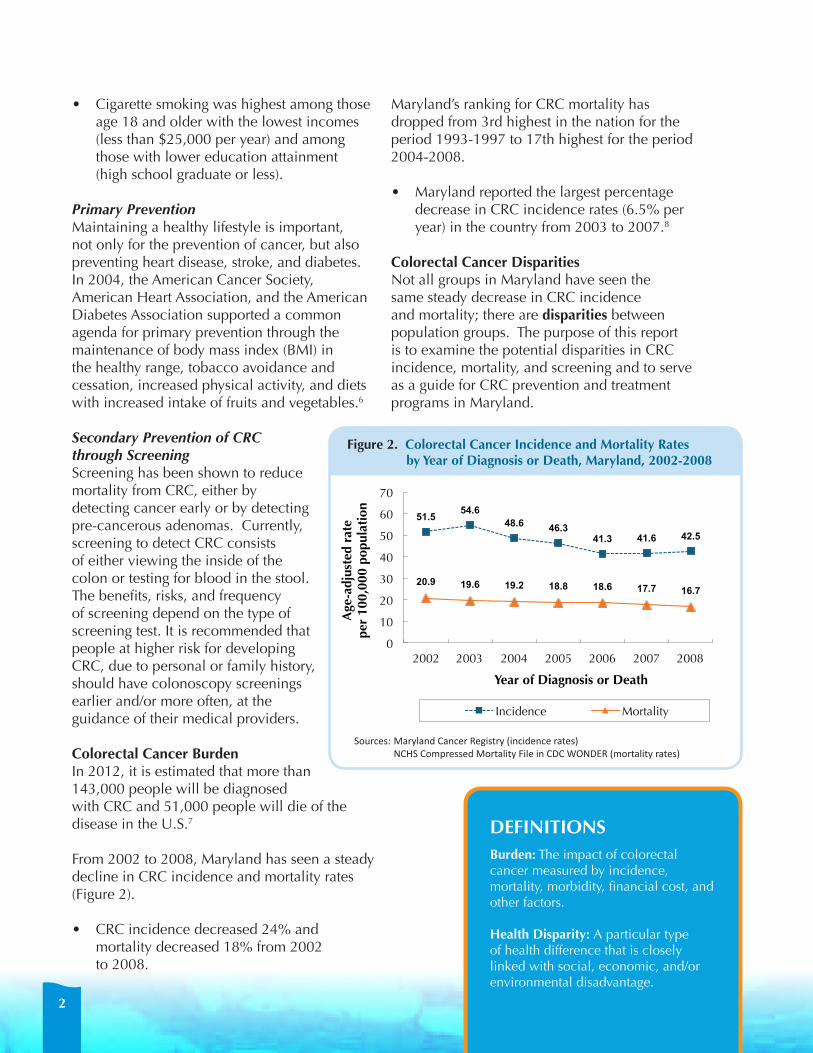
From 2002 to 2008, Maryland has seen a steady decline in CRC incidence and mortality rates (Figure 2).
• CRC incidence decreased 24% and mortality decreased 18% from 2002 to 2008.
Maryland’s ranking for CRC mortality has dropped from 3rd highest in the nation for the period 1993-1997 to 17th highest for the period 2004-2008.
• Maryland reported the largest percentage decrease in CRC incidence rates (6.5% per year) in the country from 2003 to 2007.8
Colorectal Cancer Disparities Not all groups in Maryland have seen the same steady decrease in CRC incidence and mortality; there are disparities between population groups. The purpose of this report is to examine the potential disparities in CRC incidence, mortality, and screening and to serve as a guide for CRC prevention and treatment programs in Maryland.
DeFinitionsburden: The impact of colorectal cancer measured by incidence, mortality, morbidity, financial cost, and other factors.
Health Disparity: A particular type of health difference that is closely linked with social, economic, and/or environmental disadvantage.
51.5 54.6 48.6 46.3
41.3 41.6 42.5
20.9 19.6 19.2 18.8 18.6 17.7 16.7
0
10
20
30
40
50
60
70
2002 2003 2004 2005 2006 2007 2008
Age
-adj
uste
d ra
te
per
100,
000
popu
lati
on
Year of Diagnosis or Death
Incidence Mortality
Figure 2. Colorectal Cancer Incidence and Mortality Rates by Year of Diagnosis or Death, Maryland,
2002-2008
Figure 2. Colorectal Cancer incidence and Mortality rates by Year of Diagnosis or Death, Maryland, 2002-2008
Sources:MarylandCancerRegistry(incidencerates) NCHSCompressedMortalityFileinCDCWONDER(mortalityrates)

3
Although gaps are closing, disparities by race, gender, and jurisdiction in Maryland can still be identified. Studies have shown there are numerous underlying causes of disparities including access to health care (e.g., health insurance, having a primary care provider, geographic proximity to health care), education, socioeconomic status, and cultural/religious beliefs. inCiDenCe – CRC incidence rates in Maryland are decreasing.
• From 2002 to 2008, CRC incidence decreased among both men and women; however, men continued to have higher incidence rates of CRC than women.
• Marylanders of other race had the lowest incidence of CRC, followed by Whites; African Americans or Blacks had the highest incidence rates.
• From the period 1999-2003 to 2004-2008, there was an overall decrease in CRC incidence rates throughout the state, as well as a decrease in the geographic disparity of CRC incidence rates in Maryland.
MortalitY – CRC mortality rates in Maryland are decreasing. • From 2002 to 2008, CRC mortality decreased among both men and women; however, men
continued to have higher mortality from CRC than women. • Mortality decreased for both African Americans or Blacks and Whites, but slightly increased
among Marylanders of other race. • From the period 1999-2003 to 2004-2008, the geographic disparity of CRC mortality rates
decreased.
sCreening – CRC screening in Maryland is increasing. • From 2002 to 2010, the percent of Maryland adults (age 50 years and older) with up-to-date
(UTD) CRC screening increased, with a dramatic increase in the percent having an UTD colonoscopy.
• The gap in colonoscopy screening between Whites and African Americans or Blacks was eliminated by 2010.
• In 2010, a lower proportion of people of other race reported UTD screening compared to Whites and African Americans or Blacks.
• Marylanders without health insurance reported much lower screening percentages than those with health insurance.
ColoreCtal CanCer (CrC) Disparities – at a glanCe
Major improvements have been made in CRC incidence, mortality, and screening in Maryland in the first decade of the 21st century.
4
ColoreCtal CanCer inCiDenCe
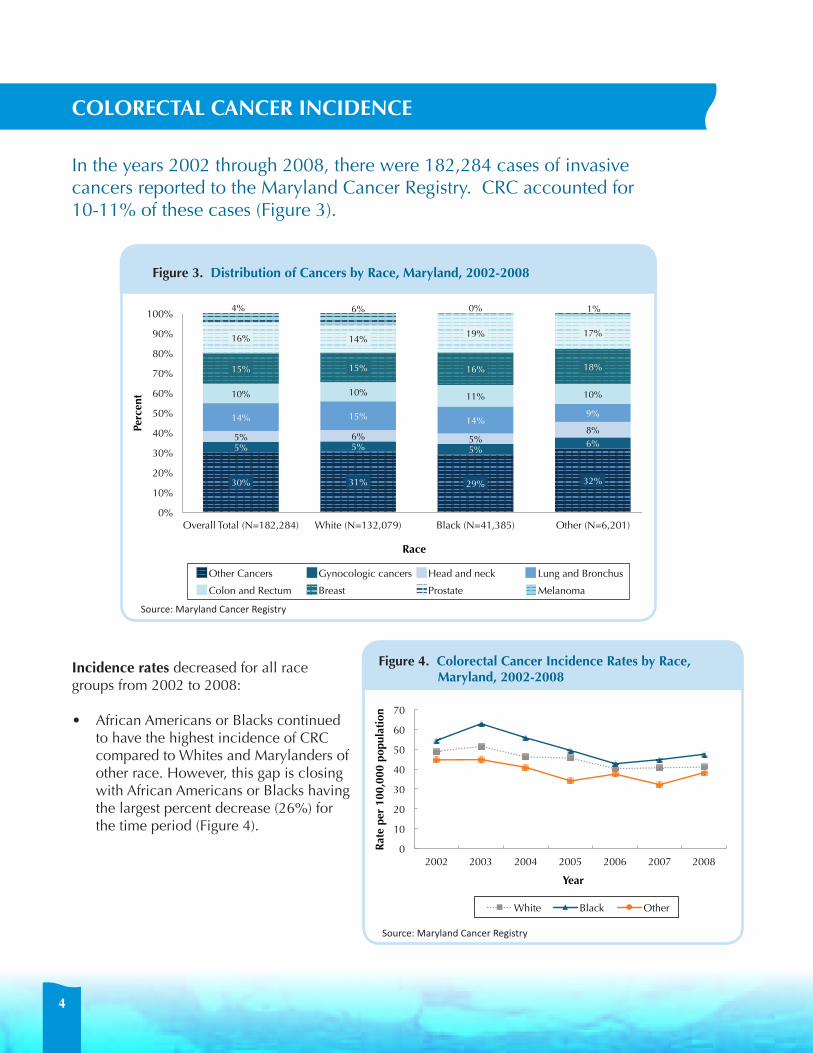
In the years 2002 through 2008, there were 182,284 cases of invasive cancers reported to the Maryland Cancer Registry. CRC accounted for 10-11% of these cases (Figure 3).
incidence rates decreased for all race groups from 2002 to 2008:
• African Americans or Blacks continued to have the highest incidence of CRC compared to Whites and Marylanders of other race. However, this gap is closing with African Americans or Blacks having the largest percent decrease (26%) for the time period (Figure 4).
30% 31% 29% 32%
5% 5% 5% 6%
5% 6% 5% 8%
14% 15% 14% 9%
10% 10% 11% 10%
15% 15% 16% 18%
16% 14% 19% 17%
4% 6% 0% 1%
0%
10%
20%
30%
40%
50%
60%
70%
80%
90%
100%
Overall Total (N=182,284) White (N=132,079) Black (N=41,385) Other (N=6,201)
Perc
ent
Race
Figure 3. Distribu.on of Cancers by Race, Maryland, 2002-‐2008
Other Cancers Gynocologic cancers Head and neck Lung and Bronchus
Colon and Rectum Breast Prostate Melanoma
Figure 3. Distribution of Cancers by race, Maryland, 2002-2008
Figure 4. Colorectal Cancer incidence rates by race, Maryland, 2002-2008
0
10
20
30
40
50
60
70
2002 2003 2004 2005 2006 2007 2008
Rat
e pe
r 10
0,00
0 po
pula
tion
Year
������������������������������������������������������� �������������������
White Black Other
0
10
20
30
40
50
60
70
2002 2003 2004 2005 2006 2007 2008 Rat
e pe
r 10
0,00
0 po
pula
tion
Year
����������������������������������������������������������������� ����� ��������������
White Male White Female Black Male Black Female
Source:MarylandCancerRegistry
Source:MarylandCancerRegistry
30% 31% 29% 32%
5% 5% 5% 6%
5% 6% 5% 8%
14% 15% 14% 9%
10% 10% 11% 10%
15% 15% 16% 18%
16% 14% 19% 17%
4% 6% 0% 1%
0%
10%
20%
30%
40%
50%
60%
70%
80%
90%
100%
Overall Total (N=182,284) White (N=132,079) Black (N=41,385) Other (N=6,201)
Perc
ent
Race
Figure 3. Distribu.on of Cancers by Race, Maryland, 2002-‐2008
Other Cancers Gynocologic cancers Head and neck Lung and Bronchus
Colon and Rectum Breast Prostate Melanoma

5
When looking at incidence rates from 2002 to 2008 cross-stratified by race and gender (Figure 5):
• African American or Black males had the highest incidence rates, followed by White males.
• African American or Black females had the greatest percentage decrease in CRC incidence (29%).
For the period 2004 to 2008, Maryland females had lower age-specific CrC incidence rates than males (data not shown).
For the period 2004 to 2008, African American or Black males and females have higher age-specific incidence rates than their White counterparts at an earlier age (Figure 6). This has been seen across the United States as well, resulting in a call for earlier CRC screening for African Americans or Blacks by some professional organizations.
DeFinitionsincidence: The number of people newly diagnosed with colorectal cancer during a specific time period, such as a year or a 5-year period.
incidence rate: The number of new colorectal cases during a specific time period divided by the total number of people in the population.
age-specific incidence rate: The rate of incidence of colorectal cancer for a specific age group (e.g., 55-59), calculated per 100,000 people.
Figure 5. Colorectal Cancer incidence rates by race and gender, Maryland, 2002-2008
Figure 6. Colorectal Cancer age-specific incidence rates by race and gender, Maryland, 2004-2008
Ages White Male Black MaleWhite FemaleBlack Female35-39 ��� ���� ��� ����40-44 ���� ���� ���� ����45-49 ���� ���� ���� ����50-54 ���� ���� ���� ����55-59 ���� ���� ���� ����
0.0
20.0
40.0
60.0
80.0
100.0
35-39 40-44 45-49 50-54 55-59 Age
-spe
cifi
c ra
te p
er 1
00,0
00 p
opul
atio
n
Age Groups
White Male Black Male White Female Black Female
0
50
100
150
200
250
300
350
400
450
500
Age
-spe
cifi
c R
ate
per
100,
000
popu
lati
on
Age Groups
White Male Black Male White Female Black Female
ages 35-39 to 55-59 Years
Source:MarylandCancerRegistry
Source:MarylandCancerRegistry
0
10
20
30
40
50
60
70
2002 2003 2004 2005 2006 2007 2008
Rat
e pe
r 10
0,00
0 po
pula
tion
Year
������������������������������������������������������� �������������������
White Black Other
0
10
20
30
40
50
60
70
2002 2003 2004 2005 2006 2007 2008 Rat
e pe
r 10
0,00
0 po
pula
tion
Year
����������������������������������������������������������������� ����� ��������������
White Male White Female Black Male Black Female
ages 20-24 to 85+ Years
85+

6
From the period 1999-2003 to 2004-2008, there has been an overall decrease in incidence rates for the majority of jurisdictions in Maryland, as well as a decrease in the variation in incidence across counties (Figure 7). The difference between the counties with the highest and lowest incidence rates decreased between the two time periods.
• For the period 2004-2008, Montgomery County had the lowest incidence rate (35.6 - 40.0 per 100,000 population) and Allegany County had the highest incidence rate (55.1 - 60.0 per 100,000 population).
Figure 7. CrC incidence rates in Maryland
1999-2003
Source:MarylandCancerRegistry
2004-2008
rate per 100,000 population35.6 - 40.0
40.1 - 45.0
45.1 - 50.0
50.1 - 55.0
55.1 - 60.0
60.1 - 65.0
65.1 - 70.00 20 40 Miles
7
ColoreCtal CanCer MortalitY
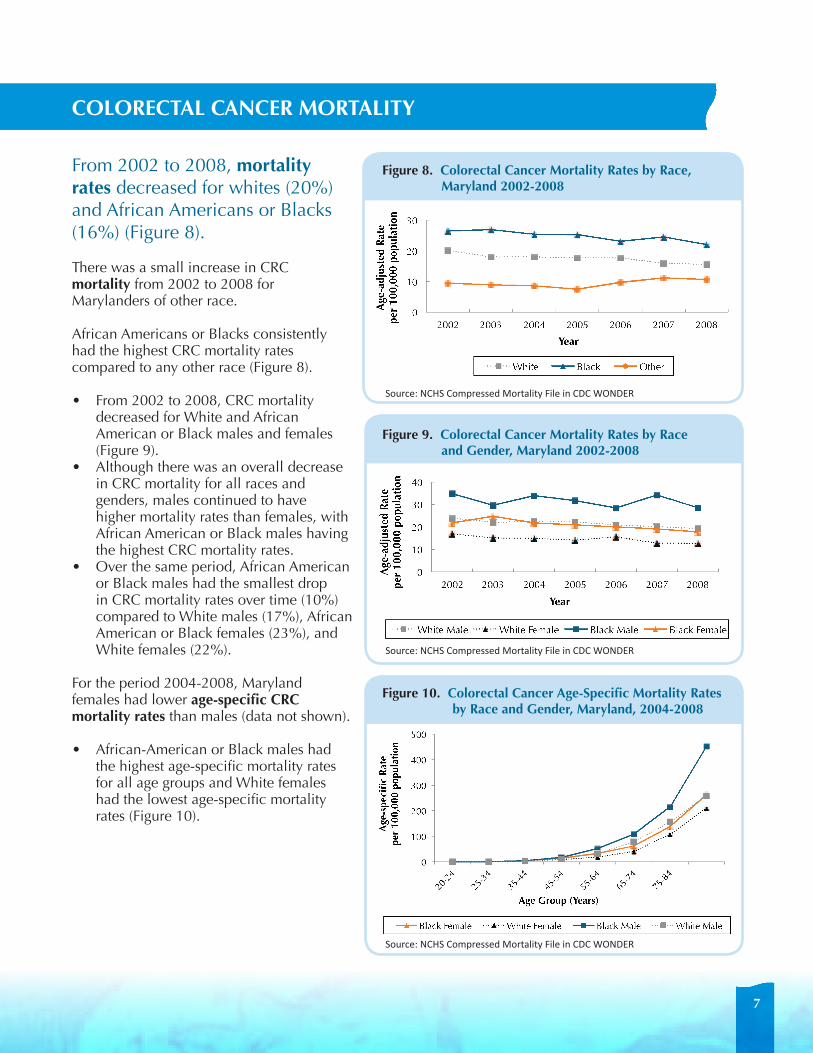
From 2002 to 2008, mortality rates decreased for whites (20%) and African Americans or Blacks (16%) (Figure 8).
There was a small increase in CRC mortality from 2002 to 2008 for Marylanders of other race.
African Americans or Blacks consistently had the highest CRC mortality rates compared to any other race (Figure 8).
• From 2002 to 2008, CRC mortality decreased for White and African American or Black males and females (Figure 9).
• Although there was an overall decrease in CRC mortality for all races and genders, males continued to have higher mortality rates than females, with African American or Black males having the highest CRC mortality rates.
• Over the same period, African American or Black males had the smallest drop in CRC mortality rates over time (10%) compared to White males (17%), African American or Black females (23%), and White females (22%).
For the period 2004-2008, Maryland females had lower age-specific CrC mortality rates than males (data not shown). • African-American or Black males had
the highest age-specific mortality rates for all age groups and White females had the lowest age-specific mortality rates (Figure 10).
Figure 8. Colorectal Cancer Mortality rates by race, Maryland 2002-2008
Figure 9. Colorectal Cancer Mortality rates by race and gender, Maryland 2002-2008
Figure 10. Colorectal Cancer age-specific Mortality rates by race and gender, Maryland, 2004-2008
Black Female White Female Black Male White Male20-24 ** ** ** **25-34 ** ** ** **35-44 3.7 3.0 3.8 2.545-54 14.3 7.6 16.3 10.555-64 32.4 18.5 52.0 31.665-74 61.9 40.3 108.5 78.975-84 138.2 107.3 215.1 156.585+ 262.1 209.5 452.4 258.2
0
100
200
300
400
500
Age
-spe
cifi
c R
ate
pe
r 10
0,00
0 po
pula
tion
Age Group (Years)
Figure 11. Colorectal Cancer Age-specific Mortality Rates by Race and Gender, Maryland, 2004-2008
Black Female White Female Black Male White Male
���� ���� ���� ���� ���� ���� ����� ������ �� � ���� ���� ���� ���� ���� ���� ����� �������� �� � ���� ���� ���� ���� ���� ���� �������� ��� �� � ���� ���� ���� ���� ���� ���� �������� ����� �� � ���� ���� ���� ���� ���� ���� ����
0
10
20
30
40
2002 2003 2004 2005 2006 2007 2008
Age
-adj
uste
d R
ate
pe
r 10
0,00
0 po
pula
tion
Year
White Male White Female Black Male Black Female
���� ���� ���� ���� ���� ���� ����� ���� ���� ���� ���� ���� ���� ���� �������� � ���� ���� ���� ���� ���� ���� ����� ���� ��� ��� ��� ��� ��� ���� ����
0
10
20
30
2002 2003 2004 2005 2006 2007 2008
Age
-adj
uste
d R
ate
pe
r 10
0,00
0 po
pula
tion
Year
White Black Other
Source:NCHSCompressedMortalityFileinCDCWONDER
Source:NCHSCompressedMortalityFileinCDCWONDER
Source:NCHSCompressedMortalityFileinCDCWONDER

8
From the period 1999-2003 to 2004-2008, there was an overall decrease in the mortality rates for the majority of jurisdictions in Maryland, as well as a decrease in the variation in mortality across counties (Figure 11).
• Montgomery County continued to have the lowest mortality rate for both periods.
Figure 11. CrC Mortality in Maryland
1999-2003
2004-2008DeFinitionsMortality: The number of people who died from colorectal cancer during a specific time period, such as a year or 5-year period. Mortality rate: The number of colorectal cancer deaths during a specific time period divided by the number of people in the population.
age-specific Mortality rate: The rate of colorectal cancer deaths for a specific age group (e.g., 55-59), calculated per 100,000 people.
Source:NCHSCompressedMortalityFileinCDCWONDER
rate per 100,000 population
20.3 - 23.2
23.3 - 26.2
26.3 - 29.70 40 80 Miles
12.2 - 14.2
14.3 - 17.2
17.3 - 20.2

9
ColoreCtal CanCer sCreening
CRC screening is important for prevention and early cancer detection. There are several CRC screening options.
screening test Description
up-to-Date (per american Cancer society
guidelines)10
Colonoscopy A doctor uses a long, flexible, lighted tube to check for CRC or adenomas inside the entire colon and rectum. Suspected adenomas can be removed and sent to a lab for diagnosis.
Every 10 years
Sigmoidoscopy This test is similar to a colonoscopy except that a doctor can only check for CRC or adenomas inside the rectum and lower third of the colon. Suspected adenomas can be removed and sent to a lab for diagnosis.
Every 5 years
Fecal Immunochemical Test (FIT)
An at-home test kit that a medical provider gives to a patient. Two to three stool samples are collected using a stick or brush and placed on a test card. The sample is sent to a lab. The test uses antibodies to check for blood in the stool.
Yearly
Fecal Occult Blood Test (FOBT)
This test is similar to the FIT except that a chemical, guaiac, is used to detect blood in the stool.
Yearly
The most commonly used screening tests are stool blood tests (fecal occult blood test and fecal immunochemical test), colonoscopy, and sigmoidoscopy (Table 1). A person is considered to be up-to-date (UTD) for CRC screening if they have had any of the screening tests described in Table 1 in the prescribed time period; colonoscopy within the past 10 years, sigmoidoscopy within the past 5 years, stool blood testing within the past year, or sigmoidoscopy in the past 5 years and stool blood testing the past year.
The U.S. Preventive Task Force recommends that everyone between the ages of 50-75 years who is at average risk for developing CRC should receive a CRC screening using FOBT, sigmoidoscopy, or colonoscopy. A health care provider can discuss screening options with each patient to determine which test is most appropriate.9
DeFinitionscreening: The performance of a test to check for disease when there are no symptoms, resulting in the detection of pre-cancer or cancer at an early stage.
table 1. Commonly used Colorectal Cancer screening tests

10
Along with the decrease in CRC incidence and mortality, there has been a rise in CRC screening in Maryland.
• From 2002 to 2010, the percentage of adults, age 50 years and older, who reported being up-to-date for CRC screening by any method increased from 64% to 71%.
• The percentage of adults who reported having been screened with colonoscopy within the past 10 years rose from 41% in 2002 to 66% in 2010 (Figure 12).
There has been a steady increase in UTD screening by any method for all race groups from 2002 to 2010 (Figure 13).
• There was a 19% increase in UTD screening in African Americans or Blacks; there was also a 24% increase for adults of other race and an 8% increase for Whites.
• While a smaller proportion of adults of other race reported having been screened for CRC, this group had the highest percent increase over the time period, showing improvement.
• The gap in screening between Whites and African Americans or Blacks was eliminated by 2010.
Having access to health care remains one of the key predictors of CRC screening.11 Not having health insurance remains a primary factor in CRC screening disparities.
• The proportion of adults who reported never being screened for CRC has been consistently higher among the uninsured in each survey year from 2002 to 2010 (Figure 14).
• There has been a 26% decrease in the proportion of uninsured adults who reported never being screened for CRC by any method. There are a few possible explanations for this trend: ˙
• The increase in screening among the uninsured may be due to outreach and public health CRC screening programs which have targeted low income and uninsured Marylanders throughout the state.
• It may also reflect past screening among previously insured Marylanders who have recently lost access to health insurance.
Figure 12. Colorectal Cancer screening Measures among Maryland adults age 50 Years and older, 2002-2010
Figure 13. percentage of Maryland adults age 50 Years and older, who reported being up-to-Date with Colorectal Cancer screening by any Method by race, 2002-2012
2002 2004 2006 2008 2010Never screened 26% 23% 20% 22% 22%Up-to-date colonoscopy 41% 50% 59% 63% 66%Up-to-date any method 64% 67% 69% 70% 71%
26% 23% 20% 22% 22%
41%
50%
59% 63% 66% 64% 67%
69% 70% 71%
0%
20%
40%
60%
80%
2002 2004 2006 2008 2010
Figure 13. Colorectal Cancer Screening Measures among Maryland Adults Age 50 Years and Older, 2002-‐2010
Never screened Up-to-date colonoscopy Up-to-date any method
2002 2004 2006 2008 2010White 65% 69% 70% 71% 71%Black 62% 64% 67% 70% 74%Other 52% 50% 63% 59% 63%
65% 62%
52%
69% 64%
50%
70% 67%
63%
71% 70%
59%
71% 74%
63%
0%
20%
40%
60%
80%
White Black Other
Figure 14. Percentage of Maryland Adults Age 50 Years and Older, who Reported being Up-‐to-‐Date with Colorectal Cancer Screening by Any Method by Race, 2002-‐2010
2002 2004 2006 2008 2010
Sources:MarylandCancerSurvey(2002-2006) MarylandBehavioralRiskFactorSurveillanceSystemSurvey(2008-2010)
Sources:MarylandCancerSurvey(2002-2006) MarylandBehavioralRiskFactorSurveillanceSystem(2008-2010)
11
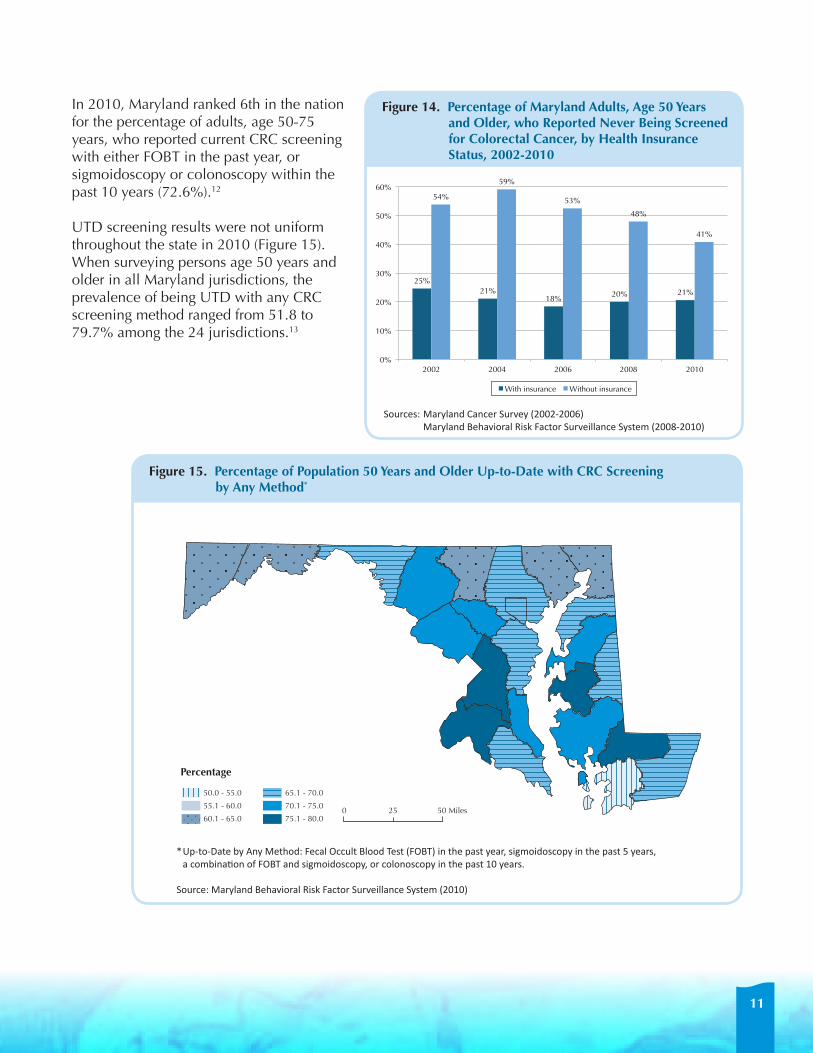
In 2010, Maryland ranked 6th in the nation for the percentage of adults, age 50-75 years, who reported current CRC screening with either FOBT in the past year, or sigmoidoscopy or colonoscopy within the past 10 years (72.6%).12
UTD screening results were not uniform throughout the state in 2010 (Figure 15). When surveying persons age 50 years and older in all Maryland jurisdictions, the prevalence of being UTD with any CRC screening method ranged from 51.8 to 79.7% among the 24 jurisdictions.13
2002 2004 2006 2008 2010With insurance 25% 21% 18% 20% 21%Without insurance 54% 59% 53% 48% 41%
25% 21%
18% 20% 21%
54%
59%
53%
48%
41%
0%
10%
20%
30%
40%
50%
60%
2002 2004 2006 2008 2010
Figure 15. Percentage of Maryland Adults, Age 50 Years and Older, who Reported Never Being Screened for Colorectal Cancer, by Health Insurance Status, 2002-‐2010
With insurance Without insurance
Figure 15. percentage of population 50 Years and older up-to-Date with CrC screening by any Method*
Figure 14. percentage of Maryland adults, age 50 Years and older, who reported never being screened for Colorectal Cancer, by Health insurance status, 2002-2010
Sources:MarylandCancerSurvey(2002-2006) MarylandBehavioralRiskFactorSurveillanceSystem(2008-2010)
*Up-to-DatebyAnyMethod:FecalOccultBloodTest(FOBT)inthepastyear,sigmoidoscopyinthepast5years, acombinationofFOBTandsigmoidoscopy,orcolonoscopyinthepast10years.
Source:MarylandBehavioralRiskFactorSurveillanceSystem(2010)
percentage
65.1 - 70.0
70.1 - 75.0
75.1 - 80.00 25 50 Miles
50.0 - 55.0
55.1 - 60.0
60.1 - 65.0
12
staging oF ColoreCtal CanCer
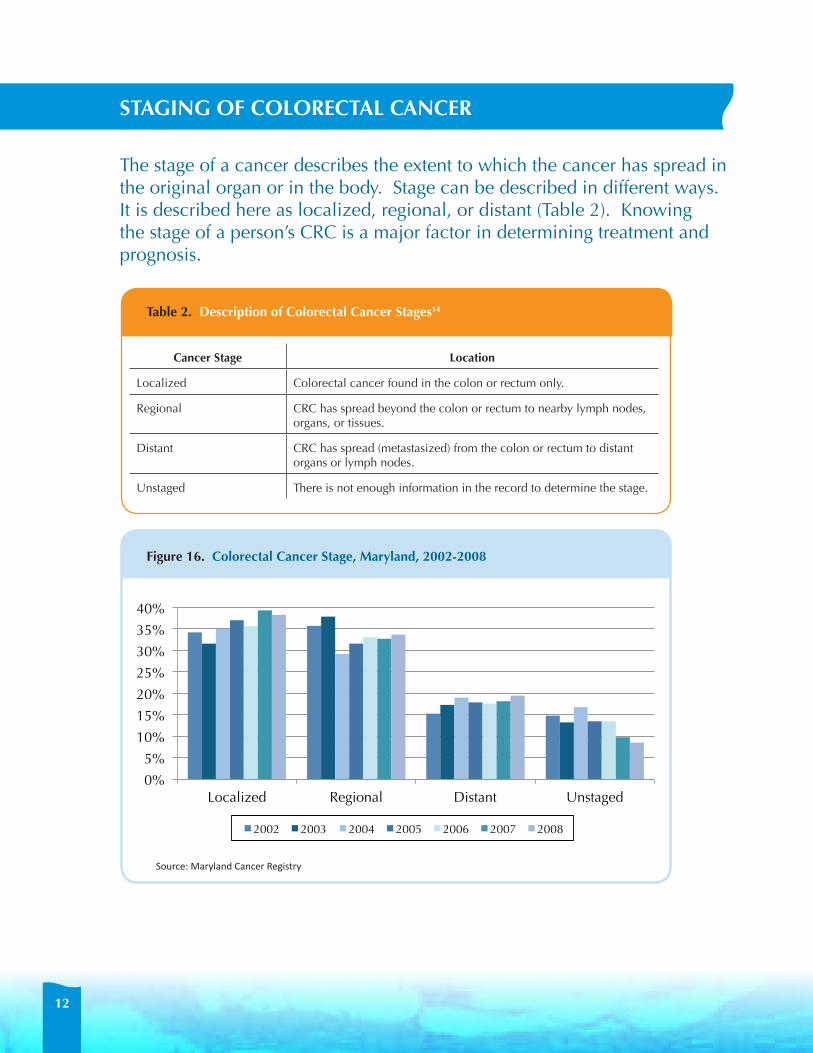
The stage of a cancer describes the extent to which the cancer has spread in the original organ or in the body. Stage can be described in different ways. It is described here as localized, regional, or distant (Table 2). Knowing the stage of a person’s CRC is a major factor in determining treatment and prognosis.
Cancer stage location
Localized Colorectal cancer found in the colon or rectum only.
Regional CRC has spread beyond the colon or rectum to nearby lymph nodes, organs, or tissues.
Distant CRC has spread (metastasized) from the colon or rectum to distant organs or lymph nodes.
Unstaged There is not enough information in the record to determine the stage.
table 2. Description of Colorectal Cancer stages14
Figure 16. Colorectal Cancer stage, Maryland, 2002-2008
2002 2003 2004 2005 2006 2007 2008Localized 34% 32% 35% 37% 36% 39% 38%Regional 36% 38% 29% 32% 33% 33% 34%Distant 15% 17% 19% 18% 18% 18% 19%Unstaged 15% 13% 17% 13% 14% 10% 9%
0%
5%
10%
15%
20%
25%
30%
35%
40%
Localized Regional Distant Unstaged
2002 2003 2004 2005 2006 2007 2008
Source:MarylandCancerRegistry

13
From 2002 to 2008, the reporting of stage to the Maryland Cancer Registry improved, as seen by the decrease in unstaged cancers, from almost 15% in 2002, to less than 9% in 2008.
• During this time period, there was an increase in cancers reported at the localized stage, a decrease at the regional stage, and a slight increase at the distant stage (Figure 16).
• Late stage cancers (regional and distant stage combined) made up over 50% of cancers diagnosed in most years for the period 2002-2008.
• Both Whites and African Americans or Blacks saw a small increase in the percent of CRC diagnosed at distant stage, with a slightly higher proportion among African American or Blacks than Whites. This disparity appears to be decreasing, with little difference between race in 2008 (Figure 17).
Figure 17. percentage of Colorectal Cancer Diagnosed at Distant stage by race, Maryland, 2002-2010
���� ���� ���� ���� ���� ���� ����� ���� ��� ��� ��� ��� ��� ��� ������� � ��� ��� ��� ��� ��� ��� ���
0%
5%
10%
15%
20%
25%
2002 2003 2004 2005 2006 2007 2008
White Black
Source:MarylandCancerRegistry
14
ColoreCtal CanCer treatMent
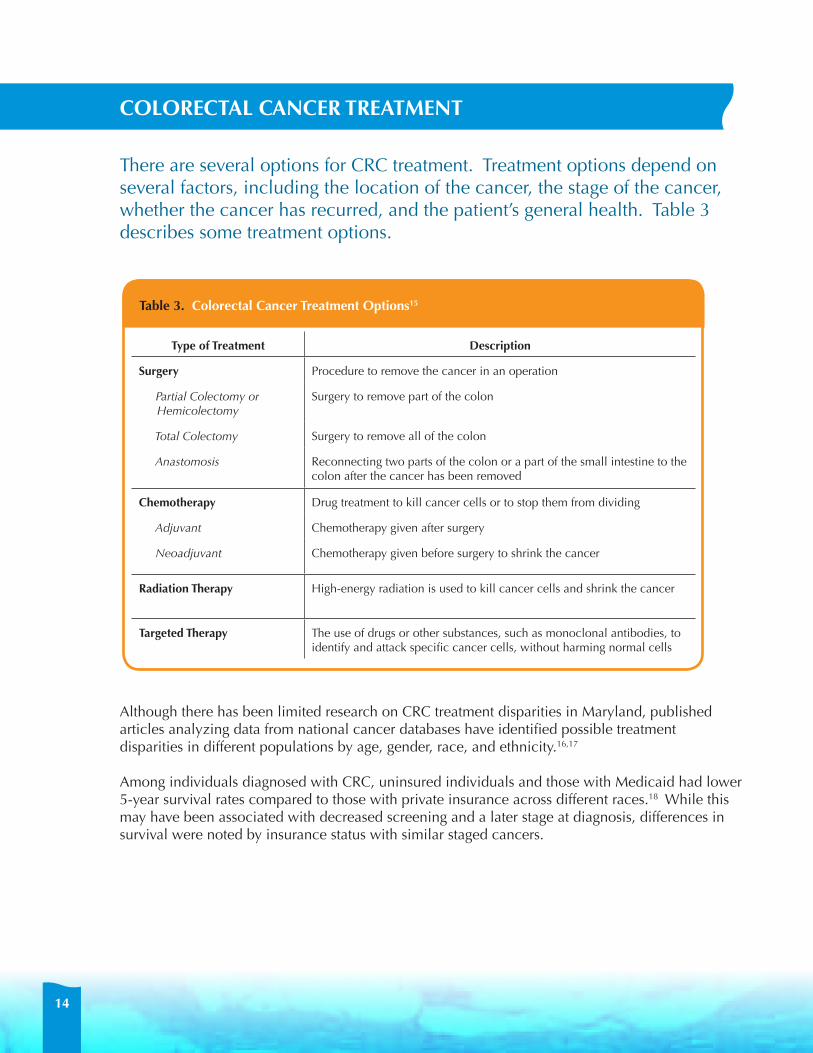
There are several options for CRC treatment. Treatment options depend on several factors, including the location of the cancer, the stage of the cancer, whether the cancer has recurred, and the patient’s general health. Table 3 describes some treatment options.
type of treatment Description
surgery Procedure to remove the cancer in an operation
Partial Colectomy or Hemicolectomy
Surgery to remove part of the colon
Total Colectomy Surgery to remove all of the colon
Anastomosis Reconnecting two parts of the colon or a part of the small intestine to the colon after the cancer has been removed
Chemotherapy Drug treatment to kill cancer cells or to stop them from dividing
Adjuvant Chemotherapy given after surgery
Neoadjuvant Chemotherapy given before surgery to shrink the cancer
radiation therapy High-energy radiation is used to kill cancer cells and shrink the cancer
targeted therapy The use of drugs or other substances, such as monoclonal antibodies, to identify and attack specific cancer cells, without harming normal cells
table 3. Colorectal Cancer treatment options15
Although there has been limited research on CRC treatment disparities in Maryland, published articles analyzing data from national cancer databases have identified possible treatment disparities in different populations by age, gender, race, and ethnicity.16,17
Among individuals diagnosed with CRC, uninsured individuals and those with Medicaid had lower 5-year survival rates compared to those with private insurance across different races.18 While this may have been associated with decreased screening and a later stage at diagnosis, differences in survival were noted by insurance status with similar staged cancers.

15
screeningFrom 2002 to 2010, increases were seen in CRC screening among White and African American or Black males and females in Maryland so that by 2010, little disparity in screening was seen among these four groups. Maryland adults who reported their race other than White or African American or Black continued to lag behind. The difference in self-reported CRC screening between those who have health insurance and those without health insurance decreased over time, though a gap remains. It is known that there are many barriers to CRC screening which may be at the patient, provider, or health system level.
Patient barriers may include: lack of awareness about CRC screening recommendations; lack of a regular health care provider or lack of recommendation for screening by a health care provider; cost of copay or deductible; lack of insurance; difficulty with transportation or taking time off from work; fear of the screening test or of the test results; and language or cultural barriers.
Provider barriers may include: a lack of knowledge about current regulations or not following current best practices; a lack of office reminder systems to ensure that screening is recommended; and the inability to meet the needs of a multicultural practice.
Health care system barriers may include: a lack of medical care or medical home; a lack of funding for uninsured patients who are diagnosed with CRC; a lack of primary-care physicians and medical providers who are able to perform CRC screening; high co-pays and deductibles for the insured; and a lack of medical providers who accept uninsured, Medical Assistance, or Medicare patients.
Barriers to CRC screening are addressed in the Maryland Comprehensive Cancer Control Plan, and strategies for addressing these barriers are included in the Cancer Disparities and Colorectal Cancer chapters of the Plan. For more information, visit http://fha.dhmh.maryland.gov/cancer/cancerplan.
treatmentWhile there have been increases throughout the first decade of the 21st century in CRC screening in Maryland, African Americans or Blacks have not achieved the same improvement in CRC mortality rates that have been exhibited in other racial/ethnic groups. Barriers to cancer treatment have been described at the patient, physician, and geographic levels for some cancers and may apply to CRC.
Physician related barriers to treatment:19
Physician recommendation has been shown to be a strong indicator of the chosen treatment method. However, recommendations may vary based on the physician’s age, gender, specialty, and beliefs in the efficacy of care. A 1996 study showed that some physicians delay in adapting to or otherwise do not change their current practice to comply with current cancer treatment guidelines. Additionally, physician-patient communication has been shown to influence a patient’s compliance with their care and treatment outcomes.
barriers to sCreening anD treatMent
16
Geographic related barriers to treatment:20
Cancer treatment may be more available in geographic areas where there are higher numbers of physicians. Based on a 2010 study, seniors were more likely to undergo colon resection and receive appropriate chemotherapy if they lived in an area with more surgeons and medical oncologists.
existing Maryland programs to address barriersThe Maryland Department of Health and Mental Hygiene (MDHMH) has several initiatives throughout the state to address CRC disparities in order to improve screening rates and lower incidence and mortality. These include:
• Cigarette Restitution Fund Program and the Cancer Prevention, Education, Screening and Treatment Program (2000-Present) - provides cancer screening and education to low income, uninsured, and underinsured adults.
• Maryland Colorectal Cancer Control Program (2009-Present) - provides cancer screening and education to low income, uninsured, and underinsured adults in selected counties in Maryland; works with Federally Qualified Health Care Centers to promote screening and implements a CRC media campaign to increase awareness in Baltimore City.
• Maryland Comprehensive Cancer Control Plan (2011) - addresses a broad range of cancer issues in Maryland and offers information, goals, and strategies to lower the CRC disparity in the state.
• Maryland Cancer Fund (2004-Present) - provides funding for cancer diagnosis and treatment for low income, uninsured, and underinsured Marylanders.
• Minority Health and Health Disparities Minority Outreach and Technical Assistance (MOTA) Program (2004 - Present) - provides outreach and technical assistance to minority communities to enhance the efforts of local health departments to decrease the incidence of cancer and cancer deaths and increase the prevention and control of tobacco use in minority communities throughout the State.
It is hoped that these underlying disparities continue to be addressed in Maryland so that the progress we have seen in the recent past will continue. Efforts should be focused on provider education, patient education, and improvement of health care systems including working with health plans to promote and offer screening. Particular attention needs to be focused on those of other race (races other than White and African American or Black) so as to reverse the upward trend in CRC mortality. Maryland should continue to support initiatives designed to eliminate the remaining racial, gender, and jurisdictional disparities observed in CRC.

17
CRC data used in this monograph were supplied from the following sources:
• Incidence, staging and primary site of CRC data were provided by the Maryland Cancer registry (MCr) - Center for Cancer Surveillance and Control (CCSC), Maryland Department of Health and Mental Hygiene (DHMH). The MCR acknowledges the State of Maryland, the Maryland Cigarette Restitution Fund, and the National Program of Cancer Registries (NPCR) of the Centers for Disease Control and Prevention (CDC) for the funds that helped support the availability of the cancer registry data.
• Maryland and U.S. mortality data presented were obtained from the national Center for Health statistics (nCHs) Compressed Mortality Files in the CDC Wide-ranging Online Data for Epidemiologic Research (WONDER) system.
• Maryland mortality ranking data were obtained from the Cigarette restitution Fund Cancer reports published annually by the Surveillance and Evaluation Unit (SEU), CCSC, DHMH.
• Maryland CRC screening data were obtained from Maryland Cancer surveys (MCs) for the years 2002, 2004, and 2006. This biennial telephone survey was commissioned by the SEU, CCSC and managed by the Department of Epidemiology and Public Health at the University of Maryland Baltimore School of Medicine.
• Maryland CRC screening data were obtained from the behavioral risk Factor surveillance system (brFss) surveys for years 2008 and 2010. This survey is managed by the DHMH Family Health Administration, Office of Chronic Disease Prevention.
Changes over time in incidence, mortality, and screening rates were examined by calculating percent differences using trend line analysis and regression equations generated in Microsoft Excel. The regression equations provided estimates that were used to obtain the rates at the extremities of the time period, which were then used to calculate the percent differences for the period.
For this report, race is defined per MCR guidelines; White race and African American or Black race include people of Hispanic ethnicity who also report race as White or Black. “Other” race includes Asian, American Indian and Alaska Native, Hawaiian or other Pacific Islander, Hispanics without a reported race, and multi-race.
Data sourCes anD MetHoDs

18
glossarY
age-specific incidence rate: The rate of incidence of colorectal cancer for a specific age group (e.g., 55-59), calculated per 100,000 people.
age-specific Mortality rate: The rate of colorectal cancer deaths for a specific age group (e.g., 55-59), calculated per 100,000 people.
Cancer stage: The extent to which cancer has spread in the organ or body. There are four cancer stages: local, regional, distant, and unstaged.
incidence (of Colorectal Cancer): Number of people newly diagnosed with colorectal cancer during a specific time period, such as a year or a 5-year period. incidence rate: Number of new colorectal cases during a specific time period divided by the number of people in the population.
Mortality (of Colorectal Cancer): The number of colorectal cancer deaths during a specific time period, such as a year or 5-year period.
Mortality rate: The number of deaths due to colorectal cancer within a specific time (such as a year or a 5-year period) divided by the number of people in the population.
race: A group of people of common decent who share hereditary characteristics. Race definitions, for this report, are based on the Maryland Cancer Registry guidelines:
• White and African American or Black race include people of Hispanic ethnicity who also report race as White or Black.
• Other race includes Asian, American Indian and Alaska Native, Hawaiian or other Pacific Islander, Hispanics without a reported race, and multi-race.
screening: Performing a test to check for disease when there are no symptoms, resulting in the detection of pre-cancer or cancer at an early stage.

19
reFerenCes
1 Maryland Comprehensive Cancer Control Plan, Maryland Department of Health and Mental Hygiene, updated July 2011. Available at: http://fha.dhmh.maryland.gov/cancer/cancerplan/SitePages/Home.aspx. Last accessed April 30, 2012.
2 Rudy DR and Zdon MJ. Update on CRC. Am Fam Physician. 2000;6:1759-70, 1773-4.
3 National Cancer Institute at the National Institutes of Health. Colon cancer prevention (PDQ). Available at: http://www.cancer.gov/cancertopics/pdq/prevention/colorectal/HealthProfessional/page1. Last accessed April 30, 2012.
4 National Cancer Institute at the National Institutes of Health. Colon cancer prevention (PDQ). Available at: http://www.cancer.gov/cancertopics/pdq/prevention/colorectal/HealthProfessional/page2. Last accessed April 30, 2012.
5 Maryland Department of Health and Mental Hygiene, Family Health Administration, Behavioral Risk Factor Surveillance System 2010. Available at: http://fha.dhmh.maryland.gov/SitePages/brfss.aspx. Last accessed April 30, 2012.
6 Eyre H, Kahn R, Robertson RM; ACS/ADA/AHA Collaborative Writing Committee. Preventing cancer, cardiovascular disease, and diabetes: a common agenda for the American Cancer Society, the American Diabetes Association, and the American Heart Association. CA Cancer J Clin. 2004 Jul-Aug;54(4):190-207.
7 American Cancer Society. Facts and Figures 2012. Atlanta: American Cancer Society. 2012. Available at: http://www.cancer.org/acs/groups/content/@epidemiologysurveilance/documents/document/acspc-031941.pdf. Last accessed April 30, 2012.
8 Vital Signs: Colorectal Cancer Screening, Incidence, and Mortality — United States, 2002—2010. MMWR Morb Mortal Wkly Rep. 2011 July 8;60(26):884-889. Available at: http://www.cdc.gov/mmwr/preview/mmwrhtml/mm6026a4.htm?s_cid=mm6026a4_w. Last accessed April 30, 2012.
9 United States Preventive Services Task Force. Screening for Colorectal Cancer. Release date October, 2008. Available at: http://www.uspreventiveservicestaskforce.org/uspstf/uspscolo.htm. Last accessed April 30, 2012.
10 American Cancer Society. Cancer Detection Guidelines. Available at: http://www.cancer.org/docroot/PED/content/PED_2_3X_ACS_Cancer_Detection_Guidelines_36.asp?sitearea=PED. Last accessed April 30, 2012.
11 Cancer Screening — United States, 2010. MMWR Morb Mortal Wkly Rep. 2012 Jan 27;61(3):41-5. Available at: http://www.cdc.gov/mmwr/preview/mmwrhtml/mm6103a1.htm#fig. Last accessed April 30, 2012.
12 See note 6.
13 See note 3.
14 National Cancer Institute, National Institutes of Health. Cancer Staging. Available at: http://www.cancer.gov/cancertopics/factsheet/detection/staging. Last accessed April 30, 2012.
15 White A, Vernon SW. Franzini L, Du XL. Racial disparities in colorectal cancer survival: To what extent are racial disparities explained by differences in treatment, tumor characteristics, or hospital characteristics? Cancer. 2010 Oct; 116(19):4622-31.
16 See note 15.
17 Haas JS, Brawarsky P, Iyer A, Fitzmaurice GM, Neville BA, Earle C. Association of area sociodemographic characteristics and capacity for treatment with disparities in colorectal cancer care and mortality. Cancer. 2011 Sep; 117(18):4267-76.
18 Ward E, Halpern M, Schrag N, Cokkinides V, DeSantis C, Bandi P, et al. Association of insurance with cancer care utilization and outcomes. CA Cancer J Clin. 2008 Jan-Feb; 58(1):9-31.
19 Mandelblatt J, Yabroff K, and Kerner J. Access to Quality Cancer Care: Evaluating and Ensuring Equitable Services, Quality of Life, and Survival. Institute of Medicine Report September 2009. Available at: http://www.iom.edu/~/media/Files/Activity%20Files/Disease/NCPF/mandle.pdf. Last accessed April 2, 2012.
20 See note 17.


The services and facilities of the Maryland Department of Health and Mental Hygiene (DHMH) are operated on a non-discriminatory basis. This policy prohibits discrimination on the basis of race, color, sex or national origin and applies to the provisions of employment and granting of advantages, privileges and accommodations.
The Department, in compliance with the Americans with Disabilities Act, ensures that qualified individuals with disabilities are given an opportunity to participate in and benefit from DHMH services, programs, benefits and employment opportunities.
Maryland Department of Health & Mental HygieneMartin o’Malley, Governor • anthony g. brown, Lt. Governor • Joshua M. sharfstein, MD, Secretary
Printed June 2012