columbia exhibit no. columbia exhibit no. …nisource.com... · columbia exhibit no. commonwealth...
TRANSCRIPT

Columbia Exhibit No.
COMMONWEALTH OF KENTUCKY BEFORE THE PUBLIC SERVICE COMMISSION
In the matter of: ) )
APPLICATION OF COLUMBIA GAS ) OF KENTUCKY, INC. FOR AN ) ADJUSTMENT OF RATES )
Case No. 2016-00162
PREPARED REBUTTAL TESTIMONY OF PAUL R MOUL
ON BEHALF OF COLUMBIA GAS OF KENTUCKY, INC.
Brooke E. Wancheck, Assistant General Counsel
Stephen B. Seiple, Assistant General Counsel Joseph M. Clark, Senior Counsel 290 W. Nationwide Blvd. Columbus, Ohio 43216-0117 Telephone: (614) 460-5558 E-mail: [email protected]
[email protected] [email protected]
Richard S. Taylor 225 Capital Avenue Frankfort, Kentucky 40601 Telephone: (502) 223-8967 Fax: (502) 226-6383 Email: [email protected]
October 21, 2016
Lindsey W. Ingram III Stoll Keenon Ogden PLLC 300 West Vine Street, Suite 2100 Lexington, Kentucky 40507-1801 Telephone: (859) 231-3982 Fax: (859): 246-3672 Email: [email protected]
Attorneys for COLUMBIA GAS OF KENTUCKY, INC.
Columbia Exhibit No. _____
COMMONWEALTH OF KENTUCKY
BEFORE THE PUBLIC SERVICE COMMISSION
In the matter of:
APPLICATION OF COLUMBIA GAS
OF KENTUCKY, INC. FOR AN
ADJUSTMENT OF RATES
)
)
)
)
)
Case No. 2016-00162
PREPARED REBUTTAL TESTIMONY OF
PAUL R. MOUL
ON BEHALF OF COLUMBIA GAS OF KENTUCKY, INC.
Brooke E. Wancheck,
Assistant General Counsel
Stephen B. Seiple, Assistant General Counsel
Joseph M. Clark, Senior Counsel
290 W. Nationwide Blvd.
Columbus, Ohio 43216-0117
Telephone: (614) 460-5558
E-mail: [email protected]
Richard S. Taylor
225 Capital Avenue
Frankfort, Kentucky 40601
Telephone: (502) 223-8967
Fax: (502) 226-6383
Email: [email protected]
Lindsey W. Ingram III
Stoll Keenon Ogden PLLC
300 West Vine Street, Suite 2100
Lexington, Kentucky 40507-1801
Telephone: (859) 231-3982
Fax: (859): 246-3672
Email: [email protected]
Attorneys for
October 21, 2016 COLUMBIA GAS OF KENTUCKY, INC.

1 PREPARED REBUTTAL TESTIMONY OF PAUL R MOUL
2 Q: Please state your name, occupation and business address.
3 A: My name is Paul Ronald Moul. My business address is 251 Hopkins Road,
4 Haddonfield, New Jersey 08033-3062. I am Managing Consultant at the firm
5 P. Moul & Associates, an independent financial and regulatory consulting
6 firm.
7
8 Q: Did you file Direct Prepared Testimony in this proceeding?
9 A: Yes, I did.
10
11 Q: What is the purpose of your Rebuttal Testimony in this proceeding?
12 A: My testimony responds to the direct testimony submitted by Richard A.
13 Baudino and Lane Kollen, witnesses appearing on behalf of the Attorney
14 General. If I fail to address each and every issue in the testimony of Messrs.
15 Baudino and Kollen, it does not imply agreement with those issues. I have
16 also prepared an update of my original analysis of the Company's cost of
17 equity.
18
19 Q: What are the key rate of return issues that the Commission should consider
20 when deciding this case?
1 1
PREPARED REBUTTAL TESTIMONY OF PAUL R. MOUL1
Q: Please state your name, occupation and business address.2
A: My name is Paul Ronald Moul. My business address is 251 Hopkins Road,3
Haddonfield, New Jersey 08033-3062. I am Managing Consultant at the firm4
P. Moul & Associates, an independent financial and regulatory consulting5
firm.6
7
Q: Did you file Direct Prepared Testimony in this proceeding?8
A: Yes, I did.9
10
Q: What is the purpose of your Rebuttal Testimony in this proceeding?11
A: My testimony responds to the direct testimony submitted by Richard A.12
Baudino and Lane Kollen, witnesses appearing on behalf of the Attorney13
General. If I fail to address each and every issue in the testimony of Messrs.14
Baudino and Kollen, it does not imply agreement with those issues. I have15
also prepared an update of my original analysis of the Company’s cost of16
equity.17
18
Q: What are the key rate of return issues that the Commission should consider19
when deciding this case?20

1 A: Mr. Kollen has challenged the Company's actual capital structure ratios and
2 has proposed an alternative hypothetical capital structure. In addition, Mr.
3 Baudino has disputed the Company's cost of short-term debt and the rate of
4 return on common equity. There are two key factors that bear on the cost of
5 equity issue in this case. Aside from technical issues that I will discuss later in
6 my rebuttal testimony, the Commission should take into consideration the
7 following:
8 1) A rate of return that will be reflective of capital cost rates, in the context
9 of an expected increase in interest rates.
10 2) A rate of return that will reflect and be supportive of the Company's
11 financial and risk profile.
12 As I explain below, the recommendation of the AG fails to adequately consider
13 these two points and thereby significantly understate the cost of common
14 equity in this proceeding. The AG recommendation also fails to provide
15 adequate support for the Company's financial profile due to the unreasonably
16 low cost of equity, cost of short-term debt, and capital structure ratios that are
17 not appropriate for CKY and would materially increase its risk and cost of
18 capital.
19
20 Q: What explains the substantial disparity between the AG recommendation 2 2
A: Mr. Kollen has challenged the Company’s actual capital structure ratios and1
has proposed an alternative hypothetical capital structure. In addition, Mr.2
Baudino has disputed the Company’s cost of short-term debt and the rate of3
return on common equity. There are two key factors that bear on the cost of4
equity issue in this case. Aside from technical issues that I will discuss later in5
my rebuttal testimony, the Commission should take into consideration the6
following:7
1) A rate of return that will be reflective of capital cost rates, in the context8
of an expected increase in interest rates.9
2) A rate of return that will reflect and be supportive of the Company’s10
financial and risk profile.11
As I explain below, the recommendation of the AG fails to adequately consider12
these two points and thereby significantly understate the cost of common13
equity in this proceeding. The AG recommendation also fails to provide14
adequate support for the Company’s financial profile due to the unreasonably15
low cost of equity, cost of short-term debt, and capital structure ratios that are16
not appropriate for CKY and would materially increase its risk and cost of17
capital.18
19
Q: What explains the substantial disparity between the AG recommendation20

1 and your proposed 11.00% equity return?
2 A: Mr. Baudino has understated the cost of equity for Columbia, which if adopted
3 by the Commission, would be of serious concern to investors in the financial
4 community. The difference between Columbia's cost of equity and the
5 proposal by the AG is attributable to a number of factors, including: (i) the
6 determination of a reasonable Discounted Cash Flow (DCF) return; (ii)
7 whether a leverage adjustment to the DCF is warranted; (iii) the extent to
8 which other methods of determining the cost of equity provide a reasonable
9 measure of the appropriate cost of common equity; (iv) a flotation cost
10 allowance; and (v) recognition of Columbia's higher investment risk
11 associated with its small size compared to other investor owned natural gas
12 companies and public utilities in general.
13
14 Q: How does the recommendation of the AG compare to the return on equity
15 for other natural gas companies as determined in their rate cases?
16 A: According to the AUS Monthly Utility Reports dated May 2016, those returns
17 are:
3 3
and your proposed 11.00% equity return?1
A: Mr. Baudino has understated the cost of equity for Columbia, which if adopted2
by the Commission, would be of serious concern to investors in the financial3
community. The difference between Columbia’s cost of equity and the4
proposal by the AG is attributable to a number of factors, including: (i) the5
determination of a reasonable Discounted Cash Flow (DCF) return; (ii)6
whether a leverage adjustment to the DCF is warranted; (iii) the extent to7
which other methods of determining the cost of equity provide a reasonable8
measure of the appropriate cost of common equity; (iv) a flotation cost9
allowance; and (v) recognition of Columbia’s higher investment risk10
associated with its small size compared to other investor owned natural gas11
companies and public utilities in general.12
13
Q: How does the recommendation of the AG compare to the return on equity14
for other natural gas companies as determined in their rate cases?15
A: According to the AUS Monthly Utility Reports dated May 2016, those returns16
are:17

COMPANY ALLOWED
ROE
Atmos Energy Corp. 9.81%
Chesapeake Utilities Corp. 10.46%
Spire, Inc. NM
New Jersey Resources Corp. 10.30% Northwest Natural Gas Co. 9.80%
South Jersey Industries, Inc. 9.75%
Southwest Gas Corporation 9.75% WGL Holdings, Inc. 9.58%
Average 9.92%
NM = Not meaningful
1 It is obvious that Mr. Baudino's proposed equity return is too low
2 because it is 92 basis points below the average authorized return for gas
3 distribution utilities nationally.
4
5 Q: Should the Commission consider the future trend in capital cost rates when
6 deciding the return on equity issue in this case?
7 A: Yes. Unlike Mr. Baudino's approach that takes a backward view of interest
8 rates, i.e. six months covering February through July 2016, accommodative
9 FOMC policy has masked the risk of utilities and with prospectively higher
10 interest rates, those conditions will be reversed. To gain a consensus view of
11 future interest rates, I tabulated the forecasts of yields on 10-year Treasury
12 notes published by a variety of well recognized and investor-influencing 4 4
ALLOWED
COMPANY ROE
Atmos Energy Corp. 9.81%
Chesapeake Utilities Corp. 10.46%
Spire, Inc. NM
New Jersey Resources Corp. 10.30%
Northwest Natural Gas Co. 9.80%
South Jersey Industries, Inc. 9.75%
Southwest Gas Corporation 9.75%
WGL Holdings, Inc. 9.58%
Average 9.92%
NM = Not meaningful
It is obvious that Mr. Baudino’s proposed equity return is too low1
because it is 92 basis points below the average authorized return for gas2
distribution utilities nationally.3
4
Q: Should the Commission consider the future trend in capital cost rates when5
deciding the return on equity issue in this case?6
A: Yes. Unlike Mr. Baudino’s approach that takes a backward view of interest7
rates, i.e. six months covering February through July 2016, accommodative8
FOMC policy has masked the risk of utilities and with prospectively higher9
interest rates, those conditions will be reversed. To gain a consensus view of10
future interest rates, I tabulated the forecasts of yields on 10-year Treasury11
notes published by a variety of well recognized and investor-influencing12

1 sources. I chose the 10-year Treasury note because it is available on a consistent
2 basis across all sources. The comparisons are:
Change
in Basis 2016 2017 2018 2019 2020 2021 Points
Blue Chip 1.74% 2.15% 3.30% 3.70% 3.90% 4.10% 236
Value Tine 1.80% 2.30% 2.80% 3.50% 3.70% 3.70% 190
EIA 2.57% 2.72% 3.27% 3.81% 3.83% 3.77% 120
CBO-The Budget and Economic Outlook 2.60% 3.30% 3.80% 4.00% 4.10% 4.10% 150
3 The universal consensus is that interest rates will increase in the future.
4 The Federal Open Market Committee ("FOMC") policy is in the process of
5 moving from an extremely accommodative to more normal monetary policy.
6 All recognized forecasts indicate a future rise in interest rates. The FOMC
7 began this process with the end of quantitative easing in October 2014 and the
8 increase in the Fed Funds rate on December 16, 2015. The uncertainty
9 surrounding the level of interest rates represents one key factor that adds to
10 the risk of common equity. In a WSJ article dated June 9, 2016, the nationally
11 renowned bond investor Bill Gross commented that global bond yields were
12 the lowest "in 500 years of recorded history" and warned that the large
13 number of negative-yielding bonds in the world will eventually lead to "a
14 supernova that will explode one day." The existence of negative yields in
5 5
sources. I chose the 10-year Treasury note because it is available on a consistent1
basis across all sources. The comparisons are:2
2016 2017 2018 2019 2020 2021
Change
in Basis
Points
Blue Chip 1.74% 2.15% 3.30% 3.70% 3.90% 4.10% 236
Value Line 1.80% 2.30% 2.80% 3.50% 3.70% 3.70% 190
EIA 2.57% 2.72% 3.27% 3.81% 3.83% 3.77% 120
CBO-The Budget and Economic Outlook 2.60% 3.30% 3.80% 4.00% 4.10% 4.10% 150
The universal consensus is that interest rates will increase in the future.3
The Federal Open Market Committee (“FOMC”) policy is in the process of4
moving from an extremely accommodative to more normal monetary policy.5
All recognized forecasts indicate a future rise in interest rates. The FOMC6
began this process with the end of quantitative easing in October 2014 and the7
increase in the Fed Funds rate on December 16, 2015. The uncertainty8
surrounding the level of interest rates represents one key factor that adds to9
the risk of common equity. In a WSJ article dated June 9, 2016, the nationally10
renowned bond investor Bill Gross commented that global bond yields were11
the lowest “in 500 years of recorded history” and warned that the large12
number of negative-yielding bonds in the world will eventually lead to “a13
supernova that will explode one day.” The existence of negative yields in14

1 Europe and Japan have led global bond investors to purchase higher yielding
2 U.S. government debt. This has resulted in yields for Treasury bonds being
3 depressed due to the supply of Treasury debt not keeping up with global
4 demand. In this environment, it would be unfair to Columbia to set its return
5 based upon the depressed levels of Treasury bond yields because we know
6 that this situation cannot persist indefinitely. Moreover, a September 13, 2016
7 WSJ article warned of another bond market "tantrum" in the situation of rising
8 interest rates and falling prices. The intentions of the FOMC indicate a trough
9 in interest rates has passed and the forecasts show interest rates will rise. The
10 Commission should take the forecast trend toward higher interest rates into
11 account when it sets the cost of equity for Columbia. Mr. Baudino's testimony
12 considers only a three-month historical average of Treasury bond yields. As
13 such, his cost of equity analysis is defective because he has not taken into
14 account the general consensus that interest rates will increase in the future
15 from current levels. It is therefore, indicated that a higher authorized return
16 is warranted in the face of expected higher interest rates.
17
18 Q: Why is it important to the determination of the cost of equity to know the
19 direction of interest rates?
20 A: As I discussed in my direct testimony, capital costs are interrelated. That is to 6 6
Europe and Japan have led global bond investors to purchase higher yielding1
U.S. government debt. This has resulted in yields for Treasury bonds being2
depressed due to the supply of Treasury debt not keeping up with global3
demand. In this environment, it would be unfair to Columbia to set its return4
based upon the depressed levels of Treasury bond yields because we know5
that this situation cannot persist indefinitely. Moreover, a September 13, 20166
WSJ article warned of another bond market “tantrum” in the situation of rising7
interest rates and falling prices. The intentions of the FOMC indicate a trough8
in interest rates has passed and the forecasts show interest rates will rise. The9
Commission should take the forecast trend toward higher interest rates into10
account when it sets the cost of equity for Columbia. Mr. Baudino’s testimony11
considers only a three-month historical average of Treasury bond yields. As12
such, his cost of equity analysis is defective because he has not taken into13
account the general consensus that interest rates will increase in the future14
from current levels. It is therefore, indicated that a higher authorized return15
is warranted in the face of expected higher interest rates.16
17
Q: Why is it important to the determination of the cost of equity to know the18
direction of interest rates?19
A: As I discussed in my direct testimony, capital costs are interrelated. That is to20

1 say, in this environment of low interest rates, the equity risk premium is
2
higher today than in other circumstances. I have reflected a higher risk
3 premium in both my prefiled direct testimony and in the updated cost of
4 equity that I have submitted with my rebuttal testimony. As such, the cost of
5 equity today is not as low as the current level of interest rates would suggest.
6
Moreover, the trend of interest rates should help guide the Commission in
7 picking the point in the range to set the Company's cost of equity. With
8
forecasts showing an increase in interest rates in the future this situation
9 strongly argues for a return in the case this is near the top of the range. Even
10
Mr. Baudino moves to the upper end of his range of DCF returns.
11
12 Q: How would investors react to a decision by the Commission to adopt the
13 recommendation of the AG?
14 A: The investment community would be alarmed if the Commission were to
15 adopt the AG's proposal. Investors would put the Company below the bottom
16 of any reasonable equity return. The return on equity used by the Commission
17 to set rates embodies in a single numerical value a clear signal of the degree of
18 regulatory support for the financial strength of the utilities that it regulates.
19 Although cost allocations, rate design issues, and regulatory policies relative
20 to the cost of service are important considerations, the opportunity to achieve 7 7
say, in this environment of low interest rates, the equity risk premium is1
higher today than in other circumstances. I have reflected a higher risk2
premium in both my prefiled direct testimony and in the updated cost of3
equity that I have submitted with my rebuttal testimony. As such, the cost of4
equity today is not as low as the current level of interest rates would suggest.5
Moreover, the trend of interest rates should help guide the Commission in6
picking the point in the range to set the Company’s cost of equity. With7
forecasts showing an increase in interest rates in the future this situation8
strongly argues for a return in the case this is near the top of the range. Even9
Mr. Baudino moves to the upper end of his range of DCF returns.10
11
Q: How would investors react to a decision by the Commission to adopt the12
recommendation of the AG?13
A: The investment community would be alarmed if the Commission were to14
adopt the AG’s proposal. Investors would put the Company below the bottom15
of any reasonable equity return. The return on equity used by the Commission16
to set rates embodies in a single numerical value a clear signal of the degree of17
regulatory support for the financial strength of the utilities that it regulates.18
Although cost allocations, rate design issues, and regulatory policies relative19
to the cost of service are important considerations, the opportunity to achieve20

1 a reasonable return on equity represents a direct signal to the investment
2 community of regulatory support for the utility's financial strength (or lack
3 thereof). In a single figure, the return on equity utilized to set rates provides
4 a common and widely understood benchmark that can be compared from one
5 company to another and is the basis by which returns on all financial assets
6 (stocks — both utility and non-regulated, bonds, money market instruments,
7 and so forth) can be measured. So, while varying degrees of sophistication are
8 required to interpret the meaning of specific Commission policies on technical
9 matters, the return on equity figure is universally understood and
10 communicates to investors the types of returns that they can reasonably expect
11 from an investment in utilities operating in Kentucky.
12
13 Q: Why should the Commission care what investors think?
14 A: For a utility to obtain new capital and retain existing capital at reasonable cost
15 and on reasonable terms, the authorized rate of return on common equity
16 must be high enough to satisfy investors with returns that are commensurate
17 with the risk of their investments. The cost of equity proposed by the AG, if
18 adopted by the Commission, would provide a signal to the investment
19 community of unsupportive regulation. That is to say, if the Commission were
20 to adopt the proposal by the AG, it would discourage commitments by 8 8
a reasonable return on equity represents a direct signal to the investment1
community of regulatory support for the utility’s financial strength (or lack2
thereof). In a single figure, the return on equity utilized to set rates provides3
a common and widely understood benchmark that can be compared from one4
company to another and is the basis by which returns on all financial assets5
(stocks – both utility and non-regulated, bonds, money market instruments,6
and so forth) can be measured. So, while varying degrees of sophistication are7
required to interpret the meaning of specific Commission policies on technical8
matters, the return on equity figure is universally understood and9
communicates to investors the types of returns that they can reasonably expect10
from an investment in utilities operating in Kentucky.11
12
Q: Why should the Commission care what investors think?13
A: For a utility to obtain new capital and retain existing capital at reasonable cost14
and on reasonable terms, the authorized rate of return on common equity15
must be high enough to satisfy investors with returns that are commensurate16
with the risk of their investments. The cost of equity proposed by the AG, if17
adopted by the Commission, would provide a signal to the investment18
community of unsupportive regulation. That is to say, if the Commission were19
to adopt the proposal by the AG, it would discourage commitments by20

1 investors to Columbia because more attractive risk-adjusted returns are
2 available in other states.
3
4 CAPITAL STRUCTURE
5 Q: Mr. Kollen has essentially proposed a hypothetical capital structure rather
6 than actual capital structure through the imposition of a hypothetical
7 common dividend payment in test year. Is his proposal reasonable for
8 Columbia?
9 A: No. The Company's actual capital structure ratios in this case of 47.58% debt
10 and 52.42% common equity are entirely consistent with the capital structure
11 ratios for the natural gas industry. There is nothing unusual about the
12 Company's actual capital structure that would require any adjustments to it.
13 How the Company's actual capital structure ratios came to be, e.g. through the
14 build-up of retained earnings with the absence of dividends, or payment of
15 dividend and concomitant equity contribution by the parent company, is not
16 the deciding factor as to the reasonableness of the ratios for ratesetting
17 purposes. These ratios are entirely consistent with the capital structure that
18 the Company has maintained historically and are consistent with the ratios for
19 the natural gas industry generally. Moreover, the Company needs the cash
20 flow derived from the absence of dividend payments in 2017 to help finance 9 9
investors to Columbia because more attractive risk-adjusted returns are1
available in other states.2
3
CAPITAL STRUCTURE4
Q: Mr. Kollen has essentially proposed a hypothetical capital structure rather5
than actual capital structure through the imposition of a hypothetical6
common dividend payment in test year. Is his proposal reasonable for7
Columbia?8
A: No. The Company’s actual capital structure ratios in this case of 47.58% debt9
and 52.42% common equity are entirely consistent with the capital structure10
ratios for the natural gas industry. There is nothing unusual about the11
Company’s actual capital structure that would require any adjustments to it.12
How the Company’s actual capital structure ratios came to be, e.g. through the13
build-up of retained earnings with the absence of dividends, or payment of14
dividend and concomitant equity contribution by the parent company, is not15
the deciding factor as to the reasonableness of the ratios for ratesetting16
purposes. These ratios are entirely consistent with the capital structure that17
the Company has maintained historically and are consistent with the ratios for18
the natural gas industry generally. Moreover, the Company needs the cash19
flow derived from the absence of dividend payments in 2017 to help finance20
1
its ongoing capital requirements, including the AMRP program. As such, Mr.
2
Kollen fails to recognize that there may be instances where it is necessary to
3 withhold dividends to fund infrastructure renewals and replacements.
4
5 Q: Has anything happened since the Company's prior rate cases that would
6 warrant a reduction in common equity component of the Company's
7 capital structure here?
8 A: No. The fundamentals affecting the Company are no different than the time
9 of the Company's last three rate cases. In each of those cases, the common
10 equity ratios were: 52.39% (C-2013-00167), 52.02% (C-2009-00141), and
11 52.09% (C-2007-00008). The Company's common equity ratio in this case is
12 52.42%, and is entirely consistent with the ratios in previous cases. There is
13 nothing in this case that would warrant a reduction in the common equity
14 ratio as proposed by Mr. Kollen. So there is no justification to deviate from
15 the Company's actual capital structure.
16
17 Q: Is the Company's proposed capital structure reasonable by reference to the
18 Gas Group?
19 A: The Company's actual capital structure ratios are within the ratios that
20 investors expect for a natural gas distribution company. As shown on 10 10
its ongoing capital requirements, including the AMRP program. As such, Mr.1
Kollen fails to recognize that there may be instances where it is necessary to2
withhold dividends to fund infrastructure renewals and replacements.3
4
Q: Has anything happened since the Company’s prior rate cases that would5
warrant a reduction in common equity component of the Company’s6
capital structure here?7
A: No. The fundamentals affecting the Company are no different than the time8
of the Company’s last three rate cases. In each of those cases, the common9
equity ratios were: 52.39% (C-2013-00167), 52.02% (C-2009-00141), and10
52.09% (C-2007-00008). The Company’s common equity ratio in this case is11
52.42%, and is entirely consistent with the ratios in previous cases. There is12
nothing in this case that would warrant a reduction in the common equity13
ratio as proposed by Mr. Kollen. So there is no justification to deviate from14
the Company’s actual capital structure.15
16
Q: Is the Company’s proposed capital structure reasonable by reference to the17
Gas Group?18
A: The Company’s actual capital structure ratios are within the ratios that19
investors expect for a natural gas distribution company. As shown on20

1
Rebuttal Attachment PRM-16, I have presented the capital structure ratios for
2
the Gas Group based upon Value Line's forecasts for the companies that I
3 assembled in my direct testimony. There, it is revealed that the common
4 equity ratio of the companies in the Gas Group average 56.5% to 57.7% across
5
the years. Individually, the common equity ratios extend up to 71%. This
6 shows that there is nothing unreasonable about the Company's proposed
7
52.42% common equity ratio for this case. There is just no reason to adjust it.
8
9 Q: Would there be consequences for the Company if a hypothetical 50.80%
10 common equity ratio were imposed on it in this case?
11 A: Yes. With a 50.80% hypothetical common equity ratio, the Company would
12 be denied an equity return on $4 million of its actual common equity. So with
13 Mr. Baudino's proposed 9.00% equity return, the Company could only hope
14 to experience an 8.72% equity return. [Please check to confirm] All investors,
15 both debt and equity, would react unfavorably to such an outcome. Rather,
16 the Commission should support the Company's financial integrity by
17 endorsing its actual capital structure.
18
11 11
Rebuttal Attachment PRM-16, I have presented the capital structure ratios for1
the Gas Group based upon Value Line’s forecasts for the companies that I2
assembled in my direct testimony. There, it is revealed that the common3
equity ratio of the companies in the Gas Group average 56.5% to 57.7% across4
the years. Individually, the common equity ratios extend up to 71%. This5
shows that there is nothing unreasonable about the Company’s proposed6
52.42% common equity ratio for this case. There is just no reason to adjust it.7
8
Q: Would there be consequences for the Company if a hypothetical 50.80%9
common equity ratio were imposed on it in this case?10
A: Yes. With a 50.80% hypothetical common equity ratio, the Company would11
be denied an equity return on $4 million of its actual common equity. So with12
Mr. Baudino’s proposed 9.00% equity return, the Company could only hope13
to experience an 8.72% equity return. [Please check to confirm] All investors,14
both debt and equity, would react unfavorably to such an outcome. Rather,15
the Commission should support the Company’s financial integrity by16
endorsing its actual capital structure.17
18

1 COST OF SHORT-TERM DEBT
2 Q: Mr. Baudino has reduced the Company's proposed cost of short-term debt
3 from 2.50% to 1.00%. Is that proposal reasonable?
4 A: No. It is based on the unlikely presumption that NiSource Finance can
5 always avail itself to the commercial paper market, and that commercial
6 paper rates will stay at these unusually low levels. Neither proposition is
7 reasonable for rate-setting purposes.
8
9 Q: Why?
10 A: First, Mr. Baudino uses a backward-looking historical embedded cost of
11 short-term debt. This approach fails to take into account the magnitude of
12 the forecast increase in interest rates expected in the future. By him moving
13 from 0.72% in 2015 to 1.00% for the test year hardly accommodates the
14 expected upward movement in interest rates. Second, there is no assurance
15 that NiSource Finance will always have access to lower-cost commercial
16 paper. There have been instances in the past, and I am sure they will be
17 repeated in the future, where commercial paper borrowing will not be
18 feasible. For this reason, NiSource Finance has a credit facility with a
19 syndicate of banks to cover the eventuality that commercial paper
20 borrrowings may not be available to it. 12 12
COST OF SHORT-TERM DEBT1
Q: Mr. Baudino has reduced the Company’s proposed cost of short-term debt2
from 2.50% to 1.00%. Is that proposal reasonable?3
A: No. It is based on the unlikely presumption that NiSource Finance can4
always avail itself to the commercial paper market, and that commercial5
paper rates will stay at these unusually low levels. Neither proposition is6
reasonable for rate-setting purposes.7
8
Q: Why?9
A: First, Mr. Baudino uses a backward-looking historical embedded cost of10
short-term debt. This approach fails to take into account the magnitude of11
the forecast increase in interest rates expected in the future. By him moving12
from 0.72% in 2015 to 1.00% for the test year hardly accommodates the13
expected upward movement in interest rates. Second, there is no assurance14
that NiSource Finance will always have access to lower-cost commercial15
paper. There have been instances in the past, and I am sure they will be16
repeated in the future, where commercial paper borrowing will not be17
feasible. For this reason, NiSource Finance has a credit facility with a18
syndicate of banks to cover the eventuality that commercial paper19
borrrowings may not be available to it.20

1
2 UPDATED COST OF EQUITY
3 Q: Are you sponsoring any additional exhibits with your rebuttal testimony?
4 A: Yes. I have updated selected attachments that were part of my original
5 prefiled direct testimony. The updates include: Cost of Equity — page 2 of
6 Attachment PRM-1, Dividend Yields — Attachment PRM-7, Historical Growth
7 Rates — Attachment PRM- 8, Projected Growth Rates — Attachment PRM-9,
8 Financial Risk Adjustment — Attachment PRM-10, Interest Rates for
9 Investment Grade Public Utility Bonds - Attachment PRM-12 pages 1 and 3,
10 Component Inputs for the Capital Market Pricing Model — Attachment PRM-
11 14 pages 1 and 2, and Comparable Earnings — Attachment PRM- 15. For the
12 purpose of my rebuttal testimony, I have maintained the same schedule
13 identifications, so that the updates can be traced to each original attachment.
14 The remaining attachments are not sensitive to the five-month update, as they
15 reflect mostly annual data.
16
17 Q: Why have you updated your ROE analysis with later data?
18 A: The data that was contained in my original Attachments ended with market
19 data through March 2016. So that the freshness of the data is not an issue that
20 would cloud the rate of return issue in this case and to respond to Staff 13 13
1
UPDATED COST OF EQUITY2
Q: Are you sponsoring any additional exhibits with your rebuttal testimony?3
A: Yes. I have updated selected attachments that were part of my original4
prefiled direct testimony. The updates include: Cost of Equity – page 2 of5
Attachment PRM-1, Dividend Yields – Attachment PRM-7, Historical Growth6
Rates – Attachment PRM- 8, Projected Growth Rates – Attachment PRM-9,7
Financial Risk Adjustment – Attachment PRM-10, Interest Rates for8
Investment Grade Public Utility Bonds - Attachment PRM-12 pages 1 and 3,9
Component Inputs for the Capital Market Pricing Model – Attachment PRM-10
14 pages 1 and 2, and Comparable Earnings – Attachment PRM- 15. For the11
purpose of my rebuttal testimony, I have maintained the same schedule12
identifications, so that the updates can be traced to each original attachment.13
The remaining attachments are not sensitive to the five-month update, as they14
reflect mostly annual data.15
16
Q: Why have you updated your ROE analysis with later data?17
A: The data that was contained in my original Attachments ended with market18
data through March 2016. So that the freshness of the data is not an issue that19
would cloud the rate of return issue in this case and to respond to Staff20

1 interrogatory 3-21, I have updated my market data through August 2016,
2 because I use month-end data in my analysis.
3
4 Q: Does the updated information impact your recommendation in this case?
5 A: No. The updated market data indicates that my original cost of equity of 11.0%
6 continues to be appropriate. Some of the models show an increase in the
7 results using later data and others show a decline. Overall, the changes offset.
8 As to the discounted cash flow (DCF) measure of the cost of equity, the
9 average six-month dividend yield component decreased (i.e., 3.11% to 2.83%),
10 while the growth rate component has increased somewhat (i.e., 6.0% to 6.25%),
11 and the leverage adjustment also increased (i.e., 0.82% to 0.89%). This leaves
12 the DCF cost rate at 10.17% vs. 10.13% in the prefiled direct testimony.
13 Declines in the update are revealed by the risk premium and capital asset
14 pricing model (CAPM) measures of the cost of equity. In these models, I have
15 reduced the projection of the yield on long-term treasury bonds from 3.75%
16 that I used in my direct testimony to 3.25% in my update. An offsetting change
17 in the update of the risk premium approach relates to the expansion of the
18 spread between the cost of public utility debt and the yield on 30-year treasury
19 bonds. While the spread that existed at the time of my prefiled direct
20 testimony was 1.25%, it has now increased somewhat to 1.35%. This shows 14 14
interrogatory 3-21, I have updated my market data through August 2016,1
because I use month-end data in my analysis.2
3
Q: Does the updated information impact your recommendation in this case?4
A: No. The updated market data indicates that my original cost of equity of 11.0%5
continues to be appropriate. Some of the models show an increase in the6
results using later data and others show a decline. Overall, the changes offset.7
As to the discounted cash flow (DCF) measure of the cost of equity, the8
average six-month dividend yield component decreased (i.e., 3.11% to 2.83%),9
while the growth rate component has increased somewhat (i.e., 6.0% to 6.25%),10
and the leverage adjustment also increased (i.e., 0.82% to 0.89%). This leaves11
the DCF cost rate at 10.17% vs. 10.13% in the prefiled direct testimony.12
Declines in the update are revealed by the risk premium and capital asset13
pricing model (CAPM) measures of the cost of equity. In these models, I have14
reduced the projection of the yield on long-term treasury bonds from 3.75%15
that I used in my direct testimony to 3.25% in my update. An offsetting change16
in the update of the risk premium approach relates to the expansion of the17
spread between the cost of public utility debt and the yield on 30-year treasury18
bonds. While the spread that existed at the time of my prefiled direct19
testimony was 1.25%, it has now increased somewhat to 1.35%. This shows20

1
that the riskiness of public utilities has increased somewhat over the past five
2
months. As a result, the risk premium cost of equity has decreased from
3
11.70% to 11.30%. The CAPM cost rate has also decreased over the past five
4
months. The leveraged adjusted betas for my water group have remained
5
unchanged. The risk-free rate of return has been reduced by 0.50% as
6
indicated above. The market premium has increased due to the turmoil
7
affecting the stock market. The CAPM result has decreased from 11.45% to
8
11.25%. I have also updated the Comparable Earnings approach. Overall, the
9
update reveals a range of the equity returns from 10.17% to 11.30% using the
10
market-based models, i.e., DCF, Risk Premium and CAPM. This shows that
11
my original cost of equity recommendation continues to be reasonable.
12
13 COST OF EQUITY
14 Q: Mr. Baudino asserts that the natural gas industry continues to be a safe,
15 solid choice for investors. Do you agree?
16 A. Only in part. The natural gas utility industry is in a period of increased
17 capital expenditures that will heighten its risk profile. Significant amounts of
18 capital will be required by the industry to meet increasingly stringent
19 environmental standards and to address aging infrastructure needs. The
20 large amounts of new capital required by the industry will pressure its
15 15
that the riskiness of public utilities has increased somewhat over the past five1
months. As a result, the risk premium cost of equity has decreased from2
11.70% to 11.30%. The CAPM cost rate has also decreased over the past five3
months. The leveraged adjusted betas for my water group have remained4
unchanged. The risk-free rate of return has been reduced by 0.50% as5
indicated above. The market premium has increased due to the turmoil6
affecting the stock market. The CAPM result has decreased from 11.45% to7
11.25%. I have also updated the Comparable Earnings approach. Overall, the8
update reveals a range of the equity returns from 10.17% to 11.30% using the9
market-based models, i.e., DCF, Risk Premium and CAPM. This shows that10
my original cost of equity recommendation continues to be reasonable.11
12
COST OF EQUITY13
Q: Mr. Baudino asserts that the natural gas industry continues to be a safe,14
solid choice for investors. Do you agree?15
A. Only in part. The natural gas utility industry is in a period of increased16
capital expenditures that will heighten its risk profile. Significant amounts of17
capital will be required by the industry to meet increasingly stringent18
environmental standards and to address aging infrastructure needs. The19
large amounts of new capital required by the industry will pressure its20

1 financial profile. To be successful in attracting the capital that it needs, the
2 industry will need to provide investors with competitive returns.
3
4 Q: Among the variables that Mr. Baudino considered in his growth rate
5 analysis for DCF purposes was the dividends per share forecast by Value
6 Line. Is that a valid measure for DCF purposes, or are there serious
7 limitations to this measure of growth?
8 A. There are. As I describe in my prefiled direct testimony, forecast earnings
9 growth is the only valid measure of growth for DCF purposes. The theory of
10 DCF indicates that the value of a firm's equity (i.e., share price) will grow at
11 the same rate as earnings per share and dividend growth will equal earnings
12 growth with a constant payout ratio. Unfortunately, a constant payout ratio
13 reflects neither the reality of the equity markets or investor expectations.
14 Therefore, to reflect investor expectations within the limitations of the DCF
15 model, earnings per share growth, which is the basis for the capital gains
16 yield and the source of dividend payments, must be given primary
17 emphasis. We can clearly see from Exhibit RAB-4 that dividend growth
18 provides a DCF return that is an outlier. There are no other DCF returns
19 shown on that exhibit that are near 7.60%. Indeed, the average of the DCF
16 16
financial profile. To be successful in attracting the capital that it needs, the1
industry will need to provide investors with competitive returns.2
3
Q: Among the variables that Mr. Baudino considered in his growth rate4
analysis for DCF purposes was the dividends per share forecast by Value5
Line. Is that a valid measure for DCF purposes, or are there serious6
limitations to this measure of growth?7
A. There are. As I describe in my prefiled direct testimony, forecast earnings8
growth is the only valid measure of growth for DCF purposes. The theory of9
DCF indicates that the value of a firm's equity (i.e., share price) will grow at10
the same rate as earnings per share and dividend growth will equal earnings11
growth with a constant payout ratio. Unfortunately, a constant payout ratio12
reflects neither the reality of the equity markets or investor expectations.13
Therefore, to reflect investor expectations within the limitations of the DCF14
model, earnings per share growth, which is the basis for the capital gains15
yield and the source of dividend payments, must be given primary16
emphasis. We can clearly see from Exhibit RAB-4 that dividend growth17
provides a DCF return that is an outlier. There are no other DCF returns18
shown on that exhibit that are near 7.60%. Indeed, the average of the DCF19
1 returns for the remaining growth rates using earnings forecasts is 9.08%
2 (9.63% + 9.37% + 8.25% = 27.25% + 3).
3
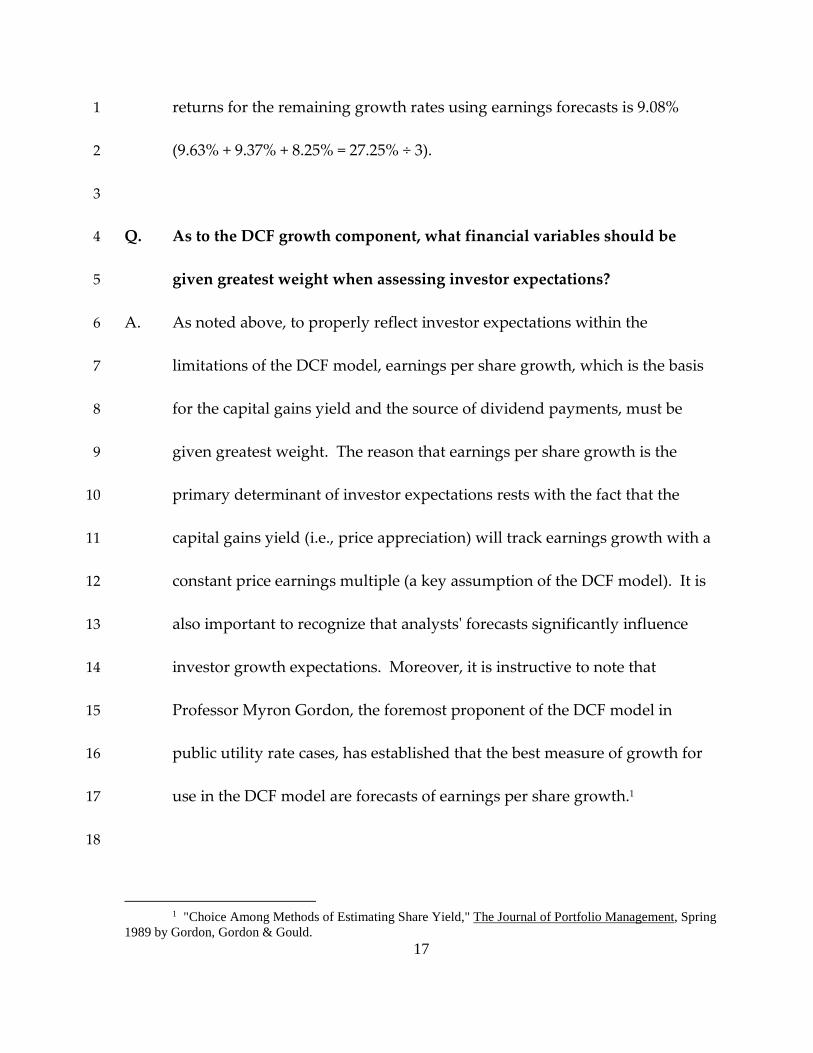
4 Q. As to the DCF growth component, what financial variables should be
5 given greatest weight when assessing investor expectations?
6 A. As noted above, to properly reflect investor expectations within the
7 limitations of the DCF model, earnings per share growth, which is the basis
8 for the capital gains yield and the source of dividend payments, must be
9 given greatest weight. The reason that earnings per share growth is the
10 primary determinant of investor expectations rests with the fact that the
11 capital gains yield (i.e., price appreciation) will track earnings growth with a
12 constant price earnings multiple (a key assumption of the DCF model). It is
13 also important to recognize that analysts' forecasts significantly influence
14 investor growth expectations. Moreover, it is instructive to note that
15 Professor Myron Gordon, the foremost proponent of the DCF model in
16 public utility rate cases, has established that the best measure of growth for
17 use in the DCF model are forecasts of earnings per share growth.'
18
1 "Choice Among Methods of Estimating Share Yield," The Journal of Portfolio Management, Spring 1989 by Gordon, Gordon & Gould.
17 17
returns for the remaining growth rates using earnings forecasts is 9.08%1
(9.63% + 9.37% + 8.25% = 27.25% ÷ 3).2
3
Q. As to the DCF growth component, what financial variables should be4
given greatest weight when assessing investor expectations?5
A. As noted above, to properly reflect investor expectations within the6
limitations of the DCF model, earnings per share growth, which is the basis7
for the capital gains yield and the source of dividend payments, must be8
given greatest weight. The reason that earnings per share growth is the9
primary determinant of investor expectations rests with the fact that the10
capital gains yield (i.e., price appreciation) will track earnings growth with a11
constant price earnings multiple (a key assumption of the DCF model). It is12
also important to recognize that analysts' forecasts significantly influence13
investor growth expectations. Moreover, it is instructive to note that14
Professor Myron Gordon, the foremost proponent of the DCF model in15
public utility rate cases, has established that the best measure of growth for16
use in the DCF model are forecasts of earnings per share growth.117
18
1 "Choice Among Methods of Estimating Share Yield," The Journal of Portfolio Management, Spring1989 by Gordon, Gordon & Gould.

1 Q: Have you detected any anomalies in the earnings growth rates shown by
2 Mr. Baudino?
3 A. There are several. First, the 1.00% earnings growth rate for New Jersey
4 Resources is an anomaly. It is significantly dissimilar to the earnings growth
5 rates for New Jersey Resources available from other sources (i.e., Zacks and
6 Thomson/Reuters). Second, the 3.00% earnings growth rate for Chesapeake
7 Utilities reported by Thomson/Reuters is clearly outside the range for the
8 other gas companies. By removing those growth rates, the DCF returns
9 become 9.17% and 9.37%.
10
11 Q: Mr. Baudino has also shown the BxR growth rates, but apparently has not
12 employed them. What are your observations concerning BxR growth?
13 A. Mr. Baudino showed the Value Line BxR growth rates. The retention growth
14 rates published by Value Line are calculated with year-end book values,
15 rather than average book values. Value Line defines "return on equity" as
16 follows:
17 Percent Earned Common Equity — net profit less
18 preferred dividends divided by common equity (i.e.,
19 net worth less preferred equity at liquidation or
20 redemption value), expressed as a percentage. See
21 Percent Earned Total Capital. 22
18 18
Q: Have you detected any anomalies in the earnings growth rates shown by1
Mr. Baudino?2
A. There are several. First, the 1.00% earnings growth rate for New Jersey3
Resources is an anomaly. It is significantly dissimilar to the earnings growth4
rates for New Jersey Resources available from other sources (i.e., Zacks and5
Thomson/Reuters). Second, the 3.00% earnings growth rate for Chesapeake6
Utilities reported by Thomson/Reuters is clearly outside the range for the7
other gas companies. By removing those growth rates, the DCF returns8
become 9.17% and 9.37%.9
10
Q: Mr. Baudino has also shown the BxR growth rates, but apparently has not11
employed them. What are your observations concerning BxR growth?12
A. Mr. Baudino showed the Value Line BxR growth rates. The retention growth13
rates published by Value Line are calculated with year-end book values,14
rather than average book values. Value Line defines “return on equity” as15
follows:16
Percent Earned Common Equity – net profit less17
preferred dividends divided by common equity (i.e.,18
net worth less preferred equity at liquidation or19
redemption value), expressed as a percentage. See20
Percent Earned Total Capital.21
22

1 Without an adjustment to convert the Value Line forecast returns from year-
2 end to average book values, there is a downward bias in the results. This is
3 because with an increasing book value driven by retention growth, the
4 average book value will be less than the year-end book value. For that
5 reason, the Federal Energy Regulatory Commission ("FERC") adjusts the
6 year-end returns to derive the average yearly return, using the formula 2 (1 +
7 G) / (2 + G) (see 92 FERC 1 61,070). Generally speaking, this adjustment
8 increases the retention growth rate.
9
10 Q: Has Mr. Baudino recognized external financing growth related to the BxR
11 rates?
12 A. No. This omission results in a further downward bias in the BxR growth rate
13 analysis. Forecasts by Value Line indicate that future growth from external
14 stock financing will add to the growth in equity. This would result in an
15 internal/external growth rate higher than that reported by Mr. Baudino.
16
17 Q: Mr. Baudino also used the CAPM as part of his analysis of the cost of
18 equity. As the risk-free rate of return component of the CAPM, he studied
19 the yields over a 6-month period for 20-year Treasury bonds and 5-year
20 Treasury notes. Do you agree?
19 19
Without an adjustment to convert the Value Line forecast returns from year-1
end to average book values, there is a downward bias in the results. This is2
because with an increasing book value driven by retention growth, the3
average book value will be less than the year-end book value. For that4
reason, the Federal Energy Regulatory Commission (“FERC”) adjusts the5
year-end returns to derive the average yearly return, using the formula 2 (1 +6
G) / (2 + G) (see 92 FERC ¶ 61,070). Generally speaking, this adjustment7
increases the retention growth rate.8
9
Q: Has Mr. Baudino recognized external financing growth related to the BxR10
rates?11
A. No. This omission results in a further downward bias in the BxR growth rate12
analysis. Forecasts by Value Line indicate that future growth from external13
stock financing will add to the growth in equity. This would result in an14
internal/external growth rate higher than that reported by Mr. Baudino.15
16
Q: Mr. Baudino also used the CAPM as part of his analysis of the cost of17
equity. As the risk-free rate of return component of the CAPM, he studied18
the yields over a 6-month period for 20-year Treasury bonds and 5-year19
Treasury notes. Do you agree?20

1 A: I agree with his use of the yields on 20-year Treasury bonds, but not his use
2 of the yields on 5-year Treasury notes. The term of the 5-year Treasury note
3 is too short to be useful here because it does not fit the long-term horizon of
4 public utility ratesetting (i.e., the average life of utility plant exceeds five
5 years). Further, as maturities are shortened for Treasury securities, they are
6 more susceptible to monetary policy actions of the FOMC. Indeed, since the
7 credit crisis, the FOMC has been taking aggressive actions to support the
8 economy with very low short-term interest rates. Since yields on shorter
9 term Treasury obligations are more influenced by FOMC policy actions than
10 are long-term Treasury yields, the shorter term yields should be avoided in
11 cost of equity analyses.
12
13 Q: In addition to a forward-looking (i.e., expectational) measurement of the
14 market premium (Rm-Rf) component of the CAPM, Mr. Baudino also
15 submitted historical data in this regard. Are any of his historical
16 measurement procedures inappropriate for CAPM purposes?
17 A: Only one. Mr. Baudino has used geometric means, as well as arithmetic
18 means for identifying the market premium using historical data (see Exhibit
19 RAB-6). Arithmetic means are appropriate, but geometric means are not. As
20 I explained in my direct testimony, only the arithmetic means are valid 20 20
A: I agree with his use of the yields on 20-year Treasury bonds, but not his use1
of the yields on 5-year Treasury notes. The term of the 5-year Treasury note2
is too short to be useful here because it does not fit the long-term horizon of3
public utility ratesetting (i.e., the average life of utility plant exceeds five4
years). Further, as maturities are shortened for Treasury securities, they are5
more susceptible to monetary policy actions of the FOMC. Indeed, since the6
credit crisis, the FOMC has been taking aggressive actions to support the7
economy with very low short-term interest rates. Since yields on shorter8
term Treasury obligations are more influenced by FOMC policy actions than9
are long-term Treasury yields, the shorter term yields should be avoided in10
cost of equity analyses.11
12
Q: In addition to a forward-looking (i.e., expectational) measurement of the13
market premium (Rm-Rf) component of the CAPM, Mr. Baudino also14
submitted historical data in this regard. Are any of his historical15
measurement procedures inappropriate for CAPM purposes?16
A: Only one. Mr. Baudino has used geometric means, as well as arithmetic17
means for identifying the market premium using historical data (see Exhibit18
RAB-6). Arithmetic means are appropriate, but geometric means are not. As19
I explained in my direct testimony, only the arithmetic means are valid20

1 measures of the market premium in the CAPM. As stated in the 2003
2
Yearbook published by Ibbotson Associates:
3 The arithmetic mean is the rate of return which, when
4 compounded over multiple periods, gives the mean of the
5 probability distribution of ending wealth values....This
6 makes the arithmetic mean return appropriate for
7 forecasting, discounting, and computing the cost of capital.
8 The discount rate that equates expected (mean) future
9 values with the present value of an investment is that
10 investment's cost of capital. The logic of using the discount
11 rate as the cost of capital is reinforced by noting that
12 investors will discount their expected (mean) ending wealth
13 values from an investment back to the present using the
14 arithmetic mean, for the reason given above. They will,
15 therefore, require such an expected (mean) return
16 prospectively (that is, in the present looking toward the
17 future) to commit their capital to the investment. 18
19 In the 2006 Yearbook, Ibbotson added:
20 A simple example illustrates the difference between
21 geometric and arithmetic means. Suppose $1.00 was
22 invested in a large company stock portfolio that experiences
23 successive annual returns of +50 percent and -50 percent.
24 At the end of the first year, the portfolio is worth $1.50. At
25 the end of the second year, the portfolio is worth $0.75. The
26 annual arithmetic mean is 0.0 percent, whereas the annual
27 geometric mean is -13.4 percent. Both are calculated as
rA = —2
r =
(0.50 -
1
[0.7512
0.50) = 0.0, and
-1= -0.134 —1 1.001 .00 i G -
28 follows:
21 21
measures of the market premium in the CAPM. As stated in the 20031
Yearbook published by Ibbotson Associates:2
The arithmetic mean is the rate of return which, when3
compounded over multiple periods, gives the mean of the4
probability distribution of ending wealth values….This5
makes the arithmetic mean return appropriate for6
forecasting, discounting, and computing the cost of capital.7
The discount rate that equates expected (mean) future8
values with the present value of an investment is that9
investment’s cost of capital. The logic of using the discount10
rate as the cost of capital is reinforced by noting that11
investors will discount their expected (mean) ending wealth12
values from an investment back to the present using the13
arithmetic mean, for the reason given above. They will,14
therefore, require such an expected (mean) return15
prospectively (that is, in the present looking toward the16
future) to commit their capital to the investment.17
18
In the 2006 Yearbook, Ibbotson added:19
A simple example illustrates the difference between20
geometric and arithmetic means. Suppose $1.00 was21
invested in a large company stock portfolio that experiences22
successive annual returns of +50 percent and -50 percent.23
At the end of the first year, the portfolio is worth $1.50. At24
the end of the second year, the portfolio is worth $0.75. The25
annual arithmetic mean is 0.0 percent, whereas the annual26
geometric mean is -13.4 percent. Both are calculated as27
follows:28
and=rA ,0.0)50.050.0(2
1=−
134.0100.1
75.0 2
1
−=−
=rG

1 The geometric mean is backward-looking, measuring the
2 change in wealth over more than one period. On the other
3 hand, the arithmetic mean better represents a typical
4 performance over single periods.
5 In general, the geometric mean for any time period is less
6 than or equal to the arithmetic mean. The two means are
7 equal only for a return series that is constant (i.e., the same
8 return in every period). For a non-constant series, the
9 difference between the two is positively related to the
10 variability or standard deviation of the returns. For
11 example, in Table 6-7, the difference between the arithmetic
12 and geometric mean is much larger for risky large company
13 stocks than it is for nearly riskless Treasury bills. 14
15 As such, the CAPM results shown on his Exhibit RAB-6, which are linked to
16 the geometric mean, are not meaningful for CAPM purposes.
17 Furthermore, we know that the geometric means from the
18 Ibbotson/Chen data are suspect because they are so far out of line with the
19 expectational market return data. That is to say, the risk premiums are 7.79%
20 and 8.68% using expectational data, while Mr. Baudino shows risk premiums
21 of 5.03% and 7.03% (see Exhibit RAB-6) using historical data. As noted
22 above, the Ibbotson/Chen historical data using geometric means, which is
23 just 5.03%, is an outlier.
24
22 22
The geometric mean is backward-looking, measuring the1
change in wealth over more than one period. On the other2
hand, the arithmetic mean better represents a typical3
performance over single periods.4
In general, the geometric mean for any time period is less5
than or equal to the arithmetic mean. The two means are6
equal only for a return series that is constant (i.e., the same7
return in every period). For a non-constant series, the8
difference between the two is positively related to the9
variability or standard deviation of the returns. For10
example, in Table 6-7, the difference between the arithmetic11
and geometric mean is much larger for risky large company12
stocks than it is for nearly riskless Treasury bills.13
14
As such, the CAPM results shown on his Exhibit RAB-6, which are linked to15
the geometric mean, are not meaningful for CAPM purposes.16
Furthermore, we know that the geometric means from the17
Ibbotson/Chen data are suspect because they are so far out of line with the18
expectational market return data. That is to say, the risk premiums are 7.79%19
and 8.68% using expectational data, while Mr. Baudino shows risk premiums20
of 5.03% and 7.03% (see Exhibit RAB-6) using historical data. As noted21
above, the Ibbotson/Chen historical data using geometric means, which is22
just 5.03%, is an outlier.23
24

1 Q: Mr. Baudino presents the results of his CAPM showing a range of 7.53% to
2 7.7% using expectational data, and only 5.77% to 7.22% using historical
3 data. Please comment.
4 A: With these ranges, Mr. Baudino appears to discount all of the CAPM results
5 as not plausible. All of these returns clearly do not support his 9.00% cost of
6 equity proposal.
7
8 Q: Mr. Baudino provides a critique of your direct testimony and highlights
9 various areas where he believes that you have overstated the Company's
10 cost of equity.
11 Mr. Baudino also questions the propriety of your leverage adjustment.
12 Please respond.
13 A: Mr. Baudino has not properly recognized that my leverage adjustment is not
14 a market-to-book ratio adjustment. In response to his specific criticisms, my
15 adjustment does not alter the use of book values of common equity,
16 preferred stock, and long-term debt in calculating the weighted average cost
17 of capital. Next, my adjustment does not address any of the factors that Mr.
18 Baudino identifies would cause market prices to deviate from book value.
19 And, my adjustment is not an attempt to "prop up high market-to-book
20 ratios" because it does not provide a return that supports any particular M/B 23 23
Q: Mr. Baudino presents the results of his CAPM showing a range of 7.53% to1
7.7% using expectational data, and only 5.77% to 7.22% using historical2
data. Please comment.3
A: With these ranges, Mr. Baudino appears to discount all of the CAPM results4
as not plausible. All of these returns clearly do not support his 9.00% cost of5
equity proposal.6
7
Q: Mr. Baudino provides a critique of your direct testimony and highlights8
various areas where he believes that you have overstated the Company’s9
cost of equity.10
Mr. Baudino also questions the propriety of your leverage adjustment.11
Please respond.12
A: Mr. Baudino has not properly recognized that my leverage adjustment is not13
a market-to-book ratio adjustment. In response to his specific criticisms, my14
adjustment does not alter the use of book values of common equity,15
preferred stock, and long-term debt in calculating the weighted average cost16
of capital. Next, my adjustment does not address any of the factors that Mr.17
Baudino identifies would cause market prices to deviate from book value.18
And, my adjustment is not an attempt to “prop up high market-to-book19
ratios” because it does not provide a return that supports any particular M/B20

1 ratio, high or low. Further, my leverage adjustment does not address any
2
distinction between investors' expected returns and their required returns.
3
My adjustment deals only with risk differences attributed to changes in
4
financial risk. As to the rating agencies, they are concerned primarily with a
5 company's cash flow and the ability to adequately cover debt service. While
6 the rating agencies have specific benchmarks for the proportion of debt to
7 capitalization, they do not calculate market based measures of the cost of
8 equity and link those results to a company's book value capital structure.
9
Hence, they would not need to address this issue.
10
11 Q: Mr. Baudino asserts that your proposed DCF growth rate is slightly greater
12 than the high end of the range of your analysis. Please respond.
13 A. My DCF growth rate is entirely within investor growth expectations for the
14 gas utilities and is fully supported by my data. Focusing on my updated
15 schedules, Attachment PRM-9 shows the analysts' forecasts of average
16 earnings growth for the gas utilities were 5.45% by FirstCall/IBES, 6.30% by
17 Zacks, 6.65% by Morningstar, 6.31% by SNL, and 5.69% by ValueLine. Three
18 out of five forecasts of earnings per share growth are above the growth rate
19 that I have used, and some by a significant measure. The 6.25% growth rate
20 that I used in my updated DCF analysis is entirely within this range. 24 24
ratio, high or low. Further, my leverage adjustment does not address any1
distinction between investors’ expected returns and their required returns.2
My adjustment deals only with risk differences attributed to changes in3
financial risk. As to the rating agencies, they are concerned primarily with a4
company’s cash flow and the ability to adequately cover debt service. While5
the rating agencies have specific benchmarks for the proportion of debt to6
capitalization, they do not calculate market based measures of the cost of7
equity and link those results to a company’s book value capital structure.8
Hence, they would not need to address this issue.9
10
Q: Mr. Baudino asserts that your proposed DCF growth rate is slightly greater11
than the high end of the range of your analysis. Please respond.12
A. My DCF growth rate is entirely within investor growth expectations for the13
gas utilities and is fully supported by my data. Focusing on my updated14
schedules, Attachment PRM-9 shows the analysts’ forecasts of average15
earnings growth for the gas utilities were 5.45% by FirstCall/IBES, 6.30% by16
Zacks, 6.65% by Morningstar, 6.31% by SNL, and 5.69% by ValueLine. Three17
out of five forecasts of earnings per share growth are above the growth rate18
that I have used, and some by a significant measure. The 6.25% growth rate19
that I used in my updated DCF analysis is entirely within this range.20

1
2 Q: Mr. Baudino seems to believe that using historical data for the Risk
3 Premium approach creates a problem with using historical premiums that
4 reflect current investor expectations. Please respond.
5 A: I share Mr. Baudino's concern in this regard. There are two ways to deal
6 with this issue. First, an analyst can use all reliable data to establish the risk
7 premium, thus avoiding a bias in selecting a particular period. This
8 represents one of the approaches that Mr. Baudino employed to arrive at his
9 market premium component of the CAPM. Second, an analyst can develop a
10 risk premium from historical data that seeks to emulate investors' current
11 expectations. I followed the later approach. The value of this approach is
12 that it allows the risk premium to vary over time -- which is what my risk
13 premium does.
14
15 Q: Mr. Baudino suggests that your CAPM results are overstated. Please
16 respond.
17 A: I used sources and methodologies similar to those employed by Mr.
18 Baudino. For example, I used the Value Line source. Second, I made a DCF
19 calculation for the S&P 500 that employed analysts' estimates to calculate the
20 DCF return. Finally, I tempered these forecasts with historical data. As to 25 25
1
Q: Mr. Baudino seems to believe that using historical data for the Risk2
Premium approach creates a problem with using historical premiums that3
reflect current investor expectations. Please respond.4
A: I share Mr. Baudino’s concern in this regard. There are two ways to deal5
with this issue. First, an analyst can use all reliable data to establish the risk6
premium, thus avoiding a bias in selecting a particular period. This7
represents one of the approaches that Mr. Baudino employed to arrive at his8
market premium component of the CAPM. Second, an analyst can develop a9
risk premium from historical data that seeks to emulate investors’ current10
expectations. I followed the later approach. The value of this approach is11
that it allows the risk premium to vary over time -- which is what my risk12
premium does.13
14
Q: Mr. Baudino suggests that your CAPM results are overstated. Please15
respond.16
A: I used sources and methodologies similar to those employed by Mr.17
Baudino. For example, I used the Value Line source. Second, I made a DCF18
calculation for the S&P 500 that employed analysts’ estimates to calculate the19
DCF return. Finally, I tempered these forecasts with historical data. As to20

1
the issue of geometric means, I have previously explained why these
2
measures are inappropriate for use in the CAPM and will not repeat them
3
here.
4
As to my use of unlevered and levered betas, I employed the Hamada
5
formula, which is merely an extension of the Modigliani & Miller formula
6
that I used in the DCF. As a consequence, the explanation that I provided
7
previously for the leverage adjustment also applies to the levered betas. It is
8
only because the regulatory process uses book values to calculate the
9
weighted average cost of capital that we need to address this issue here.
10
Regarding Mr. Baudino's observations about the size adjustment, the
11
2015 Yearbook clearly shows that the size premiums were developed from
12
all types of companies, including public utilities.
13
14 Q: Mr. Baudino also finds fault with your Comparable Earnings. Please
15 respond.
16 A: As noted previously, I did not factor the results of the Comparable Earnings
17 method directly into my recommended cost of equity for CKY. Rather, the
18 results of the Comparable Earnings approach were used to confirm the
19 results of the market based models (i.e., DCF, Risk Premium, and CAPM)
20 that I did use to arrive at my recommended cost of equity.
26 26
the issue of geometric means, I have previously explained why these1
measures are inappropriate for use in the CAPM and will not repeat them2
here.3
As to my use of unlevered and levered betas, I employed the Hamada4
formula, which is merely an extension of the Modigliani & Miller formula5
that I used in the DCF. As a consequence, the explanation that I provided6
previously for the leverage adjustment also applies to the levered betas. It is7
only because the regulatory process uses book values to calculate the8
weighted average cost of capital that we need to address this issue here.9
Regarding Mr. Baudino’s observations about the size adjustment, the10
2015 Yearbook clearly shows that the size premiums were developed from11
all types of companies, including public utilities.12
13
Q: Mr. Baudino also finds fault with your Comparable Earnings. Please14
respond.15
A: As noted previously, I did not factor the results of the Comparable Earnings16
method directly into my recommended cost of equity for CKY. Rather, the17
results of the Comparable Earnings approach were used to confirm the18
results of the market based models (i.e., DCF, Risk Premium, and CAPM)19
that I did use to arrive at my recommended cost of equity.20

1
2 Q: Does this complete your Prepared Rebuttal Testimony?
3 A: Yes, it does.
4
27
1
Q: Does this complete your Prepared Rebuttal Testimony?2
A: Yes, it does.3
4
Columbia Exhibit No.
COMMONWEALTH OF KENTUCKY
BEFORE THE PUBLIC SERVICE COMMISSION
In the matter of adjustment of rates of
) Columbia Gas of Kentucky, Inc. ) Case No. 2016-00162
REBUTTAL ATTACHMENT TO ACCOMPANY THE REBUTTAL TESTIMONY OF PAUL R. MOUL
ON BEHALF OF COLUMBIA GAS OF KENTUCKY, INC.
Stephen B. Seiple, Assistant General Counsel Brooke E. Leslie, Senior Counsel 200 Civic Center Drive P. O. Box 117 Columbus, Ohio 43216-0117 Telephone: (614) 460-4648 Fax: (614) 460-6986 Email: [email protected]
Attorneys for Applicant
COLUMBIA GAS OF KENTUCKY, INC.
Columbia Exhibit No. .
COMMONWEALTH OF KENTUCKY
BEFORE THE PUBLIC SERVICE COMMISSION
In the matter of adjustment of rates of Columbia Gas of Kentucky, Inc.
) )
Case No. 2016-00162
REBUTTAL ATTACHMENT TO ACCOMPANY THE REBUTTAL TESTIMONY OF PAUL R. MOUL
ON BEHALF OF COLUMBIA GAS OF KENTUCKY, INC.
Stephen B. Seiple, Assistant General Counsel
Brooke E. Leslie, Senior Counsel 200 Civic Center Drive P. O. Box 117 Columbus, Ohio 43216-0117 Telephone: (614) 460-4648 Fax: (614) 460-6986 Email: [email protected]
Attorneys for Applicant
COLUMBIA GAS OF KENTUCKY, INC.

Rebuttal Attachment PRM-16 Page 1 of 1
Proxy Group of Natural Gas Companies Capital Structure Ratios
2016 2017 2019-21 Long-term Debt Ratio
Common Equity Ratio
Long-term Debt Ratio
Common Equity Ratio
Long-term Debt Ratio
Common Equity Ratio
Atmos Energy Corp. 40.0% 60.0% 43.0% 57.0% 45.0% 55.0% Chesapeake Utilities Corp. 29.0% 71.0% 29.0% 71.0% 30.0% 70.0% New Jersey Resources Corp. 43.0% 57.0% 43.0% 57.0% 40.5% 59.5% Northwest Natural Gas Co. 43.0% 57.0% 43.0% 57.0% 43.0% 57.0% South Jersey Industries 41.5% 58.5% 42.5% 57.5% 45.0% 55.0% Southwest Gas 47.0% 53.0% 48.0% 52.0% 48.5% 51.5% Spire Inc. 52.5% 47.5% 52.0% 48.0% 51.5% 48.5% WGL holdings, Inc. 41.5% 57.5% 41.5% 57.0% 43.5% 55.5%
Average - all companies 42.2% 57.7% 42.8% 57.1% 43.4% 56.5%
Source: The Value Line Investment Survey, September 2, 2016
Rebuttal Attachment PRM-16Page 1 of 1
Long-term Debt Ratio
Common Equity Ratio
Long-term Debt Ratio
Common Equity Ratio
Long-term Debt Ratio
Common Equity Ratio
Atmos Energy Corp. 40.0% 60.0% 43.0% 57.0% 45.0% 55.0%Chesapeake Utilities Corp. 29.0% 71.0% 29.0% 71.0% 30.0% 70.0%New Jersey Resources Corp. 43.0% 57.0% 43.0% 57.0% 40.5% 59.5%Northwest Natural Gas Co. 43.0% 57.0% 43.0% 57.0% 43.0% 57.0%South Jersey Industries 41.5% 58.5% 42.5% 57.5% 45.0% 55.0%Southwest Gas 47.0% 53.0% 48.0% 52.0% 48.5% 51.5%Spire Inc. 52.5% 47.5% 52.0% 48.0% 51.5% 48.5%WGL holdings, Inc. 41.5% 57.5% 41.5% 57.0% 43.5% 55.5%
Average - all companies 42.2% 57.7% 42.8% 57.1% 43.4% 56.5%
Source: The Value Line Investment Survey, September 2, 2016
2016 2017 2019-21
Proxy Group of Natural Gas CompaniesCapital Structure Ratios
Columbia Exhibit No.
COMMONWEALTH OF KENTUCKY
BEFORE THE PUBLIC SERVICE COMMISSION
In the matter of adjustment of rates of
) Columbia Gas of Kentucky, Inc. ) Case No. 2016-00162
UPDATED ATTACHMENTS TO ACCOMPANY THE
TESTIMONY OF PAUL R. MOUL ON BEHALF OF COLUMBIA GAS OF KENTUCKY, INC.
Stephen B. Seiple, Assistant General Counsel Brooke E. Leslie, Senior Counsel 200 Civic Center Drive P. O. Box 117 Columbus, Ohio 43216-0117 Telephone: (614) 460-4648 Fax: (614) 460-6986 Email: [email protected]
Attorneys for Applicant
COLUMBIA GAS OF KENTUCKY, INC.
Columbia Exhibit No. .
COMMONWEALTH OF KENTUCKY
BEFORE THE PUBLIC SERVICE COMMISSION
In the matter of adjustment of rates of Columbia Gas of Kentucky, Inc.
) )
Case No. 2016-00162
UPDATED ATTACHMENTS TO ACCOMPANY THE
TESTIMONY OF PAUL R. MOUL ON BEHALF OF COLUMBIA GAS OF KENTUCKY, INC.
Stephen B. Seiple, Assistant General Counsel
Brooke E. Leslie, Senior Counsel 200 Civic Center Drive P. O. Box 117 Columbus, Ohio 43216-0117 Telephone: (614) 460-4648 Fax: (614) 460-6986 Email: [email protected]
Attorneys for Applicant
COLUMBIA GAS OF KENTUCKY, INC.

Attachment PRM-1 Page 2 of 2 UPDATED
Columbia Gas of Kentucky, Inc. Cost of Equity
as of August 31, 2016
Discounted Cash Flow (DCF)
D1/130(1) (2)
g lev. (3) = k x flot. (4) = k Gas Group
2.83% + 6.25% + 0.89% = 9.97% x 1.02 = 10.17%
Risk Premium (RP) i (5) ▪ RP (6) = k flot. = k
Gas Group
4.60% 6.50% = 11.10% ▪ 0.20% = 11.30%
Capital Asset Pricing Model (CAPM) Rf (7) + a (8) x ( Rm-Rf I9) ) + size (10) = k flot. = k Gas Group 3.25% + 0.88 x ( 7.73% ) + 1.00% = 11.05% 0.20% = 11.25%
Comparable Earnings (CE)
Historical (11) Forecast (11) Average Comparable Earnings Group
15.1% 14.0% 14.55%
References (1) Attachment PRM-7 page 1 (2) Attachment PRM-9 page 1 (3) Attachment PRM-10 page 1 (4) Attachment PRM-11 page 1 (5) A-rated public utility bond yield comprised of a 3.25% risk-free rate of return (Attachment
PRM-14 page 2) and a yield spread of 1.35% (Attachment PRM-12 page 3) (6) Attachment PRM-13 page 1 (7) Attachment PRM-14 pages 1 & 2 (8) Attachment PRM-10 page 1 (9) Attachment PRM-14 page 2 (10)Attachment PRM-14 page 3 (11)Attachment PRM-15 page 2
Attachment PRM-1 Page 2 of 2 UPDATED
Columbia Gas of Kentucky, Inc. Cost of Equity
as of August 31, 2016
Discounted Cash Flow (DCF)
Di/PO (1) (2) lev. (3) = k x Hot (4) = k
Gas Group
2.83% 6.25% + 0.89% = 9.97% x 1.02 = 10.17%
Risk Premium (RP)
(5) + RP (6) = k + flot. = k Gas Group
4.60% + 6.50% = 11.10% + 0.20% = 11.30%
Capital Asset Pricing Model (CAPM) Rf (7) + a (8) x ( Rm-Rf I 9) ) + size (10) = k flot. = k Gas Group 3.25% + 0.88 x ( 7.73% ) + 1.00% = 11.05% + 0.20% = 11.25%
Comparable Earnings (CE)
Historical (11) Forecast (11) Average Comparable Earnings Group
15.1% 14.0% 14.55%
References (1) Attachment PRM-7 page 1 (2) Attachment PRM-9 page 1 (3) Attachment PRM-10 page 1 (4) Attachment PRM-11 page 1 (5) A-rated public utility bond yield comprised of a 3.25% risk-free rate of return (Attachment
PRM-14 page 2) and a yield spread of 1.35% (Attachment PRM-12 page 3) (6) Attachment PRM-13 page 1 (7) Attachment PRM-14 pages 1 & 2 (8) Attachment PRM-10 page 1 (9) Attachment PRM-14 page 2 (10)Attachment PRM-14 page 3 (11)Attachment PRM-15 page 2
Attachment PRM-1Page 2 of 2UPDATED
Discounted Cash Flow (DCF) D 1 /P 0 (1) + g (2) + lev. (3) = k x flot. (4) = k
Gas Group 2.83% + 6.25% + 0.89% = 9.97% x 1.02 = 10.17%
Risk Premium (RP) I (5) + RP (6) = k + flot. = kGas Group 4.60% + 6.50% = 11.10% + 0.20% = 11.30%
Capital Asset Pricing Model (CAPM) Rf (7) + ß (8) x ( Rm-Rf (9) ) + size (10) = k + flot. = kGas Group 3.25% + 0.88 x ( 7.73% ) + 1.00% = 11.05% + 0.20% = 11.25%
Comparable Earnings (CE) Historical (11) Forecast (11) AverageComparable Earnings Group 15.1% 14.0% 14.55%
References (1) Attachment PRM-7 page 1(2) Attachment PRM-9 page 1(3) Attachment PRM-10 page 1(4) Attachment PRM-11 page 1(5)
(6) Attachment PRM-13 page 1(7) Attachment PRM-14 pages 1 & 2(8) Attachment PRM-10 page 1(9) Attachment PRM-14 page 2
(10) Attachment PRM-14 page 3(11) Attachment PRM-15 page 2
A-rated public utility bond yield comprised of a 3.25% risk-free rate of return (Attachment PRM-14 page 2) and a yield spread of 1.35% (Attachment PRM-12 page 3)
Columbia Gas of Kentucky, Inc.Cost of Equity
as of August 31, 2016

Attachment PRM-7 Page 1 of 1 UPDATED
Monthly Dividend Yields for Natural Gas Group
for the Twelve Months Ending August 2016
Company Jul-15 Aug-15 Sep-15 Oct-15 Nov-15 Dec-15 Jan-16 Feb-16 Mar-16 Apr-16 May-16 Jun-16 Jul-16 Aug-16 12-Month Average
6-Month Average
3-Month Average
Atmos Energy Corp (ATO) 2.84% 2.85% 2.69% 2.68% 2.70% 2.67% 2.44% 2.42% 2.27% 2.33% 2.31% 2.07% 2.11% 2.28% 2.41% 2.23% 2.15% Chesapeake Utilities Corp (CPK) 2.24% 2.35% 2.17% 2.21% 2.17% 2.03% 1.83% 1.85% 1.83% 2.06% 2.12% 1.85% 1.91% 1.92% 2.00% 1.95% 1.89% Spire Inc. (SR) 3.42% 3.50% 3.38% 3.36% 3.38% 3.31% 3.08% 3.01% 2.90% 3.08% 3.10% 2.77% 2.84% 3.05% 3.11% 2.96% 2.89% New Jersey Resources Corporation (NJR) 3.34% 3.42% 3.20% 3.04% 3.22% 2.92% 2.74% 2.79% 2.64% 2.70% 2.75% 2.49% 2.59% 2.87% 2.83% 2.67% 2.65% Northwest Natural Gas (NWN) 4.30% 4.25% 4.09% 3.92% 3.85% 3.72% 3.60% 3.76% 3.49% 3.63% 3.42% 2.90% 2.88% 3.14% 3.53% 3.24% 2.97%
South Jersey Industries Inc (SJI) 4.17% 4.21% 3.99% 4.00% 4.64% 4.50% 4.27% 4.19% 3.71% 3.80% 3.68% 3.34% 3.33% 3.58% 3.92% 3.57% 3.42% Southwest Gas Corp (SWX) 2.89% 2.94% 2.79% 2.65% 2.89% 2.95% 2.77% 2.66% 2.47% 2.79% 2.60% 2.29% 2.33% 2.58% 2.65% 2.51% 2.40% WGL Holdings Inc (WGL) 3.32% 3.43% 3.23% 2.98% 3.01% 2.96% 2.78% 2.72% 2.57% 2.88% 3.00% 2.77% 2.76% 3.12% 2.90% 2.85% 2.88%
Average UZZ aani 1101 3=1 I= 1= LEN Laa LUZ LIM LEM LEN LEN &la UZI UZI &
Note: Monthly dividend yields are calculated by dividing the annualized quarterly dividend by the month-end closing stock price adjusted by the fraction of the ex-dividend.
Source of Information: http://performance.morningstar.corn/stock/performance-return http://www.snl.com/interactivex/dividends
Forward-looking Dividend Yield 1/2 Growth Do/Po (.59) Di/Po Do el+ gr+ Do + g + Do ri + gf+ Do el 9 y K - +g
Po 2.75% 1.031250 2.83%
Discrete Do/Po Adj. 131/Po K-D0(1+9)25+Do(1+g)5°+Dop+gr+Dop+gy°°+9
2.75% 1.038767 2.85% Po
Quarterly Do/Po Adj. Di/Po ic = . r›. ei ' g Y" I 1[1.g 0.6871% 1.015272 2.82%
[Ci p,., , _I
Average 2.83%
Growth rate 6.25%
K 9.08%
Attachment PRM-7 Page 1 of 1 UPDATED
Monthly Dividend Yields for Natural Gas Group
for the Twelve Months Ending August 2016
Company Jul-15 Aug-15 Sep-15 Oct-15 Nov-15 Dec-15 Jan-16 Feb-16 Mar-16 Apr-16 May-16 Jun-16 Jul-16 Aug-16 12-Month Average
6-Month Average
3-Month Average
Atmos Energy Corp (ATO) 2.84% 2.85% 2.69% 2.68% 2.70% 2.67% 2.44% 2.42% 2.27% 2.33% 2.31% 2.07% 2.11% 2.28% 2.41% 2.23% 2.15% Chesapeake Utilities Corp (CPK) 2.24% 2.35% 2.17% 2.21% 2.17% 2.03% 1.83% 1.85% 1.83% 2.06% 2.12% 1.85% 1.91% 1.92% 2.00% 1.95% 1.89% Spire Inc. (SR) 3.42% 3.50% 3.38% 3.36% 3.38% 3.31% 3.08% 3.01% 2.90% 3.08% 3.10% 2.77% 2.84% 3.05% 3.11% 2.96% 2.89% New Jersey Resources Corporation (NJR) 3.34% 3.42% 3.20% 3.04% 3.22% 2.92% 2.74% 2.79% 2.64% 2.70% 2.75% 2.49% 2.59% 2.87% 2.83% 2.67% 2.65% Northwest Natural Gas (NWN) 4.30% 4.25% 4.09% 3.92% 3.85% 3.72% 3.60% 3.76% 3.49% 3.63% 3.42% 2.90% 2.88% 3.14% 3.53% 3.24% 2.97%
South Jersey Industries Inc (SJI) 4.17% 4.21% 3.99% 4.00% 4.64% 4.50% 4.27% 4.19% 3.71% 3.80% 3.68% 3.34% 3.33% 3.58% 3.92% 3.57% 3.42% Southwest Gas Corp (SWX) 2.89% 2.94% 2.79% 2.65% 2.89% 2.95% 2.77% 2.66% 2.47% 2.79% 2.60% 2.29% 2.33% 2.58% 2.65% 2.51% 2.40% WGL Holdings Inc (WGL) 3.32% 3.43% 3.23% 2.98% 3.01% 2.96% 2.78% 2.72% 2.57% 2.88% 3.00% 2.77% 2.76% 3.12% 2.90% 2.85% 2.88%
Average 122.% 3.37% 3.19% 1131 2.11.1b 3.13% LEN LIZ LUZ LUZ UZI LUZ LUZ LIZ.% LUZ 2.7.1% &
Note: Monthly dividend yields are calculated by dividing the annualized quarterly dividend by the month-end closing stock price adjusted by the fraction of the ex-dividend.
Source of Information: http://performance.morningstar.corn/stock/performance-return http://www.snl.com/interactivex/dividends
Forward-looking Dividend Yield 1/2 Growth Do/Po (.5g) Di/Po K - Do ell - gr+D 0 (1+g )O +130 (1+g f+ Do (1+g f +
Po g
2.75% 1.031250 2.83%
Discrete Do/Po Adj. Di/Po K _Do(1 +9).25 +Do0+9; 5° +Do0+915 +Do(1+9)"° +9
2.75% 1.038767 2.85% Po
Quarterly D0/P0 Adj. Di/Po IC = 1[1 4-g
Average 0.6871% 1.015272
[C1
2
2..882
351
Growth rate 6.25%
K 9.08%
Attachment PRM-7Page 1 of 1UPDATED
Natural Gas Group
12-Month 6-Month 3-MonthCompany Jul-15 Aug-15 Sep-15 Oct-15 Nov-15 Dec-15 Jan-16 Feb-16 Mar-16 Apr-16 May-16 Jun-16 Jul-16 Aug-16 Average Average Average
Atmos Energy Corp (ATO) 2.84% 2.85% 2.69% 2.68% 2.70% 2.67% 2.44% 2.42% 2.27% 2.33% 2.31% 2.07% 2.11% 2.28% 2.41% 2.23% 2.15%Chesapeake Utilities Corp (CPK) 2.24% 2.35% 2.17% 2.21% 2.17% 2.03% 1.83% 1.85% 1.83% 2.06% 2.12% 1.85% 1.91% 1.92% 2.00% 1.95% 1.89%Spire Inc. (SR) 3.42% 3.50% 3.38% 3.36% 3.38% 3.31% 3.08% 3.01% 2.90% 3.08% 3.10% 2.77% 2.84% 3.05% 3.11% 2.96% 2.89%New Jersey Resources Corporation (NJR) 3.34% 3.42% 3.20% 3.04% 3.22% 2.92% 2.74% 2.79% 2.64% 2.70% 2.75% 2.49% 2.59% 2.87% 2.83% 2.67% 2.65%Northwest Natural Gas (NWN) 4.30% 4.25% 4.09% 3.92% 3.85% 3.72% 3.60% 3.76% 3.49% 3.63% 3.42% 2.90% 2.88% 3.14% 3.53% 3.24% 2.97%
South Jersey Industries Inc (SJI) 4.17% 4.21% 3.99% 4.00% 4.64% 4.50% 4.27% 4.19% 3.71% 3.80% 3.68% 3.34% 3.33% 3.58% 3.92% 3.57% 3.42%Southwest Gas Corp (SWX) 2.89% 2.94% 2.79% 2.65% 2.89% 2.95% 2.77% 2.66% 2.47% 2.79% 2.60% 2.29% 2.33% 2.58% 2.65% 2.51% 2.40%WGL Holdings Inc (WGL) 3.32% 3.43% 3.23% 2.98% 3.01% 2.96% 2.78% 2.72% 2.57% 2.88% 3.00% 2.77% 2.76% 3.12% 2.90% 2.85% 2.88%
Average 3.32% 3.37% 3.19% 3.11% 3.23% 3.13% 2.94% 2.93% 2.74% 2.91% 2.87% 2.56% 2.59% 2.82% 2.92% 2.75% 2.66%
Note:
Source of Information: http://performance.morningstar.com/stock/performance-returnhttp://www.snl.com/interactivex/dividends
Forward-looking Dividend Yield 1/2 Growth D0/P0 (.5g) D1/P0
2.75% 1.031250 2.83%
Discrete D0/P0 Adj. D1/P0
2.75% 1.038767 2.85%
Quarterly D0/P0 Adj. D1/P0
0.6871% 1.015272 2.82%Average 2.83%
Growth rate 6.25%
K 9.08%
Monthly Dividend Yields for
for the Twelve Months Ending August 2016
Monthly dividend yields are calculated by dividing the annualized quarterly dividend by the month-end closing stock price adjusted by the fraction of the ex-dividend.
g + P
)g + (1 D + )g + (1 D + )g + (1 D + )g + (1 D = K0
10
10
00
00
g + P
)g + (1 D + )g + (1 D + )g + (1 D + )g + (1 D = K0
1.000
.750
.500
.250
g + 1- P
)g + (1 D + 1 = K0
.250
4

Attachment PRM-8 Page 1 of 1 UPDATED
Historical Growth Rates Earnings Per Share, Dividends Per Share,
Book Value Per Share, and Cash Flow Per Share
Gas Group
Earnings per Share Dividends per Share Book Value per Share Cash Flow per Share Value Line Value Line Value Line Value Line
5 Year 10 Year 5 Year 10 Year 5 Year 10 Year 5 Year 10 Year
Atmos Energy Corp. 7.00% 5.50% 2.50% 2.00% 5.00% 5.00% 4.50% 5.00% Chesapeake Utilities Corp. 10.00% 8.00% 5.00% 3.50% 8.00% 9.00% 11.50% 7.00% Spire, Inc. -1.00% 3.00% 3.00% 2.50% 8.00% 7.50% 0.50% 4.00% New Jersey Resources Corp. 6.50% 7.50% 7.00% 7.00% 6.50% 8.00% 7.50% 6.50% Northwest Natural Gas -5.00% 1.00% 3.00% 3.50% 2.50% 3.00% -1.00% 2.00% South Jersey Industries, Inc. 4.00% 7.00% 9.50% 9.00% 8.50% 8.00% 6.00% 7.50% Southwest Gas Corp. 10.00% 8.50% 9.00% 6.00% 5.50% 5.50% 6.50% 5.00% WGL Holdings, Inc. 2.50% 2.50% 3.50% 3.00% 2.50% 4.00% 2.50% 2.00%
Average 4.25% 5.38% 5.31% 4.56% 5.81% 6.25% 4.75% 4.88%
Source of Information: Value Line Investment Survey, September 2, 2016
Attachment PRM-8Page 1 of 1UPDATED
Dividends per Share Book Value per Share Cash Flow per Share
Gas Group 5 Year 10 Year 5 Year 10 Year 5 Year 10 Year 5 Year 10 Year
Atmos Energy Corp. 7.00% 5.50% 2.50% 2.00% 5.00% 5.00% 4.50% 5.00%Chesapeake Utilities Corp. 10.00% 8.00% 5.00% 3.50% 8.00% 9.00% 11.50% 7.00%Spire, Inc. -1.00% 3.00% 3.00% 2.50% 8.00% 7.50% 0.50% 4.00%New Jersey Resources Corp. 6.50% 7.50% 7.00% 7.00% 6.50% 8.00% 7.50% 6.50%Northwest Natural Gas -5.00% 1.00% 3.00% 3.50% 2.50% 3.00% -1.00% 2.00%South Jersey Industries, Inc. 4.00% 7.00% 9.50% 9.00% 8.50% 8.00% 6.00% 7.50%Southwest Gas Corp. 10.00% 8.50% 9.00% 6.00% 5.50% 5.50% 6.50% 5.00%WGL Holdings, Inc. 2.50% 2.50% 3.50% 3.00% 2.50% 4.00% 2.50% 2.00%
Average 4.25% 5.38% 5.31% 4.56% 5.81% 6.25% 4.75% 4.88%
Source of Information: Value Line Investment Survey, September 2, 2016
Historical Growth RatesEarnings Per Share, Dividends Per Share,
Book Value Per Share, and Cash Flow Per Share
Earnings per ShareValue Line Value Line Value Line Value Line

Attachment PRM-9 Page 1 of 1 UPDATED
Analysts' Five-Year Projected Growth Rates Earnings Per Share, Dividends Per Share,
Book Value Per Share, and Cash Flow Per Share
Value Line I/B/E/S Book Cash Percent First Earnings Dividends Value Flow Retained to
Gas Group Call Zacks Morningstar SNL Per Share Per Share Per Share Per Share Common Equity
Atmos Energy Corp. 7.30% 7.20% 6.70% 6.90% 6.50% 6.50% 3.50% 5.00% 5.50% Chesapeake Utilities Corp. 3.00% NA NA 8.50% 6.00% 6.50% 7.00% 8.00% Spire, Inc. 4.78% 4.60% 4.80% 9.00% 3.50% 4.50% 9.50% 5.00% New Jersey Resources Corp. 6.50% 6.50% 3.30% 6.50% 1.00% 3.00% 6.50% 1.50% 4.50% Northwest Natural Gas 4.00% 4.00% 4.00% 7.00% 2.00% 2.50% 4.00% 3.50% South Jersey Industries, Inc. 6.00% 10.00% 10.00% 10.00% 3.00% 6.50% 8.00% 2.50% 1.50% Southwest Gas Corp. 4.00% 4.50% 4.00% 7.00% 8.50% 3.00% 6.50% 6.00% WGL Holdings, Inc. 8.00% 7.30% 6.60% 8.00% 3.50% 2.50% 6.00% 3.50% 3.50%
Average 5.45% 6.30% 6.65% 6.31% 5.69% 4.81% 5.06% 4.94% 4.69%
Source of Information : Yahoo Finance, August 30, 2016 Zacks, August 30, 2016 Morningstar, August 30, 2016 SNL, August 30, 2016 Value Line Investment Survey, September 2, 2016
Attachment PRM-9Page 1 of 1UPDATED
Value LineI/B/E/S Book Cash PercentFirst Earnings Dividends Value Flow Retained to
Gas Group Call Zacks Morningstar SNL Per Share Per Share Per Share Per Share Common Equity
Atmos Energy Corp. 7.30% 7.20% 6.70% 6.90% 6.50% 6.50% 3.50% 5.00% 5.50%Chesapeake Utilities Corp. 3.00% NA - NA 8.50% 6.00% 6.50% 7.00% 8.00%Spire, Inc. 4.78% 4.60% - 4.80% 9.00% 3.50% 4.50% 9.50% 5.00%New Jersey Resources Corp. 6.50% 6.50% 3.30% 6.50% 1.00% 3.00% 6.50% 1.50% 4.50%Northwest Natural Gas 4.00% 4.00% - 4.00% 7.00% 2.00% 2.50% 4.00% 3.50%South Jersey Industries, Inc. 6.00% 10.00% 10.00% 10.00% 3.00% 6.50% 8.00% 2.50% 1.50%Southwest Gas Corp. 4.00% 4.50% - 4.00% 7.00% 8.50% 3.00% 6.50% 6.00%WGL Holdings, Inc. 8.00% 7.30% 6.60% 8.00% 3.50% 2.50% 6.00% 3.50% 3.50%
Average 5.45% 6.30% 6.65% 6.31% 5.69% 4.81% 5.06% 4.94% 4.69%
Source of Information : Yahoo Finance, August 30, 2016Zacks, August 30, 2016Morningstar, August 30, 2016SNL, August 30, 2016Value Line Investment Survey, September 2, 2016
Analysts' Five-Year Projected Growth RatesEarnings Per Share, Dividends Per Share,
Book Value Per Share, and Cash Flow Per Share

Attachment PRM-10 Page 1 of 1 UPDATED
Gatpou Financial Risk Adiustment
Fiscal Year
ATMOS Energy (NYSE:ATO)
Chesapeake Utilities
(NYSE:CPK) Spire, Inc. (NYSE: )
New Jersey Resources
(NYSE:NJR)
Northwest Natural Gas
(NYSE:NWN)
South Jersey Industries
(NYSE:SJI) 12/31/15
Southwest Gas (SWX)
WGL Holdings (NYSE:WGL) Avereae
09/30/15 12/31/15 09/30/15 09/30/15 12/31/15 12/31/15 09/30/15
Capitalization at Fair Values Debt(D) 2,669,323 165,100 1,944,200 817,319 667,168 1,079,000 1,645,684 1,057,900 1,255,712 Preferred(P) 0 0 0 0 0 0 0 28,173 3,522 Equity(E) 5.904.038 866.610 2.363.058 2.484.279 1.388.080 1.669.111 2.613.347 2.867.852 2.519.547 Total 6 573 361 1 031 710 4 307 258 3 301 598 9 055 248 9 748 111 4 259 031 3 953 925 9 778 780
Capital Structure Ratios Debt(D) 31.14% 16.00% 45.14% 24.76% 32.46% 39.26% 38.64% 26.76% 31.77% Preferred(P) 0.00% 0.00% 0.00% 0.00% 0.00% 0.00% 0.00% 0.71% 0.09% Equity(E) 68.86% 84.00% 54.86% 75.24% 67.54% 60.74% 61.36% 72.53% 68.14% Total 100 00% 100 00% 100 00% 100 00% 100 00% 100 00% 100 00% 100 00% 100 00%
Common Stock Issued 101,478.818 15,270.659 43,335.012 85,531.423 27,427.000 70,965.622 47,377.575 49,728.662 Treasury 0.000 0.000 0.000 2,804.847 0.000 0.000 0.000 0.000 Outstanding 101,478.818 15,270.659 43,335.012 82,726.576 27,427.000 70,965.622 47,377.575 49,728.662 Market Price $ 58.18 $ 56.75 $ 54.53 $ 30.03 $ 50.61 $ 23.52 $ 55.16 $ 57.67
Capitalization at Carrying Amounts Debt(D) 2,460,000 153,700 1,851,500 807,845 601,700 1,035,800 1,581,454 944,200 1,179,525 Preferred(P) 0 0 0 0 0 0 0 28,173 3,522 Equity(E) 3.194.797 358.138 1,573,600 1.106.956 780.972 1.037.539 1.594.408 1.243.247 1.361.207 Total 5.654.797 511.838 3425.100 1.914801 1.382672 2.073339 3.175862 2.215620 2.544254
Capital Structure Ratios Debt(D) 43.50% 30.03% 54.06% 42.19% 43.52% 49.96% 49.80% 42.62% 44.46% Preferred(P) 0.00% 0.00% 0.00% 0.00% 0.00% 0.00% 0.00% 1.27% 0.16% Equity(E) 56.50% 69.97% 45.94% 57.81% 56.48% 50.04% 50.20% 56.11% 55.38% Total 100.00% 100.00% 100.00% 100.00% 100.00% 100.00% 100.00% 100.00% 100.00%
Betas Value Line 0.75 0.60 0.70 0.80 0.65 0.80 0.75 0.75 0.73
Hamada BI Bu [1+ (1 - t ) D/E + P/E ] 0.73 Bu [1+ (1-0.35) 0.4662 + 0.0013 ] 0.73 Bu [1+ 0.65 0.4662 + 0.0013 ] 0.73 Bu 1.3043 0.56 Bu
Hamada BI 0.56 [1+ (1 -t) D/E + P/E ] BI 0.56 [1+ 0.65 0.8028 + 0.0029 ] BI 0.56 1.5247 BI 0.85
M&M ku ke - ((( ku i ) 1-t ) D / E (ku - d ) P / E 7.86% 9.08% - ((( 7.86% 3.84% ) 0.65 ) 31.77% / 68.14% 7.86% - 5.68% ) 0.09% / 68.14% 7.86% 9.08% - ((( 4.02% ) 0.65 ) 0.4662 2.18% ) 0.0013 7.86% 9.08% - (( 2.61% ) 0.4662 2.18% ) 0.0013 7.86% 9.08% - 1.22% 0.00%
M&M Ice ku + ((( ku i ) 1-t ) D / E + (ku - d ) P / E 9.97% 7.86% + ((( 7.86% 3.84% ) 0.65 ) 44.46% / 55.38% + 7.86% - 5.68% ) 0.16% / 55.38% 9.97% 7.86% + ((( 4.02% ) 0.65 ) 0.8028 + 2.18% ) 0.0029 9.97% 7.86% + (( 2.61% ) 0.8028 + 2.18% ) 0.0029 9.97% 7.86% + 2.10% + 0.01%
Attachment PRM-10Page 1 of 1UPDATED
ATMOS Energy (NYSE:ATO)
Chesapeake Utilities
(NYSE:CPK) Spire, Inc. (NYSE:__)
New Jersey Resources
(NYSE:NJR)
Northwest Natural Gas
(NYSE:NWN)
South Jersey Industries
(NYSE:SJI) Southwest Gas
(SWX)WGL Holdings (NYSE:WGL) Average
Fiscal Year 09/30/15 12/31/15 09/30/15 09/30/15 12/31/15 12/31/15 12/31/15 09/30/15
Capitalization at Fair ValuesDebt(D) 2,669,323 165,100 1,944,200 817,319 667,168 1,079,000 1,645,684 1,057,900 1,255,712Preferred(P) 0 0 0 0 0 0 0 28,173 3,522Equity(E) 5,904,038 866,610 2,363,058 2,484,279 1,388,080 1,669,111 2,613,347 2,867,852 2,519,547Total 8,573,361 1,031,710 4,307,258 3,301,598 2,055,248 2,748,111 4,259,031 3,953,925 3,778,780
Capital Structure RatiosDebt(D) 31.14% 16.00% 45.14% 24.76% 32.46% 39.26% 38.64% 26.76% 31.77%Preferred(P) 0.00% 0.00% 0.00% 0.00% 0.00% 0.00% 0.00% 0.71% 0.09%Equity(E) 68.86% 84.00% 54.86% 75.24% 67.54% 60.74% 61.36% 72.53% 68.14%Total 100.00% 100.00% 100.00% 100.00% 100.00% 100.00% 100.00% 100.00% 100.00%
Common StockIssued 101,478.818 15,270.659 43,335.012 85,531.423 27,427.000 70,965.622 47,377.575 49,728.662Treasury 0.000 0.000 0.000 2,804.847 0.000 0.000 0.000 0.000Outstanding 101,478.818 15,270.659 43,335.012 82,726.576 27,427.000 70,965.622 47,377.575 49,728.662Market Price 58.18$ 56.75$ 54.53$ 30.03$ 50.61$ 23.52$ 55.16$ 57.67$
Capitalization at Carrying AmountsDebt(D) 2,460,000 153,700 1,851,500 807,845 601,700 1,035,800 1,581,454 944,200 1,179,525Preferred(P) 0 0 0 0 0 0 0 28,173 3,522Equity(E) 3,194,797 358,138 1,573,600 1,106,956 780,972 1,037,539 1,594,408 1,243,247 1,361,207Total 5,654,797 511,838 3,425,100 1,914,801 1,382,672 2,073,339 3,175,862 2,215,620 2,544,254
Capital Structure RatiosDebt(D) 43.50% 30.03% 54.06% 42.19% 43.52% 49.96% 49.80% 42.62% 44.46%Preferred(P) 0.00% 0.00% 0.00% 0.00% 0.00% 0.00% 0.00% 1.27% 0.16%Equity(E) 56.50% 69.97% 45.94% 57.81% 56.48% 50.04% 50.20% 56.11% 55.38%Total 100.00% 100.00% 100.00% 100.00% 100.00% 100.00% 100.00% 100.00% 100.00%
Betas Value Line 0.75 0.60 0.70 0.80 0.65 0.80 0.75 0.75 0.73
Hamada Bl = Bu [1+ (1 - t ) D/E + P/E ]0.73 = Bu [1+ (1-0.35) 0.4662 + 0.0013 ]0.73 = Bu [1+ 0.65 0.4662 + 0.0013 ]0.73 = Bu 1.30430.56 = Bu
Hamada Bl = 0.56 [1+ (1 - t) D/E + P/E ]Bl = 0.56 [1+ 0.65 0.8028 + 0.0029 ]Bl = 0.56 1.5247Bl = 0.85
M&M ku = ke - ((( ku - i ) 1-t ) D / E - (ku - d ) P / E7.86% = 9.08% - ((( 7.86% - 3.84% ) 0.65 ) 31.77% / 68.14% - 7.86% - 5.68% ) 0.09% / 68.14%7.86% = 9.08% - ((( 4.02% ) 0.65 ) 0.4662 - 2.18% ) 0.00137.86% = 9.08% - (( 2.61% ) 0.4662 - 2.18% ) 0.00137.86% = 9.08% - 1.22% - 0.00%
M&M ke = ku + ((( ku - i ) 1-t ) D / E + (ku - d ) P / E9.97% = 7.86% + ((( 7.86% - 3.84% ) 0.65 ) 44.46% / 55.38% + 7.86% - 5.68% ) 0.16% / 55.38%9.97% = 7.86% + ((( 4.02% ) 0.65 ) 0.8028 + 2.18% ) 0.00299.97% = 7.86% + (( 2.61% ) 0.8028 + 2.18% ) 0.00299.97% = 7.86% + 2.10% + 0.01%
Gas GroupFinancial Risk Adjustment

Attachment PRM-12 Page 1 of 3 UPDATED
Interest Rates for Investment Grade Public Utility Bonds Yearly for 2011-2015
and the Twelve Months Ended August 2016
Years Aa
Rated A
Rated Baa
Rated Average
2011 4.78% 5.04% 5.57% 5.13% 2012 3.83% 4.13% 4.86% 4.27% 2013 4.24% 4.48% 4.98% 4.57% 2014 4.19% 4.28% 4.80% 4.42% 2015 4.00% 4.12% 5.03% 4.38%
Five-Year Average 4.21% 4.41% 5.05% 4.55%
Months
Sep-15 4.25% 4.39% 5.42% 4.68% Oct-15 4.13% 4.29% 5.47% 4.63% Nov-15 4.22% 4.40% 5.57% 4.73% Dec-15 4.16% 4.35% 5.55% 4.69% Jan-16 4.09% 4.27% 5.49% 4.62% Feb-16 3.94% 4.11% 5.28% 4.44% Mar-16 3.93% 4.16% 5.12% 4.40% Apr-16 3.74% 4.00% 4.75% 4.16%
May-16 3.65% 3.93% 4.60% 4.06% Jun-16 3.56% 3.78% 4.47% 3.93% Jul-16 3.36% 3.57% 4.16% 3.70%
Aug-16 3.39% 3.59% 4.20% 3.73%
Twelve-Month Average 3.87% 4.07% 5.01% 4.31%
Six-Month Average 3.61% 3.84% 4.55% 4.00%
Three-Month Average 3.44% 3.65% 4.28% 3.79%
Source: Mergent Bond Record
4.40%
Attachment PRM-12Page 1 of 3UPDATED
Aa A BaaYears Rated Rated Rated Average
2011 4.78% 5.04% 5.57% 5.13%2012 3.83% 4.13% 4.86% 4.27%2013 4.24% 4.48% 4.98% 4.57%2014 4.19% 4.28% 4.80% 4.42%2015 4.00% 4.12% 5.03% 4.38%
Five-YearAverage 4.21% 4.41% 5.05% 4.55%
Months
Sep-15 4.25% 4.39% 5.42% 4.68%Oct-15 4.13% 4.29% 5.47% 4.63%Nov-15 4.22% 4.40% 5.57% 4.73%Dec-15 4.16% 4.35% 5.55% 4.69%Jan-16 4.09% 4.27% 5.49% 4.62%Feb-16 3.94% 4.11% 5.28% 4.44%Mar-16 3.93% 4.16% 5.12% 4.40%Apr-16 3.74% 4.00% 4.75% 4.16%
May-16 3.65% 3.93% 4.60% 4.06%Jun-16 3.56% 3.78% 4.47% 3.93%Jul-16 3.36% 3.57% 4.16% 3.70%
Aug-16 3.39% 3.59% 4.20% 3.73%
Twelve-MonthAverage 3.87% 4.07% 5.01% 4.31%
Six-MonthAverage 3.61% 3.84% 4.55% 4.00%
Three-MonthAverage 3.44% 3.65% 4.28% 3.79%
4.40%
Interest Rates for Investment Grade Public Utility BondsYearly for 2011-2015
and the Twelve Months Ended August 2016
Source: Mergent Bond Record

Attachment PRM-12 Page 3 of 3 UPDATED
A rated Public Utility Bonds over 30-Year Treasuries
A-rated 30-Year Treasuries A-rated 30-Year Treasuries A-rated 30-Year Treasuries A-rated 30-Year Treasuries A-rated 30-Year Treasuries Year Public Utility Yield Spread Year Public Utility Yield Spread Year Public Utility Yield Spread Year Public Utility Yield Spread Year Public Utility Yield Spread
Jan-99 6.97% 5.16% 1.81% Jan-03 7.07% Jan-07 5.96% 4.85% 1.11% Jan-11 5.57% 4.52% 1.05% Jan-15 3.58% 2.46% 1.12% Feb-99 7.09% 5.37% 1.72% Feb-03 6.93% Feb-07 5.90% 4.82% 1.08% Feb-11 5.68% 4.65% 1.03% Feb-15 3.67% 2.57% 1.10% Mar-99 7.26% 5.58% 1.68% Mar-03 6.79% Mar-07 5.85% 4.72% 1.13% Mar-11 5.56% 4.51% 1.05% Mar-15 3.74% 2.63% 1.11% Apr-99 7.22% 5.55% 1.67% Apr-03 6.64% Apr-07 5.97% 4.87% 1.10% Apr-11 5.55% 4.50% 1.05% Apr-15 3.75% 2.59% 1.16%
May-99 7.47% 5.81% 1.66% May-03 6.36% May-07 5.99% 4.90% 1.09% May-11 5.32% 4.29% 1.03% May-15 4.17% 2.96% 1.21% Jun-99 7.74% 6.04% 1.70% Jun-03 6.21% Jun-07 6.30% 5.20% 1.10% Jun-11 5.26% 4.23% 1.03% Jun-15 4.39% 3.11% 1.28% Jul-99 7.71% 5.98% 1.73% Jul-03 6.57% Jul-07 6.25% 5.11% 1.14% Jul-11 5.27% 4.27% 1.00% Jul-15 4.40% 3.07% 1.33%
Aug-99 7.91% 6.07% 1.84% Aug-03 6.78% Aug-07 6.24% 4.93% 1.31% Aug-11 4.69% 3.65% 1.04% Aug-15 4.25% 2.86% 1.39% Sep-99 7.93% 6.07% 1.86% Sep-03 6.56% Sep-07 6.18% 4.79% 1.39% Sep-11 4.48% 3.18% 1.30% Sep-15 4.39% 2.95% 1.44% Oct-99 8.06% 6.26% 1.80% Oct-03 6.43% Oct-07 6.11% 4.77% 1.34% Oct-11 4.52% 3.13% 1.39% Oct-15 4.29% 2.89% 1.40% Nov-99 7.94% 6.15% 1.79% Nov-03 6.37% Nov-07 5.97% 4.52% 1.45% Nov-11 4.25% 3.02% 1.23% Nov-15 4.40% 3.03% 1.37% Dec-99 8.14% 6.35% 1.79% Dec-03 6.27% Dec-07 6.16% 4.53% 1.63% Dec-11 4.33% 2.98% 1.35% Dec-15 4.35% 2.97% 1.38%
Jan-00 8.35% 6.63% 1.72% Jan-04 6.15% Jan-08 6.02% 4.33% 1.69% Jan-12 4.34% 3.03% 1.31% Jan-16 4.27% 2.86% 1.41% Feb-00 8.25% 6.23% 2.02% Feb-04 6.15% Feb-08 6.21% 4.52% 1.69% Feb-12 4.36% 3.11% 1.25% Feb-16 4.11% 2.62% 1.49% Mar-00 8.28% 6.05% 2.23% Mar-04 5.97% Mar-08 6.21% 4.39% 1.82% Mar-12 4.48% 3.28% 1.20% Mar-16 4.16% 2.68% 1.48% Apr-00 8.29% 5.85% 2.44% Apr-04 6.35% Apr-08 6.29% 4.44% 1.85% Apr-12 4.40% 3.18% 1.22% Apr-16 4.00% 2.62% 1.38%
May-00 8.70% 6.15% 2.55% May-04 6.62% May-08 6.28% 4.60% 1.68% May-12 4.20% 2.93% 1.27% May-16 3.93% 2.63% 1.30% Jun-00 8.36% 5.93% 2.43% Jun-04 6.46% Jun-08 6.38% 4.69% 1.69% Jun-12 4.08% 2.70% 1.38% Jun-16 3.78% 2.45% 1.33% Jul-00 8.25% 5.85% 2.40% Jul-04 6.27% Jul-08 6.40% 4.57% 1.83% Jul-12 3.93% 2.59% 1.34% Jul-16 3.57% 2.23% 1.34%
Aug-00 8.13% 5.72% 2.41% Aug-04 6.14% Aug-08 6.37% 4.50% 1.87% Aug-12 4.00% 2.77% 1.23% Aug-16 3.59% 2.26% 1.33% Sep-00 8.23% 5.83% 2.40% Sep-04 5.98% Sep-08 6.49% 4.27% 2.22% Sep-12 4.02% 2.88% 1.14% Oct-00 8.14% 5.80% 2.34% Oct-04 5.94% Oct-08 7.56% 4.17% 3.39% Oct-12 3.91% 2.90% 1.01% Nov-00 8.11% 5.78% 2.33% Nov-04 5.97% Nov-08 7.60% 4.00% 3.60% Nov-12 3.84% 2.80% 1.04% Dec-00 7.84% 5.49% 2.35% Dec-04 5.92% Dec-08 6.52% 2.87% 3.65% Dec-12 4.00% 2.88% 1.12% Average:
12-months 1.39% Jan-01 7.80% 5.54% 2.26% Jan-05 5.78% Jan-09 6.39% 3.13% 3.26% Jan-13 4.15% 3.08% 1.07% 6-months 1.36% Feb-01 7.74% 5.45% 2.29% Feb-05 5.61% Feb-09 6.30% 3.59% 2.71% Feb-13 4.18% 3.17% 1.01% 3-months 1.33% Mar-01 7.68% 5.34% 2.34% Mar-05 5.83% Mar-09 6.42% 3.64% 2.78% Mar-13 4.20% 3.16% 1.04% Apr-01 7.94% 5.65% 2.29% Apr-05 5.64% Apr-09 6.48% 3.76% 2.72% Apr-13 4.00% 2.93% 1.07%
May-01 7.99% 5.78% 2.21% May-05 5.53% May-09 6.49% 4.23% 2.26% May-13 4.17% 3.11% 1.06% Jun-01 7.85% 5.67% 2.18% Jun-05 5.40% Jun-09 6.20% 4.52% 1.68% Jun-13 4.53% 3.40% 1.13% Jul-01 7.78% 5.61% 2.17% Jul-05 5.51% Jul-09 5.97% 4.41% 1.56% Jul-13 4.68% 3.61% 1.07%
Aug-01 7.59% 5.48% 2.11% Aug-05 5.50% Aug-09 5.71% 4.37% 1.34% Aug-13 4.73% 3.76% 0.97% Sep-01 7.75% 5.48% 2.27% Sep-05 5.52% Sep-09 5.53% 4.19% 1.34% Sep-13 4.80% 3.79% 1.01% Oct-01 7.63% 5.32% 2.31% Oct-05 5.79% Oct-09 5.55% 4.19% 1.36% Oct-13 4.70% 3.68% 1.02% Nov-01 7.57% 5.12% 2.45% Nov-05 5.88% Nov-09 5.64% 4.31% 1.33% Nov-13 4.77% 3.80% 0.97% Dec-01 7.83% 5.48% 2.35% Dec-05 5.80% Dec-09 5.79% 4.49% 1.30% Dec-13 4.81% 3.89% 0.92%
Jan-02 7.66% 5.45% 2.21% Jan-06 5.75% Jan-10 5.77% 4.60% 1.17% Jan-14 4.63% 3.77% 0.86% Feb-02 7.54% 5.40% 2.14% Feb-06 5.82% 4.54% 1.28% Feb-10 5.87% 4.62% 1.25% Feb-14 4.53% 3.66% 0.87% Mar-02 7.76% Mar-06 5.98% 4.73% 1.25% Mar-10 5.84% 4.64% 1.20% Mar-14 4.51% 3.62% 0.89% Apr-02 7.57% Apr-06 6.29% 5.06% 1.23% Apr-10 5.81% 4.69% 1.12% Apr-14 4.41% 3.52% 0.89%
May-02 7.52% May-06 6.42% 5.20% 1.22% May-10 5.50% 4.29% 1.21% May-14 4.26% 3.39% 0.87% Jun-02 7.42% Jun-06 6.40% 5.15% 1.25% Jun-10 5.46% 4.13% 1.33% Jun-14 4.29% 3.42% 0.87% Jul-02 7.31% Jul-06 6.37% 5.13% 1.24% Jul-10 5.26% 3.99% 1.27% Jul-14 4.23% 3.33% 0.90%
Aug-02 7.17% Aug-06 6.20% 5.00% 1.20% Aug-10 5.01% 3.80% 1.21% Aug-14 4.13% 3.20% 0.93% Sep-02 7.08% Sep-06 6.00% 4.85% 1.15% Sep-10 5.01% 3.77% 1.24% Sep-14 4.24% 3.26% 0.98% Oct-02 7.23% Oct-06 5.98% 4.85% 1.13% Oct-10 5.10% 3.87% 1.23% Oct-14 4.06% 3.04% 1.02% Nov-02 7.14% Nov-06 5.80% 4.69% 1.11% Nov-10 5.37% 4.19% 1.18% Nov-14 4.09% 3.04% 1.05% Dec-02 7.07% Dec-06 5.81% 4.68% 1.13% Dec-10 5.56% 4.42% 1.14% Dec-14 3.95% 2.83% 1.12% Nov-02 7.14% 5.04% 2.10% Nov-07 5.97% 4.56% 1.41% Nov-12 3.84% 2.39% 1.45% Dec-02 7.07% 5.01% 2.06% Dec-07 6.16% 4.57% 1.59% Dec-12 4.00% 2.47% 1.53%
Jan-03 7.07% 5.02% 2.05% Jan-08 6.02% 4.35% 1.67% Jan-13 4.15% 2.68% 1.47% Feb-03 6.93% 4.87% 2.06% Feb-08 6.21% 4.49% 1.72% Feb-13 4.18% 2.78% 1.40% Mar-03 6.79% 4.82% 1.97% Mar-08 6.21% 4.36% 1.85% Apr-03 6.64% 4.91% 1.73% Apr-08 6.29% 4.44% 1.85% May-03 6.36% 4.52% 1.84% May-08 6.28% 4.60% 1.68% Average: Jun-03 6.21% 4.34% 1.87% Jun-08 6.38% 4.74% 1.64% 12-months 1.31% Jul-03 6.57% 4.92% 1.65% Jul-08 6.40% 4.62% 1.78% 6-months 1.36%
Aug-03 6.78% 5.39% 1.39% Aug-08 6.37% 4.53% 1.84% 3-months 1.47% Sep-03 6.56% 5.21% 1.35% Sep-08 6.49% 4.32% 2.17% Oct-03 6.43% 5.21% 1.22% Oct-08 7.56% 4.45% 3.11% Nov-03 6.37% 5.17% 1.20% Nov-08 7.60% 4.27% 3.33% Dec-03 6.27% 5.11% 1.16% Dec-08 6.52% 3.18% 3.34%
Attachment PRM-12Page 3 of 3UPDATED
A-rated A-rated A-rated A-rated A-ratedYear Public Utility Yield Spread Year Public Utility Yield Spread Year Public Utility Yield Spread Year Public Utility Yield Spread Year Public Utility Yield Spread
Jan-99 6.97% 5.16% 1.81% Jan-03 7.07% Jan-07 5.96% 4.85% 1.11% Jan-11 5.57% 4.52% 1.05% Jan-15 3.58% 2.46% 1.12%Feb-99 7.09% 5.37% 1.72% Feb-03 6.93% Feb-07 5.90% 4.82% 1.08% Feb-11 5.68% 4.65% 1.03% Feb-15 3.67% 2.57% 1.10%Mar-99 7.26% 5.58% 1.68% Mar-03 6.79% Mar-07 5.85% 4.72% 1.13% Mar-11 5.56% 4.51% 1.05% Mar-15 3.74% 2.63% 1.11%Apr-99 7.22% 5.55% 1.67% Apr-03 6.64% Apr-07 5.97% 4.87% 1.10% Apr-11 5.55% 4.50% 1.05% Apr-15 3.75% 2.59% 1.16%
May-99 7.47% 5.81% 1.66% May-03 6.36% May-07 5.99% 4.90% 1.09% May-11 5.32% 4.29% 1.03% May-15 4.17% 2.96% 1.21%Jun-99 7.74% 6.04% 1.70% Jun-03 6.21% Jun-07 6.30% 5.20% 1.10% Jun-11 5.26% 4.23% 1.03% Jun-15 4.39% 3.11% 1.28%Jul-99 7.71% 5.98% 1.73% Jul-03 6.57% Jul-07 6.25% 5.11% 1.14% Jul-11 5.27% 4.27% 1.00% Jul-15 4.40% 3.07% 1.33%
Aug-99 7.91% 6.07% 1.84% Aug-03 6.78% Aug-07 6.24% 4.93% 1.31% Aug-11 4.69% 3.65% 1.04% Aug-15 4.25% 2.86% 1.39%Sep-99 7.93% 6.07% 1.86% Sep-03 6.56% Sep-07 6.18% 4.79% 1.39% Sep-11 4.48% 3.18% 1.30% Sep-15 4.39% 2.95% 1.44%Oct-99 8.06% 6.26% 1.80% Oct-03 6.43% Oct-07 6.11% 4.77% 1.34% Oct-11 4.52% 3.13% 1.39% Oct-15 4.29% 2.89% 1.40%Nov-99 7.94% 6.15% 1.79% Nov-03 6.37% Nov-07 5.97% 4.52% 1.45% Nov-11 4.25% 3.02% 1.23% Nov-15 4.40% 3.03% 1.37%Dec-99 8.14% 6.35% 1.79% Dec-03 6.27% Dec-07 6.16% 4.53% 1.63% Dec-11 4.33% 2.98% 1.35% Dec-15 4.35% 2.97% 1.38%
Jan-00 8.35% 6.63% 1.72% Jan-04 6.15% Jan-08 6.02% 4.33% 1.69% Jan-12 4.34% 3.03% 1.31% Jan-16 4.27% 2.86% 1.41%Feb-00 8.25% 6.23% 2.02% Feb-04 6.15% Feb-08 6.21% 4.52% 1.69% Feb-12 4.36% 3.11% 1.25% Feb-16 4.11% 2.62% 1.49%Mar-00 8.28% 6.05% 2.23% Mar-04 5.97% Mar-08 6.21% 4.39% 1.82% Mar-12 4.48% 3.28% 1.20% Mar-16 4.16% 2.68% 1.48%Apr-00 8.29% 5.85% 2.44% Apr-04 6.35% Apr-08 6.29% 4.44% 1.85% Apr-12 4.40% 3.18% 1.22% Apr-16 4.00% 2.62% 1.38%
May-00 8.70% 6.15% 2.55% May-04 6.62% May-08 6.28% 4.60% 1.68% May-12 4.20% 2.93% 1.27% May-16 3.93% 2.63% 1.30%Jun-00 8.36% 5.93% 2.43% Jun-04 6.46% Jun-08 6.38% 4.69% 1.69% Jun-12 4.08% 2.70% 1.38% Jun-16 3.78% 2.45% 1.33%Jul-00 8.25% 5.85% 2.40% Jul-04 6.27% Jul-08 6.40% 4.57% 1.83% Jul-12 3.93% 2.59% 1.34% Jul-16 3.57% 2.23% 1.34%
Aug-00 8.13% 5.72% 2.41% Aug-04 6.14% Aug-08 6.37% 4.50% 1.87% Aug-12 4.00% 2.77% 1.23% Aug-16 3.59% 2.26% 1.33%Sep-00 8.23% 5.83% 2.40% Sep-04 5.98% Sep-08 6.49% 4.27% 2.22% Sep-12 4.02% 2.88% 1.14%Oct-00 8.14% 5.80% 2.34% Oct-04 5.94% Oct-08 7.56% 4.17% 3.39% Oct-12 3.91% 2.90% 1.01%Nov-00 8.11% 5.78% 2.33% Nov-04 5.97% Nov-08 7.60% 4.00% 3.60% Nov-12 3.84% 2.80% 1.04%Dec-00 7.84% 5.49% 2.35% Dec-04 5.92% Dec-08 6.52% 2.87% 3.65% Dec-12 4.00% 2.88% 1.12% Average:
12-months 1.39%Jan-01 7.80% 5.54% 2.26% Jan-05 5.78% Jan-09 6.39% 3.13% 3.26% Jan-13 4.15% 3.08% 1.07% 6-months 1.36%Feb-01 7.74% 5.45% 2.29% Feb-05 5.61% Feb-09 6.30% 3.59% 2.71% Feb-13 4.18% 3.17% 1.01% 3-months 1.33%Mar-01 7.68% 5.34% 2.34% Mar-05 5.83% Mar-09 6.42% 3.64% 2.78% Mar-13 4.20% 3.16% 1.04%Apr-01 7.94% 5.65% 2.29% Apr-05 5.64% Apr-09 6.48% 3.76% 2.72% Apr-13 4.00% 2.93% 1.07%
May-01 7.99% 5.78% 2.21% May-05 5.53% May-09 6.49% 4.23% 2.26% May-13 4.17% 3.11% 1.06%Jun-01 7.85% 5.67% 2.18% Jun-05 5.40% Jun-09 6.20% 4.52% 1.68% Jun-13 4.53% 3.40% 1.13%Jul-01 7.78% 5.61% 2.17% Jul-05 5.51% Jul-09 5.97% 4.41% 1.56% Jul-13 4.68% 3.61% 1.07%
Aug-01 7.59% 5.48% 2.11% Aug-05 5.50% Aug-09 5.71% 4.37% 1.34% Aug-13 4.73% 3.76% 0.97%Sep-01 7.75% 5.48% 2.27% Sep-05 5.52% Sep-09 5.53% 4.19% 1.34% Sep-13 4.80% 3.79% 1.01%Oct-01 7.63% 5.32% 2.31% Oct-05 5.79% Oct-09 5.55% 4.19% 1.36% Oct-13 4.70% 3.68% 1.02%Nov-01 7.57% 5.12% 2.45% Nov-05 5.88% Nov-09 5.64% 4.31% 1.33% Nov-13 4.77% 3.80% 0.97%Dec-01 7.83% 5.48% 2.35% Dec-05 5.80% Dec-09 5.79% 4.49% 1.30% Dec-13 4.81% 3.89% 0.92%
Jan-02 7.66% 5.45% 2.21% Jan-06 5.75% Jan-10 5.77% 4.60% 1.17% Jan-14 4.63% 3.77% 0.86%Feb-02 7.54% 5.40% 2.14% Feb-06 5.82% 4.54% 1.28% Feb-10 5.87% 4.62% 1.25% Feb-14 4.53% 3.66% 0.87%Mar-02 7.76% Mar-06 5.98% 4.73% 1.25% Mar-10 5.84% 4.64% 1.20% Mar-14 4.51% 3.62% 0.89%Apr-02 7.57% Apr-06 6.29% 5.06% 1.23% Apr-10 5.81% 4.69% 1.12% Apr-14 4.41% 3.52% 0.89%
May-02 7.52% May-06 6.42% 5.20% 1.22% May-10 5.50% 4.29% 1.21% May-14 4.26% 3.39% 0.87%Jun-02 7.42% Jun-06 6.40% 5.15% 1.25% Jun-10 5.46% 4.13% 1.33% Jun-14 4.29% 3.42% 0.87%Jul-02 7.31% Jul-06 6.37% 5.13% 1.24% Jul-10 5.26% 3.99% 1.27% Jul-14 4.23% 3.33% 0.90%
Aug-02 7.17% Aug-06 6.20% 5.00% 1.20% Aug-10 5.01% 3.80% 1.21% Aug-14 4.13% 3.20% 0.93%Sep-02 7.08% Sep-06 6.00% 4.85% 1.15% Sep-10 5.01% 3.77% 1.24% Sep-14 4.24% 3.26% 0.98%Oct-02 7.23% Oct-06 5.98% 4.85% 1.13% Oct-10 5.10% 3.87% 1.23% Oct-14 4.06% 3.04% 1.02%Nov-02 7.14% Nov-06 5.80% 4.69% 1.11% Nov-10 5.37% 4.19% 1.18% Nov-14 4.09% 3.04% 1.05%Dec-02 7.07% Dec-06 5.81% 4.68% 1.13% Dec-10 5.56% 4.42% 1.14% Dec-14 3.95% 2.83% 1.12%Nov-02 7.14% 5.04% 2.10% Nov-07 5.97% 4.56% 1.41% Nov-12 3.84% 2.39% 1.45%Dec-02 7.07% 5.01% 2.06% Dec-07 6.16% 4.57% 1.59% Dec-12 4.00% 2.47% 1.53%
Jan-03 7.07% 5.02% 2.05% Jan-08 6.02% 4.35% 1.67% Jan-13 4.15% 2.68% 1.47%Feb-03 6.93% 4.87% 2.06% Feb-08 6.21% 4.49% 1.72% Feb-13 4.18% 2.78% 1.40%Mar-03 6.79% 4.82% 1.97% Mar-08 6.21% 4.36% 1.85%Apr-03 6.64% 4.91% 1.73% Apr-08 6.29% 4.44% 1.85%May-03 6.36% 4.52% 1.84% May-08 6.28% 4.60% 1.68% Average:Jun-03 6.21% 4.34% 1.87% Jun-08 6.38% 4.74% 1.64% 12-months 1.31%Jul-03 6.57% 4.92% 1.65% Jul-08 6.40% 4.62% 1.78% 6-months 1.36%Aug-03 6.78% 5.39% 1.39% Aug-08 6.37% 4.53% 1.84% 3-months 1.47%Sep-03 6.56% 5.21% 1.35% Sep-08 6.49% 4.32% 2.17%Oct-03 6.43% 5.21% 1.22% Oct-08 7.56% 4.45% 3.11%Nov-03 6.37% 5.17% 1.20% Nov-08 7.60% 4.27% 3.33%Dec-03 6.27% 5.11% 1.16% Dec-08 6.52% 3.18% 3.34%
30-Year Treasuries 30-Year Treasuries 30-Year Treasuries
A rated Public Utility Bonds over 30-Year Treasuries
30-Year Treasuries 30-Year Treasuries

Attachment PRM-13 Page 1 of 2 UPDATED
Common Equity Risk Premiums
Long-
Years 1926-2015
Long- Term Large Term Equity Govt.
Common Corp. Risk Bonds Stocks Bonds Premium Yields
Low Interest Rates 11.97% 4.85% 7.12% 2.97%
Average Across All Interest Rates 11.95% 6.30% 5.65% 5.09%
High Interest Rates 11.93% 7.75% 4.18% 7.22%
Source of Information: 2016 SBBI Yearbook Stocks, Bonds, Bills, and Inflation
Attachment PRM-13Page 1 of 2UPDATED
Common Equity Risk PremiumsYears 1926-2015
Large Common Stocks
Long-Term Corp. Bonds
Equity Risk
Premium
Long-Term Govt.
Bonds Yields
Low Interest Rates 11.97% 4.85% 7.12% 2.97%
Average Across All Interest Rates 11.95% 6.30% 5.65% 5.09%
High Interest Rates 11.93% 7.75% 4.18% 7.22%
Source of Information: 2016 SBBI Yearbook Stocks, Bonds, Bills, and Inflation

Attachment PRM-13 Page 2 of 2 UPDATED
Basic Series Annual Total Returns (except yields)
Year
Large Common Stocks
Long- Term Corp.
Bonds
Long-Term Govt.
Bonds Yields
1940 -9.78% 3.39% 1.94% 1945 36.44% 4.08% 1.99% 1941 -11.59% 2.73% 2.04% 1949 18.79% 3.31% 2.09% 1946 -8.07% 1.72% 2.12% 1950 31.71% 2.12% 2.24% 1939 -0.41% 3.97% 2.26% 1948 5.50% 4.14% 2.37% 1947 5.71% -2.34% 2.43% 1942 20.34% 2.60% 2.46% 1944 19.75% 4.73% 2.46% 2012 16.00% 10.68% 2.46% 2014 13.69% 17.28% 2.46% 1943 25.90% 2.83% 2.48% 1938 31.12% 6.13% 2.52% 1936 33.92% 6.74% 2.55% 2011 2.11% 17.95% 2.55% 2015 1.38% -1.02% 2.68% 1951 24.02% -2.69% 2.69% 1954 52.62% 5.39% 2.72% 1937 -35.03% 2.75% 2.73% 1953 -0.99% 3.41% 2.74% 1935 47.67% 9.61% 2.76% 1952 18.37% 3.52% 2.79% 1934 -1.44% 13.84% 2.93% 1955 31.56% 0.48% 2.95% 2008 -37.00% 8.78% 3.03% 1932 -8.19% 10.82% 3.15% 1927 37.49% 7.44% 3.17% 1957 -10.78% 8.71% 3.23% 1930 -24.90% 7.98% 3.30% 1933 53.99% 10.38% 3.36% 1928 43.61% 2.84% 3.40% 1929 -8.42% 3.27% 3.40% 1956 6.56% -6.81% 3.45% 1926 11.62% 7.37% 3.54% 2013 32.39% -7.07% 3.78% 1960 0.47% 9.07% 3.80% 1958 43.36% -2.22% 3.82% 1962 -8.73% 7.95% 3.95% 1931 -43.34% -1.85% 4.07% 2010 15.06% 12.44% 4.14% 1961 26.89% 4.82% 4.15% 1963 22.80% 2.19% 4.17% 1964 16.48% 4.77% 4.23%
1959 11.96% -0.97% 4.47% 1965 12.45% -0.46% 4.50% 2007 5.49% 2.60% 4.50% 1966 -10.06% 0.20% 4.55% 2009 26.46% 3.02% 4.58% 2005 4.91% 5.87% 4.61% 2002 -22.10% 16.33% 4.84% 2004 10.88% 8.72% 4.84% 2006 15.79% 3.24% 4.91% 2003 28.68% 5.27% 5.11% 1998 28.58% 10.76% 5.42% 1967 23.98% -4.95% 5.56% 2000 -9.10% 12.87% 5.58% 2001 -11.89% 10.65% 5.75% 1971 14.30% 11.01% 5.97% 1968 11.06% 2.57% 5.98% 1972 18.99% 7.26% 5.99% 1997 33.36% 12.95% 6.02% 1995 37.58% 27.20% 6.03% 1970 3.86% 18.37% 6.48% 1993 10.08% 13.19% 6.54% 1996 22.96% 1.40% 6.73% 1999 21.04% -7A5% 6.82% 1969 -8.50% -8.09% 6.87% 1976 23.93% 18.65% 7.21% 1973 -14.69% 1.14% 7.26% 1992 7.62% 9.39% 726% 1991 30.47% 19.89% 7.30% 1974 -26.47% -3.06% 7.60% 1986 18.67% 19.85% 7.89% 1994 1.32% -5.76% 7.99% 1977 -7.16% 1.71% 8.03% 1975 37.23% 14.64% 8.05% 1989 31.69% 16.23% 8.16% 1990 -3.10% 6.78% 8.44% 1978 6.57% -0.07% 8.98% 1988 16.61% 10.70% 9.19% 1987 5.25% -0.27% 9.20% 1985 31.73% 30.09% 9.56% 1979 18.61% -4.18% 10.12% 1982 21.55% 42.56% 10.95% 1984 6.27% 16.86% 11.70% 1983 22.56% 6.26% 11.97% 1980 32.50% -2.76% 11.99%
Attachment PRM-13 Page 2 of 2 UPDATED
Basic Series Annual Total Returns (except yields)
Year
Large Common Stocks
Long- Term Corp. Bonds
Long-Term Govt.
Bonds Yields
1940 -9.78% 3.39% 1.94%
1945 36.44% 4.08% 1.99%
1941 -11.59% 2.73% 2.04%
1949 18.79% 3.31% 2.09%
1946 -8.07% 1.72% 2.12%
1950 31.71% 2.12% 224%
1939 -0.41% 3.97% 2.26%
1948 5.50% 4.14% 2.37%
1947 5.71% -2.34% 2,43%
1942 20.34% 2.60% 2.46%
1944 19.75% 4.73% 2.46%
2012 16.00% 10.68% 2.46%
2014 13.69% 17.28% 2.46%
1943 25.90% 2.83% 2.48%
1938 31.12% 6.13% 2.52%
1936 33.92% 6.74% 2.55%
2011 2.11% 17.95% 2.55%
2015 1.38% -1.02% 2.68%
1951 24.02% -2.69% 2.69%
1954 52.62% 5.39% 2.72%
1937 -35.03% 2.75% 2.73%
1953 -0.99% 3.41% 2.74%
1935 47,67% 9.61% 2.76%
1952 18.37% 3.52% 2.79%
1934 -1.44% 13.84% 2.93%
1955 31.56% 0.48% 2.95%
2008 -37.00% 8.78% 3.03%
1932 -8.19% 10.82% 315%
1927 37.49% 7.44% 3.17%
1957 -10.78% 8.71% 3.23%
1930 -24.90% 7.98% 3.30%
1933 53.99% 10.38% 3.36%
1928 43.61% 2.84% 3.40%
1929 -8.42% 327% 3.40%
1956 6.56% -6.81% 3.45%
1926 11.62% 7.37% 3.54%
2013 32.39% -7.07% 3.78%
1960 0.47% 9.07% 3.80%
1958 43.36% -222% 3.82%
1962 -8.73% 7.95% 3.95%
1931 -43.34% -1.85% 4.07%
2010 15.06% 12.44% 4.14%
1961 26.89% 4.82% 4.15%
1963 22.80% 2.19% 4.17%
1964 16.48% 4.77% 4.23%
1959 11.96% -0.97% 4.47%
1965 12.45% -0.46% 4.50%
2007 5.49% 2.60% 4.50%
1966 -10.06% 0.20% 4.55%
2009 26.46% 3.02% 4.58%
2005 4.91% 5.87% 4.61%
2002 -22.10% 16.33% 4.84%
2004 10.88% 8.72% 4.84%
2006 15.79% 3.24% 4.91%
2003 28.68% 527% 5.11%
1998 28.58% 10.76% 5.42%
1987 23.98% -4.95% 5.56%
2000 -9.10% 12.87% 5.58%
2001 -11.89% 10.65% 5.75%
1971 14.30% 11.01% 5.97%
1968 11.06% 2.57% 5.98%
1972 18.99% 7.26% 5.99%
1997 33.36% 12.95% 6.02%
1995 37.58% 27.20% 6.03%
1970 3.86% 18.37% 6.48%
1993 10.08% 13.19% 6.54%
1996 22.96% 1.40% 6.73%
1999 21.04% -7.45% 6.82%
1969 -8.50% -8.09% 6.87%
1976 23.93% 18.65% 721%
1973 -14.69% 1.14% 7.26%
1992 7.62% 9.39% 7.26%
1991 30.47% 19.89% 7.30%
1974 -26.47% -3.06% 7.60%
1986 18.67% 19.85% 7.89%
1994 1.32% -5.76% 7.99%
1977 -7.16% 1.71% 8.03%
1975 37.23% 14.64% 8.05%
1989 31.69% 1623% 8.16%
1990 -3.10% 6.78% 8.44%
1978 6.57% -0.07% 8.98%
1988 16.61% 10.70% 9.19%
1987 5.25% -027% 920%
1985 31.73% 30.09% 9.56%
1979 18.61% -4.18% 10.12%
1982 21.55% 42.56% 10.95%
1984 6.27% 16.86% 11.70%
1983 22.56% 626% 11.97%
1980 32.50% -2.76% 11.99%
Attachment PRM-13 Page 2 of 2 UPDATED
Basic Series Annual Total Returns (except yields)
Year
1940
Large Common Stocks
-9.78%
Long- Term Corp.
Bonds
3.39%
Long- Term Govt
Bonds Yields
1.94% 1.99% 1945 36.44% 4.08%
1941 -11.59% 2.73% 2.04% 2.09% 1949 18.79% 3.31%
1946 -8.07% 1.72% 2.12% 1950 31.71% 2.12% 2.24%
2.26% 1939 -0.41% 3.97% 1948 5.50% 4.14% 2.37% 1947 5.71% -2.34% 2.43% 1942 20.34% 2.60% 2.46% 1944 19.75% 4.73% 2.46% 2012 16.00% 10.68% 2.46% 2014 13.69% 17.28% 2.46% 1943 25.90% 2.83% 2.48% 1938 31.12% 6.13% 2.52%
2.55% 1936 33.92% 6.74% 2.55% 2011 2.11% 17.95% 2.68% 2015 1.38% -1.02% 2.69% 1951 24.02% -2.69%
1954 52.62% 6.39% 2.72% 1937 -35.03% 2.75% 2.73% 1953 -0.99% 3.41% 2.74% 1935 47.67% 9.61% 2.76% 1952 18.37% 3.52% 2.79%
2.93% 1934 -1.44% 13.84% 2.95% 1955 31.56% 0.48% 3.03% 2008 -37.00% 8.78%
1932 -8.19% 10.82% 3.15% 1927 37.49% 7.44% 3.17%
3.23% 1957 -10.78% 8.71% 3.30% 1930 -24.90% 7.98% 3.36% 1933 53.99% 10.38%
1928 43.61% 2.84% 3.40% 3.40% 1929 -8.42% 3.27% 3.45% 1956 6.56% -6.81%
1926 11.62% 7.37% 3.54% 2013 32.39% -7.07% 3.78%
3.80% 1960 0.47% 9.07% 1958 43.36% -2.22% 3.82%
3.95% 1962 -8.73% 7.95% 1931 -43.34% -1.85% 4.07% 2010 15.06% 12.44% 4.14% 1961 26.89% 4.82% 4.15% 1963 22.80% 2.19% 4.17%
4.23% 1964 16.48% 4.77%
1959 11.96% -0.97% 4.47% 4.50% 1965 12.45% -0.46%
2007 5.49% 2.60% 4.50% 4.55% 1966 -10.06% 0.20% 4.58% 2009 26.46% 3.02%
2005 4.91% 5.87% 4.61% 2002 -22.10% 16.33% 4.84% 2004 10.88% 8.72% 4.84% 2006 15.79% 3.24% 4.91% 2003 28.68% 527% 5.11% 1998 28.58% 10.76% 5.42%
5.56% 1967 23.98% -4.95% 5.58% 2000 -9.10% 12.87%
2001 -11.89% 10.65% 5.75% 1971 14.30% 11.01% 5.97%
5.98% 1968 11.06% 2.57% 5.99% 1972 18.99% 726%
1997 33.36% 12.95% 6.02% 6.03% 1995 37.58% 2720%
1970 3.86% 18.37% 6.48% 1993 10.08% 13.19% 6.54% 1996 22.96% 1.40% 6.73%
6.82% 1999 21.04% -745% 1969 -8.50% -8.09% 6.87% 1976 23.93% 18.65% 7.21%
7.26% 1973 -14.69% 1.14% 7.26% 1992 7.62% 9.39% 7.30% 1991 30.47% 19.89% 7.60% 1974 -26.47% -3.06% 7.89% 1986 18.67% 19.85% 7.99% 1994 1.32% -5.76% 8.03% 1977 -7.16% 1.71% 8.05% 1975 37.23% 14.64%
1989 31.69% 1623% 8.16% 1990 -3.10% 6.78% 8.44%
8.98% 1978 6.57% -0.07% 1988 16.61% 10.70% 9.19% 1987 5.25% -0.27% 9.20%
9.56% 1985 31.73% 30.09% 1979 18.61% -4.18% 10.12%
10.95% 1982 21.55% 42.56% 1984 6.27% 16.86% 11.70% 1983 22.56% 626% 11.97%
11.99% 1980 32.50% -2.76%
Attachment PRM-13Page 2 of 2UPDATED
Basic Series Annual Total Returns (except yields)
Year
Large Common Stocks
Long-Term Corp. Bonds
Long-Term Govt. Bonds Yields
1940 -9.78% 3.39% 1.94%1945 36.44% 4.08% 1.99%1941 -11.59% 2.73% 2.04%1949 18.79% 3.31% 2.09%1946 -8.07% 1.72% 2.12%1950 31.71% 2.12% 2.24%1939 -0.41% 3.97% 2.26%1948 5.50% 4.14% 2.37%1947 5.71% -2.34% 2.43%1942 20.34% 2.60% 2.46%1944 19.75% 4.73% 2.46%2012 16.00% 10.68% 2.46%2014 13.69% 17.28% 2.46%1943 25.90% 2.83% 2.48%1938 31.12% 6.13% 2.52%1936 33.92% 6.74% 2.55%2011 2.11% 17.95% 2.55%2015 1.38% -1.02% 2.68%1951 24.02% -2.69% 2.69%1954 52.62% 5.39% 2.72%1937 -35.03% 2.75% 2.73%1953 -0.99% 3.41% 2.74%1935 47.67% 9.61% 2.76%1952 18.37% 3.52% 2.79%1934 -1.44% 13.84% 2.93%1955 31.56% 0.48% 2.95%2008 -37.00% 8.78% 3.03%1932 -8.19% 10.82% 3.15%1927 37.49% 7.44% 3.17%1957 -10.78% 8.71% 3.23%1930 -24.90% 7.98% 3.30%1933 53.99% 10.38% 3.36%1928 43.61% 2.84% 3.40%1929 -8.42% 3.27% 3.40%1956 6.56% -6.81% 3.45%1926 11.62% 7.37% 3.54%2013 32.39% -7.07% 3.78%1960 0.47% 9.07% 3.80%1958 43.36% -2.22% 3.82%1962 -8.73% 7.95% 3.95%1931 -43.34% -1.85% 4.07%2010 15.06% 12.44% 4.14%1961 26.89% 4.82% 4.15%1963 22.80% 2.19% 4.17%1964 16.48% 4.77% 4.23%
1959 11.96% -0.97% 4.47%1965 12.45% -0.46% 4.50%2007 5.49% 2.60% 4.50%1966 -10.06% 0.20% 4.55%2009 26.46% 3.02% 4.58%2005 4.91% 5.87% 4.61%2002 -22.10% 16.33% 4.84%2004 10.88% 8.72% 4.84%2006 15.79% 3.24% 4.91%2003 28.68% 5.27% 5.11%1998 28.58% 10.76% 5.42%1967 23.98% -4.95% 5.56%2000 -9.10% 12.87% 5.58%2001 -11.89% 10.65% 5.75%1971 14.30% 11.01% 5.97%1968 11.06% 2.57% 5.98%1972 18.99% 7.26% 5.99%1997 33.36% 12.95% 6.02%1995 37.58% 27.20% 6.03%1970 3.86% 18.37% 6.48%1993 10.08% 13.19% 6.54%1996 22.96% 1.40% 6.73%1999 21.04% -7.45% 6.82%1969 -8.50% -8.09% 6.87%1976 23.93% 18.65% 7.21%1973 -14.69% 1.14% 7.26%1992 7.62% 9.39% 7.26%1991 30.47% 19.89% 7.30%1974 -26.47% -3.06% 7.60%1986 18.67% 19.85% 7.89%1994 1.32% -5.76% 7.99%1977 -7.16% 1.71% 8.03%1975 37.23% 14.64% 8.05%1989 31.69% 16.23% 8.16%1990 -3.10% 6.78% 8.44%1978 6.57% -0.07% 8.98%1988 16.61% 10.70% 9.19%1987 5.25% -0.27% 9.20%1985 31.73% 30.09% 9.56%1979 18.61% -4.18% 10.12%1982 21.55% 42.56% 10.95%1984 6.27% 16.86% 11.70%1983 22.56% 6.26% 11.97%1980 32.50% -2.76% 11.99%

Attachment PRM-14 Page 1 of 3 UPDATED
Yields for Treasury Constant Maturities Yearly for 2011-2015
and the Twelve Months Ended August 2016
Years 1-Year 2-Year 3-Year 5-Year 7-Year 10-Year 20-Year 30-Year
2011 0.18% 0.45% 0.75% 1.52% 2.16% 2.78% 3.62% 3.91% 2012 0.17% 0.28% 0.38% 0.76% 1.22% 1.80% 2.54% 2.92% 2013 0.13% 0.31% 0.54% 1.17% 1.74% 2.35% 3.12% 3.45% 2014 0.12% 0.46% 0.90% 1.64% 2.14% 2.54% 3.07% 3.34% 2015 0.32% 0.69% 1.03% 1.53% 1.89% 2.14% 2.55% 2.84%
Five-Year Average 0.18% 0.44% 0.72% 1.32% 1.83% 2.32% 2.98% 3.29%
Months
Sep-15 0.37% 0.71% 1.01% 1.49% 1.88% 2.17% 2.62% 2.95% Oct-15 0.26% 0.64% 0.93% 1.39% 1.76% 2.07% 2.50% 2.89% Nov-15 0.48% 0.88% 1.20% 1.67% 2.02% 2.26% 2.69% 3.03% Dec-15 0.65% 0.98% 1.28% 1.70% 2.04% 2.24% 2.61% 2.97% Jan-16 0.54% 0.90% 1.14% 1.52% 1.85% 2.09% 2.49% 2.86% Feb-16 0.53% 0.73% 0.90% 1.22% 1.53% 1.78% 2.20% 2.62% Mar-16 0.66% 0.88% 1.04% 1.38% 1.68% 1.89% 2.28% 2.68% Apr-16 0.56% 0.77% 0.92% 1.26% 1.57% 1.81% 2.21% 2.62%
May-16 0.59% 0.82% 0.97% 1.30% 1.60% 1.81% 2.22% 2.63% Jun-16 0.55% 0.73% 0.86% 1.17% 1.44% 1.64% 2.02% 2.45% Jul-16 0.51% 0.67% 0.79% 1.07% 1.33% 1.50% 1.82% 2.23%
Aug-16 0.57% 0.74% 0.85% 1.13% 1.40% 1.56% 1.89% 2.26%
Twelve-Month Average 0.52% 0.79% 0.99% 1.36% 1.68% 1.90% 2.30% 2.68%
Six-Month Average 0.57% 0.77% 0.91% 1.22% 1.50% 1.70% 2.07% 2.48%
Three-Month Average 0.54% 0.71% 0.83% 1.12% 1.39% 1.57% 1.91% 2.31%
Source: Federal Reserve statistical release H.15
Attachment PRM-14Page 1 of 3UPDATED
Years 1-Year 2-Year 3-Year 5-Year 7-Year 10-Year 20-Year 30-Year
2011 0.18% 0.45% 0.75% 1.52% 2.16% 2.78% 3.62% 3.91%2012 0.17% 0.28% 0.38% 0.76% 1.22% 1.80% 2.54% 2.92%2013 0.13% 0.31% 0.54% 1.17% 1.74% 2.35% 3.12% 3.45%2014 0.12% 0.46% 0.90% 1.64% 2.14% 2.54% 3.07% 3.34%2015 0.32% 0.69% 1.03% 1.53% 1.89% 2.14% 2.55% 2.84%
Five-YearAverage 0.18% 0.44% 0.72% 1.32% 1.83% 2.32% 2.98% 3.29%
Months
Sep-15 0.37% 0.71% 1.01% 1.49% 1.88% 2.17% 2.62% 2.95%Oct-15 0.26% 0.64% 0.93% 1.39% 1.76% 2.07% 2.50% 2.89%Nov-15 0.48% 0.88% 1.20% 1.67% 2.02% 2.26% 2.69% 3.03%Dec-15 0.65% 0.98% 1.28% 1.70% 2.04% 2.24% 2.61% 2.97%Jan-16 0.54% 0.90% 1.14% 1.52% 1.85% 2.09% 2.49% 2.86%Feb-16 0.53% 0.73% 0.90% 1.22% 1.53% 1.78% 2.20% 2.62%Mar-16 0.66% 0.88% 1.04% 1.38% 1.68% 1.89% 2.28% 2.68%Apr-16 0.56% 0.77% 0.92% 1.26% 1.57% 1.81% 2.21% 2.62%
May-16 0.59% 0.82% 0.97% 1.30% 1.60% 1.81% 2.22% 2.63%Jun-16 0.55% 0.73% 0.86% 1.17% 1.44% 1.64% 2.02% 2.45%Jul-16 0.51% 0.67% 0.79% 1.07% 1.33% 1.50% 1.82% 2.23%
Aug-16 0.57% 0.74% 0.85% 1.13% 1.40% 1.56% 1.89% 2.26%
Twelve-Month Average 0.52% 0.79% 0.99% 1.36% 1.68% 1.90% 2.30% 2.68%
Six-MonthAverage 0.57% 0.77% 0.91% 1.22% 1.50% 1.70% 2.07% 2.48%
Three-MonthAverage 0.54% 0.71% 0.83% 1.12% 1.39% 1.57% 1.91% 2.31%
Yields for Treasury Constant MaturitiesYearly for 2011-2015
and the Twelve Months Ended August 2016
Source: Federal Reserve statistical release H.15

Attachment PRM-14 Page 2 of 3 UPDATED
Measures of the Risk-Free Rate & Corporate Bond Yields The forecast of Treasury and Corporate yields
per the consensus of nearly 50 economists reported in the Blue Chip Financial Forecasts dated September 1, 2016
Year Quarter
Treasury Corporate 1-Year
Bill 2-Year Note
5-Year Note
10-Year Note
30-Year Bond
Aaa Bond
Baa Bond
2016 Third 0.6% 0.7% 1.1% 1.5% 2.3% 3.3% 4.4% 2016 Fourth 0.7% 0.9% 1.3% 1.7% 2.5% 3.6% 4.6% 2017 First 0.9% 1.1% 1.5% 1.9% 2.6% 3.8% 4.8% 2017 Second 1.1% 1.2% 1.6% 2.1% 2.8% 3.9% 4.9% 2017 Third 1.2% 1.4% 1.8% 2.2% 2.9% 4.1% 5.0% 2017 Fourth 1.4% 1.6% 2.0% 2.4% 3.1% 4.2% 5.2%
Measures of the Market Premium
Value Line Return Median Median
Dividend Appreciation Total As of: Yield Potential Return 26-Aug-16 2.2% + 8.78% = 10.98%
DCF Result for the S&P 500 Composite D/P ( 1+.5g ) + g = k
2.08% ( 1.0420 ) + 8.40% = 10.57%
where: Price (P) at 31-Aug-16 = 2170.95 Dividend (D) for 2nd Qtr. '16 = 11.28 Dividend (D) annualized = 45.12 Growth (g) by Morningstar = 8.40%
Summary Value Line 10.98% S&P 500 10.57%
Average 10.78% Risk-free Rate of Return (Rf) 3.25%
Forecast Market Premium 7.53%
Historical Market Premium (Rm) (Rf) 1926-2015 Arith. mean 11.96% 4.03% 7.93%
Average - Forecast/Historical 7.73%
Attachment PRM-14Page 2 of 3UPDATED
1-Year 2-Year 5-Year 10-Year 30-Year Aaa BaaYear Quarter Bill Note Note Note Bond Bond Bond
2016 Third 0.6% 0.7% 1.1% 1.5% 2.3% 3.3% 4.4%2016 Fourth 0.7% 0.9% 1.3% 1.7% 2.5% 3.6% 4.6%2017 First 0.9% 1.1% 1.5% 1.9% 2.6% 3.8% 4.8%2017 Second 1.1% 1.2% 1.6% 2.1% 2.8% 3.9% 4.9%2017 Third 1.2% 1.4% 1.8% 2.2% 2.9% 4.1% 5.0%2017 Fourth 1.4% 1.6% 2.0% 2.4% 3.1% 4.2% 5.2%
Median Median Dividend Appreciation Total
As of: Yield Potential Return2.2% + 8.78% = 10.98%
D/P ( 1+.5g ) + g = k2.08% ( 1.0420 ) + 8.40% = 10.57%
where: Price (P) at = 2170.95Dividend (D) for = 11.28Dividend (D) = 45.12Growth (g) by = 8.40%
Value Line 10.98%S&P 500 10.57%
Average 10.78%Risk-free Rate of Return (Rf) 3.25%
Forecast Market Premium 7.53%
Historical Market Premium (Rm) (Rf)1926-2015 Arith. mean 11.96% 4.03% 7.93%
Average - Forecast/Historical 7.73%
annualizedMorningstar
Summary
Measures of the Market Premium
Value Line Return
DCF Result for the S&P 500 Composite
31-Aug-162nd Qtr. '16
26-Aug-16
Measures of the Risk-Free Rate & Corporate Bond YieldsThe forecast of Treasury and Corporate yields
per the consensus of nearly 50 economists reported in the Blue Chip Financial Forecasts dated September 1, 2016
CorporateTreasury

Attachment PRM-15 Page 1 of 3 UPDATED
Comparable Earnings Approach Using Non-Utility Companies with
Timeliness of 1, 2 & 3; Safety Rank of 1, 2 & 3; Financial Strength of B++, A & A+; Price Stability of 85 to 100; Betas of .60 to .80; and Technical Rank of 1& 2
Company Industry Timeliness
Rank Safety Rank
Financial Strength
Price Stability Beta
Technical Rank
Campbell Soup Co Food Processing 2 2 B++ 95 0.65 2 Clorox Co Household Products 2 2 B++ 100 0.65 2 Costco Wholesale Corporation Retail Store 3 1 A+ 100 0.75 1 Dr Pepper Snapple Group Inc Beverage 3 2 A 100 0.70 2 General Mills Inc Food Processing 3 1 A+ 100 0.70 2 Hershey Company Food Processing 3 2 B++ 95 0.70 1 Kellogg Company Food Processing 2 1 A 100 0.65 1 McCormick and Co Food Processing 1 1 A+ 100 0.75 2 O Reilly Automotive Inc Retail Automotive 3 2 A 85 0.75 2 Progressive Corporation Insurance (Prop/Cas.) 3 2 B++ 95 0.80 1 Sysco Corp Retail/Wholesale Food 2 1 A+ 100 0.75 2 Waste Connections Environmental 3 2 B++ 90 0.75 2 Waste Management Environmental 2 1 A 100 0.75 2
Average 2 2 A 97 0.72 2
Gas Group Average 2 2 A 91 0.73 1
Source of Information: Value Line Investment Survey for Windows, September 2016
Attachment PRM-14
Page 3 of 3
Exhibit 7.8: Size-Decile Portfolios of the NYSE/NYSE MKT/NASDAQ Long-Term Returns in Excess
of CAPM
1926-2015
Return in Return in Excess of
Excess of Risk-free Rate Arithmetic Risk-free Rate (as predicted Size
Size Grouping OLS Beta Mean (actual) by CAPM) Premium Mid-Cap (3-5) 1.12 13.80% 8.75% 7.75% 1.00% Low-Cap (6-8) 1.22 15.19% 10.14% 8.44% 1.70% Micro-Cap (9-10) 1.35 17.93% 12.88% 9.31% 3.58%
Breakdown of Deciles 1-10 1-Largest 0.92 11.05% 6.00% 6.36% -0.36% 2 1.04 12.78% 7.73% 7.16% 0.57%
3 1.10 13.53% 8.49% 7.63% 0.86% 4 1.12 13.80% 8.75% 7.76% 0.99%
5 1.17 14.59% 9.54% 8.05% 1.49%
6 1.17 14.77% 9.72% 8.09% 1.63%
7 1.25 15.29% 10.25% 8.62% 1.62%
8 1.30 16.08% 11.03% 8.99% 2.04%
9 1.34 16.81% 11.77% 9.23% 2.54%
10-Smallest 1.39 20.26% 15.21% 9.61% 5.60%
Betas are estimated from monthly returns in excess of the 30-day U.S. Treasury bill total return, January 1926-December 2015. Historical riskless rate
measured by the 90-year arithmetic mean income return component of 20-year government bonds (5.05%). Calculated in the context of the CAPM by
multiplying the equity risk premium by beta. The equity risk premium is estimated by the arithmetic mean total return of the S&P 500 (11.95%) minus the
arithmetic mean income return component of 20-year government bonds (5.05%) from 1926-2015. Source: Morningstar Direct and CRSP. Calculated based
on data from CRSP US Stock Database and CRSP US Indices Database ©2016 Center for Research. Used with permission. All calculations performed by
Duff & Phelps LLC.
7-16 Chapter 7: Company Size and Return
Attachment PRM-14
Page 3 of 3

Attachment PRM-15 Page 2 of 3 UPDATED
Comparable Earnings Approach Five -Year Average Historical Earned Returns
for Years 2011-2015 and Projected 3-5 Year Returns
Projected Company 2011 2012 2013 2014 2015 Average 2019-21
Campbell Soup Co 77.8% 87.2% 64.6% 49.5% 60.2% 67.9% 29.0% Clorox Co - - NMF NMF NMF - NMF Costco Wholesale Corporation 12.2% 14.1% 18.2% 16.7% 22.0% 16.6% 21.5% Dr Pepper Snapple Group Inc 26.8% 26.9% 26.5% 30.6% 35.0% 29.2% 31.5% General Mills Inc 26.0% 26.6% 26.8% 27.9% 35.3% 28.5% 33.0% Hershey Company 76.4% 71.4% 52.6% 61.6% 91.2% 70.6% 43.5% Kellogg Company 69.9% 53.6% 38.9% 50.1% 59.1% 54.3% 38.0% McCormick and Co 23.1% 24.0% 21.5% 24.4% 26.9% 24.0% 23.0% 0 Reilly Automotive Inc 18.4% 27.8% 34.1% 38.6% 47.5% 33.3% 31.0% Progressive Corporation 16.5% 11.7% 14.8% 16.5% 15.2% 14.9% 18.0% Sysco Corp 24.5% 23.9% 19.1% 17.7% 20.9% 21.2% 55.5% Waste Connections 12.1% 9.3% 10.0% 10.6% 11.4% 10.7% 10.0% Waste Management 16.6% 15.2% 17.7% 19.7% 21.6% 18.2% 28.0%
Average 32.5% 30.2% Median 26.3% 30.0% Average (excluding companies with values >20%) 15.1% 14.0%
Attachment PRM-15 Page 1 of 3 UPDATED
Comparable Earnings Approach Using Non-Utility Companies with
Timeliness of 1, 2 & 3; Safety Rank of 1, 2 & 3; Financial Strength of B++, A & A+; Price Stability of 85 to 100; Betas of .60 to .80; and Technical Rank of 1& 2
Company Industry Timeliness
Rank Safety Rank
Financial Strength
Price Stability Beta
Technical Rank
Campbell Soup Co Food Processing 2 2 B++ 95 0.65 2 Clorox Co Household Products 2 2 B++ 100 0.65 2 Costco Wholesale Corporation Retail Store 3 1 A+ 100 0.75 1 Dr Pepper Snapple Group Inc Beverage 3 2 A 100 0.70 2 General Mills Inc Food Processing 3 1 A+ 100 0.70 2 Hershey Company Food Processing 3 2 B++ 95 0.70 1 Kellogg Company Food Processing 2 1 A 100 0.65 1 McCormick and Co Food Processing 1 1 A+ 100 0.75 2 O Reilly Automotive Inc Retail Automotive 3 2 A 85 0.75 2 Progressive Corporation Insurance (Prop/Cas.) 3 2 B++ 95 0.80 1 Sysco Corp Retail/Wholesale Food 2 1 A+ 100 0.75 2 Waste Connections Environmental 3 2 B++ 90 0.75 2 Waste Management Environmental 2 1 A 100 0.75 2
Average 2 2 A 97 0.72 2
Gas Group Average 2 2 A 91 0.73 1
Source of Information: Value Line Investment Survey for Windows, September 2016
Attachment PRM-15Page 1 of 3UPDATED
Timeliness Safety Financial Price TechnicalCompany Industry Rank Rank Strength Stability Beta Rank
Campbell Soup Co Food Processing 2 2 B++ 95 0.65 2Clorox Co Household Products 2 2 B++ 100 0.65 2Costco Wholesale Corporation Retail Store 3 1 A+ 100 0.75 1Dr Pepper Snapple Group Inc Beverage 3 2 A 100 0.70 2General Mills Inc Food Processing 3 1 A+ 100 0.70 2Hershey Company Food Processing 3 2 B++ 95 0.70 1Kellogg Company Food Processing 2 1 A 100 0.65 1McCormick and Co Food Processing 1 1 A+ 100 0.75 2O Reilly Automotive Inc Retail Automotive 3 2 A 85 0.75 2Progressive Corporation Insurance (Prop/Cas.) 3 2 B++ 95 0.80 1Sysco Corp Retail/Wholesale Food 2 1 A+ 100 0.75 2Waste Connections Environmental 3 2 B++ 90 0.75 2Waste Management Environmental 2 1 A 100 0.75 2
Average 2 2 A 97 0.72 2
Gas Group Average 2 2 A 91 0.73 1
Source of Information: Value Line Investment Survey for Windows, September 2016
Comparable Earnings ApproachUsing Non-Utility Companies with
Timeliness of 1, 2 & 3; Safety Rank of 1, 2 & 3; Financial Strength of B++, A & A+;Price Stability of 85 to 100; Betas of .60 to .80; and Technical Rank of 1& 2

Attachment PRM-15 Page 3 of 3 UPDATED
Comparable Earnings Approach Screening Parameters
Timeliness Rank
The rank for a stock's probable relative market performance in the year ahead. Stocks ranked 1 (Highest) or 2 (Above Average) are likely to outpace the year-ahead market. Those ranked 4 (Below Average) or 5 (Lowest) are not expected to outperform most stocks over the next 12 months. Stocks ranked 3 (Average) will probably advance or decline with the market in the year ahead. Investors should try to limit purchases to stocks ranked 1 (Highest) or 2 (Above Average) for Timeliness.
Safety Rank
A measure of potential risk associated with individual common stocks rather than large diversified portfolios (for which Beta is good risk measure). Safety is based on the stability of price, which includes sensitivity to the market (see Beta) as well as the stock's inherent volatility, adjusted for trend and other factors including company size, the penetration of its markets, product market volatility, the degree of financial leverage, the earnings quality, and the overall condition of the balance sheet. Safety Ranks range from 1 (Highest) to 5 (Lowest). Conservative investors should try to limit purchases to equities ranked 1 (Highest) or 2 (Above Average) for Safety.
Financial Strength
The financial strength of each of the more than 1,600 companies in the VS II data base is rated relative to all the others. The ratings range from A++ to C in nine steps. (For screening purposes, think of an A rating as "greater than" a B). Companies that have the best relative financial strength are given an A++ rating, indicating ability to weather hard times better than the vast majority of other companies. Those who don't quite merit the top rating are given an A+ grade, and so on. A rating as low as C++ is considered satisfactory. A rating of C+ is well below average, and C is reserved for companies with very serious financial problems. The ratings are based upon a computer analysis of a number of key variables that determine (a) financial leverage, (b) business risk, and (c) company size, plus the judgment of Value Line's analysts and senior editors regarding factors that cannot be quantified across-the-board for companies. The primary variables that are indexed and studied include equity coverage of debt, equity coverage of intangibles, "quick ratio", accounting methods, variability of return, fixed charge coverage, stock price stability, and company size.
Price Stability Index
An index based upon a ranking of the weekly percent changes in the price of the stock over the last five years. The lower the standard deviation of the changes, the more stable the stock. Stocks ranking in the top 5% (lowest standard deviations) carry a Price Stability Index of 100; the next 5%, 95; and so on down to 5. One standard deviation is the range around the average weekly percent change in the price that encompasses about two thirds of all the weekly percent change figures over the last five years. When the range is wide, the standard deviation is high and the stock's Price Stability Index is low.
Beta
A measure of the sensitivity of the stock's price to overall fluctuations in the New York Stock Exchange Composite Average. A Beta of 1.50 indicates that a stock tends to rise (or fall) 50% more than the New York Stock Exchange Composite Average. Use Beta to measure the stock market risk inherent in any diversified portfolio of, say, 15 or more companies. Otherwise, use the Safety Rank, which measures total risk inherent in an equity, including that portion attributable to market fluctuations. Beta is derived from a least squares regression analysis between weekly percent changes in the price of a stock and weekly percent changes in the NYSE Average over a period of five years. In the case of shorter price histories, a smaller time period is used, but two years is the minimum. The Betas are periodically adjusted for their long-term tendency to regress toward 1.00.
Technical Rank
A prediction of relative price movement, primarily over the next three to six months. It is a function of price action relative to all stocks followed by Value Line. Stocks ranked 1 (Highest) or 2 (Above Average) are likely to outpace the market. Those ranked 4 (Below Average) or 5 (Lowest) are not expected to outperform most stocks over the next six months. Stocks ranked 3 (Average) will probably advance or decline with the market. Investors should use the Technical and Timeliness Ranks as complements to one another.
Attachment PRM-15 Page 2 of 3 UPDATED
Comparable Earnings Approach Five -Year Average Historical Earned Returns
for Years 2011-2015 and Projected 3-5 Year Returns
Projected Company 2011 2012 2013 2014 2015 Average 2019-21
Campbell Soup Co 77.8% 87.2% 64.6% 49.5% 60.2% 67.9% 29.0% Clorox Co - - NMF NMF NMF - NMF Costco Wholesale Corporation 12.2% 14.1% 18.2% 16.7% 22.0% 16.6% 21.5% Dr Pepper Snapple Group Inc 26.8% 26.9% 26.5% 30.6% 35.0% 29.2% 31.5% General Mills Inc 26.0% 26.6% 26.8% 27.9% 35.3% 28.5% 33.0% Hershey Company 76.4% 71.4% 52.6% 61.6% 91.2% 70.6% 43.5% Kellogg Company 69.9% 53.6% 38.9% 50.1% 59.1% 54.3% 38.0% McCormick and Co 23.1% 24.0% 21.5% 24.4% 26.9% 24.0% 23.0% 0 Reilly Automotive Inc 18.4% 27.8% 34.1% 38.6% 47.5% 33.3% 31.0% Progressive Corporation 16.5% 11.7% 14.8% 16.5% 15.2% 14.9% 18.0% Sysco Corp 24.5% 23.9% 19.1% 17.7% 20.9% 21.2% 55.5% Waste Connections 12.1% 9.3% 10.0% 10.6% 11.4% 10.7% 10.0% Waste Management 16.6% 15.2% 17.7% 19.7% 21.6% 18.2% 28.0%
Average 32.5% 30.2% Median 26.3% 30.0% Average (excluding companies with values >20%) 15.1% 14.0%
Attachment PRM-15Page 2 of 3UPDATED
ProjectedCompany 2011 2012 2013 2014 2015 Average 2019-21
Campbell Soup Co 77.8% 87.2% 64.6% 49.5% 60.2% 67.9% 29.0%Clorox Co - - NMF NMF NMF - NMFCostco Wholesale Corporation 12.2% 14.1% 18.2% 16.7% 22.0% 16.6% 21.5%Dr Pepper Snapple Group Inc 26.8% 26.9% 26.5% 30.6% 35.0% 29.2% 31.5%General Mills Inc 26.0% 26.6% 26.8% 27.9% 35.3% 28.5% 33.0%Hershey Company 76.4% 71.4% 52.6% 61.6% 91.2% 70.6% 43.5%Kellogg Company 69.9% 53.6% 38.9% 50.1% 59.1% 54.3% 38.0%McCormick and Co 23.1% 24.0% 21.5% 24.4% 26.9% 24.0% 23.0%O Reilly Automotive Inc 18.4% 27.8% 34.1% 38.6% 47.5% 33.3% 31.0%Progressive Corporation 16.5% 11.7% 14.8% 16.5% 15.2% 14.9% 18.0%Sysco Corp 24.5% 23.9% 19.1% 17.7% 20.9% 21.2% 55.5%Waste Connections 12.1% 9.3% 10.0% 10.6% 11.4% 10.7% 10.0%Waste Management 16.6% 15.2% 17.7% 19.7% 21.6% 18.2% 28.0%
Average 32.5% 30.2%Median 26.3% 30.0%Average (excluding companies with values >20%) 15.1% 14.0%
Comparable Earnings ApproachFive -Year Average Historical Earned Returns
for Years 2011-2015 andProjected 3-5 Year Returns
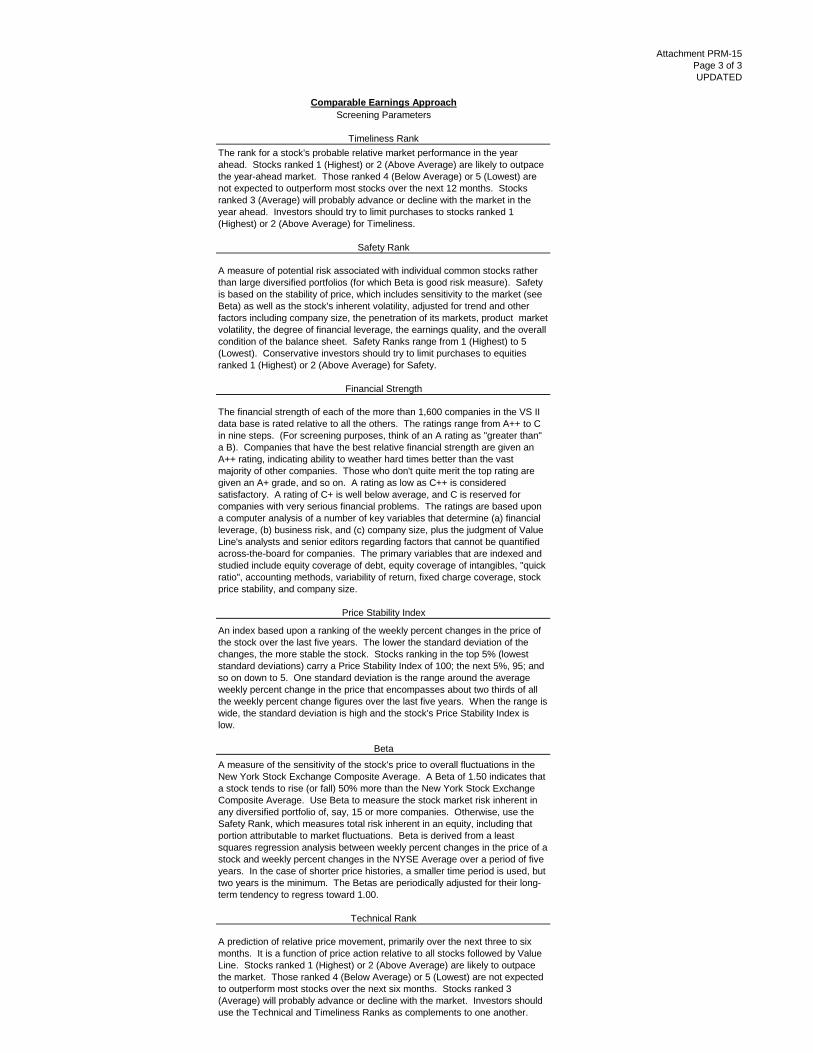
Attachment PRM-15 Page 3 of 3 UPDATED
Comparable Earnings Approach Screening Parameters
Timeliness Rank
The rank for a stock's probable relative market performance in the year ahead. Stocks ranked 1 (Highest) or 2 (Above Average) are likely to outpace the year-ahead market. Those ranked 4 (Below Average) or 5 (Lowest) are not expected to outperform most stocks over the next 12 months. Stocks ranked 3 (Average) will probably advance or decline with the market in the year ahead. Investors should try to limit purchases to stocks ranked 1 (Highest) or 2 (Above Average) for Timeliness.
Safety Rank
A measure of potential risk associated with individual common stocks rather than large diversified portfolios (for which Beta is good risk measure). Safety is based on the stability of price, which includes sensitivity to the market (see Beta) as well as the stock's inherent volatility, adjusted for trend and other factors including company size, the penetration of its markets, product market volatility, the degree of financial leverage, the earnings quality, and the overall condition of the balance sheet. Safety Ranks range from 1 (Highest) to 5 (Lowest). Conservative investors should try to limit purchases to equities ranked 1 (Highest) or 2 (Above Average) for Safety.
Financial Strength
The financial strength of each of the more than 1,600 companies in the VS II data base is rated relative to all the others. The ratings range from A++ to C in nine steps. (For screening purposes, think of an A rating as "greater than" a B). Companies that have the best relative financial strength are given an A++ rating, indicating ability to weather hard times better than the vast majority of other companies. Those who don't quite merit the top rating are given an A+ grade, and so on. A rating as low as C++ is considered satisfactory. A rating of C+ is well below average, and C is reserved for companies with very serious financial problems. The ratings are based upon a computer analysis of a number of key variables that determine (a) financial leverage, (b) business risk, and (c) company size, plus the judgment of Value Line's analysts and senior editors regarding factors that cannot be quantified across-the-board for companies. The primary variables that are indexed and studied include equity coverage of debt, equity coverage of intangibles, "quick ratio", accounting methods, variability of return, fixed charge coverage, stock price stability, and company size.
Price Stability Index
An index based upon a ranking of the weekly percent changes in the price of the stock over the last five years. The lower the standard deviation of the changes, the more stable the stock. Stocks ranking in the top 5% (lowest standard deviations) carry a Price Stability Index of 100; the next 5%, 95; and so on down to 5. One standard deviation is the range around the average weekly percent change in the price that encompasses about two thirds of all the weekly percent change figures over the last five years. When the range is wide, the standard deviation is high and the stock's Price Stability Index is low.
Beta
A measure of the sensitivity of the stock's price to overall fluctuations in the New York Stock Exchange Composite Average. A Beta of 1.50 indicates that a stock tends to rise (or fall) 50% more than the New York Stock Exchange Composite Average. Use Beta to measure the stock market risk inherent in any diversified portfolio of, say, 15 or more companies. Otherwise, use the Safety Rank, which measures total risk inherent in an equity, including that portion attributable to market fluctuations. Beta is derived from a least squares regression analysis between weekly percent changes in the price of a stock and weekly percent changes in the NYSE Average over a period of five years. In the case of shorter price histories, a smaller time period is used, but two years is the minimum. The Betas are periodically adjusted for their long-term tendency to regress toward 1.00.
Technical Rank
A prediction of relative price movement, primarily over the next three to six months. It is a function of price action relative to all stocks followed by Value Line. Stocks ranked 1 (Highest) or 2 (Above Average) are likely to outpace the market. Those ranked 4 (Below Average) or 5 (Lowest) are not expected to outperform most stocks over the next six months. Stocks ranked 3 (Average) will probably advance or decline with the market. Investors should use the Technical and Timeliness Ranks as complements to one another.
Attachment PRM-15Page 3 of 3UPDATED
Technical Rank
A prediction of relative price movement, primarily over the next three to six months. It is a function of price action relative to all stocks followed by Value Line. Stocks ranked 1 (Highest) or 2 (Above Average) are likely to outpace the market. Those ranked 4 (Below Average) or 5 (Lowest) are not expected to outperform most stocks over the next six months. Stocks ranked 3 (Average) will probably advance or decline with the market. Investors should use the Technical and Timeliness Ranks as complements to one another.
Financial Strength
The financial strength of each of the more than 1,600 companies in the VS II data base is rated relative to all the others. The ratings range from A++ to C in nine steps. (For screening purposes, think of an A rating as "greater than" a B). Companies that have the best relative financial strength are given an A++ rating, indicating ability to weather hard times better than the vast majority of other companies. Those who don't quite merit the top rating are given an A+ grade, and so on. A rating as low as C++ is considered satisfactory. A rating of C+ is well below average, and C is reserved for companies with very serious financial problems. The ratings are based upon a computer analysis of a number of key variables that determine (a) financial leverage, (b) business risk, and (c) company size, plus the judgment of Value Line's analysts and senior editors regarding factors that cannot be quantified across-the-board for companies. The primary variables that are indexed and studied include equity coverage of debt, equity coverage of intangibles, "quick ratio", accounting methods, variability of return, fixed charge coverage, stock price stability, and company size.
Price Stability Index
An index based upon a ranking of the weekly percent changes in the price of the stock over the last five years. The lower the standard deviation of the changes, the more stable the stock. Stocks ranking in the top 5% (lowest standard deviations) carry a Price Stability Index of 100; the next 5%, 95; and so on down to 5. One standard deviation is the range around the average weekly percent change in the price that encompasses about two thirds of all the weekly percent change figures over the last five years. When the range is wide, the standard deviation is high and the stock's Price Stability Index is low.
BetaA measure of the sensitivity of the stock's price to overall fluctuations in the New York Stock Exchange Composite Average. A Beta of 1.50 indicates that a stock tends to rise (or fall) 50% more than the New York Stock Exchange Composite Average. Use Beta to measure the stock market risk inherent in any diversified portfolio of, say, 15 or more companies. Otherwise, use the Safety Rank, which measures total risk inherent in an equity, including that portion attributable to market fluctuations. Beta is derived from a least squares regression analysis between weekly percent changes in the price of a stock and weekly percent changes in the NYSE Average over a period of five years. In the case of shorter price histories, a smaller time period is used, but two years is the minimum. The Betas are periodically adjusted for their long-term tendency to regress toward 1.00.
Comparable Earnings ApproachScreening Parameters
Timeliness RankThe rank for a stock's probable relative market performance in the year ahead. Stocks ranked 1 (Highest) or 2 (Above Average) are likely to outpace the year-ahead market. Those ranked 4 (Below Average) or 5 (Lowest) are not expected to outperform most stocks over the next 12 months. Stocks ranked 3 (Average) will probably advance or decline with the market in the year ahead. Investors should try to limit purchases to stocks ranked 1 (Highest) or 2 (Above Average) for Timeliness.
Safety Rank
A measure of potential risk associated with individual common stocks rather than large diversified portfolios (for which Beta is good risk measure). Safety is based on the stability of price, which includes sensitivity to the market (see Beta) as well as the stock's inherent volatility, adjusted for trend and other factors including company size, the penetration of its markets, product market volatility, the degree of financial leverage, the earnings quality, and the overall condition of the balance sheet. Safety Ranks range from 1 (Highest) to 5 (Lowest). Conservative investors should try to limit purchases to equities ranked 1 (Highest) or 2 (Above Average) for Safety.