columbia river crossing project vancouver, washington · columbia river crossing project ....
TRANSCRIPT
Columbia River Crossing Project Vancouver, Washington
Engineering (Rating Assigned November 2012)
Summary Description
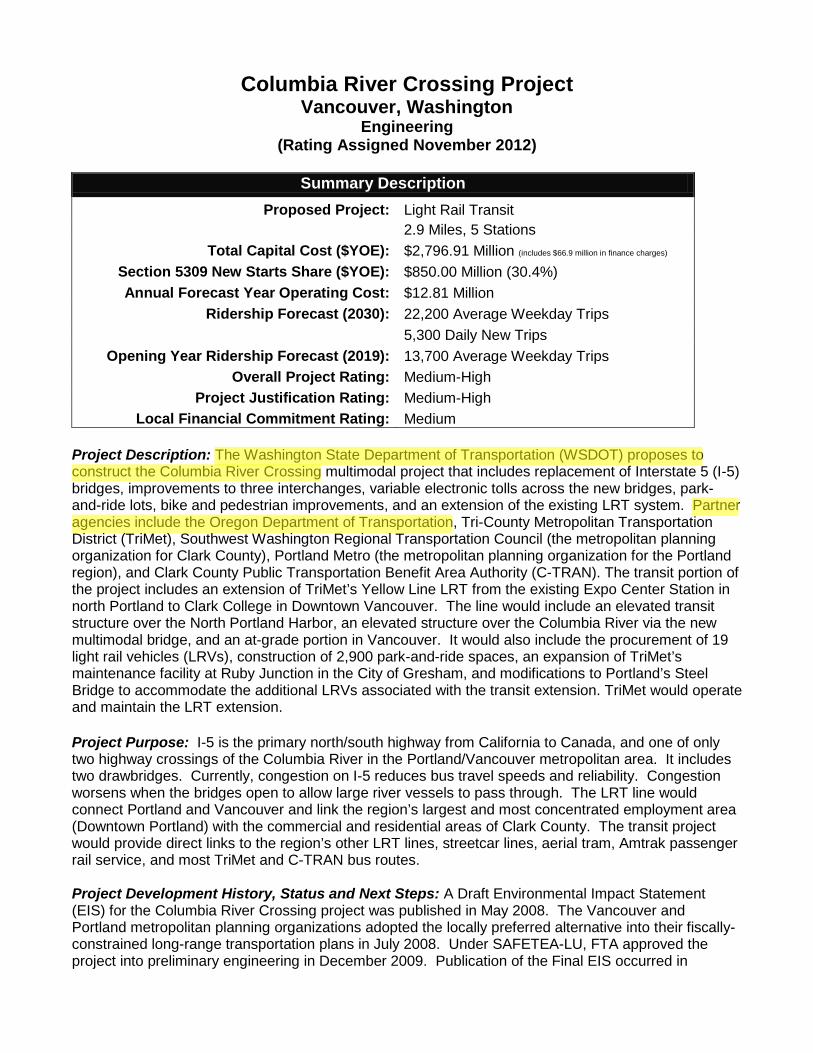
Proposed Project: Light Rail Transit 2.9 Miles, 5 Stations
Total Capital Cost ($YOE): $2,796.91 Million (includes $66.9 million in finance charges) Section 5309 New Starts Share ($YOE): $850.00 Million (30.4%) Annual Forecast Year Operating Cost: $12.81 Million
Ridership Forecast (2030): 22,200 Average Weekday Trips 5,300 Daily New Trips
Opening Year Ridership Forecast (2019): 13,700 Average Weekday Trips Overall Project Rating: Medium-High
Project Justification Rating: Medium-High Local Financial Commitment Rating: Medium
Project Description: The Washington State Department of Transportation (WSDOT) proposes to construct the Columbia River Crossing multimodal project that includes replacement of Interstate 5 (I-5) bridges, improvements to three interchanges, variable electronic tolls across the new bridges, park-and-ride lots, bike and pedestrian improvements, and an extension of the existing LRT system. Partner agencies include the Oregon Department of Transportation, Tri-County Metropolitan Transportation District (TriMet), Southwest Washington Regional Transportation Council (the metropolitan planning organization for Clark County), Portland Metro (the metropolitan planning organization for the Portland region), and Clark County Public Transportation Benefit Area Authority (C-TRAN). The transit portion of the project includes an extension of TriMet’s Yellow Line LRT from the existing Expo Center Station in north Portland to Clark College in Downtown Vancouver. The line would include an elevated transit structure over the North Portland Harbor, an elevated structure over the Columbia River via the new multimodal bridge, and an at-grade portion in Vancouver. It would also include the procurement of 19 light rail vehicles (LRVs), construction of 2,900 park-and-ride spaces, an expansion of TriMet’s maintenance facility at Ruby Junction in the City of Gresham, and modifications to Portland’s Steel Bridge to accommodate the additional LRVs associated with the transit extension. TriMet would operate and maintain the LRT extension. Project Purpose: I-5 is the primary north/south highway from California to Canada, and one of only two highway crossings of the Columbia River in the Portland/Vancouver metropolitan area. It includes two drawbridges. Currently, congestion on I-5 reduces bus travel speeds and reliability. Congestion worsens when the bridges open to allow large river vessels to pass through. The LRT line would connect Portland and Vancouver and link the region’s largest and most concentrated employment area (Downtown Portland) with the commercial and residential areas of Clark County. The transit project would provide direct links to the region’s other LRT lines, streetcar lines, aerial tram, Amtrak passenger rail service, and most TriMet and C-TRAN bus routes. Project Development History, Status and Next Steps: A Draft Environmental Impact Statement (EIS) for the Columbia River Crossing project was published in May 2008. The Vancouver and Portland metropolitan planning organizations adopted the locally preferred alternative into their fiscally-constrained long-range transportation plans in July 2008. Under SAFETEA-LU, FTA approved the project into preliminary engineering in December 2009. Publication of the Final EIS occurred in

September 2011, and issuance of the Record of Decision occurred in December 2011. The project is considered grandfathered into the MAP-21 engineering phase since the environmental review process is completed. WSDOT anticipates receiving a Full Funding Grant Agreement during 2014, and starting revenue operations in 2019. Significant Changes Since Last Evaluation (November 2011): The project’s capital cost decreased from $3,507.87 million to $2,796.91 million per a local decision to implement the project in phases. The initial phase will include all project elements required to make the LRT, highway, and tolling facility fully functional. Improvements at four highway interchanges, as well as the entire interchange at State Route 500, will be deferred.
NOTE: The financial plan reflected in this table has been developed by the project sponsor and does not reflect a commitment by DOT or FTA. The sum of the figures may differ from the total as listed due to rounding.
Locally Proposed Financial Plan Source of Funds Total Funds ($million) Percent of Total
Federal: Section 5309 New Starts FHWA Interstate Maintenance, Corridors of the Future, National Highway System, and Surface Transportation Program
$850.00 $122.70
30.4%
4.4%
State: Oregon DOT and Washington State
DOT General Existing Funds Oregon DOT Anticipated Legislative
Funds Washington State DOT Anticipated
Legislative Funds
$24.29
$439.78
$260.14
0.9%
15.7%
9.3%
Local: Toll Bond Proceeds Transportation Infrastructure Finance and Innovation Act (TIFIA) Loan Backed by Toll Revenues
$250.00 $850.00
8.9%
30.4%
Total: $2,796.91 100.0%
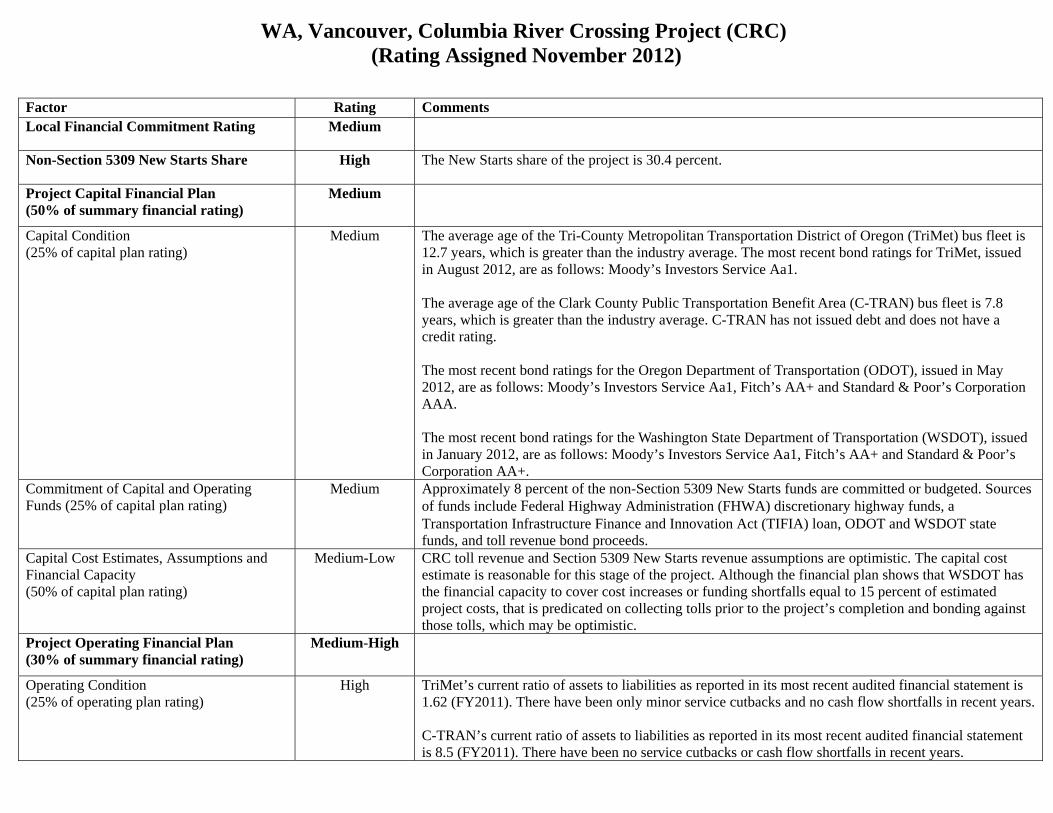
WA, Vancouver, Columbia River Crossing Project (CRC) (Rating Assigned November 2012)
Factor Rating Comments Local Financial Commitment Rating Medium
Non-Section 5309 New Starts Share High The New Starts share of the project is 30.4 percent.
Project Capital Financial Plan (50% of summary financial rating)
Medium
Capital Condition (25% of capital plan rating)
Medium The average age of the Tri-County Metropolitan Transportation District of Oregon (TriMet) bus fleet is 12.7 years, which is greater than the industry average. The most recent bond ratings for TriMet, issued in August 2012, are as follows: Moody’s Investors Service Aa1. The average age of the Clark County Public Transportation Benefit Area (C-TRAN) bus fleet is 7.8 years, which is greater than the industry average. C-TRAN has not issued debt and does not have a credit rating. The most recent bond ratings for the Oregon Department of Transportation (ODOT), issued in May 2012, are as follows: Moody’s Investors Service Aa1, Fitch’s AA+ and Standard & Poor’s Corporation AAA. The most recent bond ratings for the Washington State Department of Transportation (WSDOT), issued in January 2012, are as follows: Moody’s Investors Service Aa1, Fitch’s AA+ and Standard & Poor’s Corporation AA+.
Commitment of Capital and Operating Funds (25% of capital plan rating)
Medium Approximately 8 percent of the non-Section 5309 New Starts funds are committed or budgeted. Sources of funds include Federal Highway Administration (FHWA) discretionary highway funds, a Transportation Infrastructure Finance and Innovation Act (TIFIA) loan, ODOT and WSDOT state funds, and toll revenue bond proceeds.
Capital Cost Estimates, Assumptions and Financial Capacity (50% of capital plan rating)
Medium-Low CRC toll revenue and Section 5309 New Starts revenue assumptions are optimistic. The capital cost estimate is reasonable for this stage of the project. Although the financial plan shows that WSDOT has the financial capacity to cover cost increases or funding shortfalls equal to 15 percent of estimated project costs, that is predicated on collecting tolls prior to the project’s completion and bonding against those tolls, which may be optimistic.
Project Operating Financial Plan (30% of summary financial rating)
Medium-High
Operating Condition (25% of operating plan rating)
High TriMet’s current ratio of assets to liabilities as reported in its most recent audited financial statement is 1.62 (FY2011). There have been only minor service cutbacks and no cash flow shortfalls in recent years. C-TRAN’s current ratio of assets to liabilities as reported in its most recent audited financial statement is 8.5 (FY2011). There have been no service cutbacks or cash flow shortfalls in recent years.
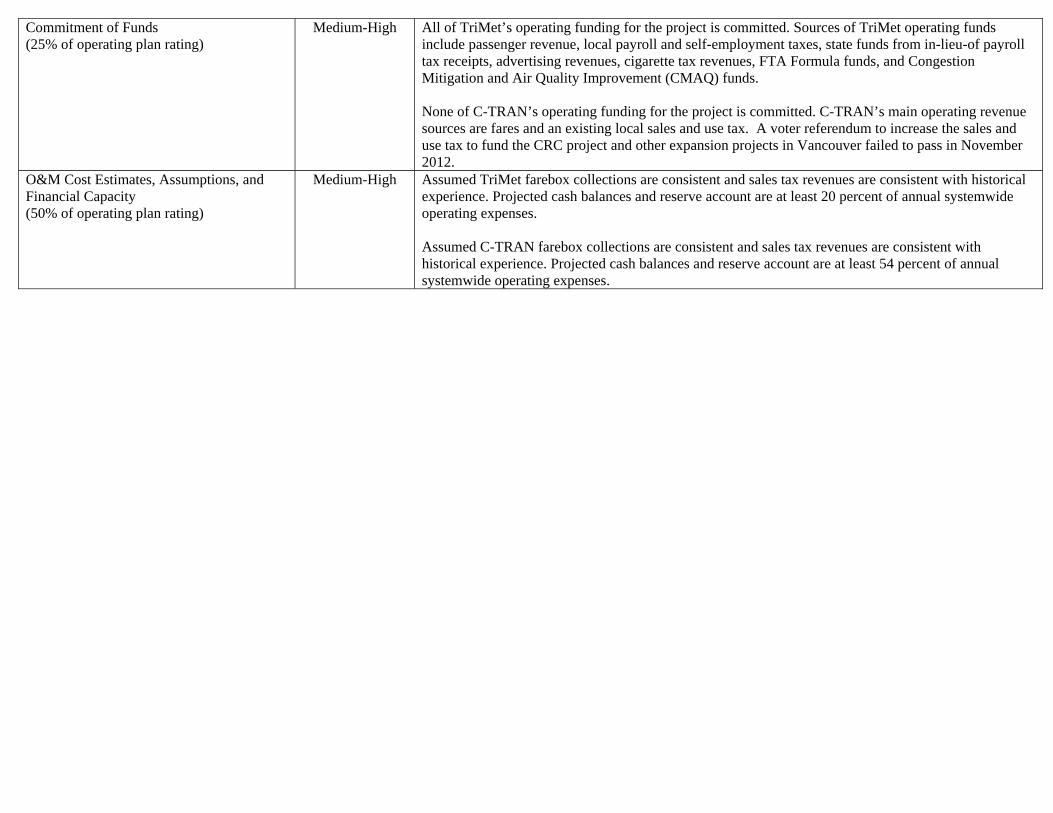
Commitment of Funds (25% of operating plan rating)
Medium-High All of TriMet’s operating funding for the project is committed. Sources of TriMet operating funds include passenger revenue, local payroll and self-employment taxes, state funds from in-lieu-of payroll tax receipts, advertising revenues, cigarette tax revenues, FTA Formula funds, and Congestion Mitigation and Air Quality Improvement (CMAQ) funds. None of C-TRAN’s operating funding for the project is committed. C-TRAN’s main operating revenue sources are fares and an existing local sales and use tax. A voter referendum to increase the sales and use tax to fund the CRC project and other expansion projects in Vancouver failed to pass in November 2012.
O&M Cost Estimates, Assumptions, and Financial Capacity (50% of operating plan rating)
Medium-High Assumed TriMet farebox collections are consistent and sales tax revenues are consistent with historical experience. Projected cash balances and reserve account are at least 20 percent of annual systemwide operating expenses. Assumed C-TRAN farebox collections are consistent and sales tax revenues are consistent with historical experience. Projected cash balances and reserve account are at least 54 percent of annual systemwide operating expenses.

Columbia River Crossing Project Vancouver, Washington
Engineering (Rating Assigned in November 2009)
LAND USE RATING: Medium
The land use rating reflects the population and employment densities within ½-mile of proposed station areas:
• Average population density across all station areas is 2,400 persons per square mile. Total employment served is at least 300,000. Including Yellow Line segments that are existing or under construction, the project would provide a one-seat ride to nearly 43,000 residents and over 145,000 jobs.
• Three of the five proposed stations are in the Vancouver, WA Central Business District (CBD), the second largest in the region after Portland, OR, which features a grid street pattern, complete sidewalk network, and numerous pedestrian amenities, and contains over 12,000 jobs, over 95 percent of which would be within 1/2 mile of a station. The Clark College Station area is well-served by trails and sidewalks but lacks a grid street network, and most of the land uses closest to the station are athletic fields or open space. The Hayden Island Station is surrounded by a major highway interchange, massive shopping mall, and some low- to medium-density housing.
ECONOMIC DEVELOPMENT RATING: High
Transit-Supportive Plans and Policies: High (50 percent of Economic Development Rating)
• Oregon’s comprehensive planning system has existed for more than 30 years and land use laws play a major role in determining how cities and regions grow. Portland Metro’s Urban Growth Management Functional Plan requires that cities and counties define minimum densities for all residential zones, with typical policy targets of 45 to 60 persons per acre in transit station areas designated as growth centers. Portland updated its comprehensive plan and implemented ordinances in order to comply with regional requirements.
• On the Washington side, state, county, municipal, and district plans and policies all promote transit- and pedestrian-friendly design and development character. Compact, mixed-use downtowns, complete streets, and downtown pedestrian amenities are all reflected in the Community Framework Plan as well as the Comprehensive Plan for Vancouver and the Vancouver City Center Vision & Subarea Plan. The city’s Transit Overlay District imposes minimum densities, increased maximum densities, and parking maximums. The Downtown District Plan also limits parking facilities, designates pedestrian corridors, and permits increased building heights.
• The City of Vancouver offers a multi-family housing tax exemption in the downtown area. The city has also designated two Revenue Development Areas (RDAs) which can be used to finance infrastructure improvements and has worked with private developers on large developments in both RDAs. Developments within the Transit Overlay District are eligible for up to 24 percent in transit impact fee reductions if certain conditions are met. Vancouver is also implementing an expedited permitting process.
Performance and Impacts of Policies: High (50 percent of Economic Development Rating)
• TriMet estimates that light rail in the region has spurred over $6.0 billion in investment along corridors in the Portland region. Metro’s Transit Oriented Development Program has assisted 29 development projects currently under construction or completed.
• In Vancouver, most of the land area within 1/2 mile of the four proposed stations falls within the CBD. A number of new projects in the southern part of downtown have already been completed, and many have taken advantage of reduced parking requirements and density bonuses allowed in the Transit Overlay District. Development goals, supported by a recent development capacity study, aim for over 3.5 million square feet of new commercial and institutional space, and 1,400 new residential units, in downtown Vancouver by 2023.

E Burnside St
NE Halsey St
SE Division St
SE 39
th Av
e SE 60
th Av
e
SE Holgate Blvd
SE Flavel StSE Flavel St
SE Woodstock Blvd
SE Tacoma StSE Johnson Creek Rd
SE Park Ave
Sandy Blvd
SE M
ilwau
kie A
ve
500
99E
14
39th St
Fourth Plain Blvd
McLoughlin BlvdFourth Plain
W A S H I N G T O N
O R E G O N
Vancouver
Portland Fairview
Gresham
Camas
Hayden Island
84
84
205
405
5
5
N0 1
MILE
E Burnside St102n
d Ave
181s
t Ave
223r
d Ave
NE 82
nd A
veNE 42
nd A
ve
Martin
Luthe
r King
Jr. B
lvd
NE Columbia Blvd
NE Lombard St
NE Marine Dr
Mill Plain Blvd
NE Killingsworth St
Broadway
NE Prescott St
Inter
state
Ave
NE Sandy Blvd
Columbia River
North Portland Harbor
Vancouver Lake
LacamasLake
Willamette River
Ruby JunctionSteel Bridge
Main Project Area
OREGON
WASHINGTON
Focus Map Area
Milwaukie
Powell
136th
SunnysideSE Li
nwoo
d Ave
Lake
112th
Stark
129th
Mt. Scott
5
172n
d
Terwilliger
Boones Ferry
35th
Taylors Ferry
Vermont
45th
BarnesSt Helens
Lombard
LOMBARD
MILL PLAIN BLVD
TS
NOT
GNI
HS
AW
TS
YAW
DAO
RB
E 5TH ST
COLUMBIA
N COLUMBIA BLVD
MA
IN S
T
33RD
8TH ST
49TH
44TH
MCLOUGHLIN BLVD
MCLOUGHLIN BLVD
54TH
HT51
NLO
CNIL ST JAM
ES
FALK
ROSS
45TH
BR
AN
DT
COLUMBIA HOUSE BLVD
MARTIN
LUTH
ER KIN
G JR
EVA
HT31
EN
KA
UFF
MA
N
E RE
SERV
E ST
ST JOHNS B
LVD
NO
SP
MIS
BLAN
DFO
RD
33RD
39TH
15TH ST
17TH ST
13TH ST
LIN
CO
LN
FOURTH PLAIN BLVD
SE COLUMBIA WAY
UNION
EVERGREEN BLVD
20TH
N MARINE DR
N MARINE DR
N JANTZEN AVE
N HAYDEN ISLANDDR
NTOMAHAWK ISLAND DR
Vancouver
WASHINGTONHAYDENISLAND
ClarkCollege
Portland
OREGON
Focus Map
Overview Map
Highway ImprovementsExisting Highway and BridgeProposed Light Rail AlignmentExisting MAX LinesExisting Projects Under ConstructionProposed Park and RideProposed Light Rail StationsInterchange ImprovementsPossible Staging or Casting AreasOther Light Rail-related Improvements