column strength curves - home - the …arizona.openrepository.com/arizona/bitstream/10150/...column...
TRANSCRIPT

Column strength curves
Item Type text; Thesis-Reproduction (electronic)
Authors Bos, Harvey Dale, 1946-
Publisher The University of Arizona.
Rights Copyright © is held by the author. Digital access to this materialis made possible by the University Libraries, University of Arizona.Further transmission, reproduction or presentation (such aspublic display or performance) of protected items is prohibitedexcept with permission of the author.
Download date 24/06/2018 16:49:49
Link to Item http://hdl.handle.net/10150/554529

COLUMN STRENGTH CURVES
"byHarvey Dale Bos
A Thesis Submitted to the Faculty of theDEPARTMENT OF CIVIL ENGINEERING AND ENGINEERING MECHANICS
In Partial Fulfillment of the Requirements For the Degree ofMASTER OF SCIENCE
. WITH A MAJOR IN CIVIL ENGINEERINGIn the Graduate College
THE UNIVERSITY OF ARIZONA
1 9 7 3

STATEMENT BY AUTHOR
This thesis has "been submitted in partial fulfillment of requirements for an advanced degree at The'University of Arizona and is deposited in the University Library to be made available to borrowers under rules of the Library©
Brief quotations from this thesis are allowable without special permission^ provided that accurate acknowledgment of source is made© Requests for permission for extended quotation from or reproduction of this manuscript in whole or in part may be granted by the head of the major department or the Dean of the Graduate College when in his judgment the proposed use of the material is in the interests of scholarship© In all other instances," however," permission must be obtained from the author©
SIGNED g 12/ ^ ^
APPROVAL BY THESIS DIRECTORThis thesis has been approved on the date shown below$
R© M© RICHARDProfessor of Civil Engineering

ACKNOWLEDGMENT
The author wishes to express his appreciation to Dre Ralph Me Richard for his guidance and advice during the research for and preparation of this manuscripte
ill

TABLE OF CONTENTS
PageLIST OF ILLUSTRATIONS © © o o o o e e e o e e e e e e e e e e o VABSTRACT e o G o e e o e e o o e o o o o o e o G o e e e e o e VXX
Iq INTRODUCTION 0 © © © © e © © a © © © « © © © © . o e o o e o e e I2 o BASIC CONCEPTS e e © o © © o e © e o o 6 © © © e e © © '©oo© ^
CoInRiYi Thsoi y © o © © © © © © © © © © © © © © © © © © © © © ^The Richard ion © o © © © © © © © © © © © © © © © © © 7
3© METHOD OF SOLUTION o o © o d o © © © q © © © © © © © © © © © ©Finite Element Model o © © © © © © © © © © © © © © © © © © 11Sign Convention © o © © © © © © © © © © © © © © © © © © © © IxResidual Stress Patterns © © © © © © © © © © © o © © © © © 13
Linear Residual Stress Pattern © © © © © © © © © © © © 13Parabolic Residual Stress Pattern © © © © © © © © © © © 14
Column Curves o © © © © © © © © © © © © © © © © © © © © © ® 1640 INFLUENCE OF RESIDUAL STRESS ON COLUMN STRENGTH © © © © © © © ©■ 18
Analytical Results © © o © © © © © © © © © © © © © © © © © 18Comparison with Experimental Results © 0 © © © o © 0 © © © 28
5o. APPLICATION TO STUB COLUMN TESTS © . © o ©. © © e © © © © © © 30Steel Columns e © © © © © © © © © © © © © © © © © © © © © © 30Aluminum Columns o © © © © © © © © © © © © © © © © © © © © 33
6© SUMMARY AND CONCLUSIONS © © © © © © © © © © © © © © © © © © © © 35LIST OF REFERENCES o © © . © © © © - © © © © © . © © © © © © © © © © 36
iv

LIST OF ILLUSTRATIONS
Figure Page16 Typical Rounded Stress-Strain Curve s . . . e 62e Typical Stress-Strain Curve for Steel . 0 , 63b Nondimensional Stress-Strain Relationship of Eqe 10 « e , „ 0 8ke Elastic-Plastic Stress-Strain Parameters . , , . e «,* . « , 95e Nonlinear Shape Parameter n e o o o o e o o o o o o e o o o o 96, Idealized Cross Section with Typical Finite Elements e . „ e 127a Linear Residual Stress Distribution • • 8 e o B o o o e « B s 1288 Typical Parabolic Residual Stress Distribution . , „ e . 0 0 « 129e Idealized Compressive Stress-Strain Curve for Mild Steel « 0 1910o Effective Compressive Stress-Strain Curves 0 <. 0 0 0 0 « 0 0 2011b Influence of Residual Stress Distribution
on the Effective Shape Parameter, nQ e « e o « e o ' e . o o » » 2212* Influence of Residual Stress Distribution on E^/E vs0 £/fe-0 e 2313o Influence of Residual Stress Distribution on E^/E vs„ o /cr 0 2414, Influence of Residual Stress Distribution
on Strong Axis Bending ‘ 0 0 0 0 c 0 0 0 0 0 o ® o « 0 0 0 » 0 2515o Influence of Residual Stress Distribution
on WeaR Axis Bending 0 0 o o o o e 0 0 0 0 0 0 0 0 0 0 0 0 0 2616e Comparison of Analytical and Column Research
Council Column Strength Curves 0 0 0 0 0 0 0 0 0 0 0 0 0 0 0 >2?17o Comparison of Analytical and Experimental Results
for a Measured Residual Stress Distribution 0 0 0 0 0 0 0 0 0 29180 Compressive Stress-Strain Curve for Mild Steel Columns 0 0 0 3119o Column Strength for Mild Steel Columns
Based on Stub Column Test Results 0 0 0 0 0 0 0 0 0 . 0 0 0 0 0 32v

LIST OF ILLUSTRATIONS— Continuedvi
Figure Page20„ Compressive Stress-Strain Curve for
6061 T~6 Aluminum Column e o e . e o e e o e e o o B e e o e e 3321e Column Strength for 6o6l T-6 Aluminum Columns
Based on Stub Column Test Results „e . 34

ABSTRACT
The tangent modulus formula is widely used for determining the critical buckling stress for columns in the inelastic rangee The tangent modulus is usually determined by measuring the slope of the effective stress-strain curve for the column section. By fitting the Richard equation to the effective stress-strain curve and performing differentiation, an analytical expression for the tangent modulus may be obtained.
Residual stresses, resulting from uneven cooling, have a significant effect on the strength of mild steel columns, A finite element model was used to obtain effective stress-strain curves, and column strength curves, based on the analytical expression for the tangent modulus," were obtained. Both a linear and a parabolic residual stress pattern, with varying magnitudes of the maximum residual compressive stress, were used to study the influence of residual stresses on column strength. The analytically obtained column strength curves for a "known” residual stress distribution were found to be in close agreement with experimental results.
The Richard equation was also fitted to the stress-strain curves from both mild steel and aluminum stub column tests. The analytically obtained column strength curves were in close agreement with experimental results.
vii

CHAPTER i
INTRODUCTION
For over two hundred years? the'behavior of columns has been studied both analytically and experimentally. In 1744, Leonard Euler first developed the column formula which is still in use today for elastic buckling. Proof tests of structures indicated that columns frequently failed below the Euler load, and the Euler formula was not generally utilized for design. In 1889V Considere conducted a series of column tests which showed that the Euler formula accurately predict™ ed column strength whenever the average stress was below the proportional limit. For buckling in the inelastic range, he proposed replacing Young’s modulusV E, in the Euler formula with an "effective" modulus having a value between the tangent modulus, E^e and Young’s modulus, Ee During the same year, Engesser suggested substituting the tangent modulus, E^V in place of Young’s modulus, E, for inelastic bucklingo In 1895V Jasinski suggested that there was an apparent error in the Engesser formula because, during bending, a portion of jthe cross section would be subjected to a strain reversal for which Young’s modulus, E,' would apply, Engesser then developed a formula for a "reduced" modulus which depended on EV and the shape of the cross section. In 1910," Von Karman derived explicit expressions for the "reduced" modulus for rectangular and idealized H-section columns0 Column tests showed that failure usually occurred at loads just above

the tangent-modulus loads, andV In 19 7$> Shanley (ll) offered a new interpretation of the tangent-modulus loade He showed that "a difference in strain can "be obtained without strain reversal if the strain is developed simultaneously with an increase in the average straine"In 1952$ the Column Research Council (12) recommended the use of the tangent-modulus formula for predicting column strength in the inelastic range. More details on the evolution of the column formula have been given by the Column Research Council (4), Huber and Beedle (8), and Shanley (ll).
The tangent-modulus formula was readily applicable to columns of materials such as aluminum which have rounded stress-strain curves. However, since the stress-strain curve for a mild steel coupon is generally idealized as being bilinear, the tangent-modulus formula was not directly applicable to steel columnse If a compression test is run on a steel stub columnV the resulting effective stress-strain curve for the entire cross section will have a rounded portion due principally to residual stresses and variation in the yield stress over the cross section (4,8),
There are two methods for obtaining the effective stress-strain curve for the cross section of a steel column. The first method requires a knowledge of the magnitude and distribution of the residual stresses and the stress-strain relationship for a coupon of the column material. An analytical procedure is used to obtain the effective stress-strain curve for the cross section. The second method is to obtain the stress-strain curve directly from a stub column test. The

effect of residual stresses is thus included without requiring further knowledge of their magnitude or distributions These methods are discussed in more detail "by the Column Research Council (4), Huber and Beedle (8)g Beedle and Tall (l), and Yu and Tall (13)«
The slope of the stress-strain curve for the entire cross section is the effective tangent modulus for the section and is used in the tangent-modulus formula to predict column strength,, Techniques for determining the tangent modulus are described by the Column Research Council (4)e
An analytical expression for the tangent modulus is available by representing the stress-strain curve by the Richard equation (?910) and performing differentiation. This paper is concerned with the use of the Richard tangent modulus for determining column strength. Two residual stress patterns with varying magnitudes of the maximum residual compressive stress are used to obtain effective stress-strain . curves for several cross sections. Column strength curves are con- - structed. based on the Richard tangent modulus for the effective stress- strain curves', and comparisons are made with column test results.The referenced equation is also fitted to the effective stress-strain curves obtained from stub column tests. The tangent modulus for these curves is used to construct column strength curves9 and analytical results are compared with column test results.

CHAPTER 2
BASIC CONCEPTS
For a linearly elastic, initially straight, centrally loaded column, the load for the lowest mode of buckling within the elastic range is given by the Euler formulas
- . - S 'where is the Euler buckling load, E is Young6s modulus, I is themoment of inertia about the axis perpendicular to the direction ofbuckling, K is an effective length coefficient, and L is the length of
2the column8 Since 1 = Ar , where A is the area and r is the radius of gyration, the average stress at the Euler buckling load, o , is given by 8
For a straight, centrally loaded column which is free of residual stresses and which is made of a material having a rounded stress- strain curve as shown in Fig, 1, the critical buckling stress in the inelastic range, is given by:
vhl
(3)
where E^, the tangent modulus, is the slope of the stress-strain curve

at the stress cr^ This formula has "been used extensively to determine the "buckling strength of both aluminum and magnesium alloy columns (4)e
In hot-rolled structural steel shapes, residual stresses result from the uneven cooling of portions of the section. The flange tips,' which cool more rapidly, develop residual compressive stresses, whereas other parts, which cool more slowly, develop residual tensile stresses e Brockenbrough and Johnston (2) mention additional sources of residual stresses 1 however", Beedle and Tall (l) have shown that residual stresses resulting from uneven cooling have the most significant effect on column strengthe
Portions of a column under a compressive residual stress will "begin to yield at a lower applied compressive load than will portions . under a tensile residual stress. This causes the effective stress- strain curve for a steel stub column to have a rounded portion as shown in.Fig, 2,
ized as being bilinear as shown in Fig, 2, the stiffness of the yielded portion of the column is zero, and the stiffness of the cross section is determined by the stiffness of the elastic portion, El , where I is the moment of inertia of the elastic portion (2,8), The equation for critical buckling stress then becomes 8 '
flange sections by neglecting the contribution of the web to the moment
If the stress-strain curve for coupons of mild steel is ideal-
(4)
Huber and Beedle (8) obtained approximate solutions for for wide

6
-crcr
E
Ideal Coupon-cr
tub Columno'
e
FIG. 1.— TYPICAL ROUNDED STRESS-STRAIN CURVE
FIG. 2.— TYPICAL STRESS- STRAIN CURVE FOR STEEL
of inertiatEmE
and ~ = ( ~5,E
for strong axis bending
for weak axis bending
(5)
(6)where is the effective tangent modulus determined from the stress- strain curve for the entire cross section. Thus, for mild steel columns, the critical buckling stress in the inelastic range, o , is given by the approximate equations!
for strong axis bendingA m
and
C (KL/r)
TrzE°o “ TTTTTz
(7)Em
(KL/r) \E— I for weak axis bending (8)

The Richard Equation The stress-strain curve for a material is often idealized by a r
series of straight lines„ Smooth analytical expressions have been developed to represent stress-strain curves and provide continuity.One such expression is the well-known Ramberg-Osgood polynomial (9) which gives the strain explicitly in terms of the stress t
where or is the stress, & is the strain, E is Young’s modulus, denotes the stress at a secant modulus of 0,7 E, and m is the shape parameter of the stress-strain curve. A similar expression which gives the stress explicitly in terms of the strain is the Richard equation (?,10)i
r - ^TYiTS (1°)1 + Ee
%in which or is the stress, e is the strain, E is Young9s modulus, denotes the plastic stress, and n is the shape parameter of the stress- strain curveo Fig. 3 is a nondimensional plot of Eqe 10o Solving Eq0 10 for strain explicitly in terms of stress gives (10)i
“ F f r rEqs0 10 and 11 are ideally suited to materials that exhibit an elastic- perfectly plastic stress-strain relationship,
Richard (10) has modified Eqe 10 to include materials that exhibit linear strain hardening:

8
1.2
1.0
0,8
0.2
0,00,0 0.8 2.42.0 2.8FIG. 3# — NONDIMENSIONAL STRESS-STRAIN RELATIONSHIP OF EQ. 10
Ei&i + El£
"'o
n\ l /n (12)
where E^ is the plastic modulus; E = E - E^ where E is the initial or Young’s modulus; and or is a "reference” plastic stress as shown in Fig, 4, It is noted that when E^ = 0, Eq, 12 is identical to Eq, 10.Fig, 5 shows the relation "between cj/cr and n for a stress-strain curvewith and as defined in Fig, 4.
The value of the shape parameter, n, may be determined analytically as follows (referring to Fig, 4)i

9
oro
cr.1
cr
Strain soFIG. 4,--ELASTIC-PLASTIC STRESS-STRAIN PARAMETERS
.2
0#
0.8
0.2
0.0!• 10. 100.
nFIG. 5.— NONLINEAR SHAPE PARAMETER n

An analytical expression for the tangent modulus is obtained by differentiating 12$
E.
1 +°o
n nf 1 + Epn
(16)
This expression is referred to as the Richard tangent modulus throughout this paper0

CHAPTER 3
METHOD OP SOLUTION
Finite Element ModelThe cross section of several wide flange shapes was idealized
as being composed of three rectangles with dimensions "b9 &„ t@ and w as shown in Fig, 6, Residual stresses were assumed to be constant across the thicknesses of both the flange and the web, A symmetrical residual stress pattern* which is consistent with cooling residual stresses, was assumed. One flange was divided into finite elements from center to tip, and the web was divided into finite elements from center to flange. Typical finite elements are shown in Fig, 6, The effective average stress on the section, o^, is given by8
where is the number of elements in the half flange, is the number4«of elements in the half web, is the average stress on the i ele-
Compressive stresses, strains, and loads were considered negative? tensile stresses, strains, and loads were considered positive throughout this investigation.
ment, a^ is the area of the i**1 element, and A is the total area of the section.
Sign Convention
11

12
x
yAd x
w ±tT
FIG. 6.— IDEALIZED GROSS SECTION WITH TYPICAL FINITE ELEMENTS
T w ^ r r r n T ^ . (c)
% (T)
^rfTlTcrtf (C) 5h (T)
(=)
T-04-
L
tw
i l u ^ ,c)
T-cf
FIG, 7.— LINEAR RESIDUAL STRESS DISTRIBUTION
FIG. 8,— TYPICAL PARABOLIC RESIDUAL STRESS DISTRIBUTION

Residual Stress Patterns Two idealizations of the true residual stress pattern were
used. The linear residual stress pattern has "been used "by Driscoll et ale (5) and Galambos (6) as a close approximation for the residual stress distribution in ASTM A? steel ¥ 8x31 sections. The parabolic pattern appears to be a close approximation to the residual stress distribution in several ASTM A? steel sections, such as the ¥ 12x65 (l). Investigations by Huber and Beedle (8) and Beedle and Tall (l) have shown that the actual residual stress distribution usually falls somewhere between these two patterns.
Linear Residual Stress PatternThe linear residual stress pattern (Fig, 7) assumes residual
compression in the flange tips and a uniform tension in the web, with a linear variation in the stress from the center to the tips of the flange (5*6), The equation for the residual stress as a function of the distance from the center of the flange is;
^ x) = *w - b/2 (ow “ °tf) ' (18)where x is the distance from the center of the flange (Fig, 6), 0^ is the stress in the web, and 0^ is the stress in the tip of the flange.
If the residual stress in the tip of the flange is known, the residual stress in the web can be determined from equilibrium;
jf <^es dA = 0 = cr, (d - 2t) w + tb/2
where <r _ is the residual stress on the. infinitesimal area dA„

14Solving for givesi
wC, " " (-W- 4. °4-p (1?)bfc +' (d-2t jw/ tfThe average stress for the 1 finite element^ o , 1st
°i “ g'Li g ■— (20)where 0 ^ is the stress on the left side and 0^ is the stress on the right side of the 1 element„ Thus, the entire linear residual stress distribution can be determined if the stress at the flange tip is 1known0
Parabolic Residual Stress PatternThe parabolic residual stress pattern (Fig„ 8) assumes residual
compression in the flange tips with the stress in the flange varying parabolieally about the center of the flange and the stress in the web varying parabolieally about the center of the web» The equation for residual stress as a function of the distance from the center of the flange is 8
. ,2” ‘’k ' [bTzJ (<rof - °tf) (21)
where x is the distance from the center of the flange (Fig, 6), cr^ isthe stress in the center of the flange, and is the stress in the tip of the flange0 Similarly, the stress as a function of the distance from the center of the web is 8
* °'c» - (afe) ("'m - " U (22)where y is the distance from the center of the web (Fig, 6), cr^ is the

15stress in the center of the weh^ and is the stress in the top of the web6.
For equilibriums, rb/2 i ,2
J^TBB ^ " G = V 0 L^Of “ W (°Cf “ °tf t dx
+ 2J 0 Lfcw • (#) - 0't„>w dyIntegrating and applying limits j noting that o^w - crf 8 gives s
(3
cf
ft - «)% w w (I " ™L ^2‘ (23)
If .<rcf and are known', them
cr = ew
2 W , ta ft - t)”3” T I F ”
A
(I -1) " 5(I “ *) H
>
y,th
(24)
The average stress for the i finite element, is found by Simpson8s Buies
^i°Li + °Mi * °Ri (25)
where is the stress on the left side',' is the stress on the right side'," and is the stress in the center of the i *1 element cThus',' if the residual stresses at the center and tip of the flange

are known9 the complete parabolic residual stress distribution can be determinedc
Column CurvesThe stress-strain curve for the column material was represented
by the Richard equation (Eq* 12),' The residual stress distribution on the section was idealized as being either linear or parabolicg and the average stress on each finite element was obtained by Eq* 20 for the linear pattern or by Eq® 25 for the parabolic pattern. The average residual strain for each element was then determined by Eq„ 11*
The effective stress-strain curve for the section was obtained by adding increments of strain to the section* The applied strain on the sectionj, was added to the residual strain of each finite element* The stress on each element was then determined by Eq, 12V and the effective stress on the section* cr * was obtained by Eq, 17* The effective stress-strain curve was nondimensionalized by plotting c^/cr versus
Ve0.For an applied effective strain of 6,0* the effective stress*
o s> corresponds to cr (Fig* 4)s, and the shape parameter for the effective stress-strain curve was determined by EqV 15, This shape parameter was used in Eq, 16 to calcuate the effective tangent modulus* E^* for the section for each increment of strain*
Column curves were nondimensionalized by plotting cT/V versus
ICEjthe nondimensional slenderness parameter* * A - — i/—r— , for each in-. I TiE
crement of strain* Setting the effective stress* o * equal to the

critical "buckling stress, tr , the critical value of the slendernessoratio8 KL/rf was obtained from Eqe 7
For weak axis buckling of mild steel columns, the critical slenderness ratio, KL/r, was obtained from Eq0 8s

CHAPTER 4
INFLUENCE OF RESIDUAL STRESS ON COLUMN STRENGTH
The finite element model, discussed previously, was used to study the influence of the magnitude and distribution of residual stresses on the effective stress-strain and column strength curves»A GDC 6400 computer was used to obtain solutions6
Analytical Results Two different residual stress patterns with varying magnitudes
of the maximum compressive residual stress were applied to three column sections0 The residual stress patterns used were the linear pattern (Fig0 7) and the parabolic pattern (Figs 8) with 0^ - - e Usingthese two patterns, the maximum compressive residual stress, or^, occurred at the flange tips for the three column sectionse
The W 8x31» W 12x65$ and W 14x426 column sections were used. These sections represent a wide variation in dimensions, particularly in flange and web thicknesses, The ¥ 8x31 section has been used extensively for experimental work, and a number of measurements of residual stresses for this section have been made by Huber and Beedle (8) and by Beedle and Tall (l).
The column material was taken as mild steel with a yield stress, <r., of 36 ksi and Young9s modulus of 29 x 1(P ksi. The stress-strain curve was idealized by the Richard equation (Eq0 12) with a shape
18
19
Stress cr (ksi)
20
0004 0012 .001600080.0 0020Strain 6, (in/in)
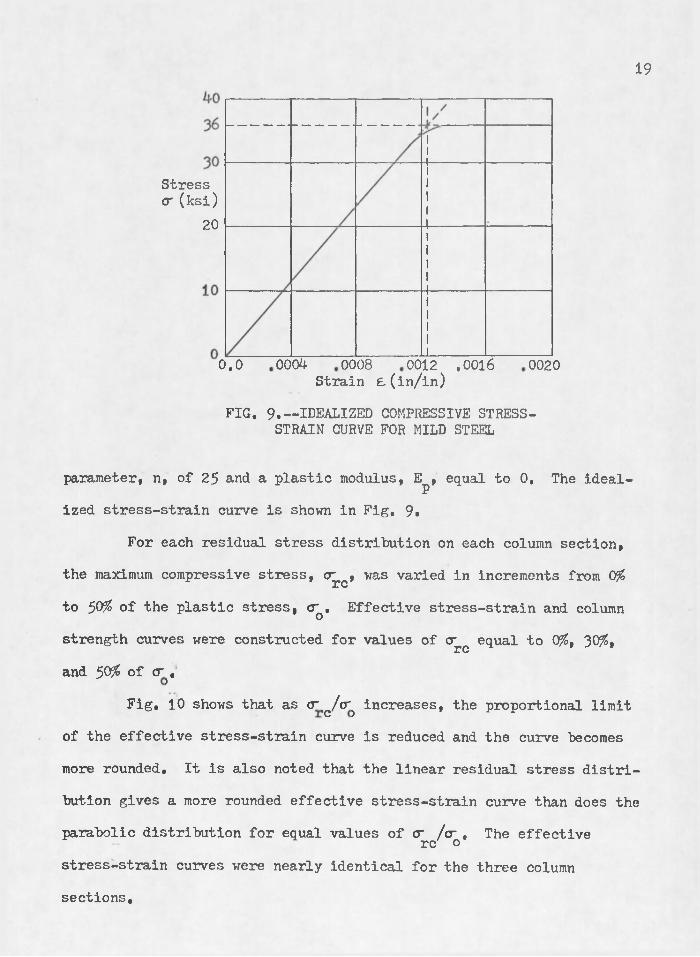
FIG. 9.— idealized COMPRESSIVE STRESS- STRAIN CURVE FOR MILD STEEL
parameter, n, of 25 and a plastic modulus, E , equal to 0. The idealized stress-strain curve is shown in Fig, 9,
For each residual stress distribution on each column section, the maximum compressive stress, o^, was varied in increments from 0% to 50% of the plastic stress, 0 , Effective stress-strain and column strength curves were constructed for values of o^c equal to 0%, 30%, and 50% of cre
Fig, 10 shows that as tr /cr increases, the proportional limit of the effective stress-strain curve is reduced and the curve becomes more rounded. It is also noted that the linear residual stress distribution gives a more rounded effective stress-strain curve than does theparabolic distribution for equal values of cr /cr , The effectiverc ostress-strain curves were nearly identical for the three column sections.

20
1.00
0.90
0.80
W 8x31, W 12x65, and W 14x426 Column Sections0.70
Linear Residual Stress Distribution
0.60 Parabolic Residual Stress Distribution
0.500,40 0,60 0.80 1.00 1.401.20
FIG. 10.— EFFECTIVE COMPRESSIVE STRESS-STRAIN CURVES

21The effective shape parameter, ne» was obtained for each effec
tive stress-straln.curve by Eq, 15a Fig, 11 shows the value of n@ plotted versus c^/o^ for each residual stress distribution* It Is observed that the linear pattern has lower values of ng than does the parabolic pattern. This corresponds to a more rounded effective stress- strain curve. Values for n@ for the three column sections agreed within 2^e
Using the value for ne for each effective stress -strain curve", . the effective tangent modulus, E^, was obtained by Eq, 16, Pig, 12 shows E^/E versus e/e , and Fig, 13 shows E^/E versus o^/or, These curves are for the ¥ 8x31 section. Similar curves were obtained for the other two column sections.
The influence of residual stress on column strength curves is shown in Fig, 14 for strong axis bending and in Fig, 15 for weak axis bending. For both strong and weak axis bendingg" the critical buckling stress, c e decreases as or /cr increases. For equal values of cr /<r ,C O 5TC Othe assumed parabolic residual stress distribution gives a higher value of or/cr than does the linear distribution. These curves are for the ¥ 8x31 section.
The average value of cr^ is approximately 0,3 (4), Columnstrength curves for both strong and weak axis bending of the ¥ 8x31section for the linear residual stress distribution with cr =0,3 <Trc • oare shown in Fig, 16 along with the Column Research Council (4) column strength curve.

22
25Parabolic Residual Stress Distribution
20Linear Residual Stress Distribution
15
ne
10
W 8x31» W 12x65, and V 14x426 Column Sections5
0 _ 0.00 0.10 0.400.20 0.30
crrcFIG. 11.— INFLUENCE OF RESIDUAL STRESS DISTRIBUTION
ON THE EFFECTIVE SHAPE PARAMETER, n^

23
1.00
rc'0.80
0.60
E /E
0.40
0.20
0.000.00 0.40 0.80 1.20 1.60 2.00
e/£o
FIG. 12.— INFLUENCE OF RESIDUAL STRESS DISTRIBUTIONON E /E VS. &/& m o
W 8x31 Column SectionLinear Residual Stress Distribution Parabolic Residual Stress Distribution

24
1.00
0.80
0.60
E/E
0.40
W 8x31 Column SectionLinear Residual Stress Distribution0.20
Parabolic Residual Stress Distribution
0.000.00 0.40 0.600.20 0.80 1.00
FIG. 13.— INFLUENCE OF RESIDUAL STRESS DISTRIBUTIONON E /E VS. <r/cr m e' o

1.00Euler Curve
re0.80
0.60
<V<r
0.40
W 8x31 Column SectionLinear Residual Stress Distribution0.20Parabolic Residual Stress Distribution
0.00 0.400,00 0.80 1.60 11.20 2.00cr
Slenderness Function A= —
FIG. 14,— INFLUENCE OF RESIDUAL STRESS DISTRIBUTIONON STRONG AXIS BENDING

26
1.00
Euler Curve
rc‘0.80
0.60
cr
0.40
W 8x31 Column SectionLinear Residual Stress Distribution0.20Parabolic Residual Stress Distribution
0.00 — 0.00 0,40 0.80 1.601.20 2.00Slenderness Function A 1 KL °o
FIG. 15.— INFLUENCE OF RESIDUAL STRESS DISTRIBUTIONON WEAK AXIS BENDING

27
1.00
Strong Axis Bending CRC Curve
0.80Weak Axis Bending
0.60
cr
0.40
W 8x31 Column SectionLinear Residual Stress Distribution<r/cr = 30%
0.20
0.00 0.400.00 0.80 1.601.20 2.00KLSlenderness Function A 1
FIG. 16.— COMPARISON OF ANALYTICAL AND COLUMN RESEARCH COUNCIL COLUMN STRENGTH CURVES

28Comparison with Experimental Results
Huber and Beedle (8) determined residual stresses in a number of ¥ 8x31 mild steel columnse Based on their measurements, a linear residual stress pattern with c^c = 12®5 ksi and = 36 ksi was used to obtain column strength curves analytically as beforee Fige 17 shows these column strength curves along with results of column tests performed by Huber and Beedle (8), Over 75% of the experimental results lie within of the analytically obtained column strength curvese
/

29
1.00
0.80
o.6o
" A
0.40
0.20
0.00
Annealed Weak Axis Tests by Huber and Beedle (8)
Annealed Strong Axis BendingAnnealed Weak Axis Bending
W 8x31 Column Section
As-rolled Strong Axis Bending----- As-rolled Weak Axis Bending
n As-rolled Strong Axis Tests by Huber and Beedle (8)
o As-rolled Weak Axis Tests by Huber and Beedle (8)
0.00 0.40 0.80 1.20 1.60
Slenderness Function A~ —r lliTE
2.00
FIG. I?.— COMPARISON OF ANALYTICAL AND EXPERIMENTAL RESULTS FOR A MEASURED RESIDUAL STRESS DISTRIBUTION

CHARTER 5
APPLICATION TO STUB COLUMN TESTS
The effective stress-strain curve obtained from a stub column test may be idealized by the Richard equation (Eqe 12), using Eq„ 15 to obtain the effective shape parameter, nQ, The expression for the effective tangent modulus, E^, may then be obtained by Eq. l6e
Steel ColumnsThe average stress-strain curve for mild steel stub columns,
obtained from a number of stub column tests by Beedle and Tall (l), is shown in Fig. 18, This curve was approximated by the Richard equation (Eq. 12) with E = 29 x 10^ ksi, = 0, <Tq - 3^e5 ksi, - 30,8 ksi, and ne = 6.1, Fig, 19 shows the column strength curves obtained analytically by using the Richard tangent modulus (Eqe 16), Results of column tests by Beedle and Tall (l) are also shown. There is some scatter in test results, but the analytically obtained curves appear to lie close to the mean, with of the experimental results lying within b% of the analytically obtained curves. This scatter was also present on cr versus L/r curves by Beedle and Tall (i)0
30

31
—
(ksi)20
0.00 .0004 .0008 .0012 .0016 .0020Strain 6 (in/in)
FIG. 18.— COMPRESSIVE STRESS-STRAIN CURVE FOR MILD STEEL COLUMNS

32
1.00Strong Axis Bending
Weak Axis Bending0.80
o.6o
<r /cr
0.40
Q Strong Axis Tests by Beedle and Tall (l)
0.20 o Weak Axis Tests by Beedle and Tall (l)
0.001— 0.00 0.40 1.600.80 1.20 2.00
Slenderness Function 7K- KL %
FIG. 19.— COLUMN STRENGTH FOR MILD STEEL COLUMNS BASED ON STUB COLUMN TEST RESULTS
i

Aluminum Columns The stress-strain curve, obtained by Brungraber and Clark (3),
for the parent metal for a number of built up aluminum columns is shown in Fig, 20, This stress-strain curve was approximated by the Richard equation (Eq, 12) with E = 10 x 10^ ksi, = 330 ksi, 0^=41 ksi,0 == 36,3 ksi, and n^ = 5#8, Fig, 21 shows the column strength curve obtained analytically by using the tangent modulus from Eq, 16,Results of column tests on the parent metal by Brungraber and Clark (3) are also shown. Excellent agreement between analytical and experimental results was obtained.
f-u__
(ksi)
0.00 .002 .004 .006 .008 .010Strain £ (in/in)
FIG. 20.— COMPRESSIVE STRESS-STRAIN CURVE FOR 6061 T-6 ALUMINUM STUB COLUMN

34
1,00
0,80
o Column Test Results by Brungraber and Clark (3)
0.001.60 —I.0,80 1,20
crKLSlenderness Function A
FIG. 21.“-COLUMN STRENGTH FOR 6061 T-6 ALUMINUM COLUMNS BASED ON STUB COLUMN TEST RESULTS
CHAPTER 6
SUMMARY AND CONCLUSIONS
Effective stress-strain curves P obtained from either a known residual stress distribution or from stub column tests, were approx™ imated by the Richard equation. An analytical expression for the effective tangent modulus was then used to predict column strength,■
If the residual stress distribution is known or assumed, or if stub column test results are available, a continuous analytical expression for the tangent modulus may be. used to accurately predict column strength.
35

LIST OF REFERENCES
1« Beedle, L„ S», and Tall, L,, "Basic Column Strength," Journal ofthe Structural Divisione ASCE, Vol. 86, No, ST?, Proc, Paper 2555,
. July, i960, pp. 139-173.2, Brockenbrough, R0 Le, and Johnston, B, G,, USS Steel Design
Manual, United States Steel Corporation, Pittsburgh, Pa,, 1968®3, Brungraber, Re J,, and Clark, J® W,9 "Strength of Welded Aluminum
Columns," Journal of the Structural Division, ASCE, Vol» 86, No,• ST8, Proca Paper 25^19 Aug,, 19^0, pp. 33-57,4, Column Research Council Guide to Design Criteria for Metal Com
pression Members, 2nd ed,, Ba Johnston, ede, John Wiley and Sons, I n c N e w York, NeYe, 1966,
5» Driscoll, G, C, Jre, Beedle, L, S,, Galambos$ T, V,, Lu, Le,Fisher, J, W., Ostapenko, A,, and Daniels, J, H,, Plastic Design of Multistory Frames, Lehigh University, Fritz Engineering Laboratory Report No, 273,20, Bethlem, Pa,, 1965, pp, 4,6 1-,7,
, 6, Galambos, T, V,, Structural Members and Frames, Prentice-Hall,Inco, Englewood Cliffs, N,J,, 1968. '
7® Goldberg, J, E,, and Richard, R, M,, "Analysis of Nonlinear Structures," Journal of the Structural Division, ASCE, Vol, 89, No. ST4, Proc, Paper 3^04, Aug., 19^3, PP. 333-351.
8, Huber",' A, W « a n d Beedle, L, S,, "Residual Stress and the Compressive Strength of Steel," Welding Journal, Vol. 33$ Dec,,1954, pp® 589-614®
9@ Ramberg, W®, and Osgood, W® R® $ "Description of Stress-StrainCurves by Three Parameters," Technical Note No® 902® National Advisory Commission for Aeronautics, Washington, D,C,, 1943®
10® Richard, R® M®, "An Elastic-Plastic Stress-Strain Relationship," Unpublished Paper®
11® Shanley, F® R®, Strength of Materialse McGraw-Hill Book Co®, Inc®, New York,' N®Y®, 1957®
12® "The Basic Column Formula," CRC Tech® Memo No® 1® May, 1952®
36

YuV G, K,, and Tall, L., "Significance and Application of Stub Column Test Results," Journal of the Structural Divisions ASCE, Vol, 97$ No« STTV Proc, Paper 8231$ July, 1971$ PP» 1841-18618
