combination of active ingredients in a single...
TRANSCRIPT

UNIVERSITÀ DEGLI STUDI DI PARMA UNIVERSITÉ DE BORDEAUX
CO-TUTORSHIP DOCTORATE IN
DRUGS, BIOMOLECULES AND HEALTH PRODUCTS
Cicle XXIX
COMBINATION OF ACTIVE INGREDIENTS IN A SINGLE SOLID FORM FOR ORAL ADMINISTRATION:
STUDY OF FORMULATION AND CRITICAL COMPRESSION PARAMETERS
Coordinator: Prof. Marco Mor Tutor: Prof. Alessandra Rossi Prof Pierre Tchoreloff
PhD Candidate: Luca Castrati

I
INDEX
Sunto ......................................................................................................................................... 1
Résumé ...................................................................................................................................... 5
Thesis Introduction ..................................................................................................................... 9
1 Introduction ...................................................................................................................... 10
1.1 Inflammation ....................................................................................................................... 10
1.1.1 Therapeutic solutions ............................................................................................................................... 12
1.1.1.1 Ibuprofen ......................................................................................................................................... 14
1.1.1.2 Sucralfate......................................................................................................................................... 15
2 Aim of the research work .................................................................................................. 18
Chapter I .................................................................................................................................. 19
1 Introduction ...................................................................................................................... 20
1.1 Multilayer tablets ................................................................................................................ 20
1.2 Quality by Design approach .................................................................................................. 21
1.3 Manufacturing of a multilayer dosage form .......................................................................... 23
2 Aim of the research work .................................................................................................. 29
3 Materials and methods ..................................................................................................... 30
3.1 Materials ............................................................................................................................. 30
3.2 Methods .............................................................................................................................. 30
3.2.1 Preparation of sucralfate granulate .......................................................................................................... 30
3.2.2 Preparation of the ibuprofen lysine granulate ......................................................................................... 32
3.2.3 Particle size distribution analysis of the granulate ................................................................................... 32
3.2.4 Determination of water content of granulate by TGA .............................................................................. 33

II
3.2.5 Multilayer tablet manufacturing ............................................................................................................... 33
3.2.6 Tablets characterization............................................................................................................................ 36
3.2.6.1 Dimensional measures .................................................................................................................... 36
3.2.6.1.1 “In die” dimensions .................................................................................................................... 36
3.2.6.1.2 “Out of die” dimensions ............................................................................................................. 36
3.2.6.2 Breaking strength test ..................................................................................................................... 37
3.2.7 Tablet disintegration test .......................................................................................................................... 38
4 Results and discussion....................................................................................................... 38
4.1 Bilayer tablet of ibuprofen lysine/ sucralfate ........................................................................ 39
4.1.1 Stability test of bilayer tablets of sucralfate/ibuprofen lysine.................................................................. 42
4.1.2 Sucralfate layer Water Content versus Elastic Recovery .......................................................................... 45
4.1.3 Single layer Water content vs Time .......................................................................................................... 49
4.2 Cylindrical monolayer tablets ............................................................................................... 51
4.2.1 Cylindrical tablets monolayer of Sucr_1 ................................................................................................... 51
4.2.2 Cylindrical tablets monolayer of sucralfate Sucr_2 .................................................................................. 54
4.2.2.1 Sucralfate monolayer disintegration test ........................................................................................ 58
4.2.3 Cylindrical monolayer tablets of ibuprofen lysine .................................................................................... 60
4.2.3.1 Ibuprofen lysine monolayer disintegration test .............................................................................. 63
4.2.4 Cylindrical bilayer tablets of sucralfate/ibuprofen lysine ......................................................................... 64
4.2.4.1 Cylindrical bilayer tablets Sucr_1/Ibuprofen lysine ......................................................................... 64
4.2.4.2 Cylindrical bilayer tablets Sucr_2 / Ibuprofen lysine ....................................................................... 66
4.2.4.3 Comparison of the ejection energies of the sucralfate/ibuprofen lysine cylindrical bilayer tablets
68
4.2.4.3.1 Disintegration time the sucralfate/ibuprofen lysine cylindrical bilayer tablets ......................... 69
4.2.5 Oblong bilayer ........................................................................................................................................... 70
4.2.5.1 Oblong bilayer tablets Sucr_1/Ibuprofen lysine .............................................................................. 70
4.2.5.2 Oblong bilayer Sucr_2/Ibuprofen lysine .......................................................................................... 72
III
4.2.5.3 Comparison of the ejection energies of the sucralfate/ibuprofen lysine cylindrical bilayer tablets
73
4.2.6 Oblong three-layers tablets ...................................................................................................................... 74
5 Conclusions ....................................................................................................................... 77
Chapter II ................................................................................................................................. 78
1 Introduction ...................................................................................................................... 79
1.1 Problematics encountered during the production of multi-layer tablets of ibuprofen lysine and
sucralfate ......................................................................................................................................... 79
1.1.1 Testing the interfacial strength of a multi-layer tablet ............................................................................. 80
1.1.2 Testing the influence of the shape of the interface on the strength of a multi-layer tablet .................... 81
2 Purpose ............................................................................................................................ 84
3 Comparison of breaking tests ............................................................................................ 85
3.1 Materials and Methods ........................................................................................................ 85
3.1.1 List of excipients ....................................................................................................................................... 85
3.1.2 Manufacturing of tablets .......................................................................................................................... 85
3.1.3 Tablets testing ........................................................................................................................................... 87
3.1.3.1 Diametrical Breaking Test applied to bilayer compacts: ................................................................. 88
3.1.3.2 Indentation Test .............................................................................................................................. 88
3.1.3.3 Shear Test ........................................................................................................................................ 89
3.1.4 Numerical Simulation................................................................................................................................ 89
3.2 Results and Discussion ......................................................................................................... 90
3.2.1 Observation of the fracture mechanisms during the different tests ........................................................ 90
3.2.1.1 Diametrical Breaking Test................................................................................................................ 90
3.2.1.2 Shear test ........................................................................................................................................ 93
3.2.1.3 Influence of the dimensional properties of the tablet .................................................................... 94
3.2.2 Indentation test ........................................................................................................................................ 96

IV
3.2.2.1 Numerical Simulation of indentation test ....................................................................................... 98
3.2.3 Experimental results for batches 1 and 2. ................................................................................................ 99
3.3 Conclusions ........................................................................................................................ 102
4 Effect of the shape on the interfacial strength ................................................................. 103
4.1.1 Materials and methods ........................................................................................................................... 103
4.1.1.1 List of excipients ............................................................................................................................ 103
4.1.1.2 Tablet production .......................................................................................................................... 103
4.1.2 Tablet testing .......................................................................................................................................... 105
4.1.2.1 Indentation test ............................................................................................................................. 105
4.1.2.2 Dimension measuring .................................................................................................................... 105
4.1.3 Statistical Analysis ................................................................................................................................... 106
4.2 Results and discussion ........................................................................................................ 107
4.2.1 Shape of the interface............................................................................................................................. 107
4.2.2 Study of the interfacial strength ............................................................................................................. 110
4.3 Conclusion ......................................................................................................................... 115
5 Design of Experiment of a bilayer tablet of Ibuprofen Lysine/Sucralfate .......................... 116
5.1.1 Materials and Methods ........................................................................................................................... 116
5.1.1.1 Preparation of Ibuprofen Lysine formulation ................................................................................ 116
5.1.1.2 Preparation of Sucralfate formulation .......................................................................................... 117
5.1.2 Tablet manufacturing.............................................................................................................................. 119
5.1.3 Design of experiment .............................................................................................................................. 119
5.1.4 Tablet analysis ......................................................................................................................................... 121
5.1.4.1 Breaking strength test ................................................................................................................... 121
5.1.5 Storage conditions .................................................................................................................................. 122
5.2 Results and discussion ........................................................................................................ 122
5.2.1.1 Responses and statistical analysis ................................................................................................. 122
5.2.2 Optimization of the factor ...................................................................................................................... 126

V
6 Conclusions ..................................................................................................................... 128
Thesis Conclusions .................................................................................................................. 129
Conclusions ............................................................................................................................ 130
REFERENCES ........................................................................................................................... 131
LIST OF PUBLICATIONS ........................................................................................................... 134
POSTER .......................................................................................................................................... 134
PUBLICATIONS ............................................................................................................................... 134

Sunto
Il lavoro di tesi di dottorato è stato condotto nella prima metà presso l’Università degli Studi
di Parma, Dipartimento di Farmacia, e successivamente presso l’Università di Bordeaux
(FR), Dipartimento di Meccanica e Ingegneria, in accordo alla Convenzione di dottorato in
co-tutela.
Il progetto di dottorato ha riguardato lo studio dei parametri critici di compressione di una
compressa tristrato per il rilascio immediato di due farmaci in combinazione. Le compresse
multistrato sono progettate per la fabbricazione di prodotti di combinazione a dose fissa che
semplificano il regime terapeutico e potenzialmente aumentare la compliance del paziente.
In particolare, i farmaci utilizzati per la produzione della compressa multistrato sono stati un
farmaco antiinfiammatorio non stereoideo, ibuprofene lisina, e un citoprotettore, sucralfato.
Ibuprofene lisina è efficace nel trattamento di stati infiammatori, ma un’assunzione cronica
del farmaco può dare luogo, come effetto collaterale, a lesione della mucosa
gastrointestinale e formazione di ulcere. Il sucralfato è un protettore della mucosa
gastrointestinale e quindi l’utilizzo dell’ibuprofene lisina in combinazione con sucralfato può
prevenire la comparsa di ulcere.
La compressa tristrato doveva essere costituita da uno strato centrale contenente 342 mg
di ibuprofene lisina e due strati esterni contenenti ciascuno 100 mg di sucralfato.
Le compresse multistrato di sucralfato/ibuprofene lisina sono state realizzate mediante
l’utilizzo di un simulatore di compressione, che permette di produrre queste compresse in
condizioni di stretto controllo delle forze e dello spostamento dei punzoni. Il controllo dei
parametri critici di compressione è di particolare importanza nel caso della produzione di
compresse multistrato, che sono sistemi eterogenei in cui due o più strati di polveri
compattate sono separati tra loro da una interfaccia discreta. La resistenza alla rottura della
compressa e la tendenza alla separazione degli strati delle compresse multistrato

2
dipendono non solo dalla composizione dello strato, ma anche dalla proprietà di
deformazione di ogni strato durante il processo di compressione.
Durante il periodo di tesi di dottorato svolto presso l’Università degli Studi di Parma, la
ricerca ha riguardato inizialmente lo sviluppo formulativo per l’ottenimento degli strati singoli
di sucralfato e di ibuprofene lisina. Successivamente, è stato eseguito uno studio dei
parametri critici di precompressione e di compressione di una compressa bistrato, ottenuta
mediante precompressione di un strato di sucralfato e successiva compressione dello strato
di ibuprofene lisina. Sono state prodotte due tipologie di compresse bistrato di
sucralfato/ibuprofene lisina, che si differenziavano in termini di composizione della
formulazione utilizzata per la produzione dello strato di sucralfato. In un caso, il sucralfato è
stato granulato con cellulosa microcristallina mentre nel secondo caso il sucralfato è stato
granulato con una miscela di cellulosa microcristallina e lattosio. Le compresse bistrato
contenenti solo cellulosa microcristallina nello strato di sucralfato hanno mostrato il
fenomeno di separazione degli strati, durante la fase di espulsione della compressa dalla
matrice, all’aumentare delle forze di precompressione e di compressione applicate. Al
contrario, le compresse bistrato in cui era presente anche il lattosio nello strato di sucralfato,
non si è osservato separazione degli strati indipendentemente dalle forze di
precompressione e di compressione applicate.
La separazione dello strato è dovuta alla presenza di cellulosa microcristallina, che si
comporta come materiale plastico. La rugosità superficiale della cellulosa microcristallina
nel primo strato diminuisce all’aumentare della forza di precompressione, diminuendo i punti
di adesione tra i due strati adiacenti. Invece, il lattosio, materiale fragile, tende a fratturarsi
aumentando l’area superficiale disponibile e quindi l’adesione tra gli strati.
Sulla base dei risultati ottenuti dalla compressione delle compresse bistrato di
sucralfato/ibuprofene lisina, si è passato alla produzione delle compresse tristrato
utilizzando, per gli strati di sucralfato, la formulazione contenente come eccipienti la

3
microcristallina cellulosa e il lattosio. Come nel caso delle compresse bistrato, la presenza
di lattosio ha permesso l’ottenimento delle compresse tristrato senza osservare il fenomeno
di separazione degli strati al termine del processo di compressione.
Il periodo di dottorato svolto presso l’Università di Bordeaux si è concentrato su tre aspetti
differenti. Il primo è stato quello di valutare se il test riportato nella Farmacopea Europea per
la misura della resistenza alla rottura delle compresse potesse essere utilizzato anche nel
caso di compresse multistrato. Tale test consiste nell’applicare una forza diametrale sulla
compressa e misurare tale forza al punto di rottura. Dal confronto di questo test con altri due
diversi test, il test a indentazione (che applica forza tramite un punzone posizionato tra gli
strati) e il test a ghigliottina (che consiste nel tenere fermo uno strato mediate una struttura
apposita e nell’applicare forza sull’altro strato), si è concluso che il test di rottura diametrale
non è idoneo nel caso di compresse multistrato, in quanto misura esclusivamente la forza
di rottura di uno dei due strati, anziché quella di delaminazione.
Il secondo aspetto è stato quello di valutare l’influenza della forma dell’interfaccia
sull’adesione di due strati in una compressa multistrato. Si sono prodotte diverse compresse
multistrato con soli eccipienti con interfacce differenti mediante l’uso di punzoni appositi
(cilindrici, convessi, con diverso raggio di curvatura della convessità) e si è misurata la
resistenza alla rottura delle compresse bistrato mediante l’uso di un test idoneo, il testo a
indentazione, convalidato durante la prima parte del lavoro eseguito presso l’Università di
Bordeaux. Dai risultati si è evinto che le interfacce fabbricate con punzoni con curvature
tendono ad essere meno resistenti rispetto a compresse bistrato aventi un’interfaccia
completamente piatta. Si è notato come la forza di precompressione influisce sulla
creazione della curvatura dell’interfaccia, infatti a basse forze di precompressione tutte le
compresse prodotte avevano un’interfaccia piatta, quindi un’alta resistenza alla rottura,
mentre ad alte forze di precompressione i punzoni ricurvi producevano compresse con

4
un’interfaccia curva e meno resistenti e di conseguenza si osservava la separazione degli
strati in fase di espulsione dalla matrice.
Il terzo aspetto è stato quello di eseguire un disegno sperimentale basato sulla produzione
di una compressa bistrato di sucralfato e ibuprofene lisina. Il disegno sperimentale ha
incluso i fattori di produzione (drying time) delle formulazioni di sucralfato, ottenute durante
il periodo di dottorato presso l’Università degli Studi di Parma, di conservazione delle
compresse prodotte (in particolare il grado di umidità presente durante il periodo di
conservazione) e dei parametri di compressione. Dall’analisi del disegno sperimentale si è
evidenziato che il contenuto di acqua residuo nel granulato di sucralfato sia un fattore
importante nell’ottenimento della compressa bistrato. A valori alti di contenuto di acqua
residua (circa 30%) si sono ottenute compresse bistrato con bassi valori di resistenza alla
rottura. Inoltre, è stata riscontrata una correlazione tra il grado di umidità residua del
sucralfato e l’umidità dell’ambiente in cui la compressa bistrato è conservata. Infatti, quando
la differenza tra i valori di umidità residua dello strato di sucralfato e di umidità dell’ambiente
di conservazione è grande, la compressa tende ad avere una bassa resistenza alla rottura.
Viceversa, nei casi in cui la differenza tra grado di umidità presente nello strato di sucralfato
e l’umidità dell’ambiente di conservazione è ridotta, la compressa bistrato risulta avere una
maggiore resistenza alla rottura.

5
Résumé
Le travail de thèse de doctorat a été mené dans la première moitié auprès de l'Università
degli Studi di Parma, Dipartimento di Farmacia, et successivement auprès de l'Université
de Bordeaux (FR), Département de Mécanique et Ingénierie, conformément à la Convention
de co-tutelle de thèse de doctorat.
Le projet de doctorat a concerné l'étude des paramètres critiques de compression d'un
comprimé à trois couches pour le relâchement immédiat de deux médicaments en
combinaison. Les Comprimés multicouches sont projetés pour la fabrication de produits de
combinaison à dose fixe qui simplifient le régime thérapeutique et potentiellement
augmenter l'observance du patient.
En particulier, les médicaments utilisés pour la production du comprimé multicouche ont été
un médicament anti-inflammatoire non-stéroïdien, ibuprofène lysine, et un cytoprotecteur,
sucralfate. Ibuprofène lysine est efficace dans le traitement d'états inflammatoires, mais un
emploi chronique du médicament peut provoquer, comme effet indésirable, la lésion de la
muqueuse gastro-intestinale et la formation d'ulcères. Le sucralfate est un protecteur de la
muqueuse gastro-intestinale et donc l'emploi de l'ibuprofène lysine en combinaison avec le
sucralfate peut prévenir l'apparition des ulcères.
Le comprimé à trois couches devait être constitué d'une couche centrale contenant 342 mg
d'ibuprofène lysine et deux couches extérieures contenant chacune 100 mg de sucralfate.
Les comprimés multicouches de sucralfate/ibuprofène lysine ont été réalisés avec
l'utilisation d'un simulateur de compression, qui permet de produire ces comprimés dans
des conditions de strict contrôle des forces et du déplacement des poinçons. Le contrôle
des paramètres critiques de compression est de grande importance dans le cas de la
production de comprimés multicouches, qui sont des systèmes hétérogènes dans lesquels
deux ou plus couches de poussières compactes sont séparées parmi eux par une interface

6
discrète. La résistance à la rupture du comprimé et la tendance à la séparation des couches
des comprimés multicouches ne dépendent pas seulement de la composition de la couche,
mais également de la propriété de déformation de chaque couche pendant le procès de
compression.
Pendant la période de thèse de doctorat déroulée auprès de l'Università degli Studi di
Parma, la recherche a concerné initialement le développement de la formule pour l'obtention
des couches individuelles de sucralfate et d’ibuprofène de lysine. Successivement, l'on a
effectué une étude des paramètres critiques de pré-compression et de compression d'un
comprimé à deux couches, obtenu par la pré-compression d'une couche de sucralfate et la
compression successive de la couche d'ibuprofène de lysine. L'on a produit deux types de
comprimés à deux couches de sucralfate/ibuprofène lysine, qui se diversifiaient en termes
de composition de la formulation utilisée pour la production de la couche de sucralfate. Dans
un cas, le sucralfate a été granulé avec de la microcrystalline cellulose, pendant que dans
le deuxième cas le sucralfate a été granulé avec un mélange de microcrystalline cellulose
et lactose. Les comprimés à deux couches contenant seulement de la microcrystalline
cellulose dans la couche de sucralfate ont montré le phénomène de séparation des
couches, pendant la phase d'expulsion du comprimé de la matrice, avec l'augmentation des
forces de pré-compression et de compression appliquées. Au contraire, dans les comprimés
à deux couches où il y avait même le lactose dans la couche de sucralfate, l'on n'a pas
observé de séparation des couches indépendamment des forces de pré-compression et de
compression appliquées.
La séparation de la couche est due à la présence de cellulose microcristalline, qui se
comporte comme matériel plastique. La rugosité superficielle de la cellulose microcristalline
dans la première couche diminue avec l'augmentation de la force de pré-compression, en
diminuant les points d'adhésion entre les deux couches adjacentes. Par contre, le lactose,

7
matériel fragile, tend à se fracturer en augmentant l'aire superficielle disponible et donc
l'adhésion parmi les couches.
Su la base des résultats obtenus de la compression de comprimés à deux couches de
sucralfate/ibuprofène lysine, l'on a procédé à la production de comprimés à trois couches
en utilisant, pour les couches de sucralfate, la formulation contenant comme excipients la
microcristalline cellulose et le lactose. Comme dans le cas de comprimés à deux couches,
la présence de lactose a permis l'obtention des comprimés à trois couches sans observer
le phénomène de séparation des couches à la fin du procès de compression.
La période de doctorat déroulée auprès de l'Université de Bordeaux s'est concentrée sur
trois aspects différents. Le premier aspect a été celui d'évaluer si le test rapporté dans la
Pharmacopée Européenne pour la mesure de la résistance à la rupture de comprimés
pouvait être utilisé même dans le cas de comprimés multicouches. Ce test consiste à
appliquer une force diamétrale sur le comprimé et mesurer telle force au point de rupture.
De la comparaison de ce test avec deux autres tests différents, le test à indentation (qui
applique la force par un poinçon positionné parmi les couches) et le test à guillotine (qui
consiste à maintenir une couche immobile avec une structure appropriée et à appliquer une
force sur l'autre couche), l'on a conclu que le test de rupture diamétrale n'est pas correct
dans le cas de comprimés multicouches, parce qu'il mesure exclusivement la force de
rupture d'un des deux couches, plutôt que celle de délamination.
Le deuxième aspect a été celui d'évaluer l'influence de la forme de l'interface sur l'adhésion
de deux couches dans un comprimé multicouche. L'on a produit plusieurs comprimés
multicouches seulement avec des excipients avec des interfaces différentes à travers
l'emploi de coinçons appropriés (cylindriques, convexes, avec un rayon différent de
courbure de la convexité) et l'on a mesuré la résistance à la rupture des comprimés à deux
couches par l'emploi d'un test correct, le test à indentation, validé pendant la première partie
du travail effectué auprès de l'Université de Bordeaux. Des résultats, l'on a observé que les

8
interfaces fabriquées avec des poinçons avec des courbures tendent à être moins
résistantes par rapport à des comprimés à deux couches ayant une interface complètement
plate. L'on a remarqué comme la force de pré-compression influence la création de la
courbure de l'interface, en effet à des basses forces de pré-compression tous les comprimés
produits avaient une interface plate, donc une haute résistance à la rupture, alors que avec
des hautes forces de pré-compression les poinçons courbes produisaient des comprimés
avec une interface courbe et moins résistants et par conséquent l'on observait la séparation
des couches dans la phase d'expulsion de la matrice.
Le troisième aspect a été celui d'élaborer un dessin expérimental basé sur la production
d'un comprimé à deux couches de sucralfate et ibuprofène lysine. Le dessin expérimental a
inclus les facteurs de production (drying time) des formulations de sucralfate, obtenues
pendant la période de doctorat auprès de l'Università degli Studi di Parma, de conservation
de comprimés produits (en particulier le degré d'humidité présent dans la période de
conservation) et des paramètres de compression. De l'analyse du dessin expérimental l'on
a remarqué que le contenu d'eau restant dans le granulé de sucralfate est un facteur
important dans l'obtention de comprimé à deux couches. Avec des valeurs hautes de
contenu d'eau restant (environ de 30%) l'on obtient des comprimés à deux couches avec
des basses valeurs de résistance à la rupture. En outre, l'on a constaté une corrélation entre
le degré d'humidité restant du sucralfate et l'humidité de l'environnement dans lequel le
comprimé à deux couches est conservé. En effet, là où la différence entre le degré
d'humidité du sucralfate et l'humidité de l'ambient de conservation est plus elevée, le
comprimé tend à avoir une basse résistance à la rupture. Vice-versa, dans les cas où la
différence entre le degré d'humidité de sucralfate et l'humidité de l'environnement de
conservation est faible, le comprimé à deux couches résulte avoir plus de résistance à la
rupture.

9
Thesis Introduction

10
1 Introduction
1.1 Inflammation
Inflammation is a biological automatism that occurs at the level of a vascularized tissue in
response to a damage. It is basically a protective response on the part of the body in order
to eliminate the initial cause of cell injury; in some cases, the inflammation, if not properly
controlled, can cause damage and disease [1]. Each stimulus can give rise to a response.
At the macro level, it is manifested by the cardinal signs of inflammation: rubor, tumor, calor,
dolor and functio laesa [2, 3].
The inflammatory response is characterized by three distinct phases [4]:
1. erythematous acute phase, in which there is an increase in capillary permeability,
vasodilation and release of chemical mediators, such as histamine, serotonin,
eicosanoids, cytokines;
2. delayed subacute phase, in which infiltration of leukocytes and phagocytes in the site
of inflammation is mainly observed;
3. chronic proliferative phase, characterized by tissue degeneration and fibrosis.
The chemical mediators, released during the inflammatory process, induce the biosynthesis
of eicosanoids (main mediators of inflammation) by interacting with receptors of the plasma
membrane associated proteins. As a result of this interaction, the activation of
phospholipase A2 and C occurs. The phospholipase A2 is able to hydrolyze the ester bond
existing between the arachidonic acid and phospholipids of the membrane; the acid is
released and metabolized by multiple pathways, in which the most important involves two
different enzyme systems, cyclooxygenase and lipoxygenases [5].

11
The term “eicosanoid” references to three different classes of chemical mediators:
prostaglandins, leukotrienes and thromboxane. Each of them is synthetized from the
arachidonic acid (5,8,11,14-eicosatetraenoic acid, Figure 1).
Figure 1: Chemical structure of arachidonic acid
The synthesis of prostaglandins and thromboxanes occurs through the mediation of
ubiquitous enzymes, the cyclo-oxygenase, of which three isoforms exist:
1. cyclooxygenase-1 (COX-1), isoform expressed in many tissues (gastric and intestinal
mucosa, kidneys, platelets and vascular endothelium), responsible of the production
of prostanoids;
2. cyclooxygenase-2 (COX-2), produced by the inflammatory process and expressed
constitutively in the brain and liver; It produces prostanoids that mediate
inflammation, pain and fever;
3. cyclooxygenase-3 (COX-3), recently discovered in the brain of the dog, it is a splice
variant of COX-1.
The cyclooxygenase performs two activities: endoperoxide synthase, leading to the
synthesis of prostaglandin G (PGG), and peroxidase, which converts PGG into
prostaglandin H. All other prostaglandins derive (PGD, PGE, PGF, PGI belonging to the
series 1,2 and 3) from prostaglandin H, chemically unstable. Thromboxanes and
leukotrienes derived from the action of the thromboxane synthase and lipoxygenase,
respectively, [6].

12
Inflammatory reactions are the basis for very common chronic diseases, such as rheumatoid
arthritis, atherosclerosis, as well as life-threatening hypersensitivity reactions caused by
insect stings, drugs and toxins. The arachidonic acid derivatives contribute significantly to
the maintenance of the inflammatory process; for this reason, most of the anti-inflammatory
drugs used act mainly as inhibitors of the biosynthesis of eicosanoids.
1.1.1 Therapeutic solutions
There are two classes of drugs, each one characterized by their mechanism of action [7]:
1. glucocorticoids: indirectly inhibit phospholipase A2, inducing the synthesis of
lipocortine protein that inhibits the enzyme. However, they have several side effects
that limit their use, such as suppression of the immune response, osteoporosis,
hypertension, hyperglycemia and growth retardation [8];
2. nonsteroidal anti-inflammatory drug (NSAIDs) inhibit cyclooxygenase enzymes by
blocking the biosynthesis of prostaglandins and thromboxanes [9].
NSAIDs have three main effects:
1. anti-inflammatory: by blocking the synthesis of some important mediators of the
inflammatory process (PGE2 and PGI2 in specific sites);
2. analgesic, by inhibiting the production of PGE2, a prostaglandin which helps the
allogenic activity of bradykinin and other autacoids issued in the site of inflammation;
3. antipyretic, by suppressing the hypothalamic response by inhibiting the synthesis of
PGE2.
It is believed that the therapeutic effects of NSAIDs are related to inhibition isoform COX-2,
while the side effects would result from the simultaneous inhibition of both isoforms (COX-1
and COX-2) [6].
13
The most common side effects are gastric mucosal injury and inhibition of platelets
aggregation, for which the isoform COX-1 plays a critical role. Taking advantage of the
different structural characteristics of the active site of COX-1 and COX-2 isoforms, NSAIDs
were synthesized for selectively inhibiting one isoform (COX-2, critical for the inflammatory
process); these inhibitors have anti-inflammatory and analgesic effects but they have no
anti-platelet aggregation activity.
The main therapeutic uses of NSAIDs include diseases such as rheumatoid arthritis,
ankylosing spondylitis, osteoarthritis, musculoskeletal pain, headache, post-operative pain,
and primary dysmenorrhea.
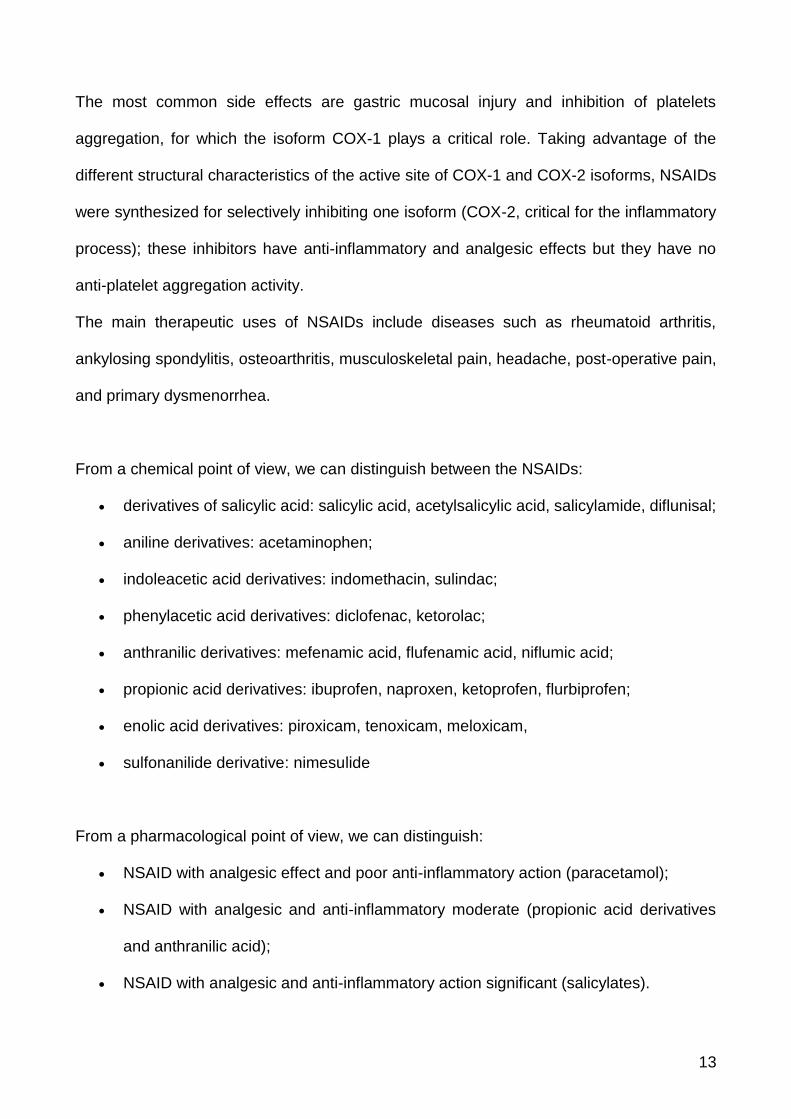
From a chemical point of view, we can distinguish between the NSAIDs:
derivatives of salicylic acid: salicylic acid, acetylsalicylic acid, salicylamide, diflunisal;
aniline derivatives: acetaminophen;
indoleacetic acid derivatives: indomethacin, sulindac;
phenylacetic acid derivatives: diclofenac, ketorolac;
anthranilic derivatives: mefenamic acid, flufenamic acid, niflumic acid;
propionic acid derivatives: ibuprofen, naproxen, ketoprofen, flurbiprofen;
enolic acid derivatives: piroxicam, tenoxicam, meloxicam,
sulfonanilide derivative: nimesulide
From a pharmacological point of view, we can distinguish:
NSAID with analgesic effect and poor anti-inflammatory action (paracetamol);
NSAID with analgesic and anti-inflammatory moderate (propionic acid derivatives
and anthranilic acid);
NSAID with analgesic and anti-inflammatory action significant (salicylates).

14
1.1.1.1 Ibuprofen
Ibuprofen ((RS)-2-(4-(2-methylpropyl) phenyl) propanoic acid) is an active ingredient
belonging to the family of NSAIDs (nonsteroidal anti-inflammatory drugs), propionic acid
derivative (Figure 2). It is Insoluble in water, soluble in acetone, methanol and methylene
chloride. Ibuprofen melts at a temperature between 75-78 °C [10].
Figure 2: Chemical structure of ibuprofen
.
Ibuprofen is marketed as a racemic mixture, although the pharmacological activity is due
almost exclusively at the isomer (S) (+). It is used as such or as lysine, arginine or sodium
salt. It is a drug having anti-inflammatory, analgesic and antipyretic activity, primarily
indicated for the treatment of clinical signs and symptoms of rheumatoid arthritis and
osteoarthritis, to relieve moderate and minor pain, to reduce fever and for the treatment of
dysmenorrhea. Ibuprofen is rapidly absorbed after oral administration; in fact, the plasmatic
concentration peak is reached in about 2 hours. It is characterized by a pk a = 4.4, it
extensively binds to plasma proteins (99%) and interacts with other acidic drugs, such as
acetylsalicylic acid and methotrexate [11]. Ibuprofen is rapidly metabolized by CYP2C9
(90%) and CYP2C19 (10%) and almost completely excreted in the urine within 24 hours.
The ibuprofen metabolism involves the formation of two catabolites: a hydroxylated-
carboxylate and one where the ibuprofen is conjugated with glucuronic acid and
excreted. Only a small fraction of the drug is excreted as unchanged; moreover, it was
observed that does not concentrate in breast milk. Ibuprofen exerts its pharmacological

15
action through inhibition of the biosynthesis of prostaglandins for the isoenzymes of
cyclooxygenase blockade (COX-1 and COX-2) and the inhibition is preferentially charged to
the inducible COX-2. It directs the metabolism of arachidonic acid towards the way of 5-
lipoxygenase resulting in increased production and release of leukotrienes. As an inhibitor
of cyclooxygenase, Ibuprofen is less powerful than ketoprofen and naproxen but more active
than propoxyphene, especially in the treatment of dental pain [12].
Ibuprofen, in the form of free acid, is characterized by a poor solubility that determines a
slow onset of therapeutic effect. To obviate this drawback saline forms, such as ibuprofen
lysine, which is more soluble and better absorbed from the gastrointestinal tract are
used. Formulations containing ibuprofen in the salt form (lysine salt or arginine salt) show a
faster absorption, a more effective reduction of pain and a more prolonged analgesic effect
compared to a formulation containing Ibuprofen (Table I) [13].
Table I: Average values of T max
Formulation T max (min)
Ibuprofen 90
Ibuprofen lysine salt 35
Ibuprofen arginine salt 29
1.1.1.2 Sucralfate
Sucralfate is a complex of aluminum hydroxide and sucrose octasolfate. His brute formula
is the following:
C12H30Al8O51S8[Al(OH)3]n[H2O]n'
16
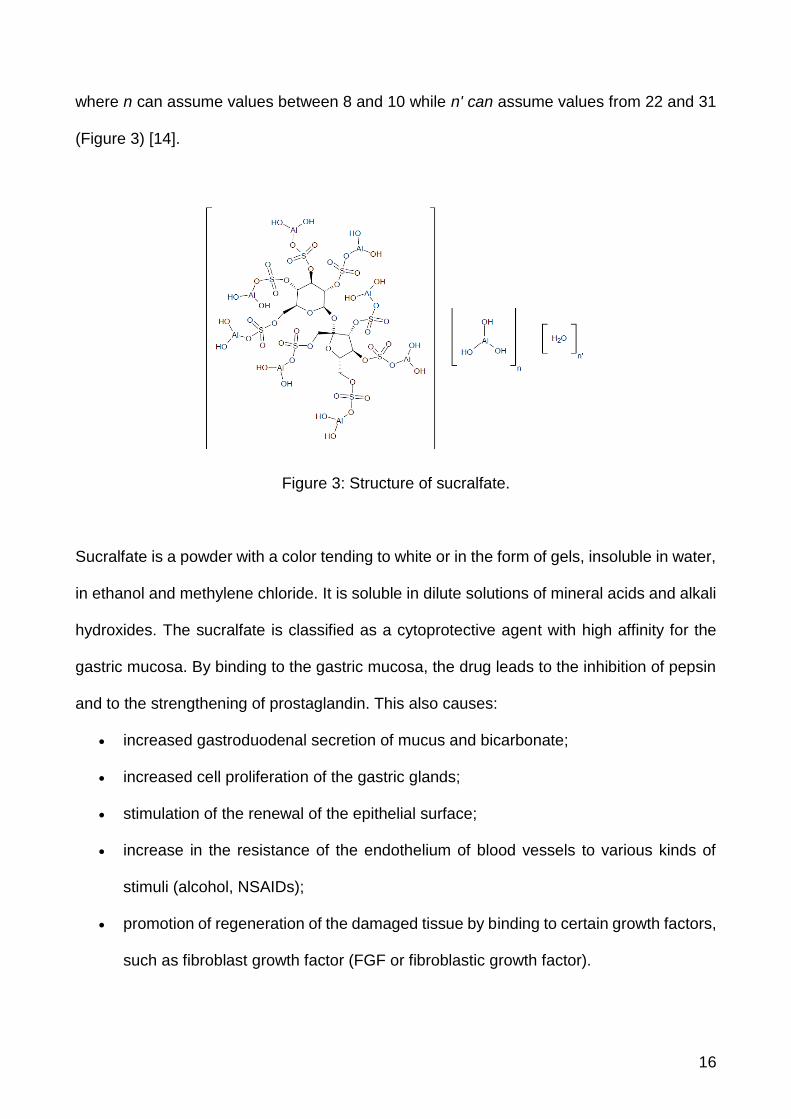
where n can assume values between 8 and 10 while n' can assume values from 22 and 31
(Figure 3) [14].
Figure 3: Structure of sucralfate.
Sucralfate is a powder with a color tending to white or in the form of gels, insoluble in water,
in ethanol and methylene chloride. It is soluble in dilute solutions of mineral acids and alkali
hydroxides. The sucralfate is classified as a cytoprotective agent with high affinity for the
gastric mucosa. By binding to the gastric mucosa, the drug leads to the inhibition of pepsin
and to the strengthening of prostaglandin. This also causes:
increased gastroduodenal secretion of mucus and bicarbonate;
increased cell proliferation of the gastric glands;
stimulation of the renewal of the epithelial surface;
increase in the resistance of the endothelium of blood vessels to various kinds of
stimuli (alcohol, NSAIDs);
promotion of regeneration of the damaged tissue by binding to certain growth factors,
such as fibroblast growth factor (FGF or fibroblastic growth factor).

17
In an acidic environment (pH<4), the sucralfate reacts with hydrochloric acid in
the stomach to form a cross-linking, viscous, paste-like compound capable to adhere to the
surface of the gastric mucosa, protecting it thanks to the formation of a bio-adhesive
barrier. The link with the gastric mucosa is based on an electrostatic/ionic interaction
between negatively charged molecules and positively charged glycoproteins in the damaged
mucosa. It is used for the treatment of various diseases of the gastrointestinal tract including
stress induced ulcer, esophagitis, duodenal ulcers, secondary gastrointestinal ulcerations
caused by NSAIDs and gastro-esophageal reflux. It is orally administered in different
pharmaceutical forms (tablets, granules and suspensions); about 5% of the administered
dose is systemically absorbed and excreted as unchanged in the urine. The remaining part
reacts with hydrochloric acid present in the stomach; not being significantly absorbed, it is
excreted in the feces. The dose is 2 g twice a day or 1 g for a maximum four times a day,
preferably before meals. Sucralfate offers a protection of gastric mucosa for a period of
about 6 hours through the formation of a paste which floats on the stomach contents. In fact,
besides as protector of the gastric mucosa it is also used to prevent or reduce
gastroesophageal reflux. It is not recommended its concomitant use with antacids or anti-
secretory drugs that cause an increase in gastric pH limiting the activation of the molecule
and the formation of the gel [15].

18
2 Aim of the research work
Multilayer tablets are proven to be an effective way of administering complex therapeutic
solutions, allowing the manufacturing of single dosage forms with multiple APIs [16].
In this case, a therapeutic solution for chronic inflammation is proposed in the form of a
multilayers tablet containing ibuprofen lysine and sucralfate.
The first part of this thesis was focused on the realization of a three-layers tablet containing
one layer of ibuprofen lysine surrounded by two layer of sucralfate. The tablet was designed
for the immediate release of the active substances into the stomach.
The second part was addressed to better comprehension of the challenges related to the
manufacture of multilayers tablets, starting from basic excipients. Finally, a design of
experiments on the formulation and process parameters was performed for the
manufacturing of a bilayer tablet of ibuprofen lysine and sucralfate.

19
Chapter I

20
1 Introduction
1.1 Multilayer tablets
The tablet is one of the most popular dosage form in use today. In particular, therapeutic
strategies based on oral delivery of bilayer (and multilayer) tablets are gaining more
acceptance among brand and generic products due to a confluence of factors including
advanced delivery strategies, patient compliance and combination therapy [16].
Recently, research has turned its attention on the development of these delivery systems
for the treatment of complex diseases, such as type II diabetes, hypertension, malaria, pain
treatment and AIDS.
Multilayer tablets are gaining popularity due to several factors:
1. Reduce the burden for patients by administering two or more active
pharmaceutical ingredients (APIs) in a single dosage form.
2. Multilayer tablets can be designed to overcome chemical incompatibility between
two active components.
3. Lastly, those tablets are also developed to control the delivery rate of one or more
APIs, by interposing layers with different release profiles.
The manufacture of multilayer tablets is a delicate procedure: it needs to ensure both the
physical and chemical stability (Critical Quality Attributes) of the tablet itself during the
industrial processing procedures (manufacturing, handling, packaging and shipping) and to
enable the activity of the drugs after the tablet administration, to reach the Target Product
Profile. The construction of such complex oral dosage forms requires on one hand the
complete control of any aspects of its formulation and compression processes, i.e. the
critical material attributes and the Critical Process Parameters, and on the other hand the
control of the release of, for example, each active substance with an individual and
controlled manner.

21
Although the manufacture of multilayer tablets has been successful for over 50 years, there
is still a need of an improvement, in order to ensure that the manufacturing process will
make possible to satisfy both technological and therapeutic specifications as well as
regulatory requirements.
Currently, in literature plenty of information can be found about the processes that intervene
during the compaction of powders and the final tablet manufacturing. However, the current
approach of analyzing the critical process parameters of compression is to use a model
formulation made of excipients (and a proper lubricant) [17]. In particular, regarding the
matter of tableting a multilayer tablet, a vast majority of the studies performed (and
published) do not take into account the complexity added by working with active ingredients,
to the final purpose of offering an innovative therapeutic solution.
Therefore, in this work of thesis, an investigation of the compression’s critical parameters of
a multilayer tablet, containing two drugs in combination, is proposed.
The multilayer system studied was a three-layer tablet, containing ibuprofen-lysine and
sucralfate in combination (on different layers), with the aim of proposing a clinical viable way
of treating inflammation, and expand the knowledge about the manufacturing of a multilayer
release system.
1.2 Quality by Design approach
Quality by Design (QbD) is a systematic, scientific, risk-based, holistic and proactive
approach to pharmaceutical development that begins with predefined objectives and
emphases process understanding and control [18]. It means designing and developing
formulations and manufacturing processes to ensure predefined product quality objectives
[19]. QbD identifies characteristics that are critical to quality from the perspective of patients,

22
translates them into the attributes that the drug product should possess, and establishes
how the critical process parameters can be varied to consistently produce a drug product
with the desired characteristics [20]. The relationships between formulation and
manufacturing process variables (including drug substance and excipient properties and
process parameters) and product characteristics are established and the variables
identified. This knowledge is then used to implement a flexible and robust manufacturing
process that can allow the manufacturing of a consistent product over time. Thus, some of
the QbD elements include [21]:
– Define target product quality profile
– Design and develop product and manufacturing processes
– Identify critical quality attributes, process parameters, and sources of variability
– Control manufacturing processes to produce consistent quality over time
Under the QbD methodology, pharmaceutical quality of the drug product is assured by
understanding and controlling formulation and manufacturing variables. End product testing
confirms the quality of the product and is not part of the manufacturing consistency or
process control. A product specification is often set by observing data from a small number
of batches, believed to be acceptable and then setting acceptance criteria that required
future batches to be the same. The consistency comes from the design and control of the
manufacturing process and the specification of drug product should be clinically relevant
and generally determined by product performance. Under QbD, batches may not be actually
tested, as the process understanding and process control provide sufficient evidences that
the batches will meet the specification. Furthermore, the specification under the QbD is
solely used for the confirmation of product quality, not manufacturing consistency and
process control [22].

23
1.3 Manufacturing of a multilayer dosage form
Two drugs can be administered in a single dosage form, such as a multilayer system.
In general, a multilayer tablet is made of two or more drugs having identical and/or different
release kinetics (Figure 4) [16]. Each layer constituting the tablet is obtained with a tableting
machine. Each layer of powder, poured in the die, undergoes a precompression
process. The force applied by the upper punch determines the compression of the various
layers of material deposited on each other with the formation of the multilayer tablet.
Figure 4: Graphic representation of a multilayer tablet
The manufacturing process presents several problems: the weight of the individual layers
may be inaccurate, excessive compressive force may cause lamination of the tablets and
eventual separation of the layers during the manufacturing or the storage. In addition, the
mechanical properties and the compaction of the individual layers can differ substantially in
relation to the compression process that is unique to each layer [23].
In the design and realization of multi-dose dosage form it must be taken into account
different aspects, such as:
elastic/plastic deformation of the active ingredients and the excipients used;
cross-contamination between the adjacent layers;
delamination of the layers;
chemical and physical long term stability;
sizes of the multilayer tablet;

24
influence of temperature and ambient humidity on the adhesion of the layers.
These are just some of the problematics associated with the manufacture and storage of
multilayer tablets. The most concerning one is surely the delamination. It consists in the
separation of the layers, therefore mining the integrity of the tablet itself [24].
The layer separation of multilayer tablets is caused by various mechanical stresses that
develop during the compression phase, and that are released during the relaxation and
ejection phase. The mechanisms that underlie it involve both the cohesive / adhesive
properties and plasticity/elasticity of the material, coupled with the parameters of
compression (Figure 5).

25
Figure 5: Cycle of compression for a multilayer tablet in an alternative tableting machine.
The manufacture of multilayer tablets consists, firstly, in the deposition of the first layer of
powder in the die (Fig 5.1). Then a tamping force is applied to the first layer (Fig 5.2). This
has a significant impact on the interfacial strength and adhesion between adjacent layers,
also it contributes to the integrity of the final tablet. The precompression force, applied to the
first layer, determines a reduction in the area of bonding surface, therefore the higher it is,
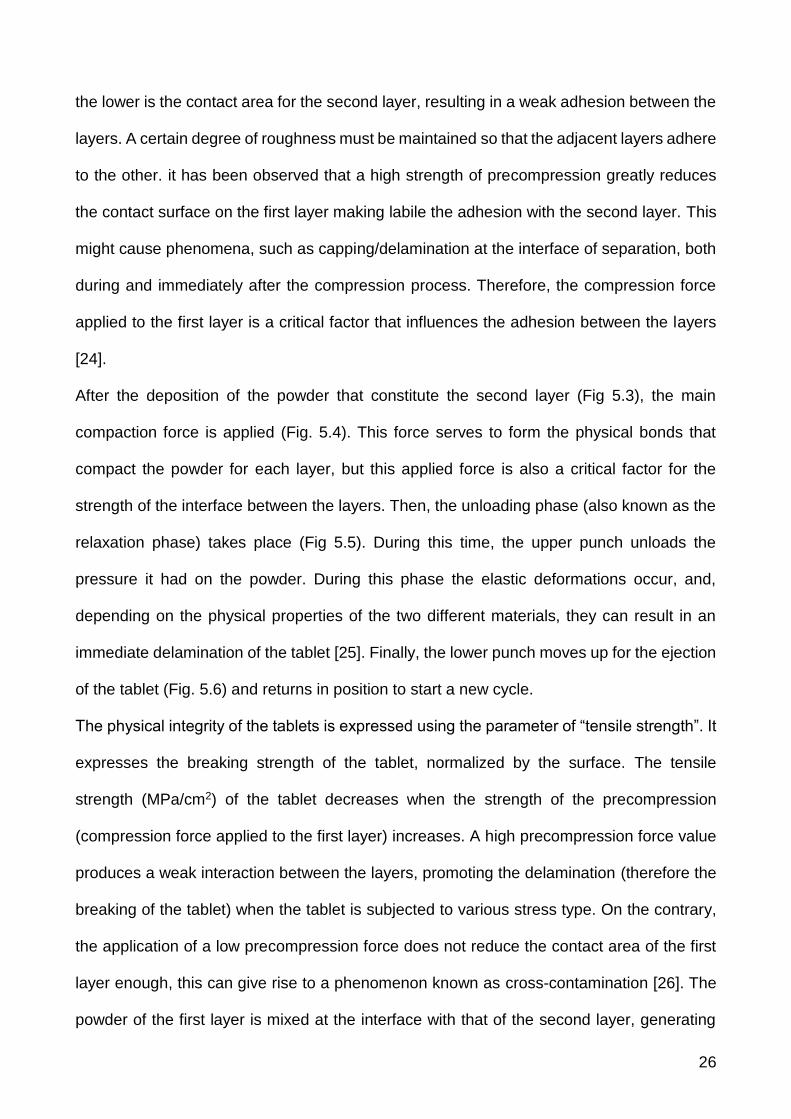
26
the lower is the contact area for the second layer, resulting in a weak adhesion between the
layers. A certain degree of roughness must be maintained so that the adjacent layers adhere
to the other. it has been observed that a high strength of precompression greatly reduces
the contact surface on the first layer making labile the adhesion with the second layer. This
might cause phenomena, such as capping/delamination at the interface of separation, both
during and immediately after the compression process. Therefore, the compression force
applied to the first layer is a critical factor that influences the adhesion between the layers
[24].
After the deposition of the powder that constitute the second layer (Fig 5.3), the main
compaction force is applied (Fig. 5.4). This force serves to form the physical bonds that
compact the powder for each layer, but this applied force is also a critical factor for the
strength of the interface between the layers. Then, the unloading phase (also known as the
relaxation phase) takes place (Fig 5.5). During this time, the upper punch unloads the
pressure it had on the powder. During this phase the elastic deformations occur, and,
depending on the physical properties of the two different materials, they can result in an
immediate delamination of the tablet [25]. Finally, the lower punch moves up for the ejection
of the tablet (Fig. 5.6) and returns in position to start a new cycle.
The physical integrity of the tablets is expressed using the parameter of “tensile strength”. It
expresses the breaking strength of the tablet, normalized by the surface. The tensile
strength (MPa/cm2) of the tablet decreases when the strength of the precompression
(compression force applied to the first layer) increases. A high precompression force value
produces a weak interaction between the layers, promoting the delamination (therefore the
breaking of the tablet) when the tablet is subjected to various stress type. On the contrary,
the application of a low precompression force does not reduce the contact area of the first
layer enough, this can give rise to a phenomenon known as cross-contamination [26]. The
powder of the first layer is mixed at the interface with that of the second layer, generating

27
not well defined layers, with mixing of the two products at the interface. This has strong
repercussion on the final product quality.
The adhesion between the layers depends not only on the applied force but also by the
physical-chemical nature of the excipients and of the active ingredients present in the
formulation. The material properties have a significant impact on the process of compacting
and adherence of the layers; some plastic materials possess properties (for example
microcrystalline cellulose), other elastic properties (for example lactose), still others are
fragile (for example lactose) [27]. During the compression, the brittle materials tend to
fragmentize, giving rise to smaller particles that fill the voids between the larger particles
(thus increasing the friction forces on the walls of the die and consequently increasing the
ejection force). On the contrary, for plastic and elastic materials, plastic and elastic
deformations occurs. During the decompression phase the materials relax in different way
and rate, then the radial stress generated could determine the separation at the interface
and cause delamination in the ejection phase. The plastic/elastic properties of a material are
strongly related to its surface free energy (Young equation and equation of Wu) [28]. The
tendency to delamination is significantly lower than in the case in which the layers are made
of plastic materials or characterized by high surface free energy. Generally, a brittle material
produces a smooth surface, while a plastic material produces a rough and irregular surface.
As already underlined, the adhesion between the layers is strongly correlated to the latter
aspect.
Other important aspects concern the characteristics of the powder bed to compress, as for
example porosity, morphology, particle size and water content. Wet granulation is often used
to standardize the properties of a powder blend (particle size) or to improve some aspects
such as powder flowability.
Also important are the process parameters, such as the speed of the punches, the dwell
time and the relaxation time. It has been shown that an increase of the speed of the punches

28
leads to a significant reduction of the porosity of each layer compressed, limiting the
adhesion at the interface and promoting the delamination [24].

29
2 Aim of the research work
The purpose of the thesis work carried out at the University of Parma involved the
construction of a three-layer tablet consisting of two different active principles, ibuprofen
lysine and sucralfate, in combination.
The manufacture of three-layer tablets was performed using a compression simulator, which
allows to study in detail the physics of the compaction process.
In a first instance, a model formulation was prepared, in order to fully understand the
problematics involved in a preparation of a multilayer system. Thereafter, two different
formulations of sucralfate, each containing a dose of 100 mg of the active were prepared.
The formulations differ in the presence of two excipients, microcrystalline cellulose and
lactose.
As regards the ibuprofen lysine salt, it was used a single formulation that contains a dose of
active principle equal to 342 mg. This dosage is the currently used dosage in various
commercial products already approved for market release (such as Rapid (Boots
Pharmaceutical, London, UK), Nurofen (Reckitt Benckiser, Slough, U.K.)).
Both formulations were individually subjected to compaction, followed by the study of the
critical factors that affect the compression process, in order to evaluate the impact of
different excipients on the process.
The tablet manufacturing followed this order:
• cylindrical monolayer tablets of sucralfate
• cylindrical monolayer tablets of ibuprofen lysine
• cylindrical bilayer tablets (sucralfate and ibuprofen lysine)
• oblong bilayer tablets (sucralfate and ibuprofen lysine)
• oblong three-layer tablets (two layers of sucralfate and one of ibuprofen lysine)

30
3 Materials and methods
3.1 Materials
Croscarmellose sodium (AcDiSol SD-711, FMC Philadelphia, United States)
Hydrophilic fumed silica (Aerosil 200, Evonik Industries AG, Hanau, Germany)
Microcrystalline cellulose (Avicel PH 101, ACEF, Fiorenzuola d'Arda, Piacenza, Italy)
Lactose (FlowLac 100, MEGGLE, Wasserburg, Germany)
Ibuprofen lysine (Lisapharma, Erba, Italy)
Crospovidone (Kollidon CL/ Kollidon 30/ Kollidon VA, BASF, Ludwigshafen,
Germany)
Magnesium stearate (ACEF, Fiorenzuola d'Arda, Piancenza, Italy)
Sodium bicarbonate (Sigma-Aldrich, Riedel-de Haen, Germany)
Sucralfate gel (BK Giulini, Ludwigshafen am Rhein,Germany)
Glycerol distearate (Precirol, Gattefossé, Lyon, France).
All materials and solvents used are of analytical grade according Ph. Eur last edition.
3.2 Methods
3.2.1 Preparation of sucralfate granulate
For the preparation of the granulate, sucralfate moist gel with a water content of 67.2% was
used. Sucralfate gel was manually reduced in small pieces and dried in fluid bed dryer
(Figure 6) “Mini Glatt” (Glatt GmbH, Binzen, Baden-Württemberg Germany).
Sucralfate gel was subjected to a 40-minute drying step (inlet air temperature 40 °C, air flow
pressure 0.5 bar). Then, the drying process was stopped and the reduction of residual water

31
content (%) of the moist sucralfate gel was measured by using Karl Fisher Titration (Crison
Titromatic, Barcelona, Spain) and compared with the weight of the moist sucralfate gel
initially loaded. The drying process was continued till the water content of the sucralfate gel
was between 50-52%. Those preemptive drying steps have the purpose of drying the
sucralfate gel enough to be manipulated and stored. The sucralfate gel was then kneaded
in a mortar with microcrystalline cellulose, lactose, or a mixture of microcrystalline cellulose
and lactose. Granules were obtained by using an oscillating arm granulator (Figure 7,
Erweka AR400, Düsseldorf, Germany), equipped with a 1.2 mm mesh.
Then, the granulate was subjected to a drying cycle in a fluidized bed (inlet air temperature
40 °C, air flow pressure 0.3 bar) for forty minutes to obtain a water content between 13 and
15%. The sucralfate granulate was then mixed with 0.5% of magnesium stearate in
Turbula® (WAB, Basel, CH) for 5 minutes.
Figure 6: Mini Glatt Fluid bed.

32
Figure 7: Oscillating arm granulator
3.2.2 Preparation of the ibuprofen lysine granulate
The wet granulate of ibuprofen lysine was prepared by mixing (in presence of one steel ball)
the drug and the excipients in Turbula® for 15 minutes. Afterwards, the blend was kneaded
in a mortar with 35 ml of the binder solution of PVP K 30 (5% w/V) in ethanol. Granules were
obtained by using an oscillating arm granulator (Erweka AR400, Düsseldorf, Germany),
equipped with a 0.8 mm mesh. Granules were dried in an oven at 40 °C for about 2
hours. The granulate was then mixed in Turbula® for fifteen minutes with extra-granular
excipients and further five minutes after the addition of magnesium stearate.
3.2.3 Particle size distribution analysis of the granulate
The particle size distribution analysis of the granulate was carried out by sieving method
(Endecotts Limited, London, United Kingdom). The sieves were stacked on sieve shakers
(Fritsch GmbH, Idar-Oberstein, Germany), according to the geometric progression of 2
order. The openings of the sieve mesh were the following: 1000, 710, 500, 355, 250, 180
and 125 m.

33
Prior to analysis each sieve was accurately weighed. Then, the sieves were placed by
putting the one with the largest opening on the top and the others in order of decreasing
mesh opening up to finish with a round pan, called the receiver. Samples of granules (about
20 g) were poured into the top sieve and closed with a lid. Then, the stack of sieves was
subjected to vibrations for 5 minutes at amplitude 4. The sieves were weighed and placed
on the sieve shakers for additional 5 minutes at amplitude 4. The sieves were weighed again.
Knowing the opening of each mesh sieve, the size class of the particles corresponding to
the fraction collected on the sieve is equal to the arithmetic mean between the opening of
the above sieve and that of the below one. The fractions collected on each sieve were
weighed and the amount of granules for each size fraction was expressed as the percentage
fraction of the weight of granulate analyzed.
3.2.4 Determination of water content of granulate by TGA
The determination of the residual water content in the sucralfate granulate was performed
by means of the thermogravimetric analysis (TGA). The instrument used was the TG50
(METTLER Toledo, USA) equipped with STARe software. An amount of granulate was
accurately weighed into an alumina crucible, positioned on the plate of the balance, and
closed with a perforated alumina lid. Each sample was subjected to a heating program from
25 to 140 °C, at scan rate of 20 °C/min in a nitrogen atmosphere (flow of 100 ml/min),
followed by an isotherm of 15 min at 140 °C. The analysis was conducted in triplicate.
3.2.5 Multilayer tablet manufacturing
The multilayer tablets were manufactured using the Styl’One Evolution Rotary Tablet Press
Simulator (Medel'Pharm, Lyon, France). The apparatus, equipped with single location for
die and punches (Figure 8), is able to simulate the industrial rotary tablet press using the

34
software Advanced ANALIS. The displacement of the upper and lower punches is controlled
electronically and the force exerted by the punches on the powder bed is measured by the
sensors.
Figure 8: Compression Simulator Styl'One Evolution
Two types of multilayer tablets were manufactured:
flat cylindrical tablets, using EURO D punches of 11.28 mm diameter (HOLLAND Ltd,
Nottingham, UK);
oblong tablets, using EURO D punches (17.5 x 8.5 mm, HOLLAND Ltd, Nottingham,
UK; Figure 9).

35
Figure 9: Oblong punches EURO D
The powder feed for the die filling during the manufacturing of ibuprofen and sucralfate
layers was done by using a gravity-feed shoe for the sucralfate granulate and a force feeding
shoe (Figure 10), for the ibuprofen granulate. This one is a particular shoe equipped with
paddles. The rotation of the paddles inside the shoe facilitates the flowing of the powder and
consequently the die filling.
Figure 10: An example of the shoe used during the manufacturing
of the multilayer tablets.
Both monolayer tablets of sucralfate and ibuprofen lysine were obtained, using the
cylindrical punches, at different compression force values (10, 20, 30 and 40 kN).

36
The bilayer tablets of sucralfate and ibuprofen lysine were prepared using EURO D
cylindrical punches. Tablets were produced for each of the precompression (0, 1, 2, 4 kN)
and compression force values (10, 20, 30 and 40 kN).
The bilayer oblong tablets of sucralfate and ibuprofen were produced using oblong punches
EURO D. Tablets have been manufactured at each of the precompression (0, 1, 2, 4 kN)
and compression force values (10, 20, 30 and 40 kN).
The bilayer tablets, cylindrical and oblong, were produced by placing as first layer the
sucralfate granulate and as second layer the ibuprofen granulate.
Finally, the three-layers oblong tablets were manufactured, putting sucralfate granulate in
the first and third layers and ibuprofen in the middle layer.
3.2.6 Tablets characterization
3.2.6.1 Dimensional measures
3.2.6.1.1 “In die” dimensions
The in-die dimensions of a tablets are the value of height and diameters that the tablet
reaches during the compression phase. It is possible to measure this property using the
Styl’One compaction simulator coupled with the software Advanced ANALIS (see 3.2.5).
3.2.6.1.2 “Out of die” dimensions
The measuring of the dimensions of a the single-layer and multilayer tablets (after the
ejection from the tableting machine) was performed using a digital thickness gauge
(Mitutoyo, Tokyo, Japan) on a sample of five tablets for each value of
precompression/compression force applied.

37
3.2.6.2 Breaking strength test
The determination of the breaking strength of the tablets was carried out using a digital
dynamometer (Acquati, mod. MC AG, Arese, Italy). The dynamometer is an instrument for
the measurement of forces constituted by a transverse movable bar and two grippers that
hold the tested tablet into position (Figure 11). To run the breaking test the dynamometer
was equipped with a 50 daN cell. The analysis was conducted at a speed of advance of the
cell of 50 mm/ min.
Figure 11: Dynamometer monocolumn Acquati
The monolayer and multilayer cylindrical tablets were subjected to an axial breaking
strength, as shown in Figure 12; the same methodology was applied to multilayer oblong
tablets.
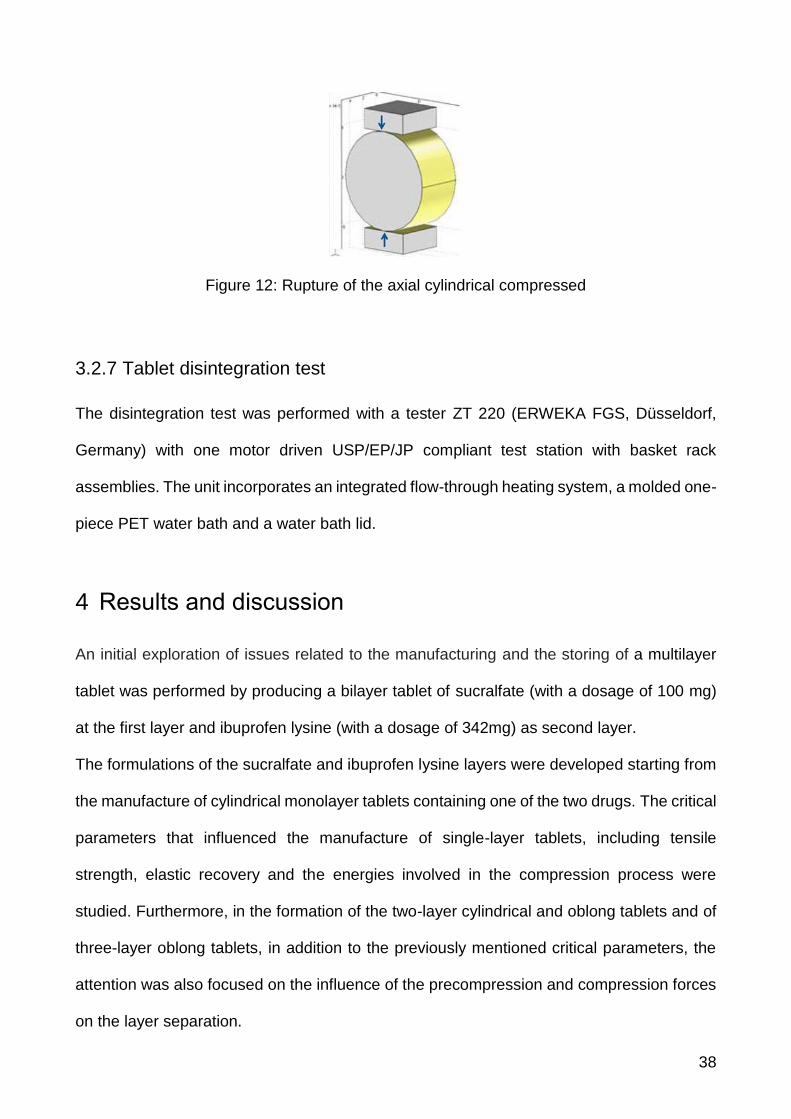
38
Figure 12: Rupture of the axial cylindrical compressed
3.2.7 Tablet disintegration test
The disintegration test was performed with a tester ZT 220 (ERWEKA FGS, Düsseldorf,
Germany) with one motor driven USP/EP/JP compliant test station with basket rack
assemblies. The unit incorporates an integrated flow-through heating system, a molded one-
piece PET water bath and a water bath lid.
4 Results and discussion
An initial exploration of issues related to the manufacturing and the storing of a multilayer
tablet was performed by producing a bilayer tablet of sucralfate (with a dosage of 100 mg)
at the first layer and ibuprofen lysine (with a dosage of 342mg) as second layer.
The formulations of the sucralfate and ibuprofen lysine layers were developed starting from
the manufacture of cylindrical monolayer tablets containing one of the two drugs. The critical
parameters that influenced the manufacture of single-layer tablets, including tensile
strength, elastic recovery and the energies involved in the compression process were
studied. Furthermore, in the formation of the two-layer cylindrical and oblong tablets and of
three-layer oblong tablets, in addition to the previously mentioned critical parameters, the
attention was also focused on the influence of the precompression and compression forces
on the layer separation.

39
The critical parameters studied were the following:
sucralfate water content (%): the percentage of residual water content;
breaking strength (N): the force, applied in the axial way, required to cause the break
of the tablet;
tensile strength (MPa);
ejection energy (J) of the tablet from the die;
plastic energy (J): the total energy during the compression process, equal to the sum
of energy provided during the compression phase (compression energy) and the
energy recovered from the tablet when the applied force decreases (elastic energy);
elastic energy (J): energy recovered from the compressed powder when the
compression force decreases.
4.1 Bilayer tablet of ibuprofen lysine/ sucralfate
In order to test the formulation and production conditions, a bilayer tablet was manufactured
as show in Figure 13.
Figure 13: Composition of the bilayers tablet
342 mg
140.68 mg
444.6 mg Ibuprofen Lysine
Sucralfate (1) (granulate) 100 mg
Dosage Layer Weight

40
Sucralfate granulate was obtained following the procedure described in paragraph 3.2.1,
while ibuprofen lysine granulate was prepared as described in section 3.2.2 The final
formulation is reported in Table II.
Table II: Components of the sucralfate and ibuprofen layers.
Sucralfate layer
Components mg %
Dry sucralfate 100 71.08
Water 15.68 11.15
Microcrystalline cellulose 25 17.77
Total 140.68 100
Ibuprofen lysine layer
Ibuprofen lysine 342 70
Kollidon VA 17.1 5
Sodium Bicarbonate 51.3 15
Precirol 17.1 5
Cornstarch 17.1 5
Total 444.6 100
The selected parameters used for the manufacturing of the bilayers tablets are summarized
in Table III. In particular, the parameters are:
dosage height: measured in mm, is the depth at which the lower punch goes during
the filling phase. It determines the quantity of the powder inside the die.

41
tamping force: is the force that the upper punch applies during the precompression
phase. It determines the minimum distance between the punches, therefore the
thickness of the first layer.
main compression force: is the force that the upper punch produces during the main
compression.
Table III: Compression parameters used to manufacture the bilayer tablet
Sucralfate Ibuprofen lysine
Dosage Height(mm) 2.609 10.319
Tamping Force (kN) 0.2 /
Main Compression Force (kN) / 10, 20, 30, 40
Firstly, the powder of sucralfate is deposited by the shoe inside the die, for a dosage height
of 2.61mm, that gives exactly a layer weighted 221 mg (which contains the desired dose of
sucralfate (100 mg)).
Then a tamping force is applied to the layer of Sucralfate, of 0.2 kN (as reported in Table
III). This was kept minimal to ensure that the layer was not excessively tamped, but high
enough to ensure that there is enough space inside the die for the powder of ibuprofen
lysine. Finally, the powder of ibuprofen lysine is deposited inside the die, and compressed
with different compression forces.
As shown in Figure 14, the hardness of the bilayer tablets obtained (measured with the
dynamometer as indicated in the section 3.2.6) linearly increases as the applied
compression (Figure 14).

42
Figure 14: Main compression force versus tablet hardness (n=20)
The graph shows a linear relation between the hardness and the compression force, with
an R2 of 0.99838. This means that, even when a high compression force is applied, the
bilayer tablet is still capable of converting that force into plastic deformation and reduction
of porosity.
4.1.1 Stability test of bilayer tablets of sucralfate/ibuprofen lysine
The produced tablets were stored in sealed containers for 24h, at a measured humidity of
45%. The containers were made of plastic (PET), provided with pores to allow the flow of
air. Those containers were then stored in glass chambers equipped with a saturated solution
of potassium carbonate.
After this period of time, layer separation in the bilayer tablets was observed.

43
Then, a monolayer cylindrical tablet of sucralfate and a monolayer cylindrical tablet of
ibuprofen lysine was produced, using the formulation reported in Table III. The tablets were
manufactured at compression forces of 10, 20, 30 and 40 kN.
The tablets were tested measuring the dimensions in-die and out-of-die, as per section
3.2.6. The out-of-die volume was measured 24h after the tablet manufacturing, in order to
include the influence of time into account.
Given that a changing in the dimensional properties of the tablet is correlated to the elastic
energy of the tablet themselves, the difference in dimensions is named as “elastic recovery”
and it is described by the equation of Picker [29]:
Ert = (Vout – Vi) / Vout * 100
where:
Ert= elastic recovery
Vout = volume of tablet out of die after 24h
Vin = volume of tablet inside the die
For the layer of sucralfate and ibuprofen lysine, the calculated elastic recovery, plotted
versus its compression force, is showed in Figure 15.

44
Figure 15: Elastic return of sucralfate and ibuprofen lysine layers versus the compression
force applied (n=10).
The elastic recovery of sucralfate layer ranges from 9.5 to 10.3%, proving that the layer
tends to have a meaningful elasticity. The same procedure was applied for the layer of
Ibuprofen lysine. In this case the elastic recovery ranges from 3.5 to 6.4 %, in a seemingly
force-dependent manner. This shows that there is a difference of elastic recovery between
the two layers. In Table IV the difference in elastic recovery (ΔErt) between the cylindrical
monolayer of sucralfate and ibuprofen lysine for each batches of tablet made at different
compression force is reported.

45
Table IV: Difference of elastic recovery (ΔErt) between each batch of cylindrical monolayer
of sucralfate and cylindrical monolayer of ibuprofen lysine.
Compression force ΔErt
10 6.0 ± 1.5
20 5.7 ± 0.5
30 4.8 ± 1.4
40 3.5 ± 0.8
This elastic recovery stresses the interface between the layers, applying a tension force that
leads to delamination. This does not happen during the compression phases or immediately
after the ejection of the tablet from the die (as most of the reported cases in literature do
[31]), but the delamination process takes places during the storage time.
This lead to the conclusion that one of the components of the bilayer tablet is subject to a
changing of its volume over time.
It has been reported in the literature that sucralfate is a hygroscopic material [15, 30], but
there is no link between the water content of the sucralfate, its ability to absorb water from
the environment and the correlation between water intake / expansion of a sucralfate tablet
(the elastic recovery). Therefore, further studies were performed to assess the influence of
the water content of the sucralfate layer with its elastic recovery.
4.1.2 Sucralfate layer Water Content versus Elastic Recovery
Sucralfate at different water content was produced. Following the granulation step, the
compacts were then dried in fluid bed for three different times (15, 30 and 45) obtaining
three different level of water content.

46
A single layer tablet of Sucralfate was produced for each level of water content. Before its
production, the water content of the powder was measured. Then, for each level of water
content the elastic return was measured (Table V).
Table V: Drying time of the sucralfate granulate in fluid bed, water content (%) of the
sucralfate granulate before compaction and the elastic return of the tablets
Batch # Drying time (min) Water content before compaction (%) Elastic Return (%)
1 15 33.0 ± 4.2 14.2 ± 1.3
2 30 23.2 ± 3.5 9.5 ± 3.3
3 45 10.2 ± 1.6 4.6 ± 3.1
As shown in Table V the elastic recovery was reduced according to the water content of the
powder. The chosen drying times gave rise to sucralfate with very different levels of moisture
content and different elastic recovery. Even if the equilibrium moisture content was not
reached, the results were sufficient to prove that water plays a pivotal role in increasing the
elastic recovery, simply because water it is not in itself a compressible material.
In order to study the effect of different elastic recovery of the powder of sucralfate on the
hardness of the bilayer tablets, four batches of bilayer tablets of ibuprofen lysine and
sucralfate are produced, varying the sucralfate drying time (therefore its water content). The
drying time in this study were much higher than the previous one, because it was necessary
to obtain a sucralfate dry enough to obtain a bilayer tablet. Those tablets must have enough
mechanical resistance to be safely stored and tested. The batches were differentiated by
the sucralfate granulate drying time (Table VI).

47
Table VI: Batches produced by changing drying time of sucralfate.
Batch Drying time (min) Water content of the
sucralfate powder (%)
#1 45 10.9
#2 60 8.8
#3 90 4.6
#4 120 2.5
The formulation of ibuprofen used for these bilayer tablets is described in paragraph 4.1 and
kept constant for each batch.
In Figure 16, the adhesion force of the bilayer tablet (measured as described in par 3.2.6.2)
and the difference in elastic recovery between the two layers are plotted versus the water
content of the layer of sucralfate.

48
Figure 16: Adhesion Force of Bilayer Tablet and difference in elastic return between the
layers versus the Water Content of the Layer of Sucralfate.
As can be observed from the graph reported in Figure 16, a linear relationship exists
between the water content of the powder of sucralfate and the adhesion strength between
the two layers of the bilayer tablet sucralfate / ibuprofen lysine.
The last one clearly decreases when increasing the water content of the layer of sucralfate.
Moreover, the difference of elastic recovery between the layer of sucralfate and layer of
ibuprofen lysine increases as the water content increases. This is interesting because it is
possible to observe that, when the difference between the elastic recovery of the layer is
small, then the adhesion force is at its maximum, and vice versa.

49
4.1.3 Single layer Water content vs Time
In order to investigate the effect of the water intake of the sucralfate granulate, different
monolayer tablets of sucralfate were manufactured. Immediately after the production, the
manufactured tablets were placed in closed polyethylene bottles. These bottles were placed
in three different sealed humidity chambers (placed inside a room at controlled temperature
of 25°C), each one containing a different saturated salt solution that creates a different
relative humidity (R.H. %) inside the chamber. The humidity conditions of each chamber is
reported in Table VII.
Table VII: Salt solutions used and their humidity
Water content of the monolayer tablet was measured at 1, 2, 3, 5, 7 and 14 days after the
manufacturing, by grinding the sucralfate layer and analyzing by TGA at the heating program
indicated in the section 3.2.4.
As shown in Figure 17 the water content of the single layer of sucralfate tends to reach a
plateau for all three different environmental humidity levels. The plateau was reached at
higher value of water content in the case of 25°C/75% RH (around 20%). In the case of
25°C/43.6% RH and 25°C/11.3% RH, the plateau is obtained at around 16% and 14%,
respectively.
Humidity Chamber Salt Solution Relative Humidity (R.H., %)
1 Sodium chloride 75
2 Potassium carbonate 43.6
3 Lithium chloride 11.3

50
Figure 17: Water content (%) of the single layer of sucralfate versus time (n=10).
The impact of a high humidity storing condition on water uptake of the sucralfate tablets was
relevant, as an increase of around 3 % after just 1 day and 5 % after 14 days was observed.
Given that high water content is correlated with an increase of elastic recovery and that high
difference in elastic recovery impacts negatively on the stability of a bilayer tablet, the fact
that the sucralfate tends to absorb water from the environment is responsible for the layer
separation of bilayer tablets stored at high humidity levels.

51
4.2 Cylindrical monolayer tablets
The manufacture of monolayer tablets was carried out using cylindrical punches EURO D
from the diameter of 11.28 mm.
The tablets produced are divided into three different categories:
cylindrical single-layer tablets of sucralfate (Sucr_1);
cylindrical single-layer tablets of sucralfate (Sucr_2);
cylindrical tablets monolayer of Ibuprofen lysine
4.2.1 Cylindrical tablets monolayer of Sucr_1
The composition of the formulation for the tablets monolayer Sucr_1 is reported in Table
VIII.
Table VIII: Composition of the formulation Sucr_1
Components mg %
Sucralfate dry granulated 100 70.62
Water 20.2 14.27
Microcrystalline cellulose 20 14.12
Magnesium stearate 1.4 0.99
Total 141.6 100
To manufacture the cylindrical tablets of sucralfate, the gel was granulated by following the
method previously described, with the sucralfate granulate produced using batch #1
according to Table VI.
The granulate of sucralfate was characterized in terms of size distribution (Figure 18).

52
Figure 18: size distribution of the granulate of sucralfate Sucr_1
As can be noted from the histogram reported in Figure 18, the granules contain about 30%
of fine particles (<125 m).
After the addition of sucralfate to granulate the excipients reported in Table VIII, the mixture
was mixed in a Turbula® and compressed by the compaction simulator Styl'One
Evolution. The tablets of Sucr_1 were characterized in terms of change in weight, diameter
and height (Table IX).

53
Table IX: Mean weight value, diameter, height of monolayers Sucr_1
(mean value ± standard deviation, n = 5)
Sucr_1 Mean value ± st. dev.
Weight (mg) 188.5 ± 1.5
Compression
force (kN)
10
Height (mm) 1.46 ± 0.01
Diameter (mm) 11.32 ± 0.01
20
Height (mm) 1.25 ± 0.01
Diameter (mm) 11.30 ± 0.01
30
Height (mm) 1.15 ± 0.01
Diameter (mm) 11.31 ± 0.01
40
Height (mm) 1.13 ± 0.01
Diameter (mm) 11.31 ± 0.01
The Sucr_1 formulation allowed the manufacture of cylindrical single-layer tablets at each
selected force values. In addition, the powder blend showed good flowability and,
consequently, the die filling from the shoe was constant.
The data reported in Table X showed that the increase of the compression force applied
results in an increase of breaking strength, tensile strength and plastic energy of the
tablets. The ejection energy was kept low at each compression force value, index of a good
lubrication of the formulation despite the high component of fine particles of the sucralfate
granulate.

54
Table X: compression parameters normalized by the weight of the tablets obtained with
the Sucr_1 formulation (mean value ± standard deviation, n = 5)
Compression
force
measured (kN)
Breaking
strength (N/g)
Tensile
strength
(MPa/g)
Ejection
energy (J/g)
Plastic
Energy (J/g)
Elastic
energy (J/g)
10.30 242.6 ± 15.7 9.36 ± 0.6 3.01 ± 0.11 15.97 ± 0.22 0.566 ± 0.07
18.93 624.8 ± 43.6 28.14 ± 2.0 2.48 ± 0.03 29.16 ± 0.22 0.278 ± 0.02
27.96 744.5 ± 67.5 36.54 ± 3.2 2.08 ± 0.02 39.68 ± 0.43 0.345 ± 0.02
33.98 838.72 ± 134 41.89 ± 6.6 1.91 ± 0.04 44.67 ± 0.16 -0.55 ± 0.05
4.2.2 Cylindrical tablets monolayer of sucralfate Sucr_2
The composition of the formulation for the tablets monolayer Sucr_2 is reported in Table XI.
Table XI: Composition of the formulation Sucr_2
Components mg %
Sucralfate dry granulated 100 70.77
Water 20.3 14.37
Microcrystalline cellulose T2 10 7.08
Lactose 10 7.08
Magnesium stearate 1 0.71
Total 141.3 100.00
Before the addition of magnesium stearate, the sucralfate granulate was characterized in
terms of size distribution. As can be noted from the histogram reported in Figure 19 the
granules contain about 34 % of fine particles (<125 m).

55
Figure 19: size distribution of the granulate of sucralfate Sucr_2
After the addition of sucralfate to granulate the excipients listed in Table VIII, the mixture
was mixed in Turbula® and compressed by the compression simulator Styl'One
Evolution. The tablets of Sucr_2 were characterized in terms of change in weight, diameter
and height (Table XII).
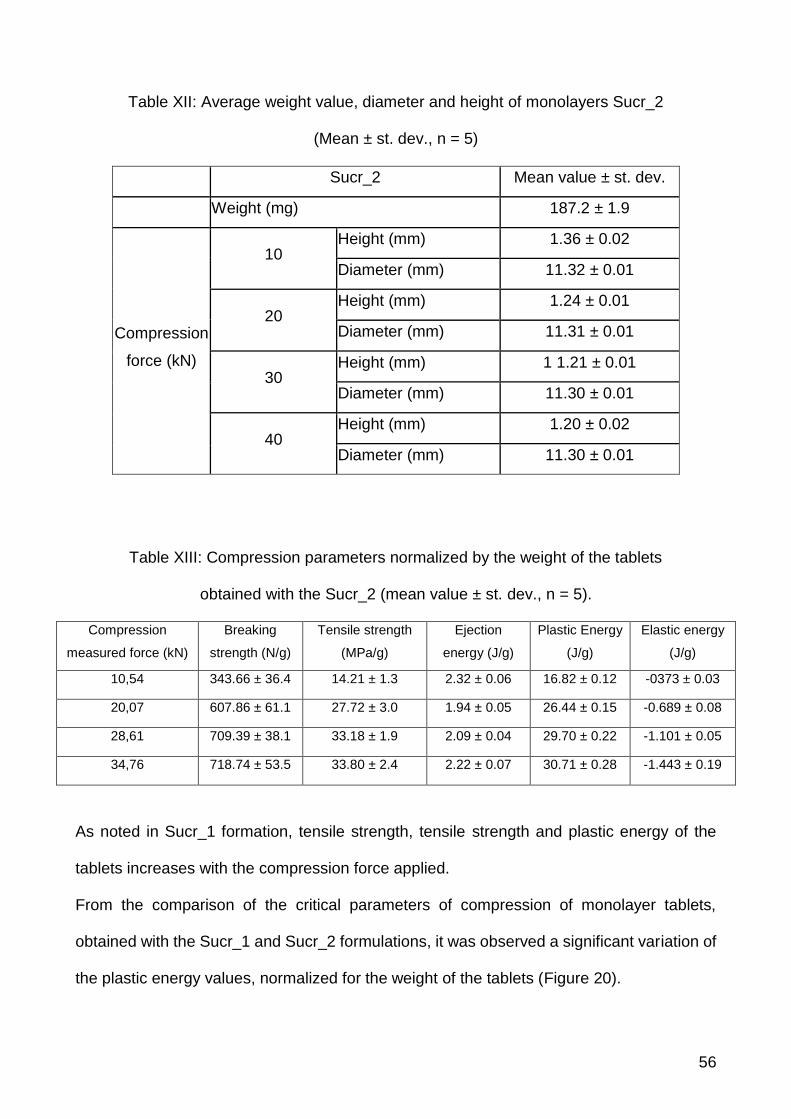
56
Table XII: Average weight value, diameter and height of monolayers Sucr_2
(Mean ± st. dev., n = 5)
Sucr_2 Mean value ± st. dev.
Weight (mg) 187.2 ± 1.9
Compression
force (kN)
10 Height (mm) 1.36 ± 0.02
Diameter (mm) 11.32 ± 0.01
20 Height (mm) 1.24 ± 0.01
Diameter (mm) 11.31 ± 0.01
30 Height (mm) 1 1.21 ± 0.01
Diameter (mm) 11.30 ± 0.01
40 Height (mm) 1.20 ± 0.02
Diameter (mm) 11.30 ± 0.01
Table XIII: Compression parameters normalized by the weight of the tablets
obtained with the Sucr_2 (mean value ± st. dev., n = 5).
Compression
measured force (kN)
Breaking
strength (N/g)
Tensile strength
(MPa/g)
Ejection
energy (J/g)
Plastic Energy
(J/g)
Elastic energy
(J/g)
10,54 343.66 ± 36.4 14.21 ± 1.3 2.32 ± 0.06 16.82 ± 0.12 -0373 ± 0.03
20,07 607.86 ± 61.1 27.72 ± 3.0 1.94 ± 0.05 26.44 ± 0.15 -0.689 ± 0.08
28,61 709.39 ± 38.1 33.18 ± 1.9 2.09 ± 0.04 29.70 ± 0.22 -1.101 ± 0.05
34,76 718.74 ± 53.5 33.80 ± 2.4 2.22 ± 0.07 30.71 ± 0.28 -1.443 ± 0.19
As noted in Sucr_1 formation, tensile strength, tensile strength and plastic energy of the
tablets increases with the compression force applied.
From the comparison of the critical parameters of compression of monolayer tablets,
obtained with the Sucr_1 and Sucr_2 formulations, it was observed a significant variation of
the plastic energy values, normalized for the weight of the tablets (Figure 20).
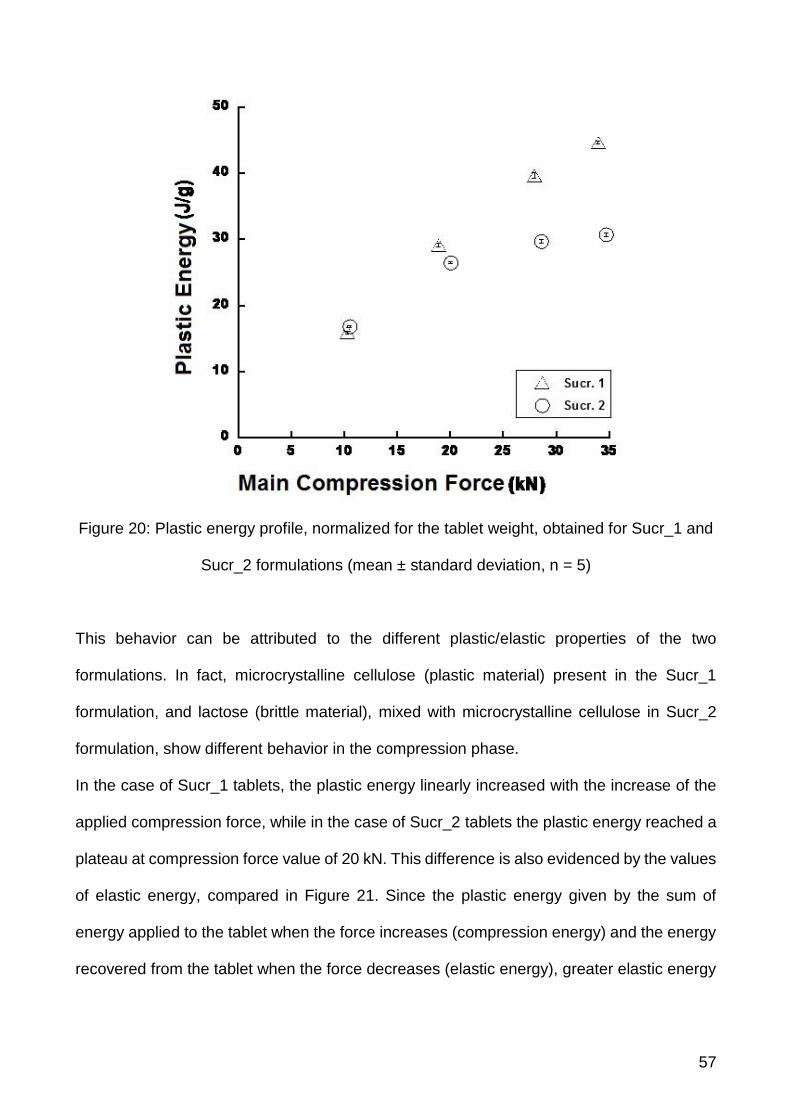
57
Figure 20: Plastic energy profile, normalized for the tablet weight, obtained for Sucr_1 and
Sucr_2 formulations (mean ± standard deviation, n = 5)
This behavior can be attributed to the different plastic/elastic properties of the two
formulations. In fact, microcrystalline cellulose (plastic material) present in the Sucr_1
formulation, and lactose (brittle material), mixed with microcrystalline cellulose in Sucr_2
formulation, show different behavior in the compression phase.
In the case of Sucr_1 tablets, the plastic energy linearly increased with the increase of the
applied compression force, while in the case of Sucr_2 tablets the plastic energy reached a
plateau at compression force value of 20 kN. This difference is also evidenced by the values
of elastic energy, compared in Figure 21. Since the plastic energy given by the sum of
energy applied to the tablet when the force increases (compression energy) and the energy
recovered from the tablet when the force decreases (elastic energy), greater elastic energy

58
(in absolute terms) for Sucr_2 tablets, gives rise to a decrease of the plastic energy values
for these tablets as the compression forces applied increases.
Figure 21: Elastic energy profile, normalized for the tablet weight, obtained for Sucr_1 and
Sucr_2 formulations (mean ± standard deviation, n = 5).
4.2.2.1 Sucralfate monolayer disintegration test
In order to ensure that the layer of sucralfate complied with the specification of the Eur. Ph.
regarding immediate release tablets, the disintegration test was performed on the cylindrical
monolayer tablets of Sucr_1 and Sucr_2, manufactured at different compression forces.
In Table XIV the disintegration times (min) are summarised.

59
Table XIV: Disintegration times for each monolayer.
Compression Force (Kn)
Sucr_1
Disintegration Time (min)
Sucr_2
Disintegration Time (min)
10 1.10 ± 0.32 3.20 ± 0.21
20 1.03 ± 0.12 3.10 ± 0.27
30 1.10 ± 0.04 3.15 ± 0.12
40 1.20 ± 0.28 3.14 ± 0.32
The results show that clearly the formulation is suitable for an immediate release
pharmaceutic dosage form. Each time is in fact inferior to the 5 minutes’ limits that the Eu.
Pharm. imposes.
It is also relevant to note how the compression forces do not play any role on the
disintegration time. In fact, the driving force of the disintegration is the high hygroscopic
tendencies of the Sucralfate itself.

60
4.2.3 Cylindrical monolayer tablets of ibuprofen lysine
The composition of the formulation for the tablets monolayer of ibuprofen lysine is reported
in Table XV.
Table XV: Composition of the ibuprofen lysine formulation
Components Mg
Ibuprofen lysine salt * 342
Kollidon CL 15
NaHCO 3 20
Microcrystalline cellulose 20
PVP K30 11.7
purple Lake 0.02
Aerosil 200 4
AcDiSol 16
Magnesium stearate 2
Total 431
* corresponding to 200 mg of ibuprofen lysine
Ibuprofen, because of unfavorable characteristics in compression (poor flowability and a
tendency to packing) was wet granulated with PVP K30, microcrystalline cellulose (as
diluent with good mechanical properties), NaHCO3 and Kollidon CL (both with the purpose
of enhancing the tablet disintegration). The ibuprofen lysine granulate was characterized in
terms of size distribution. As can be noted from the histogram reported in Figure 22, the

61
granulate contains about 50% of particles having size in 355 and 250 m range, while the
fine fraction (<125 m) was about 15 %.
Figure 22: size distribution of the granules of ibuprofen lysine.
After the extra-granular addition of the other ingredients shown in Table XV, the mixture was
compressed with the compression simulator Styl'One Evolution. The tablets of ibuprofen
lysine were characterized in terms of change in weight, diameter and height (Table XVI).

62
Table XVI: Average weight value, diameter and height of ibuprofen monolayers
(mean ± standard deviation, N = 5)
Ibuprofen lysine monolayer Mean value ± st. dev..
Weight (mg) 432.3 ± 2.5
Compression
force (kN)
10
Height (mm) 4.09 ± 0.03
Diameter (mm) 11.33 ± 0.01
20
Height (mm) 3.82 ± 0.02
Diameter (mm) 11.32 ± 0.02
30
Height (mm) 3.71 ± 0.02
Diameter (mm) 11.31 ± 0.01
40
Height (mm) 3.70 ± 0.02
Diameter (mm) 11.32 ± 0.01
Table XVII: Compression parameters normalized by the weight of the tablets obtained with
the ibuprofen lysine formulation (mean value ± standard deviation, n = 5)
Compression measured
force (kN)
Breaking
strength (N/g)
Tensile strength
(MPa/g)
Ejection Energy
(J/g)
Plastic Energy
(J/g)
Elastic energy
(J/g)
9.66 250.10 ± 9:53 3.44 ± 0.139 5.58 ± 0.107 14.97 ± 0.138 -0.436 ± 0.047
18.96 416.10 ±
27.90
6.14 ± 0.408 5.27 ± 0.05 23.22 ± 0.129 -1.140 ± 0.072
28.46 522.99 ±
19.47
7.93 ± 0.297 5.20 ± 0.01 28.34 ± 0.135 -2.310 ± 0.126
37.38 526.17 ±
32.27
8.00 ± 0.518 5.61 ± 0.140 31.48 ± 0.271 -4.062 ± 0.171

63
The tensile strength and tensile strength of tablets increased with increasing compression
force applied. The tablets, manufactured at a compression force of about 20 kN, show a
considerably higher resistance to rupture in those produced in about 10 kN; while in the
compression strength values of 30 and 40 kN the difference in terms of resistance to
breakage is reduced. This could be an indication of the attainment of the formulation of the
compaction limit. The ejection energy is constant, regardless of the compression force
value. It is noted, however, an increase, in absolute terms, of the elastic energy value with
the increase of compression force, this suggests that the elastic deformation plays an
important role in the ibuprofen formulation.
4.2.3.1 Ibuprofen lysine monolayer disintegration test
To ensure that the layer of Ibuprofen lysine will comply to the specification of the European
Pharmacopoeia regarding the tablets for immediate release, the disintegration test was
performed for each batch of cylindrical monolayer tablet of Ibuprofen lysine produced with
different compression forces.
In Table XVIII the results, expressed in minutes, for the disintegration times.
Table XVIII: Disintegration times of the ibuprofen lysine monolayer.
Compression Force (kN) Disintegration Time (min)
10 2.30 ± 0.21
20 3.40 ± 0.12
30 4.10 ± 0.50
40 4.14 ± 0.16

64
Even though the disintegration times are superior to the sucralfate layers, the results show
that clearly the formulation is suitable for an immediate release pharmaceutic dosage form.
There seems to be a correlation between the compression forces and the disintegration
times. This is because the higher the compression force, the lower the tablet porosity is.
Tablets of ibuprofen with a low porosity will not allow for an easy access of water inside the
tablet itself, making the disintegration more difficult.
4.2.4 Cylindrical bilayer tablets of sucralfate/ibuprofen lysine
Two types of cylindrical tablets were manufactured bilayer:
cylindrical bilayer tablets Sucr_1/Ibuprofen lysine
cylindrical bilayer tablets Sucr_2/Ibuprofen lysine
4.2.4.1 Cylindrical bilayer tablets Sucr_1/Ibuprofen lysine
The cylindrical bilayer tablets were made of two different layers: the first layer was obtained
with the Sucr_1 formulation, while the second layer contained ibuprofen lysine
formulation. The characteristics of the bilayer tablets are reported in Table XIX.

65
Table XIX: Average weight value, diameter and height of Sucr_1/ibuprofen lysine bilayers
tablets (mean value ± standard deviation, n = 5)
Mean compression force
(kN) Precompression (kN) Weight (mg)
Height
(mm)
Diameter
(mm) Bilayer obtained
9.5
0.06 514.2 ± 1.9 4.61 11.34 YES
0.86 510.9 ± 2.3 4.57 11.34 YES
1.92 512.1 ± 2.4 4.58 11.34 YES
4.2 513 ± 1.4 4.60 11.34 YES
19.03
0.08 523 ± 1.7 4.21 11.32 YES
1.13 517.8 ± 3.3 4,16 11.32 YES
2.29 517.5 ± 1.8 4,16 11.32 YES
4,19 - - - Layer separation
28.4 9
0.07 520 ± 2.6 4.01 11.32 YES
0.92 513.2 ± 2.2 3.95 11.32 YES
1.82 510.3 ± 0.9 3.94 11.32 YES
3.65 - - - Layer separation
37.43
0.06 478.3 ± 2.5 3.59 11.31 YES
0.84 509.4 ± 1.3 3.87 11.32 YES
1.83 - - - Layer separation
3.98 - - - Layer separation
At a compression force applied of 20 and 30 kN with a precompression of 4 kN the
delamination of layers is observed, during the ejection phase of the bilayer tablet. In contrast,
at 40 kN compression force the separation of the layers occurs even at the lowest value of
precompression.

66
The separation of the bilayer tablets is probably due to the presence of microcrystalline
cellulose (a plastic material). An increase of the force of precompression reduces the
interfacial interactions between the adjacent layers. However, the bilayer tablets
manufactured at low values of force of the precompression may give rise to cross-
contamination between the layers.
4.2.4.2 Cylindrical bilayer tablets Sucr_2 / Ibuprofen lysine
As for the previous bilayer tablets, the cylindrical bilayer tablets were made of two different
layers: the first layer was obtained with the Sucr_2 formulation, while the second layer
contained ibuprofen lysine formulation. The characteristics of the bilayer tablets are reported
in Table XX.

67
Table XX: Average weight value, diameter and height of Sucr_2/ibuprofen lysine bilayers
tablets (mean value ± standard deviation, n = 5)
Compression force
measured (kN)
Precompression force
measured (kN)
Weight
(mg)
Height
(mm)
Diameter
(mm)
Bilayer
obtained
8.61
0.04 502.1 ± 8.2 4.50 11.35 YES
0.89 513.7 ± 2.8 4.62 11.35 YES
1.68 511.7 ± 4.0 4.62 11.36 YES
3.04 502 ± 3.5 4.54 11.36 YES
17.99
0 508.9 ± 2.1 4.13 11.34 YES
0.67 499.3 ± 4.2 4.05 11.33 YES
1.53 497 ± 2.7 4.04 11.34 YES
3.50 494.5 ± 2.9 4.01 11.33 YES
27.64
0 499.9 ± 1.2 3.93 11.32 YES
0.80 492.7 ± 1.7 3.87 11.33 YES
1.73 489.8 ± 3.2 3.85 11.33 YES
3.63 485.4 ± 2.5 3.81 11.32 YES
36.52
0 492.3 ± 3.4 3.84 11.33 YES
0.88 492.6 ± 0.93 3.84 11.31 YES
1.59 491.1 ± 3.1 3.83 11.32 YES
3.72 486.6 ± 1.1 3.80 11.30 YES

68
In the presence of lactose in the layer of sucralfate the phenomenon of separation of the
layers has not been observed even with high values of precompression force. This is due to
characteristics of the excipient (a brittle material), which tends to fragment into smaller
particles creating a larger contact surface, it promotes adhesion between the adjacent
layers.
The Sucr_2/ibuprofen lysine bilayer tablets have however shown a contamination between
the two layers (being of a different color), also to high precompression forces, leading to an
inaccurate weight control of the layers.
4.2.4.3 Comparison of the ejection energies of the sucralfate/ibuprofen lysine
cylindrical bilayer tablets
As previously shown, the Sucr_1/Ibuprofen lysine cylindrical bilayer tablets exhibited lower
layer adhesion at certain values of precompression and compression forces, but the ejection
energy of these bilayer tablets didn’t increase at greater applied compression force (Figure
23). The ejection energy value of Sucr_1 tablets remains constant (about 5 J/g). In the case
of Sucr_2/Ibuprofen lysine cylindrical bilayer tablets the ejection energy linearly increased
as the compression force applied was raised.

69
Figure 23: Ejection energy given to the bilayer tablets, normalized by the bilayer weight (
Sucr_1, Sucr_2; mean ± standard deviation, n = 5).
This behaviour was due to the fragmentation of lactose brittle material, present in the Sucr_2
formulation, which generated higher surface area free from lubricant increasing the friction
coefficient.
4.2.4.3.1 Disintegration time the sucralfate/ibuprofen lysine cylindrical bilayer tablets
A disintegration test was performed on both bilayer tablets (Sucr_1/ibuprofen lysine and
Sucr_2/ibuprofen lysine), to verify if the results are in agreement with those previously
obtained for the monolayer. During the disintegration process, faster sucralfate layer
disintegration was observed, followed by the disintegration of Ibuprofen lysine layer,
although within the limit of 5 min.

70
4.2.5 Oblong bilayer
Because of the matrix dosage limit, it has not been possible to obtain tri tablets of sucralfate
and ibuprofen lysine with the required dosages of APIs. For this reason, we used the oblong
punches (17,50mmX8,50mm) and the relative matrix, to increase the volume of powder to
compress.
Two types of bilayer tablets were manufactured:
Oblong tablets bilayer Sucr_1/Ibuprofen lysine
Oblong tablets bilayer Sucr_2/Ibuprofen lysine
4.2.5.1 Oblong bilayer tablets Sucr_1/Ibuprofen lysine
The oblong bilayer tablets were made of two different layers: the first layer was obtained
with the Sucr_1 formulation, while the second layer contained ibuprofen lysine
formulation. The characteristics of the bilayer tablets are reported in Table XXI.

71
Table XXI: Average weight value and height of Sucr_1/ibuprofen lysine oblong bilayers
tablets (mean value ± standard deviation, n = 5)
* Not available
Compression force
measured (kN)
Precompression force
measured (kN)
Weight
(mg)
Height
(mm) Bilayer obtained
10.22
0.02 658.06 ± 1.4 5.29 YES
0.91 644.04 ± 1.3 5.20 YES
1.92 642.5 ± 0.8 5.19 YES
3.89 640.8 ± 3.1 5.17 YES
19.65
0.02 667.2 ± 1.2 5.00 YES
0.95 652.1 ± 2.4 4.91 YES
2.04 651.9 ± 2.1 4.90 Layer separation
4,12 647.7 ± 2.2 4.87 Layer separation
28.97
0.03 672.6 ± 1.1 4.85 YES
1.07 658.5 ± 1.7 4.75 YES
2.07 651.9 ± 2.6 4.73 Layer separation
4.22 648.5 ± 1.4 4.71 Layer separation
38.20
0.04 671.6 ± 1.2 4.73 YES
1.13 657.8 ± 1.0 4.56 Layer separation
n.a.* 650.3 ± 2.3 4.60 YES
n.a.* 641.1 ± 0.9 4.56 Layer separation
As expected, the behavior of the Sucr_1 and ibuprofen lysine formulations during the
compaction process of the oblong bilayer tablets was in agreement with that observed during
the manufacturing of the cylindrical bilayer tablets.

72
4.2.5.2 Oblong bilayer Sucr_2/Ibuprofen lysine
The tablets are oblong bilayer consisting of two different layers; the first layer was obtained
with the Sucr_2 formulation, and the second layer with the Ibuprofen lysine formulation. The
characteristics of the bilayer tablets are reported in Table XXII.
Table XXII: Average weight value and height of Sucr_2/ibuprofen lysine oblong bilayers
tablets (mean value ± standard deviation, n = 5))
Compression force
measured (kN)
Precompression force
measured (kN)
Weight
(mg)
Height
(mm) Bilayer obtained
10.41
0.06 637.1 ± 3.4 5.13 YES
0.89 620.8 ± 3.4 5.02 YES
1.57 618.2 ± 3.2 4.99 YES
2.89 613.3 ± 4.0 4.96 YES
19.68
0.03 640 ± 1.8 4.87 YES
0.6 625.9 ± 3.2 4.77 YES
1.17 622 ± 4.8 4.75 YES
2.36 616.3 ± 2.5 4.71 YES
28.99
0.04 642.8 ± 3.6 4.72 YES
0.52 627 ± 1.9 4.62 YES
1.11 621 ± 2.8 4.60 YES
2.24 612 ± 3.7 4.54 YES
38.10
0.03 639.6 ± 4.3 4.61 YES
0.50 619.1 ± 4.9 4.50 YES
0.94 609.4 ± 2.8 4.45 YES
2.15 606.5 ± 2.4 4.43 YES

73
The change of punches had not effect on obtaining the bilayer tablets oblong, the behavior
of the formulations and Sucr_2 Ibuprofen lysine during the compaction process, has not
deviated from what was observed previously.
4.2.5.3 Comparison of the ejection energies of the sucralfate/ibuprofen lysine
cylindrical bilayer tablets
As already observed for the cylindrical bilayer tablets, the Sucr_1/Ibuprofen lysine oblong
bilayer tablets, unlike the Sucr_2/Ibuprofen lysine oblong bilayer tablets, showed lower layer
adhesion at certain values of precompression and compression forces. The ejection energy
of both Sucr_1/Ibuprofen lysine and Sucr_2/Ibuprofen lysine oblong bilayer tablets
increases as the applied compression force was raised (Figure 24). As expected, the oblong
bilayer tablets containing lactose in the sucralfate layer showed greater ejection energy
values. However, in general the values of ejection energy for the oblong bilayer tablets
remained lower than those observed for the cylindrical bilayer tablets. This was due to the
fact that in the case of oblong tablets the precompression and compression forces were
applied to a larger surface area and consequently the friction forces were more distributed
reducing the ejection energy. This was object of further investigation in the research work
carried out at the University of Bordeaux.

74
Figure 24: Ejection energy given to the oblong bilayer tablets, normalized by the bilayer
weight ( Sucr_1, Sucr_2; mean ± standard deviation, n = 5).
4.2.6 Oblong three-layers tablets
Based on the results so far obtained with the manufacturing of bilayer tablets, the three layer
oblong tablets were obtained starting from the Sucr_2 formulation for two sucralfate layers.
produced. This choice has been motivated by the fact that all cylindrical and oblong bilayer
tablets containing this sucralfate formulation did not exhibited layer separation phenomenon;
moreover, for the oblong bilayer tablets layers the ejection energy values were not too high.
Then, the three-layer oblong tablets were manufactured by putting:
first layer: Sucr_2 formulation
second layer: Ibuprofen lysine formulation
third layer: Sucr_2 formulation.
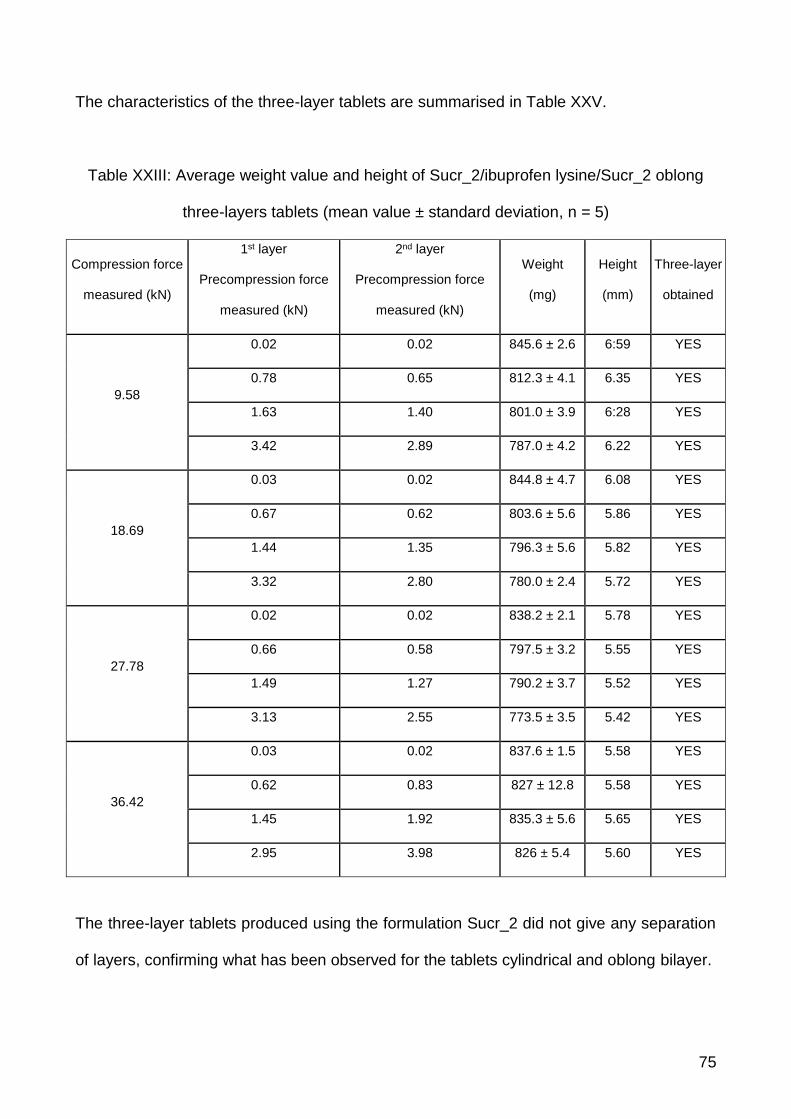
75
The characteristics of the three-layer tablets are summarised in Table XXV.
Table XXIII: Average weight value and height of Sucr_2/ibuprofen lysine/Sucr_2 oblong
three-layers tablets (mean value ± standard deviation, n = 5)
Compression force
measured (kN)
1st layer
Precompression force
measured (kN)
2nd layer
Precompression force
measured (kN)
Weight
(mg)
Height
(mm)
Three-layer
obtained
9.58
0.02 0.02 845.6 ± 2.6 6:59 YES
0.78 0.65 812.3 ± 4.1 6.35 YES
1.63 1.40 801.0 ± 3.9 6:28 YES
3.42 2.89 787.0 ± 4.2 6.22 YES
18.69
0.03 0.02 844.8 ± 4.7 6.08 YES
0.67 0.62 803.6 ± 5.6 5.86 YES
1.44 1.35 796.3 ± 5.6 5.82 YES
3.32 2.80 780.0 ± 2.4 5.72 YES
27.78
0.02 0.02 838.2 ± 2.1 5.78 YES
0.66 0.58 797.5 ± 3.2 5.55 YES
1.49 1.27 790.2 ± 3.7 5.52 YES
3.13 2.55 773.5 ± 3.5 5.42 YES
36.42
0.03 0.02 837.6 ± 1.5 5.58 YES
0.62 0.83 827 ± 12.8 5.58 YES
1.45 1.92 835.3 ± 5.6 5.65 YES
2.95 3.98 826 ± 5.4 5.60 YES
The three-layer tablets produced using the formulation Sucr_2 did not give any separation
of layers, confirming what has been observed for the tablets cylindrical and oblong bilayer.

76
Furthermore, a disintegration test has been performed on the three-layers tablets obtained.
The test reported values coherent with the values previously obtained for each single layer,
therefore we can state that the manufacturing of a multi-layer tablet does not affect the
disintegration time of each single layer.

77
5 Conclusions
The three-layer tablets of sucralfate and ibuprofen lysine salt were produced using the
compression simulator.
The formulations were first characterized by the manufacture of cylindrical tablets
monolayer; followed by studying several reports about the compressibility of the
formulations, defining some key parameters such as the breaking strength, the tensile
strength and the energies involved in the compaction process. From the studies carried out
it was observed that the addition of lactose in the formulation of sucralfate determines a
reduction of the total plastic energy, due to an increase of elastic energy.
The next step involved the manufacture of cylindrical bilayer tablets, where it was evaluated
the adhesion between the adjacent layers. The cylindrical bilayer tablets formed from the
formulation Sucr_1 they encounter the phenomenon of separation of the layers during the
step of expulsion of the compression process. This was not observed for cylindrical two-
layer tablets comprise the Sucr_2 formulation containing lactose. It is therefore hypothesized
that the presence of lactose in the formulation of sucralfate limits the separation of the layers,
although causing a considerable increase in the energy of ejection.
For dosing issues, due to a limit imposed by the compression simulator, it has gone from
EURO D cylindrical punches to oblong EURO D punches, which allow to load a matrix in
the majority of powder volume. Bilayer tablets can be manufactured with the oblong tooling,
and this confirms what has already been observed for cylindrical two-layer tablets.
The last part of the thesis project involved the manufacture of three-layer tablets, using the
Sucr_2 formulation containing lactose. The three-layer tablets were made without following
the separation of the layers.

78
Chapter II

79
1 Introduction
1.1 Problematics encountered during the production of multi-
layer tablets of ibuprofen lysine and sucralfate
The development of the Ibuprofen-lysine/Sucralfate layered tablets is a complex procedure,
which starts with the formulation of each single layers (that have to respect the desired drug
release profiles) and end with the combination of the previously formulated layers in a single
tablet. This final product must be prepared taking into account its physical and chemical
stability, thus modifying certain procedure parameters that will exert a relevant effect on the
multi-layer tablets critical mechanical properties, as shown in the first part of this thesis.
In fact, the currently used procedure to prepare multi-layer tablets is to subject the powder
of the lower layer to a precompression (tamping) pressure and then, once the powder of the
second layer is distributed above the precompressed first layer, to apply a main compression
pressure [31]. The precompression step is critical: a high precompression force reduces the
possibilities of cross-contamination between the layers, but also decreases the roughness
of the interfacial surface, diminishing the contact surface between the layers, thus enhancing
the probability of a delamination [32].
It is also critical to consider the difference in mechanical properties under compression
between the different powders. Plasticity and brittleness, but also size and shape of the
particles can interfere with the interfacial adhesion. This parameters are all studied
extensively in the current pharmaceutical literature [23].
The main problem that occurs during the manufacturing of the bilayer tablet is delamination
[24]. It corresponds to the splitting of the tablet at the interface between the layers. This

80
separation between the layers may take place just after compaction or later during the
storage. Some explanation of the delamination phenomena can be found in the literature,
and this phenomenon is related to different parameters such for example the elastic
recovery of the two layers or the roughness of the interface. It was also shown that the
process parameters can influence the interfacial strength. For example, to ensure a good
cohesion, the pressure applied to the first layer should be kept to a minimum, and the
pressure applied on the second layer should be high enough.
1.1.1 Testing the interfacial strength of a multi-layer tablet
During the first part of this thesis, a qualitative approach to the subject was taken, by simply
registering whether or not the tablet was delaminated after the compression cycle. But no
real information was given on the actual strength of the formed interface. This should be of
interest, given the fact that several compression parameters where changed, along with
excipients and shape of the punches, during the manufacturing of the different batches.
Due to the importance of the adhesion at the interface between layers, it is critical to perform
a relevant and robust method to quantify its strength. This is also a matter that is becoming
of more interest as with the development of Quality by Design (QbD) for the manufacturing
of a bilayer tablet. Product and processing understanding is a key element to QbD. As such,
it is clear that the control of each single step and the quantification of each single parameter
should be as accurate as possible [20].
When applying the QbD methodology to the design of a bilayer tablet, the accurate
quantification of the mechanical resistance of interface between the two layers is necessary
to correctly assess the quality attributes of the final product.
Unfortunately, as currently stated by the European Pharmacopoeia (ver. 8), there is no
standard methodology to measure the interfacial strength of bilayer tablet. The only

81
methodology that is described in the European pharmacopeia to test the strength of tablet
is the diametral compression test but in the corresponding monograph, there is no reference
of its use in the case of bilayer tablets. Nevertheless, several articles in literature can be
found that perform the diametral compression test to characterize the interfacial strength of
a bilayer tablet (and therefore the final robustness of the tablet itself).
On the other hand, other testing methodology are acknowledged, such as the relatively new
indentation test [33]. This test proved, with a pharmaceutical quality by design approach, to
be suitable for the measurement of the interfacial adhesion of bilayer tablets. Another test
that is currently under investigation is the shear test [34]. This fixture is described carefully
in the material and methods of this publication. Lastly, it is possible to measure the interfacial
strength via traction testing [17]. This testing is operatively complicated to execute, because
the examined bilayer tablets must be individually glued to two tablet holders using a fast-
acting glue and left, for example, for an hour to ensure a good adhesion. It must be also
ensured that no glue migrate through the pores up to the interface of the examined bilayer
tablets.
1.1.2 Testing the influence of the shape of the interface on the strength of a
multi-layer tablet
The study of the compaction of pharmaceutical powder in multi-layer tablets is often
performed on flat faced tablets due to the difficulty in precisely measure the compression
parameters (stresses applied and punch displacement) when using complex shaped
punches. Unfortunately, the results obtained using flat punches cannot always be
generalized to the cases of more complex punch shapes [35]. This is in contrast with the
industrial tendency to use convex shaped punches when preparing both single layer and
multi–layer tablets. This is not only because a convex shape is more commercially

82
appealing, but also because of technical reasons. For example, convex tablets tend to be
less fragile and it is easier to perform a coating on a convex tablets, because this shape
prevent the adhesion between tablets during the coating procedure [36].
Previous studies performed on tablets with convex shape for both experimental and showed
that the results obtained for convex shape, i.e., the density and stress distributions, are
different from the ones obtained on flat faced tablets [35]. A recent publication [37]
underlined that, in the case of convex tablets, the density distribution was also influenced
by the thickness of the compact. These results show that, even if they are obtained under
the same compression load, tablets obtained using different punch curvatures are difficult
to compare and may have different mechanical properties.
In the case of bi-layer tablets the shape could thus play an important role in the adhesion
between the layers. Nevertheless there is, to our knowledge, only one study about the effect
of the punch curvature on the interfacial strength of bilayer tablet [38]. In the cited study, the
comparison was performed between bilayer tablets manufactured with two different sets of
tooling: 12.77 mm diameter round flat faced B type tooling, and 20.47 mm 10.90 mm capsule
shaped D type tooling. The authors compare the interfacial strength of bilayer tablets
obtained with these two sets under the same compression force. Unfortunately, these two
punch sets have a very different projected surface area. The tablets obtained can thus be
hardly compared and the results showed in this paper should be taken with caution.
Considering the existing literature on convex tablets, two main differences are expected
between bilayer tablets made with flat or concave punches. The first one is the possibility of
having a curved interface, the curvature being linked with the respective values of the
precompression and main compression pressure. The second one is the fact the concave
punches give a more heterogeneous stress distribution at the interface. These two aspects
could have an influence of the interfacial strength of the tablet, and this is the focus of the
present study.

83
This work aims to compare the interfacial strength of convex and flat-faced bilayer tablets.
For this purpose, several batches of tablets were produced, flat-faced, biconvex but also
tablets obtained with one flat punch and one concave punch. The non-symmetric
configuration was used to try to separate the effects due to the curvature of the interface
and those due to the stress distribution. The interfacial strength was tested using a
previously presented indentation test [39]. The obtained results were submitted to a
statistical analysis.

84
2 Purpose
To try to clarify the testing conditions, we chose in this work to use three different tests to
study the interfacial strength of a model formulation: diametral compression, shear test and
indentation test. These three tests were chosen because they are easy to perform,
applicable to various compacts shape and they don’t necessitate specific sample
preparation. As such, they could be chosen as a standard test at an industrial level. The aim
was to study if these three tests were indeed able to discriminate tablets with different
interfacial strength or if they should be avoided for the characterization of the interfacial
strength of bilayer tablets, and this will be the focus of the first part of discussion of this work.
Then, after resolving the necessity of validating a testing method, the matter of the influence
of the shape on the strength of the tablet will be addressed. When considering the existing
literature on convex tablets, two main differences are expected between bilayer tablets
made with flat or concave punches. The first one is the possibility of having a curved
interface, the curvature being linked with the respective values of the precompression and
main compression pressure. The second one is the fact the concave punches give a more
heterogeneous stress distribution at the interface. These two aspects could have an
influence of the interfacial strength of the tablet, and this is the focus of the present study.
This work aims to compare the interfacial strength of convex and flat-faced bilayer tablets.
Finally, after assessing both the testing methodology and the shape of the influence, a final
investigation on the strength of the bilayer tablet made of Ibuprofen Lysine/Sucralfate will be
performed. This will lead to a Design of Experiment where the water content of the
sucralfate, the bilayer production parameters and the storage conditions will be considered
as factors. The expected responses include a quantitative measure of the interfacial
strength.

85
3 Comparison of breaking tests
In this study, several tests were compared in order to understand if there is a proper way of
testing a multilayer tablet.
3.1 Materials and Methods
3.1.1 List of excipients
Microcrystalline cellulose (Vivapur 12, JRS PHARMA GmbH & Co, Rosemberg,
Germany)
Lactose (Flowlac 90, Meggle, Wasserburg, Germany)
Magnesium Stearate (ACEF, Fiorenzuola d'Arda, Piacenza, Italy)
3.1.2 Manufacturing of tablets
As studied in previous works, and as explain above, the main process parameters that have
an influence on the strength of a bilayer tablets are the applied force on the first layer and
the main compaction force. Then, in order to compare the ability of each test to discriminate
the robustness of a bilayer tablet, tablets with different mechanical strengths at their
interface were produced by playing with these 2 process parameters.
The compaction experiments were performed using a Styl’One Evolution compaction
simulator (Medelpharm, Lyon, France). This device is a single punch tableting press,
monitored by Analis software. The displacement of the upper and lower punches is
controlled electronically.
The pressure applied by the punches to the powder bed is measured with strain gauges.
The machine can be also controlled with a given pressure to be reached. For all the

86
experiments, the tablets were produced using standard Euro D round and flat punches with
a diameter of 11.28 mm.
Bilayer tablets were manufactured using a model formulation: microcrystalline cellulose for
the first layer, and spray-dried lactose as second layer, adding 1% of magnesium stearate
to both powders as a lubricant. The filling height for the layers was adjusted to obtain a total
height of about 10 mm before compaction for the layer of microcrystalline cellulose, and 8
mm for the layer of lactose. The filling height will remain constant for every tablet produced.
These filling highs were chosen to obtain bilayer tablet in which both layers have
approximately the same thickness.
In order to have tablets with different interfacial strengths, tablets were produced in two
different batches: varying the applied main compaction force but keeping the tamping force
applied on the first layer constant (Batch 1), and keeping the main compaction force constant
but modifying the tamping force (Batch 2) (Table XXIV).

87
Table XXIV: Parameters (Tamping and Main Compaction Pressures) of
the batches of tablets produced
Batch 1
Tamping pressure (MPa) Main Compaction Pressure (MPa)
10 100
10 150
10 200
10 300
10 400
Batch 2
Tamping pressure (MPa) Main Compaction Pressure (MPa)
10 300
25 300
40 300
According to the literature, in the first batch, the adhesion between the layers should
increase with the maximum compaction force. For the second batch, the adhesion should
decrease with increasing tamping force.
3.1.3 Tablets testing
As already discussed, different tablet breaking tests and mechanisms were taken into
account. Those are the Diametrical breaking test, the indentation test and the shear test
(Fig. 26).

88
Figure 26: A, diametrical test; B, indentation test; C, shear test.
3.1.3.1 Diametrical Breaking Test applied to bilayer compacts:
For this test, a Micropress (Cegitab, Lyon, France) tester was used. The tablet is placed
here vertically between two anvils (Fig. 26A). The instrument can apply a displacement of
the upper anvil at a constant rate (0.05 mm/min) the upper punch, thus squeezing the tablet.
The load is measured using a force transducer with a resolution of 0.01 N. The measured
force for each value of displacement applied is recorded, with a frequency of 10 Hz. This
apparatus allows to obtain a Force/Displacement curve.
3.1.3.2 Indentation Test
An adapted version of the previously illustrated Micropress (Cegitab, Lyon, France) was
used. The bilayer tablets were put on a V-support with an opening angle of 90° and a depth
of 6 mm (Fig. 26B). The samples were then stressed with a punch designed for the
experiment. The punch tip is a half cylinder shape with a diameter of 2.80 mm and a width
of 6 mm. The system is designed to apply a stress, through the very tip of the punch, exactly
at the interface between the layers. The breaking force corresponds to the breaking force

89
needed to separate the two layers of the tablet. This force is determined at the maximum of
the force-displacement curves obtained during the test.
3.1.3.3 Shear Test
For this test, a TA HD Plus apparatus (Stable Micro System, Surrey, UK) was used. The
tablet is inserted into a fixture cavity so that the tablet layers lie in the plane of a “guillotine-
like” blade (Fig. 26C). A layer of the bilayer tablets must fit perfectly inside the cavity, holding
the tablet in position for the test, while the other layer is completely outside of the fixed
cavity. The blade then applies an increasing stress on the layer of the tablet outside of the
system until the two layers are sheared apart. This system allows to control of the speed of
the blade. To be in a quasi-static condition, the minimum possible speed allowed by the
machine is used, 0.01 mm/sec.
3.1.4 Numerical Simulation
Finite Element Method (FEM) simulation was performed using Abaqus 6.13 software
(Dassault Systems). Linear elastic model was used to understand the mechanical behaviour
of the tablets. The elastic properties of both microcrystalline cellulose and lactose were
already characterised by using experimental test [30] and their respective values were used
in this simulation. The metal tools (Avils, V-support and punch) were considered with the
elastic properties of steel.

90
3.2 Results and Discussion
3.2.1 Observation of the fracture mechanisms during the different tests
3.2.1.1 Diametrical Breaking Test
When a tablet is broken via diametrical test, a curve displacement/force is obtained, as
shown in Fig. 27.
Figure 27: Example of force recorded vs Displacement applied by the diametrical test
As showed, the force increased with increasing displacement of the upper punch, until it
reached the breaking point. After said breaking point, the value did not drop immediately to
the zero value, because the tablet was not totally broken and still hold in place. At the end
of the test, the tablet did not show any macroscopic sign of delamination.

91
To understand what phenomenon caused the force drop, a batch of tablets was produced
with a tamping force of 10 MPa and a main compression force of 100 MPa. This time, the
test was stopped immediately after the drop and the tablets were carefully examined. The
first observation was that the interface was still cohesive, i.e. no delamination had taken
place. After the MicroPress testing, a further exam of the tablets was conducted by Scanning
Electron Microscopy. The results are shown in Figure 28. The tablets showed no clear
difference at the interface between the 2 layers, before (Fig. 28A) and after (Fig. 28B) the
tablet testing, with no sign of fracture or breaking. However, it is possible to see that a
breaking occurred at the level of lactose layer (Fig. 28B), starting from the interface. In fact,
when examining each layer via SEM, it was clear that the layer of lactose is clearly broken,
with a fracture that propagates though this layer. At the same time, the layer of
microcrystalline cellulose appeared almost unbroken. Fig. 28C and Fig. 28D point out the
difference between the lactose layer before and after the test.

92
Figure 28: SEM images of bilayer tablets tested with the diametrical test. A: interface
before testing; B: interface after testing, C: lactose layer before testing.
D: lactose layer after testing
With this fundamental observation, it was clear that the force drop during this test was not
due to the delamination of the tablet but to the failure of one of the layer.
To further understand what happened during this test, the numerical simulation of the test
was performed. The material properties of both lactose and microcrystalline cellulose tablets
(obtained with a compression pressure of 100MPa) were used. The results of the simulation
are shown in Fig 29. The tablet at the left shows the stress distribution in lactose layer and
at the right is shown the stress distribution in microcrystalline cellulose layer. Some areas of
the tablet were in compression and in order to better represent the tensile stress (which
causes the crack of one layer during this test) the scale was modified and plotted between

93
-5 and 6 MPa. The numerical results, reported in Fig. 29, showed that the stress was
different in the two layers of the tablet. Mainly, the stress was higher in the lactose layer than
in the microcrystalline cellulose layer which means that during this test we solicited more
one layer rather than the other one, depending on their respective mechanical properties.
This explains why only one layer failed during the test, while the other one stays intact.
Thus, all these results show that this test would not be well suited to test the interfacial
strength of bilayer tablets.
Figure 29: Stress (11) distribution inside bilayer tablet.
3.2.1.2 Shear test
In this test one layer of the tablet is fixed inside an ad-hoc adjusted cavity, while the other
layer is exposed to the blade. The blade then cuts through the bilayer tablet at the interface.
Therefore, a curve force (registered on the blade) versus displacement (of the blade itself)
is recorded (Figure 30). The maximum value of the curve corresponds to the breaking point:

94
at this value the layers are completely separated. Then, there is no more resistance applied
by the tablet and the force recorded drops immediately to the zero value.
Figure 30: Force recorded vs Displacement applied by the shear test
3.2.1.3 Influence of the dimensional properties of the tablet
In order to ensure that the resulting shear force has no correlation with the thickness of the
layers and is thus characteristic of the interfacial strength, specific batches of tablet were
prepared. For these batches; the tamping force and the main compression force were kept
constant (10 MPa of tamping pressure and 300 MPa of main compression); varying only the
dosage height of the powder before the tableting cycle. In this way, it is expected that the
final height of each layer will be different. The batches produced are shown in Table XXV.
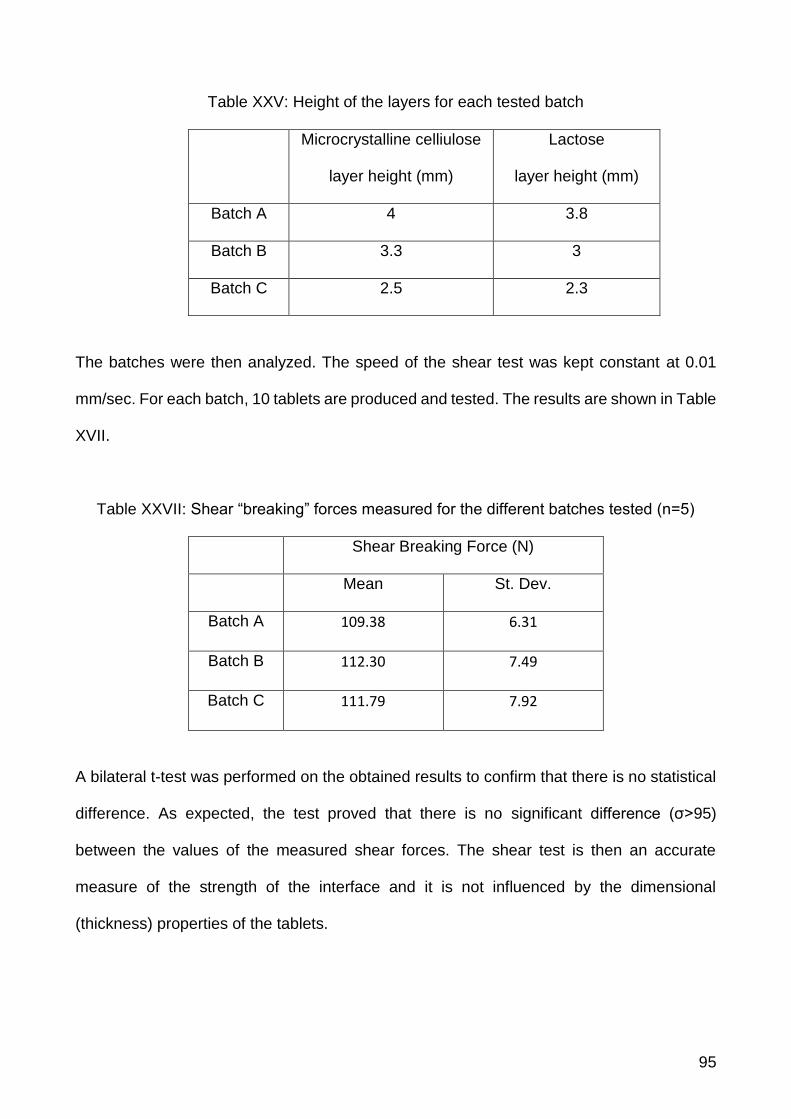
95
Table XXV: Height of the layers for each tested batch
Microcrystalline celliulose
layer height (mm)
Lactose
layer height (mm)
Batch A 4 3.8
Batch B 3.3 3
Batch C 2.5 2.3
The batches were then analyzed. The speed of the shear test was kept constant at 0.01
mm/sec. For each batch, 10 tablets are produced and tested. The results are shown in Table
XVII.
Table XXVII: Shear “breaking” forces measured for the different batches tested (n=5)
Shear Breaking Force (N)
Mean St. Dev.
Batch A 109.38 6.31
Batch B 112.30 7.49
Batch C 111.79 7.92
A bilateral t-test was performed on the obtained results to confirm that there is no statistical
difference. As expected, the test proved that there is no significant difference (σ>95)
between the values of the measured shear forces. The shear test is then an accurate
measure of the strength of the interface and it is not influenced by the dimensional
(thickness) properties of the tablets.

96
3.2.2 Indentation test
As the indentor applies displacement right at the interface of the bilayer tablet, a curve force
versus displacement is obtained (Fig 31). This curve, no matter the bilayer tablet tested, is
characterized by three different parts:
1. Portion of the curve before the first relative maximum (1)
2. First relative maximum point (2)
3. Second relative maximum (3)
Figure 31: Force recorded vs Displacement applied by the indentation test. 1: portion
before the first relative maximum, 2: first relative maximum value; 3: second relative
maximum value
The curve exhibits two clear maximum points. To understand the difference on the structure
of the tablet between these two points, three batches of tablets were analyzed via SEM. For

97
the first batch, the indentation test was stopped immediately before reaching the first
maximum point (2). For the second batch the test was run immediately after the first
maximum point and the third batch undergo until after the second maximum point (3). The
SEM picture are shown in Figure 32. Pictures were taken along the crowned of the tablets,
both at the indentation mark and at 90° respect of the indentation mark to evaluate the crack
propagation.
Figure 32: SEM images of bilayer tablets tested with the indentation test. 1a: indentation
mark before the first maximum point; 2a: indentation mark after the first maximum point;
3a: indentation mark at the second maximum point. 1b: interface before the first maximum
point; 2b: interface cracked after the first maximum point; 3a: interface cracked after the
second maximum point
As it is possible to observe, before the first maximum point the interface appeared to be
intact (1b), except for the mark that the indentor left on the surface corresponding to a local

98
plastic deformation (1a). After the first maximum point, it is possible to observe that there is
a crack at the interface (2b), although it does not propagate on the whole surface. The mark
left by the indentor is clear at this point (2a). After the second maximum point it is possible
to observe both the propagation of the crack at the edges of the indentation mark (3a) and
the complete breaking of the interface of the bilayer tablet (3b). Thus, the indentation test
starts cracking the interface at the maximum point (2). The cracking thus propagates on the
whole interface until point (3) were the tablet is finally delaminated. Therefore, the value of
the first maximum is clearly characteristic of the crack formation at the interface and thus of
the interfacial strength.
3.2.2.1 Numerical Simulation of indentation test
To illustrate this progress of the crack, the numerical simulation of indentation test was
carried out by using Abaqus® software. The adhesion between the two layers was simulated
by defining a surface-based cohesive behaviour implemented in Abaqus/Standard. This
cohesive interaction between the layers was used in conjunction with a crack criterion to
assess the start of the crack and its progress when the applied force increases. A variable
which indicates the crack initiation was added. The possible values of this variable are
between 0 and 1 and when the crack criteria are reached this variable takes the value 1.
The results of the simulation are presented in Fig. 33. Fig. 33A and 33D show the beginning
and the end of the test respectively and Fig. 33B and 33C the intermediate states of the test.
It can be seen that at the beginning of the test, the interface remains intact. As the applied
force increases, the crack starts near the applying point of the force and progresses toward
the bottom of the tablet. These findings are coherent with the experimental results.

99
Figure. 33: Crack start and its growth (A–D) at the interface of bilayer tablet during the
indentation test
3.2.3 Experimental results for batches 1 and 2.
As stated above, to check the ability of the different tests to characterize the interfacial
strength of the tablets, two batches of tablets were produced. The results for batch 1 are
presented in Fig. 34.
As stated in the literature, it is expected that the interfacial strength should increase with
increasing compaction force. For each test an increase of the measured force was indeed
observed. Nevertheless, for indentation and shear test, the force seemed to reach a plateau
for main compression values higher than 20kN. This trend was not observed for the
diametral compression.

100
The results for batch 2 are presented in Figure. 35. For this batch, the interfacial strength
should decrease when increasing the tamping force on the first layer. The shear test and
the indentation test measured, as expected, values of breaking force that decreased with
increasing tamping force. On the contrary, the diametrical testing apparatus, did not show
any significant differences when the different batches of tablets compressed with varying
tamping are compared. For this latest test, the breaking force was clearly independent of
the tamping force.
The two previous results can be easily explained by considering the fracture mechanisms
described above. The diametral compression in fact measures, in this case, the cohesion of
the lactose layer and not the interfacial strength. This cohesion, increases with increasing
main compression and there is no reason to obtain a plateau in Fig. 34. Moreover, the
tamping force has no influence on the cohesion of the lactose layer because the cohesion
is driven by the main compaction force. As a consequence, for batch 2, as the main
compression is kept constant, the measured failure force is also constant, whatever the
applied tamping force might be. These results prove that, in this case, the diametral
compression does not measure the interfacial strength of the bilayer compact. Thus, this
test cannot be taken as a reference test for the measure of the interface hardness of bilayer
tablets.
On the contrary, both indentation and shear tests gave results that were expected (Fig. 35),
according to the literature. The measured value is a true characterization of the interfacial
strength of the compact. In conclusion, both tests could be proposed as standard test for
the characterization of the interfacial strength of bilayer tablets instead of using diametral
compression test.

101
Figure.34: Breaking Force for different tests (n=20) versus Main Compaction Force
Figure.35: Breaking Force for different tests (n=10) versus the tamping force.

102
3.3 Conclusions
In this study, three different tests were used for the characterization of the interfacial strength
of bilayer on a model formulation. The diametrical test proved to be not suitable for testing
the robustness of the interface of bilayer tablets. This test is not able to discriminate between
bilayer tablets with different interfacial strength because it just tested the cohesion of one of
the layers. An implementation of a diametrical test in a design space that aims to obtain an
optimized multilayer tablet will lead to an erroneous selection of further parameters in a QbD
procedure. On the contrary, indentation and shear test were able to discriminate tablets with
different interfacial strength. Such tests could be chosen as standard tests for the
characterization of the interfacial strength of bilayer tablets.

103
4 Effect of the shape on the interfacial strength
As already described, in this session tablets with different interfacial shapes are produced
and tested.
4.1.1 Materials and methods
4.1.1.1 List of excipients
Calcium phosphate (DCP, ACEF, Fiorenzuola d'Arda, Piancenza, Italy)
Microcrystalline cellulose (MCCVivapur 12, JRS PHARMA GmbH & Co, Rosemberg,
Germany)
Lactose (Lac, Flowlac 90, (Meggle, Wasserburg, Germany)
Magnesium stearate (ACEF, Fiorenzuola d'Arda, Piancenza, Italy)
4.1.1.2 Tablet production
Three classical excipients were used: microcrystalline cellulose, calcium phosphate
dihydrate and spray-dried lactose. Each powder was lubricated adding 1% of Magnesium
stearate. The blending was performed at 50 rpm for 5 min using a Turbula mixer (Type T2C,
Willy A Bachofen, Muttenz, Switzerland). Two different bilayer systems were produced:
MCC/DCP (MCC first layer, DCP second layer) and MCC/Lac (MCC first layer and Lac
second layer).
In order to produce tablets with different interfacial shapes, 4 different punches were used:
flat-faced and concave faced with three radii of curvature (6, 8 and 11 mm). All the punches
were round Euro B with a diameter of 8mm. Four different punch configurations were used:
upper flat/bottom flat (UF/BF), upper flat/bottom curved (UF/BC), upper curved /bottom flat
(UC/BF) and upper curved/bottom curved (UC/BC). For each configuration with curved
punches, the three radius of curvature were used. For the UC/BC configuration, both

104
punches had the same curvature. Table XXVII summarizes the different punch
configurations used.
Table XXVII: Punch configurations of bilayer tablets produced.
Configuration radius of curvature
upper punch lower punch
UF/BF flat flat
UC/BF
11 flat
8 flat
6 flat
UF/BC
flat 11
flat 8
flat 6
UC/BC
11 11
8 8
6 6
For each configuration, tablets where produced varying the tamping force :0.5kN, 1.5kN,
3.5kN and 5kN [40]. This forces correspond to applied pressure of 10 MPa, 30 MPa, 70 MPa
and 100 MPa respectively. The main tableting force was set to 15kN (i.e. a compacting
pressure of 300 MPa). This makes it possible, on one hand to produce tablets with different
interfacial strength and on the other hand to vary the shape of the interface as it will be
demonstrated below. The force values were chosen based on our experience on the studied
products
The compaction experiments were performed using a Styl’One Evolution compaction
simulator (Medelpharm, Lyon, France). This device is a single punch tableting press,

105
monitored by Analis software. The displacement of the upper and lower punches is
controlled electronically, and the displacement of the punches and the pressures applied
are measured with strain gauges.
4.1.2 Tablet testing
4.1.2.1 Indentation test
The test used was already described in details in session 3. The system is designed to apply
a stress, through the tip of the punch, exactly at the interface between the layers (Fig. 36).
The interface is clearly visible because of the different colors of the layers, despite the curved
punches used.
Figure 36: Frontal and side views of the indentation test
4.1.2.2 Dimension measuring
The shape of the interface was measured after the delamination using an optical binocular
(Meiji Techno, Chikumazawa, Japan) equipped with a digital camera Invenio-3SII (Deltapix,
Hassellunden, Denmark). The images were analyzed with DeltaPix image software
(DeltaPix, Hassellunden, Denmark), able to convert the pixels in dimensional units (mm)

106
after the calibration though a specific calibration bar. The convex shape was evaluated as
the radius of the circle that inscribed it.
4.1.3 Statistical Analysis
The analysis was performed using the software MODDE (Umetrics, Sweden). As it will be
described below, the analysis was performed to study the influence of the curvature of the
upper punch (Cup), the curvature of the lower punch (Cbot) and the tamping force (Tamp)
on both the radius of curvature of the interface and the ratio between the breaking force of
one configuration and the breaking force of the UF/BF configuration obtained under the
same compression parameters. The curvature of the punch was quantified by the inverse of
the radius of curvature of the punch. This made it possible to have a numerical value for flat
punches (0) and to have a factor that increased when the curvature of the punch increased.
The relation between the two factors and the response was obtained by fitting with MLR
(multiple linear regressions) a quadratic model:
𝑅𝑒𝑠 = 𝑏0 + 𝑏𝐶𝑢𝑝𝐶𝑢𝑝 + 𝑏𝑇𝑎𝑚𝑝𝑇𝑎𝑚𝑝 + 𝑏𝐶𝑏𝑜𝑡𝐶𝑏𝑜𝑡 + 𝑏𝐶𝑢𝑝×𝑇𝑎𝑚𝑝𝐶𝑢𝑝 × 𝑇𝑎𝑚𝑝 + 𝑏𝐶𝑢𝑝×𝐶𝑏𝑜𝑡𝐶𝑢𝑝
× 𝐶𝑏𝑜𝑡+𝑏𝑇𝑎𝑚𝑝×𝐶𝑏𝑜𝑡𝑇𝑎𝑚𝑝 × 𝐶𝑏𝑜𝑡
Were “Res” was the response variable and bcup, bTamp, bCbot, bCupxTamp, bCupxCbot, and
bTampxCbot were the model parameters.
The correlation between experimental factors and the response variable was evaluated with
a summary of the fit method which included the goodness of fit (R2) and the goodness of
prediction (Q2). The goodness of the quadratic model was also estimated with ANOVA. The
model was considered good if the difference R2 − Q2 was lower than 0.2, Q2 was higher than

107
0.5 and the p value obtained for the model was lower than 0.05 (which is significant at a
confidence level of 95%).
4.2 Results and discussion
4.2.1 Shape of the interface
As explained above four different punch configurations were used some of them containing
various punch curvatures. The tablets produced with these different configurations were
then tested for interfacial strength. These results will be presented below. But first, to help
to understand the rational of the four configurations chosen, it is necessary to present the
measurement of the shape of the interface made on the delaminated tablets obtained after
the test.
Obviously, the compacts obtained with the BF/UF configuration gave tablet with a flat
interface. These tablets are commonly found in the literature. The results also shown that
the configuration BC/UF gave tablets with a flat interface. The curved punch at the bottom
did not influenced the shape of the interface in this case.
For the two other configurations, BF/UC and BC/UC, it was found the tablets had a curved
interface. The measurement of the interface radius of curvature can be found in figure 37. It
can be noted that the tablet obtained with a tamping pressure of 0.5 kN are not included in
the graph. For these tablets it was difficult to obtain reliable results due to the roughness of
the interface and the low curvature.
The statistical analysis of the results is reported in figure 38. The studied response was the
radius of curvature of the interface. For the system MCC/DCP the statistical parameters
were R2=0.96, Q2=0.90 and p=0.000 and for the system MCC/Lac they were R2=0.96,
Q2=0.91 and p=0.000. Considering the criteria mentioned above the model was found
suitable in both cases.

108
Figure. 37. Radius of curvature of the interface of the tablets as function of the tamping
force. MCC/DCP: UC/BF(a) and UC/BC (b) ; MCC/Lac UC/BF(c) and UC/BC (d)
Fig. 38: Statistical analysis of the influence of the studied factors on the curvature of the
interface (a) MCC/DCP and (b) MCC/Lac

109
The results in Figure 37 indicates that both systems behaved in the same manner. There
were only two significant parameters that influenced the curvature of the interface. The first
one was the curvature of the upper punch. The effect was negative, meaning that the
curvature of the interface increased (i.e. the radius of curvature decreased) when the
curvature of the punch (Cup) increased. This result was easy to foresee.
The other significant parameter was the tamping force. Again, the effect was negative which
means that when the tamping force increased, the radius of curvature decreased, i.e. the
curvature increased. To understand this fact, it is important to think back to process itself.
The tamping force is applied to the first layer, then the second layer is poured into the die.
This means that before the main compression, the shape of the interface is approximatively
equal to the one of the upper punch, whatever the tamping force. But, by increasing the
tamping force, the density of the first layer increases along with its mechanical resistance.
The results shown in Fig. 38 indicate that the second compression tends to flatten the
interface (the radius of curvature of the interface is always higher than the one of the upper
punch). Nevertheless, this flattening is more efficient if the first layer is less densified. Tablets
obtained with a low tamping force will thus have flatter interface than tablets obtained with
high tamping force.
The last of the three parameters, the curvature of the bottom punch (Cbot), is found to be
not significant. Again, as in the case of the configurations that gave flat interfaces, the
curvature of the interface is not influence by the curvature of the lower punch.
Finally, the four punch configurations chosen can be divided into two groups: those that
gave flat interfaces (BF/UF and BC/UF) and those who gave curved interfaces (BF/UC and
BC/UC). Into each group, the two configurations gave the same shape of the interface but,
as they have a different bottom punch, the stress distribution at the interface during the
compression might be different for each configuration. This means that studying the
difference in interfacial strength between the two configurations of a same group will make

110
it possible to study the influence of the stress distribution at the interface without the
contribution of the curvature of the interface. After that, comparing the results between the
two groups will make it possible two study the influence of the shape of the interface on the
interfacial strength.
4.2.2 Study of the interfacial strength
Tablet were made for each punch configuration with the different punch curvatures. Due the
amount of experiment performed, it was not possible to perform all in a single day with the
same powder preparation. Each punch configuration (UC/BC, UF/BC, UC/ BF) was made
on a single day with a fresh batch of powder. To avoid problem of reproducibility from one
day to another, the configuration UF/BF was re-prepared each time to verify day to day
reproducibility and to be sure to be able to compare one configuration to the other.
The results for MCC/DCP tablets are presented in Fig. 39, the results for MCC/Lac are in
Fig. 40. The points that have a breaking force equal to zero on the graph correspond to
tablets that delaminated spontaneously after the ejection. Finally, the statistical analysis of
the results is presented in Fig. 41. As the aim of this study was to characterize the difference
between tablets with flat or curved interface, the response chosen for this analysis was the
ratio between the breaking force of the shaped tablet and the breaking force of the flat tablet
produced under the same condition of tamping force and on the same day. This made it
possible to study the effect of the parameters on the difference between the interfacial
strength with curved interface and with flat interface. The use of the ratio avoids also to have
problems due to the day to day reproducibility as the UF/BF configuration was remade each
day in parallel with the studied configuration. The statistical parameters for each case were:
R2=0.856, Q2=0.756 and p=0.000 for MCC/DCP and R2=0.906, Q2=0.869 and p=0.000 for

111
MCC/Lac. Considering the criteria mentioned above the model was found suitable in both
cases.
Figure 39: Interfacial strength of bilayer tablets MCC/DCP as a function of the tamping
force: (a) BC/UF (b) BF/UC (c) BC/UC. The reference BF/UF configuration is represented
on each graph.
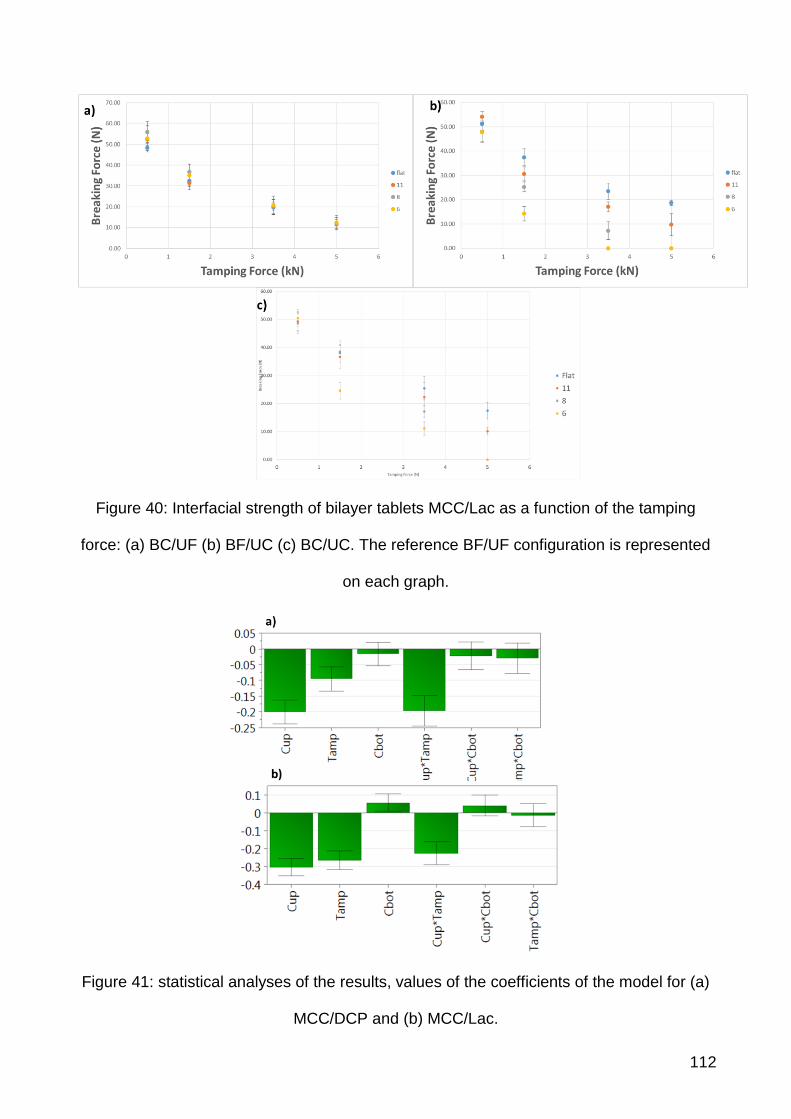
112
Figure 40: Interfacial strength of bilayer tablets MCC/Lac as a function of the tamping
force: (a) BC/UF (b) BF/UC (c) BC/UC. The reference BF/UF configuration is represented
on each graph.
Figure 41: statistical analyses of the results, values of the coefficients of the model for (a)
MCC/DCP and (b) MCC/Lac.

113
As explained above, in this analysis we wanted to try to separate the effect due to the
curvature of the interface and the one due to the stress distribution at the interface during
the compression. For this last point, we needed to compare UF/BF with UF/BC and UC/BF
with UC/BC. This could be made by looking at the parameter Cbot. For the system
MCC/DCP, the parameter was not significant, which means that the curvature of the lower
punch had no influence on the interfacial strength. This can be visualized of fig.39a for the
case of the flat interface: all the configurations gave the same breaking force value. The
same comment can be made for the case of the curved interface by comparing fig.39b and
39c.
For the case of the system MCC/Lac, the coefficient Cbot had a small positive influence
which is given significant by the model (p=0.03). This influence is due to the results of the
tablets with a curved interface. In fact, when looking at figure 40a no difference can be made,
for the tablet with a flat interface, between tablets obtained with flat lower punch and tablets
obtained with curved lower punch. On the contrary for the tablets with a curved interface,
the difference is visible for tamping force of 1.5kN and 3.5kN and punch curvature R6 and
R8. In these case the value of the breaking force was lower when the lower punch is flat
than when it is round. This explains the small positive coefficient found in fig. 40b.
The conclusion about this parameter and about the influence of the stress distribution at the
interface is that, in most of the case, it has no influence on the breaking strength of the tablet,
and in some particular configurations and operative conditions it can have a small influence.
It can thus not be considered as the most influent parameter.
The two other parameters, Cup and Tamp, have a very significant negative impact on the
ratio between the breaking force of the shaped tablet and the breaking force of the flat tablet.
As explained in the first part of the results, increasing Cup and Tamp corresponds to an
increase of the curvature of interface. Moreover, both effects are interdependent as it is
shown by the significance of the parameter Cup*Tamp. This interaction can be seen using

114
the interaction plot presented in figure 42. The response decreases when Cup increases
(i.e. the curvature increases) and this effect is more and more marked when Tamp
increases. These results show that, increasing the curvature of the interface is unfavorable
for the interfacial strength of the tablet.
Figure 42: interaction plot between the parameters Cup and Tamp. (a) MCC/DCP. (b)
MCC/Lac. On each graph, the Y-axis (response) represents the ratio between the breaking
force of the shaped tablet and the breaking for of the flat tablet obtained the same day under
the same conditions of compression.
115
An interesting point is that, for the system MCC/Lac, the curvature of the interface was so
unfavorable that it promoted, in some cases, direct delamination of the tablets after ejection.
This behavior makes it possible to affirm that the decrease of the breaking force measure
during the test is not an artefact due to the test itself but a real effect of interfacial weakening.
This validates, if necessary, the use of the indentation test for the study of bilayer tablet with
a curved interface.
4.3 Conclusion
When producing a bilayer tablet, the shape of the interface is rarely taken into account as
one of the parameters that can influence the adhesion of the two layers. In this work it is
proved that this factor is able to influence bilayer tablets strength. Increasing the curvature
of the interface by increasing the punch curvature and/or increasing the tamping pressure
has a weakening effect of the interface. This can, in some cases, lead to direct delamination
of the tablet under operating conditions that, for flat tablet gives a correct interfacial strength.
When producing bilayer tablet with curved punch, the operating conditions might be set to
obtained tablets with an interface as flat as possible. The easiest way of doing it is to use a
tamping force as low as possible. In this case, the interfacial strength of tablets obtained
using curved punches is comparable to the one of the tablets obtained with flat punches
which is, moreover, higher when low tamping force is used.

116
5 Design of Experiment of a bilayer tablet of Ibuprofen
Lysine/Sucralfate
5.1.1 Materials and Methods
5.1.1.1 Preparation of Ibuprofen Lysine formulation
In order to have a powder that is ideal for compression, a process of wet granulation of the
Ibuprofen lysine and excipients is done.
The excipients showed in Tab XXVIII were mixed in a mortar. As a binder it is used an
alcoholic solution of PVP K 30 (5% w/v). The powder was then granulated used a granulator
with oscillator rotor, equipped with meshes sized 0.8 mm. The granulate was then heated in
oven for 2 hours at 40 °C. Then, the extraganular excipients (Silica, AcDiSol) were added
(highlighted in red in tab IV). Lastly, Magnesium stearate (1%) was added, and then the
powder was mixed in Turbula for 5 min.

117
Table XXVIII: Formulation of ibuprofen lysine granulate.
Extragranular excipients are highlighted in red
Components mg % g %
Ibuprofen lysine 342 83.7 44.97 79.4
Kollidon CL 15 3.7 1.97 3.5
NaHCO3 20 4.9 2.63 4.6
Lactose 20 4.9 2.63 4.6
PVP K30 11.7 2.9 1.53 2.7
SiO2 4 0.9 0.53 0.9
AcDiSOL 16 3.7 2.10 3.7
Magnesium stearate 2 0.5 0.26 0.5
Total 431 100 56.6 100
5.1.1.2 Preparation of Sucralfate formulation
The sucralfate gel (initial WC% 67.2%) was dried using the Fluid bed (40°C; 0.5 bar).
In order to have sucralfate with different water content, two different drying steps, at 15
minutes and at 45 minutes, were performed. Therefore, two batches of sucralfate were
obtained, each one with different water content.
The water content was measured with a scale equipped with an internal heater. This scale
works by heating a sample of the product to a pre-determined temperature (60°C) and
measuring the weight every minute. The measure stops when the sample stops losing
weight. The difference between the initial weight and the final one, in percentage, is the
water content of the sample. Table shows the sucralfate batches prepared with different
water contents.

118
Table XXIX: Prepared sucralfate batches.
Batch Drying time (minutes) Water Content (%)
Sucr_1 15 33.2
Suc_2 45 10.2
. The composition of the layer for each batch of Sucralfate is shown in Table XXX.
Table XXX: Composition of the layer of sucralfate for both batches. In red, the extragranular
components. The percentages are related to the quantity of dried Sucralfate.
Batch 1
Components mg Percentage
Sucralfate 150 mg
Water 15.3 mg 10.2 %
Lactose 30 mg 20 %
Magnesium stearate 1.5 mg 1 %
Total 196.8
Batch 2
Components mg Percentage
Sucralfato gel 150 mg
Water 45.75 mg 30.5 %
Lactose 30 mg 20 %
Magnesium stearate 1.5 mg 1 %
Total 225.75

119
5.1.2 Tablet manufacturing
The compaction experiments were performed using a Styl’One Evolution compaction
simulator (Medelpharm, Lyon, France). This device is a single punch tableting press,
monitored by Analis software. The displacement of the upper and lower punches is
controlled electronically.
The pressure applied by the punches to the powder bed is measured with strain gauges.
The machine can be also controlled with a given pressure to be reached. For all the
experiments, the tablets were produced using standard Euro D round and flat punches with
a diameter of 11.28mm.
For all the experiments, a precompression pressure of 5 MPa was used. This pressure was
kept to a minimum in order to have the maximum possible interfacial strength, as already
studied in the literature.
5.1.3 Design of experiment
A half-factorial design with 5 factors was employed, allowing for the estimation of the main
effects and two factors interactions. The number of experiments to perform for the half
fractional factorial design was 2n-1.
The included factors derive from the formulation aspects, the tableting processes and the
storage conditions. From a formulation point of view, the water content of the Sucralfate
layer was considered, with two different levels. The processes factor considered were the
dwell time, the layer disposition and the main pressure force, each one with two levels. After
the production, the tablets were stored in sealed humidity chambers, with three levels of
storage conditions.

120
It must be noted that the precompression force was be kept constant. This is because the
effect of this parameters is already well-known from the literature, and confirmed by the work
of this thesis in previous paragraphs (3.2.3).
Table XXXI shows a comprehensive list of the factors and levels.
Table XXXI: list of the factors and their levels for the DoE.
Factors Levels
Sucralfate Drying Time 15 min, 45 min
Main Compaction Pressure 100 MPa, 300 MPa
Dwell time 20 ms, 1000 ms
Layer Disposition 1*, 2*
Storage RH 5%, 45%, 75%
1*: the sucralfate layer is precompressed first, then the ibuprofen lysine layer is accommodated in the matrix. 2*: the ibuprofen lysine layer is precompressed first, then the sucralfate layer is accommodated in the matrix.
The design matrix, reported in Table VII included 20 experiments. The design space was
constructed and analyzed with a DoE software, MODDE (MKS Data Analytics Solutions,
Umeå, Sweden). The list of the experiments is shows in table XXXII.

121
Table XXXII: list of the experiment for the DoE.
Experiment
Sucralfate
Drying Time
(min)
Dwell time
(ms)
Layer
deposition
Main pressure
(MPa)
Storage R.H.
(%)
1 15 20 2 300 5
2 45 1000 1 300 75
3 15 1000 2 100 5
4 15 20 1 100 5
5 45 20 1 300 5
6 15 1000 1 300 5
7 15 1000 1 100 75
8 45 20 1 100 75
9 15 20 2 100 75
10 45 1000 1 100 5
11 45 1000 2 100 45
12 45 20 2 300 75
13 45 1000 2 100 75
14 15 20 1 300 75
15 45 1000 1 300 45
16 45 1000 2 300 5
17 15 1000 2 300 75
18 15 20 2 300 75
19 45 20 2 100 5
20 45 20 1 100 45
5.1.4 Tablet analysis
5.1.4.1 Breaking strength test
The previously described indentation test was used. This consist of a V-support with an
opening angle of 90° and a depth of 6 mm, in which the tablet can be placed. The samples
were then stressed with a punch designed for the experiment. The punch tip is a half cylinder
shape with a diameter of 2.80 mm and a width of 6 mm. The system is designed to apply a

122
stress, through the very tip of the punch, exactly at the interface between the layers. The
breaking force corresponds to the breaking force needed to separate the two layers of the
tablet. This force is determined at the maximum of the force-displacement curves obtained
during the test. This test proved to be suitable for testing the strength of a bilayer tablet (3.3)
5.1.5 Storage conditions
In order to store the manufactured batches of tablets in three different humidity conditions,
three different humidity chambers were prepared, as per Table XXXIII. The chambers are
kept at the desired humidity level by filling them with a saturated salt solution, and letting
them equilibrate for 2 days. This bottles were placed inside humidity chambers pre-
equilibrated at 25°C/11.3% RH; 25°C/43.6% RH and 25°C/75% RH respectively. At
predetermined time points, a bottle was pulled from the oven and tested for hardness,
dimensions and weight.
Table XXXIII: tablets storing conditions
5.2 Results and discussion
5.2.1.1 Responses and statistical analysis
The studied responses are the breaking strength of the tablets
Salt Solution Final Humidity
Sodium Chloride 75%
Potassium Carbonate 45.5%
Silica Gel 5%

123
after 1 day of storage and after 7 days of storage. Then, in order to compare them, the
fraction between the two was calculated (Delta Breaking Force). In Table XXXIV there are
the obtained responses for each different run.
Table XXXIV: obtained responses for each run.
Run Order
Breaking Force 1
Day (kN)
Breaking Force 7
Days (kN)
Delta BF
(kN)
1 23.92 13.46 0.437291
2 56.66 38.16 0.326509
3 13.76 2.5 0.818314
4 11.51 6.3 0.45265
5 53.81 60.72 -0.128415
6 17.92 12.25 0.316406
7 10.84 5.4 0.501845
8 21.05 14.03 0.333492
9 12.9 11.51 0.107752
10 36.6 36 0.0163934
11 23.54 19.32 0.179269
12 50.19 39.58 0.211397
13 24.1 7.85 0.674274
14 32.8 28.4 0.134146
15 62.04 56.9 0.0828498
16 52.93 68.54 -0.294918
17 21.2 18.2 0.141509
18 22.6 17.1 0.243363
19 22.9 21.85 0.0458515
20 27.87 17.58 0.369214

124
The model proved to be robust. as shown in Figure 43 there is a correlation between the
measured points and the predicted ones. with a statistically significant r2.
Figure 43: Observed vs Predicted Plot for the values of Breaking Forces.
In order to understand the interaction between the formulation and production factors and
the breaking force of the tablets, the coefficients of the model were studied, and a coefficient
plot was produced. In this plot, only the significant factors and interaction of factors (and
their coefficients) are shown in Figure 44.
Figure 44: coefficient plot of factors and interactions between them

125
Both for the values of breaking force at day 1 and at day 7, the residual humidity of the
Sucralfate layer is one of the most influential factor. As per manufacture parameters, the
main pressure proved to be the most relevant factor. As shown in fig.44 in this design of
experiment is not possible to see an effect of the dwell time and layer disposition.
Finally, the storage time is not relevant on the strength of the bilayer tablets when the tablets
are tested after just 1 day, but its influence starts to increase at day 7.
Always at 7 days, it is possible to measure a cross-effect of the residual humidity of the layer
of sucralfate with the storage conditions. This became of interest considering that this cross
effect is the main effect on the DeltaBF. The interaction is shown in the interaction plot
(Figure. 45)
Figure 45: interaction plot of the Sucralfate humidity levels and the storage conditions.
As shown in Figure 45, the higher the storage RH is the lower is the final breaking force. In
particular, after 7 days of storing the effect of the high storage humidity is extremely relevant,
reducing the strength of the adhesion between the layers no matter what are the condition

126
of sucralfate production. indicating that high storage humidity is especially dangerous to the
correct storing of bilayer tablets at long times. After 1 day, on the other hand, we have a
slight increase in breaking force of the tablet produced with Sucr_1 (showed as RHS (15),
dried 15 minutes, and with a final water content of 33.2%) stored at high RH. This indicates
that for short periods of time, the tablets are more robust when the humidity of the
environment is higher than the water content of the tablet itself. A possible explanation to
this is that the sucralfate, when stored at low humidity conditions, tends to shrink by water
loss, causing structural damages (caused by the changing in dimensions) to the interface in
the process. Oh the other hand the sucralfate produced with a high drying time, Sucr_2
(showed as RHS (45), dried 45 minutes and with a water content of 10.2%) gave much
higher breaking forces than the bilayer made with Sucr_1. In this case, the humidity of the
storing environments has a negative effect on the strength of the tablet, probably because
the sucralfate will retain water from the environment itself, changing his dimension, and
leading to a weakening of the adhesion of the layers.
5.2.2 Optimization of the factor
A optimization process has been performed in order to establish the influence of each factor
on the final breaking force of the bilayer tablet. To include the effect of storing time in the
optimization process, the chosen parameter to optimize is the Breaking Force at 7 days.
The optimization process gave a list of factors, their ideal values, and their coefficient of
influence on the final product. Those are reported in Table XXXV.

127
Tablet XXXV: Factors, ideal values and coefficients of influence
Factor Role Value Factor contribution
RH sucralfate Free 45 18.2067
Dwell time Free 1000 12.4139
Layer disposition Free 2 6.99254
Main Pressure Free 300 20.9197
Storage RH Free 5 41.4672
The role of each factor is set to “free”, meaning that it is possible to modify each factor
independently from the other ones. The results show that, when aiming to the manufacture
of a robust bilayer tablet of sucralfate / ibuprofen lysine, the most important factor to consider
is the storing humidity (contribution of 41.4). In a second instance the effect of the main
pressure of compression became relevant, together with the water content of the sucralfate
(contribution of 20.9 and 18.2 respectively) ideally these parameters are set to the maximum
compression pressure and the driest sucralfate. A minor importance is related to the dwell
time, meaning that it is possible to produce strong tablets even with lower dwell times. This
is important in case of an industrial scale-up, because a high production speed is preferable.
Lastly, the layer disposition does not play an important role (contribution of 6.9), giving the
option to produce bilayer tablets with comparable strength no matter the disposition of the
layers themselves.

128
6 Conclusions
In this part of this work of research, two different aspects were taken in consideration: how
to properly test the strength of a multilayer tablet and how the production parameters
influence the shape of the interface of a multilayer tablet.
As regarding the first part of this work, the reached conclusion is clear: the commonly used
(and approved by the Pharm: European, last version) test is not suitable for testing a
multilayer tablet. In this work, other suitable tests are proposed.
In the second part of the work, different multilayer tablets with different interfaces were
produced. By testing the strength of the interface of each batch of multilayer tablet produced,
it is possible to say that a flat interface gives a more cohesive multilayer tablet.
Lastly, given the conclusion reached, a Design of Experiment for a bilayer tablet of ibuprofen
lysine and sucralfate was conducted. The bilayer tablets were all produced with a flat
interface (to maximize their strengths) and tested with a suitable test. This DoE led to the
conclusion then the characteristic of the product used (such as relative humidity) and
storage conditions are fundamental to determine the robustness of a multilayer tablets.

129
Thesis Conclusions
130
Conclusions
Multilayer tablet technology is a viable way of administering multiple drugs in one single
dosage form. This technology is based on the compression of different layers of powder in
different steps. The research project was devoted to the studying and the application of the
multilayer tableting technology for the preparation of an immediate release dosage form of
ibuprofen lysine and sucralfate. According to the co-tutorship agreement, the research was
carried out both at University of Parma, Italy, and University of Bordeaux, France.
During the first part of the project, carried out at University of Parma, Department of
Pharmacy, several multilayers tablets made of ibuprofen lysine and sucralfate were studied,
in order to test the influence of several parameters of production on the final tablet quality.
During the second part of the project, carried out at the Department of Mechanics and
Engineering of the University of Bordeaux, testing conditions and production parameters of
excipient-made multilayers tablets were studied. This led to defining the best production
parameters (in order to have a robust tablet) and the most suitable way of testing it. Finally,
a design of experiment was performed on the ibuprofen lysine – sucralfate bilayer tablet to
check for the best formulation parameters, production and storage conditions.
The project will continue with a novel Design of Experiment focused of manufacturing the
three-layer tablets (a middle layer of ibuprofen lysine with the first and third layer of
sucralfate). The formulation of the layer of Ibuprofen Lysine will be kept constant (the same
already discussed in this thesis), while different formulations of sucralfate will be studied
according to the DoE.
In particular, this formulation will include different diluents (MCC, Lactose and Starch) with
different quantities and three-layer tablets will be produced and studied.
This DoE will allow us to understand the influence of the different properties of each
excipient in the formulation of a three-layer system.

131
REFERENCES
1. Robbins, C., Review of Pathology. 2010, Elsevier BV. p. ii.
2. Tracy, R.P., The five cardinal signs of inflammation: Calor, Dolor, Rubor, Tumor ...
and Penuria (Apologies to Aulus Cornelius Celsus, De medicina, c. A.D. 25). J
Gerontol A Biol Sci Med Sci, 2006. 61(10): p. 1051-2.
3. Rather, L.J., Disturbance of function (functio laesa): the legendary fifth cardinal sign
of inflammation, added by Galen to the four cardinal signs of Celsus. Bull N Y Acad
Med, 1971. 47(3): p. 303-22.
4. Serhan, C.N. and J. Savill, Resolution of inflammation: the beginning programs the
end. Nat Immunol, 2005. 6(12): p. 1191-1197.
5. Hardwick, J.P., et al., Eicosanoids in Metabolic Syndrome. Adv Pharmacol, 2013.
66: p. 157-266.
6. Caughey, G.E., et al., Roles of cyclooxygenase (COX)-1 and COX-2 in prostanoid
production by human endothelial cells: selective up-regulation of prostacyclin
synthesis by COX-2. J Immunol, 2001. 167(5): p. 2831-8.
7. Brogden, R.N., Non-Steroidal Anti-Inflammatory Analgesics Other than Salicylates.
Drugs, 1986. 32(Supplement 4): p. 27-45.
8. AC, P., Glucocorticoids: effects, action mechanisms, and therapeutic uses. 2011:
Nova Science.
9. Buer, J.K., Origins and impact of the term ‘NSAID’. Inflammopharmacology, 2014.
22(5): p. 263-267.
10. Davies, N.M., Clinical Pharmacokinetics of Ibuprofen. Clinical Pharmacokinetics,
1998. 34(2): p. 101-154.
11. Mehlisch, D., Comparative study of ibuprofen lysine and acetaminophen in patients
with postoperative dental pain. Clinical Therapeutics, 1995. 17(5): p. 852-860.
12. Moore, A.R., et al., Faster, higher, stronger? Evidence for formulation and efficacy
for ibuprofen in acute pain. Pain, 2014. 155(1): p. 14-21.
13. Vladiskovic, C. and N. Masciocchi, Reversibly changing a painkiller structure: A hot
topic for a cold case—Ibuprofen lysine salt. Journal of Pharmaceutical and
Biomedical Analysis, 2015. 107: p. 394-402.
14. D. Hollander, G.N.J.T., Sucralfate. From basic science to the bedside”. 1995,
Plenum medical group Company, New York and London.
15. Dallwig, B., Sucralfate. Journal of Exotic Pet Medicine, 2010. 19(1): p. 101-104.

132
16. Abebe, A., et al., Review of bilayer tablet technology. International Journal of
Pharmaceutics, 2014. 461(1-2): p. 549-558.
17. Akseli, I., et al., Mechanistic characterization of bilayer tablet formulations. Powder
Technology, 2013. 236: p. 30-36.
18. Pramod, K., et al., Pharmaceutical product development: A quality by design
approach. International Journal of Pharmaceutical Investigation, 2016. 6(3): p. 129-
138.
19. Lionberger, R.A., et al., Quality by Design: Concepts for ANDAs. The AAPS
Journal, 2008. 10(2): p. 268-276.
20. Yu, L.X., Pharmaceutical Quality by Design: Product and Process Development,
Understanding, and Control. Pharmaceutical Research, 2008. 25(4): p. 781-791.
21. Food and Drug Administration CDER. Guidance for industry:
Changes to an approved NDA or ANDA. 2004.
22. Haleem, R.M., et al., Quality in the pharmaceutical industry – A literature review.
Saudi Pharmaceutical Journal, 2015. 23(5): p. 463-469.
23. Vaithiyalingam, S.R. and V.A. Sayeed, Critical factors in manufacturing multi-layer
tablets—Assessing material attributes, in-process controls, manufacturing process
and product performance. International Journal of Pharmaceutics, 2010. 398(1-2):
p. 9-13.
24. Podczeck, F., Theoretical and experimental investigations into the delamination
tendencies of bilayer tablets. International Journal of Pharmaceutics, 2011. 408(1-
2): p. 102-112.
25. Dudhat, S.M., C.N. Kettler, and R.H. Dave, To Study Capping or Lamination
Tendency of Tablets Through Evaluation of Powder Rheological Properties and
Tablet Mechanical Properties of Directly Compressible Blends. AAPS
PharmSciTech, 2016.
26. Wu, C.-Y. and J.P.K. Seville, A comparative study of compaction properties of
binary and bilayer tablets. Powder Technology, 2009. 189(2): p. 285-294.
27. Iyer, R.M., et al., The impact of roller compaction and tablet compression on
physicomechanical properties of pharmaceutical excipients. Pharm Dev Technol,
2014. 19(5): p. 583-92.
28. Papós, K., et al., Effect of the surface free energy of materials on the lamination
tendency of bilayer tablets. International Journal of Pharmaceutics, 2015. 496(2): p.
609-613.

133
29. Picker, K.M., Time dependence of elastic recovery for characterization of tableting
materials. Pharm Dev Technol, 2001. 6(1): p. 61-70.
30. Gainotti, A., et al., Effect of residual water content on the physico-chemical
properties of sucralfate dried gel obtained by microwave drying. Drug Dev Ind
Pharm, 2005. 31(7): p. 645-52.
31. Abebe, A., et al., Review of bilayer tablet technology. Int J Pharm, 2014. 461(1-2):
p. 549-58.
32. Kottala, N., et al., Evaluation of the performance characteristics of bilayer tablets:
Part I. Impact of material properties and process parameters on the strength of
bilayer tablets. AAPS PharmSciTech, 2014. 13(4): p. 1236-42.
33. Busignies, V., et al., Development of a new test for the easy characterization of the
adhesion at the interface of bilayer tablets: Proof-of-concept study by experimental
design. International Journal of Pharmaceutics, 2014. 477(1-2): p. 476-484.
34. Klinzing, G. and A. Zavaliangos, Understanding the Effect of Environmental History
on Bilayer Tablet Interfacial Shear Strength. Pharmaceutical Research, 2013. 30(5):
p. 1300-1310.
35. Sinka, I.C., J.C. Cunningham, and A. Zavaliangos, Analysis of tablet compaction. II.
Finite element analysis of density distributions in convex tablets. Journal of
Pharmaceutical Sciences, 2004. 93(8): p. 2040-2053.
36. Gad, S.C., Pharmaceutical Manufacturing Handbook, Production and Process.
2008: Wiley-Interscience.
37. Diarra, H., et al., Investigating the effect of tablet thickness and punch curvature on
density distribution using finite elements method. International Journal of
Pharmaceutics, 2015. 493(1-2): p. 121-128.
38. Jason Franck, A.A., Rekha Keluskar, Kyle Martin, Antara and N.K.H.S. Majumdar,
Axial strength test for round flat faced versus capsule shaped bilayer tablets.
Pharmaceutical Development and Technology, 2013. 20(2): p. 139-145.
39. Virginie Busignies, V.M., Harona Diarra, Pierre Tchoreloff, Development of a new
test for the easy characterization of the adhesion at the interface of bilayer tablets:
Proof-of-concept study by experimental design. International Journal of
Pharmaceutics, 2014 477 p. 476–484.
40. Podczeck, F., Theoretical and experimental investigations into the delamination
tendencies of bilayer tablets. International Journal of Pharmaceutics, 2011. Volume
408(Issues 1–2): p. 102–112.

134
LIST OF PUBLICATIONS
POSTER
Comparison of breaking tests for the characterization of the interfacial strength of
bilayer tablets; Luca Castrati, Vincent Mazel, Virginie Busignies, Harona Diarra,
Alessandra Rossi, Paolo Colombo, Pierre Tchoreloff. APV 10th Word Meeting, April
2016, Glasgow (UK).
Influence of layer composition and compaction parameters on the manufacturing of
sucralfate / ibuprofen lysine bi-layer tablets. A. Rossi, L. Castrati, M. Molinari, G.
Colombo, D. M. Rekkas, S. Politis, R. Bettini, P. Colombo. APV 10th Word Meeting,
April 2016, Glasgow (UK).
PUBLICATIONS
Luca Castrati, Vincent Mazel, Virginie Busignies, Harona Diarra, Alessandra Rossi,
Paolo Colombo, Pierre Tchoreloff. Comparison of breaking tests for the
characterization of the interfacial strength of bilayer tablets. Int. J. Pharm. 513 (1-2),
709-716 (2016).
Luca Castrati, Vincent Mazel, Harona Diarra, Virginie Busignies, Pierre Tchoreloff.
Effect of the curvature of the punches on the shape of the interface and the
delamination tendency of bilayer tablets. Submitted to J. Pharm. Sci.

135

136

137