combined assessment of energy systems and urban planning
TRANSCRIPT
HAL Id: hal-02180948https://hal.archives-ouvertes.fr/hal-02180948
Submitted on 11 Jul 2019
HAL is a multi-disciplinary open accessarchive for the deposit and dissemination of sci-entific research documents, whether they are pub-lished or not. The documents may come fromteaching and research institutions in France orabroad, or from public or private research centers.
L’archive ouverte pluridisciplinaire HAL, estdestinée au dépôt et à la diffusion de documentsscientifiques de niveau recherche, publiés ou non,émanant des établissements d’enseignement et derecherche français ou étrangers, des laboratoirespublics ou privés.
Combined assessment of energy systems and urbanplanning to evaluate the long-term impact of urban
developmentMatthieu Denoux, Edi Assoumou, Nadia Maïzi
To cite this version:Matthieu Denoux, Edi Assoumou, Nadia Maïzi. Combined assessment of energy systems and urbanplanning to evaluate the long-term impact of urban development. Energy and Society in Transition:2nd International Conference on Energy Research and Social Science, May 2019, Tempe, United States.2019. �hal-02180948�
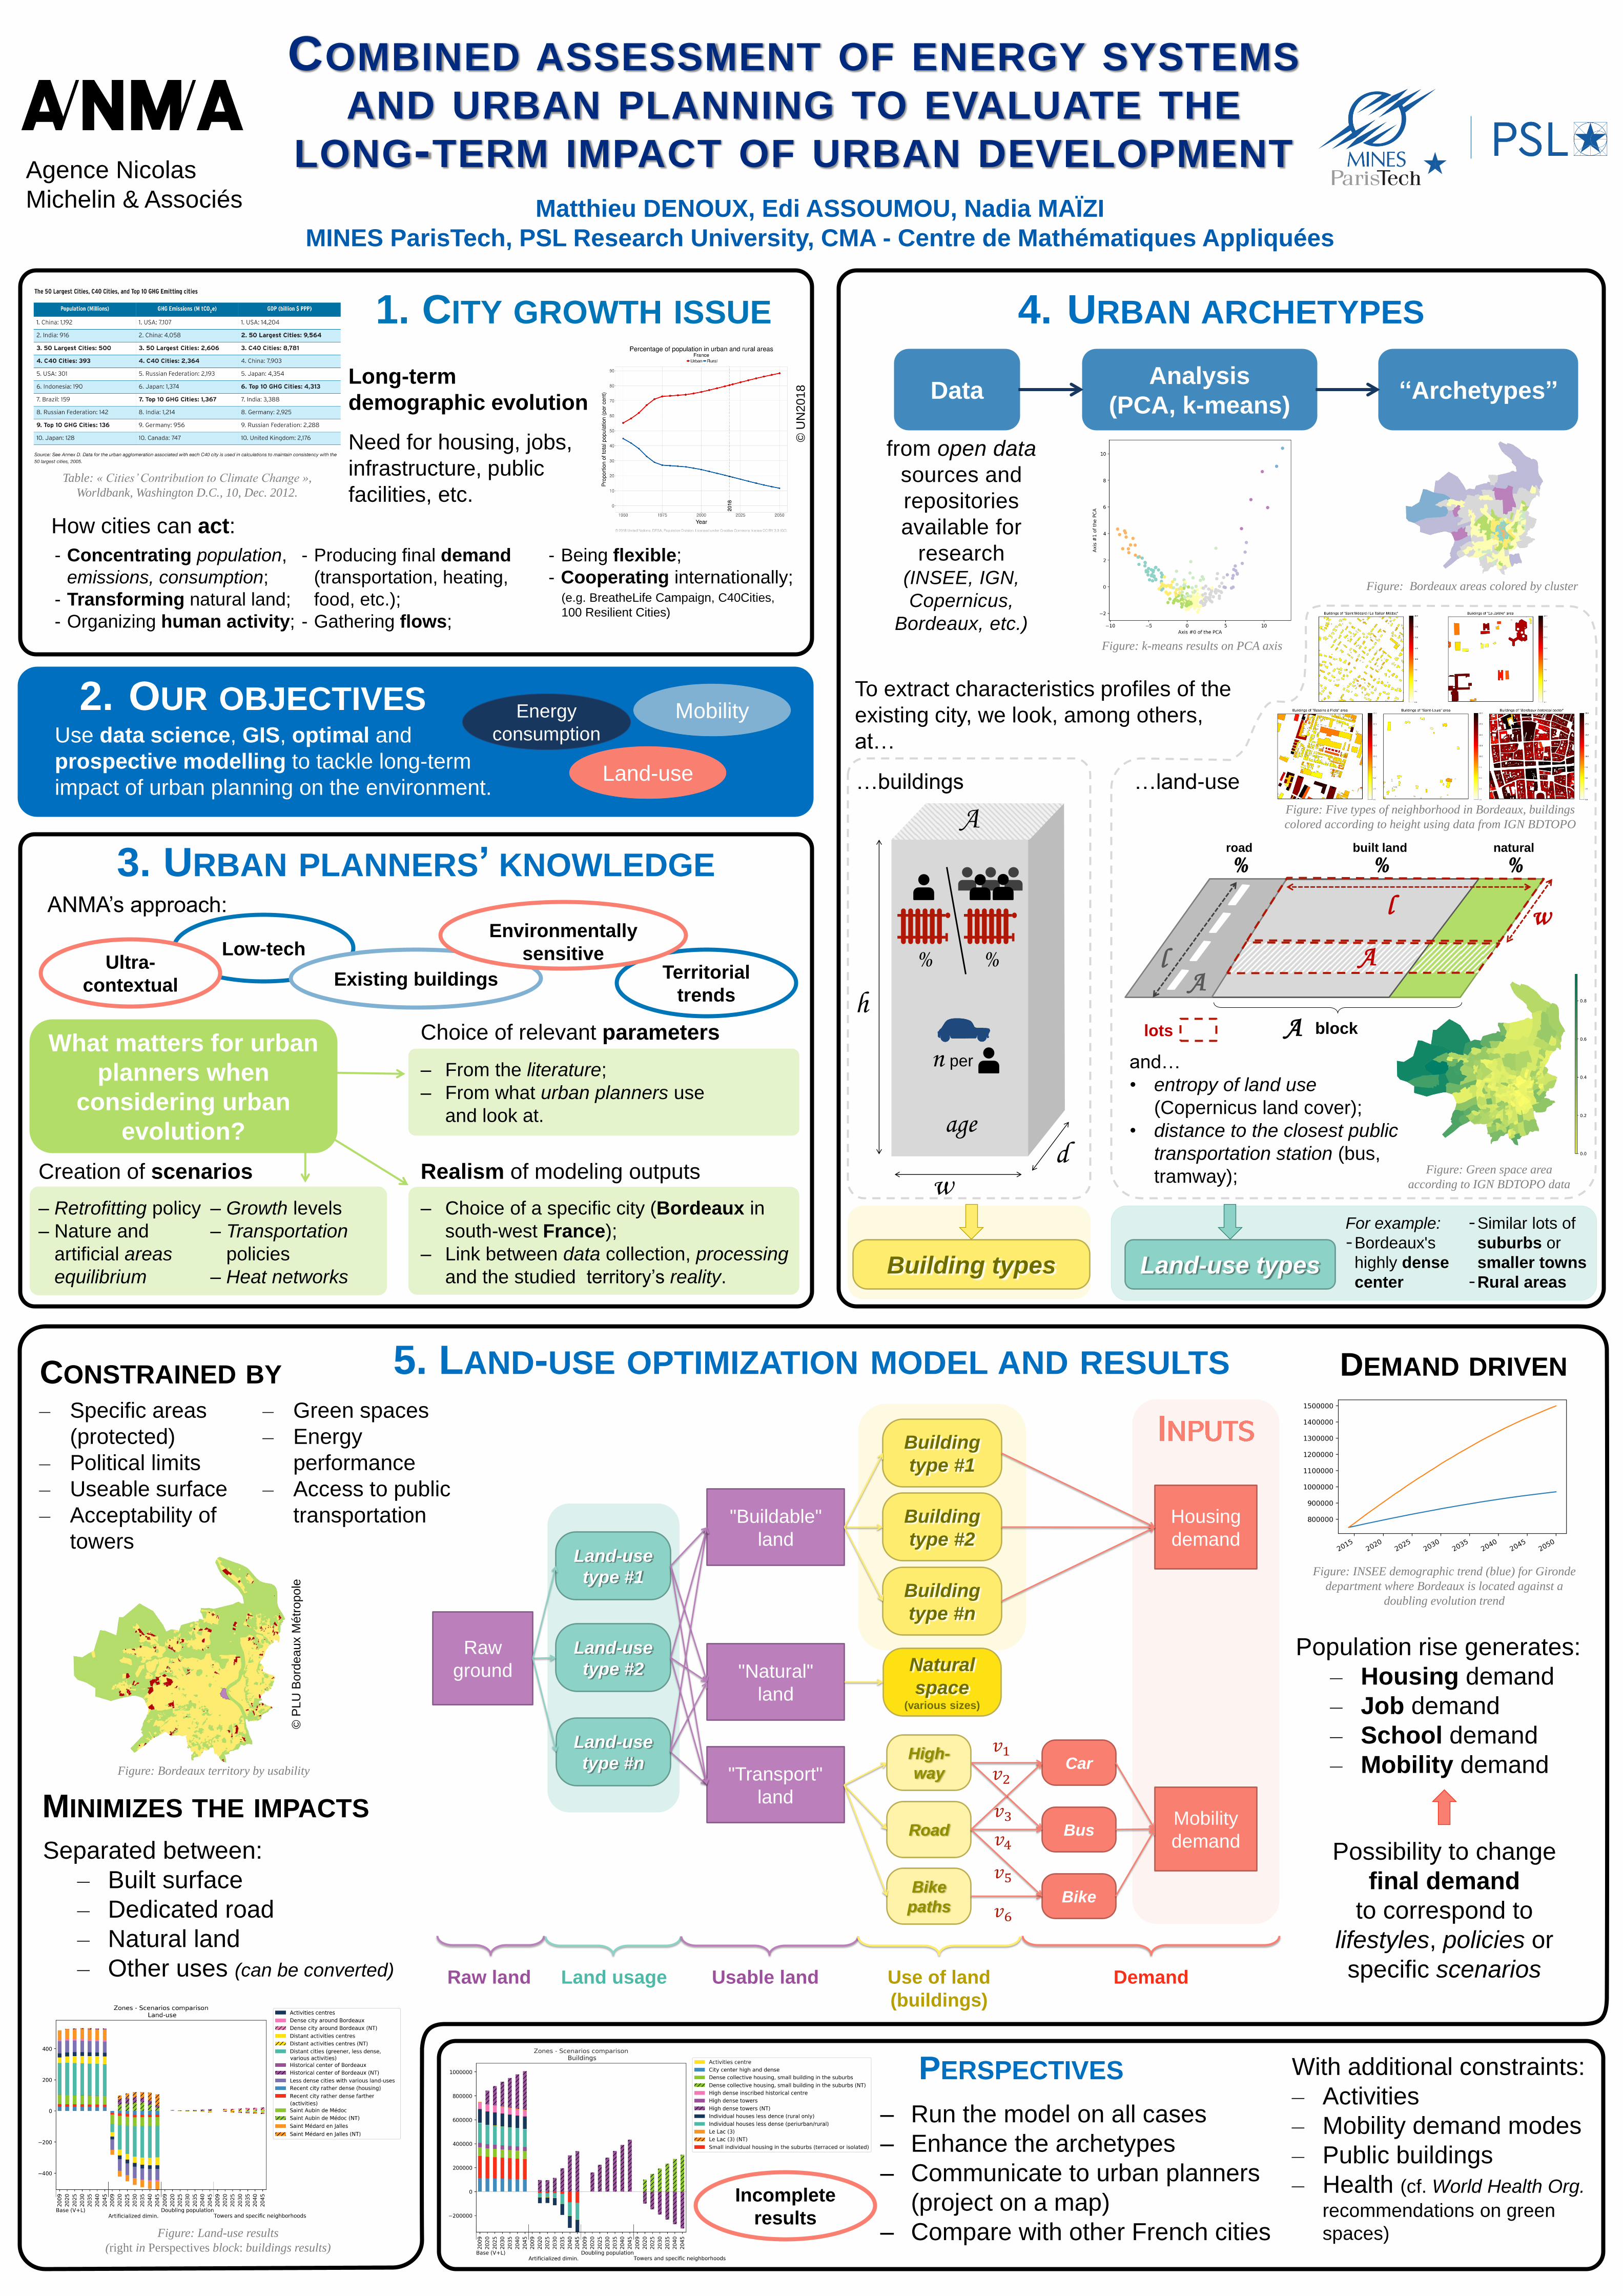
1. CITY GROWTH ISSUE
Matthieu DENOUX, Edi ASSOUMOU, Nadia MAÏZI
MINES ParisTech, PSL Research University, CMA - Centre de Mathématiques Appliquées
COMBINED ASSESSMENT OF ENERGY SYSTEMS AND URBAN PLANNING TO EVALUATE THE
LONG-TERM IMPACT OF URBAN DEVELOPMENT
4. URBAN ARCHETYPES
3. URBAN PLANNERS’ KNOWLEDGE
5. LAND-USE OPTIMIZATION MODEL AND RESULTS
Long-term
demographic evolution
Need for housing, jobs,
infrastructure, public
facilities, etc.
Use data science, GIS, optimal and
prospective modelling to tackle long-term
impact of urban planning on the environment.
Table: « Cities’ Contribution to Climate Change »,
Worldbank, Washington D.C., 10, Dec. 2012.
from open data
sources and
repositories
available for
research (INSEE, IGN,
Copernicus,
Bordeaux, etc.)
ANMA’s approach:
Name Concerns Description
Green Land use Green spaces must always remain, at least, at the base-year level.
Greener Land use Green spaces must expand to, at least, X %.
Towers Buildings Constrains the number of high towers that can be built every year as such
building projects very often meet with opposition.
Artificial Land use Artificial ground must always remain, at most, at the base-year level.
Less artificial Land use Artificial ground must decrease, at most, by X %.
Double population Final demand Population, instead of following INSEE trends, must double before the end.
New way of life Land use &
buildings
New ways of occupying the land from urban planners’ projects.
DEMAND DRIVEN
Population rise generates:
– Housing demand
– Job demand
– School demand
– Mobility demand
Figure: INSEE demographic trend (blue) for Gironde
department where Bordeaux is located against a
doubling evolution trend
Droite :
C:\Users\matthieu.denoux\ownCloud\Code\Graphisme\outputs\insee_trend.png
Milieu :
C:\Users\matthieu.denoux\ownCloud\Valorisation\2019-06-03_IEW\RES\iew_res.pptx
MINIMIZES THE IMPACTS
CONSTRAINED BY
Separated between:
– Built surface
– Dedicated road
– Natural land
– Other uses (can be converted)
– Specific areas
(protected)
– Political limits
– Useable surface
– Acceptability of
towers
– Green spaces
– Energy
performance
– Access to public
transportation
How cities can act:
- Concentrating population,
emissions, consumption;
- Transforming natural land;
- Organizing human activity;
- Producing final demand
(transportation, heating,
food, etc.);
- Gathering flows;
- Being flexible;
- Cooperating internationally; (e.g. BreatheLife Campaign, C40Cities,
100 Resilient Cities) Changes in six areas—water, waste, food, energy, transportation,
and land use—are needed to meet the challenge to
make cities and the vast areas they affect more viable.
the city could align its
consumption with realistic needs, produce more of its own
food and energy, and put much more of its waste to use.
[1]
M. O’Meara, « Reinventing cities for people and the planet »,
Worldwatch Paper, no 147, p. 4-94, 1999.
Creation of scenarios
– Retrofitting policy
– Nature and
artificial areas
equilibrium
– Growth levels
– Transportation
policies
– Heat networks
Realism of modeling outputs
– Choice of a specific city (Bordeaux in
south-west France);
– Link between data collection, processing
and the studied territory’s reality.
Choice of relevant parameters
– From the literature;
– From what urban planners use
and look at.
© U
N2
01
8
Land-use
Droite courbe tendance population
https://population.un.org/wup/Country-Profiles/
Energy
consumption Mobility
Droite :
C:\Users\matthieu.denoux\ownCloud\Code\CalculParametres\input\images\metropole\aire_vegetalisee_pourc.png
Deux schémas :
C:\Users\matthieu.denoux\ownCloud\Valorisation\2019-05-29_ERSS\poster\infographies.pptx
Droite :
C:\Users\matthieu.denoux\ownCloud\Code\AffichageIRISEnigma\out_serveur\images\no_legend_recap_bdtopo_bati_union.png
and…
• entropy of land use
(Copernicus land cover);
• distance to the closest public
transportation station (bus,
tramway);
% road
% built land
% natural
w l
A l A
block lots A Gauche (retiré) :
C:\Users\matthieu.denoux\ownCloud\Code\CalculParametres\input\images\metropole\moyenne_occ_parcelles_non_vides_pourc.png
h
w d
% %
A
n per
age
Figure: Five types of neighborhood in Bordeaux, buildings
colored according to height using data from IGN BDTOPO
Figure: Green space area
according to IGN BDTOPO data
…buildings …land-use
Low-tech
For example:
-Bordeaux's
highly dense
center
-Similar lots of
suburbs or
smaller towns
-Rural areas
Ultra-
contextual Territorial
trends Existing buildings
What matters for urban
planners when
considering urban
evolution?
Raw
ground
Land-use
type #2
Land-use
type #1
Land-use
type #n
"Natural"
land
"Buildable"
land
"Transport"
land
Raw land Land usage Demand
Building
type #2
Building
type #1
Building
type #n
Housing
demand
Usable land Use of land
(buildings)
Natural
space (various sizes)
Road Mobility
demand
Car
Bus
Bike
High-
way
Bike
paths
𝑣1
𝑣2
𝑣3
𝑣4
𝑣5
𝑣6
Environmentally
sensitive
Agence Nicolas
Michelin & Associés
Building types Land-use types
Deux images de résultats d’ACP/K-means
C:\Users\matthieu.denoux\ownCloud\Code\CalculParametres\metropole_output\acp\poster_erss_iris_s
ols_parcelles_porosite_ecoles
Data Analysis
(PCA, k-means) ‘‘Archetypes’’
To extract characteristics profiles of the
existing city, we look, among others,
at…
PERSPECTIVES With additional constraints:
– Activities
– Mobility demand modes
– Public buildings
– Health (cf. World Health Org.
recommendations on green
spaces)
2. OUR OBJECTIVES
© P
LU
Bord
eaux M
étr
opo
le
– Run the model on all cases
– Enhance the archetypes
– Communicate to urban planners
(project on a map)
– Compare with other French cities
C:\Users\matthieu.denoux\ownCloud\Code\CautiousTIMESDrawer\resul
ts_occupation_sols\20190103007_poster_erss
C:\Users\matthieu.denoux\ownCloud\Code\CautiousTIMESDrawer\resul
ts_occupation_sols\20190103007_poster_erss
C:\Users\matthieu.denoux\ownCloud\Projets\Bordeaux\QGis\Projets\PL
U\zones_plu.qgz
Incomplete
results
Possibility to change
final demand
to correspond to
lifestyles, policies or
specific scenarios
Figure: Land-use results
(right in Perspectives block: buildings results)
Figure: Bordeaux territory by usability
Figure: k-means results on PCA axis
Figure: Bordeaux areas colored by cluster