combined revision unit 4: economic activity and energy and start unit 6 urban environments we will...
TRANSCRIPT

Combined revisionCombined revision
Unit 4: Economic activity and energy
AndStart Unit 6 Urban
Environments
We will start Unit 6 – you have the questions – but
most likely we will need to finish this next week with
Unit 7 Fragile environments

2
Remember these?Remember these?
• ‘purple words’ means define them at the start of when you use them
•With reference to named examples means case studies,
•Blue words only use the diagram
•Red words or symbols ‘ , imply ideas from more than one source are needed
•Either using the printed sheets or by flicking through slides 3 – 6, decide if and when these colours are needed

3
Spec 2004 qu 3Spec 2004 qu 3
• (a) Place the letter P next to an example of a primary sector job, and the letter T next to an example of a tertiary sector job.(2)
•Farmer Shopkeeper Car factory worker Shoe maker
• (2)

4
(b) Study Figure 3a, which shows the percentages of (b) Study Figure 3a, which shows the percentages of the working population in the three employment the working population in the three employment sectors of countries A,B,C and D. sectors of countries A,B,C and D.
• (i) Complete the table by writing in the name of the missing sector and the missing percentage.(2)
• Sector: Percentage:• (ii) Which country is likely to be(6)• The USA? Reason • The least economically developed? Reason

5
(iii) 82% of country D’s working population is in (iii) 82% of country D’s working population is in the primary sector. Describe two problems the primary sector. Describe two problems which might result from this dependence on the which might result from this dependence on the sector. (2)sector. (2)
• (c) Explain briefly where your country gets its energy from and why these choices are made.(5)

6
(d) Study Figure 3b which is an advertisement for the (d) Study Figure 3b which is an advertisement for the nuclear power industry.nuclear power industry.
(i) Which two advantages of nuclear power are mentioned? (4)(ii) To what extent do you think the advertisement is ‘fair and balanced’ in its viewsabout nuclear power? Give reasons for your answer.(9)
STOP HERE!STOP HERE!

8
Spec 2004 qu 3Spec 2004 qu 3
• (a) Place the letter P next to an example of a primary sector job, and the letter T next to an example of a tertiary sector job.(2)
•Farmer Shopkeeper Car factory worker Shoe maker
• (2)

9
(b) Study Figure 3a, which shows the percentages of (b) Study Figure 3a, which shows the percentages of the working population in the three employment the working population in the three employment sectors of countries A,B,C and D. sectors of countries A,B,C and D.
• (i) Complete the table by writing in the name of the missing sector and the missing percentage.(2)
• Sector: Percentage:• (ii) Which country is likely to be(6)• The USA? Reason • The least economically developed?
Reason

10
(iii) 82% of country D’s working population is in (iii) 82% of country D’s working population is in the the primary sectorprimary sector. Describe two problems . Describe two problems which might result from this dependence on the which might result from this dependence on the sector. (2)sector. (2)
• (c) Explain briefly where your country gets its energy from and why these choices are made.(5)

11
(d) Study Figure 3b which is an advertisement for the (d) Study Figure 3b which is an advertisement for the
nuclear power industry.nuclear power industry.
(i) Which two advantages of nuclear power are mentioned? (4)(ii) To what extent do you think the advertisement is ‘fair and balanced’ in its viewsabout nuclear power? Give reasons for your answer.(9)

12
3. Production: 3. Production: (a) Study Figures 3a and 3b, (a) Study Figures 3a and 3b, which show employment in the three economic which show employment in the three economic sectors of a sample of countries.sectors of a sample of countries.• (i) Which country
has the highest percentage of its workforce employed in the secondary sector? (1)
• (ii) Use the information from Figure 3a to complete Indonesia’s entry in Figure 3b. (2)

13
3. Production: 3. Production: (a) Study Figures 3a and 3b, (a) Study Figures 3a and 3b, which show employment in the three economic which show employment in the three economic sectors of a sample of countries.sectors of a sample of countries.• (iii) Which one of
the dots labelled A, B or C represents the position of Jamaica (1))
• (v) How does the size of the secondary sector in an LIC differ from the size of the secondary sector in an HIC? Explain why.(2)

14
• (b) Name one occupation that is typical of each of the following three sectors: (3)
•1. Primary sector
•2. Secondary sector
•3. Tertiary sector

15
3. Production: 3. Production: (a) Study Figure 3. It shows Malaysia’s (a) Study Figure 3. It shows Malaysia’s
main exports in 1975 and 2000.main exports in 1975 and 2000.
• (i) Name an export that increased in importance. (1)
• (ii) Name an export that decreased in importance. (1)
• (iii) Are oil and gas renewable or non-renewable sources of energy?(1)

16
3. Production: 3. Production: (a) Study Figure 3. It shows Malaysia’s (a) Study Figure 3. It shows Malaysia’s
main exports in 1975 and 2000.main exports in 1975 and 2000.
• (iv) Which economic sector – primary, secondary, tertiary or quaternary – produced most exports (2)
• 1. in 1975? . 2. in 2000?
• (ii) Name two tertiary sector activities.(2)

17
• (iii) Describe what happens to the tertiary sector as countries like Malaysia develop. (2)
• (c) The growth of manufacturing industry in Malaysia has turned it into an HIC very quickly
• (i) Name one type of manufacturing industry that has grown rapidly in rapidly industrialising countries. (1)
• (ii) With reference to named examples, explain the reasons for this growth.(9)

18
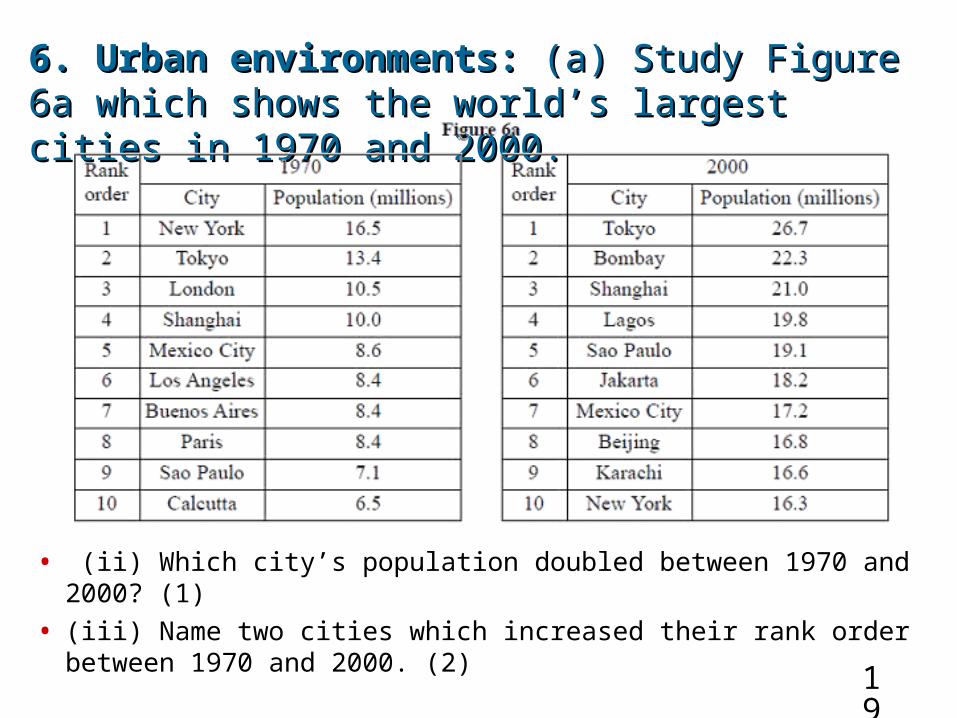
6. Urban environments: 6. Urban environments: (a) Study Figure 6a (a) Study Figure 6a which shows the world’s largest cities in 1970 which shows the world’s largest cities in 1970 and 2000.and 2000.
• (i) Read the statements below and underline the correct statement(1)
• Three of the 1970s cities are found in Europe
• Three of the 1970s cities are found in Asia
19
6. Urban environments: 6. Urban environments: (a) Study Figure 6a (a) Study Figure 6a which shows the world’s largest cities in 1970 which shows the world’s largest cities in 1970 and 2000.and 2000.
• (ii) Which city’s population doubled between 1970 and 2000? (1)
• (iii) Name two cities which increased their rank order between 1970 and 2000. (2)

20
• (b) Name one city in a LIC, where there was rapid population growth between 1970 and 2000. (1)
• (i) Give two reasons for this rapid growth.(2)
• (ii) Describe two problem caused by this rapid growth in an area that you have studied (4)
• (iii) With reference to that named place, explain how these 2 problems are being tackled.(6)

21
• (i) Which profile shows a street in the C.B.D.? (1)
• (ii) Give reasons for your choice and why it is like that.(7)
• (d) This information could has been gathered by fieldwork. What is the method used, and how would you plan to gather similar information?
(c) Study Figure (c) Study Figure 6b which shows 6b which shows the profiles of two the profiles of two streets, A and B, streets, A and B, in a Brazilian city.in a Brazilian city.

22
• (d) This information could has been gathered by fieldwork. What is the method used, and how would you plan to gather similar information?

23
(a)Study Figure 6 which (a)Study Figure 6 which shows part of a mega-shows part of a mega-city in an LEDC (Less city in an LEDC (Less Economically Developed Economically Developed Country). Four typical Country). Four typical shanty town locations shanty town locations are marked are marked AA, , BB, , C C and and DD..
• (i) What is a shanty town? (2)
• (ii) Explain how shanty towns contribute to the growth of mega-cities in LICs (2)

24
(a)Study Figure 6 (a)Study Figure 6 which shows part which shows part of a mega-city in of a mega-city in an LEDC (Less an LEDC (Less Economically Economically Developed Developed Country). Four Country). Four typical shanty typical shanty town locations are town locations are marked marked AA, , BB, , C C and and DD..• (iii) For two of the
locations marked A, B, C or D, give reasons why a shanty town is located there(4)

25
(a)Study Figure 6 (a)Study Figure 6 which shows part which shows part of a mega-city in of a mega-city in an LEDC (Less an LEDC (Less Economically Economically Developed Developed Country). Four Country). Four typical shanty typical shanty town locations are town locations are marked marked AA, , BB, , C C and and DD..• (iv) Suggest why
people are moving from location B out towards locations A and C. (2)

26
• [Look back] (v) Describe the ‘development spine’ shown on Figure 6 and suggest why this development is in this location.(4)
• (b) How would you find out about the quality of the environment in different parts of the city? (6)
• (c) How do developments in the rural-urban fringe of cities in HICs compare with those in the rural-urban fringe of LIC cities? Use examples to support your answer.(9)

27
(a) Study Figure 6. It gives information about (a) Study Figure 6. It gives information about the built-up area of an LIC city.the built-up area of an LIC city.
• (i) All the squatter settlements are on the same side of the city. Give two other features of the location of these settlements. (2)

28
(a) Study Figure 6. It gives information about (a) Study Figure 6. It gives information about the built-up area of an LIC city.the built-up area of an LIC city.
• (ii) Give three ways in which squatter settlements X, Y and Z differ. (3)
• (iii) Suggest reasons for one of these differences. (2)

29
• (b) (i) What do the letters CBD stand for? (1)
• (ii) State three features of a CBD. (3)
• (c) Give reasons for the development of mega-cities.(4)
• (d) How would you carry out a land-use survey? (6)
• (e) Why are there zones of land use within a city? An example may help your answer. (9)

30
(a) Study Figure 6, which shows a city in an HIC (High (a) Study Figure 6, which shows a city in an HIC (High Income Country).Income Country).
• (i) On which side of the city did the boundary grow outwards between 1984 and 2004? (1)
• (ii) What geographical term describes the outward spread of a city? (1)

31
(a) Study Figure 6, which shows a city in an HIC (High (a) Study Figure 6, which shows a city in an HIC (High Income Country).Income Country).
• (iii) Describe the locations of the two superstores. (2)
• (iv) Suggest why superstores in HICs are often found in such locations. (4)

32
• (b) Give the meaning of two of the following terms:
• l brownfield site
• l greenfield site
• l urban sprawl.
• (b) Explain why changes in land use on the edges of cities need careful management. (4)
• (ii) For a named HIC city, describe how these changes are being managed. (9)
• [For this, you can use Manchester – talk about how the Trafford centre was sited, and how this replaced the now abandoned industrial area, and what happened around the old Port, which meant they managed NOT to build on new greenfield areas, but used old brownfield sites instead –also Colshaw Farm Estate, the post-war overspill estate]