combined sewer overflow abatement in boston harbor
TRANSCRIPT
Design Study
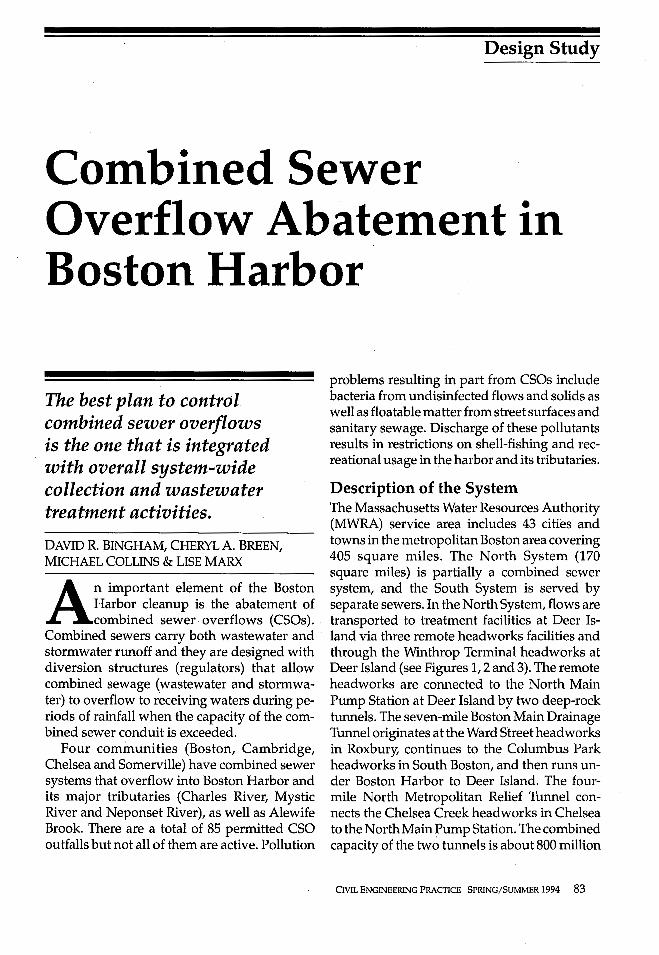
Combined Sewer Overflow Abatement in Boston Harbor
The best plan to control. combined sewer overflows is the one that is integrated with overall system-wide collection and wastewater treatment activities.
DAVID R. BINGHAM, CHERYL A. BREEN, MICHAEL COLLINS & LISE MARX
An important element of the Boston Harbor cleanup is the abatement of combined sewer overflows (CSOs).
Combined sewers carry both wastewater and stormwater runoff and they are designed with diversion structures (regulators) that allow combined sewage (wastewater and stormwater) to overflow to receiving waters during periods of rainfall when the capacity of the combined sewer conduit is exceeded.
Four communities (Boston, Cambridge, Chelsea and Somerville) have combined sewer systems that overflow into Boston Harbor and its major tributaries (Charles River, Mystic River and Neponset River), as well as Alewife Brook. There are a total of 85 permitted CSO outfalls but not all of them are active. Pollution
problems resulting in part from CSOs include bacteria from undisinfected flows and solids as well as floatable matter from street surfaces and sanitary sewage. Discharge of these pollutants results in restrictions on shelUishing and recreational usage in the harbor and its tributaries.
Description of the System The Massachusetts Water Resources Authority (MWRA) service area includes 43 cities and towns in the metropolitan Boston area covering 405 square miles. The North System (170 square miles) is partially a combined sewer system, and the South System is served by separate sewers. In the North System, flows are transported to treatment facilities at Deer Island via three remote headworks facilities and through the Winthrop Terminal headworks at Deer Island (see Figures 1, 2 and 3). The remote headworks are connected to the North Main Pump Station at Deer Island by two deep-rock tunnels. The seven-mile Boston Main Drainage Tunnel originates at the Ward Street headworks in Roxbury, continues to the Columbus Park headworks in South Boston, and then runs under Boston Harbor to Deer Island. The fourmile North Metropolitan Relief Tunnel connects the Chelsea Creek headworks in Chelsea to the North Main Pump Station. The combined capacity of the two tunnels is about 800 million
CIVIL ENGINEERING PRACTICE SPRING/SUMMER 1994 83

... N th or h Sewer Revere Branc
Chelsea Bran
... East Boston Metro Winthrop ch Sewer .... (Caruso) ...
Terminal .... Pump Station
... Headworks ..... Trunk
Wakefield Branc & Trunk Sewers
h .... Sewer
North Metro-
Millbrook Va Sewer & Reli
lley ef Sewer
H - Chelsea Creek politan Deer Island -Main Pump
t ,... Headworks Relief,...
... Station
North Metro Sew & Relief Sewer
er
H North Metro Relief Sewer
Tunnel
t ~l 1 ,
Lexington Branch Sewe
Alewife Charlestown
~
Cambridge, Deer Island Charlestown &
r
North Charle Metro Sewer
s
-,... Pump Station
Wastewater. Pump Somerville-Medford Treatment Station Branch Sewers Faciiity
• South Charle Relief Sewer :i -,...
Ward Street Boston Main Drainage Tunnel
To Harbor
Charles River Valley Sewer
... Headworks t Outfalls ...
Columbus Park Headworks
FIGURE 1. North System headworks and tunnels schematic.
gallons per day (mgd), which coincides with the combined peak flow capacity of 788 mgd of the upgraded North Main Pump Station.
The North Metropolitan Trunk Sewer conveys flows from portions of communities near Deer Island and from the East Boston (Caruso) Pump Station that has a capacity of 125 mgd. This pump station conveys dry and wet weather flow from East Boston, Chelsea and Revere; it also conveys excess wet weather flow that is tributary to the Chelsea Creek headworks. The North Metropolitan Trunk Sewer flows are tributary to the Winthrop Terminal headworks (which will have an upgraded capacity of 125 mgd), located at the plant site. · Combined Sewer System. About 14 square miles of the North System area is served by combined sewers within Boston, Cambridge, Chelsea and Somerville. These systems were generally constructed between 1860 and 1900. Figures 2 and 3 show the extent of drainage area tributary to the CSO outfalls, including combined sewer areas and areas served by separate storm drains that discharge via CSO outlets.
84 CML ENGINEERING PRACTICE SPRING/SUMMER 1994
There are approximately 81 active outfalls (shown in Figures 2 and 3) that are owned and operated by the four communities or the MWRA. Of these active outfalls, 45 are owned and operated by the Boston Water and Sewer Commission (BWSC). The BWSC and the other three CSO communities receive an annualmunicipal permit from the MWRA that authorizes their wastewater and combined sewer discharges into the MWRA' s system. In addition, all of the communities and the MWRA have National Pollution Discharge Elimination System permits for their CSO outfalls.
Six of the 81 active CSOs are routed through treatment facilities owned and operated by the MWRA. These facilities provide treatment to approximately 50 percent of the system-wide CSO volume generated during a typical storm. Characteristics of these facilities are presented in Table 1. Both the Cottage Farm and Prison Point facilities provide detention/ treatment of CSO flows during larger storms, and can capture small storms entirely, returning stored flows to the collection system for conveyance to the Deer

TABLE 1 Existing CSO Treatment Facilities
Facility Name
Cottage Farm
Prison Point
Somerville Marginal
Constitution Beach
Fox Point
Commercial Point
• Rehabilitated in 1988
Location
Memorial Drive near Boston University Bridge Cambridge
Near Museum of Science Bridge Cambridge
McGrath Highway at Route 1-93 Somerville
Moore Street and Cowper Street East Boston Freeport Street near Southeast Expressway Dorchester Park Street near MBTA tracks Dorchester
** Former outfall designation number
First Year of Operation
1971
1980
1973'
1987
1989
1991
Treatment Process
Screening Skimming Settling Chlorination Detention (1 .3 million gallons} Screening Skimming Settling Chlorination Detention (1 .2 million gallons} Dry weather pumping Screening Chlorination
Screening Chlorination
Screening Chlorination
Screening Chlorination
Peak Flow (mgd)
233
323
245
20
119
194
Facility Outfall Number
MWR201
MWR203
MWR205 SOM 007A (Relief)
BOS 002"
BOS 089'" BOS 088 (relief)
BOS 090 ...
••• Facility discharges to the BWSC collection upstream of BWSC existing CSO outfall
Island treatment plant. The remaining four facilities provide flow-through treatment consisting of coarse screening and disinfection. The Constitution Beach, Fox Point and Commercial Point facilities provide treatment at specific outfalls located near recreational areas: Constitution Beach in East Boston, and the Savin Hill, Malibu, and Tenean beaches along the Neponset River and Dorchester Bay shorelines.
The Cottage Farm, Prison Point, and Somerville marginal facilities provide control of CSOs from large tributary areas and can be characterized as regional CSO control facilities. Overflows along the Boston and Cambridge shore of the Upper Charles River are controlled by the Cottage Farm facility. The Prison Point facility controls overflow into the Charles River Basin from Boston, Cambridge and Somerville. The Somerville marginal facility controls overflows from approximately one-third of Somerville's combined sewer network and normally discharges into the Mystic River downstream of the Amelia Earhart Dam.
Effect of Recent Deer Island Improvements. During 1990 and 1991, the MWRA completed several projects to improve the operation and reliability of the existing Deer Island treatment plant that must remain in operation until the new treatment facilities are on-line. Under the "Fast-Track Improvements Program," the power supply was upgraded and augmented through repairs to the electrical distribution system, placement of a new cross-harbor cable and installation of new generators. Five new sewage pumps, along with four new electric pump motors, were installed in the North Main Pump Station to significantly increase overall pumping capacity. In addition, rehabilitation of the primary sedimentation tanks resulted in less off-line time for maintenance and repairs.
Increased pumping capacity at Deer Island has reduced the amount of time that flows are choked back at the head works facilities and has increased the peak flow conveyance capacity of the collection system (see Table 2). As a result,
CNIL ENGINEERING PRACTICE SPRING/SUMMER 1994 85
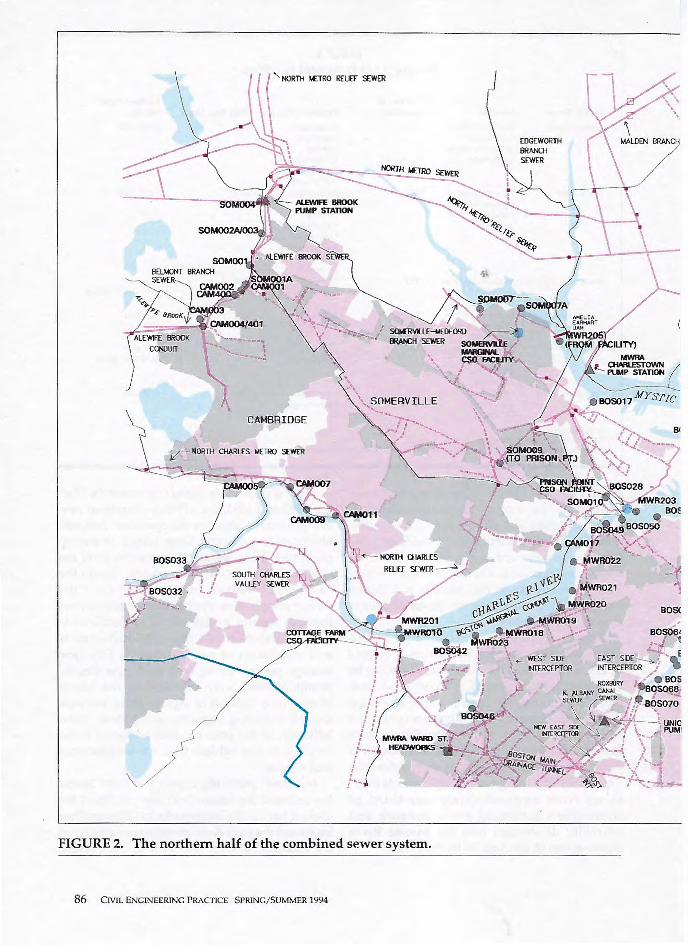


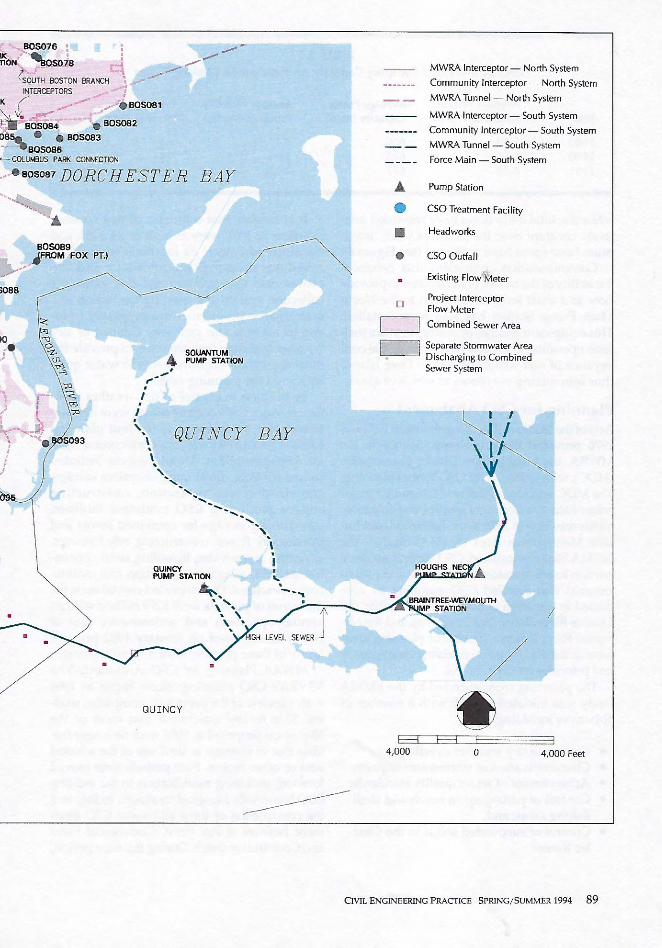
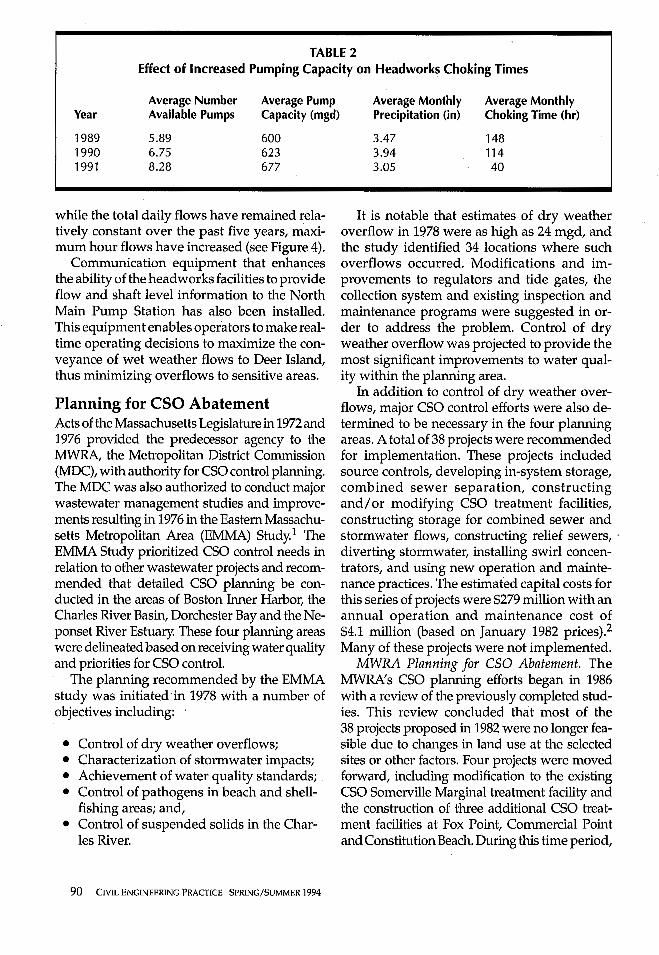
TABLE 2 Effect of Increased Pumping Capacity on Headworks Choking Times
Average Number Average Pump Year Available Pumps Capacity (mgd)
1989 5.89 600 1990 6.75 623 1991 8.28 677
while the total daily flows have remained relatively constant over the past five years, maximum hour flows have increased (see Figure 4).
Communication equipment that enhances the ability of the head works facilities to provide flow and shaft level information to the North Main Pump Station has also been installed. This equipment enables operators to make realtime operating decisions to maximize the conveyance of wet weather flows to Deer Island, thus minimizing overflows to sensitive areas.
Planning for CSO Abatement Acts of the Massachusetts Legislature in 1972 and 1976 provided the predecessor agency to the MWRA, the Metropolitan District Commission (MDC), with authority for CSO control planning. The MDC was also authorized to conduct major wastewater management studies and improvements resulting in 1976 in the Eastern Massachusetts Metropolitan Area (EMMA) Study.1 The EMMA Study prioritized CSO control needs in relation to other wastewater projects and recommended that detailed CSO planning be conducted in the areas of Boston Inner Harbor, the Charles River Basin, Dorchester Bay and the Neponset River Estuary. These four planning areas were delineated based on receiving water quality and priorities for CSO control.
The planning recommended by the EMMA study was initiated in 1978 with a number of objectives including:
• Control of dry weather overflows; • Characterization of stormwater impacts; • Achievement of water quality standards; . • Control of pathogens in beach and shell
fishing areas; and, • Control of suspended solids in the Char
les River.
90 CIVIL ENGINEERING PRACTICE SPRING/SUMMER 1994
Average Monthly Average Monthly Precipitation (in) Choking Time (hr)
3.47 148 3.94 114 3.05 40
It is notable that estimates of dry weather overflow in 1978 were as high as 24 mgd, and the study identified 34 locations where such overflows occurred. Modifications and improvements to regulators and tide gates, the collection system and existing inspection and maintenance programs were suggested in order to address the problem. Control of dry weather overflow was projected to provide the most significant improvements to water quality within the planning area.
In addition to control of dry weather overflows, major CSO control efforts were also determined to be necessary in the four planning areas. A total of 38 projects were recommended for implementation. These projects included source controls, developing in-system storage, combined sewer separation, constructing and/ or modifying CSO treatment facilities, constructing storage for combined sewer and stormwater flows, constructing relief sewers, · diverting stormwater, installing swirl concentrators, and using new operation and maintenance practices. The estimated capital costs for this series of projects were $279 million with an annual operation and maintenance cost of $4.1 million (based on January 1982 prices).2
Many of these projects were not implemented. MWRA Planning for CSO Abatement. The
MWRA's CSO planning efforts began in 1986 with a review of the previously completed studies. This review concluded that most of the 38 projects proposed in 1982 were no longer feasible due to changes in land use at the selected sites or other factors. Four projects were moved forward, including modification to the existing CSO Somerville Marginal treatment facility and the construction of three additional CSO treatment facilities at Fox Point, Commercial Point and Constitution Beach. During this time period,

800-.---------------------------------,
□ Monthly Maximum Hourly Flow (mgd) □ □ □
m!I Average Daily Flow -- 3-Month Moving Average
600 ---------------------------- □---------□ □
□ □
□□
i □ □
□ .S 400 !
- -1:r - - - - -□ -□- - - - - - - - - - - - - - -
u:: m!I
200
0---'---------------------------------' J F MAMJJASO N DJ F MAMJJAS ON DJ F MAMJJAS ON D JF MAMJJASO ND J F MAMJ
1988 I 1989 I 1990 I 1991 I 1992
FIGURE 4. Deer Island flow data.
the BWSC, Cambridge and Somerville also completed a series of in-system modifications (primarily in the Charles River Basin) that were part of the 1982 recommended improvements.
In 1987, as part of the on-going resolution of the federal court suit concerning violations of the Clean Water Act, the MWRA and the U.S. Environmental Protection Agency (USEPA) jointly entered a stipulation clarifying the MWRA's responsibility and legal liability for developing and implementing a comprehensive CSO control program. This filing was followed in August 1987 by a court-ordered schedule requiring the MWRA to prepare a comprehensive CSO facilities plan, to construct additional CSO treatment facilities, and to develop and implement best management practices and system optimization plans.
The MWRA initiated a new facilities planning effort in 1988. The planning area was divided into six study basins including the Inner Harbor, the Lower Charles River, Dorchester Bay, Alewife/Mystic River, the Upper Charles River and the Neponset River. A monitoring
program involving combined sewers, storm drains and receiving waters was initiated and several stotm events were monitored. The combined sewer and storm drain concentration data were used to develop concentrations for CSO and storm water modeling. Modeling was then conducted using the RUNOFF and TRANSPORT blocks of the USEPA Storm Water Management Model (SWMM)3 with the goal of predicting the CSO flows generated by different storm events for existing and future no-action conditions, as well as withdifferent control measures. CSO outfalls and regulators were aggregated into groups to reduce the number of overflow points in the model.
A number of CSO control technologies were evaluated. Preliminary comparison and screening of the technologies based on performance, cost and projected water quality improvements identified the most promising alternatives for further study. Technologies initially screened included best management practices, satellite physical-chemical treatment systems, storage and biological treatment sys-
CIVIL ENGINEERING PRACTICE SPRING/SUMMER 1994 91

TABLE 3 Summary of 1990 Recommended Plan Elements
Recommended Plan Components
Basin Facilities Associated With Tunnel Other
Inner Harbor ■ 60,690-ft. Consolidation Conduit ■ 850-ft. New Storm Drains ■ Eight Drop Shaft Facilities: Two With
Ventilation/Odor Control Systems ■ Manhole Modifications at SOM 006
& SOM 007 ■ Block 26 Outfalls ■ Modify Prison Point and Somerville
Marginal CSO Facilities to Store & Screen Overflows Only
Lower Charles River
■ 14,470-ft. Consolidation Conduit ■ Block 16 Outfalls ■ Three Drop Shaft Facilities ■ Modify Cottage Farm CSO Facility to
Store & Screen Overflows Only
Dorchester Bay ■ 13,600-ft. Consolidation Conduit ■ Block 8 Outfalls
Alewife/Mystic River
Upper Charles River
Neponset River
■ Two Drop Shaft Facilities
terns, and sewer separation. Three technologies - in-system storage, near surface storage and tunnel storage - were identified as the preferable alternatives and were then evaluated for application to the six receiving water basins.
This facilities plan was completed in 1990, with the major recommendation that a deep tunnel storage system be constructed with extensive consolidation conduits. Near surface storage was proposed in the Alewife Brook area and sewer separation was proposed in two localized areas. A summary of the 1990 plan elements is shown in Table 3; Figure 5 presents a map of the proposed deep tunnel storage facilities. The tunnel storage was sized to contain 342 million gallons, enough to reduce overflows to about four per year, capturing 80 percent of the CSO volume and 90 percent of the pollutants. The estimated capital cost of the recommended plan was $1.2 billion with annual operation and maintenance costs pro-
92 CML ENGINEERING PRACTICE SPRING/SUMMER 1994
■ Study Outfall BOS 090 ■ Modify Fox Point CSO Facility to
Screen Discharges Only
■ 9,460-ft. Consolidation Conduit ■ 6.8-mgd Pump Station With 300-ft.
Force Main to Alewife Brook Conduit ■ Block 12 Outfalls
■ Develop SOPs
■ 9, 115-ft. New Storm Drains
jected to be $3.2 million.4,5 Under the recommended plan, the use of the existing CSO treatment facilities would be minimized. Tunnel diversion structures proposed for the facilities would first route flows to the tunnel, with only excess flows going to the existing facilities.
Although the 1990 recommended plan met federal CSO control guidelines, it acknowledged that additional investigations would be necessary prior to implementation and provided suggestions for additional flow monitoring and modeling and for physical inspections of the collection system. In addition, metering and other observations in the CSO community systems were indicating that the CSO volumes were significantly less than predicted by the 1990 plan.6 The results of monitoring performed in Boston Harbor also revealed that there were greater than expected improvements in water quality. These improvements further supported the
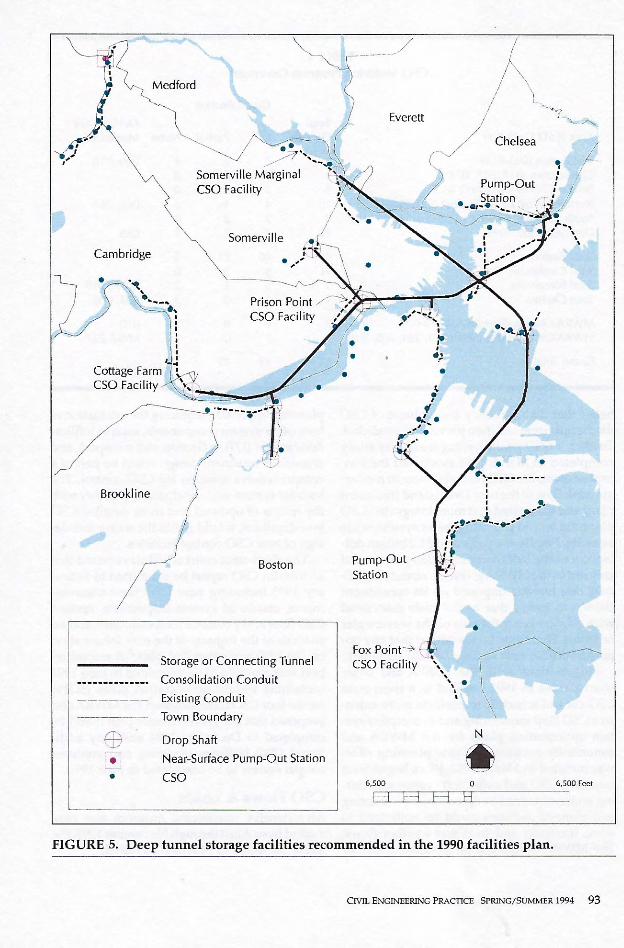
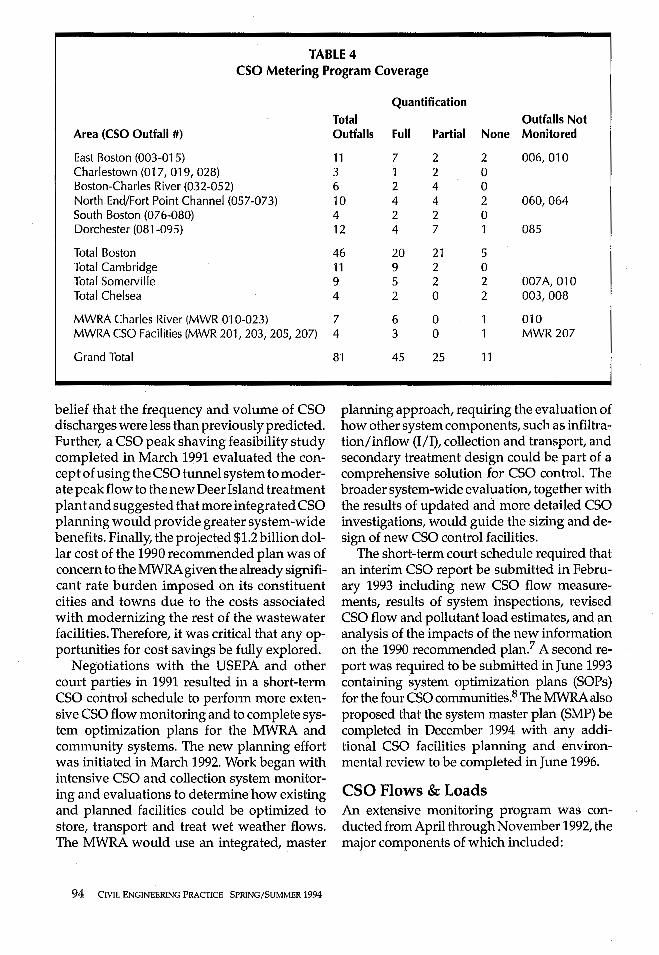
TABLE 4 CSO Metering Program Coverage
Area (CSO Outfall #)
East Boston (003-015) Charlestown (017, 019, 028) Boston-Charles River (032-052) North End/Fort Point Channel (057-073) South Boston (076-080) Dorchester (081-095)
Total Boston Total Cambridge Total Somerville Total Chelsea
MWRA Charles River (MWR 010-023) MWRA CSO Facilities (MWR 201, 203, 205, 207)
Grand Total
belief that the frequency and volume of CSO discharges were less than previously predicted. Further, a CSO peak shaving feasibility study completed in March 1991 evaluated the concept of using the CSO tunnel system to moderate peak flow to the new Deer Island treatment plant and suggested thatmoreintegratedCSO planning would provide greater system-wide benefits. Finally, the projected $1.2 billion dollar cost of the 1990 recommended plan was of concern to the MWRAgiven the already significant rate burden imposed on its constituent cities and towns due to the costs associated with modernizing the rest of the wastewater facilities. Therefore, it was critical that any opportunities for cost savings be fully explored.
Negotiations with the USEPA and other court parties in 1991 resulted in a short-term CSO control schedule to perform more extensive CSO flow monitoring and to complete system optimization plans for the MWRA and community systems. The new planning effort was initiated in March 1992. Work began with intensive CSO and collection system monitoring and evaluations to determine how existing and planned facilities could be optimized to store, transport and treat wet weather flows. The MWRA would use an integrated, master
94 CIVIL ENGINEERING PRACTICE SPRING/SUMMER 1994
Quantification Total Outfalls Not Outfalls Full Partial None Monitored
11 7 2 2 006, 010 3 1 2 0 6 2 4 0 10 4 4 2 060,064 4 2 2 0 12 4 7 1 085
46 20 21 5 11 9 2 0 9 5 2 2 007A,010 4 2 0 2 003,008
7 6 0 010 4 3 0 MWR 207
81 45 25 11
planning approach, requiring the evaluation of how other system components, such as infiltration/ inflow (1/1), collection and transport, and secondary treatment design could be part of a comprehensive solution for CSO control. The broader system-wide evaluation, together with the results of updated and more detailed CSO investigations, would guide the sizing and design of new CSO control facilities.
The short-term court schedule required that an interim CSO report be submitted in February 1993 including new CSO flow measurements, results of system inspections, revised CSO flow and pollutant load estimates, and an analysis of the impacts of the new information on the 1990 recommended plan? A second report was required to be submitted in June 1993 containing system optimization plans (SOPs) for the four CSO communities.8 The MWRAalso proposed that the system master plan (SMP) be completed in December 1994 with any additional CSO facilities planning and environmental review to be completed in June 1996.
CSO Flows & Loads An extensive monitoring program was conducted from April through November 1992, the major components of which included:
• Rainfall gaging; • Flow metering at CSOs, interceptors,
pump stations, headworks facilities and the wastewater treatment plants; and,
• CSO quality sampling.
The major objectives of this program were to characterize existing conditions in the CSO communities and MWRA interceptor system, to provide data of sufficient quantity and quality to calibrate and verify computer models of the sewer system, and to provide data for evaluating and developing the SOPs that maximize use of the collection system for storage. The data collected during this program far exceeded any past data collection efforts in the CSO system, and provided a comprehensive understanding of conditions in the system.
The 1992 Monitoring Program. Temporary rain gages were installed at six locations in the MWRA collection system tributary area, supplementing nine existing rainfall gages operated by the MWRA and others. Temporary meter clusters (consisting of a combination of depth, pressure and velocity sensors, and data storage blocks) were installed at regulators, overflow pipes and tide gates within the CSO community systems. These meter clusters were configured to provide data defining the temporal variations in flow rate and water levels at all active CSOs where such measurements were possible.
The resulting metering program coverage is summarized in Table 4. Many of the outfalls required multiple meters and only a few of the outfalls could not be monitored due to such factors as inaccessibility, blockage or severe tide gate leakage. In total, approximately 75 percent of the combined system area in the four CSO communities was quantified, 20 percent was partially quantified, and less than five percent could not be quantified.
Supplementing the CSO flow monitoring is an extensive set of monitoring data from the MWRA and CSO community interceptors. An existing MWRA program includes over 170 flow meters at community inflow and outflow points (see Figures 2 and 3), as well as at major facilities such as pump stations and headworks. These meters have been in place since 1991 and provide flow and depth data at 15-minute intervals at each location. This ongo-
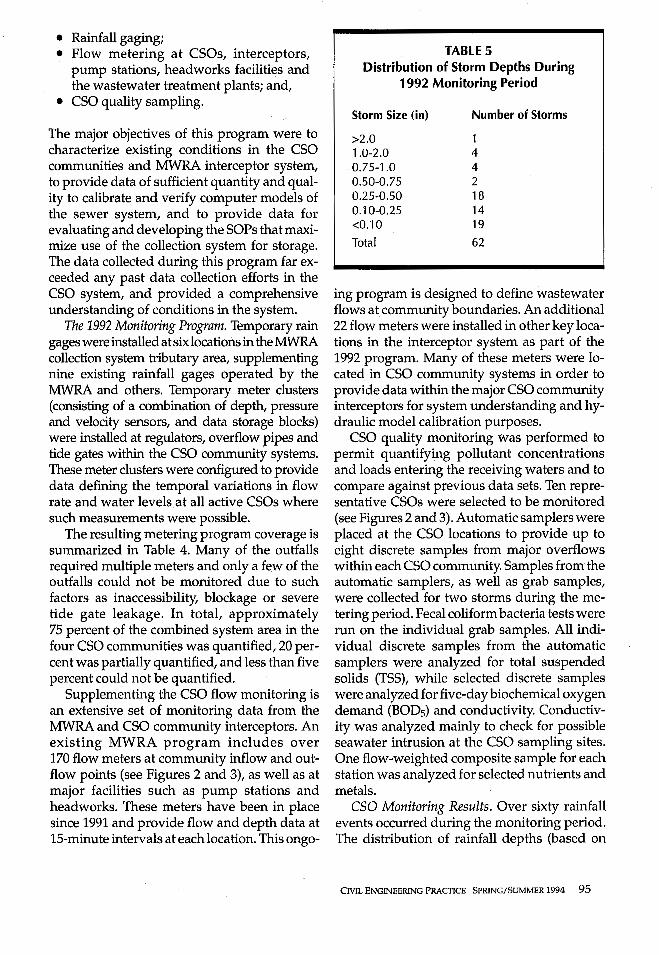
TABLE 5 Distribution of Storm Depths During
1992 Monitoring Period
Storm Size (in)
>2.0 1.0-2.0 0.75-1.0 0.50-0.75 0.25-0.50 0.10-0.25 <0.10
Total
Number of Storms
1 4 4 2 18 14 19
62
ing program is designed to define wastewater flows at community boundaries. An additional 22 flow meters were installed in other key locations in the interceptor system as part of the 1992 program. Many of these meters were located in CSO community systems in order to provide data within the major CSO community interceptors for system understanding and hydraulic model calibration purposes.
CSO quality monitoring was performed to permit quantifying pollutant concentrations and loads entering the receiving waters and to compare against previous data sets. Ten representative CSOs were selected to be monitored (see Figures 2 and 3). Automatic samplers were placed at the CSO locations to provide up to eight discrete samples from major overflows within each CSO community. Samples from the automatic samplers, as well as grab samples, were collected for two storms during the metering period. Fecal coliform bacteria tests were run on the individual grab samples. All individual discrete samples from the automatic samplers were analyzed for total suspended solids (TSS), while selected discrete samples were analyzed for five-day biochemical oxygen demand (B0D5) and conductivity. Conductivity was analyzed mainly to check for possible seawater intrusion at the CSO sampling sites; One flow-weighted composite sample for each station was analyzed for selected nutrients and metals.
CSO Monitoring Results. Over sixty rainfall events occurred during the monitoring period. The distribution of rainfall depths (based on
CNIL ENGINEERING PRACTICE SPRING/SUMMER 1994 95

12 0 ;:o II> 5·
0.36 et
0.72 ~ -, ~,
8
'o 0 co 11) .s "O ,.... s: ;·-.. :::r
0 0 .. ...... u::: !
.. ..,, - Measured Flow ..
0 .. 4 ·•. 4 ::E ..... Measured Depth a
0.___ __ _._ ___ ..1..---__ _,_ ___ .1--_,.._..,_.L..--"'--.___u.u.-... ............ -.iO 0 6 12 18 24 30 36 42 48
Time in Hours From Midnight on 5/30/92
FIGURE 6. Typical flow data for an outfall influenced by tide levels during the June 1, 1992, storm.
averaging the various rainfall gage data) by size is depicted in Table 5. The largest storm event occurred on June 1, with over two inches of rainfall distributed evenly across the whole project area. The recurrence interval of this storm was approximately six months. Although there were many storms during the monitoring period, comparison with long-term records showed that it was typical.
CSO flow data were analyzed with respect to overflow volumes for the storms during the monitoring period, the characteristics of overflows at particular locations, and the major factors (i.e., tidal influence, drainage area size) that affect these characteristics.
Figure 6 shows typical data collected at a CSO outfall (regulator 003-2 in East Boston) including flow rate, depth of flow and rainfall depth for the storm of June 1, 1992. As shown, the water level in the regulator rose to over five feet. The CSO flow rate began to increase and then dropped to zero with the rising tide (also shown on Figure 6). Thus, despite the large rainfall, the tide was able to shut off the overflow and the system was able to contain the
96 CIVIL.ENGINEERING PRACTICE SPRING/SUMMER 1994
combined volume. No flooding is known to have occurred during that storm event. This observation suggests that raising the height of the weir at the regulator could limit overflows without adverse effects. When the tide later decreased, the overflow again activated. This same effect was measured at many tidally affected overflows in the system.
A summary of the response of overflows to rainfall events based on the overflow data is presented in Table 6. This table indicates that none of the overflows activate consistently for small storms of less than 0.1 inches. There are also a number of overflows that require substantial rainfall before they activate. Sixteen overflows did not activate during the program.
Two storm events on November 3 and 22-23, 1992, were monitored for CSO water quality. The data from these two sampling events were compared with CSO quality data from the 1990 recommended plan and data collected by the BWSC. A comparison of the concentrations measured in the outfalls during 1992 with concentrations measured during other recent monitoring programs is provided in Table 7.
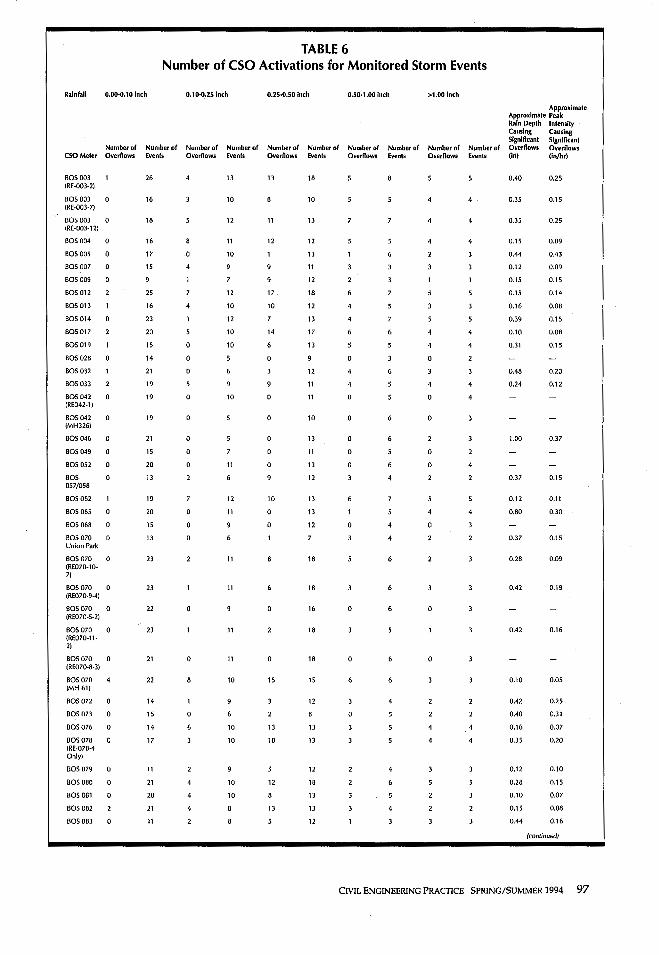
TABLE 6 Number of CSO Activations for Monitored Storm Events
Rainfall 0,00-0, 10 Inch 0.10-0,25 Inch 0.25-0.50 Inch 0.50-1.00 Inch >1.00 inch
Approximale Approximate Peak Rain Depth Intensity · Causing Causing Significant Significant
Number of Number of Number of Number of Number of Number of Number of Number of Number of Number of Overflows Overflows CSOMeter Overflows Events Overflows Events Overflows E.,.ents Overflows Events Overflows Events (iri) (la/hr)
BOS003 26 13 13 18 0.40 0.25 (RE-003-21
BOS 003 16 10 10 4 0.35 0.15 (RE-003-7)
BOS 003 0 18 12 11 13 4 0.35 0.25 (RE-003-121
BOS 004 0 16 11 12 12 4 0.15 0.09
BOS 005 17 0 10 13 0.44 0.43
BOS 007 15 11 0.12 0.09
805 009 12 0.15 0.15
BOS012 25 12 17. 18 0.15 0.14
BOS 013 16 10 10 12 4 0.16 0.08
BOS 014 23 12 13 0.39 0.15
BOS 017 20 10 14 17 6 4 0.10 0.08
805019 15 0 10 6 13 4 0.31 0.15
BOS 028 0 14 0 0 0
BOS 032 21 12 6 0.48 0.20
BOS 033 19 11 4 4 4 0.24 0.12
BOS 042 0 19 0 10 0 11 0 0 (RE042-1)
BOS 042 0 19 0 10 6 0 (MH326)
BOS 046 21 0 13 0 1.00 0.37
BOS 049 0 15 0 0 11 0 0
BOS 052 0 20 11 0 13 6 0 4
BOS 0 13 12 0.37 0.15 057/058
BOS 062 19 12 10 13 0.12 0.11
BOS 065 20 0 11 0 13 4 0.80 0.30
BOS 068 15 0 12 0
BOS 070 0 13 4 0.37 0.15 Union Park
BOS070 0 23 11 18 6 0.28 0.09 (RE070-10-71
BOS 070 23 11 18 0.42 0.19 (RE070-9-4)
BOS 070 0 22 0 16 0 6 0 (RE070-5-2)
BOS070 0 23 11 18 0.42 0.16 (RE070-11-21
BOS 070 0 21 0 11 0 18 0 0 (RE070-8-3)
BOS 070 22 10 15 15 6 0.10 0.05 (MH61)
BOS 072 14 12 4 0.42 0.25
BOS073 0 15 0 0 0.40 0.31
BOS076 0 14 10 13 13 4 0.16 0.07
BOS 078 17 10 10 13 4 0.35 0.20 (RE-078-4 Only)
BOS 079 11 12 4 0.12 0.10
BOS 080 0 21 10 12 18 6 0.28 0.15
805 081 0 20 10 13 0.10 0.07
BOS 082 21 13 13 4 0.15 0.08
BOS 083 0 11 12 0.44 0.16
(continued)
CIVIL ENGINEERING PRACTICE SPRING/SUMMER 1994 97
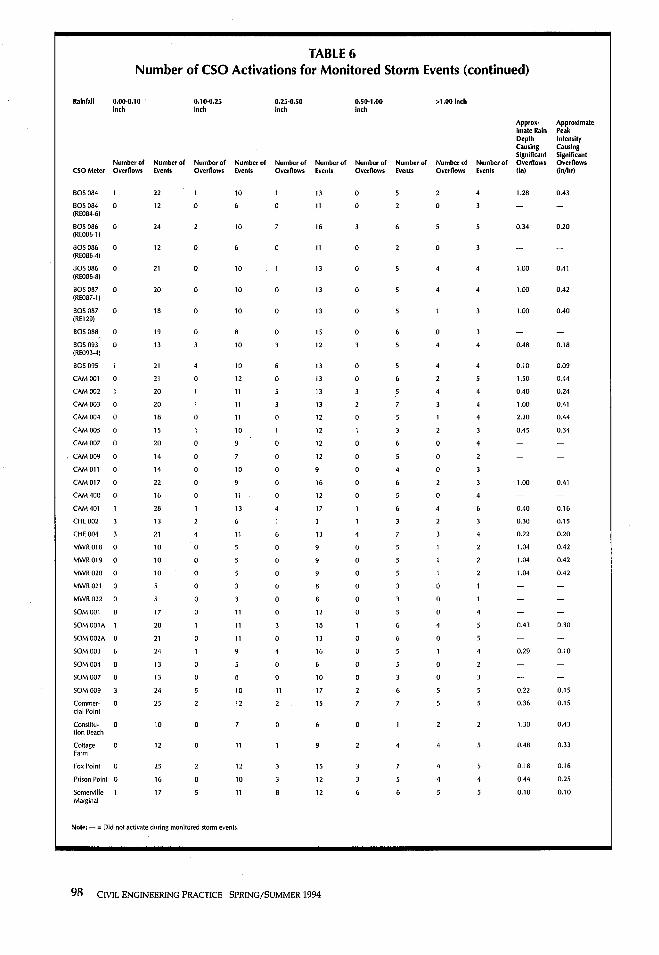
TABLE 6 Number of CSO Activations for Monitored Storm Events (continued)
Rainfall 0.00-0.10 0.10-0.25 0.25-0.50 0.50-1.00 >1.00 Inch inch Inch Inch Inch
Approx• Approximate lmale Rain Peak Depth lntensily Causing Causing Significant Significant
Number of Number of Number of Number of Number of Number of Number of Number of Number of Number of Overflows Overflows CSOMeter Overflows Events Overflows Events Overflows Events Overflows Events Overflows Events (in) (in/hr)
805084 22 10 13 0 1.28 0.43
BOS 084 0 12 0 11 0 0 (RE084-6)
BOS 086 0 24 10 16 6 0.34 0.20 (RE086-1)
BOS 086 0 12 0 11 0 0 (RE086-4)
BOS 086 0 21 0 10 13 0 1.00 0.41 (RE086-8)
BOS 087 0 20 0 10 0 13 0 4 1.00 0.42 (RE087-1)
BOS 087 0 18 0 10 0 13 0 1.00 0.40 (RE129)
BOS 0BB 0 19 0 0 15 0
BOS 093 0 13 10 12 4 0.48 0.18 (RE093·41
BOS 095 21 10 13 0 4 0.10 0.09
CAM00l 0 21 0 12 0 13 0 1.50 0.44
CAM 002 20 11 13 0.40 0.24
CAM003 20 11 13 1.00 0.41
CAM004 1B 11 0 12 2.20 0.44
CAM005 15 10 12 0.45 0.34
CAM007 20 0 12 0
CAM009 0 14 0 12 0
CAM011 14 10 0 0
CAM017 0 22 0 16 1.00 · 0.41
CAM400 0 16 11 0 12 0 4
CAM401 28 13 17 6 0.40 0.16
CHED02 13 0.30 0.15
CHED04 21 11 13 4 0.22 0.20
MWRD18 0 10 0 0 1.04 0.42
MWR019 0 10 0 0 1.04 0.42
MWR020 0 10 0 0 1.04 0.42
MWR021 0 0
MWR022 0 0
SOM00l 0 17 11 0 12 0 0
SOM 001A 1 28 11 18 0.43 0.30
SOM 002A 0 21 11 0 13 0 0
SOM 003 24 16 0.29 0.10
SOM004 0 13 0 0 0
SOM007 0 13 0 10 0
SOM 009 24 10 11 17 6 0.22 0.lS
Commer- 0 2S 12 15 0.36 0.lS cial Point
Constitu- 10 0 0 1.30 0.43 tion Beach
Cottage 12 0 11 4 0.48 0.33 Farm
Fox Point 2S 12 lS 0.18 0.16
Prison Point 0 16 0 10 12 4 0.44 0.2S
Somerville 17 11 12 0.10 0.10 Marginal
Note: - = Did not activate during monitored storm events.
98 CNIL ENGINEERING PRACTICE SPRING/SUMMER 1994
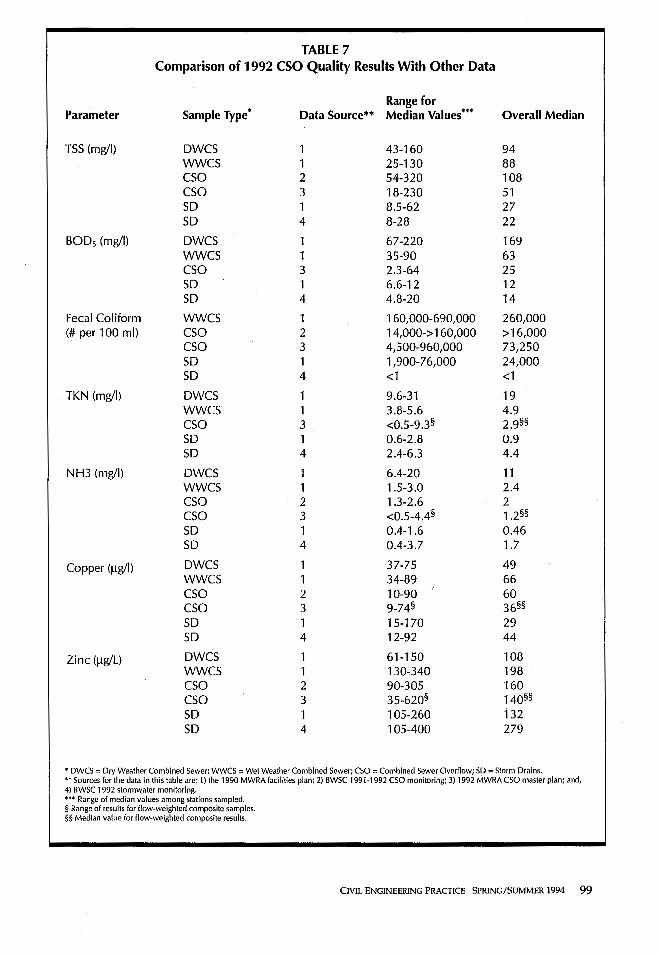
TABLE 7 Comparison of 1992 CSO Quality Results With Other Data
Range for Parameter Sample Type • Data Source** Median Values ••• Overall Median
TSS (mg/I) DWCS 43-160 94 wwcs 25-130 88 cso 2 54-320 108 cso 3 18-230 51 SD 1 8.5-62 27 SD 4 8-28 22
BOD5 (mg/I) DWCS 1 67-220 169 wwcs 1 35-90 63 cso 3 2.3-64 25 SD 1 6.6-12 12 SD 4 4.8-20 14
Fecal Coliform wwcs 1 160,000-690,000 260,000 (# per 100 ml) cso 2 14,000-> 160,000 >16,000
cso 3 4,500-960,000 73,250 SD 1 1,900-76,000 24,000 SD 4 <1 <1
TKN (mg/I) DWCS 1 9.6-31 19 wwcs 1 3.8-5.6 4.9 cso 3 <0.5-9.3§ 2,9§§
SD 1 0.6-2.8 0.9 SD 4 2.4-6.3 4.4
NH3 (mg/I) DWCS 6.4-20 11 wwcs 1 .5-3.0 2.4 cso 2 1.3-2.6 2 cso 3 <0.5-4.4§ 1.2§§ SD 1 0.4-1.6 0.46 SD 4 0.4-3.7 1.7
Copper (µg/1) DWCS 37-75 49 wwcs 34-89 66 cso 2 10-90 60 cso 3 9_74§ 36§§
SD 1 15-170 29 SD 4 12-92 44
Zinc (µg/L) DWCS 61-150 108 wwcs 130-340 198 cso 2 90-305 160 cso 3 35-620§ 140§§ SD 1 105-260 132 SD 4 105-400 279
• DWCS = Dry Weather Combined Sewer; WWCS = Wet Weather Combined Sewer; CSO = Combined Sewer Overflow; SD= Storm Drains. "Sources for the data in this table are: 1) the 1990 MWRA facilities plan;2) BWSC 1991-1992 CSO monitoring; 3) 1992 MWRA CSO master plan; and, 4) BWSC 1992 stormwater monitoring. *** Range of median values among stations sampled. § Range of results for flow-weighted composite samples. §§ Median value for flow-weighted composite results.
CIVIL ENGINEERING PRACTICE SPRING/SUMMER 1994 99
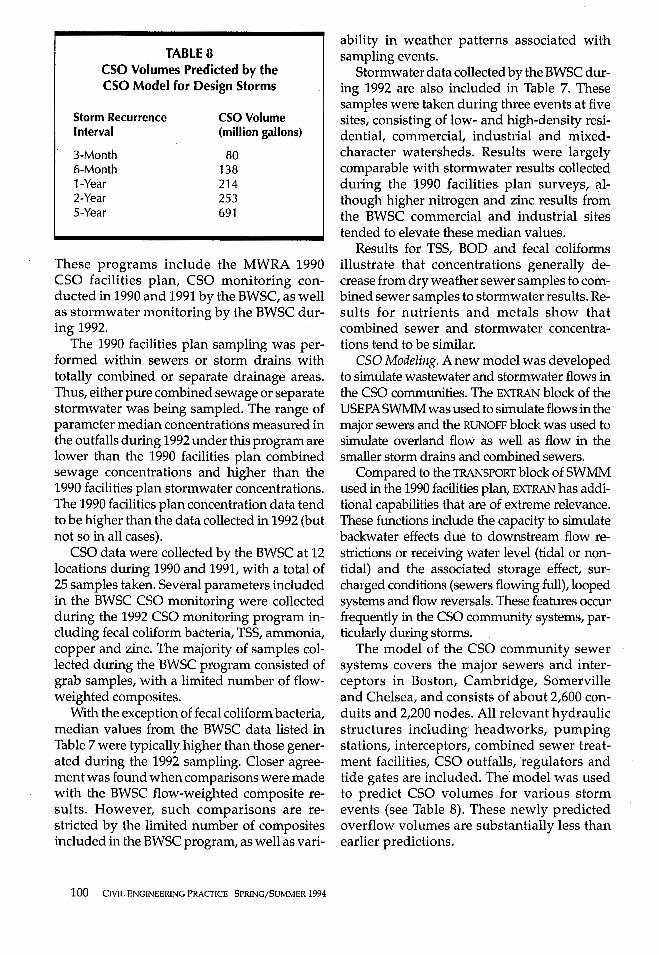
TABLE 8 CSO Volumes Predicted by the CSO Model for Design Storms
Storm Recurrence Interval
3-Month 6-Month 1-Yei!r 2-Year 5-Year
CSOVolume (million gallons)
BO 138 214 253 691
These programs include the MWRA 1990 CSO facilities plan, CSO monitoring conducted in 1990 and 1991 by the BWSC, as well as stormwater monitoring by the BWSC during 1992.
The 1990 facilities plan sampling was performed within sewers or storm drains with totally combined or separate drainage areas. Thus, either pure combined sewage or separate stormwater was being sampled. The range of parameter median concentrations measured in the outfalls during 1992 under this program are lower than the 1990 facilities plan combined sewage concentrations and higher than the 1990 facilities plan stormwater concentrations. The 1990 facilities plan concentration data tend to be higher than the data collected in 1992 (but not so in all cases).
CSO data were collected by the BWSC at 12 locations during 1990 and 1991, with a total of 25 samples taken. Several parameters included in the BWSC CSO monitoring were collected during the 1992 CSO monitoring program including fecal coliform bacteria, TSS, ammonia, copper and zinc. The majority of samples collected during the BWSC program consisted of grab samples, with a limited number of flowweighted composites.
With the exception of fecal coliform bacteria, median values from the BWSC data listed in Table 7 were typically higher than those generated during the 1992 sampling. Closer agreement was found when comparisons were made with the BWSC flow-weighted composite results. However, such comparisons are restricted by the limited number of composites included in the BWSC program, as well as vari-
lQQ CIVIL ENGINEERING PRACTICE SPRING/SUMMER 1994
ability in weather patterns associated with sampling events.
Stormwater data collected by the BWSC during 1992 are also included in Table 7. These samples were taken during three events at five sites, consisting of low- and high-density residential, commercial, industrial and mixedcharacter watersheds. Results were largely comparable with stormwater results collected during the 1990 facilities plan surveys, although higher nitrogen and zinc results from the BWSC commercial and industrial sites tended to elevate these median values.
Results for TSS, BOD and fecal coliforms illustrate that concentrations generally decrease from dry weather sewer samples to combined sewer samples to stormwater results. Results for nutrients and metals show that combined sewer and stormwater concentrations tend to be similar.
CSO Modeling. A new model was developed to simulate wastewater and stormwater flows in the CSO communities. The EXTRAN block of the USEPASWMM was used to simulate flows in the major sewers and the RUNOFF block was used to simulate overland flow as well as flow in the smaller storm drains and combined sewers.
Compared to the TRANSPORT block of SWMM used in the 1990 facilities plan, EXTRAN has additional capabilities that are of extreme relevance. These functions include the capacity to simulate backwater effects due to downstream flow restrictions or receiving water level (tidal or nontidal) and the associated storage effect, surcharged conditions (sewers flowing full), looped systems and flow reversals. These features occur frequently in the CSO community systems, particularly during storms.
The model of the CSO community sewer systems covers the major sewers and interceptors in Boston, Cambridge, Somerville and Chelsea, and consists of about 2,600 conduits and 2,200 nodes. All relevant hydraulic structures including- headworks, pumping stations, interceptors, combined sewer treatment facilities, CSO outfalls, regulators and tide gates are included. The model was used to predict CSO volumes for various storm events (see Table 8). These newly predicted overflow volumes are substantially less than earlier predictions.
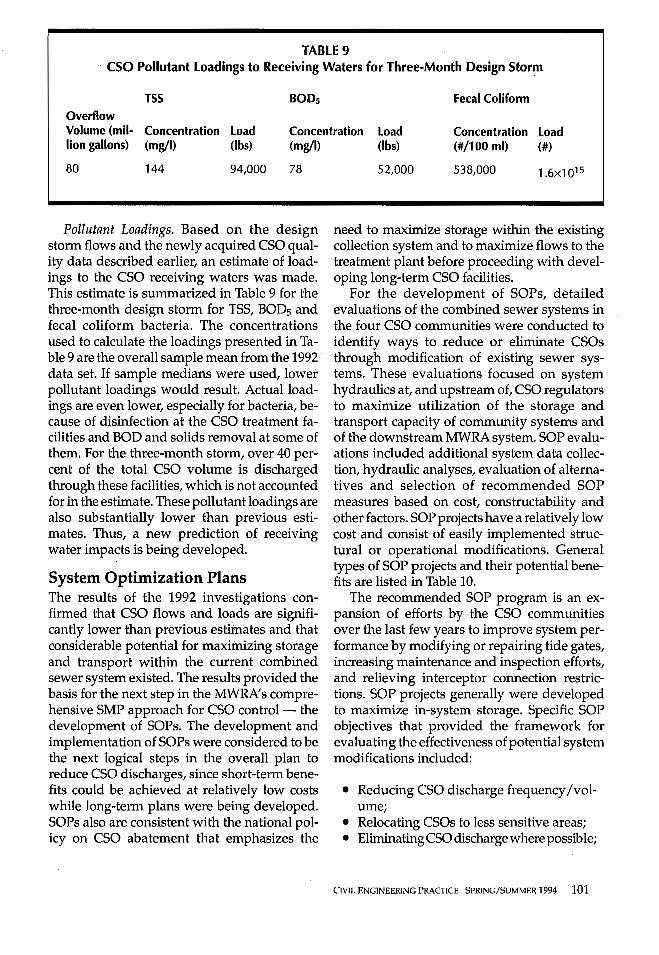
TABLE 9 CSO Pollutant Loadings to Receiving Waters for Three-Month Design Storm
TSS BODs Fecal Coliform
Overflow Volume (mil- Concentration Load Concentration Load Concentration Load lion gallons) (mg/I) (lbs) (mg/I)
80 144 94,000 78
Pollutant Loadings. Based on the design storm flows and the newly acquired CSO quality data described earlier, an estimate of loadings to the CSO receiving waters was made. This estimate is summarized in Table 9 for the three-month design storm for TSS, BOD5 and fecal coliform bacteria. The concentrations used to calculate the loadings presented in Table 9 are the overall sample mean from the 1992 data set. If sample medians were used, lower pollutant loadings would result. Actual loadings are even lower, especially for bacteria, because of disinfection at the CSO treatment facilities and BOD and solids removal at some of them. For the three-month storm, over 40 percent of the total CSO volume is discharged through these facilities, which is not accounted for in the estimate. These pollutant loadings are also substantially lower than previous estimates. Thus, a new prediction of receiving water impacts is being developed.
System Optimization Plans The results of the 1992 investigations confirmed that CSO flows and loads are significantly lower than previous estirp.ates and that considerable potential for maximizing storage and transport within the current combined sewer system existed. The results provided the basis for the next step in the MWRA' s comprehensive SMP approach for CSO control - the development of SOPs. The development and implementation of SOPs were considered to be the next logical steps in the overall plan to reduce CSO discharges, since short-term benefits could be achieved at relatively low costs while long-term plans were being developed. SOPs also are consistent with the national policy on CSO abatement that emphasizes the
(lbs) (#/100 ml) (#)
52,000 538,000 1.6x10¹⁵
need to maximize storage within the existing collection system and to maximize flows to the treatment plant before proceeding with developing long-term CSO facilities.
For the development of SOPs, detailed evaluations of the combined sewer systems in the four CSO communities were conducted to identify ways to reduce or eliminate CSOs through modification of existing sewer systems. These evaluations focused on system hydraulics at, and upstream of, CSO regulators to maximize utilization of the storage and transport capacity of community systems and of the downstream MWRA system. SOP evaluations included additional system data collection, hydraulic analyses, evaluation of alternatives and selection of recommended SOP measures based on cost, constructability and other factors. SOP projects have a relatively low cost and consist of easily implemented structural or operational modifications. General types of SOP projects and their potential benefits are listed in Table 10.
The recommended SOP program is an expansion of efforts by the CSO communities over the last few years to improve system performance by modifying or repairing tide gates, increasing maintenance and inspection efforts, and relieving interceptor connection restrictions. SOP projects generally were developed to maximize in-system storage. Specific SOP objectives that provided the framework for evaluating the effectiveness of potential system modifications included:
• Reducing CSO discharge frequency /volume;
• Relocating CSOs to less sensitive areas; • Eliminating CSO discharge where possible;
CIVIL ENGINEERING PRACTICE SPRING/SUMMER 1994 101
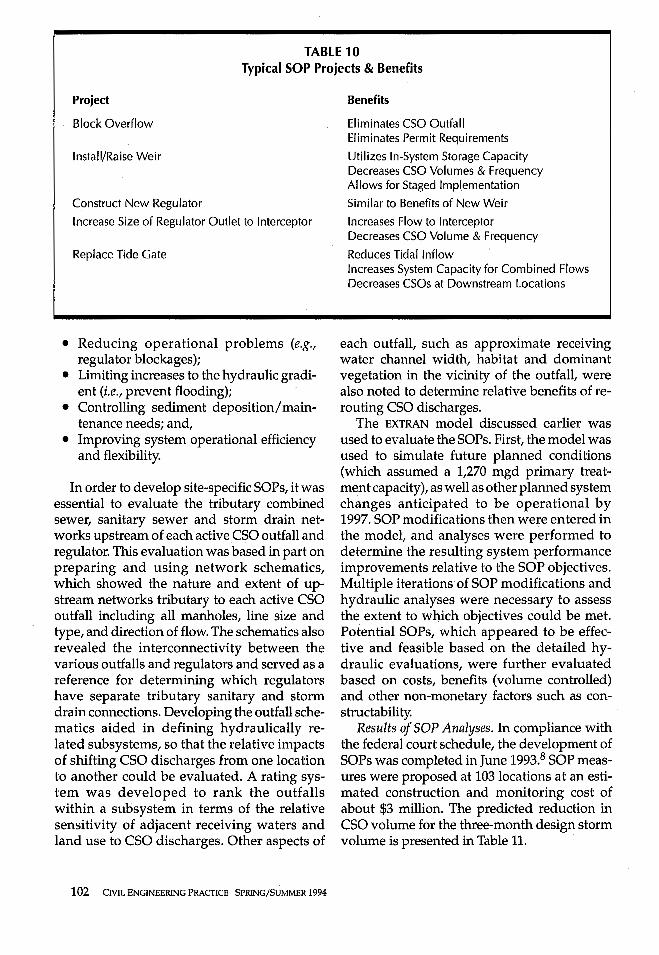
TABLE 10 Typical SOP Projects & Benefits
Project
Block Overflow
Install/Raise Weir
Construct New Regulator
Increase Size of Regulator Outlet to Interceptor
Replace Tide Gate
• Reducing operational problems (e.g., regulator blockages);
• Limiting increases to the hydraulic gradient (i.e., prevent flooding);
• Controlling sediment deposition/ maintenance needs; and,
• Improving system operational efficiency and flexibility.
In order to develop site-specific SOPs, it was essential to evaluate the tributary combined sewer, sanitary sewer and storm drain networks upstream of each active CSO outfall and regulator. This evaluation was based in part on preparing and using network schematics, which showed the nature and extent of upstream networks tributary to each active CSO outfall including all manholes, line size and type, and direction of flow. The schematics also revealed the interconnectivity between the various outfalls and regulators and served as a reference for determining which regulators have separate tributary sanitary and storm drain connections. Developing the outfall schema tics aided in defining hydraulically related subsystems, so that the relative impacts of shifting CSO discharges from one location to another could be evaluated. A rating system was developed to rank the outfalls within a subsystem in terms of the relative sensitivity of adjacent receiving waters and land use to CSO discharges. Other aspects of
102 CIVIL ENGINEERING PRACTICE SPRING/SUMMER 1994
Benefits
Eliminates CSO Outfall Eliminates Permit Requirements
Utilizes In-System Storage Capacity Decreases CSO Volumes & Frequency Allows for Staged Implementation
Similar to Benefits of New Weir
Increases Flow to Interceptor Decreases CSO Volume & Frequency
Reduces Tidal Inflow Increases System Capacity for Combined Flows Decreases CSOs at Downstream Locations
each outfall, such as approximate receiving water channel width, habitat and dominant vegetation in the vicinity of the outfall, were also noted to determine relative benefits of rerouting CSO discharges.
The EXTRAN model discussed earlier was used to evaluate the SOPs. First, the model was used to simulate future planned conditions (which assumed a 1,270 mgd primary treatment capacity), as well as other planned system changes anticipated to be operational by 1997. SOP modifications then were entered in the model, and analyses were performed to determine the resulting system performance improvements relative to the SOP objectives. Multiple iterations of SOP modifications and hydraulic analyses were necessary to assess the extent to which objectives could be met. Potential SOPs, which appeared to be effective and feasible based on the detailed hydraulic evaluations, were further evaluated based on costs, benefits (volume controlled) and other non-monetary factors such as constructability.
Results of SOP Analyses. In compliance with the federal court schedule, the development of SOPs was completed in June 1993.8 SOP measures were proposed at 103 locations at an estimated construction and monitoring cost of about $3 million. The predicted reduction in CSO volume for the three-month design storm volume is presented in Table 11. ·
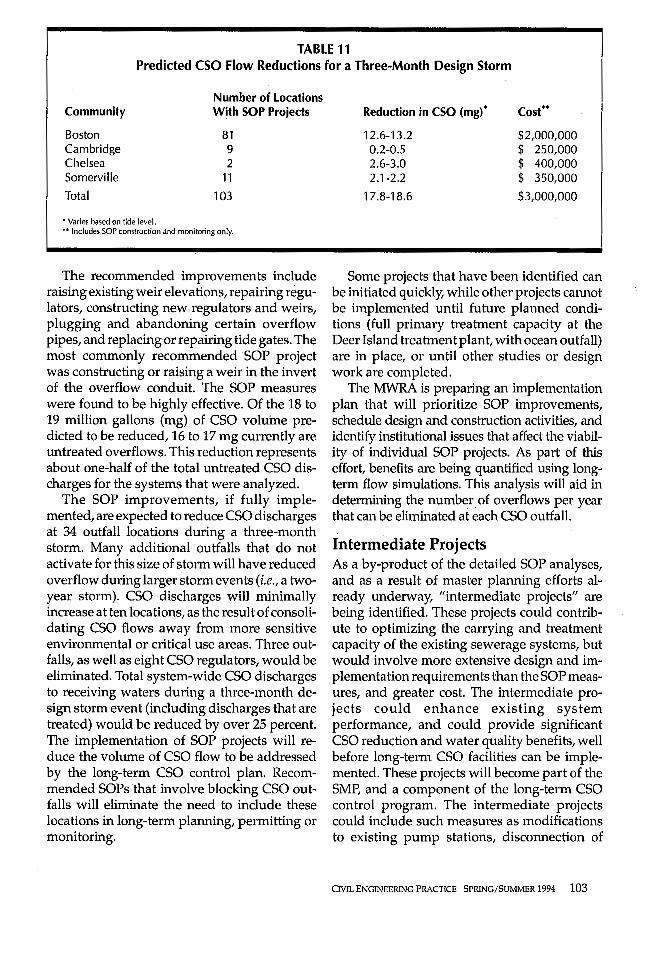
TABLE 11 Predicted CSO Flow Reductions for a Three-Month Design Storm
Number of Locations Community With SOP Projects
Boston 81 Cambridge 9 Chelsea 2 Somerville 11
Total 103
• Varies based on tide level. •• Includes SOP construction and monitoring only.
The recommended improvements include raising existing weir elevations, repairing regulators, constructing new regulators and weirs, plugging and abandoning certain overflow pipes, and replacing or repairing tide gates. The most commonly recommended SOP project was constructing or raising a weir in the invert of the overflow conduit. The SOP measures were found to be highly effective. Of the 18 to 19 million gallons (mg) of CSO volume predicted to be reduced, 16 to 17 mg currently are untreated overflows. This reduction represents about one-half of the total untreated CSO discharges for the systems that were analyzed.
The SOP improvements, if fully implemented, are expected to reduce CSO discharges at 34 outfall locations during a three-mori.th storm. Many additional outfalls that do not activate for this size of storm will have reduced overflow during larger storm events (i.e., a twoyear storm). CSO discharges will minimally increase at ten locations, as the result of consolidating CSO flows away from more sensitive environmental or critical use areas. Three outfalls, as well as eight CSO regulators, would be eliminated. Total system-wide CSO discharges to receiving waters during a three-month design storm event (including discharges that are treated) would be reduced by over 25 percent. The implementation of SOP projects will reduce the volume of CSO flow to be addressed by the long-term CSO control plan. Recommended SOPs that involve blocking CSO outfalls will eliminate the need to include these locations in long-term planning, permitting or monitoring.
Reduction in CSO (mg)• Cost**
12.6-13.2 $2,000,000 0.2-0.5 $ 250,000 2.6-3.0 $ 400,000 2.1-2.2 $ 350,000
17.8-18.6 $3,000,000
Some projects that have been identified can be initiated quickly, while other projects cannot be implemented until future planned conditions (full primary treatment capacity at the Deer Island treatment plant, with ocean outfall) are in place, or until other studies or design work are completed.
The MWRA is preparing an implementation plan that will prioritize SOP improvements, schedule design and construction activities, and identify institutional issues that affect the viability of individual SOP projects. As part of this effort, benefits are being quantified using longterm flow simulations. This analysis will aid in determining the number. of overflows per year that can be eliminated at each CSO outfall.
Intermediate Projects As a by-product of the detailed SOP analyses, and as a result of master planning efforts already underway, "intermediate projects" are being identified. These projects could contribute to optimizing the carrying and treatment capacity of the existing sewerage systems, but would involve more extensive design and implementation requirements than the SOP measures, and greater cost. The intermediate projects could enhance existing system performance, and could provide significant CSO reduction and water quality benefits, well before long-term CSO facilities can be implemented. These projects will become part of the SMP, and a component of the long-term CSO control program. The intermediate projects could include such measures as modifications to existing pump stations, disconnection of
CIVIL ENGINEERING PRACTICE SPRING/SUMMER 1994 103
Complete Data Analysis: Flow (Outlying Areas) 1993 CSO Flow/Quality Stormwater
Notes: Each box represents a program activity. The diagram represents general logic, but activities may run concurrently,
Define SMP Objectives
Complete System Models: CSO Update North & South Systems Stormwater Receiving Water
Define Historic Baseline Conditions
Define Near-Term (1997) Baseline Conditions
Complete Near-Term Project Identification:
IJefine SMP Assumptions/ Constraints
SOPs (Stony Brook; Intermediate Projects
Define Develop Future Evaluation (2020) Criteria/ Planning Process Baseline
Develop Wastewate Treatment Plant Strategies
Develop Evaluate Select & SMP SMP Develop Scenarios Scenarios SMP
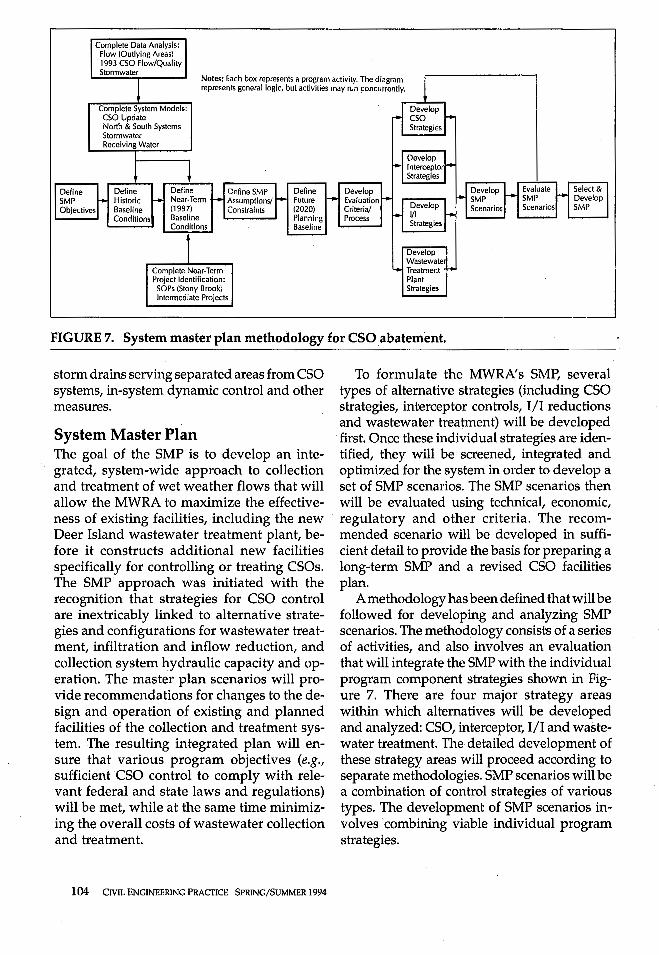
FIGURE 7. System master plan methodology for CSO abatement.
storm drains serving separated areas from CSO systems, in-system dynamic control and other measures.
System Master Plan The goal of the SMP is to develop an integrated, system-wide approach to collection and treatment of wet weather flows that will allow the MWRA to maximize the effectiveness of existing facilities, including the new Deer Island wastewater treatment plant, before it constructs additional new facilities specifically for controlling or treating CSOs. The SMP approach was initiated with the recognition that strategies for CSO control are inextricably linked to alternative strategies and configurations for wastewater treatment, infiltration and inflow reduction, and collection system ~ydraulic capacity and operation. The master plan scenarios will provide recommendations for changes to the design and operation of existing and planned facilities of the collection and treatment system. The resulting integrated plan will ensure that various program objectives (e.g., sufficient CSO control to comply with relevant federal and state laws and regulations) will be met, while at the same time minimizing the overall costs of wastewater collection and treatment.
104 CIVIL ENGINEERING PRACTICE SPRING/SUMMER 1994
To formulate the MWRA's SMP, several types of alternative strategies (including CSO strategies, interceptor controls, 1/1 reductions and wastewater treatment) will be developed first. Once these individual strategies are identified, they will be screened, integrated and optimized for the system in order to develop a set of SMP scenarios. The SMP scenarios then will be evaluated using technical, economic, regulatory and other criteria. The recommended scenario will be developed in sufficient detail to provide the basis for preparing a long-term SMP and a revised CSO facilities plan.
A methodology has been defined that will be followed for developing and analyzing SMP scenarios. The methodology consists of a series of activities, and, also involves an evaluation that will integrate the SMP with the individual program component strategies shown in Figure 7. There are four major strategy areas within which alternatives will be developed and analyzed: CSO, interceptor, 1/1 and wastewater treatment. The detailed development of these strategy areas will proceed according to separate methodologies. SMP scenarios will be a combination of control strategies of various types. The development of SMP scenarios involves combining viable individual program strategies.
Due to the interrelationships among the individual strategies, implementation of the most cost-effective alternatives for each of the individual strategies may not produce the most cost-effective, system-wide approach. For example, I/I strategies and interceptor strategies both may result in reductions of peak flow from upstream, separate sewer areas. The SMP would identify a certain degree of 1/1 removal and a certain degree of interceptor modifications, which when combined will produce the most cost-effective overall peak flow reduction and optimization of system conveyance and treatment capacities. The potential peak flow reductions would, in turn, be evaluated in conjunction with CSO control and secondary treatment options, which may influence the degree of peak flow reduction required for optimal performance. As a result of this type of "tradeoff" analysis, a set of SMP alternatives will be developed that cover a range of benefits and costs. These alternatives will then be evaluated to determine the best overall scenario. In this way, CSO control will be integrated with overall collection and treatment system activities. The optimum SMP scenario will represent a combination of individual strategies that provide the greatest incremental benefit while meeting the required CSO control goal. Benefits will be determined in numerous ways, such as hours of criteria compliance, days of beach or shellfish bed openings, number of overflows per year or percent capture of CSO flows or loads.
DAVID R. BINGHAM has a B.S. in Civil Engineering from Northeastern Univ., an M.S. in Civil Engineering from the Univ. of Massachusetts and an M.B.A. from Worcester Polytech
nic Institute. He has been employed by Metcalf & Eddy, Inc., for 17 years and is currently a Vice President. He is leading the master planning for CSO abatement for the MWRA.
CHERYL A. BREEN is a Project Manager with Metcalf & Eddy, Inc., in Wakefield, Mass. She is currently working on the MWRA CSO abatement program and system master plan and on an
air emissions monitoring program for the Deer Is-
land plant. She received her B.S. from the Univ. of Massachusetts at Amherst in 1977. Prior to joining Metcalf & Eddy, she worked for the MWRA and served as Assistant Secretary of Environmental Af fairs for the Commonwealth of Massachusetts.
MICHAEL COLLINS is a Project Manager with the MWRA. He received his B.S.C.E. and M.S.C.E. degrees from Northeastern Univ. in 1979 and 1986, respectively. He has
over 15 years of experience ranging from planning through construction of wastewater collection and treatment systems, and stormwater/environmental water quality management studies, permitting and design of recommended solutions. He is a Registered Professional Engineer in Massachusetts and Connecticut.
LISE MARX is a Project Manager with the Sewerage Facilities Develop-
•· t ment Department of the MWRA with primary responsibility for planning and regulatory issues facing the CSO
control program. She received an undergraduate degree from Cornell College and a master's degree in Regional Planning from the Univ. of North Carolina-Chapel Hill. She has worked extensively on environmental planning issues at both the state and local level for the past 12 years. She is a member of both the American Planning Association and the American Institute of Certified Planners.
REFERENCES
1. Metropolitan District Commission, EMMA Study - Wastewater Engineering and Management Plan for Boston Harbor - Eastern Massachusetts Metropolitan Area, prepared by Metcalf & Eddy, Inc., 1976.
2. Metropolitan District Commission, Combined Sewer Overflow Project Summary Report on Facilities Planning, prepared by Camp, Dresser & McKee, Inc., 1982.
3. Huber, W.C., & Dickinson, R.E., Storm Water Management Model, Version 4: User's Manual, EPA Environmental Laboratory, Athens, Georgia, 1988.
4. Massachusetts Water Resources Authority, Final Combined Sewer Overflow Facilities Plan and Final Environmental Impact Report, prepared by CH2M Hill, 1991.
CNJL ENGINEERING PRACTICE SPRING/SUMMER 1994 105
5. Suhr, G., "Planned Facilities for Combined Sewer Overflows: Boston Metropolitan Area," Civil Engineering Practice, Journal of the Boston Society of Civil Engineers Section/ASCE, Vol. 7, No. 2, 1992.
6. Adams, E.E, & Zhang, X.Y., The Impact of CS Os on Boston Harbor: A New Look Based on 1990 Data,MWRA Environmental Quality Technical Report No. 91-9, 1991.
106 CIVIL ENGINEERING PRACTICE SPRING/SUMMER 1994
7. Massachusetts Water Resources Authority, Interim CSO Report, submitted to U.S. Environmental Protection Agency and Conservation Law Foundation, prepared by Metcalf & Eddy, Inc., 1993.
8. Massachusetts Water Resources Authority, System Optimization Plans for CSO Control, submitted to U.S. EPA and Conservation Law Foundation, prepared by Metcalf & Eddy, Inc., 1993.