combining crop models and remote sensing for yield prediction · advanced remote sensing and...
TRANSCRIPT
Report EUR 25643 EN
P e te r H oe f s loot , A mor I ne s , J os va n D a m, Gr e gor y D uve il le r , Fr a nc ois K a yit a kir e a nd J a me s H a ns e n 2012
Report of CCFAS-JRC Workshop
at Joint Research Centre, Ispra,
Italy, June 13-14, 2012
Combining crop models and remote sensing
for yield prediction:
Concepts, applications and challenges for
heterogeneous, smallholder environments

European Commission
Joint Research Centre
Institute for Environment and Sustainability (IES)
Contact information:
Francois KAYITAKIRE
Address: Joint Research Centre, Via Enrico Fermi 2749, TP 266, 21027 Ispra (VA), Italy
E-mail: [email protected]
Tel.: +39 0332 786580
Fax: +39 0332 789029
http://mars.jrc.ec.europa.eu/
http://www.jrc.ec.europa.eu/
This publication is a Technical Report by the Joint Research Centre of the European Commission and
the CCAFS program of CGIAR.
Legal Notice
Neither the European Commission nor any person acting on behalf of the Commission
is responsible for the use which might be made of this publication.
Europe Direct is a service to help you find answers to your questions about the European Union
Freephone number (*): 00 800 6 7 8 9 10 11
(*) Certain mobile telephone operators do not allow access to 00 800 numbers or these calls may be billed.
A great deal of additional information on the European Union is available on the Internet.
It can be accessed through the Europa server http://europa.eu/.
JRC77375
EUR 25643 EN
ISBN 978-92-79-27883-9 (pdf)
ISSN 1831-9424 (online)
doi:10.2788/72447
Luxembourg: Publications Office of the European Union, 20xx
© European Union, 2012
Reproduction is authorised provided the source is acknowledged.
Printed in Luxembourg

Combining Crop Models and Remote Sensing for
Yield Prediction: Concepts, Applications and
Challenges for Heterogeneous Smallholder
Environments
Report of Joint CCFAS-JRC Workshop
Venue: Joint Research Centre (JRC), Ispra, Italy
Date: June 13-14, 2012
Peter Hoefsloot, Hoefsloot Spatial Solutions, The Netherlands
Amor Ines, IRI-Columbia University, NY, USA
Jos van Dam, Wageningen University, The Netherlands
Gregory Duveiller, Joint Research Centre, Ispra, Italy
Francois Kayitakire, Joint Research Centre, Ispra, Italy
James Hansen, CCAFS & IRI-Columbia University, NY, USA
November 2012

2

3
Contents
1 Executive summary ............................................................................................................................... 5
1.1 Context .......................................................................................................................................... 5
1.2 Workshop rationale and objectives .............................................................................................. 5
1.3 Workshop salient findings............................................................................................................. 6
2 Summary of presentations and discussions .......................................................................................... 9
2.1 Data assimilation techniques ........................................................................................................ 9
2.2 Crops researched ........................................................................................................................ 10
2.3 Use of Crop Models ..................................................................................................................... 11
2.4 Use of Remote Sensing parameters as proxies for biomass production .................................... 13
2.5 Use of satellite sensors ............................................................................................................... 15
2.6 Research locations ...................................................................................................................... 16
2.7 Spatial scales ............................................................................................................................... 17
2.8 Heterogeneity ............................................................................................................................. 17
2.9 Crop masks .................................................................................................................................. 18
2.10 Crop management factors .......................................................................................................... 18
2.11 Uncertainty of predictions .......................................................................................................... 19
2.12 Linkage with other sources of information ................................................................................. 19
3 Presentation Abstracts ........................................................................................................................ 21
3.1 The challenges of an operational crop yield forecasting system in Sub-Saharan Africa ............ 21
3.2 Crop Forecasting within the CCAFS Program .............................................................................. 23
3.3 Integration of agro-hydrological modelling, remote sensing and geographical information .... 24
3.4 Assimilating remote sensing data into crop models improves predictive performance for
spatial application ................................................................................................................................... 25
3.5 Regional Crop Simulation Modelling for Yield Prediction Using Remote Sensing and GIS: Indian
Experiences ............................................................................................................................................. 26
3.6 Integration of MODIS products and a crop simulation model for crop yield estimation ........... 27
3.7 Exploring the Response of the Central US Agro-Ecosystem to Climate Change ......................... 28
3.8 Crop Yield Forecasting Over Various Scales Combining Models and Remote Sensing ............... 29
3.9 On the Assimilation of Remote Sensing Data with Crop Models for Crop Yield Forecasting ..... 30

4
3.10 Simultaneous Estimation of Model State Variables and Observation and Forecast Biases using a
Two-Stage Hybrid Kalman Filter ............................................................................................................. 31
3.11 Satellite image simulations for data assimilation at multiple scales .......................................... 32
3.12 MARS operational crop monitoring and yield forecasting activities in Europe .......................... 33
3.13 Experiences with data assimilation for regional crop yield forecasting ..................................... 34
3.14 Crop Monitoring and Early Warning Service in Africa ................................................................ 35
3.15 Data Assimilation based on the Integration of Satellite Data and Field Sensor Data for Drought
Monitoring .............................................................................................................................................. 36
3.16 Data assimilation for the carbon cycle in Sudan savannah smallholder communities ............... 37
3.17 Soil-water-crop modelling for decision support in Sub-Saharan west Africa: experiences from
Niger and Benin ....................................................................................................................................... 38
3.18 Wheat yield modelling in a stochastic framework within and post season yield estimation in
Tunisia 39
4 References .......................................................................................................................................... 41
5 Acronyms and Abbreviations .............................................................................................................. 43
6 Workshop Program ............................................................................................................................. 45
7 Participants ......................................................................................................................................... 47
8 Sponsors .............................................................................................................................................. 48

5
1 Executive summary
1.1 Context
There are many factors contributing to the strain on the world’s food supply, ranging from insufficient
investment in the agricultural sector, a lack of access to markets, climate change and climate variability,
water shortages and drought, to simple increased demand for food and changes in diet.
It is a major challenge for the world to feed its growing population. It can easily be seen that agriculture
is a key to this challenge. Given the world’s environmental problems, simply growing more food is not
enough. Agriculture will have to be developed with sustainability built-in from the start.
One of the important subjects in agriculture is crop yield forecasting. It’s advent began in the 1970s.
Crop yield forecasting is key for government structures at all levels, including NGO’s and international
organization such as the United Nations as well as companies that are dependent on agricultural
produce as an input. Research in crop yield forecasting has seen advancements in response to
widespread famine in the Sahel, Ethiopia and other countries in the seventies and eighties. The
operational knowledge gained helped predict and partly avoid food shortages in the years after.
The target environments for crop yield forecasting have always been two-fold. In countries with highly
mechanised large-scale agriculture, such as the USA, Europe and Russia, crop yield forecasting provides
data to governmental structures, companies and farmers. Good yield and price predictions provide a
clear strategic advantage. Governments and supra-national bodies (such as the EU) use these data for
rationalisation of policy adjustments.
The other crop forecasting arena is formed by developing countries, where low staple food production
can have disastrous effects. Predicting food shortages in developing countries early has been the
mandate of the crop forecasting units of UN organisations such as FAO and WFP, as well as FEWSNET,
JRC and a number of others.
The technical methodology supporting the two operational sectors is largely comparable, although an
important difference lies in the type of agriculture studied, distinguishing homogenous large-scale
production environments from heterogeneous, smallholder environments.
1.2 Workshop rationale and objectives
Predictions of crop yields within the growing season are critical inputs for a range of agricultural and
food security decisions. For example, management of agricultural input and credit supplies, agricultural
trade, food security safety net and relief programs, agricultural insurance, and recommendations about
crop varieties and production technologies depend on or benefit from the best possible estimates of

6
crop production. They differ primarily in the timing of key actions and hence the required lead-time.
Agricultural and food security management can generally benefit from improvements in accuracy (at a
given lead-time) and lead-time (at a given threshold of accuracy).
Both simple water balance and process-based crop models are often used to estimate yields within the
growing season. In some cases, they are coupled with seasonal climate forecasts to reduce the
uncertainty associated with climate. The uncertainties associated with crop models, input data and
modelling assumptions – collectively referred to as model error – also contribute to the uncertainty of
crop yield forecasts. One way to correct crop model errors is by data assimilation. Data assimilation
involves using observed data to update simulated model state variables or to estimate model
parameters. Evidence in the literature suggests that data assimilation can improve model performance.
Remote sensing (RS) by satellites offers several options for reducing crop forecasting errors, particularly
in data-sparse regions. Biophysical variables retrieved from remote sensing data, such as Leaf Area Index
(LAI), soil moisture and ET, obtained at adequate spatial and temporal resolutions, can potentially be
coupled with crop models to provide valuable information for crop yield forecasting at various scales.
However, heterogeneous, smallholder farming environments present significant challenges for the use
of remote sensing data assimilation for crop yield forecasting, as field size within these highly
fragmented landscapes is often smaller than the pixel size of remote sensing products that are freely
available.
JRC and CCAFS jointly sponsored the workshop on June 13-14, 2012, at the JRC in Ispra, Italy, to identify
avenues for exploiting remote sensing information to improving crop forecasting in smallholder farming
environments. The workshop’s objectives were:
To advance the state-of-knowledge of data assimilation for crop yield forecasting;
To address challenges and needs for successful applications of data assimilation in forecasting crop
yields in heterogeneous, smallholder environments; and
To enhance collaboration and exchange of knowledge among data assimilation and crop forecasting
groups.
The workshop succeeded in bringing together scientists from around the world. This has enabled
discussions on research and results and has greatly enhanced collaboration and exchange of knowledge,
especially about data assimilation and crop forecasting.
1.3 Workshop salient findings
This workshop was organized to exchange knowledge on crop models and remote sensing for yield
prediction, especially for heterogeneous, smallholder environments. Organisations such as JRC and
various UN organisations are interested in progress in crop modelling, as it helps to improve their
operational yield forecasting. From an operational viewpoint Francois Kayitakire of the EU Joint
Research Centre sets the most pressing challenges as follows:

7
Advanced remote sensing and modelling techniques have not yet reached operational real-time
crop forecasting.
So far, the spatial resolution of models and feasible remote sensing is hardly adequate for most of
cropping systems in Africa.
About the timing of crop yield forecasting: for operational circumstances it would be best to have
good crop forecasts about two months before harvest, although it might be more realistic to have it
one month before.
In smallholder environments, it is still unknown which crops are grown and when.
The workshop shows that there have been clear advances in crop yield forecasting. Important
innovations were made in the use of remote sensing-crop model integration through data assimilation.
In essence data assimilation is the technique whereby remote sensing data are used as inputs in crop
models, to adjust or reset state variables in crop models. Several techniques exist to do this of which the
Ensemble Kalman Filter is applied most.
The most noticeable advances have been made in homogenous environments. Good examples of these
cropping environments were presented for the mid-western states of the USA and Russia. For these
environments, scientists showed that the solution lies in the use of high-resolution remote sensing data
integrated with advanced crop models. Some of this research has reached practical applicability. As an
example, grain yields can be forecasted using high resolution remote sensing fed into a crop model and
subsequently checked against combine harvester data.
This is not (yet) feasible in an African setting. For these environments, low-cost moderate resolution
imagery is more feasible, combined with increased knowledge on extracting signatures for targeted
crops and cropping systems. In the workshop in-depth research has been presented on smallholder
environments in Africa and Asia based on the study of carbon, water and energy cycles. It was showed
that the heterogeneous, smallholder cropping environment is slowly being understood in satisfactory
detail. Incorporation of other data (e.g. socio-economic data) proved to be needed to understand the
crop production to its full extent.
For smallholder environments, some participants advocated the use of high-resolution techniques,
coupled with an in-depth knowledge of the area of study. Promising field experiments are being set up
in Mali, Niger, India and other countries to study the heterogeneous, smallholder environments. Others
felt that (for country of continental scale predictions) low-resolution techniques (remote sensing,
models and data) are the way to go forward.
CCAFS theme 2 main goals are to build resilient rural livelihoods, ensure food delivery, trade, and crisis
response and enhanced climate information and services. Assisting scientists in the field of crop
forecasting is one of the ways to achieve these goals. During the workshop Jim Hansen (Theme 2 leader)
of CCAFS led the discussion on how to address the challenges for applying RS data assimilation for crop
forecasting in heterogeneous, smallholder environments. With respect to data, high resolution remote
sensing was offered (to the m scale) but seems to be unfeasible for operational use in Africa because of
scale and cost. Moderate resolution remote sensing combined with downscaling techniques e.g., un-
8
mixing vegetation signature seems to be interesting, like what is being pursued by IRI/JPL. Fusion of
moderate (shorter return period) and high resolution (longer return period) remote sensing was also
discussed with some reluctance from the group. In terms of data integration, the state-parameter
simultaneous update within the Ensemble Kalman Filter was discouraged especially when using LAI for
data assimilation. A framework was proposed in which crop model parameters first are estimated by
inverse modelling, and then the calibrated model can be linked with the Ensemble Kalman Filter for the
assimilation of LAI for forecasting yield. Proof of concept study was discussed using data from India and
Mali.

9
2 Summary of presentations and discussions
During the workshop, crop production has been highlighted from many sides, using a variety of models,
satellite parameters and field data. Subjects range from field to continent level, from small scale to
large-scale crop production, from tropical to temperate regions, from maize to millet. With the large
variety of presented subjects, it is difficult to honour each and every subject in this summary report.
However, trends in crop yield forecasting for heterogeneous, smallholder environments can certainly be
observed. Some of the trends and observations discussed in the following pages:
Data assimilation techniques
Crops researched
Use of Crop Models
Use of Remote Sensing parameters as proxies for biomass production
Use of satellite sensors
Research locations
Spatial scales (from field to continent)
Heterogeneity
Crop masks
Crop management factors
Uncertainty of predictions
Linkage with other sources of information
Although the presenters covered a wide range of subjects, the analysis of the presentations has led to
some conclusions that are summarized in the following sections.
2.1 Data assimilation techniques
During the workshop it has been shown that data assimilation can be applied successfully in crop
modelling studies. In general two types of assimilation techniques were demonstrated in the
presentations:
1. A recalibration strategy where some uncertain model parameters (for example the emergence date)
are optimized by minimizing the difference between the model and the observations available.
2. A sequential updating strategy where model states or parameters are updated during the model
run. A prerequisite for this technique is that the model allows adjusting the states or parameters
during the model run. Essentially in data assimilation, model parameters in a time-step are re-set or
corrected by observations from the real world.

10
For crop modelling a logical source of these observations is remote sensing. Remotely sensed data are
typically sensor data gained from platforms such as satellites, aircraft and surface-bound sensors.
In data assimilation, one could simply replace the model results by observations. In practice this is not a
good idea, because:
Both the external data and the model results contain errors;
Often a proxy of the state variables is assimilated;
Almost always one needs to update many (unobserved) state variables using only one or a couple of
observations; and
Continuity of the observations is not guaranteed (cloud cover, satellite failure).
Therefore methods like the Ensembles Kalman filter have to be applied (Pauwels) or re-calibration of
model parameters are better options for data assimilation.
Presenters argued that data assimilation in crop growth related models has its challenges:
The studied processes and models have biases that are not taken care of in some of the algorithms
that support data assimilation. Working with biases is often possible by applying corrections for bias
to the original algorithms (Pauwels).
A parallel process to biomass production, or crop growth, is crop development (phenology of the
plant). When trying to assimilate a remote-sensing estimation of biomass in a crop growth model,
one may be faced by what some authors call a “phenological shift” (see Curnel et al. 2011). Basically,
a given amount of green biomass may be attained at different stages of the crop season, e.g. in the
increasing or the decreasing part of the curve, and forcing this biomass value in a model without
knowing the phenology can result in dramatically wrong results.
It is still unclear which combination of satellite data and crop modelling (input data; calibration;
assimilation) is most effective. It needs to be studied which crop data are most suitable for data
assimilation at available temporal and spatial scales of satellite images (van Dam)
Interaction/dependency between parameters may lead to errors in their estimation (Guerif)
2.2 Crops researched
The table below shows that most of the research in this workshop is done on Maize and Wheat. Both
crops are among the most cultivated in the world (grown in tropical as well as areas with temperate
climates), which could explain part of the popularity. Furthermore, these crops are often grown in large
fields on large farms with advanced crop management practices like precision farming (Bach), leading to
a nicely homogenous crop.
Of the pure tropical crops, rice, sorghum and millet are mentioned most (Table 1). Especially millet and
sorghum are grown in the heterogeneous, smallholder environments that are subject of this workshop.
11
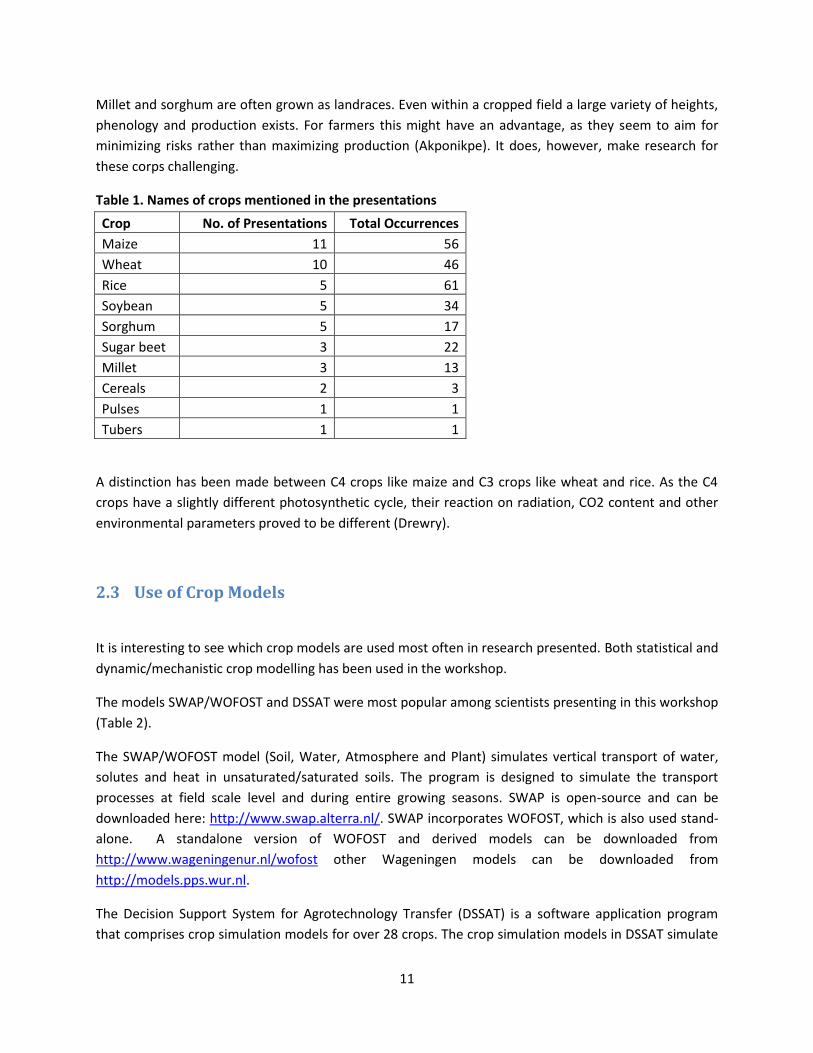
Millet and sorghum are often grown as landraces. Even within a cropped field a large variety of heights,
phenology and production exists. For farmers this might have an advantage, as they seem to aim for
minimizing risks rather than maximizing production (Akponikpe). It does, however, make research for
these corps challenging.
Table 1. Names of crops mentioned in the presentations
Crop No. of Presentations Total Occurrences
Maize 11 56
Wheat 10 46
Rice 5 61
Soybean 5 34
Sorghum 5 17
Sugar beet 3 22
Millet 3 13
Cereals 2 3
Pulses 1 1
Tubers 1 1
A distinction has been made between C4 crops like maize and C3 crops like wheat and rice. As the C4
crops have a slightly different photosynthetic cycle, their reaction on radiation, CO2 content and other
environmental parameters proved to be different (Drewry).
2.3 Use of Crop Models
It is interesting to see which crop models are used most often in research presented. Both statistical and
dynamic/mechanistic crop modelling has been used in the workshop.
The models SWAP/WOFOST and DSSAT were most popular among scientists presenting in this workshop
(Table 2).
The SWAP/WOFOST model (Soil, Water, Atmosphere and Plant) simulates vertical transport of water,
solutes and heat in unsaturated/saturated soils. The program is designed to simulate the transport
processes at field scale level and during entire growing seasons. SWAP is open-source and can be
downloaded here: http://www.swap.alterra.nl/. SWAP incorporates WOFOST, which is also used stand-
alone. A standalone version of WOFOST and derived models can be downloaded from
http://www.wageningenur.nl/wofost other Wageningen models can be downloaded from
http://models.pps.wur.nl.
The Decision Support System for Agrotechnology Transfer (DSSAT) is a software application program
that comprises crop simulation models for over 28 crops. The crop simulation models in DSSAT simulate

12
growth, development and yield as a function of the soil-plant-atmosphere dynamics. Although DSSAT is
not open source, its source code and executables can be requested for free from http://www.dssat.net/
Some models are developed by the presenting scientists themselves and not distributed to other
groups. These models are often used in precision agriculture for direct advice to farmers (APSIM,
http://www.apsim.info).
Table2. Use of models in workshop presentations
Models No. of Presentations Total Occurrences
SWAP 3 18
DSSAT 3 14
CSM 3 14
WOFOST 3 8
PROMET 1 27
MM5 1 11
WTGROWS 1 9
STICS 1 6
MODFLOW 1 3
SUCROS 1 3
ORYZA1 1 2
LINGRA 1 1
WARM 1 1
PROSAIL 1 1
AGROMETSHELL 1 1
APSIM 1 1
MLCan 1 1
The models described in the workshop describe crop biomass production roughly through the study of 3
processes: water cycle (water balance models), energy cycle (radiative transfer models) and carbon
cycle. Many models take two or more of these processes into account.
Plant growth models are relatively good in simulating the potential growth, as affected by climate and
crop characteristics (Figure 1).
Also the growth inhibiting effects of water shortage, oxygen shortage, salinity excess and nutrient
shortage can be simulated quite well with current crop growth models. However, the growth reduction
due to weeds, pests, diseases and pollutants is still difficult to simulate. Satellites measure the actual
growth conditions, which includes the total effect of all growth reducing factors. This may cause a
mismatch between crop growth simulations and measured crop growth by satellites.
Scientists increasingly use “model inversion” whereby the model is fed with output parameters to get a
better understanding of the driving input variables/properties (Honda, Guerif and Sehgal).

13
Figure 1. Plant growth simulation is affected by defining climate and crop characteristics (potential
growth), limiting factors and reducing factors. All factors together result in actual growth.
2.4 Use of Remote Sensing parameters as proxies for biomass production
Proxies for yield and biomass production have been developed over the years from remote sensing
derived spectral measurements. The products involve different spectral bands, various retrieval
algorithms and corrections. The most popular products (in terms of occurrence in the presentations of
this workshop) are mentioned in Table 3.
Table 3. Occurrence of parameters and proxies in the presentations
Parameters/Proxy No. of presentations Total Occurrences
LAI & GAI (Leaf Area Index & Green Area Index) 11 177
NDVI (Normalized Difference Vegetation Index) 9 83
Evapotranspiration 8 26
Precipitation derived from RS 5 8
fAPAR (fraction of Absorbed Photosynthetically Active Radiation) 4 31
IR (infrared) 2 3
EVI (Enhanced vegetation Index) 1 8
Global Radiation 1 3
Potential Actual
defining factors
• CO2
• radiation
• temperature
• crop characteristics
physiology, phenology
canopy architecture
defining factors
+
limiting factors
• water shortage
• oxygen shortage
• salinity excess
• nutrient shortage
defining factors
+
limiting factors
+
reducing factors
• weeds
• pests
• diseases
• pollutants
14
The parameters above can be extracted from a variety of satellite platforms. In practice, MODIS, SPOT,
NOAA-AVHRR and MSG are often used. The parameters have been used at low, medium and high
resolutions at various scales.
The most frequently used parameter is LAI (Leaf Area Index). This parameter has been developed 50
years ago for field experiments. It’s defined as half the total developed area of green leaves per unit of
ground horizontal area (Chen & Black, 1992). The satellite-based LAI products are generally not the
same variables as the LAI in crop growth models or the LAI measured in a field. A main reason for this
discrepancy is that available satellite LAI are produced from reflectance obtained from coarse spatial
resolution pixels, in which various different types of vegetation covers are present. For the same reason,
several scientists have proven that the satellite based LAI can differ considerably from field measured
LAI (Honda). Sometimes LAI is referred to as GAI (for Green Area Index). For several crops in which
various part of the plant photosynthesis (e.g. cereals), it is actually more appropriate to use this term to
refer to the biophysical variable retrieved from remote sensing since the radiance measured by the
instrument is made of electromagnetic radiation reflected from all plant organs (Duveiller et al., 2011a).
A biophysical variable that is generally as widely available as LAI is the fraction of Absorbed
Photosynthetically Active Radiation (fAPAR). This variable is actually more closely related to yield than
LAI. For diverse reasons (one being that fAPAR is generally not a state variable in the current generation
of simulation models) it seems to be much less popular for data assimilation in crop models, even
though it probably avoids some of the problems/uncertainties encountered with LAI. This point was
raised in the workshop and proposed as a justified research direction.
The NDVI (Normalized Difference Vegetation Index) has been used widely. This parameter has been
around for quite some time and long historical records exist. Many derivatives/refinements of NDVI are
now in use such as DVI (Difference Vegetation Index) and EVI (Enhanced Vegetation Index; used by
Hoogenboom).
An estimate of actual evapotranspiration can be based on satellite signals only. Crop models often
calculate actual evapotranspiration as output. While the first method is based on evapotranspiration of
the entire vegetation by pixel, the second approach makes it possible to be crop-specific. Examples of
both approaches were shown.
An issue that returned various times in the discussions was which model variables should be updated at
satellite overpass. For instance, if LAI is measured, not only the LAI but also many other model variables
that are related to leaf area index (such as plant biomass, green area index, development stage) should
be updated. The plant model update should be consistent. Various groups use different methods.
Satellite derived precipitation estimates are used in crop forecasting, but it has been proven that this
parameter is related poorly to yields when applied as cumulative over the crop period (Irénikatché). As
input to crop models at a daily or dekadal time-step it has however proven its usefulness.
15
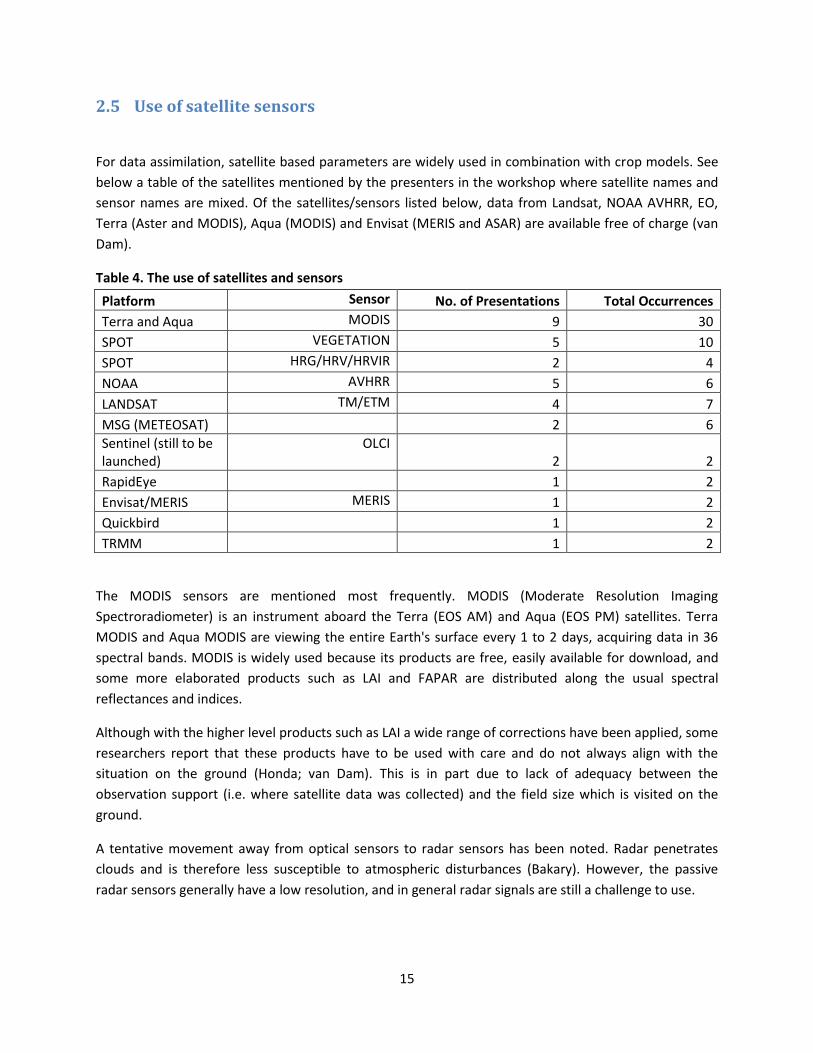
2.5 Use of satellite sensors
For data assimilation, satellite based parameters are widely used in combination with crop models. See
below a table of the satellites mentioned by the presenters in the workshop where satellite names and
sensor names are mixed. Of the satellites/sensors listed below, data from Landsat, NOAA AVHRR, EO,
Terra (Aster and MODIS), Aqua (MODIS) and Envisat (MERIS and ASAR) are available free of charge (van
Dam).
Table 4. The use of satellites and sensors
Platform Sensor No. of Presentations Total Occurrences
Terra and Aqua MODIS 9 30
SPOT VEGETATION 5 10
SPOT HRG/HRV/HRVIR 2 4
NOAA AVHRR 5 6
LANDSAT TM/ETM 4 7
MSG (METEOSAT) 2 6
Sentinel (still to be launched)
OLCI 2 2
RapidEye 1 2
Envisat/MERIS MERIS 1 2
Quickbird 1 2
TRMM 1 2
The MODIS sensors are mentioned most frequently. MODIS (Moderate Resolution Imaging
Spectroradiometer) is an instrument aboard the Terra (EOS AM) and Aqua (EOS PM) satellites. Terra
MODIS and Aqua MODIS are viewing the entire Earth's surface every 1 to 2 days, acquiring data in 36
spectral bands. MODIS is widely used because its products are free, easily available for download, and
some more elaborated products such as LAI and FAPAR are distributed along the usual spectral
reflectances and indices.
Although with the higher level products such as LAI a wide range of corrections have been applied, some
researchers report that these products have to be used with care and do not always align with the
situation on the ground (Honda; van Dam). This is in part due to lack of adequacy between the
observation support (i.e. where satellite data was collected) and the field size which is visited on the
ground.
A tentative movement away from optical sensors to radar sensors has been noted. Radar penetrates
clouds and is therefore less susceptible to atmospheric disturbances (Bakary). However, the passive
radar sensors generally have a low resolution, and in general radar signals are still a challenge to use.
16
Many low-resolution satellite data are available at high frequency, while high resolution data are
available at low frequency. Various algorithms exist to combine low and high-resolution data to derive
the optimal amount of information (Ines; Honda).
Besides satellite sensors, some scientists use earth-bound sensors on poles as well as small, unmanned
airplanes (Drewry, Honda).
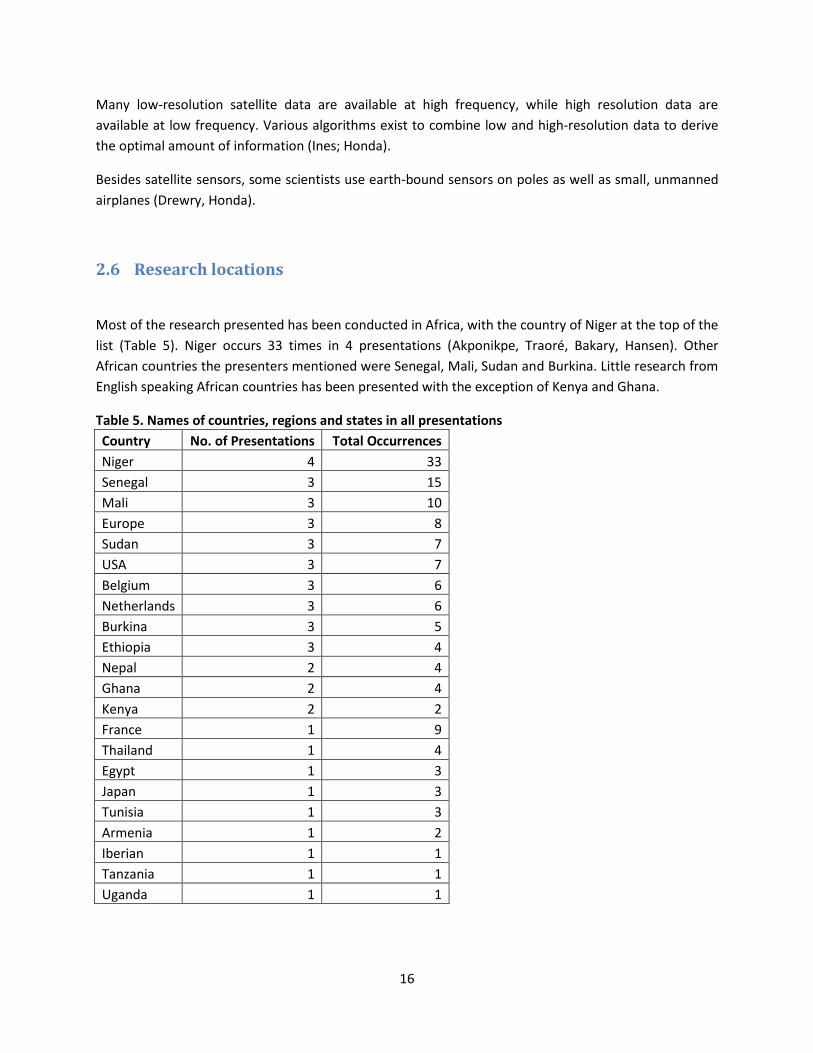
2.6 Research locations
Most of the research presented has been conducted in Africa, with the country of Niger at the top of the
list (Table 5). Niger occurs 33 times in 4 presentations (Akponikpe, Traoré, Bakary, Hansen). Other
African countries the presenters mentioned were Senegal, Mali, Sudan and Burkina. Little research from
English speaking African countries has been presented with the exception of Kenya and Ghana.
Table 5. Names of countries, regions and states in all presentations
Country No. of Presentations Total Occurrences
Niger 4 33
Senegal 3 15
Mali 3 10
Europe 3 8
Sudan 3 7
USA 3 7
Belgium 3 6
Netherlands 3 6
Burkina 3 5
Ethiopia 3 4
Nepal 2 4
Ghana 2 4
Kenya 2 2
France 1 9
Thailand 1 4
Egypt 1 3
Japan 1 3
Tunisia 1 3
Armenia 1 2
Iberian 1 1
Tanzania 1 1
Uganda 1 1
17
Quite some research findings were presented on European countries, mainly The Netherlands, Belgium,
Germany, the Iberian Peninsula and Russia. The mid-western states of the United States were frequently
used as research locations. These states have an advantage over other study areas due to their relatively
homogenous crop covers during the cropping season. This enables the scientists to find “almost pure
pixels” in remote sensing imagery.
2.7 Spatial scales
The spatial scale of the research matters for the methods and data that can be applied successfully.
Studies were presented at a wide range of spatial scales, ranging from field to continent. A somewhat
arbitrary list of scales mentioned:
Field level (van Dam and Bach, Drewry, Akponikpe)
Village level (Traoré, Akponikpe)
District level (Seghal, Bakary, Guerif)
Country level (Marinho, Meroni)
Sub-continent and continent level (Duveiller and Terink)
Some debate was noticeable among the scientist on the question whether methods at the finer level
(e.g. field) can successfully be scaled up to any level above. While some argued that it is just a matter of
computing power, others insisted that different models and datasets have to be applied at different
spatial scales.
In general, it became apparent that research at the field level helps to understand complex cropping
systems and leads to better inputs and management techniques on farm level while research on district
and higher scales helps policy makers in governments, NGO’s and international organisations. Ideally a
methodology should be developed which addresses both field and regional scale, as for instance shown
by Bach.
2.8 Heterogeneity
One of the most challenging aspects of the use of remote sensing proved to be the heterogeneity of the
crop/vegetation in one pixel. This is most apparent in low-resolution imagery (e.g. > 1 km pixel size).
“Pure pixels” for low-resolution imagery can be found in the USA and Russia, but are almost non-
existent in Africa and Europe minus Russia. Some recent research has shown, however, that pure
enough pixels can be obtained in highly fragmented landscapes in Europe in order to have a crop
specific signal (de Wit) if medium spatial resolution imagery such as MODIS (250m) is employed and the
spatial response of the instrument is carefully taken into account (Duveiller et al. 2011b). This approach
18
allows an alternative solution to un-mixing coarse pixels, but on the other hand still requires some a
priori information of where the crops are located beforehand.
High-resolution imagery proved to be helpful to detect in-field variability on large-scale farms (Bach).
This kind of high spatial resolution imagery is typically available only for a limited geographic extend,
and with a temporal revisit capacity which is lower than desired for agricultural monitoring. Although,
future satellite constellations (such as the European Spatial Agency’s Sentinel-2) aim at making high
spatial resolution imagery operationally available worldwide, there remains the challenge of managing
this exorbitant amount of data and extract from it a clear and reliable information than can be used for
assessing crop status.
In heterogeneous, smallholder environments, even high resolution imagery had to be complemented by
extensive field research to successfully describe the heterogeneity of fields and crops (Traoré).
2.9 Crop masks
Several researchers noted the lack of good crop masks (Marinho, Kayitakire). Unfortunately, land cover
maps just specify agricultural practices (arable land, rangeland etc.), and rarely go down to the crop
level. For many areas, such crop masks should ideally be done on a yearly basis to reflect the changes
that occur due to crop rotation or expansion/regression of crop extends. Crop rotation is the main
limitation in Europe that forces the operational MARS crop yield forecasting system of the European
Commission from using crop specific time series (Duveiller).
Another challenge is that crop masks cannot be considered constant as different crops are grown in
different years. Even percentage-wise pixel estimates (for example 20% wheat, 30% maize etc.) are only
available for some well-researched areas.
Researchers generally put quite some work into crop masks, before the actual research topic was
investigated (Traoré, Hoogenboom).
2.10 Crop management factors
Crop yields are to a high degree determined by the management practices applied to it (Sehgal). For
crop yield forecasting the most important ones are sowing dates, irrigation and nutrient application.
Crop model outcome is to a high degree dependent on sowing date (Traoré).
Participants showed several methods to estimate sowing dates:
Simulated sowing date, based on external parameters (Akponikpe);

19
Estimated sowing dates extracted from remote sensing time series (Guerif);
Establishing sowing dates through field work (Sehgal) or local sensors in fields (Honda).
Obviously the scale of the study (from field to continent) determines the possibilities. At higher scales
(country, continent), fieldwork is not a workable solution to determine management factors applied.
2.11 Uncertainty of predictions
Uncertainty in crop yield predictions remains a problem. This is particularly the case early in the season.
Generally the uncertainty declines towards the end of the season. Uncertainty during the season can be
lowered through seasonal climate forecasts (Hansen).
Model uncertainty can partly be addressed by data assimilation techniques, while climate uncertainty
can be addressed by seasonal forecasts (Ines).
2.12 Linkage with other sources of information
It has been advocated during the workshop that scientists look at linkages with information sources
outside the traditional soil-water-plant system. Social economic databases and other sources that
explain small-scale farmers livelihoods from a different angle are to be integrated with crop models for a
better understanding of crop production systems. Potentially this could go further than establishing
simple correlations. Models integrating for example socio economic information with crop production
systems are yet to be developed (Guerif).
The recent AgMIP project combines climate, crops and economics (Traoré). Within AgMIP a large number of crop and agronomy modelling groups cooperate to compare modelling results for existing crop datasets and for future conditions, including climate change.

20
21
3 Presentation Abstracts
3.1 The challenges of an operational crop yield forecasting system in Sub-
Saharan Africa Francois Kayitakire, JRC, MARS Unit, FOODSEC Action, Ispra, Italy
The Food Security Assessment (FOODSEC) Action of the EC-JRC supports the implementation of EU Food
Security and Food Assistance policies by providing scientific advice and objective assessment of food
security situation. It has been developing pieces of an early warning system to monitor crop and pasture
production, with a focus on most food insecure areas, mainly in Sub-Saharan Africa. The system was by
large conceived as an extension of the “Monitoring Agriculture with Remote Sensing” (MARS) project to
regions outside the European Union. Thus, it relies mainly on remote sensing solutions and to some
extent on crop modelling. Low-spatial satellite imagery is extensively used to derive the crop conditions
in agricultural areas and pasture availability in pastoral areas. This approach proved effective for
qualitative assessment of proxies of food production. In a few cases, tentative to link remote sensing
derived indicators to crop yield or production has been done. Those indicators are usually analysed
together with those derived from meteorological data, and they make the basis of the MARS crop and
food security monitoring reports (http://mars.jrc.ec.europa.eu/mars/Bulletins-Publications).
Crop modelling has up-to now played a minor role in the system for several reasons. The main constraint
has been the model calibration and the availability of historical yield (and production) statistics. The
area of interest of the FOODSEC Action is actually very large, with many different ecological conditions
and agricultural systems that are poorly understood and mapped. Moreover, yield statistics that are a
key component in any crop forecasting solution are rarely available at the appropriate spatial resolution
and temporal coverage. Therefore, JRC opted for a simple crop model (AgrometShell) that was
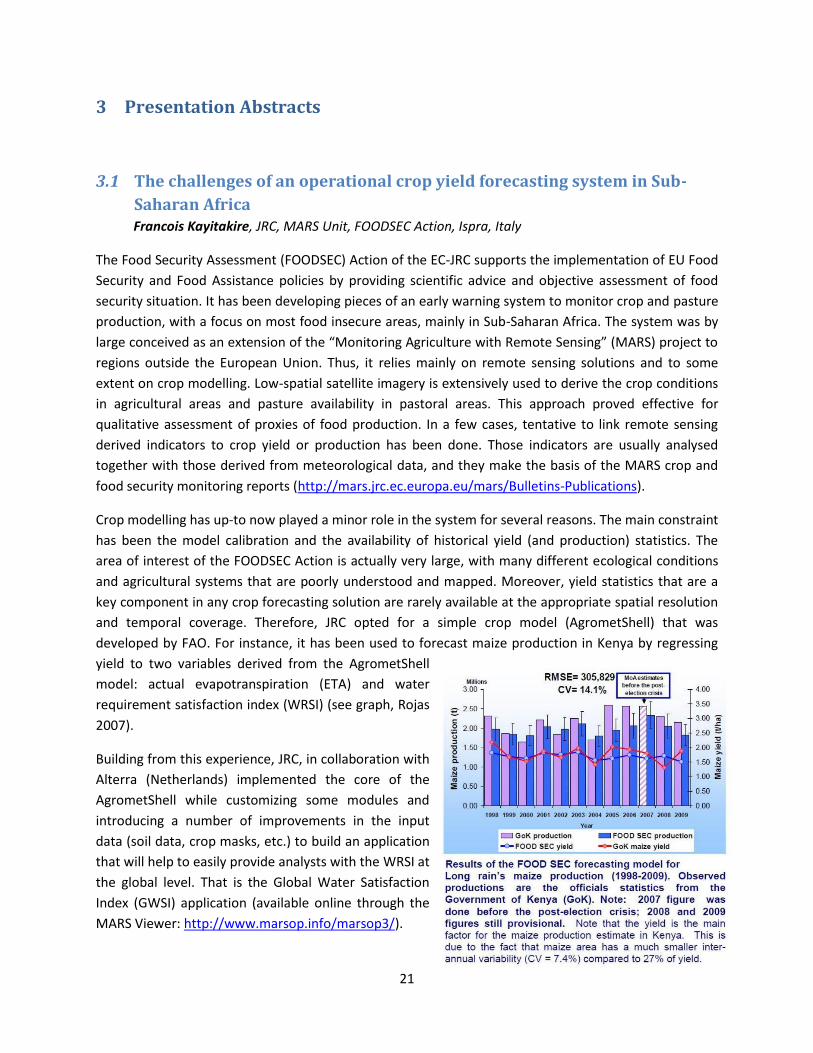
developed by FAO. For instance, it has been used to forecast maize production in Kenya by regressing
yield to two variables derived from the AgrometShell
model: actual evapotranspiration (ETA) and water
requirement satisfaction index (WRSI) (see graph, Rojas
2007).
Building from this experience, JRC, in collaboration with
Alterra (Netherlands) implemented the core of the
AgrometShell while customizing some modules and
introducing a number of improvements in the input
data (soil data, crop masks, etc.) to build an application
that will help to easily provide analysts with the WRSI at
the global level. That is the Global Water Satisfaction
Index (GWSI) application (available online through the
MARS Viewer: http://www.marsop.info/marsop3/).

22
However, there’s a need of an effective quantitative crop yield forecasting solution. Crop forecasting
only makes sense when the conclusions can be published in time. In an ideal case, the forecast of crop
production is released 2 months before harvest. It is more realistic to expect estimates 1 month before
harvest, but also an analysis that comes in at harvest time is still practical. The forecasting method
should also be able to correctly capture the inter-annual variability of yield because such variability is
the most critical for food security of vulnerable households.
A crop forecasting system based on crop modelling and remote sensing faces a number of challenges:
the availability of yield data at sub-national levels;
the calibration and validation of models;
the availability of long time series in input data;
the course spatial resolution of input data, such as remote sensing. This spatial resolution is hardly
adequate for most of cropping systems in Africa (mixture of crop fields and other land cover types);
the necessity to know where crops are grown (crop masks).
To address these challenges will require long-term research and developments. But there’s perhaps a
room for searching for simpler solutions with a reasonable accuracy. This workshop provided some
directions to such solutions.
23
3.2 Crop Forecasting within the CCAFS Program James Hansen, Theme 2 Leader of the Climate Change, Agriculture and Food Security research
program of the CGIAR.
The CGIAR research program on Climate Change, Agriculture and Food Security (CCAFS) is a major
research initiative that aims to: identify and develop pro-poor adaptation and mitigation practices,
technologies and policies for agriculture and food systems; and support the inclusion of agricultural
issues in climate change policies, and of climate issues in agricultural policies, at all levels. CCAFS work is
organized in 4 research themes:
Theme 1: Adaptation to Progressive Climate Change
Theme 2: Adaptation through Managing Climate Risk (led by James Hansen)
Theme 3: Pro-poor Climate Change Mitigation
Theme 4: Integration for Decision Making
Theme 2 seeks to enhance the resilience of rural livelihoods and food systems to climate-related risk.
Improving climate-related information for risk management, across multiple scales, is an important part
of the Theme’s contribution toward climate-resilience. CCAFS research currently focuses on East and
West Africa and South Asia.
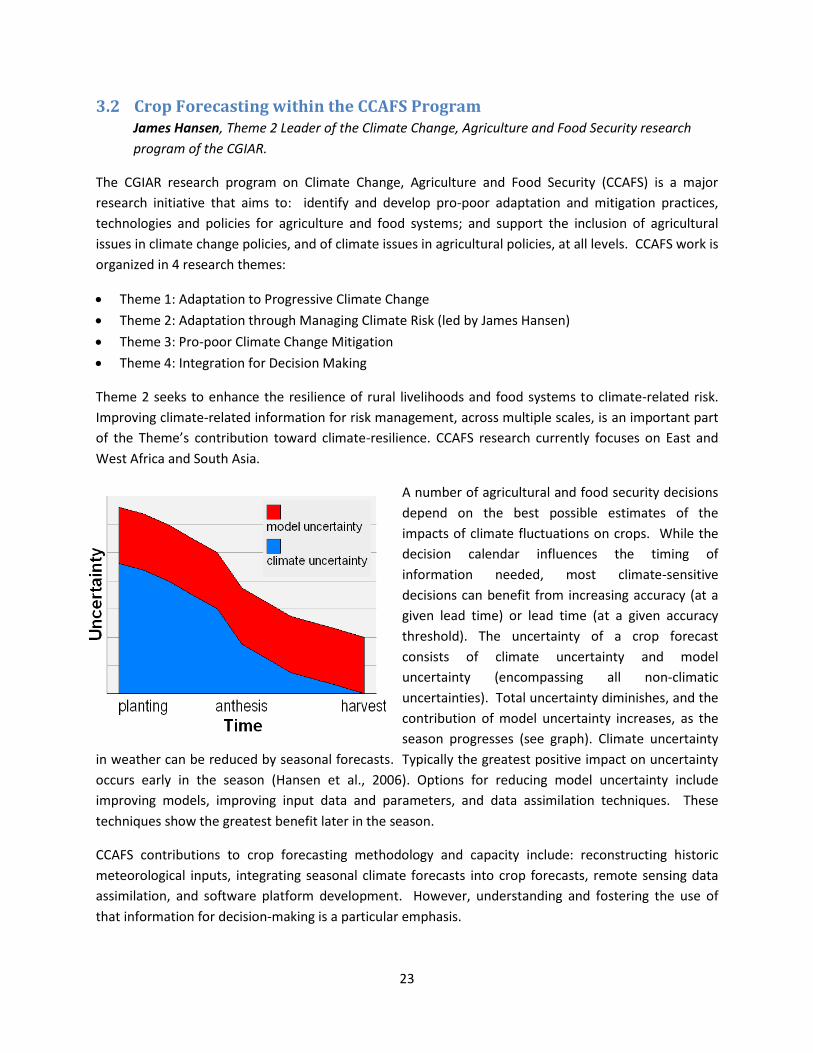
A number of agricultural and food security decisions
depend on the best possible estimates of the
impacts of climate fluctuations on crops. While the
decision calendar influences the timing of
information needed, most climate-sensitive
decisions can benefit from increasing accuracy (at a
given lead time) or lead time (at a given accuracy
threshold). The uncertainty of a crop forecast
consists of climate uncertainty and model
uncertainty (encompassing all non-climatic
uncertainties). Total uncertainty diminishes, and the
contribution of model uncertainty increases, as the
season progresses (see graph). Climate uncertainty
in weather can be reduced by seasonal forecasts. Typically the greatest positive impact on uncertainty
occurs early in the season (Hansen et al., 2006). Options for reducing model uncertainty include
improving models, improving input data and parameters, and data assimilation techniques. These
techniques show the greatest benefit later in the season.
CCAFS contributions to crop forecasting methodology and capacity include: reconstructing historic
meteorological inputs, integrating seasonal climate forecasts into crop forecasts, remote sensing data
assimilation, and software platform development. However, understanding and fostering the use of
that information for decision-making is a particular emphasis.

24
3.3 Integration of agro-hydrological modelling, remote sensing and
geographical information Jos van Dam, Department of Environmental Science, Wageningen University, The Netherlands
For many years Wageningen University has been in the forefront of crop modelling leading to well-
known crop models as WOFOST, SUCROS and LINTUL. Many of these models can be downloaded from
http://models.pps.wur.nl. These models have been developed from a thorough understanding of crop
production, down to the role of leaf stomata. The agrohydrological model SWAP (Soil Water
Atmosphere Plant) combines the crop growth model WOFOST with a detailed soil transport model. The
graph below visualizes the processes modelled by SWAP.
Wageningen University has
conducted several research
projects in India (Sirsa) and Iran
(Esfahan) with local partners
with the aim to gain knowledge
of local cropping systems, study
the water cycle and look for
ways to aggregate results from
field to region. The projects
started with data collection
(both field data and remote
sensing data). The data have
been input to the crop model
SWAP and WOFOST. A
comparison is made between the crop models run with and without input of remote sensing data
through data assimilation.
In the uncorrected SWAP model, the simulated LAI was larger than satellite measured LAI. The main
reasons are the difference in scale between model and satellite as well as the fixed harvesting data in
the model. The model also showed larger fluctuations than the satellite data, which was also
contributed to a spatial and temporal scale effect.
As a second track, remote sensing parameters have been used to reset state variables in the model. The assimilation of satellite-based LAI measurements was most effective. This significantly reduced the bias percentages for predictions one month in advance of harvest. However, bias percentages for predictions two months ahead of harvest were not influenced positively by assimilation with LAI (Vazifedoust et al., 2009). In the near future, Wageningen University intends to apply these methodologies at common sites in Mali and India.
25
3.4 Assimilating remote sensing data into crop models improves predictive
performance for spatial application Martine Guerif, UMR EMMAH INRA UAPV, Avignon, France
Crop models are powerful tools for dealing with agro-environmental issues such as the impact of
agriculture on soil and water, the impact of agriculture on climate change, the evaluation of cropping
systems. Models can help with strategic and tactic decisions for sustainable cropping systems. Models
can be applied at different scales: field/farm, region, country and continent.
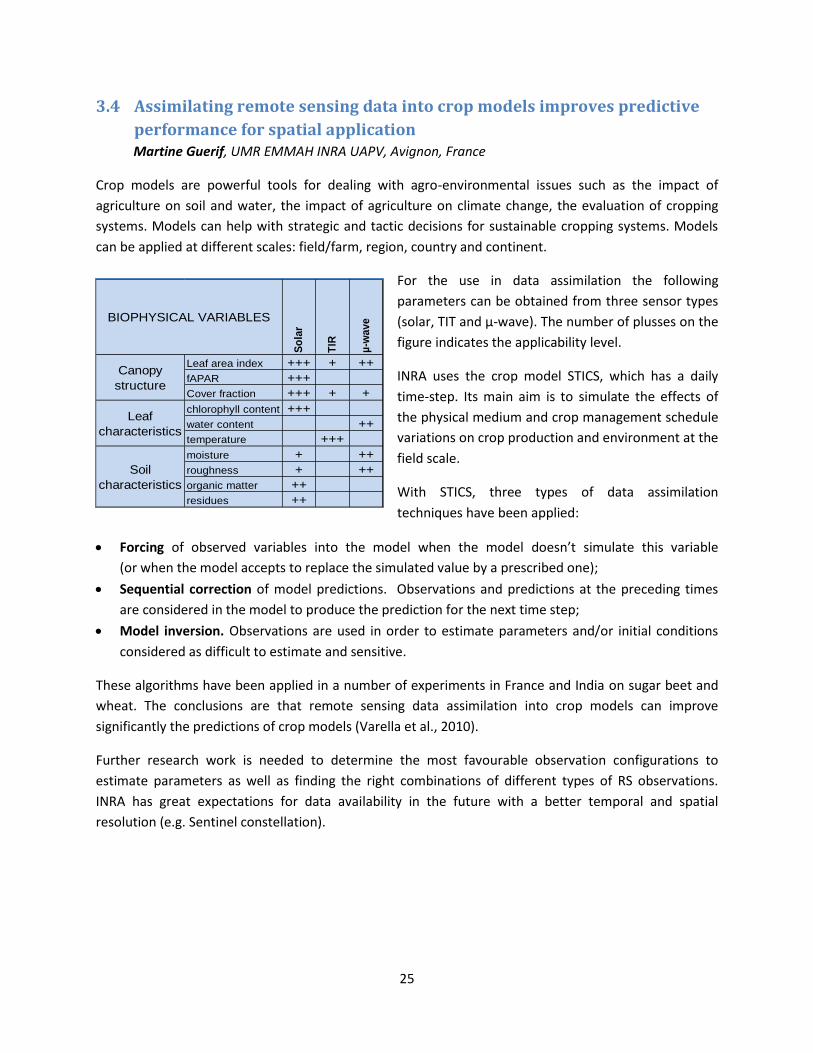
For the use in data assimilation the following
parameters can be obtained from three sensor types
(solar, TIT and µ-wave). The number of plusses on the
figure indicates the applicability level.
INRA uses the crop model STICS, which has a daily
time-step. Its main aim is to simulate the effects of
the physical medium and crop management schedule
variations on crop production and environment at the
field scale.
With STICS, three types of data assimilation
techniques have been applied:
Forcing of observed variables into the model when the model doesn’t simulate this variable
(or when the model accepts to replace the simulated value by a prescribed one);
Sequential correction of model predictions. Observations and predictions at the preceding times
are considered in the model to produce the prediction for the next time step;
Model inversion. Observations are used in order to estimate parameters and/or initial conditions
considered as difficult to estimate and sensitive.
These algorithms have been applied in a number of experiments in France and India on sugar beet and
wheat. The conclusions are that remote sensing data assimilation into crop models can improve
significantly the predictions of crop models (Varella et al., 2010).
Further research work is needed to determine the most favourable observation configurations to
estimate parameters as well as finding the right combinations of different types of RS observations.
INRA has great expectations for data availability in the future with a better temporal and spatial
resolution (e.g. Sentinel constellation).
So
lar
TIR
µ-w
av
eLeaf area index +++ + ++
fAPAR +++
Cover fraction +++ + +
chlorophyll content +++
water content ++
temperature +++
moisture + ++
roughness + ++
organic matter ++
residues ++
Canopy
structure
Leaf
characteristics
Soil
characteristics
BIOPHYSICAL VARIABLES
26
3.5 Regional Crop Simulation Modelling for Yield Prediction Using Remote
Sensing and GIS: Indian Experiences Vinay Sehgal, Indian Agricultural Research Institute, New Delhi, India
IARI is a 106 years old national institute in agricultural research & teaching in India, instrumental in the
“Green revolution” as well as the first national institute to introduce Remote Sensing in courses. Remote
Sensing (RS) can be of use for crop simulation models at regional scale. It may provide inputs parameters
and/or initial conditions as well as improve the accuracy of the model results. This positive effect of data
assimilation techniques is due to correction of errors in the structure of the model and the correction of
the growth affecting factors like pests, diseases, salinity etc. This can be done by making models self-
correcting as well as inserting RS measurements directly into the model as state variables.
Data assimilation algorithms used at IARI:
Direct use of the driving RS variable in model;
Forcing: updating of a state variable derived from RS (e.g. LAI);
Re-initialization: adjustment of an initial condition to obtain a simulation in agreement with RS
derived observations;
Re-calibration: adjustment of the model parameters to obtain a simulation in line with RS;
Corrective method: error between simulated and RS derived variable to correct yield values.
In the study area of Thanjavur MODIS LAI images are used in the ORYZA1 model (a model for irrigated
rice production) to get an estimate of the phenological stage of different rice classes.
In another study the WTGROWS model is applied with the forcing and re-initialization techniques to
estimate wheat grain yields at farmer field level. Grain yield estimations improved considerably using
this approach.
In India, conventionally, crop forecasting is done by Crop Cutting Experiments (CCE) following a sampling
plan that varies from state to state, and the results are then aggregated at higher administrative units.
Recent research initiatives have improved crop forecasting in India, namely:
FASAL (Forecasting Agricultural Output Using Space, Agrometeorology and Land-based
Observations). FASAL forecasts different crops using different remote sensing data combined with
field data.
NADAMS (National Agricultural Drought Assessment & Monitoring System). NADAMS uses seasonal
NDVI profiles integrated with ground information to estimate crop conditions.
Main findings (Sehgal et al., 2011):
Crop models need to describe at least three interdependent systems: canopy, root and soil system.
Crop management practices are the main determinant of variability in crop yields at small scale.
Remote sensing derived crop phenology (sowing), LAI and soil moisture assimilations at multiple
time in crop season are a possible way forward.
27
3.6 Integration of MODIS products and a crop simulation model for crop yield
estimation Gerrit Hoogenboom, Washington State University, Prosser, WA, USA, in collaboration with
Hongliang Fang, Institute of Geographic Sciences and Natural Resources Research, Chinese
Academy of Sciences, Beijing, China, and Shunlin Liang, University of Maryland, College Park
Maryland, USA.
Washington State University, in cooperation with various international partners has developed various
methodologies for crop yield estimation with remotely sensed data. The data assimilation techniques
used were:
Direct input: the model uses remotely sensed data as inputs
Sequential assimilation: replace state variables in the model with remotely sensed data
Variational assimilation: minimize the difference between variables estimated by remote
sensing and crop model simulations
Crop models used were:
DSSAT (Decision Support System for Agro-technology Transfer)
CSM-CERES-Maize and CSM-CERES-Wheat for maize/corn and wheat
CSM-CROPGRO-Soybean for soybean
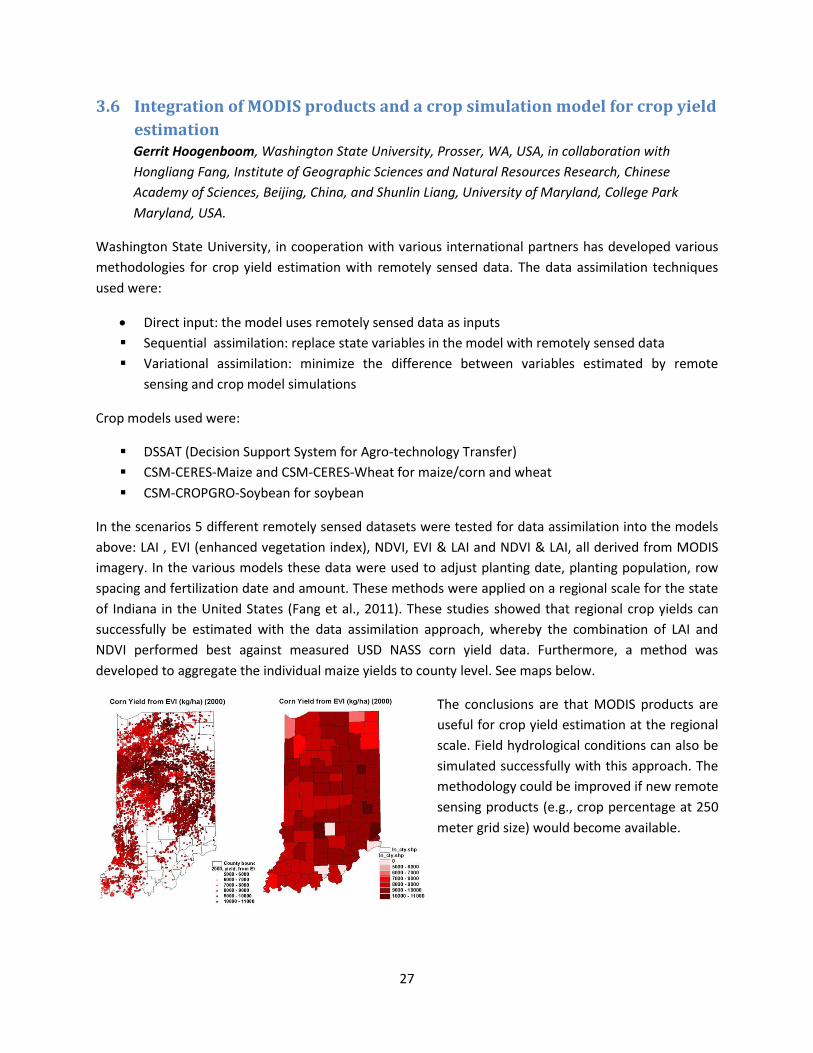
In the scenarios 5 different remotely sensed datasets were tested for data assimilation into the models
above: LAI , EVI (enhanced vegetation index), NDVI, EVI & LAI and NDVI & LAI, all derived from MODIS
imagery. In the various models these data were used to adjust planting date, planting population, row
spacing and fertilization date and amount. These methods were applied on a regional scale for the state
of Indiana in the United States (Fang et al., 2011). These studies showed that regional crop yields can
successfully be estimated with the data assimilation approach, whereby the combination of LAI and
NDVI performed best against measured USD NASS corn yield data. Furthermore, a method was
developed to aggregate the individual maize yields to county level. See maps below.
The conclusions are that MODIS products are
useful for crop yield estimation at the regional
scale. Field hydrological conditions can also be
simulated successfully with this approach. The
methodology could be improved if new remote
sensing products (e.g., crop percentage at 250
meter grid size) would become available.
28
3.7 Exploring the Response of the Central US Agro-Ecosystem to Climate
Change Darren Drewry, NASA Jet Propulsion Laboratory / Caltech Climate Physics Group, Pasadena, CA,
USA
Rapid changes in the earth atmosphere have been detected in the last hundred years. This applies to
carbon dioxide, methane, nitrous oxide and sulphur. At the same time scale, global warming has been
detected with an average increase of about 1 degree Celsius. A relation between the two phenomena is
plausible.
An assumption is often made that higher CO2 levels lead to higher plant production, as one of the
growth factors is available at a higher rates. However, some scientists doubt this, as plants appear to
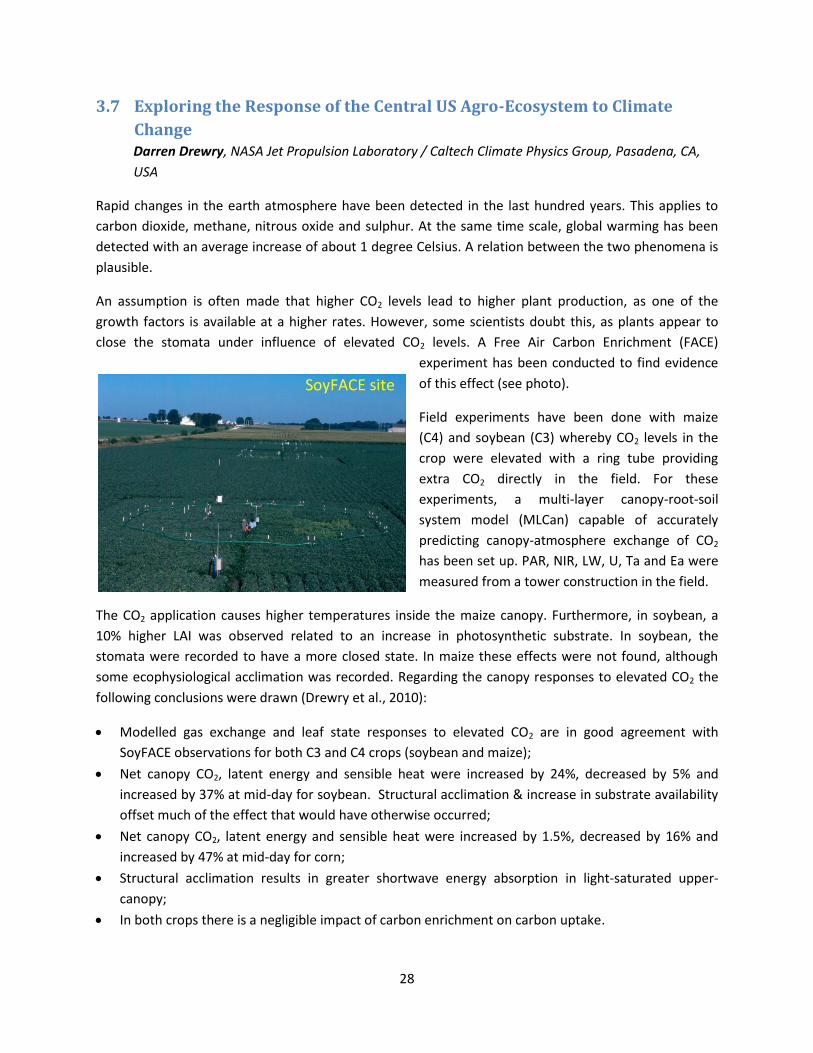
close the stomata under influence of elevated CO2 levels. A Free Air Carbon Enrichment (FACE)
experiment has been conducted to find evidence
of this effect (see photo).
Field experiments have been done with maize
(C4) and soybean (C3) whereby CO2 levels in the
crop were elevated with a ring tube providing
extra CO2 directly in the field. For these
experiments, a multi-layer canopy-root-soil
system model (MLCan) capable of accurately
predicting canopy-atmosphere exchange of CO2
has been set up. PAR, NIR, LW, U, Ta and Ea were
measured from a tower construction in the field.
The CO2 application causes higher temperatures inside the maize canopy. Furthermore, in soybean, a
10% higher LAI was observed related to an increase in photosynthetic substrate. In soybean, the
stomata were recorded to have a more closed state. In maize these effects were not found, although
some ecophysiological acclimation was recorded. Regarding the canopy responses to elevated CO2 the
following conclusions were drawn (Drewry et al., 2010):
Modelled gas exchange and leaf state responses to elevated CO2 are in good agreement with
SoyFACE observations for both C3 and C4 crops (soybean and maize);
Net canopy CO2, latent energy and sensible heat were increased by 24%, decreased by 5% and
increased by 37% at mid-day for soybean. Structural acclimation & increase in substrate availability
offset much of the effect that would have otherwise occurred;
Net canopy CO2, latent energy and sensible heat were increased by 1.5%, decreased by 16% and
increased by 47% at mid-day for corn;
Structural acclimation results in greater shortwave energy absorption in light-saturated upper-
canopy;
In both crops there is a negligible impact of carbon enrichment on carbon uptake.

29
3.8 Crop Yield Forecasting Over Various Scales Combining Models and
Remote Sensing Wilco Terink, FutureWater, Wageningen, Netherlands
Crop growth models can be applied at various scales ranging from field to basin and country to even
continent. Some models are more suitable to be
applied at field scale, while other models are more
suitable to be applied at the basin or continental
scale. FutureWater uses (agro)hydrological
simulation models that are in the opensource
domain. For each project, FutureWater
determines which model is most suitable, given
the spatial and temporal scales at hand (see
graphic).
An important aspect is formed by the trade-off between the physical model detail (model complexity)
and the availability of the required data. As
expected, field scale models have generally more
physical detail than continental models, where
input data are usually scarce and more
assumptions have to be made. Similarly, in remote
sensing, stratification is possible, based on
temporal frequency and spatial resolution (see
graphic).
FutureWater conducts projects at various scales as
mentioned above. In Egypt it evaluated the
(agro)hydrological performance of an farm-level
(field scale) irrigation improvement project.. In India the company calibrated at the basin scale a
hydrological model with remotely sensed evapotranspiration (Immerzeel and Droogers, 2008). For
the 22 countries in the Middle East and North Africa (MENA region), FutureWater performed a
water supply and demand analysis for the period 2010-2050.
In every project choices have to be made again. The selection of models and data is determined by:
The trade-off between required resolution, available resolution, and costs
High resolution inputs are almost always needed for calibration and correcting
Regarding remote sensing data there is a movement from optical to radar based imagery in order to be
able to look through clouds.

30
3.9 On the Assimilation of Remote Sensing Data with Crop Models for Crop
Yield Forecasting Amor Ines, International Research Institute for Climate and Society (IRI), Palisades, NY, USA
Uncertainty is one of the largest challenges when predicting crop yields. This uncertainty can be
attributed to both models and climate data. Uncertainty is highest early in the crop cycle and generally
diminishes towards the harvest. Model uncertainty can be lowered partly by data assimilation
techniques, while climate uncertainty can be decreased by using seasonal climate forecasts, (e.g. as
produced by IRI). Although seasonal forecasts have a low temporal and spatial scale, they have proven
to be useful in projects like the WFP Africa Risk Capacity project to reduce the uncertainty a few months
before harvest. See example of the scale of the seasonal
forecasts in map.
Generally crop models work best in large-scale,
homogeneous agro-ecosystems. However, for complex,
heterogeneous agricultural systems in the context of
smallholder agriculture in developing countries, the
fractions of target crops grown are usually small.
Innovations are especially needed in:
Un-mixing RS vegetation signature, which should
result in signals for different crops rather than a mixture of
crops and natural vegetation;
Promising RS soil moisture data are available (based
on radar), but the scale is still too coarse (both spatial and
temporal) for most modelling applications.
Crop monitoring and yield forecasting have been
investigated for the continental United States (especially
Georgia and Iowa) using DSSAT-CSM crop models in combination with soil moisture and LAI products
from remote sensing. Using AMSR-E soil moisture data with the Kalman filter, did not lead to
significantly better results, while the use of MODIS LAI did have a positive effect on accuracy of yield
data against USDA yield figures.
Conclusions of research are (Ines et al., 2012):
Regarding the Ensembles Kalman filter performance applied to DSSAT-CSM crop models, the value
of data assimilation with climate forecasts is more evident later in the growing season.
The skills of climate forecasts is most important in the early part of the growing season.
The availability of downscaled remotely sensed soil moisture and LAI data would make modelling
considerably more accurate.
Using both soil moisture + LAI gave better results compared to using them independently in the data
assimilation - possibly due to the interaction of the two in the simulations.

31
3.10 Simultaneous Estimation of Model State Variables and Observation and
Forecast Biases using a Two-Stage Hybrid Kalman Filter Valentijn R.N. Pauwels, Laboratory of Hydrology and Water Management, Ghent University,
Ghent, Belgium
In Earth sciences data assimilation is defined as the updating of modelled state variables using external
datasets. Therefore, in theory, one could simply replace model results by observations. In practice this is
not a good approach because:
Both the external data and the model results contain errors.
Many times a proxy of the state variables is assimilated, and not the state variable itself
Almost always one needs to update many (unobserved) state variables using only one or a couple of
observations.
Therefore more complicated methods for data assimilation are developed of which the most popular is
the Kalman filter. In the original Kalman Filter (1960), the state variables and observations are assumed
to be unbiased. It uses a model state-space representation of the system whereby the state variables
are mapped onto observation space.
In an example with soil moisture, the modelled soil moisture is expressed as a volumetric fraction
(between 0 and 1). The fact that the observations are in percentages shows that state variables can be
updated using any observation they are related to. In this approach, the “Kalman Gain” becomes a
weighting factor between the observation error and the model error.
The Kalman filter has been designed for linear, un-biased systems. Unfortunately many data sets
(especially remote sensing data) assimilated into hydrologic models contain a significant bias. Many
studies remove the bias before the assimilation by removing the long-term difference between the
model and the external data. Since models contain bias as well, this may not be the optimal strategy.
Therefore a refinement of the Kalman filter has been developed by Evensen (1994), which is called the
Ensemble Kalman Filter. It enables the assimilation of external data into nonlinear biased systems. It
essentially estimates forecast and observation biases together with the model state. An essential
assumption is that the observation and forecast bias errors are independent of each other and are also
independent of the system state errors.
Crop models tend to very complicated (many processes combined in one model), and need a wide
variety of data sets, model parameters, and meteorological forcing. This can lead to both random and
systematic errors in the model results.
Unfortunately, straightforward application of data assimilation techniques leads to both random and
systematic errors. Therefore, if bias is apparent in observations and/or model, this has to be taken into
account to get meaningful model outputs (Pauwels and De Lannoy, 2009).

32
3.11 Satellite image simulations for data assimilation at multiple scales Heike Bach, VISTA Remote Sensing in Geosciences, Munich, Germany
VISTA Remote Sensing is a private company (SME) situated in Munich, Germany (www.vista-geo.de). Its
main expertise is in remote sensing applications in hydrology and agriculture. Vista works in close
connection with the University of Munich with the aim to bring (crop) science to practice. For farmers,
Vista develops satellite techniques for precision farming in Europe and Russia (www.talkingfields.de).
PROMET (Mauser & Bach 2009) and SLC (Verhoef & Bach 2012) are land surface models that couple a
crop growth model with a radiative transfer model offering simulated satellite images that can be
compared to real ones for data assimilation purposes. SLC uses structural, spectral and observational
input data. PROMET is raster-based, and produces a completely closed water and energy balance.
Management practices such as sowing date and harvest date can be fed onto the system.
On a field scale, PROMET/SLC has been used to
predict wheat yields in a large-scale farm in
Germany, producing high resolution (20 m)
output, which fit very well with measurements
from combine harvester recordings (see graphic
from Hank et al., 2012).
In a meso-scale study encompassing the Upper
Danube Watershed (76000 km²) surface
temperatures were calculated with PROMET that
correlated very well to similar NOAA-AVHRR
extracted temperature data at a resolution of 1 by
1 km.
In a macro-scale study for Central Europe (1.36
million km²) the MM5 model (model to simulate
or predict atmospheric circulation) was combined
with PROMET, where the 45km pixels of the MM5
model were successfully combined with the 1 km PROMET model to deliver an estimate for the average
annual evapotranspiration (Zabel et al. 2012).
The above-presented examples show that high resolution satellite images now allow observing the
current crop status at various scales. The heterogeneities of the land surface can thus be captured. By
assimilation of satellite data, improved modelling of the water and carbon cycle can be achieved.
PROMET is capable of predicting crop yields at field scale, meso-scale and even macro-scale using the
same physical principles and procedures.

33
3.12 MARS operational crop monitoring and yield forecasting activities in
Europe Gregory Duveiller, AGRI4CAST Action, MARS Unit, JRC, Ispra, Italy
The European Commission requires in-season crop yield forecasts at a European level as part of the
decision making process on market intervention and for policy support. For the past twenty years, the
Monitoring Agricultural Resources (MARS) Unit of the European Commission Joint Research Centre (JRC)
has operationally produced such forecasts for European member states and for countries in the EU
periphery in a tight monthly schedule. This is done using the MARS Crop Yield Forecasting System
(MCYFS), a modelling infrastructure driven by agro-meteorological data and assisted by remotely sensed
observations. The MCYFS is a decision support system driven by expert knowledge and relying on four
main data infrastructures: a meteorological data infrastructure, a remote sensing data infrastructure, a
crop simulation infrastructure and a statistical infrastructure. The system uses meteorological data to
run crop growth models that provide information on crop status, such as biomass production, soil
moisture or biomass of the storage organs. Remote sensing provides an independent assessment of
crop status through the use of global and pan-European low-resolution imagery in near real-time (NRT).
Finally, the statistical infrastructure includes methods used to analyse, along the season, historical yield
records against the information about crop status generated by crop models to produce a forecast that
is presented in a monthly bulletin to decision-makers in Brussels. Of course, the team of analysts that
needs to decide what is the
most adequate information
to base the forecast upon is
the keystone of this
approach, and is supported
by a skilled IT team. The
system is articulated by a
spatial framework defining
the spatial reference upon
which all the data is
generated (reference grids,
administrative units, static
spatial layers used by crop
models and remote sensing,
etc.).
Some research questions that are currently being investigated or that are foreseen in the coming future
include the following: (1) using remote sensing to provide improved crop calendars which could help
recalibrate models better in the crop modelling infrastructure; (2) develop a method to identify pure
enough crop specific time series from MODIS that can be used from crop growth monitoring; (3)
exploiting global solar radiation LANSAF products (derived from MSG) as input to the crop models to
produce simulations of better quality.

34
3.13 Experiences with data assimilation for regional crop yield forecasting Allard de Wit, Alterra, Wageningen, The Netherlands
The result of a study investigating whether data assimilation techniques could improve regional crop
yield forecasting for Europe was presented. A study area was selected in the Walloon area of Belgium
and in Northern France. In this area wheat is a dominant crop. The WOFOST crop yield model was
applied on these areas on a 10x10 km grid scale. The methodology involved the identification of “pure”
wheat pixels (see graphics) using LAI temporal profiles. MODIS GAI ingestion was used for selected
wheat pixels for the years 2000 to 2009.
The research involved heavy quality control on MODIS GAI after which the GAI data were applied in
WOFOST using parameter optimization. Finally results were validated with the EUROSTAT regional
statistics.
Limitations to the use of the
Kalman Ensembles data
assimilation technique were
found. As EnKF originates from
meteorology and oceanography
(Evensen 1994) it works best with
integration of rates of change
according to atmospheric
physics/hydrodynamics.
However, crop models have two
processes running: growth and
phenology. Phenology can be
seen as a parallel controlling
process that complicated the
application of the EnKF filter.
The main conclusions of the research are (de Wit et al., 2012):
The Ensemble Kalman filter must be applied with care. It proved to be suitable for soil moisture
assimilation, where there is no phenology effect.
The data assimilation recalibration strategy seems more suitable in general for assimilating canopy
variables although crop-specific estimates are needed (no mixed pixels).
MODIS GAI estimates have shown to be very noisy in W-Europe, as a result of the high level of
landscape fragmentation. Post-processing and quality control are very important.
MODIS GAI estimates have demonstrated to be useful in updating crop model parameters. One of
the findings was that the inter-annual variability in the distributions of the optimized model
parameters was larger than expected.

35
3.14 Crop Monitoring and Early Warning Service in Africa Bakary Djaby, University of Liege, Arlon, Belgium
University of Liege (ULg) plays an important role in the GMFS (Global Monitoring for Food Security)
project, funded by the European Space Agency (see www.gmfs.info). The main partners in Africa are
located in Sudan, Malawi and Niger (AGHRYMET).
The ULg aims at improving early warning services with quantitative estimates of crop yield and pasture
biomass in two regions:
West Africa: Development of crop yields forecast models using remote sensing data in Niger and
Senegal;
East Africa and West Africa: improvement of Livestock Early Warning systems products in West
Africa (Niger and Senegal) and East Africa (Ethiopia)
In GMFS Phase 2, the focus of the project has been on intensive training of users in Africa, and the
integration of model results into the countries food security bulletins. The model used is the FAO Crop
specific soil water balance model (CSSWB), which has been implemented in the software AgrometShell.
Input data differ from application to application, but in general these datasets are used:
Rainfall estimates from stations and ECMWF era interim reanalysis data
Remote sensing NOAA-AVHRR GAC, SPOT and MERIS imagery (NDVI, Fapar and DMP)
Land use data: LULC/ Globcover and FAO crop calendars.
National Statistics for production data
Remote Sensing data are used to assess the seasonality (sowing, harvest). For this, time series are
analyzed with the adaptive Savitzky-Golay filtering method. From this fitted model the beginning and
end of the growing season can be extracted. In a next step, these data are input into the water balance
calculations.
For validation extensive field surveys have been conducted in Niger and Senegal for 5 years. In Niger
18343 fields with millet, 8548 fields with sorghum and 1791 fields with maize In Senegal 3122 fields with
millet and 2743 fields with peanuts. The models are validated by leaving part of the input data out of the
calculations and check calculated values against input data later. If little data are available leave-one-
out cross validation techniques are used as well as resampling (bootstrap).
Some difficulties were experienced with the accuracy of climate information, e.g. ECMWF versus
country station data and uncertainties in land use and country statistical figures.
Developments planned in the near future:
Integration of SAR soil moisture data;
Two forecast periods in Niger and Senegal for this season (August and September);
Comparative study of USGS WRSI input versus AgrometShell Water balance and impact.
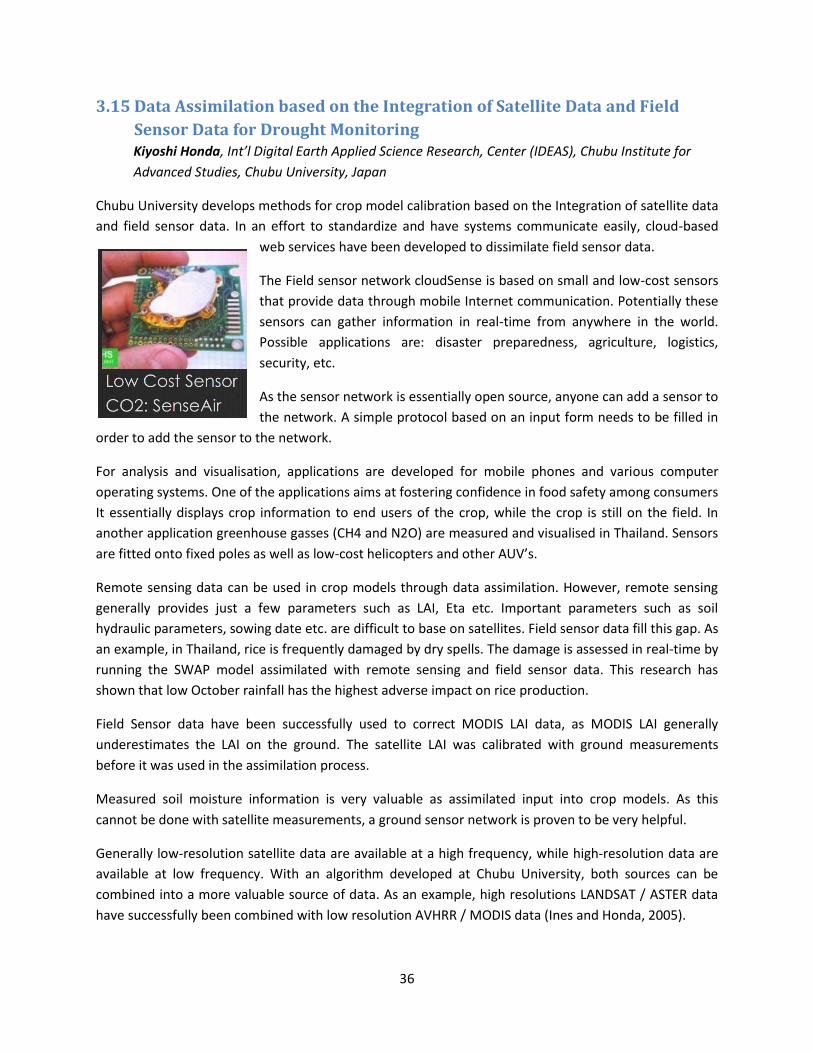
36
3.15 Data Assimilation based on the Integration of Satellite Data and Field
Sensor Data for Drought Monitoring Kiyoshi Honda, Int’l Digital Earth Applied Science Research, Center (IDEAS), Chubu Institute for
Advanced Studies, Chubu University, Japan
Chubu University develops methods for crop model calibration based on the Integration of satellite data
and field sensor data. In an effort to standardize and have systems communicate easily, cloud-based
web services have been developed to dissimilate field sensor data.
The Field sensor network cloudSense is based on small and low-cost sensors
that provide data through mobile Internet communication. Potentially these
sensors can gather information in real-time from anywhere in the world.
Possible applications are: disaster preparedness, agriculture, logistics,
security, etc.
As the sensor network is essentially open source, anyone can add a sensor to
the network. A simple protocol based on an input form needs to be filled in
order to add the sensor to the network.
For analysis and visualisation, applications are developed for mobile phones and various computer
operating systems. One of the applications aims at fostering confidence in food safety among consumers
It essentially displays crop information to end users of the crop, while the crop is still on the field. In
another application greenhouse gasses (CH4 and N2O) are measured and visualised in Thailand. Sensors
are fitted onto fixed poles as well as low-cost helicopters and other AUV’s.
Remote sensing data can be used in crop models through data assimilation. However, remote sensing
generally provides just a few parameters such as LAI, Eta etc. Important parameters such as soil
hydraulic parameters, sowing date etc. are difficult to base on satellites. Field sensor data fill this gap. As
an example, in Thailand, rice is frequently damaged by dry spells. The damage is assessed in real-time by
running the SWAP model assimilated with remote sensing and field sensor data. This research has
shown that low October rainfall has the highest adverse impact on rice production.
Field Sensor data have been successfully used to correct MODIS LAI data, as MODIS LAI generally
underestimates the LAI on the ground. The satellite LAI was calibrated with ground measurements
before it was used in the assimilation process.
Measured soil moisture information is very valuable as assimilated input into crop models. As this
cannot be done with satellite measurements, a ground sensor network is proven to be very helpful.
Generally low-resolution satellite data are available at a high frequency, while high-resolution data are
available at low frequency. With an algorithm developed at Chubu University, both sources can be
combined into a more valuable source of data. As an example, high resolutions LANDSAT / ASTER data
have successfully been combined with low resolution AVHRR / MODIS data (Ines and Honda, 2005).

37
3.16 Data assimilation for the carbon cycle in Sudan savannah smallholder
communities Pierre Traoré, ICRISAT, Bamako, Mali
Stable soil organic carbon (SOC) plays an important role in soils while it retains water and improves the
structure of the soil. Increasing SOC contents in the soil could also potentially help reduce the CO2
content of the air. These are long-term processes prove difficult to quantify. ICRISAT took up the
challenge and used the DSSAT model (DSSAT-CENTURY) together with field measurements and remote
sensing to quantify the carbon cycle.
This was applied in Sudanian agricultural systems in Southern Mali, Burkina Faso and Ghana (see map).
These areas have heterogeneous management techniques and quite extensive mixed cropping practices,
often with low-yielding traditional varieties. The most important crops were maize, yam, millet,
sorghum and peanut. Even within a crop like sorghum, 8 to 10 different varieties have been identified
that react differently to management practices.
Information on the very
detailed cropping patterns
was obtained though high-
resolution imagery in
combination with field work
(based on QuickBird NDVI
anomalies).
In time, SOC measurements
and model outcomes have
been studied at both point
level and aggregated to areas, where the aim was to minimize uncertainty. At point level simplified
DSSAT simulations of SOC have been assimilated with field measurements using the Ensemble Kalman
Filter.
At point-level (Jones & al., 2004, 2007; Koo, 2007), using the EnKF reduced measurement uncertainty by
around 60%. Furthermore, over space the EnKF reduced uncertainty by 50%, although results proved to
be very sensitive to initial estimates of parameters. In other words, there is uncertainty on departure
from steady state as well as uncertainty on planting dates.
Besides this research, ICRISAT is instrumental in the worldwide AgMIP project. This is a distributed
climate-scenario simulation exercise for historical model intercomparison and future climate change
conditions that goes further than just crop modelling. Many crop and agricultural economics modelling
groups around the world are contributing. The goals of AgMIP are to improve substantially the
characterization of risk of hunger and world food security due to climate change and to enhance
adaptation capacity in both developing and developed countries.

38
3.17 Soil-water-crop modelling for decision support in Sub-Saharan west
Africa: experiences from Niger and Benin Pierre B. Irénikatché AKPONIKPÈ, Faculty of Agronomy, University of Parakou, Benin
The Sahel region in West Africa suffers from low grain yields (millet yield often lower than 500kg/ha),
caused by limited and uncertain rainfall (300-600mm per year) compounded by low soil fertility.
Although numerous improvements have been proposed over the years, the impact of agricultural
research is still low. Small scale farmers rarely adopt new management methods and inputs. The main
reason seems to be that farmers seek to reduce risk while scientists try to increase yields.
The University of Parakou in Benin has investigated this phenomenon. It has studied climate risk
management in S-W Niger where a high temporal rainfall variability is normal (annual coefficient of
variance of 17 to 36 %, even 78% at a daily basis). There is also a high spatial rainfall variability. Farmers
seem to adapt to the spatial variability by dispersing their fields within the village territory.
The University set out to investigate the hypothesis whether farmers disperse their fields to reduce
agro-climatic risk.
A “household field dispersion index” has been developed to test the hypothesis. This index is sensitive to
the distance between fields, but independent of the number of farms in the village as well as the total
farm area of the farmer. Furthermore a “yield instability index” (to measure inter-annual variation of the
household) and a “yield disparity index” (to measure the inter-annual variation of yields relative to the
village area) were constructed. Soil fertility gradients were taken into account. Closer to the village soil
fertility is usually higher.
The main conclusions were as follows (Akponikpe et al., 2011):
There is no relation between cumulated annual rainfall and yield (see graph);
Large spatial rainfall variability generates an even larger spatial variability in yields;
Field dispersion, as practiced by farmers in western Niger, allows to mitigate inter-annual yield
variability at the household level, albeit to a limited extent.
A second study was carried out in Northern Benin
investigating the optimal amount of nitrogen that can
be applied to farmers fields., the current
recommendation being 30 kg per ha.
The University found that grain yields were
considerably lower than those assumed with the
recommendation above. In part this is explained by
farmers using un-improved varieties of millet. The
study concludes that that around 15 kg of nitrogen per ha is the best optimum.
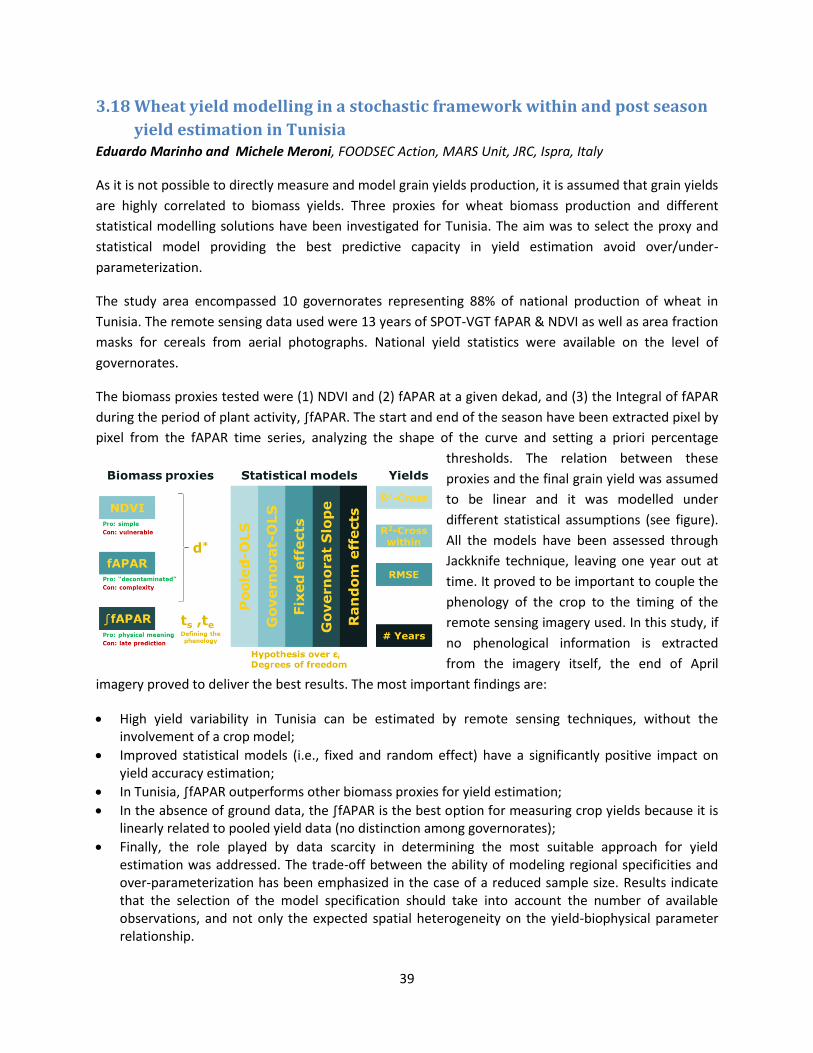
39
3.18 Wheat yield modelling in a stochastic framework within and post season
yield estimation in Tunisia Eduardo Marinho and Michele Meroni, FOODSEC Action, MARS Unit, JRC, Ispra, Italy
As it is not possible to directly measure and model grain yields production, it is assumed that grain yields
are highly correlated to biomass yields. Three proxies for wheat biomass production and different
statistical modelling solutions have been investigated for Tunisia. The aim was to select the proxy and
statistical model providing the best predictive capacity in yield estimation avoid over/under-
parameterization.
The study area encompassed 10 governorates representing 88% of national production of wheat in
Tunisia. The remote sensing data used were 13 years of SPOT-VGT fAPAR & NDVI as well as area fraction
masks for cereals from aerial photographs. National yield statistics were available on the level of
governorates.
The biomass proxies tested were (1) NDVI and (2) fAPAR at a given dekad, and (3) the Integral of fAPAR
during the period of plant activity, ∫fAPAR. The start and end of the season have been extracted pixel by
pixel from the fAPAR time series, analyzing the shape of the curve and setting a priori percentage
thresholds. The relation between these
proxies and the final grain yield was assumed
to be linear and it was modelled under
different statistical assumptions (see figure).
All the models have been assessed through
Jackknife technique, leaving one year out at
time. It proved to be important to couple the
phenology of the crop to the timing of the
remote sensing imagery used. In this study, if
no phenological information is extracted
from the imagery itself, the end of April
imagery proved to deliver the best results. The most important findings are:
High yield variability in Tunisia can be estimated by remote sensing techniques, without the involvement of a crop model;
Improved statistical models (i.e., fixed and random effect) have a significantly positive impact on yield accuracy estimation;
In Tunisia, ∫fAPAR outperforms other biomass proxies for yield estimation;
In the absence of ground data, the ∫fAPAR is the best option for measuring crop yields because it is linearly related to pooled yield data (no distinction among governorates);
Finally, the role played by data scarcity in determining the most suitable approach for yield estimation was addressed. The trade-off between the ability of modeling regional specificities and over-parameterization has been emphasized in the case of a reduced sample size. Results indicate that the selection of the model specification should take into account the number of available observations, and not only the expected spatial heterogeneity on the yield-biophysical parameter relationship.

40
41
4 References
Akponikpe, P.B.I., J. Minet, B. Gerard, P. Defourny, and C.L. Bielders, 2011. Spatial fields dispersion as a
farmer strategy to reduce agro-climatic risk at the household level in pearl millet-based systems in the
Sahel: a modelling perspective. Agricultural and Forest Meteorology, 151: 215-227.
de Wit, A., Duveiller, G., Defourny,P., 2012, Estimating regional winter wheat yield with WOFOST
through the assimilation of green area index retrieved from MODIS observations. Agricultural and Forest
Meteorology, in press.
Drewry, D.T., P. Kumar, S. Long, C. Bernacchi, X.-Z. Liang, and M. Sivapalan, 2010. Ecohydrological
responses of dense canopies to environmental variability: 1. Interplay between vertical structure and
photosynthetic pathway. Journal of Geophysical Research, 115, G04023, doi:10.1029/2010JG001341.
Duveiller, G., F. Baret, and P. Defourny, 2012. Crop specific green area index retrieval from MODIS data
at regional scale by controlling pixel-target adequacy. Remote Sensing of Environment, in press.
Fang, H., S. Liang, G. Hoogenboom, 2011. Integration of MODIS products and a crop simulation model
for crop yield estimation. International Journal of Remote Sensing, 32(4): 1039-1065.
Hammer, G.L., J.W. Hansen, J.G. Phillips, J.W. Mjelde, H. Hill, A. Love, A. Potgieter, 2001. Advances in application of climate prediction in agriculture. Agricultural Systems 70: 515–553. Hank, T., Bach, H., Spannraft, K., Friese, M., Frank, T., Mauser, W. 2012. Improving the process-based simulation of growth heterogeneities in agricultural stands through assimilation of earth observation data, IEEE, IGARSS 2012 Proceedings. Hansen, J.W., A. Challinor, A. Ines, T. Wheeler, and V. Moron, 2006. Translating climate forecasts into agricultural terms: advances and challenges. Climate Research. 33: 27–41. Hansen, J.W., Challinor, A., Ines, A., Wheeler, T., Moron, V. 2006. Translating climate forecasts into agricultural terms: advances and challenges. Climate Research. 33: 27–41. Hansen, J.W. 2005. Integrating seasonal climate prediction and agricultural models for insights into agricultural practice. Philosophical Transactions of the Royal Society. B. 360: 2037-2047 Hansen J.W., Indeje, M. 2004. Linking dynamic seasonal climate forecasts with crop simulation for maize yield prediction in semi-arid Kenya. Agricultural and Forest Meteorology. 125: 143–157. Immerzeel, W.W., and P. Droogers, 2008. Calibration of a distributed hydrological model based on
satellite evapotranspiration. Journal of Hydrology. 349: 411-424.
Ines, A., Das, N.N., Hansen, J.W. and E.G.Njoku, 2012. Assimilation of remotely sensed soil moisture and
vegetation with a crop simulation model. Remote Sensing of Environment. Under review.

42
Ines, A., and K. Honda, 2005. On quantifying agricultural and water management practices from low
spatial resolution RS data using genetic algorithms: A numerical study for mixed pixel environment.
Advances in Water Resources. 28: 856-870.
Mauser, W., Bach H. (2009): PROMET – a Physically Based Hydrological Model to Study the Impact of
Climate Change on the Water Flows of Medium Sized, Mountain Watersheds, J. Hydrol., 376(2009)362-
377.
Pauwels, V. R. N., and G. J. M. De Lannoy .2009. Ensemble-based assimilation of discharge into rainfall-
runoff models: A comparison of approaches to mapping observational information to state space.
Water Resources Research. 45, W08428, doi:10.1029/2008WR007590.
Rojas, O., 2007. Operational maize yield model development and validation based on remote sensing
and agro‐meteorological data in Kenya. International Journal of Remote Sensing, 28: 3775-3793.
Sehgal, V.K., Jain, S., Aggarwal, P.K., and S. Jha, 2011. Deriving Phenology Metrics and Their Trends Using
Times Series of NOAA-AVHRR NDVI Data. Journal of Indian Society of Remote Sensing 39: 373-381.
Vermeulen, S., Zougmore, R., Wollenberg, E., Thornton, P., Nelson, G., Kristjanson, P., Kinyangi, J., Jarvis, A., Hansen, J., Challinor, A., Campbell, B. and P. Aggarwal. 2012. Climate change, agriculture and food security: a global partnership to link research and action for low-income agricultural producers and consumers. Environmental Sustainability. 4:128–133 Vermeulen, S.J., Aggarwal, P.K., Ainslie, A., Angelone, C., Campbell, B.M., Challinor, A.J., Hansen, J.W., Ingram, J.S.I., Jarvis, A., Kristjanson, P., Lau, C. , Nelson, G.C., Thornton, P.K., E. Wollenberg. 2012. Options for support to agriculture and food security under climate change. Environmental Science & Policy 15:136-144. Varella, H., M. Guérif, S. Buis, and N. Beaudoin, 2010. Soil properties estimation by inversion of a crop
model and observations on crops improves the prediction of agro-environmental. European Journal of
Agronomy. 33: 139-147.
Vazifedoust, M., J.C. van Dam, W.G.M. Bastiaanssen and R.A. Feddes, 2009. Assimilation of satellite data
into agrohydrological models to improve crop yield forecasts. International Journal of Remote Sensing,
30: 2523-2545.
Verhoef, W., Bach, H. 2012. Simulation of Sentinel-3 images by four stream surface atmosphere
radiative transfer modeling in the optical and thermal domains. Remote Sensing of Environment, 120 :
197-207.
Zabel, F., Mauser, W., Marke, T., Pfeiffer, A., Zangl, G., and C. Wastl. 2012. Inter-comparison of two land-
surface models applied at different scales and their feedbacks while coupled with a regional climate
model. Hydrology and Earth System Science. 16: 1017–1031.
43
5 Acronyms and Abbreviations
AGRHYMET Centre for Agriculture, Hydrology and Meteorology
AgMIP Agricultural Model Intercomparison and Improvement Project
AGROMETSHELL
FAO Water Balance Model implementation
AMSR Advanced Microwave Scanning Radiometer
AUV Unmanned Aerial Vehicle
AVHRR Advanced Very High Resolution Radiometer
C3 Carbon fixation method in photosynthesis for most crops in temperate regions (e.g., wheat)
C4 Carbon fixation method in photosynthesis for some crops in tropical regions (e.g., maize)
CCAFS Climate Change, Agriculture and Food Security research program of the CGIAR
CCE Crop Cutting Experiments
CGIAR Research Program on Climate Change, Agriculture and Food Security
CSM Cropping System Model
DSSAT Decision Support System for Agro-technology Transfer
ECMWF European Centre for Medium-Range Weather Forecasts
EnKF Ensemble Kalman Filter
EOS Earth Observing System, a coordinated series of polar-orbiting and low inclination satellites
ESSP Earth System Science Partnership
ETA Actual Crop Evapotranspiration
EVI Enhanced vegetation Index
FACE Free Air Carbon Enrichment
FAO Food and Agriculture Organisation of the United Nations
FAPAR Fraction of Absorbed Photosynthetically Active Radiation
FASAL Forecasting Agricultural Output Using Space, Agromet and Land Observations (India)
GAI Green Area Index
GWSI Global Water Satisfaction Index
IARI Indian Agricultural Research Institute
ICRISAT International Crops Research Institute for Semi-Arid Tropics
INRA French National Institute for Agricultural Research
IRI International Research Institute for Climate and Society
JRC Joint Research Centre of the European Commission
LAI Leaf Area Index
LINGRA A grass growth model developed by ALTERRA, Wageningen. Based on LINTUL
LINTUL Light INTerception and UtiLization simulator. A simple general crop growth model
MARS The “Monitoring Agriculture with Remote Sensing” project of the JRC - AGRI4CAST
MERIS MEdium Resolution Imaging Spectrometer
MLCan Vertically resolved canopy-atmosphere exchange model
MM5 Mesoscale crop growth model of Pennsylvania State University
MODFLOW Groundwater model

44
MODIS MODerate-resolution Imaging Spectroradiometer
MSG METEOSAT Second Generation
N Nitrogen
NADAMS National Agricultural Drought Assessment & Monitoring System (India)
NASA National Aeronautics and Space Administration (USA)
NDVI Normalized Difference Vegetation Index
NGO Non-governmental organization
NIR Near Infrared
NOAA National Oceanic and Atmospheric Administration
OLS Ordinary Least Squares
ORYZA1 Eco-physiological model for irrigated rice production.
PROMET Crop Growth Model of VISTA (German company)
PROSAIL Radiative transfer model
RS Remote Sensing
SAR Synthetic Aperture Radar
SOC Stable soil organic carbon
SPOT Système Pour l'Observation de la Terre (French satellites)
STICS Generic model for the simulation of crops and their water and nitrogen balances.
SUCROS Simple and Universal CROp growth Simulator
SWAP Soil Water Atmosphere Plant model
TM Thematic Mapper
TRMM Tropical Rainfall Measuring Mission
USGS United States Geological Survey
VGT VEGETATION sensor on board the SPOT satellite
WARM Rice crop model used at JRC
WFP World Food Programme
WOFOST WOrld FOod Studies. Simulation model for the quantitative analysis of the growth and production of annual field crops
WRSI Water Requirement Satisfaction Index
WTGROWS Crop simulation model for regional wheat yield mapping
45
6 Workshop Program
Wednesday, 13 June 2012
Opening session
09:00-09:10 Welcome address, JRC
09:10-09:25 Crop Forecasting within the CCAFS Program, James Hansen, CCAFS, IRI-Columbia University
09:25-09:40 The challenges of an operational crop yield forecasting system in Sub-Saharan Africa. Is there a realistic and effective solution? Francois Kayitakire, JRC
09:40-10:10 Integration of agro-hydrological modelling, remote sensing and geographical information, Jos van Dam, Wageningen University
Session 1
10:45-11:15 Assimilation of remote sensing observations into a crop model improves predictive performance for spatial application, Martine Guerif, INRA
11:15-11:45 Regional Crop Simulation Modelling for Yield Prediction using Remote Sensing and GIS: Indian Experiences, Vinay Sehgal, IARI-India
11:45-12:15 Using MODIS LAI to estimate maize yield, Gerrit Hoogenboom, Washington State University
12:15-12:30 Discussion
Session 2
14:00-14:30 Exploring the climatic response of the central US agro-ecosystem, Darren Drewry, NASA-JPL
15:30-16:00 On the assimilation of remotely sensed soil moisture and vegetation with crop simulation models, Amor Ines, IRI, Columbia University
Session 3
16:30-17:00 Simultaneous Estimation of Model State Variables and Observation and Forecast Biases using a Two-Stage Hybrid Kalman Filter, Valentijn Pauwels, Ghent University
17:00-17:30 Satellite image simulations for data assimilation at multiple scales, Heike Bach (VISTA) and Wolfram Mauser (University of Munich)
17:30-18:00 Estimating crop biophysical properties from remote sensing data by inverting linked radiative transfer and ecophysiological models, Kelly R. Thorp, USDA

46
18:00-18:15 Discussion
Thursday, 14 June 2012
Session 4
9:00-09:30 MARS operational crop monitoring and yield forecasting activities in Europe and possible improvements based on remote sensing data, Gregory Duveiller, JRC
09:30-10:00 Experiences with satellite data assimilation for regional crop yield forecasting, Allard de Wit, Alterra
10:00-10:30 Operational crop yield forecast using remote sensing and agrometeorological in West Africa, Bernard Tychon and Bakary Djaby, University of Liege
Session 5
10:45-11:15 Data Assimilation based on the Integration of Satellite Data and Field Sensor Data for Drought Monitoring, Kiyoshi Honda, Chubu University
11:15-11:45 Data assimilation for the carbon cycle in Sudanian smallholder communities, Sibiry Traore, ICRISAT
11:45-12:15 Soil-water-crop modeling for decision support in sub-saharan West Africa: experiences from Niger and Benin, Pierre Irénikatché AKPONIKPE, Université de Parakou
12:15-12:45 Wheat yield modelling in a stochastic framework – within and post season yield estimation in Tunisia, Eduardo Marinho and Michele Meroni, JRC
Session 6: Discussion and way forward
14:30-16:30 James Hansen, CCAFS, Chair of the session
16:30-17:00 Meeting conclusions
47
7 Participants
Participant Insitute Country
Workshop Steering Committee
Francois Kayitakire Joint Research Centre Italy
Amor Ines IRI, Columbia University USA
Jos van Dam Wageningen University The Netherlands
Gregory Duveiller Joint Research Centre Italy
Narendra Das NASA-Jet Propulsion Lab USA
James Hansen CCAFS; IRI, Columbia University USA
Presenters
Pierre Akponikpe University of Parakou Benin
Heike Bach VISTA-Geo Germany
Allard de Wit Alterra The Netherlands
Bakary Djabi University of Liege Belgium
Darren Drewry NASA-Jet Propulsion Laboratory United States
Gregoy Duveiller Joint Research Centre Italy
Martine Guerif INRA France
James Hansen IRI, Columbia University United Sates
Kiyoshi Honda Chubu University Japan
Gerrit Hoogenboom Washington State University United States
Amor Ines IRI, Columbia University United States
Francois Kiyitakire Joint Research Centre Italy
Eduardo Marinho Joint Research Centre Italy
Michele Meroni Joint Research Centre Italy
Valentijn Pauwels Ghent University Belgium
Vinay Sehgal Indian Agricultural Research Institute India
Wilco Terink FutureWater The Netherlands
Pierre Sibiry Traore ICRISAT Mali
Jos van Dam Wageningen University The Netherlands
Other Participants
Bettina Baruth Joint Research Centre Italy
Herve Kerdiles Joint Research Centre Italy
Olivier Leo Joint Research Centre Italy
Raul Lopez Joint Research Centre Italy
Giancarlo Pini Joint Research Centre Italy
Ferdinando Urbano Joint Research Centre Italy
Christelle Vancutsem Joint Research Centre Italy
Peter Hoefsloot Hoefsloot Spatial Solutions The Netherlands

48
8 Sponsors
The workshop and report were supported by the CGIAR Research Program on Climate Change,
Agriculture and Food Security (CCAFS) – a strategic partnership of the CGIAR and the Earth System
Science Partnership (ESSP), led by the International Center for Tropical Agriculture (CIAT). CCAFS brings
together the world’s best researchers in agricultural science, development research, climate science and
Earth System science, to identify and address the most important interactions, synergies and tradeoffs
between climate change, agriculture and food security. CGIAR is a global research partnership for a food
secure future. CCAFS is supported by the Canadian International Development Agency (CIDA), the
Danish International Development Agency (DANIDA), the European Union (EU), with technical support
from the International Fund for Agricultural Development (IFAD). The views expressed in this document
cannot be taken to reflect the official opinions of CGIAR or ESSP.
The Joint Research Centre of the European Union (JRC) is the European Commission’s in-house science
service. It provides the science for policy decisions, with a view to ensuring that the EU achieves its
Europe 2020 goals for a productive economy as well as a safe, secure and sustainable future. The JRC
plays a key role in the European Research Area and reinforces its multi-disciplinarity by networking
extensively with leading scientific organisations in the Member States, Associated Countries and
worldwide.

European Commission
EUR 25643 – Joint Research Centre – Institute for Environment and Sustainability
Title: Combining crop models and remote sensing for yield prediction: Concepts, applications and challenges for
heterogeneous, smallholder environments
Author(s): Peter Hoefsloot, Amor Ines, Jos van Dam, Gregory Duveiller, Francois Kayitakire and James Hansen
Luxembourg: Publications Office of the European Union
2012 – 52 pp. – 21.0 x 29.7 cm
EUR – Scientific and Technical Research series – ISSN 1831-9424 (online)
ISBN 978-92-79-27883-9 (pdf)
doi:10.2788/72447
Abstract
JRC and CCAFS jointly organized a workshop on June 13-14, 2012 in Ispra, Italy with the aim to advance the state-of-
knowledge of data assimilation for crop yield forecasting in general, to address challenges and needs for successful
applications of data assimilation in forecasting crop yields in heterogeneous, smallholder environments, and to enhance
collaboration and exchange of knowledge among data assimilation and crop forecasting groups.
The workshop showed that advances made in crop science are widely applicable to crop forecasting. The presentations
of the participants approached the challenge from many sides, leading to ideas for improvement that can be
implemented in real-time, operational crop yield forecasting. When applied, this knowledge has the potential to benefit
the livelihoods of smallholder farmers in the developing world.

z
As the Commission’s in-house science service, the Joint Research Centre’s mission is to provide EU policies with independent, evidence-based scientific and technical support throughout the whole policy cycle. Working in close cooperation with policy Directorates-General, the JRC addresses key societal challenges while stimulating innovation through developing new standards, methods and tools, and sharing and transferring its know-how to the Member States and international community. Key policy areas include: environment and climate change; energy and transport; agriculture and food security; health and consumer protection; information society and digital agenda; safety and security including nuclear; all supported through a cross-cutting and multi-disciplinary approach.
LB-N
A-2
5643-E
N-N