combining drug and gene similarity measures for drug … · combining drug and gene similarity...
TRANSCRIPT

Tel-Aviv University
The Raymond and Beverly Sackler Faculty of Exact Sciences
Blavatnik School of Computer Science
Combining drug and gene similarity
measures for drug-target elucidation
This thesis is submitted in partial fulfillment
of the requirements towards the M.Sc. degree
Tel-Aviv University
School of Computer Science
by
Liat Perlman
The research work in this thesis has been carried out
under the supervision of Prof. Roded Sharan
October, 2010

2
Acknowledgments
I would like to express my gratitude to my thesis supervisor, Prof. Roded Sharan, for the
helpful guidance throughout the course of this work and for his fruitful and creative ideas
which led to its establishment. I would also like to thank Assaf Gottlieb for
accompanying me in every step of this research, for the constant help and the
constructive advices. I am grateful to Nir Atias for the incorporation of the side effect
algorithm in our method, for the innovative ideas and for the assistance in the creation of
this work. Finally, I would like to thank my wonderful husband for his endless support
and his constant belief in me. He has been my source of strength in every step of the way.
This study was supported by a fellowship from the Edmond J. Safra Bioinformatics
Program at Tel Aviv University.

3
Abstract Understanding drugs and their modes of action is a fundamental challenge in systems
medicine. Key to addressing this challenge is the elucidation of drug targets, an important
step in the search for new drugs or novel targets for existing drugs. Incorporating
multiple biological information sources is of essence for improving the accuracy of drug
target prediction. In this thesis, we introduce a novel framework -- Similarity-based
Inference of drug-TARgets (SITAR) -- for incorporating multiple drug-drug and gene-
gene similarity measures for drug target prediction. The framework consists of a new
scoring scheme for drug-gene associations based on a given pair of drug-drug and gene-
gene similarity measures, combined with a logistic regression component that integrates
the scores of multiple measures to yield the final association score. We apply our
framework to predict targets for hundreds of drugs using commonly used and novel drug-
drug and gene-gene similarity measures and compare our results to existing state of the
art methods, markedly outperforming them. We then employ our framework to make
novel target predictions for hundreds of drugs; we validate these predictions via curated
databases that were not used in the learning stage. Our framework provides an extensible
platform for incorporating additional emerging similarity measures among drugs and
genes.
Part of the results in this thesis have been accepted for publication in the Journal of
Computational Biology [54].

4
Contents
1 Introduction ................................................................................................ 5
2 Background ................................................................................................ 8
2.1 Introduction to drugs and targets ............................................................................... 8
2.2 Motivation for prediction of drug target associations ............................................. 12
2.3 Drug related information sources ............................................................................ 12
2.3.1 Database of cellular response data .................................................................... 13
2.3.2 Databases of drugs and their targets ................................................................. 15
3 Previous work and Our approach .......................................................... 17
3.1 Previous Methods .................................................................................................... 17
3.1.1 Ligand-based similarity .................................................................................... 17
3.1.2 Side effect-based similarity .............................................................................. 19
3.1.3 Integrating chemical and sequence similarities for drug target inference ........ 22
3.2 Summary and Our approach .................................................................................... 27
4 SITAR: An algorithm for predicting drug targets ............................... 29
4.1 Similarity measure construction .............................................................................. 31
4.2 Combining measures ............................................................................................... 34
4.3 Measure construction considerations ...................................................................... 36
4.4 Prediction assessment and parameter optimization ................................................. 37
4.5 Computing novel predictions .................................................................................. 39
5 Experimental Results ............................................................................... 40
5.1 Feature selection and performance evaluation ........................................................ 40
5.2 Comparison to other drug-target prediction methods ............................................. 43
5.3 Novel predictions .................................................................................................... 44
6 Conclusions ............................................................................................... 50
5
Chapter 1
Introduction
Deciphering drug targets is a primary task in the development of new drugs, in finding
new ways to utilize existing drugs and in pinpointing their side effects. Experimental
identification of drug-target associations remains a laborious and costly task [26], calling
for faster computational prediction methods. Such methods can be used to augment the
limited available information on drug targets, which is in sharp contrast to the vast
number of compounds existing in chemical databases.
Early attempts in computational prediction included docking simulations [14] and
text mining [79]. The former, however, can be applied only to targets with known 3D
structure. The latter searches for co-occurrences of drugs and genes in texts and is limited
to current knowledge and prone to detection problems due to multiple gene and
compound names. Additional attempts were based on reverse engineering of gene
regulatory networks, inferring possible targets from cellular responses to administered
drugs [6, 23, 47]. These methods suffer from the complex and noisy nature of molecular
networks. Recently, several algorithms have been proposed to predict drug-target
associations by combining drug-drug and gene-gene similarity measures [39, 7, 76, 11].
The key assumption underlying these algorithms is that similar drugs tend to share
similar targets [50]. This has been observed with respect to chemical similarity [61, 48],
side effect similarity [11] and more.

6
Several authors had previously predicted drug-target interactions by combining
chemical drug-drug similarity and sequence-based gene-gene similarity [7, 76]. Keiser et
al. [39] compared the chemical structure of drugs to a compendium of ligands, known to
modulate the function of protein receptors, providing indirect connections between drugs
and targets via these ligands. Several approaches, concentrating mainly on indirect drug-
gene associations, employed additional similarity measures to gain insights on drugs.
Specifically, protein-protein interaction (PPI) network similarity was used in [28] to
predict drug-gene genetic interactions (termed Pharmacogenes), and gene expression data
was combined with drug-response data in [42] to infer co-modules of genes and drugs.
Last, a recent approach used information on compound-induced fitness defects of yeast
deletion strains to predict drug-targets in S. cerevisiae [29].
Different similarity measures utilize different attributes of drugs or genes, hence the
use of just one or few of them may miss information that is relevant to predicting new
associations. In particular, the 2D chemical space does not always comply with 3D
structural similarity [40]. Moreover, sequence similar targets tend to bind the same
ligands in the case of G-protein coupled receptor (GPCR) targets but less so for protein
kinases [40]. The use of pharmacological information is limited to marketed drugs whose
indication/side-effect information is available [11].
To overcome these limitations we have designed a new prediction scheme --
Similarity-based Inference of drug-TARgets (SITAR) -- that integrates multiple measures
to facilitate the prediction task. Our contribution is two-fold: (i) We introduce novel drug-
drug similarity measures and combine them into the prediction process; and (ii) we
propose a way of integrating the drug-drug and gene-gene similarities to create

7
classification features. The result is a new drug-target prediction algorithm, which
markedly outperforms previous methods and can cope with new drugs with no known
targets.
This thesis is organized as follows: Chapter 2 is divided into two parts: The first
part provides biological background on drugs, targets and their required interplay for the
establishment of drugs as therapeutic substances. We then highlight the pivotal role of
computational methods for drug-target prediction in facilitating the formidable procedure
of drug discovery. In the second part we describe several contemporary drug related
information sources.
In Chapter 3 we present the state of the art methods for drug-target prediction and
discuss their caveats. Then, we briefly review our framework and emphasize its novelty
compared to other methods.
In Chapter 4 we introduce our method in detail; starting from the construction of
both known and novel similarity measures, continuing to the scheme by which we
integrated all the similarity measures into a single association score and ending with a
short description of how we exploited our framework to predict novel associations
between drugs and targets.
In Chapter 5 we evaluate the performance of our method and compare it to the
performance of previous state of the art methods. Then, we discuss novel associations
predicted by our method and their validation.
Finally, in Chapter 6 we summarize this work and discuss future research.

8
Chapter 2
Background
In this chapter we review some of the basic concepts characterizing drugs and targets.
Then, we discuss the importance of computational schemes for drug-target prediction in
advancing drug discovery and development. Finally, we introduce several up to date drug
related information sources.
2.1 Introduction to drugs and targets
There is no dispute as to the pivotal role of drugs and their development in human
healthcare and medicine. The relation between drugs and diseases can be pictured as
follows: If we consider a disease state as a situation in which the biological system is
shifted from its equilibrium, namely its healthy state, the role of the drug is to ideally
restore the system to its equilibrium [34]. The effectiveness of a drug relies on a wide
spectrum of parameters, among which the type of the disease and its progression, the
general health of the patient, his past medical profile and more.
Formally, a drug is any substance that, when absorbed into the body of a living
organism, alters normal bodily function. An example of a well-known drug is penicillin
which was fortuitously discovered in 1929 by Alexander Fleming. Penicillin is a
metabolite produced from penicillium mold that can lyse staphylococci. Due to its

9
efficacy and lack of toxicity penicillin became one of the most influential antibiotics back
in the 19’th century [17].
A drug mostly confers its effect by binding to its target. A drug target is a biological
molecule or molecules that are inhibited, activated or modulated by a drug molecule.
They can be any form or combination of proteins, DNA or RNA. Generally, the linkage
of a drug to its target brings about a cascade of reactions that ultimately results in the
drug response.
The druggability of a given target is defined either by how well the drug or any other
therapeutic substance can access the target, or by the efficacy the drug can actually
achieve once it interacts with the target. It is influenced by many parameters such as the
cellular location of the target, its related side effects and toxicity [18]. Conceivably, the
majority of the target proteins of FDA approved drugs are localized in the membrane
[77], as illustrated in Figure 2.1. Membrane proteins are much easier to target since the
drug need not pass through the cellular membrane, which is a highly complex task, to
confer its effect.
Inspection of the functional distribution of target proteins indicates that there are
only a few prominent druggable protein families (see Figure 2.2): Enzymes that
Figure 2.1: Cellular localization of target proteins of FDA approved drugs. 62% of
the target proteins are localized in the membrane. Figure taken from [77].

10
constitute slightly under half of current targets, GPCR (G-protein coupled receptors), ion
channels and nuclear receptors. The rest of the target proteins belong to a variety of
protein families that altogether comprise a very small portion of current targets.
Recent publications conducted a large-scale assessment of the druggability of the
human genome; their estimate is that only 10% of the genes in the human genome are
druggable, and only 5% are both druggable and relevant to disease [14].
It is noteworthy that the distribution of the number of targets per drug is far from
uniform. The majority of the drugs target only a few proteins but some have many targets
as depicted in Figure 2.3. For example, the drugs propiomazine and promazine are
associated with the highest number of targets, having 14 targets each [77].
Historically, the preferable drug candidates were drugs that specifically bind very
few targets. Following the success of anticancer drugs and nonselective drugs for mood
disorders the pharmaceutical industry has shifted toward multi-target drug development,
or polypharmacology [77, 39, 17]. These drugs bind promiscuously to many targets, and
consequently have a more disperse impact than the one caused by a drug targeting a
Figure 2.2: Functional distribution of target proteins of marketed drugs. Figure taken from [30].

11
single target. Hence, polypharmacology has a huge potential in treating complex diseases,
having many casual genes.
Not all the effects of a drug are desirable. In practice, most approved drugs are
known to have a series of unwanted effects, termed the side effects of a drug. Side effects
are complex phenomenological observations that can be caused by several molecular
scenarios. The most common scenario is the binding of a drug with its direct targets or
additional targets named the drug’s off targets [11]. The drug binds its off targets with
some degree of affinity; however unlike its direct targets the drug was not originally
designated to interact with them. Additional side effect causing scenarios are downstream
pathway perturbations, kinetics and dosage effects, drug-drug interference, effects of
active metabolites, and aggregation or irreversible target binding of the drug [11]. Side
effects may vary for each individual depending on the person's disease state, age, weight,
gender, ethnicity and general health.
Figure 2.3: Distribution of FDA approved drugs with respect to the number of their
targets. Figure taken from [77].

12
2.2 Motivation for prediction of drug target associations
Drug discovery and development is a laborious multi-step process that requires enormous
money investment, great endeavors and extensive analysis of massive data.
A critical point in the development of a novel drug is the elucidation of its molecular
targets, as this is crucial for understanding the cellular processes taking place in the
response to the drug. Failure in correct identification of targets is a significant factor in
the low drug approval rate stemming from safety issues [45]. Specifically, the association
of a drug with additional targets, beyond its direct ones may give rise to hazardous side
effects, precluding further drug development and usage. Additionally, drug target
identification can broaden the therapeutic areas of extant drugs.
Since the experimental determination of drug-protein interactions remains a
formidable task [26] there is a strong incentive to develop computational high throughput
methods for drug-target prediction. These methods identify putative drug-target
associations by exploiting extant information related to drugs and targets. The large
potential of such methods lies in the disproportion between the sizes of the compound
space and target space and the number of presently known interactions between
compounds and target proteins. This observation suggests that there is a large array of
associations that are yet uncovered [76].
2.3 Drug related information sources
In recent years there has been a tremendous increase in our knowledge on drugs’
properties and mechanisms of action. It is attributed to the emergence of a plethora of

13
information sources, for example a compilation of high-throughput gene-expression
profiling of drug perturbation and comprehensive public resources that cover a
substantial portion of drugs’ properties. In the following we summarize several of these
information sources that are pertinent to this thesis.
2.3.1 Database of cellular response data
The connectivity map project [43] is an innovative framework that aims to relate drugs,
genes and diseases via comparison of their gene-expression profiles or signatures, to a
large database of signatures and using pattern-matching tools to reveal significant
similarities among these signatures. The signature database was produced from a series of
microarray experiments in which distinct cell-lines were treated with various drug
dosages across several time points. In each experiment the genes were ranked according
to their differential expression relative to a control cell line which was not treated with
the drug, giving rise to a ranked list of ~22,000 genes. Over 6000 such microarray
experiments were performed on 5 distinct cell lines treated with 1309 compounds.
In order to identify drugs with similar gene-expression profiles a nonparametric,
ranked-based approach termed GSEA (Gene Set Enrichment Analysis) was adopted. By
this approach, a query signature is compared against each ranked gene list in the
connectivity map data set to determine whether the query genes exhibit a similar or an
opposite trend to the assayed ranked list. Each comparison of the query signature to a
reference ranked gene list yields a connectivity score ranging from +1 to -1. Scores
approaching +1 reflect positive connectivity, meaning that the up-regulated genes of the
query tend to appear near the top of the ranked genes list and the down-regulated genes of

14
the query near the bottom. Scores approaching -1 express negative connectivity and
exhibit the opposite trend, i.e., the query signature genes are anti-correlated with the
ranked gene list. All instances in the database were then ordered according to their
connectivity scores, from the highest connectivity scores to the smallest ones. Figure 2.4
illustrates the above technique.
The authors showed that the proposed method can elucidate new therapeutic roles for
established drugs, generate hypotheses on the mechanism of action of novel drugs and
offer new therapeutic substances for treatment of complex diseases.
Figure 2.4: The Connectivity Map Concept. Gene-expression profiles
derived from treatment of cells with a large number of drugs constitute a
reference database. Gene-expression signatures represent any induced or
organic cell state of interest (left). Pattern-matching algorithms score each
reference profile for the direction and strength of enrichment with the query
signature (center). Drugs are ranked by their “connectivity score”; those at
the top ("positive") and bottom ("negative") are functionally connected with
the query state (right) through the common gene-expression changes.
Figure taken from [43].

15
2.3.2 Databases of drugs and their targets
As mentioned in previous sections, identification of drug target associations is paramount
for drug development. In order to promote the process, multiple drug-target databases
have evolved during recent years.
DrugBank [74, 73] is a comprehensive drug-centered resource that contains detailed
information on drugs and their action. Each drug entry is composed of over 100 data
fields with half of them devoted to drug/chemical data and the other half devoted to
pharmacological, pharmacogenomic and molecular biology data. In addition to the drug
related data, DrugBank maintains information on drug targets (i.e. sequence, structure,
and pathway) and their associations with drugs. DrugBank spans ~4900 drugs comprised
of ~1350 FDA-approved drugs, ~3100 experimental drugs, 188 illicit drugs and small
amounts of biotec, nutraceutical and withdrawn drugs. The database also retains ~3000
drug targets, more than half of them targeted by approved drugs.
KEGG DRUG [35, 37, 36] is an extensive drug information resource that contains
chemical structures and/or chemical components of all drugs in Japan, including crude
drugs and TCM (Traditional Chinese Medicine) formulas, and drugs in the USA and
Europe. It also maintains information on drug target interactions. It accommodates data
of about 9000 drugs (as of September 2009).
DCDB (Drug Combination database) [46] holds information on approved and
investigational drug combinations, also known as multicomponent drugs. The
combination of several drugs to produce an extra powerful and more effective therapeutic
substance has proven useful to treat complicated diseases, e.g., cancer [55] and AIDS
[27]. Apart from drug combinations data it also contains information on individual drugs

16
and their known molecular targets. The drug target information was drawn from the
literature and from several pertinent databases such as DrugBank [73], Uniprot [33],
PubChem [72] and Drugs.com. Overall it encompasses 499 drug combinations,
involving 485 individual drugs from more than 6000 references.
Table 2.1 summarizes the data content of the different databases.
DrugBank KEGG DRUG DCDB
# total drugs
4897 ~9000 485
# total targets
3037 ~2500 497
# drug target associations ~6000
2619 967
# data fields per drug
107 ~10 18
Contains target related
information*
+ - +
Main content Chemical,
pharmacological
and molecular
biology data
Chemical
structures and
chemical
components of
drugs
Drug combinations
*e.g. sequence, structure and GO annotation
Table 2.1: Comparison of the data content among the databases DrugBank, KEGG DRUG
and DCDB.

17
Chapter 3
Previous work and Our approach
In this chapter we review in detail the state of the art methods for drug-target prediction
and discuss their drawbacks. Eventually, we briefly present our approach to tackle the
task and highlight its contribution with respect to the other methods.
3.1 Previous Methods
As mentioned earlier, a large array of computational methods for drug target associations
prediction have evolved during the last decade. In the following we elaborate on four
notable ones: The ligand based similarity method of Keiser et al. [39], the side effect
based similarity method of Campillos et al. [11] and two methods that incorporate
chemical and sequence similarities [76, 7] for the prediction task.
3.1.1 Ligand-based similarity
The algorithm of [39] quantitatively associates drugs with known drug targets based on
the chemical 2D similarity of each drug to a compendium of ligands annotated into sets
for hundreds of drug targets. The motivating hypothesis of this approach is that two
structurally similar molecules are likely to bind the same targets [50]. Analogously, a
drug which is structurally similar to the binding molecules of a certain target, namely its
ligands, is likely to bind the target by itself.

18
Formally, for each drug target pair the 2D structural similarity of to 's
ligand set { } was quantified as an E-value using a statistics-based
chemoinformatics approach called SEA [38], which is described in the sequel. The E-
value serves as a reliability score to the association between ; the smaller the E-
value is the more likely the association takes place.
The structural similarity between a drug and 's ligand set { } is
computed as follows: Tanimoto score [70] is measured across all pairwise drug ligand
combinations . Define { } as a subset of indexes for
which ( ) . The Tanimoto score threshold
was set to 0.57 in this study. The similarity raw score of the pair is evaluated
by the formula:
∑
A statistical model for the random chemical similarity of the raw scores which
originated from BLAST paradigm was developed empirically (for further details on the
development of the model and the selection of the Tanimoto score threshold see the
Methods section of [38]). Z-score for the similarity raw score is computed based on
the model parameters. Finally, the probability to obtain the similarity raw score by
random chance alone, given the Z-score is transformed to an expectation value [38]. The
combination of the structural comparisons with the statistical model is referred to as SEA
(Similarity Ensemble Approach).
In [39] 3,665 drugs drawn from MDL Comprehensive Medicinal Chemistry database
(CMC) were compared against 65,241 ligands organized into 246 targets extracted from

19
MDL Drug Data Report (MDDR) [2] database. Each target was represented solely by its
set of known ligands. The molecules were represented by two topological descriptors:
2048-bit Daylight [3] and the 1024-bit folded ECFP_4 [1] fingerprints. SEA was applied
with each descriptor individually and drug target pairs having small E-values were
selected for further exploration.
The main drawback of this approach is that it is constrained to proteins whose related
ligands are both known and readily-available. Hence, it cannot provide any predictions
involving proteins with no a priori information regarding the ligands that modulate their
activities. Furthermore, this method does not take into account any sequence information,
and relies heavily on the ligands as the sole representatives of the targets. This may result
in an increased susceptibility of the method to noise in the ligand information.
3.1.2 Side effect-based similarity
Campillos et al. [11] used side effect similarity to relate drugs to novel targets. The
underlying assumption of this approach is that drugs having similar side effects tend to
share similar targets. This hypothesis was confirmed empirically by the authors,
demonstrating a remarkable correlation between side-effect similarity and the likelihood
that two drugs share a protein target. In general, the authors formulated a novel measure
for side effect similarity between each pair of drugs. This measure was then combined
with the widely-used Tanimoto 2D chemical similarity to form a statistical model that
estimates the probability of a pair of drugs to share a target. In the following we review
this scheme in detail.

20
Side effects were extracted from publicly available package inserts via a text-mining
procedure. The side effects were then classified according to the Unified Medical
Language System (UMLS) ontology for medical symptoms [8]. For the computation of
the side-effect similarity a weighing scheme which consists of two parts, a rareness
weight and a correlation weight, was defined. The rareness weight reflects the
relationship between the side effect frequency and the probability two drugs share a
target. Due to an inverse correlation between the two parameters, the rareness weight of a
side effect ri is defined as the negative logarithm of the side-effect frequency fi.
Some side-effects are correlated, for instance nausea and vomiting tend to commonly
co-occur. The correlation weight gi is defined to penalize for this redundancy, it does so
by down-weighing correlated side effects in a manner which resembles the down-
weighing of similar protein sequences within multiple alignments.
A raw score for the side-effect similarity between a drug pair (X,Y) was
calculated by summing the product of the weights across all their shared side effects:
∑
The raw scores were then converted to P-values by randomizing the side effects. These P
values represent the pairwise side-effect similarity between drugs.
The Chemical Development Kit tool [65] was utilized to calculate the Tanimoto 2D
chemical similarity between each pair of drugs on chemical hashed fingerprints of a 1024
bits length ,thus yielding the chemical similarity measure.
Given a pair of drugs we wish to evaluate their probability to share a target based on
a function of side effect similarity and chemical similarity. To this end, both similarity
21
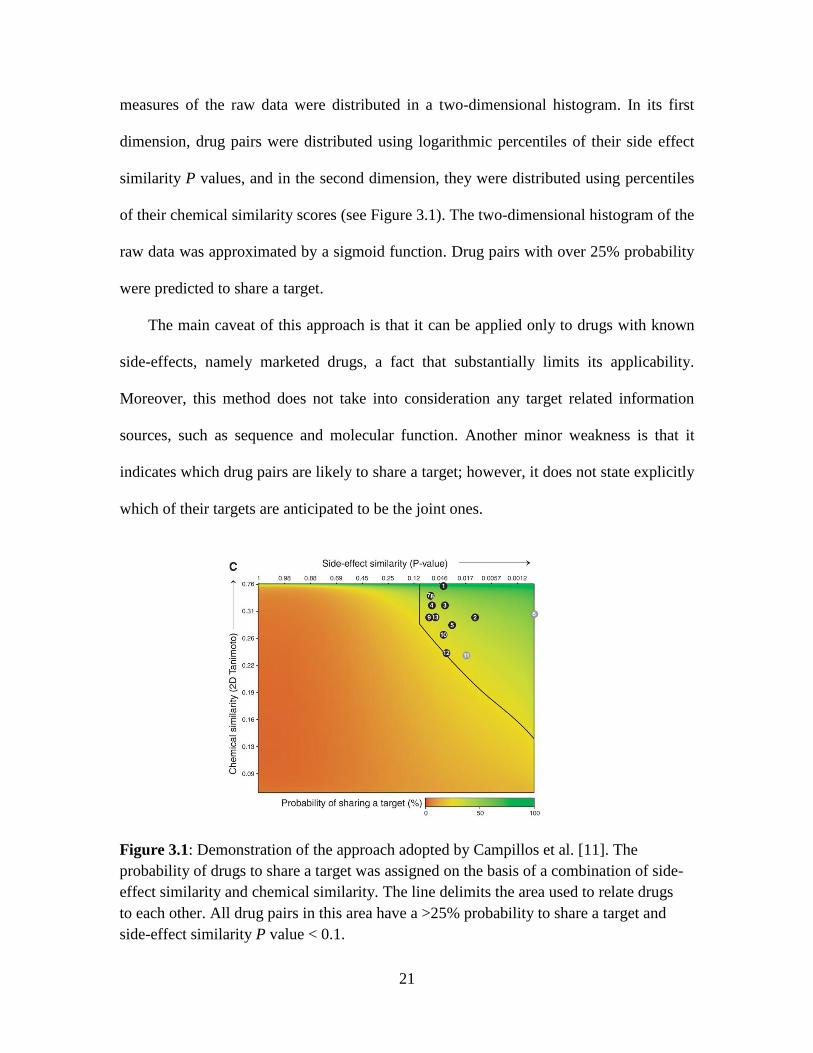
measures of the raw data were distributed in a two-dimensional histogram. In its first
dimension, drug pairs were distributed using logarithmic percentiles of their side effect
similarity P values, and in the second dimension, they were distributed using percentiles
of their chemical similarity scores (see Figure 3.1). The two-dimensional histogram of the
raw data was approximated by a sigmoid function. Drug pairs with over 25% probability
were predicted to share a target.
The main caveat of this approach is that it can be applied only to drugs with known
side-effects, namely marketed drugs, a fact that substantially limits its applicability.
Moreover, this method does not take into consideration any target related information
sources, such as sequence and molecular function. Another minor weakness is that it
indicates which drug pairs are likely to share a target; however, it does not state explicitly
which of their targets are anticipated to be the joint ones.
Figure 3.1: Demonstration of the approach adopted by Campillos et al. [11]. The
probability of drugs to share a target was assigned on the basis of a combination of side-
effect similarity and chemical similarity. The line delimits the area used to relate drugs
to each other. All drug pairs in this area have a >25% probability to share a target and
side-effect similarity P value < 0.1.

22
3.1.3 Integrating chemical and sequence similarities for drug
target inference
In [76] and [7] algorithms were developed that integrate two types of information –
chemical similarity between compounds and sequence similarity between proteins.
Yamanishi et al. [76] devised a kernel regression-based method (KRM) to infer
unknown drug-target interactions by integrating both of these similarities into a unified
Euclidean space termed the ‘pharmacological space’. The drug-target association
inference was conducted by a multi-step procedure as follows:
(i) Interacting compounds and proteins are embedded into a unified space called the
‘pharmacological space’.
(ii) A regression model is learned between the chemical/genomic space and the
unified space and any compounds/proteins are mapped to the unified space.
(iii) Compounds and proteins that are closer than a threshold in the unified space are
predicted to interact with each other.
Let { } be a set of known drugs and { }
a set of known target proteins,
respectively, where is the number of known drugs and the number of known
target proteins. Initially, a gold standard set of known drug-target interactions is
represented by a bipartite graph G(V1+V2, E), where V1 is the set of drugs, V2 is the
set of target proteins and E represents the interactions between them. The authors
proposed to transform the bipartite graph structure to an Euclidian space such that
both compounds and proteins are represented by sets of q-dimensional feature vectors
{ }
and {
}
, respectively. To this end, a graph-based similarity matrix

23
(
) is constructed, where the elements are computed by
employing Gaussian functions as follows:
for i,j = 1,…,nc
for i,j = 1,…,ng
for i = 1,…,nc, j = 1,…,ng
where is the shortest distance between the node pair (x,y) in the bipartite graph and h
is a width parameter, set to 2 in this study.
Subsequently, the matrix K is transformed into a positive definite matrix by
repeatedly adding a small multiple of the identity matrix to its diagonal until all its
eigenvalues become positive. Then, K is decomposed into eigenvalues as follows:
⁄
⁄
where the diagonal elements of the matrix are eigenvalues and the columns of the
matrix are eigenvectors and
⁄ . The row vectors of the matrix
(
)
are used to represent all drugs and target proteins. The
features ( )
and (
)
constitute the pharmacological
feature space, i.e., the unified space of compounds and proteins.
Let denote the matrix of chemical similarity between compounds and the
matrix of sequence similarity between proteins; these similarity matrices represent the
chemical and genomic space, respectively. The aim of the method is to construct
regression models that best describe the relationship between the chemical/genomic space

24
and the pharmacological feature space. To this end, a non-parametric technique known as
kernel regression was adopted. This technique learns a non-linear relation between the
chemical/genomic space and the pharmacological feature space such that the inferred
relation maximally fits the data. The kernel regression model for the problem at hand is
given by:
∑
where x is an element in a space X, is the feature vector of x in the pharmacological
space, n is the size of the space X, is a similarity function, is a weight vector and
is a noise vector. We wish to optimize the equation so that its right hand side would
match its left hand side as much as possible for all the elements in the space X. This is
achieved by finding a weight matrix that minimalizes the following
loss function:
‖ ‖
where S is an similarity matrix and ‖ ‖ is Frobenius norm. The above function can
be formulated in a trace form as:
{ }
From setting
, the solution is analytically obtained by:
Two regression models were generated by this scheme: One for the correlation
between the chemical space and the pharmacological feature space with the weight
matrix Wc = (
)
and the other for the correlation between the

25
genomic space and the pharmacological feature space with
(
)
, respectively. Formally, given a new compound it is mapped onto
the pharmacological feature space by the formula:
∑
where is a weight vector and is the chemical similarity score of a compound
pair. An analogous procedure is employed to map a new protein gnew onto the
pharmacological feature space:
∑
where is a weight vector and is the sequence similarity score between a protein
pair. Finally, a feature-based similarity score is computed for each compound-
protein pair by calculating the inner product of their features in the
pharmacological space:
( )
The feature-based similarity score serves as a measure of the closeness between
compounds and proteins in the pharmacological feature space. Compound-protein pairs
whose score exceeds a certain threshold are predicted to interact with each other.
The shortcoming of this method stems from the utility of only two types of similarity
measures – the chemical structure similarity and sequence similarity. The information
required for their construction is usually at hand, so its acquisition does not restrict the
method's applicability. Nonetheless, these similarity measures comprise a minor portion

26
in the huge space of drug and target properties, and therefore their usage might not
suffice to exhaust this space.
Bleakley et al. [7] proposed another integrative technique to cope with the task. The
authors use a scheme called bipartite local models (BLM) to assign an association score
to each drug-target pair, in a two-phase procedure. They defined the problem as follows:
Given a drug target pair (di,tj) we wish to predict whether the drug di interacts with the
target tj. Preliminarily, both the chemical similarity and sequence similarity were
transformed to positive semi-definite matrices; this permitted their utility as kernel
functions on which a support vector machine (SVM) model was applied throughout the
course of the algorithm.
In the first phase the target tj is discarded and two separate lists are assembled, one
containing all the other known targets of the drug di and another containing targets not
known to be bound by di. The targets in the first list are assigned a label +1 and the
targets in the other list are assigned a label of -1. Next, an SVM model is trained on the
sequence similarity among the concerned targets to discriminate between the two data
types. This model is then employed on the sequence similarity between the target tj to the
targets in the training set to predict the label of tj as a target or non-target of the drug di.
An analogous procedure is conducted on the drugs; namely, the target tj is fixed and
the drug di is discarded. Again, an SVM model is trained on the chemical similarity
among the relevant drugs to discriminate between drugs targeting tj from those not
targeting tj. Eventually, this classification rule is applied to the chemical similarity
between the drug di to the drugs in the training set, predicting whether di binds to tj or not.

27
The final stage of the algorithm is the integration of the two scores, the one assigned
to the target tj and the one assigned to the drug di into a unified association score. To this
end, the authors use a max function; therefore, the association score is simply the highest
score among the two.
The primary pitfall of this algorithm is that it cannot be employed on drug target
pairs (di,tj) having no prior information with regard to the targets of the drug di and the
drugs targeting the target tj. Hence, this method is not applicable in scenarios in which
the query association involves both a novel drug and a novel target. Furthermore, it
suffers from the same weakness of the previously mentioned method [76], as both
methods exploit the same similarity measures.
3.2 Summary and Our approach
Detection of associations between drugs and targets is a crucial task in genomic drug
discovery. Its great importance has led to the rapid development of a large array of
computational methods from various disciplines, each trying to address the problem from
a different perspective. In the previous sections we reviewed several existing methods for
this task and pointed out their drawbacks. A shared weakness of all these methods is that
they take advantage of only a thin slice in the huge amount of data attributed to drugs and
targets. As alluded in the introduction, the utilization of just one or a few similarity
measures may miss information that is valuable for uncovering novel drug-target
associations.
The next chapter will be dedicated to the description of our approach; here, we
provide an overview of the method and highlight its contribution compared to other state

28
of the art methods. Our method relies on the construction of various drug-drug and gene-
gene similarity measures derived from diverse readily available databases pertaining to
drugs and targets. Each pair of drug-drug and gene-gene similarity measures is combined
to form a single classification feature. Every feature is calculated by combining the drug-
drug similarities between a query drug and other drugs and the gene-gene similarities
between the query gene and other target genes across all true drug-target associations.
The features are automatically combined using a logistic regression classifier that is
coupled with a wrapper feature selection procedure and yield the final classification
scores.
The contribution of our method can be summarized as follows: (i) We introduce
novel drug-drug similarity measures and combine them into the prediction process. (ii)
We propose a way of integrating the drug-drug and gene-gene similarities to create
classification features. (iii) Our novel drug-target prediction algorithm markedly
outperforms previous methods. (iv) Finally, our method can be easily extended by newly
constructed similarity measures, and hence is scalable and remarkably adequate to current
times where new data sources are emerging in an exceedingly rapid manner.

29
Chapter 4
SITAR: An algorithm for predicting
drug targets
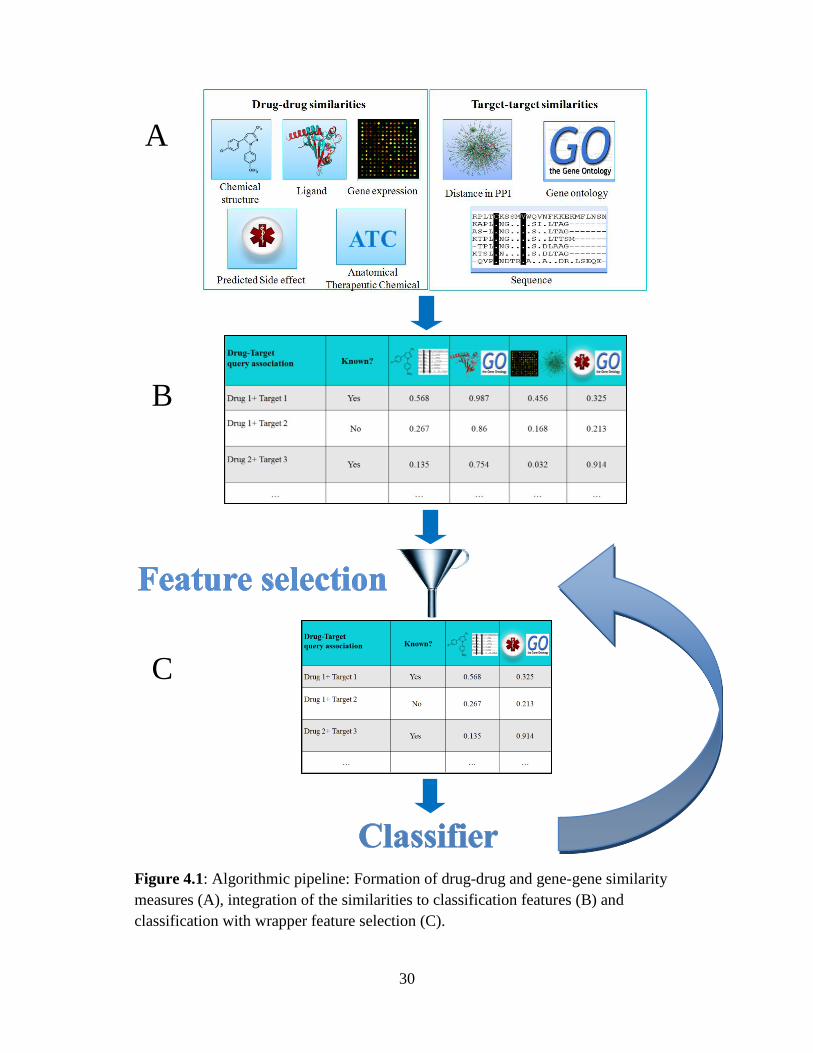
We designed a drug-target prediction algorithm with three main components (see Figure
4.1): (i) drug-drug and gene-gene similarity computations; (ii) combining the drug and
gene similarity measures into classification features; and (iii) feature selection and
prediction using logistic regression. In the following we describe these components in
detail.
Similarity measures
In order to overcome the limitations engulfed in using similarity measures of a single
type, we set out to incorporate a multitude of similarity measures, including both novel
and already published ones. Overall, we considered five drug-drug similarities and three
gene-gene similarities from different biological and chemical sources. The drug-drug
similarity measures were computed using chemical, registered and predicted side effects
[41] of the drug, drug response gene expression profiles and the Anatomical, Therapeutic
and chemical (ATC) classification system. The gene-gene similarity measures used are
based on sequence, closeness in a protein-protein interaction network and semantic GO
similarities. Overall, 315 drugs and 250 protein targets were represented in all measures,
spanning 782 known associations.
30
Figure 4.1: Algorithmic pipeline: Formation of drug-drug and gene-gene similarity
measures (A), integration of the similarities to classification features (B) and
classification with wrapper feature selection (C).
A
B
C

31
4.1 Similarity measure construction
We defined and computed five drug-drug similarity measures and three gene-gene
similarity measures. All similarity measures were normalized to be in the range [0,1].
We build the following drug-drug similarity measures:
1. Chemical-based: Canonical simplified molecular input line entry specification
(SMILES) of the drug molecules were downloaded from DrugBank [73]. Hashed
fingerprints were computed using the Chemical Development Kit (CDK) with default
parameters [66]. The similarity score between two drugs is computed on their
fingerprints according to the two-dimensional Tanimoto score [70], which is equivalent
to the Jaccard score [32] of their fingerprints, i.e., the size of the intersection over the
union when viewing each fingerprint as specifying a set of elements.
2. Ligand-based: The Similarity Ensemble Approach (SEA) [38] relates protein
receptors based on the chemical 2D similarity of the ligand-sets modulating their
function. Given a drug’s canonical SMILES, the SEA search tool compares it against a
compendium of ligand-sets and computes E-values for those ligand sets. To compute a
drug-drug similarity we queried drugs using their canonical SMILES on the SEA tool. To
obtain robust results, we queried the drug against the two ligand databases provided in
the tool (MDL Drug data report [2] and WOMBAT [52]) and used two different methods
to compute the drug fingerprint (Scitegic ECFP4 [1] and Daylight [3]), resulting in four
lists of similar ligand sets. We utilized both fingerprints since according to the SEA tool
Scitegic ECFP4 provides more precise results, while Daylight can find more novel
connections. Unifying the four lists and filtering drug-ligand set pairs with E-values>10-5
,
we obtained a list of relevant protein-receptor families for each drug. Finally, the

32
similarity between a pair of drugs was computed as the Jaccard score between the
corresponding sets of receptor families. We note that due to a partial mapping of the
receptor families to proteins, we could not use the drug-receptor associations directly as
classification features.
3. Expression-based: Gene expression responses to drugs were retrieved from the
Connectivity Map project [44]. We experimented with three different methods to
calculate drug similarity from Connectivity Map ranked gene expression profiles: (i)
Spearman rank correlation coefficient; (ii) calculating a Jaccard score between the 500
most differentially expressed genes (250 most up-regulated and 250 most down-regulated
genes); and (iii) using the method proposed by [31], employing Gene Set Enrichment
Analysis (GSEA) [69] as a similarity measure. We dealt with multiple experiments per
drug as follows: In the Spearman calculation, we averaged over the d1xd2 different
correlation coefficients obtained between the d1 experiments of one drug against the d2
repeated experiments of the second drug. In the Jaccard case, we used differentially
expressed genes that appeared in at least 50% of the gene expression responses to the
same drug. The method proposed by [31] handles repeated experiments of the same drug
through iterative merging.
4. Side-effect based: Drug side effects were obtained from SIDER [41], an online
database containing drug side effects associations extracted from package inserts using
text mining methods . Recently, we developed an algorithmic framework to predict side
effects for drugs by combining side effect information on known drugs with their
chemical properties [5]. Following this work, we defined the similarity between drugs
according to the Jaccard score between their top ten predicted side effects.

33
5. Annotation-based: We used the World Health Organization (WHO) Anatomical ,
Therapeutic and Chemical (ATC) classification system [63]. This hierarchical
classification system categorizes drugs at five different levels according to the organ or
system on which they act, their therapeutic and their chemical characteristics.
ATC codes were obtained from DrugBank. To define a similarity between ATC terms we
used the semantic similarity algorithm of [58]. This algorithm associates probabilities
p(x) with all the nodes (i.e., terms) x in the hierarchy and calculates the similarity of two
drugs as the maximum over all their common ancestors c of –log (p(c)).
The gene-gene similarity measures we used include:
1. Sequence similarity: based on a Smith-Waterman sequence alignment score [64].
Following the normalization suggested in [7], we divide the Smith-Waterman score
between two protein sequences by the geometric mean of the scores obtained from
aligning each sequence against itself.
2. Closeness in a protein-protein interaction (PPI) network: Human protein-protein
interactions were compiled from [9, 20, 60, 67, 75]. The distances between each pair of
genes were calculated based on their corresponding proteins using an all-pairs shortest
paths algorithm. Distances were transformed to similarity values using:
)',()',( ppbDAeppS (1)
where S(p,p’) is the computed similarity value between two proteins, D(p,p’) is the
shortest path between these proteins in the PPI network and A, b are free parameters (see
Measure construction considerations section for their optimization).
3. Gene Ontology (GO) semantic similarity: GO annotations [4] were downloaded
from UniProt [33]. The scores of the semantic similarity between the GO annotation

34
terms of the targets were calculated according to [58], using the csbl.go R package [53].
All three ontologies were used in the computation as similar drugs are expected to
interact with proteins that act in similar biological processes, or have similar molecular
functions or reside in similar compartments.
4.2 Combining measures
We view the drug target prediction problem as a classification problem, where the goal is
to learn a classifier that can distinguish true and false drug-target associations. True drug-
target interactions were retrieved from KEGG DRUG [36], DrugBank [73] and DCDB
[46]. An independent set of drug-target interactions was downloaded from Matador [24]
for validation purposes only. The classification features that we use are constructed from
scores calculated on pairs combined of one of M drug-drug measures (5 in our case) and
one of N gene-gene similarity measures (3 in our case), resulting in an MxN set of drug-
gene measure features for each drug-target association (15 in our case). For a given
measure pair (i.e., feature), the score of a given association (d,t) is calculated by
considering the similarity, according to the given measure pair, of all true drug-target
interactions to this association. The computation is done as follows: First, for each true
interaction (d’,t’) we compute the drug-drug similarity S(d,d’) and the target-target
similarity S(t,t’). Next, we combine the two similarities to a single score. Finally, we
integrate the scores of all true interactions to form the classification feature.
We experimented with several ways of combining the two similarities and
integrating the scores over the various true associations, aiming to compute a score that
would differ as much as possible between true and false drug-target interaction. This

35
difference was tested using the Wilcoxon rank sum test for equal medians. To combine a
drug-drug and a gene-gene similarity, we considered two types of averaging functions:
arithmetic mean and geometric mean. The two options scored similarly (p<1e-10
) with a
slight advantage to geometric mean (AUPR difference < 0.01), which we used in the
sequel. To integrate the scores of the known associations, we studied the effect of
averaging the top-k scores for various selections of k and discovered that taking only the
top scoring drug-target interaction yields the lowest p-value, as displayed in Figure 4.2.
This effect was observed also under the arithmetic mean score.
To conclude, we used the maximum value over the following weighted version of
geometric mean to score drug target associations:
1r0 ,)',()',(max),( )1(,'',
rr
tdtd ttSddStdScore (2)
The optimization of the scoring parameter r was done in a cross validation setting (see
the Prediction assessment and parameter optimization section for further details).
Figure 4.2: -log(p-value) of the Wilcoxon rank sum test for the distribution of scores of
true versus false drug-target associations. The score was computed by averaging the top k
scores, k ranging from 1 to 50.

36
4.3 Measure construction considerations
The transformation of a data source into a similarity measure can be done in various
ways. In order to choose a transformation that will perform well in drug target prediction,
we applied the Wilcoxon rank sum test to choose the transformation with greatest
separation power. Precisely, a suggested drug-drug similarity measure was combined
with all the gene-gene similarity measures to form classification features. A Wilcoxon
rank-sum test was then applied to each of these features to test whether the medians of
the distributions of feature values on true and false drug-targets interactions differ. The
logarithms of the resulting p-values were averaged to yield the separation score for that
suggested measure. An analogous procedure was applied to score gene-gene similarity
measures.
We used these separation scores to specify two measures: the co-expression based
drug similarity and the PPI-based gene similarity. For the co-expression based drug
similarity, Jaccard-based similarities scored better (average rank sum p< 7e-89
) than
GSEA-based similarities (average rank sum p< 2e-35
) and Spearman-based similarities
(p<3e-11
). The decreased performance of the Spearman-based similarity measure is
understandable in light of the fact that gene expression profiles tend to be informative
mainly with regard to the top (upregulated) and bottom (downregulated) genes. For the
PPI-based gene similarity, we used the separation score in order to choose the optimal
parameters A and b (equation 1). Hence, we picked b=1 and chose A such that direct
network neighbors would get a value close to 1 (A=0.9). However, the results were
robust over a wide range of parameters – similar AUPRs (AUPR difference<0.003) were
obtained with b ranging from 0.5 to 2 and A ranging from 0.5 to 1.

37
4.4 Prediction assessment and parameter optimization
We used a 10-fold cross validation scheme to evaluate the accuracy of our prediction
algorithm. The training set used for the cross validation included 782 true drug-target
interactions and a randomly generated set of drug-gene pairs (not part of the positive set),
twice larger than the positive set. We note that taking a negative set of equal size or three
times larger did not alter the results substantially (AUPR difference of 0.035 between a
negative set of equal size to a twice larger set and AUPR difference of 0.027 between a
negative set twice larger to a three times larger set).
In order to improve the classification accuracy, we optimized the weight factor r in
Equation 2 and performed feature selection on the 15 features associated with the various
measure pairs. Specifically, we trained a logistic regression classifier where the data was
divided into 10 parts and we iteratively selected eight parts to be the training set, a 9th
part was considered a test set on which we optimized the parameter r and the 10th part
was considered the validation set, on which the performance of the classification was
assessed. We found that the AUPR was robust to the selection of the weight r, with
slightly better classification performance using r=0.4 (AUPR difference<0.02).
To select features, we used a wrapper feature selection procedure, which is based on
a classification accuracy measure (see [25]). A common method to avoid exhaustively
searching for the optimal set of features in terms of classification accuracy is through an
iterative greedy algorithm. One variant, termed forward selection, starts with an empty
set and adds in each step the most contributing feature, while another, termed backward
elimination, starts with the full set and removes the least contributing feature in each step.

38
These two algorithms yield nested subsets of features from which a set attaining the
highest accuracy is finally chosen.
We considered two different scores as indicators for the classification accuracy – The
Area Under the Curve (AUC) of the Receiver Operating Characteristics (ROC) curve
[21] and the Area Under the Precision Recall (AUPR) curve [16]. Standard deviations for
both measures were assessed by using 100 random partitions of the training data into
cross validation sets. Importantly, when dealing with uneven number of true and false
examples, Precision-Recall (PR) curves give a more informative picture of an algorithm's
performance [16]. Furthermore, in [16] it is shown that a curve dominates in ROC space
if and only if it dominates in PR space. Hence we focus on the AUPR criterion as an
indication for classification performance. We evaluated the classification quality also in
regard to different target types, including Enzymes, G-protein coupled receptors
(GPCRs), ion-channels and nuclear receptors. The target type was inferred from
DrugBank [73] and Uniprot [33] annotations.
The classification was done using MATLAB implemented logistic regression.
Logistic regression is used for the prediction of the probability of an event by fitting the
data to a logistic curve. In our study, the logistic regression predicts the probability of an
association between a drug-gene pair to occur by concordant weighting of a list of
features score, estimated with respect to a query association. A cutoff was selected
according to the best F1-measure, defined as the harmonic mean between the precision
and recall. We also tested a Support Vector Machines (SVM) classifier with different
kinds of kernel functions (linear, polynomial, radial basis function and sigmoid) using the
LIBSVM package for MATLAB [12] with default parameters.

39
4.5 Computing novel predictions
To predict additional targets for drugs in our data set, we used a training set that included
all the true associations and a two-fold larger randomly generated set of drug-gene pairs
that are not known to interact. We applied the trained classifier to all remaining drug-
gene pairs to form our prediction set. To assign prediction scores also to the random
negative set that we used, we repeated the analysis with another randomly-picked
negative set, distinct from the first one. Overall, we obtained classification scores for all
77968 unknown drug-gene pairs. We used a classification threshold that yielded the best
F1-measure. Out of the resulting prediction set, we picked for each drug its maximal
scoring target as the most promising target. Overall, we could predict targets for 307
drugs.

40
Chapter 5
Experimental Results
In this chapter, we demonstrate the results of the feature selection procedure and inspect
the individual contribution of each feature to the predictive power of our method.
Subsequently, we compare our method to two extant approaches. We conclude the
chapter with a thorough verification of our novel predictions.
5.1 Feature selection and performance evaluation
We performed feature selection using both forward selection and backward elimination,
converging to a selected set of ten features, constructed from pairs of drug-drug and
gene-gene similarity measures. The area under the precision-recall curve (AUPR) scores
before and after the feature selection phase, as well as the AUPR achieved when using
the final ten selected features are listed in Table 5.1. Similar results were obtained when
using an SVM classifier as shown in Table 5.2. Examining the individual contribution of
each of the features, we find that best AUPR scores are achieved using the ligand-based
drug-drug similarity of [39] together with sequence similarity for genes (AUPR=0.85).
The least contributing combination is the drug co-expression together with PPI network
closeness (AUPR=0.54). Accordingly, we find that the best drug-drug similarity averaged
over all gene-gene similarities is the ligand similarity (AUPR=0.83±0.02) and the worst
is the co-expression similarity (AUPR=0.67±0.11). For genes, the best gene-gene

41
measure across all drug-drug similarities is the GO semantic similarity and the worst is
the PPI closeness measure. We note that the feature selection process did not affect the
results significantly, but we expect it to have more impact when additional similarity
measures are incorporated as features.
Drug similarity Gene similarity AUPR* AUC†
All features 0.905 0.935
Selected features 0.908 0.935
Ligand Sequence similarity 0.851 0.867
Ligand GO semantic
similarity
0.845 0.867
Predicted Side
Effect
GO semantic
similarity
0.832 0.863
ATC similarity GO semantic
similarity
0.81 0.858
Ligand PPI closeness 0.809 0.844
Chemical GO semantic
similarity
0.805 0.84
ATC similarity PPI closeness 0.762 0.809
Chemical Sequence similarity 0.749 0.763
Predicted Side
Effect
PPI closeness 0.729 0.759
Co-expression Sequence similarity 0.724 0.748
* All standard deviations are below AUPR of 0.01 † All standard deviations are below AUC of 0.005
Table 5.1: AUPR and AUC scores calculated using different features.

42
Kernel type AUPR AUC
Linear 0.902 0.928
Polynomial (gamma=0.1,
degree=3)
0.867 0.88
Radial basis function
(gamma=0.1)
0.903 0.931
Sigmoid (gamma=0.1) 0.879 0.903
Table 5.2: AUPR and AUC scores calculated using different SVM kernels on the
selected features of Table 5.1.
We further assessed the classification quality of different target types (GPCRs, ion
channels, enzymes and nuclear receptors), as in [7]. The results are listed in Table 5.3,
with GPCRs attaining the best scores.
Target type Number AUPR AUC
GPCR 49 0.939 0.946
Ion channels 37 0.889 0.927
Enzymes 94 0.877 0.922
Others 56 0.87 0.935
Nuclear receptors 14 0.851 0.863
Table 5.3: AUPR and AUC scores calculated for different target types.

43
5.2 Comparison to other drug-target prediction
methods
We compared our method to two state of the art methods: (i) The kernel regression-based
method (KRM) of [76]. This method embeds drugs and targets into a unified Euclidean
space termed the ‘pharmacological space’, using a regression model. Predicted
interacting drug-gene pairs are those which are closer to each other below a certain
threshold in the pharmacological space. (ii) The bipartite local models (BLM) method of
[7] constructs local models to learn drug-target associations based on additional targets of
the query drug and additional drugs targeting the query target . We note that we originally
aimed to compare our approach to the method proposed by [39], however since the SEA
tool of [38] provides receptors code names which cannot be mapped to our list of targets,
no direct comparison was feasible. Figure 5.1 displays the Precision-Recall curves of the
three methods and Table 5.4 summarizes the AUPR and AUC scores between the
different methods, overall demonstrating the marked improvement obtained by our new
method (AUPR of 0.908, exceeding the KRM and BLM methods by 0.07 and 0.15 AUPR
difference, respectively).
Figure 5.1: Precision-Recall curves of our logistic regression classifier (SITAR),
KRM and BLM methods.

44
Measure type AUPR AUC
SITAR 0.908 0.935
KRM [76] 0.838 0.884
BLM [7] 0.754 0.814
Table 5.4: Comparison of AUPR and AUC scores calculated using different methods.
5.3 Novel predictions
After demonstrating the utility of our method in predicting drug target associations, we
set out to predict novel targets for drugs in our data set (Section 4.5). We focused on the
best scoring gene for each drug, obtaining putative novel targets for 307 of the 315 drugs
used in this study. To validate these predictions we compared the predicted associations
to those reported in two other sources of drug-target interactions that were not used in the
learning process: The Therapeutic Target Database (TTD) [78] and the Matador database
[24]. TTD included only six interactions that were not part of our original data. Two of
them were predicted by us (p<2.4e-4
). Matador, on the other hand, reported 219 additional
interactions, out of which we predicted thirteen (p<8.4e-12
).
For an additional validation, we utilized information on drug-related pathways of
KEGG [36] and REACTOME [49] databases, as cataloged in the Comparative
Toxicogenomics Database (CTD) [15]. Out of the 315 drugs used in this study, 217 drugs
are associated with known pathways in CTD. For each drug, we constructed a merged list

45
of genes that appear in all the pathways associated with that drug. We then searched for
enrichment of the predicted targets of each drug in this merged list. We found 20 drugs
whose pathways are enriched for our predicted targets (at a false discovery rate (FDR) of
0.05). For comparison, we randomly permuted the association between drug target
predictions and drug pathways and recomputed the number of enriched drugs. Across 100
such permutation tests, 9.2±3.4 drugs were enriched on average, with all tests attaining
less than 20 enrichments (p<0.01).
The distribution of target types in our novel predictions is different from the general
distribution of known targets. Specifically, nuclear receptors and GPCRs are
overrepresented in our novel predictions relative to their general abundance in all the
targets as depicted in Figure 5.2 (relative abundance in novel predictions is 2.4 and 1.9
times the relative abundance in drug targets for nuclear receptors and GPCRs,
respectively). This overrepresentation is attributed to higher scores achieved by drugs
associated with nuclear receptors and GPCRs due to higher sequence similarity of nuclear
receptors and GPCRs relative to other targets (twice and 1.7 more similar than ion
channels, respectively). In addition, nuclear receptors are much closer to each other on
the protein-protein interaction (PPI) network (average PPI distance between nuclear
receptors is smaller by a factor of 0.6 from all other types). We note that dopamine
receptor D3 (DRD3), having only two known interactions in our data, had exceptionally
high occurrence in our novel prediction set (28 times). Dopamine receptor D3 is
primarily predicted to be targeted by drugs indicated for Parkinson’s disease and
Schizophrenia (eight out of nine existing in DrugBank). It is noteworthy that half of the
predicted drugs targeting DRD3 are also indicated for Parkinson’s disease or

46
Schizophrenia. These predictions make DRD3 a promising candidate for further
investigation.
Next, we applied our method to provide novel predictions for drugs that have no
known interacting targets in DrugBank. There are 20 such drugs that are included in all
our similarity measures. Applying a cross-validation scheme and choosing a
classification threshold maximizing the F1-measure, we could predict targets for 14
drugs. The top 5 scoring predictions are listed in Table 5.5. Evaluating our set of top
predictions for drugs with unknown targets, we find indirect evidence for the first four of
the top five associations. Specifically, Theobromine is predicted to target Adenosine A1
receptor (Adora1). Theobromine, derived from the cacao bean, belongs to the
methylxanthine class of chemical compounds. Other methylxanthine derivatives like
Caffeine and Theophylline are reported to target Adenosine A1 receptors [22]. Cefotetan
is predicted to target Paraoxonase 1 (PON1). Cefotetan belongs to the Cephamycin class
of antibiotics, which is often classified with second generation Cephalosporins, the latter
inhibits PON1 [62]. Rolitetracycline is predicted to target Cytochrome C (CYCS) and
Caspase 3 (Casp3) with equal score. Rolitetracycline is a member of the tetracycline
Figure 5.2: Relative abundance of (A) enzymes, (B) ion channels, (C) GPCRs, (D)
nuclear receptors and (E) others in the novel predicted set.

47
family of antibiotics. Other members from this family like Minocycline and Doxycycline
are reported to inhibit Cytochrome C (Minocycline [80]) and Caspase 3 (Minocycline and
Doxycycline [13, 51]). Last, Sulfamerazine is predicted to target Dihydrofolate reductase
(Dhfr). Sulfamerazine belongs to antibacterial sulfonamides whose inhibition of
Dihydrofolate reductase has been extensively studied [59].
Rank Drug name Target name
1 Theobromine Adenosine A1 receptor (Adora1)
2 Cefotetan Paraoxonase 1 (PON1)
3 Rolitetracycline Cytochrome C, somatic (CYCS)
3 Rolitetracycline Caspase 3, apoptosis-related cysteine peptidase
(Casp3)
4 Sulfamerazine Dihydrofolate reductase (Dhfr)
5 Guaifenesin Solute carrier family 6 (neurotransmitter
transporter, serotonin), member 4 (SLC6A4)
Last, we applied our method to detect genes that to date are not recognized as drug
targets. In order to reduce the amount of tested genes, we constructed a list of the most
promising targets in the following way: for each of the 250 known targets, we took the
most similar gene in at least one of the three used gene-gene similarity measures
(sequence similarity, closeness on the protein-protein interaction network and Gene
Ontology semantic similarity). We obtained 135 potential new targets on which we
applied a similar procedure as in the case of drugs with no known targets: we performed a
Table 5.5: Top 5 predicted drug-target associations for drugs with no known targets.
The two top predicted targets of Rolitetracycline achieved the same score.

48
10-fold cross validation to obtain a classification threshold that was used to classify the
135 potential targets. We then considered the top ranked predicted drug for each of the
135 potential targets. The top 5 drug predictions are listed in Table 5.6, all of which are
supported by current knowledge as discussed below. Specifically, Fluorometholone is
predicted to target calreticulin (CALR). Fluorometholone is a glucocorticoid, which is a
class of steroid hormones that binds to the glucocorticoid receptor (GR). Interestingly, it
has been shown that CALR binds to the GR, thus inhibiting the effect of glucocorticoids
[10]. Menadione (Vitamin K3) is predicted to target coagulation factor III (tissue factor,
F3). According to DrugBank, Menadione is involved as a cofactor of vitamin K-
dependent coagulation factors II, VII, IX and X, two of which are known to be part of the
tissue factor pathway [71]. In addition, tissue factor is known to be targeted by
Coagulation factor VIIa, which is itself a vitamin K-dependent glycoprotein. Methyldopa,
primarily used for hypertension is predicted to target nitric oxide synthase 1 (neuronal)
(NOS1). It has been shown that Methyldopa is associated with changes in nitric-oxide
synthesis [56]. Clofibrate is predicted to target apolipoprotein E (APOE). According to
DrugBank, Clofibrate inhibits the synthesis and increases the clearance of apolipoprotein
B, which is part of the low-density lipoproteins (LDL). APOE has a role in the
conversion of very low density lipoproteins to LDL [19]. Finally, Bacitracin, an
antibiotic, is predicted to target thrombospondin 1 (Thbs1/TSP1). While we could not
find a direct connection between the two, it is noteworthy that Bacitracin acts by
interfering with bacterial cell wall maintenance of Gram-positive organisms [68].
Interestingly, it has been shown that TSP1 promotes cellular adherence of Gram-positive

49
pathogens via the recognition of peptidoglycan, the main component of the cell wall [57].
Rank Drug name Target name
1 Fluorometholone Calreticulin (CALR)
2 Menadione Coagulation factor III
(thromboplastin, tissue
factor) (F3)
3 Methyldopa Nitric oxide synthase 1
(neuronal) (NOS1)
4 Clofibrate Hypothetical
LOC100129500;
apolipoprotein E (APOE)
5 Bacitracin Thrombospondin 1
(Thbs1/TSP1)
Table 5.6: Top 5 predicted drug-target associations for genes with no known drugs
targeting them.

50
Chapter 6
Conclusions
We introduced a novel method, SITAR, for predicting drug-target interactions. Our
method incorporates an extensive set of drug-drug and gene-gene similarity measures.
Newly incorporated drug-drug similarities are based on predicted side effects, gene
expression drug response profiles and the ATC classification system. The classification
features are constructed based on a new score integrating the drug-drug and gene-gene
similarity spaces. These features are integrated via a logistic regression classifier,
combined with a feature selection process. Our method is flexible and allows the
incorporation of new emerging measures without altering already computed scores on
other measures. Using our method, we show marked improvement of classification
performance over previous drug-target prediction approaches. We provide novel
predictions of drug-target interactions and validate them against public databases. Last,
we predict targets for drugs which to-date have no known targets.
Having shown that our method is robust with respect to different score choices,
selected features and different classification methods, it seems that the primary reason for
the increased performance compared to previous methods stems from the use of multiple
similarity measures. Each of the resulting features alone does not have enough predictive
power, but the combination of multiple features allows the classification procedure to
perform well. Accordingly, we noticed that using a low number of features (less than 5)
deteriorates the results. Nevertheless, our method can be enhanced in several ways. First,

51
one could improve and expand the measures used. Of special interest is improving the
gene co-expression similarity based on the Connectivity Map data, which currently
exhibits the worst performance. Another extension would be to increase the number of
represented drugs and genes shared between the different measures. This could be
achieved either by predicting missing similarities from existing ones (as in [5]) or by
incorporating imputation methods to overcome missing information in some of the
measures.

52
Bibliography
[1] Accelrys, Inc. http://accelrys.com/products/scitegic/. 2009.
[2] MDL Drug Data Report 2006.1 (MDL Information Systems Inc., San Leandro, CA,
2006).
[3] Thor and Merlin; Version 4.62; Daylight Chemical Information Systems Inc.:
Irvine, CA. Theory at www.daylight.com.
[4] M. Ashburner, C. A. Ball, J. A. Blake, D. Botstein, H. Butler, J. M. Cherry, A. P.
Davis, K. Dolinski, S. S. Dwight, J. T. Eppig, M. A. Harris, D. P. Hill, L. Issel-
Tarver, A. Kasarskis, S. Lewis, J. C. Matese, J. E. Richardson, M. Ringwald, G. M.
Rubin and G. Sherlock, Gene ontology: tool for the unification of biology. The
Gene Ontology Consortium, Nat Genet, 25 (2000), pp. 25-9.
[5] N. Atias and R. Sharan, An Algorithmic Framework for Predicting Side-Effects of
Drugs, RECOMB 2010, to appear. (2010).
[6] D. d. Bernardo, M. J. Thompson, T. S. Gardner, S. E. Chobot, E. L. Eastwood, A.
P. Wojtovich, S. J. Elliott, S. E. Schaus and J. J. Collins, Chemogenomic profiling
on a genome-wide scale using reverse-engineered gene networks, Nature
Biotechnology, 23 (2005), pp. 377 - 383.
[7] K. Bleakley and Y. Yamanishi, Supervised prediction of drug-target interactions
using bipartite local models, Bioinformatics, 25 (2009), pp. 2397-403.
[8] O. Bodenreider, The Unified Medical Language System (UMLS): integrating
biomedical terminology, Nucleic Acids Research, 32 (2004), pp. D267-D270.
[9] B. J. Breitkreutz, C. Stark, T. Reguly, L. Boucher, A. Breitkreutz, M. Livstone, R.
Oughtred, D. H. Lackner, J. Bahler, V. Wood, K. Dolinski and M. Tyers, The
BioGRID Interaction Database: 2008 update, Nucleic Acids Res, 36 (2008), pp.
D637-40.
[10] K. Burns, M. Opas and M. Michalak, Calreticulin inhibits glucocorticoid- but not
cAMP-sensitive expression of tyrosine aminotransferase gene in cultured McA-
RH7777 hepatocytes, Mol Cell Biochem, 171 (1997), pp. 37-43.
[11] M. Campillos, M. Kuhn, A. C. Gavin, L. J. Jensen and P. Bork, Drug target
identification using side-effect similarity, Science, 321 (2008), pp. 263-6.
[12] C.-C. Chang and C.-J. Lin, LIBSVM : a library for support vector machines,
Software available at http://www.csie.ntu.edu.tw/~cjlin/libsvm (2001).

53
[13] M. Chen, V. O. Ona, M. Li, R. J. Ferrante, K. B. Fink, S. Zhu, J. Bian, L. Guo, L.
A. Farrell, S. M. Hersch, W. Hobbs, J. P. Vonsattel, J. H. Cha and R. M.
Friedlander, Minocycline inhibits caspase-1 and caspase-3 expression and delays
mortality in a transgenic mouse model of Huntington disease, Nat Med, 6 (2000),
pp. 797-801.
[14] A. C. Cheng, R. G. Coleman, K. T. Smyth, Q. Cao, P. Soulard, D. R. Caffrey, A. C.
Salzberg and E. S. Huang, Structure-based maximal affinity model predicts small-
molecule druggability, Nat Biotechnol, 25 (2007), pp. 71-5.
[15] A. P. Davis, C. G. Murphy, C. A. Saraceni-Richards, M. C. Rosenstein, T. C.
Wiegers and C. J. Mattingly, Comparative Toxicogenomics Database: a
knowledgebase and discovery tool for chemical-gene-disease networks, Nucleic
Acids Res, 37 (2009), pp. D786-92.
[16] J. Davis and M. Goadrich, The relationship between Precision-Recall and ROC
curves, ICML '06: Proceedings of the 23rd international conference on Machine
learning (2006), pp. 233-240.
[17] J. Drews, Drug discovery: a historical perspectiv, Science, 287 (2000), pp. 1960-
1964.
[18] J. Eckstein, Drug disovery tutorial.
[19] C. Ehnholm, R. W. Mahley, D. A. Chappell, K. H. Weisgraber, E. Ludwig and J. L.
Witztum, Role of apolipoprotein E in the lipolytic conversion of beta-very low
density lipoproteins to low density lipoproteins in type III hyperlipoproteinemia,
Proc Natl Acad Sci U S A, 81 (1984), pp. 5566-70.
[20] R. M. Ewing, P. Chu, F. Elisma, H. Li, P. Taylor, S. Climie, L. McBroom-
Cerajewski, M. D. Robinson, L. O'Connor, M. Li, R. Taylor, M. Dharsee, Y. Ho, A.
Heilbut, L. Moore, S. Zhang, O. Ornatsky, Y. V. Bukhman, M. Ethier, Y. Sheng, J.
Vasilescu, M. Abu-Farha, J. P. Lambert, H. S. Duewel, Stewart, II, B. Kuehl, K.
Hogue, K. Colwill, K. Gladwish, B. Muskat, R. Kinach, S. L. Adams, M. F. Moran,
G. B. Morin, T. Topaloglou and D. Figeys, Large-scale mapping of human protein-
protein interactions by mass spectrometry, Mol Syst Biol, 3 (2007), pp. 89.
[21] T. Fawcett, An introduction to ROC analysis, Pattern Recognition Letters, 27
(2005), pp. 861-874.
[22] B. B. Fredholm and C. G. Persson, Xanthine derivatives as adenosine receptor
antagonists, Eur J Pharmacol, 81 (1982), pp. 673-6.
[23] T. S. Gardner, D. d. Bernardo, D. Lorenz and J. J. Collins, Inferring Genetic
Networks and Identifying Compound Mode of Action via Expression Profiling,
Science, 301 (2003), pp. 102 - 105.

54
[24] S. Gunther, M. Kuhn, M. Dunkel, M. Campillos, C. Senger, E. Petsalaki, J. Ahmed,
E. G. Urdiales, A. Gewiess, L. J. Jensen, R. Schneider, R. Skoblo, R. B. Russell, P.
E. Bourne, P. Bork and R. Preissner, SuperTarget and Matador: resources for
exploring drug-target relationships, Nucleic Acids Res, 36 (2008), pp. D919-22.
[25] I. Guyon and A. Elisseeff, An Introduction to Variable and Feature Selection,
Journal of Machine Learning Research, 3 (2003), pp. 1157-1182.
[26] S. J. Haggarty, K. M. Koeller, J. C. Wong, R. A. Butcher and S. L. Schreiber,
Multidimensional chemical genetic analysis of diversity-oriented synthesis-derived
deacetylase inhibitors using cell-based assays, Chem Biol, 10 (2003), pp. 383-96.
[27] S. M. Hammer, D. A. Katzenstein, M. D. Hughes, H. Gundacker, R. T. Schooley,
R. H. Haubrich, W. K. Henry, M. M. Lederman, J. P. Phair, M. Niu, M. S. Hirsch
and T. C. Merigan, A Trial Comparing Nucleoside Monotherapy with Combination
Therapy in HIV-Infected Adults with CD4 Cell Counts from 200 to 500 per Cubic
Millimeter, N Engl J Med, 335 (1996), pp. 1081-1090.
[28] N. T. Hansen, S. Brunak and R. B. Altman, Generating genome-scale candidate
gene lists for pharmacogenomics, Clin Pharmacol Ther, 86 (2009), pp. 183-9.
[29] M. E. Hillenmeyer, E. Ericson, R. W. Davis, C. Nislow, D. Koller and G. Giaever,
Systematic analysis of genome-wide fitness data in yeast reveals novel gene
function and drug action, Genome Biol, 11 (2010), pp. R30.
[30] A. L. Hopkins and C. R. Groom, The druggable genome, Nature Reviews Drug
Discovery, 1 (2002), pp. 727-730.
[31] F. Iorio, R. Tagliaferri and D. d. Bernardo, Identifying network of drug mode of
action by gene expression profiling, J Comput Biol 16 (2009), pp. 241-251.
[32] P. Jaccard, Nouvelles recherches sur la distribution florale., Bul. Soc. Vaudoise
Sci. Nat., 44 (1908), pp. 223–270.
[33] E. Jain, A. Bairoch, S. Duvaud, I. Phan, N. Redaschi, B. E. Suzek, M. J. Martin, P.
McGarvey and E. Gasteiger, Infrastructure for the life sciences: design and
implementation of the UniProt website, BMC Bioinformatics, 10 (2009), pp. 136.
[34] C. S. Janga and A. Tzakos, Structure and organiztion of drug-target networks:
insights from genomic approaches for drug discovery Molecular BioSystems, 5
(2009), pp. 1536-1548.
[35] M. Kanehisa and S. Goto, KEGG: kyoto encyclopedia of genes and genomes,
Nucleic Acids Res, 28 (2000), pp. 27-30.
[36] M. Kanehisa, S. Goto, M. Furumichi, M. Tanabe and M. Hirakawa, KEGG for
representation and analysis of molecular networks involving diseases and drugs,
Nucleic Acids Res, 38 (2010), pp. D355-60.

55
[37] M. Kanehisa, S. Goto, M. Hattori, K. F. Aoki-Kinoshita, M. Itoh, S. Kawashima, T.
Katayama, M. Araki and M. Hirakawa, From genomics to chemical genomics: new
developments in KEGG, Nucleic Acids Res, 34 (2006), pp. D354-7.
[38] M. J. Keiser, B. L. Roth, B. N. Armbruster, P. Ernsberger, J. J. Irwin and B. K.
Shoichet, Relating protein pharmacology by ligand chemistry, Nat Biotechnol, 25
(2007), pp. 197-206.
[39] M. J. Keiser, V. Setola, J. J. Irwin, C. Laggner, A. I. Abbas, S. J. Hufeisen, N. H.
Jensen, M. B. Kuijer, R. C. Matos, T. B. Tran, R. Whaley, R. A. Glennon, J. Hert,
K. L. Thomas, D. D. Edwards, B. K. Shoichet and B. L. Roth, Predicting new
molecular targets for known drugs, Nature, 462 (2009), pp. 175-81.
[40] M. Kuhn, M. Campillos, P. Gonzalez, L. J. Jensen and P. Bork, Large-scale
prediction of drug-target relationships, FEBS Lett, 582 (2008), pp. 1283-90.
[41] M. Kuhn, M. Campillos, I. Letunic, L. J. Jensen and P. Bork, A side effect resource
to capture phenotypic effects of drugs, Mol Syst Biol, 6 (2010), pp. 343.
[42] Z. Kutalik, J. S. Beckmann and S. Bergmann, A modular approach for integrative
analysis of large-scale gene-expression and drug-response data, Nat Biotechnol,
26 (2008), pp. 531-9.
[43] J. Lamb, The Connectivity Map: a new tool for biomedical research, Nat Rev
Cancer, 7 (2007), pp. 54-60.
[44] J. Lamb, E. D. Crawford, D. Peck, J. W. Modell, I. C. Blat, M. J. Wrobel, J. Lerner,
J. P. Brunet, A. Subramanian, K. N. Ross, M. Reich, H. Hieronymus, G. Wei, S. A.
Armstrong, S. J. Haggarty, P. A. Clemons, R. Wei, S. A. Carr, E. S. Lander and T.
R. Golub, The Connectivity Map: using gene-expression signatures to connect
small molecules, genes, and disease, Science, 313 (2006), pp. 1929-35.
[45] M. A. Lindsay, Target discovery, Nature Reviews Drug Discovery, 2 (2003), pp.
831-838.
[46] Y. Liu, B. Hu, C. Fu and X. Chen, DCDB: drug combination database,
Bioinformatics, 26 (2010), pp. 587-8.
[47] K. M. Mani, C. Lefebvre, K. Wang, W. K. Lim, K. Basso, R. Dalla-Favera and A.
Califano, A systems biology approach to prediction of oncogenes and molecular
perturbation targets in B-cell lymphomas, Mol Syst Biol, 4 (2008), pp. 169.
[48] Y. C. Martin, J. L. Kofron and L. M. Traphagen, Do structurally similar molecules
have similar biological activity?, J Med Chem, 45 (2002), pp. 4350-8.
[49] L. Matthews, G. Gopinath, M. Gillespie, M. Caudy, D. Croft, B. de Bono, P.
Garapati, J. Hemish, H. Hermjakob, B. Jassal, A. Kanapin, S. Lewis, S. Mahajan,
B. May, E. Schmidt, I. Vastrik, G. Wu, E. Birney, L. Stein and P. D'Eustachio,

56
Reactome knowledgebase of human biological pathways and processes, Nucleic
Acids Res, 37 (2009), pp. D619-22.
[50] J. B. Mitchell, The relationship between the sequence identities of alpha helical
proteins in the PDB and the molecular similarities of their ligands, J Chem Inf
Comput Sci, 41 (2001), pp. 1617-22.
[51] P. X. Mouratidis, K. W. Colston and A. G. Dalgleish, Doxycycline induces caspase-
dependent apoptosis in human pancreatic cancer cells, Int J Cancer, 120 (2007),
pp. 743-52.
[52] M. Olah, M. Mracec, L. Ostopovici, R. Rad, A. Bora, N. Hadaruga, I. Olah, M.
Banda, Z. Simon, M. Mracec and T. I. Oprea, WOMBAT: World of Molecular
Bioactivity, in I. O. Prof. Dr. Tudor, ed., Chemoinformatics in Drug Discovery,
2005, pp. 221-239.
[53] K. Ovaska, M. Laakso and S. Hautaniemi, Fast Gene Ontology based clustering for
microarray experiments, BioData Min, 1 (2008), pp. 11.
[54] L. Perlman, A. Gottlieb, N. Atias, E. Ruppin and R. Sharan, Combining drug and
gene similarity measures for drug-target elucidation, Journal of Computational
Biology, Special issue of RECOMB Systems Biology 2010, in press.
[55] G. J. Peters, C. L. van der Wilt, C. J. A. van Moorsel, J. R. Kroep, A. M. Bergmann
and S. P. Ackland, Basis for effective combination cancer chemotherapy with
antimetabolites, Pharmacology & Therapeutics, 87 (2000), pp. 227–253.
[56] E. Podjarny, S. Benchetrit, B. Katz, J. Green and J. Bernheim, Effect of methyldopa
on renal function in rats with L-NAME-induced hypertension in pregnancy,
Nephron, 88 (2001), pp. 354-9.
[57] C. Rennemeier, S. Hammerschmidt, S. Niemann, S. Inamura, U. Zahringer and B.
E. Kehrel, Thrombospondin-1 promotes cellular adherence of gram-positive
pathogens via recognition of peptidoglycan, FASEB J, 21 (2007), pp. 3118-32.
[58] P. Resnik, Semantic Similarity in a Taxonomy: An Information-Based Measure and
its Application to Problems of Ambiguity in Natural Language, J of Artificial
Intelligence Research, 11 (1999), pp. 95-130.
[59] I. M. Rollo, Dihydrofolate reductase inhibitors as antimicrobial agents and their
potentiation by sulfonamides, CRC Crit Rev Clin Lab Sci, 1 (1970), pp. 565-83.
[60] J. F. Rual, K. Venkatesan, T. Hao, T. Hirozane-Kishikawa, A. Dricot, N. Li, G. F.
Berriz, F. D. Gibbons, M. Dreze, N. Ayivi-Guedehoussou, N. Klitgord, C. Simon,
M. Boxem, S. Milstein, J. Rosenberg, D. S. Goldberg, L. V. Zhang, S. L. Wong, G.
Franklin, S. Li, J. S. Albala, J. Lim, C. Fraughton, E. Llamosas, S. Cevik, C. Bex,
P. Lamesch, R. S. Sikorski, J. Vandenhaute, H. Y. Zoghbi, A. Smolyar, S. Bosak,
R. Sequerra, L. Doucette-Stamm, M. E. Cusick, D. E. Hill, F. P. Roth and M. Vidal,

57
Towards a proteome-scale map of the human protein-protein interaction network,
Nature, 437 (2005), pp. 1173-8.
[61] A. Schuffenhauer, P. Floersheim, P. Acklin and E. Jacoby, Similarity metrics for
ligands reflecting the similarity of the target proteins, J Chem Inf Comput Sci, 43
(2003), pp. 391-405.
[62] S. Sinan, F. Kockar and O. Arslan, Novel purification strategy for human PON1
and inhibition of the activity by cephalosporin and aminoglikozide derived
antibiotics, Biochimie, 88 (2006), pp. 565-74.
[63] A. Skrbo, B. Begovic and S. Skrbo, [Classification of drugs using the ATC system
(Anatomic, Therapeutic, Chemical Classification) and the latest changes], Med
Arh, 58 (2004), pp. 138-41.
[64] T. F. Smith, M. S. Waterman and C. Burks, The statistical distribution of nucleic
acid similarities, Nucleic Acids Res, 13 (1985), pp. 645-56.
[65] C. Steinbeck, Y. Han, S. Kuhn, O. Horlacher, E. Luttmann and E. Willighagen, The
Chemistry Development Kit (CDK): an open-source Java library for Chemo- and
Bioinformatics, J Chem Inf Comput Sci, 43 (2003), pp. 493-500.
[66] C. Steinbeck, C. Hoppe, S. Kuhn, M. Floris, R. Guha and E. L. Willighagen, Recent
developments of the chemistry development kit (CDK) - an open-source java library
for chemo- and bioinformatics, Curr Pharm Des, 12 (2006), pp. 2111-20.
[67] U. Stelzl, U. Worm, M. Lalowski, C. Haenig, F. H. Brembeck, H. Goehler, M.
Stroedicke, M. Zenkner, A. Schoenherr, S. Koeppen, J. Timm, S. Mintzlaff, C.
Abraham, N. Bock, S. Kietzmann, A. Goedde, E. Toksoz, A. Droege, S. Krobitsch,
B. Korn, W. Birchmeier, H. Lehrach and E. E. Wanker, A human protein-protein
interaction network: a resource for annotating the proteome, Cell, 122 (2005), pp.
957-68.
[68] K. J. Stone and J. L. Strominger, Mechanism of action of bacitracin: complexation
with metal ion and C 55 -isoprenyl pyrophosphate, Proc Natl Acad Sci U S A, 68
(1971), pp. 3223-7.
[69] A. Subramanian, P. Tamayo, V. K. Mootha, S. Mukherjee, B. L. Ebert, M. A.
Gillette, A. Paulovich, S. L. Pomeroy, T. R. Golub, E. S. Lander and J. P. Mesirov,
Gene set enrichment analysis: a knowledge-based approach for interpreting
genome-wide expression profiles, Proc Natl Acad Sci U S A, 102 (2005), pp.
15545-50.
[70] T. T. Tanimoto, IBM Internal Report 17th Nov 1957.
[71] A. E. Thomson, E. J. Squires and P. A. Gentry, Assessment of factor V, VII and X
activities, the key coagulant proteins of the tissue factor pathway in poultry plasma,
Br Poult Sci, 43 (2002), pp. 313-21.

58
[72] Y. Wang, J. Xiao, T. O. Suzek, J. Zhang, J. Wang and S. H. Bryant, PubChem: a
public information system for analyzing bioactivities of small molecules, Nucleic
Acids Research, 37 (2009), pp. W623–W633.
[73] D. S. Wishart, C. Knox, A. C. Guo, D. Cheng, S. Shrivastava, D. Tzur, B. Gautam
and M. Hassanali, DrugBank: a knowledgebase for drugs, drug actions and drug
targets, Nucleic Acids Res, 36 (2008), pp. D901-6.
[74] D. S. Wishart, C. Knox, A. C. Guo, S. Shrivastava, M. Hassanali, P. Stothard, Z.
Chang and J. Woolsey, DrugBank: a comprehensive resource for in silico drug
discovery and exploration, Nucleic Acids Res, 34 (2006), pp. D668-72.
[75] I. Xenarios, L. Salwinski, X. J. Duan, P. Higney, S. M. Kim and D. Eisenberg, DIP,
the Database of Interacting Proteins: a research tool for studying cellular networks
of protein interactions, Nucleic Acids Res, 30 (2002), pp. 303-5.
[76] Y. Yamanishi, M. Araki, A. Gutteridge, W. Honda and M. Kanehisa, Prediction of
drug-target interaction networks from the integration of chemical and genomic
spaces, Bioinformatics, 24 (2008), pp. i232-40.
[77] M. Yildrim, K. Goh, M. Cusick, A. Barabasi and M. Vidal, Drug-target network,
Nature Biotechnology, 25 (2007), pp. 1119-1126.
[78] F. Zhu, B. Han, P. Kumar, X. Liu, X. Ma, X. Wei, L. Huang, Y. Guo, L. Han, C.
Zheng and Y. Chen, Update of TTD: Therapeutic Target Database, Nucleic Acids
Res, 38 (2010), pp. D787-91.
[79] S. Zhu, Y. Okuno, G. Tsujimoto and H. Mamitsuka, A probabilistic model for
mining implicit 'chemical compound-gene' relations from literature,
Bioinformatics, 21 Suppl 2 (2005), pp. ii245-51.
[80] S. Zhu, I. G. Stavrovskaya, M. Drozda, B. Y. Kim, V. Ona, M. Li, S. Sarang, A. S.
Liu, D. M. Hartley, D. C. Wu, S. Gullans, R. J. Ferrante, S. Przedborski, B. S.
Kristal and R. M. Friedlander, Minocycline inhibits cytochrome c release and
delays progression of amyotrophic lateral sclerosis in mice, Nature, 417 (2002), pp.
74-8.

ירתקצ
דרך יעילה . הרפואי פיתוחקידום הב משמעותי אתגר מהווה פעולתן ואופן תרופות של הבנה
מרכזי צעד הינו . גילוי המטרותתרופותלהתמודד עם אתגר זה היא זיהוי חלבוני המטרה של
על מנת לשפר את הדיוק תרופות קיימות.ל מטרות חדשותקישור בפיתוח תרופות חדשות וב
, זו בעבודה מגוון רחב ככל האפשר של מקורות מידע ביולוגים. אגדבחיזוי המטרות יש צורך ל
תרופה-תרופה של מדדי דמיוןמגוון המשלבת SITAR חדשנית הנקראת מציגים שיטה אנו
חדשה ציון הערכת על מושתתת השיטה .תרופות לש מטרה חלבוני חיזוי לשם גן-גןו
תרופה-תרופה של דמיון מדדינתון של זוג סמך על המחושבת לגנים תרופות בין לאסוציאציות
זוגות המדדים כדי מבחרשל סטית מאגד את הציונים יכאשר אלמנט של רגרסיה לוג גן-וגן
למאות מטרותרחב היקף של לחיזוי בשיטה השתמשנו ציון סופי לאסוציאציה הנדונה.להניב
-של תרופה ידינו, על לראשונה פותחוש, חדשים וכאלו קיימים דמיון מדדי באמצעות תרופות
והראינו את ,קיימות שיטות של לאלו תוצאות השיטה את והשווינ כמו כןו גן-תרופה וגן
, תרופות למאות חדשות מטרות חיזוישם ל שיטהה הפעלנו את מכן, לאחר .יתרונה עליהן
בשלב הלימוד. שימוש בהם נעשה שלא מידע מאגרי באמצעות הללו התחזיותמ חלק ואימתנו
תרופות בקרב נוספיםחדשים דמיון מדדי הכללת י"ע קלות ביתר להרחבה ניתנת שלנו השיטה
כתב העתב לפרסום התקבלו זו בעבודה המוצגות מהתוצאות חלק. וגנים
Journal of Computational Biology [45].

אביב-תל אוניברסיטת
סאקלר ובברלי ריימונד שם על מדויקים למדעים הפקולטה
בלבטניק שם על המחשב למדעי הספר-בית
וגנים תרופות של דמיון מדדי של אינטגרציה
תרופותשל מטרה חלבוני גילוי לצורך
תואר לקבלת מהדרישות כחלק הוגש זה חיבור
אביב-תל באוניברסיטת M.Sc. - "אוניברסיטה מוסמך"
המחשב למדעי ס"ביה
ידי על
פרלמן ליאת
שרן רודד פרופסור של בהדרכתו הוכנה העבודה
ע"אתש תשרי