combining information from multiple surveys: examples · pdf filecombining information from...
TRANSCRIPT

Combining Information from Multiple Surveys: Examples with NCHS Surveys Nathaniel Schenker, Van Parsons
National Center for Health Statistics
Centers for Disease Control and Prevention ([email protected], [email protected] )
Household Survey Producers Workshop
Committee on National Statistics
June 1, 2011 * The findings and conclusions in this presentation are those of the authors and do not necessarily represent the views of the National Center for Health Statistics, Centers for Disease Control and Prevention.

2
CONTENTS 1. REASONS FOR COMBINING INFORMATION 2. FOUR PROJECTS THAT INVOLVED COMBINING
INFORMATION 3. DISCUSSION

3
1. REASONS FOR COMBINING INFORMATION • Take advantage of different strengths of different surveys • Use one survey to supply information lacking in another • Handle various “non-sampling errors”; e.g.,
- Coverage error - Errors due to missing data - Measurement or response error
• Lower sampling error, i.e., improve precision
4
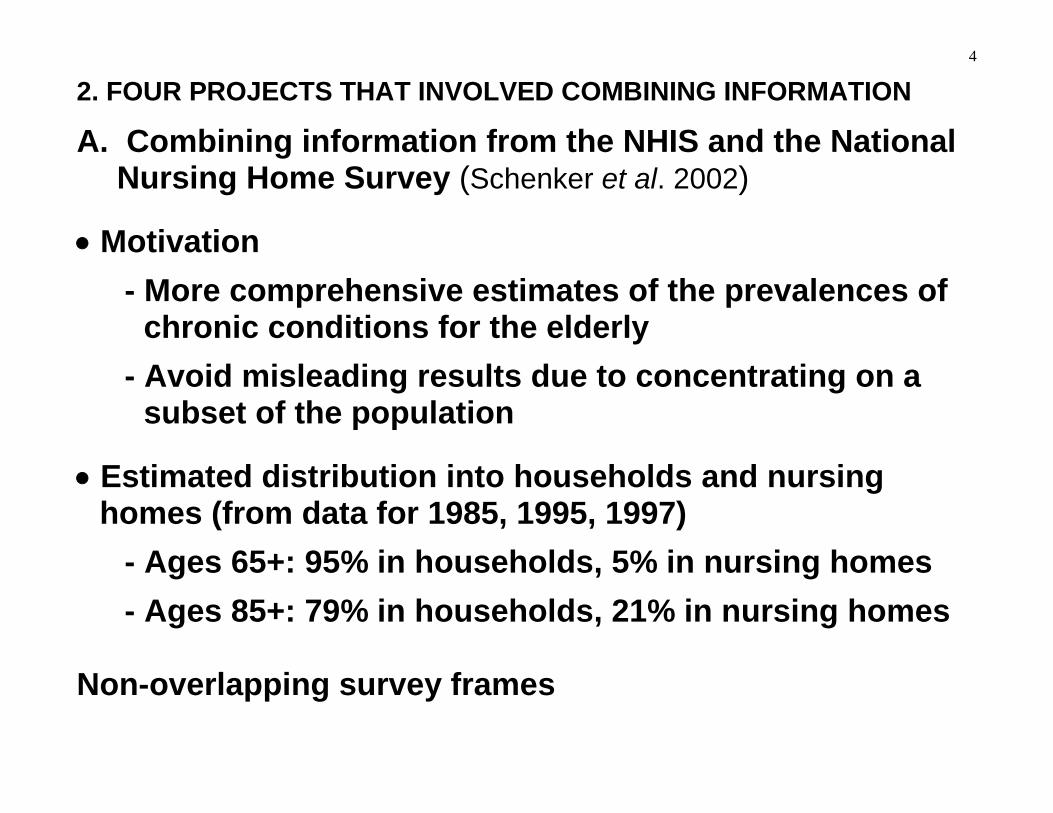
2. FOUR PROJECTS THAT INVOLVED COMBINING INFORMATION
A. Combining information from the NHIS and the National Nursing Home Survey (Schenker et al. 2002)
• Motivation
- More comprehensive estimates of the prevalences of chronic conditions for the elderly
- Avoid misleading results due to concentrating on a subset of the population
• Estimated distribution into households and nursing homes (from data for 1985, 1995, 1997)
- Ages 65+: 95% in households, 5% in nursing homes
- Ages 85+: 79% in households, 21% in nursing homes
Non-overlapping survey frames
5
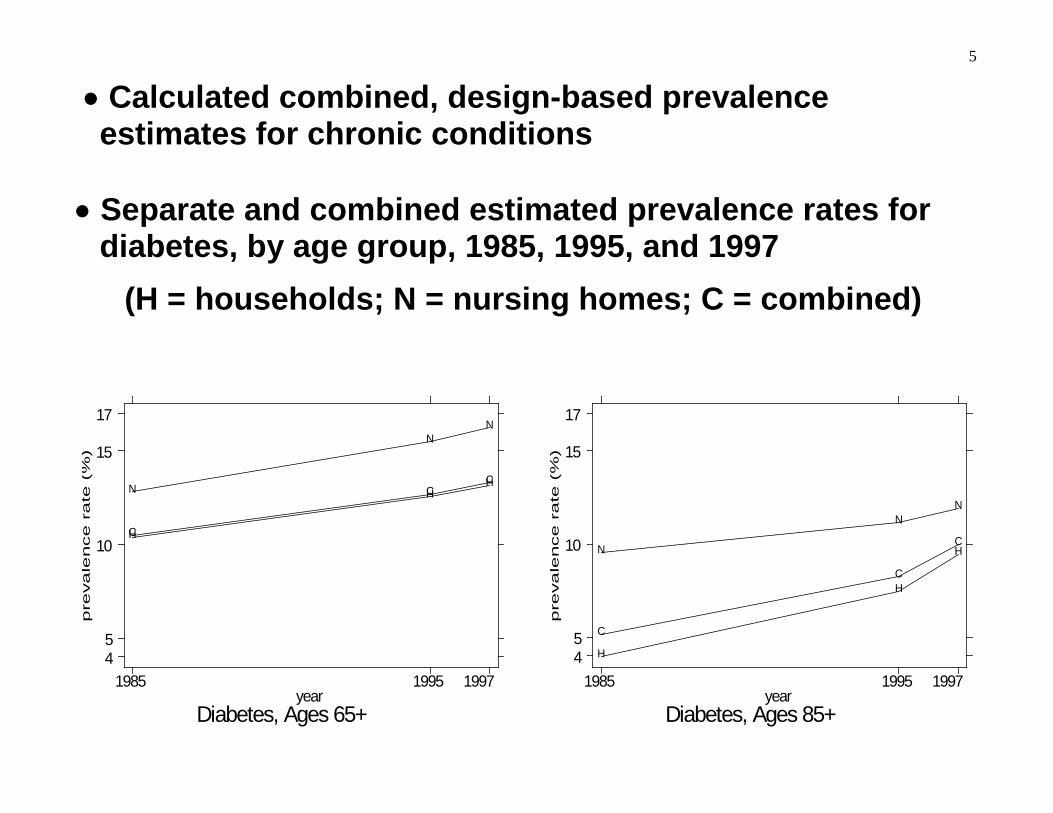
• Calculated combined, design-based prevalence estimates for chronic conditions
• Separate and combined estimated prevalence rates for
diabetes, by age group, 1985, 1995, and 1997 (H = households; N = nursing homes; C = combined)
pre
va
lence r
ate
(%
)
Diabetes, Ages 65+year
1985 1995 199745
10
15
17
HH
H
NN
NC
C
C
pre
va
lence r
ate
(%
)
Diabetes, Ages 85+year
1985 1995 199745
10
15
17
H
H
H
NN
NC
C
C

6
B. Using information from National Health and Nutrition Examination Survey (NHANES) to improve on analyses of self-reported data from the NHIS (Schenker, et al. 2010)
• Motivation
- Self-reported data on NHIS health conditions from questions such as:
“Has a doctor or other health professional ever told you that you have <condition of interest>?”
OR “What is your <height/weight>?”
- might not accurately reflect prevalences of health conditions
♦ e.g., some respondents may not have access to a doctor or other health professional

7
• Method for improving on analyses of self-reported data
♦ NHANES asks self-report questions during an interview and
♦ obtains clinical measures based on a physical examination
- Apply “measurement error” models to NHANES data
predicting clinical outcome from self-report answer and covariates
- Used the fitted models to multiply impute clinical
outcomes for persons in the NHIS

8
• Comparison of 1999-2002 NHIS Estimated Prevalence Rates for Persons of Ages 20 Years and Above: Self-Reported (SR) Data versus Multiply Imputed Clinical (MICL) Data
Categories Hypertension Diabetes Obesity SR MICL SR MICL SR MICL
Education < HS Grad. 30.9 39.5 11.1 14.2 25.7 30.1 HS Grad. 22.9 30.1 6.6 8.8 23.5 28.1
> HS Grad. 16.5 22.8 4.2 6.5 18.7 23.1
Race/ Ethnicity
Hispanic 14.1 20.8 6.9 9.7 23.2 28.2 N.H. Black 26.7 35.1 8.8 11.3 29.9 34.8 N.H. White 20.8 27.6 5.6 7.9 19.8 23.1
Note: Certain records were excluded from the data for this study due to missing covariate values. NHANES sample size = 6,110. NHIS sample size = 105,252.

9
C. Combining information from NHIS and Behavioral Risk Factor Surveillance System (BRFSS) to enhance small-area estimation (Raghunathan, et al. 2007 and Davis, et al. 2010)
• Motivation
- Interest in county/state estimates of the prevalence of cancer risk factors and screening
- NHIS and BRFSS have different strengths - Combining information from surveys could improve
small-area estimates

10
BRFSS :
♦ Fairly large survey
♦ Almost all counties are included in sample BUT
♦ Telephone survey ⋅ Coverage issues ⋅ High nonresponse rates

11
- NHIS
♦ Face-to-face survey ⋅ Good coverage of civilian non-institutionalized population.
⋅ Higher response rates than does BRFSS
BUT
♦ “Small” relative to BRFSS
♦ Only about 25% of counties are in sample

12
• Project developed Bayesian methods to combine information from the two surveys
• Viewed as a BRFSS enhancement ● National Cancer Institute released small-area estimates
♦ smoking status, mammography and pap smear - Estimates produced for counties, health service areas,
and states On-line for 1997-9 and 2000-3 (http://sae.cancer.gov/)
with plans to update ● Current work involves including component for cell-
phone-only households

13
• Summaries of Bayesian BRFSS-alone and BRFSS/NHIS county-level estimates of prevalence rates for current smoking among adult males in 2000, by range of telephone non-coverage rates
Range of Telephone Non-Coverage Rates (%)
Mean of County-Level Estimates (%) BRFSS-Alone BRFSS/NHIS
< 2 20.6 20.4 2 – 3 21.1 23.0 3 – 5 21.9 24.3 5 – 8 23.0 25.7 8 – 10 24.1 26.6
10 – 15 24.4 27.7 15 – 20 25.4 29.8
≥ 20 24.1 30.8

14
• State-level direct and combined (model-based) estimates for mammography, 1997-99

15
D. NCHS record linkage program (http://www.cdc.gov/nchs/data_access/data_linkage_activities.htm)
• Enables researchers to examine factors that influence disability, chronic disease, health care utilization, morbidity, and mortality
• Data being linked to various NCHS surveys
- Air quality data from the Environmental Protection Agency
- Death certificate records from the National Death Index
- Medicare enrollment and claims data from the Centers for Medicare and Medicaid Services
- Benefit history data from the Social Security Administration

16
DISCUSSION •Technical lessons
- Combining information across surveys can yield gains especially when the surveys have complementary strengths
♦ If strengths not complementary, can still gain precision from increased sample size
- Methods developed can become “obsolete” quickly
♦ “Wireless-only” households have increased from about 3% in 2003 to about 24% in 2010 (Blumberg and Luke 2011) ⋅ BRFSS/NHIS project needs separate modeling components for landline and wireless phones

17
- Survey Comparability (or lack thereof)
♦ Target populations: Degree of overlap
♦ Questionnaire
⋅ For mammography, BRFSS refers to: 1. “Within past year (1 to 12 months ago)” 2. “Within past 2 years (1 to 2 years ago)”
NHIS refers to:
1. “a year ago or less” 2. “more than 1 year but not more than 2
years”

18
♦ Sources of information ⋅ NHIS: household members recalling from
memory NNHS: nursing home staff consulting medical
records
♦ Context and mode
⋅ NHANES respondents answer interview questions knowing they will be examined subsequently; different context from NHIS
⋅ Telephone interview in BRFSS vs. face-to-face interview in NHIS

19
- Different sample designs
Need sampling and weighting structures - Need to find good predictors
♦ The more predictive of the outcome of interest, the better
♦ Choice of predictors can be limited by surveys and/or data files used
♦ Predictors will not explain everything
- Deal with small sample sizes, sparse data
♦ In BRFSS/NHIS project ⋅ small samples in counties
♦ Combining multiple years of data can be helpful
♦ Use large-sample approximations with caution

20
• Administrative lessons
- Small-area data sharing among multiple agencies can require a lot of work
♦ Confidentiality concerns
♦ Differing policies among agencies
♦ Differing priorities among agencies
- It is important to educate secondary users on methods
used and limitations of results

21
REFERENCES Blumberg , S.J., and Luke, J.V. (2011), “Wireless Substitution: Early Release of Estimates from the National Health Interview Survey, July – December 2010,” Division of Health Interview Statistics, National Center for Health Statistics, Centers for Disease Control and Prevention (http://www.cdc.gov/nchs/data/nhis/earlyrelease/wireless201005.htm).
Davis, W.W., Parsons, V.L., Xie, D., Schenker, N., Town, M., Raghunathan, T.E., and Feuer, E.J. (2010), “State-Based Estimates of Mammography Screening Rates Based on Information from Two Health Surveys,” Public Health Reports.
Raghunathan, T.E., Xie, D., Schenker, N., Parsons, V.L., Davis, W.W., Dodd, K.W., and Feuer, E.J. (2007), “Combining Information From Two Surveys to Estimate County-Level Prevalence Rates of Cancer Risk Factors and Screening,” Journal of the American Statistical Association, 102, 474-486.
Schenker, N. (2004), “Bridging Across Changes in Classification Systems,” in Applied Bayesian Modeling and Causal Inference from Incomplete-Data Perspectives, A. Gelman and X.-L. Meng, Eds., Chichester: Wiley, pp. 117-128.
Schenker, N., Gentleman, J.F., Rose, D., Hing, E., and Shimizu, I.M. (2002), “Combining Estimates from Complementary Surveys: A Case Study Using Prevalence Estimates from National Health Surveys of Households and Nursing Homes,” Public Health Reports, 117, 393-407.
Schenker, N., and Raghunathan, T.E. (2007), “Combining Information from Multiple Surveys to Enhance Estimation of Measures of Health,” Statistics in Medicine, 26, 1802-1811.
Schenker, N., and Raghunathan, T.E. (2008), “Discussion of ‘Assessing the Value of Bayesian Methods for Inference about Finite Population Quantities’ by Sedransk,” Journal of Official Statistics, 24, 507-512.
Schenker, N., Raghunathan, T.E., and Bondarenko, I. (2010), “Improving on Analyses of Self-Reported Data in a Large-Scale Health Survey by Using Information from an Examination-Based Survey,” Statistics in Medicine, 9, 533-545.
Sedransk, J. (2008), “Assessing the Value of Bayesian Methods for Inference about Finite Population Quantities,” Journal of Official Statistics, 24, 495-506.