combining nadir and oblique uav imagery to reconstruct ... · pdf filean accurate set of...
TRANSCRIPT

ARTICLE
Combining nadir and oblique UAV imagery to reconstruct quarry topography:methodology and feasibility analysis
Paolo Rossia, Francesco Mancinia, Marco Dubbinib, Francesco Mazzonec and Alessandro Capraa
aDepartment of Engineering (DIEF) ‘Enzo Ferrari’, University of Modena and Reggio Emilia, Modena, Italy; bGeography Section,Department of History, Culture and Civilisation (DiSCi), University of Bologne, Bologne, Italy; cDepartment of Science and Technology,University of Naples “Parthenope”, Naples, Italy
ABSTRACT
The feasibility of unmanned-aerial-vehicle-based photogrammetry was assessed for thereconstruction of high-resolution topography and geomorphic features of quarries by nadirand off-nadir imagery. The test site was a quarry located in the rural area of Turi (Bari,southern Italy). Two processing scenarios were created. Nadir images were initially used,and images acquired with off-nadir angles were added. An accurate set of ground controlpoints (GCPs) were surveyed for both georeferencing purposes and validation processes. Inthe reconstruction of the surfaces, an accuracy of a few centimeters was achieved in the finalpositioning of point clouds representing the main geometries of quarry environment.However, greatest differences were found along the edges or the lines characterized bysudden slope changes. To better understand such results, some characteristic quarry shapesdepicted by both the scenarios were compared to those surveyed by a total station used asan independent benchmark technique. It allowed to define the benefits introduced by thejoint use of nadir and oblique images in the delineation of quarry shapes, surface disconti-nuities and better descriptions of sub-vertical walls. Beside the evaluation of benefits intro-duced by use of oblique cameras, the effectiveness of the proposed methodology was alsodiscussed with alternative technologies. Unmanned aerial platforms represent an effectivesolution, with the need for few accurate GCPs.
ARTICLE HISTORY
Received 11 February 2017Revised 24 March 2017Accepted 25 March 2017
KEYWORDS
UAV photogrammetry;3D reconstruction; quarrytopography; accuracyassessments; feasibilityanalysis
Introduction
Open-pit mines and quarries represent some of the
most evident topographic signatures of landscapes
for human activities over a wide range of geo-
morphic settings (Chen, Li, Chang, Sofia, &
Tarolli, 2015). Visual impact and modifications to
the geomorphological settings constitute the main
issues related to such landscape alterations, both
during mining and for many years post-mining.
Furthermore, better knowledge of the new geo-
morphic features introduced after intensive quarry-
ing activities can improve the design of the most
appropriate strategies for reclamation and rehabili-
tation of mined sites (Damigos & Kaliampakos,
2003) or implementation of geomechanical models
to assess the slope stability.
Prior to these activities, detailed topographic sur-
veys are required. Also, depending on current regula-
tions, mine managers have to report the amount of
extracted materials and mine tailings on a regular
basis (Shahbazi, Sohn, Théau, & Ménard, 2015) with
problems related to a reliable estimation of volu-
metric changes over time. The search for accurate
and repeatable methodologies and procedures to
reconstruct three-dimensional (3D) geomorphic fea-
tures of quarries with centimetric spatial resolution is
important for mine managers.
For 3D surveying of quarries and open-pit mines,
aerial light detection and ranging, airborne photo-
grammetry, terrestrial laser scanning (TLS), global
navigation satellite system (GNSS) and traditional
survey techniques can provide useful information.
However, high-resolution topographic surveying of
quarries is associated with high capital and logistical
costs (Chen et al., 2015). In particular, surveys over
small areas do not justify the use of traditional aerial
technology. Over large areas, point-based observa-
tions such as GNSS and electronic total stations are
time-consuming and cost-intensive. In general, the
cost of ground-based methodologies is relatively
high, and mining activities need to be closed down
in the operational zones. Moreover, the design of
ground surveys for remote and difficult-to-access
areas might represent a very hard task. The 3D repre-
sentation of break lines, dumps and sides with sub-
vertical walls is another relevant point in the selection
of the best technology for quarry monitoring, assess-
ment of extraction costs/efficiency and volumes
CONTACT Paolo Rossi [email protected] Department of Engineering (DIEF) “Enzo Ferrari”, University of Modena and Reggio Emilia, viaPietro Vivarelli 10, I-41125 Modena, Italy
EUROPEAN JOURNAL OF REMOTE SENSING, 2017
VOL. 50, NO. 1, 1313097
http://dx.doi.org/10.1080/22797254.2017.1313097
© 2017 The Author(s). Published by Informa UK Limited, trading as Taylor & Francis Group.This is an Open Access article distributed under the terms of the Creative Commons Attribution License (http://creativecommons.org/licenses/by/4.0/), which permitsunrestricted use, distribution, and reproduction in any medium, provided the original work is properly cited.

computation. TLS can be used to acquire 3D point
clouds of slopes whenever a good visibility from the
setting points is guaranteed. Conversely, aerial meth-
odologies based on nadir views are not very suited to
the mapping of slope zones.
In recent years, aerial photogrammetry based on
images acquired by unmanned aerial vehicles (UAVs)
has been used for the reconstruction of geomorphic
features at an affordable and unprecedented spatial
and temporal resolution. In particular, structure from
motion (SfM) photogrammetry with nadir and, more
rarely, oblique cameras has provided high-resolution
digital surface models (DSMs) with vertical accura-
cies and spatial resolution at few centimeter level
(Agüera-Vega, Carvajal-Ramírez, & Martínez-
Carricondo, 2016; Bryson, Johnson-Roberson,
Murphy, & Bongiorno, 2013; Casella et al., 2014;
Eltner et al., 2016; Fonstad, Dietrich, Courville,
Jensen, & Carbonneau, 2013; Harwin, Lucieer, &
Osborn, 2015; Mancini et al., 2013; Rupnik, Nex, &
Remondino, 2014).
Little has been published relating to the applicabil-
ity of UAV-based methodologies in quarrying, to
overcome the use of simplified representations and
layouts of slope geometry. In this field, McLeod et al.
(2013) explored the feasibility of using UAVs to
obtain point clouds to measure fracture orientation,
more recently Shahbazi et al. (2015) and Chen et al.
(2015) adopted UAV technology for 3D mapping and
geomorphic feature characterization of open-pit mine
areas. Tong et al. (2015) highlighted the need to
integrate point clouds from nadir UAV images of
slope zones with TLS-derived point clouds for land
cover classification.
The feasibility of UAV-based photogrammetry
was evaluated for the reconstruction of topography
and geomorphic features of quarries and further
assessments on acquisition geometries and obtain-
able accuracies introduced. The case study provides
inspiration for discussions and definitions of meth-
odologies valid in environments where defined geo-
metries and sharp break lines are recurring
features.
Methods
Case study
The case study is a 9-ha quarry in the rural area of
Turi (Bari, southern Italy) that started operations
more than 50 years ago (see Figure 1(a)). This site
shows prevalent Mesozoic carbonate rock locally bur-
ied under alluvional-eluvial red soil deposits, with no
vegetation present across the area. The main geo-
morphic features are a multilevel shaped pit with a
bottom altitude of about 35 m from the surface
(Figure 1(b)–(e)) and sub-vertical walls located on
the east side that have sharp break lines (Figure 1
(d)). The surface roughness is related to deposits of
quarried material and to the signs left by the machin-
ery that was used to break up the rock walls. Outside
the perimeter of the quarried area, there is some
sparse vegetation that covers the most superficial
areas; any 3D reconstruction of ground surfaces
based on a photogrammetric approach is not effective
and can generate errors. Figure 2(a) shows a high-
resolution ortophoto that was reconstructed in this
study. For the successive analysis of the impact and
benefits introduced by the joint use here of nadir and
oblique cameras, the investigated area was reduced to
the large, 4.6-ha sector located on the east side
(Figure 2(a), dashed polygon) mostly characterized
by sub-vertical walls.
UAV flights
The UAV airframe used was a hexacopter ESAFLY
A2500 that was designed and manufactured by Sea
Air Land (SAL) Engineering, and equipped with a
Canon EOS 550D digital camera with a fixed geome-
try during flights (focal length: 25.0 mm; sensor res.
5184 × 3456; average GSD: 0.01 m) and an on-board
navigation-grade GNSS receiver. The maximum
weight was 5.8 kg, with the upper limit of flight
endurance of 20 min.
The flight plan with a conventional parallel flight
lines development was planned at an altitude of 50 m
a.g.l. using an aerial orthophoto as the reference map
Figure 1. (a) Ortophoto of the quarry, showing also location of the study site within Italy; (b–e) sub-vertical walls and maingeomorphological features of the studied area.
212 P. ROSSI ET AL.

(the altitude provided here increases for inner por-
tions due to the stepped topography). An autono-
mous mode of images acquisition was set for one
shot per second, for a total of 786 acquired images.
To cover the whole area, three flights were performed
with nadir orientation of the camera, the acquisition
timing gave up to a minimum of seven overlapping
images for any single ground feature. However, a
forward and side overlap of 90% was guaranteed.
An additional flight with a 60° off-nadir camera (i.e.
oblique images) and manual piloting was carried out
to collect aerial images of the sub-vertical walls in the
eastern part of the quarry (see Figure 2(a) and (b),
area within dashed line) at an average distance of
20 m from the walls. Images at finer scale were there-
fore produced during the flight with oblique camera.
The redundant set of images acquired at the selected
timing facilitates the SfM approach. Images acquired
during the takeoff and landing operations and
blurred images were filtered out during the later
processing.
Ground control and validation points
Validation of reconstructed surfaces is a fundamental
issue for multitemporal elevation data sets. A range of
recent studies has advanced our understanding of
sources of error, accuracy and precision of SfM tech-
niques under different scenarios (Agüera-Vega et al.,
2016; Fonstad et al., 2013; Harwin et al., 2015; James
& Robson, 2012; James, Robson, d’Oleire-Oltmanns,
& Niethammer, 2017). The number, density, spatial
distribution and positioning accuracy of ground con-
trol points (GCPs) are also key factors for reliable
positioning of UAV-SfM products. James and Robson
(2012) and Clapuyt, Vanacker, and Van Oost (2015)
demonstrated that the position error of DSMs
decreases with the use of an increasing number of
GCPs. James and Robson (2012) assessed the effects
of the distribution of GCPs on the results. These
studies showed that widely dispersed GCPs and
their orientation along the perimeter of an area pro-
mote fewer reconstruction errors. Similar data were
obtained by Harwin et al. (2015) in an accuracy
validation procedure that determined the benefits of
accurate GCPs and oblique imagery under different
scenarios within a limited portion of an eroding
coastal scarp. Depending also on the GCPs positional
accuracy, such studies demonstrated that a number of
5–10 GCPs are able to produce an accuracy of about
5 cm of point clouds derived for limited surface
extent. Considering a flight altitude of 50 m planned
in this work, such value of accuracy is also compar-
able with the 1:1000 precision rates introduced by
James and Robson (2012).
Thus, in the attempt to provide a reliable proce-
dure for quarries monitoring and reduce the efforts
in the field, the locations of 18 evenly distributed
targets were surveyed for successive use as GCPs in
the final point-cloud orientation and validation
points (VPs) for an accuracy assessments of the
UAV-derived elevation data set (see Figure 2(a) for
GCPs and VPs spatial distribution). In particular,
GCPs were acquired along perimeter areas and at
different elevations. Then, 20 cm × 25 cm plastic
boards with alternate black and white triangles inter-
secting in the center were placed on horizontal sur-
faces only (Figure 2(c)).
Rapid-static GNSS surveying was performed to
connect the target locations with a reference GNSS
station located in the vicinity of the investigated area.
The absolute coordinates of the reference station were
calculated using static positioning over longer ranges
within the GNSS permanent infrastructure managed
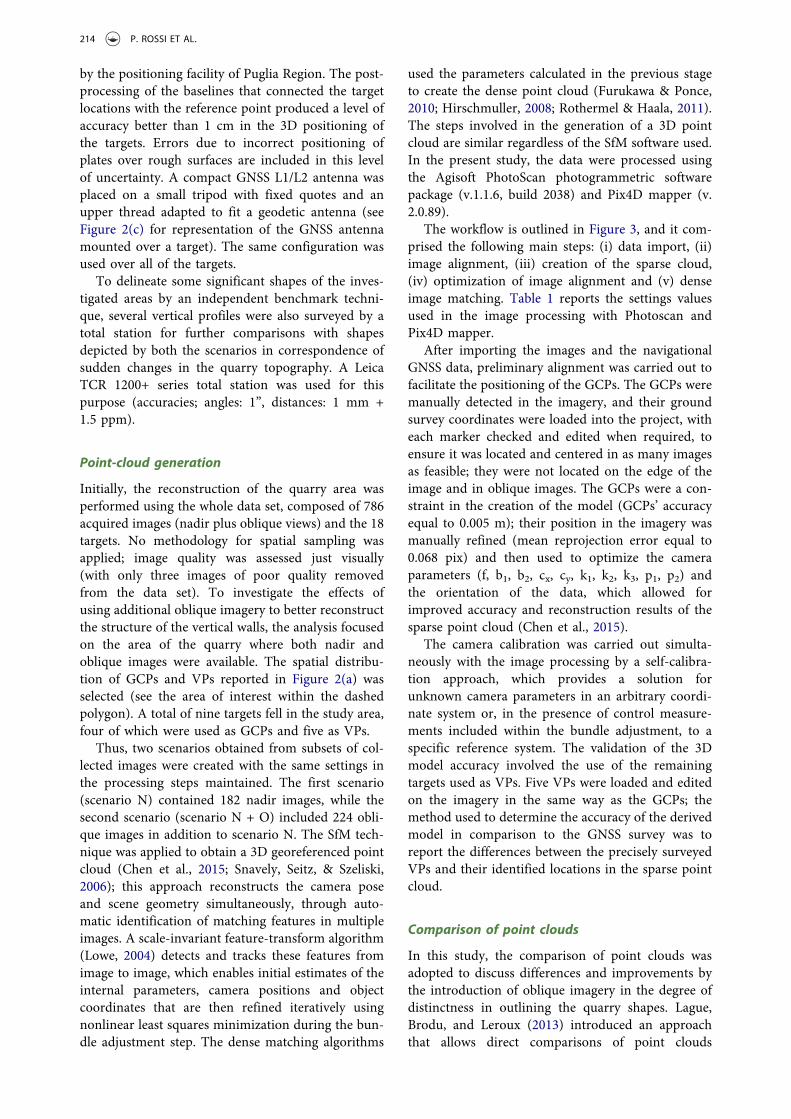
Figure 2. (a) Ortophoto of the entire site, with indication of the area where oblique images were collected (black dashed box;investigated area). Dots represent the location of the ground control points (GCPs) acquired through a global navigationsatellite system (GNSS) survey, and squares represent the GNSS locations used as validation points (VPs). Some targets wereused alternatively as GCPs and VPs; (b) three-dimensional (3D) model with a view of the camera positions; (c) GNSS antennacollecting data over a black and white target used as reference.
EUROPEAN JOURNAL OF REMOTE SENSING 213
by the positioning facility of Puglia Region. The post-
processing of the baselines that connected the target
locations with the reference point produced a level of
accuracy better than 1 cm in the 3D positioning of
the targets. Errors due to incorrect positioning of
plates over rough surfaces are included in this level
of uncertainty. A compact GNSS L1/L2 antenna was
placed on a small tripod with fixed quotes and an
upper thread adapted to fit a geodetic antenna (see
Figure 2(c) for representation of the GNSS antenna
mounted over a target). The same configuration was
used over all of the targets.
To delineate some significant shapes of the inves-
tigated areas by an independent benchmark techni-
que, several vertical profiles were also surveyed by a
total station for further comparisons with shapes
depicted by both the scenarios in correspondence of
sudden changes in the quarry topography. A Leica
TCR 1200+ series total station was used for this
purpose (accuracies; angles: 1”, distances: 1 mm +
1.5 ppm).
Point-cloud generation
Initially, the reconstruction of the quarry area was
performed using the whole data set, composed of 786
acquired images (nadir plus oblique views) and the 18
targets. No methodology for spatial sampling was
applied; image quality was assessed just visually
(with only three images of poor quality removed
from the data set). To investigate the effects of
using additional oblique imagery to better reconstruct
the structure of the vertical walls, the analysis focused
on the area of the quarry where both nadir and
oblique images were available. The spatial distribu-
tion of GCPs and VPs reported in Figure 2(a) was
selected (see the area of interest within the dashed
polygon). A total of nine targets fell in the study area,
four of which were used as GCPs and five as VPs.
Thus, two scenarios obtained from subsets of col-
lected images were created with the same settings in
the processing steps maintained. The first scenario
(scenario N) contained 182 nadir images, while the
second scenario (scenario N + O) included 224 obli-
que images in addition to scenario N. The SfM tech-
nique was applied to obtain a 3D georeferenced point
cloud (Chen et al., 2015; Snavely, Seitz, & Szeliski,
2006); this approach reconstructs the camera pose
and scene geometry simultaneously, through auto-
matic identification of matching features in multiple
images. A scale-invariant feature-transform algorithm
(Lowe, 2004) detects and tracks these features from
image to image, which enables initial estimates of the
internal parameters, camera positions and object
coordinates that are then refined iteratively using
nonlinear least squares minimization during the bun-
dle adjustment step. The dense matching algorithms
used the parameters calculated in the previous stage
to create the dense point cloud (Furukawa & Ponce,
2010; Hirschmuller, 2008; Rothermel & Haala, 2011).
The steps involved in the generation of a 3D point
cloud are similar regardless of the SfM software used.
In the present study, the data were processed using
the Agisoft PhotoScan photogrammetric software
package (v.1.1.6, build 2038) and Pix4D mapper (v.
2.0.89).
The workflow is outlined in Figure 3, and it com-
prised the following main steps: (i) data import, (ii)
image alignment, (iii) creation of the sparse cloud,
(iv) optimization of image alignment and (v) dense
image matching. Table 1 reports the settings values
used in the image processing with Photoscan and
Pix4D mapper.
After importing the images and the navigational
GNSS data, preliminary alignment was carried out to
facilitate the positioning of the GCPs. The GCPs were
manually detected in the imagery, and their ground
survey coordinates were loaded into the project, with
each marker checked and edited when required, to
ensure it was located and centered in as many images
as feasible; they were not located on the edge of the
image and in oblique images. The GCPs were a con-
straint in the creation of the model (GCPs’ accuracy
equal to 0.005 m); their position in the imagery was
manually refined (mean reprojection error equal to
0.068 pix) and then used to optimize the camera
parameters (f, b1, b2, cx, cy, k1, k2, k3, p1, p2) and
the orientation of the data, which allowed for
improved accuracy and reconstruction results of the
sparse point cloud (Chen et al., 2015).
The camera calibration was carried out simulta-
neously with the image processing by a self-calibra-
tion approach, which provides a solution for
unknown camera parameters in an arbitrary coordi-
nate system or, in the presence of control measure-
ments included within the bundle adjustment, to a
specific reference system. The validation of the 3D
model accuracy involved the use of the remaining
targets used as VPs. Five VPs were loaded and edited
on the imagery in the same way as the GCPs; the
method used to determine the accuracy of the derived
model in comparison to the GNSS survey was to
report the differences between the precisely surveyed
VPs and their identified locations in the sparse point
cloud.
Comparison of point clouds
In this study, the comparison of point clouds was
adopted to discuss differences and improvements by
the introduction of oblique imagery in the degree of
distinctness in outlining the quarry shapes. Lague,
Brodu, and Leroux (2013) introduced an approach
that allows direct comparisons of point clouds
214 P. ROSSI ET AL.

without meshing or gridding and to compute the
local distances between point clouds along the surface
normal direction. This method is called a multiscale
model to model cloud comparison (M3C2), and it
can be found as a plugin of the Cloud Compare
software V2 (freely available at http://www.cloudcom
pare.org). Significant distances between point clouds
were detected by the M3C2 algorithm after the esti-
mate of a confidence interval based on the point-
cloud roughness. Significant change indicated
whether the distance measured by M3C2 was signifi-
cantly greater (at a 95% confidence interval) than a
reference measure of the roughness. The significant
change was 0 if the surface was very rough compared
Figure 3. Workflow for 3D point-cloud generation and the subsequent investigations.
Table 1. Settings values used in the image processing with Photoscan and Pix4D mapper.
Survey
Nadir data set 182 imagesOblique data set 224 imagesGCP accuracy 10 mm
Data processing
Photoscan Pix4d Mapper
Alignment Initial processingAccuracy High Keypoints image scale Original image sizePair preselection Reference Matching image pairs Aerial grid or corridor
Dense cloud Point cloudQuality Medium Point density Half image size, optimalDepth filtering Aggressive Minimum matches 3
GCP, ground control point.
EUROPEAN JOURNAL OF REMOTE SENSING 215

to the mean distance measured between the two
clouds or if there were not enough points in the
“projection cylinder” (typically 4 by default). The
dense cloud ensured a sufficient number of points
for such an assessment. In this paper the M3C2
algorithm was selected because of its suitability in
the comparisons of point clouds from monitoring
operations of objects marked by well-defined surface
orientation and prevailing shapes.
The operational diagram in Figure 4(a) shows the
M3C2 analysis. For every point i, the neighboring
points within a diameter D are used to calculate the
punctual normal (N). Then the algorithm requires the
definition of a search cylinder, with its axis aligned
with the normal for i. The cylinder has diameter d
(search scale), and a maximum length is imposed to
speed up the calculation.
Results
Point-cloud generation and accuracy assessment
The proposed methodologies allowed the generation of
point clouds from UAV images after the processing of
the nadir (scenario N) and nadir plus oblique (scenario
N + O) imagery. PhotoScan produced a sparse cloud
compose of 15,924 points in the scenario N and 21,884
in the scenario N + O with better representation that
the nadir view provided for sub-vertical walls and
hidden surfaces. The processing of a dense cloud by
setting the accuracy at the “medium” level resulted in
26,702,644 and 43,046,029 points for N and N + O
scenario, respectively, with an average point density of
4 cm. In the dense cloud, the average point density
related to walls changed from 330 points/m2 to 620
points/m2 after the introduction of oblique imageries,
providing a more complete description of the area.
The processing was repeated in a very similar config-
uration using Pix4D for further comparison. Pix4D
could not match all the images of the scenario
N + O together due to the absence of intermediate
or transitional frames between the nadir and oblique
acquisitions. So, the N and N + O data sets were
processed separately and then aligned. Final joint opti-
mization based on a bundle adjustment procedure
made the refinement of the unknowns possible.
Despite this, the results confirmed the achievement
in the sparse and dense cloud generation.
The VP positions derived from accurate GNSS and
their corresponding positions in the derived point
cloud were used to calculate the error metrics (dx,
dy, dz) for the dual scenarios (Table 2). The
Figure 4. (a) Operational diagram of the M3C2 technique. The normal for i is calculated at scale D. A cylinder with diameter dand specified length is used to select points i1 and i2. LM3C2 is the distance between i1 and i2, and local roughness is calculatedas σ1 and σ2 (from Lague et al. (2013), with modifications); (b) influence of the complex topography on the determination ofdistances near the break lines. The normal directions influence the distance value; LM3C2 ≠ L’M3C2.
Table 2. Distances between the point clouds created by PhotoScan and Pix4D Mapper according to the dual scenarios (N,N + O) and the reference GNSS locations.
Scenario Validation point
Distance between point clouds (m)
Photoscan Pix4D
dx dy dz d VPð Þ dx dy dy d VPð Þ
N 19 N −0.028 −0.012 0.032 0.043 0.013 −0.003 −0.013 0.01905 N −0.017 −0.019 −0.028 0.038 0.021 0.009 0.039 0.04615 0.019 −0.020 −0.021 0.035 −0.031 0.014 0.013 0.03734 −0.005 −0.022 0.006 0.024 0.004 0.008 −0.005 0.010
04 N 0.010 0.002 −0.001 0.011 −0.016 −0.006 −0.005 0.018Mean −0.004 −0.014 −0.002 −0.002 0.004 0.006
N + O 19 N −0.028 −0.004 0.043 0.051 −0.012 −0.001 0.024 0.02705 N −0.015 −0.02 −0.037 0.045 0.019 0.010 0.032 0.03915 0.022 −0.013 −0.021 0.033 −0.021 0.013 −0.001 0.02434 −0.003 −0.022 −0.007 0.023 0.008 0.013 −0.011 0.019
04 N 0.017 0.005 −0.015 0.024 −0.023 −0.008 0.002 0.025Mean −0.001 −0.011 −0.008 −0.006 0.005 0.009
GNSS, global navigation satellite system.d(VP), Euclidean distance (m) calculated for each VP; Mean, mean distance along reference direction.
216 P. ROSSI ET AL.
methodologies applied were effective for the produc-
tion of accurate solutions, as the differences between
the point-cloud positions and GNSS locations were
limited to a few centimeters. Both scenarios N and
N + O provided accurate solutions.
Moreover, to provide an assessment of the simi-
larity between point clouds provided by PhotoScan
and Pix4D within the investigated area in the N + O
scenario, a comparison was performed using the
M3C2 methodology. Parameters used in the M3C2
methodology assumed the following values: D varies
between 0.3 m and 0.7 m, with step equal to 0.1 m;
d = 0.1m andmaximumdisplacement distance = 10m.
This parameter setting allowed the calculation of the
normal considering the roughness of the surface and
with respect to the geometric complexity. The D
value is suitable for the case study, and it is inter-
mediate between the values proposed by Lague et al.
(2013) for gravel and cobbles (0.25 m, 0.7 m, respec-
tively). The d value was chosen to limit the vertical
search range. The M3C2 algorithm calculates the
best-fit planes; to be effective, a minimum number
of points is required to fall in the area of study (Lague
et al., 2013). This comparison exhibits very small
residuals, with averages values of −0.004 m
(SD = 0.033 m). Due to this similarity between
point clouds, the remaining analyses presented were
carried out using Photoscan alone.
Contribution of nadir imagery to point clouds
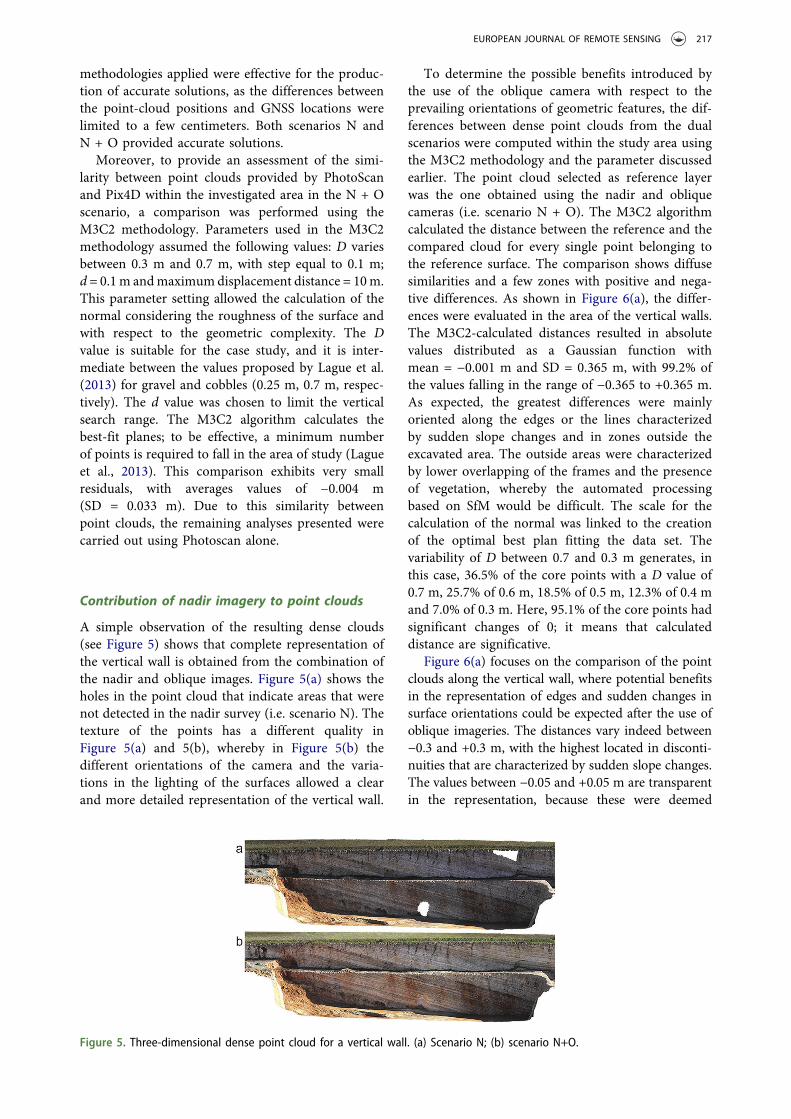
A simple observation of the resulting dense clouds
(see Figure 5) shows that complete representation of
the vertical wall is obtained from the combination of
the nadir and oblique images. Figure 5(a) shows the
holes in the point cloud that indicate areas that were
not detected in the nadir survey (i.e. scenario N). The
texture of the points has a different quality in
Figure 5(a) and 5(b), whereby in Figure 5(b) the
different orientations of the camera and the varia-
tions in the lighting of the surfaces allowed a clear
and more detailed representation of the vertical wall.
To determine the possible benefits introduced by
the use of the oblique camera with respect to the
prevailing orientations of geometric features, the dif-
ferences between dense point clouds from the dual
scenarios were computed within the study area using
the M3C2 methodology and the parameter discussed
earlier. The point cloud selected as reference layer
was the one obtained using the nadir and oblique
cameras (i.e. scenario N + O). The M3C2 algorithm
calculated the distance between the reference and the
compared cloud for every single point belonging to
the reference surface. The comparison shows diffuse
similarities and a few zones with positive and nega-
tive differences. As shown in Figure 6(a), the differ-
ences were evaluated in the area of the vertical walls.
The M3C2-calculated distances resulted in absolute
values distributed as a Gaussian function with
mean = −0.001 m and SD = 0.365 m, with 99.2% of
the values falling in the range of −0.365 to +0.365 m.
As expected, the greatest differences were mainly
oriented along the edges or the lines characterized
by sudden slope changes and in zones outside the
excavated area. The outside areas were characterized
by lower overlapping of the frames and the presence
of vegetation, whereby the automated processing
based on SfM would be difficult. The scale for the
calculation of the normal was linked to the creation
of the optimal best plan fitting the data set. The
variability of D between 0.7 and 0.3 m generates, in
this case, 36.5% of the core points with a D value of
0.7 m, 25.7% of 0.6 m, 18.5% of 0.5 m, 12.3% of 0.4 m
and 7.0% of 0.3 m. Here, 95.1% of the core points had
significant changes of 0; it means that calculated
distance are significative.
Figure 6(a) focuses on the comparison of the point
clouds along the vertical wall, where potential benefits
in the representation of edges and sudden changes in
surface orientations could be expected after the use of
oblique imageries. The distances vary indeed between
−0.3 and +0.3 m, with the highest located in disconti-
nuities that are characterized by sudden slope changes.
The values between −0.05 and +0.05 m are transparent
in the representation, because these were deemed
Figure 5. Three-dimensional dense point cloud for a vertical wall. (a) Scenario N; (b) scenario N+O.
EUROPEAN JOURNAL OF REMOTE SENSING 217

nonsignificant considering the metric accuracies
obtainable with this methodology (according to the
precision ratios of about 1:1000 reported by James &
Robson, 2012). The point clouds generated by the two
scenarios (i.e. N, N + O) were cut with the vertical
planes (producing vertical profiles) to determine
whether the calculated distances were real or were an
incorrect estimation of the M3C2 algorithm. Also, to
provide an independent technique as benchmark in the
assessment of benefits introduced by the processing of
oblique view, the aforementioned sections have been
compared with data collected by the total station.
Figure 6, profiles b–g, shows some of the profiles
created, where the black solid line indicates the position
of the reference point cloud. We note that there is a
general agreement (gray areas) with the distances cal-
culated by the algorithm and those represented in
Figure 6(a). The yellow and red zones in Figure 6(a)
indicate a positive distance, and the profiles confirm
these results, where the compared point cloud (profiles
b–g, blue line) is above the reference (profiles b–g, red
line). In the blue areas in Figure 6(a), the two point
clouds are reversed and the distances are negative. The
comparison with profiles surveyed by total stations
suggested that areas characterized by sudden changes
in topography and surface orientations are better
represented by the scenario (N + O). In particular,
this is evident for profiles e and f, where the reference
profile is more closely represented by the vertical sec-
tions obtained from the N + O scenario.
Figure 6. Distances calculated by the M3C2 algorithm and comparison with the independent data set provided by surveyingwith total station. The lowest values (white in the legend) are transparent in the 3D model, for easy viewing. The upper figureshows the position of six profiles (named with letters from b to g) where data are compared. The lower figures show the verticalsections of the two point clouds, with an indication of the significant distances, and a comparison with the reference data usedas benchmark. Red lines, vertical profile from scenario N+O used as reference by the M3C2 algorithm; blue lines, comparedmodel of scenario N; black solid lines, vertical profiles detected by total station measurements. The horizontal distance (X-axis) isfrom the starting point of the section; Y-axis represents the height values along the profiles.
218 P. ROSSI ET AL.

Discussion
Oblique images, GCPs and accuracy
The accuracy at centimeter level achieved in the final
positioning of the point clouds from UAV photo-
grammetry is comparable with performances pro-
vided by long range TLS, differential GNSS or total
station, although the costs are not always comparable.
Certainly, patches of vegetation affect the elevation
models produced by any of the available photogram-
metry-based methodologies. However, the aerial
nadir view is not very suited for surveying sub-ver-
tical walls, although the contributions of the oblique
cameras demonstrated the possibility to strengthen
the consistency of the reconstructed surfaces.
However, to fully exploit the potentialities of the
imagery collected by the oblique camera, an algorithm
that can process nadir and oblique images simulta-
neously is needed (e.g. PhotoScan). Even with the
inclusion of oblique imagery, the use of a few accurate
GCPs is strongly recommended. As shown by James
and Robson (2014), in the absence of GCPs, systematic
errors in the DSM creation can be significantly
reduced through the collection of oblique imagery.
Quantitative studies on the benefits introduced by
oblique imagery in the reconstruction of natural land-
scapes are not very common. Harwin et al. (2015)
investigated the joint use of nadir and oblique imagery
and several scenarios related to GCP accuracy (centi-
meter and millimeter levels) and distribution. They
indicated that the benefits introduced by oblique ima-
gery can be particularly noted with inaccurate GCPs (a
few centimeters in the level of accuracy). The dual
scenario examined in the present study used accurate
GCPs but differed in the geometry of the acquisition of
the imagery. Table 1 reports the very small discrepan-
cies for both scenarios N and N + O, although the
arrangement of the VPs should be commented upon.
The VPs were placed at variable depths on the hor-
izontal surfaces only, with no VPs placed on the ver-
tical walls. This means that only horizontal VPs
contributed to the validation stage. However, in the
case of the use of VPs on the vertical walls only, the
nadir imagery would barely identify the targets. For
this reason, a comparison of the accuracy achieved by
the scenarios N and N + O cannot be performed with
the same VP distribution if the VPs were distributed
on the walls. Thus, for logistic reasons and with the
need to establish a methodology for an effective and
timely UAV aerial survey, the targets were placed only
on horizontal surfaces.
Ability to reconstruct shapes for sub-vertical
surfaces
As shown in Figure 5, the scenario with nadir and
oblique images (N + O) allowed detailed
representation of the vertical wall without voids.
The distances calculated between the two point
clouds indicated that the greatest differences were
along discontinuities. These values might have been
partly generated by the M3C2 algorithm, according to
the delineation of the normal direction. In sharp
break lines, the matching area for the normal calcula-
tion (D) falls on differently oriented surfaces. As
shown in Figure 4(b) for point clouds that fall close
to break lines, the normal directions might influence
the distance. However, inspection of the vertical sec-
tions makes the reasons for such heterogeneities
more comprehensible. Figure 6 indicated that the
differences between the vertical profiles from scenar-
ios N and N + O arose from well-recognizable differ-
ences in geometric features. In Figure 6, the profiles
reconstructed from scenario N + O (red line) that are
shown are more suitable to represent the complex
geometries and are closer to the reference profile
than profiles generated by the use of nadir mages
only. In the N + O scenario, the higher point density
allowed better delineation of the break lines.
Moreover, scenario N (blue line) did not allow pre-
cise modeling of the debris material at the base of the
vertical walls (see also profiles e–g). In all of the
profiles, scenario N produced smoothed geometries
and a more gradual transition between the horizontal
and vertical surfaces than scenario N + O.
Pros and cons of UAV to other surveys
technologies
An investigation on the feasibility and affordability of
UAV-based surveys as a tool to reconstruct high-
resolution topography of quarries deserves a short
discussion on their performance with different tech-
nologies. GNSS and electronic total station might
sometimes have difficulties for the monitoring of
large areas and thus can generate high costs (Tong
et al., 2015). TLS and UAV photogrammetry generate
models with higher point densities. However, within
areas with complex morphology, TLS might require
many station points to avoid occlusions, and the
whole survey could become time and cost demand-
ing. UAV photogrammetry requires mission planning
and flights design based on nadir and oblique camera
poses and a GNSS survey for the accurate positioning
of the GCPs and VPs. The whole procedure ensures
rapid execution of the survey; although, based on the
number of acquired images, the processing of the
data could be time-consuming. The execution costs
of survey based on the mentioned technologies could
vary largely and relies on logistic conditions, the size
of the area and the required degree of detail. Also,
they are connected to the productivity, the cost of the
skilled personnel/equipment and processing steps
(Bangen, Wheaton, Bouwes N., Bouwes B., &
EUROPEAN JOURNAL OF REMOTE SENSING 219

Jordan, 2014). The extent of surveyed surface and the
required detail in the reconstruction of quarry topo-
graphy play a fundamental role. Technologies based
on aerial surveys are less influenced by the increase in
the surveyed surface.
For small sites, the acquisition is simple and rapid;
the traditional methods have competitive costs and
are well suited. By increasing the surveyed area, the
technologies that are more productive (i.e. TLS,
UAV) become more convenient. For large area, the
UAV survey could become the most effective solu-
tion, being able to provide a reasonable accuracy for
quarry monitoring purposes under a wide range of
operative conditions. TLS surveys could provide an
even better accuracy in the surfaces reconstruction,
but the number of stations needed to represent the
whole structure could increase dramatically for large
extents. Under these conditions GNSS and total sta-
tion cannot be considered the best practices. Usually,
GNSS surveys for morphological reconstructions
refer to a real-time or post-processed kinematic sur-
vey. Detected paths can allow the identification of the
main geometry of a quarry or provide a more detailed
description (e.g. two points per square meter).
Similarly, total station can detect only the main geo-
metric features of the area, while higher numbers of
points require significant increases in the costs and
effort. An increasing in time required for surveying
the quarry environment could constitute an unfavor-
able circumstance.
During surveys, the mining activities have to be
totally or partially stopped, with additional costs
related to the potential loss of productivity and any
trouble in optimization of the machine activity. UAV
allows the survey of very large extent within one
working day and could become the most suitable
method when complex quarry environments have to
be reconstructed, with high point densities and in a
rapid and economically competitive way.
Conclusions
The analysis of UAV images by SfM approach con-
stitutes a reliable and validated tool for surveyors who
are interested in high-resolution reconstruction and
monitoring of quarries. The methodology is well sui-
ted for the definition of regular geometries and for
sudden changes of surfaces’ slope. The accuracy and
performance of UAV-SfM methodology make it
competitive with technologies used for this kind of
application. The rapid execution of the survey and
the few necessary observations on the ground make it
a suitable technique for manufacturing areas and
dangerous zones, where speed and safety of the per-
sonnel are essential requirements. The quality of the
SfM 3D models is influenced by the quality of the
images and the factors related to the mission
planning. Careful planning of the UAV trajectories
and the nadir and oblique image acquisitions with
some overflights and the survey of limited and accu-
rate GCPs have been all crucial for the success of the
whole survey.
This UAV-based photogrammetry with nadir and
oblique imagery provides a valuable tool for quarry
management by operators and for the monitoring of
mining activities on a regular basis. UAV surveys also
provide a useful tool for management of the environ-
mental risk of dangerous and inaccessible areas, and
they enhance the geotechnical interpretation of spa-
tially variable soil conditions with a reasonable mea-
sure of reliability. A permanent array of targets
deployed within the mined areas could strengthen
the repeatability of the resulting 3D model and rein-
force the analysis of mined volumes from compari-
sons of successive 3D models.
Disclosure statement
No potential conflict of interest was reported by theauthors.
Funding
Field test carried out within the PRIN 2010-2011 financedby the Italian Ministry of Education, University andResearch.
References
Agüera-Vega, F., Carvajal-Ramírez, F., & Martínez-Carricondo, P. (2016). Accuracy of digital surface mod-els and orthophotos derived from unmanned aerial vehi-cle photogrammetry. Journal of Surveying Engineering,04016025. doi:10.1061/(ASCE)SU.1943-5428.0000206
Bangen, S.G., Wheaton, J.M., Bouwes, N., Bouwes, B., &Jordan, C. (2014). A methodological intercomparison oftopographic survey techniques for characterizing wade-able streams and rivers. Geomorphology, 206, 343–361.doi:10.1016/j.geomorph.2013.10.010
Bryson, M., Johnson-Roberson, M., Murphy, R.J., &Bongiorno, D. (2013). Kite aerial photography for low-cost, ultra-high spatial resolution multi-spectral map-ping of intertidal landscapes. PLoS One, 8(9), e73550.doi:10.1371/journal.pone.0073550
Casella, E., Rovere, A., Pedroncini, A., Mucerino, L.,Casella, M., Cusati, L.A., . . . Firpo, M. (2014). Study ofwave run up using numerical models and low-altitudeaerial photogrammetry: A tool for coastal management.Estuarine, Coastal and Shelf Science, 149, 160–167.doi:10.1016/j.ecss.2014.08.012
Chen, J., Li, K., Chang, K.J., Sofia, G., & Tarolli, P. (2015).Open-pit mining geomorphic feature characterization.International Journal of Applied Earth Observation andGeoinformation, 42, 76–86. doi:10.1016/j.jag.2015.05.001
Clapuyt, F., Vanacker, V., & Van Oost, K. (2015).Reproducibility of UAV-based earth topography recon-structions based on structure-from-motion algorithms.Geomorphology, 260, 4–15. doi:10.1016/j.geomorph.2015.05.011
220 P. ROSSI ET AL.

Damigos, D., & Kaliampakos, D. (2003). Assessing thebenefits of reclaiming urban quarries: A CVM analysis.Landscape and Urban Planning, 64(4), 249–258.doi:10.1016/S0169-2046(02)00243-8
Eltner, A., Kaiser, A., Castillo, C., Rock, G., Neugirg, F., &Abellán, A. (2016). Image-based surface reconstructionin geomorphometry – Merits, limits and developments.Earth Surface Dynamics, 4(2), 359–389. doi:10.5194/esurf-4-359-2016
Fonstad, M.A., Dietrich, J.T., Courville, B.C., Jensen, J.L., &Carbonneau, P.E. (2013). Topographic structure frommotion: A new development in photogrammetric mea-surement. Earth Surface Processes and Landforms, 38(4),421–430. doi:10.1002/esp.v38.4
Furukawa, Y., & Ponce, J. (2010). Accurate, dense, androbust multiview stereopsis. IEEE Transactions onPattern Analysis and Machine Intelligence, 32(8), 1362–1376. doi:10.1109/TPAMI.2009.161
Harwin, S., Lucieer, A., & Osborn, J. (2015). The impact ofthe calibration method on the accuracy of point cloudsderived using unmanned aerial vehicle multi-viewstereopsis. Remote Sensing, 7(9), 11933–11953.doi:10.3390/rs70911933
Hirschmuller, H. (2008). Stereo processing by semiglobalmatching and mutual information. IEEE Transactions onPattern Analysis and Machine Intelligence, 30(2), 328–341. doi:10.1109/TPAMI.2007.1166
James, M.R., & Robson, S. (2012). Straightforward recon-struction of 3D surfaces and topography with a camera:Accuracy and geoscience application. Journal ofGeophysical Research: Earth Surface, 117(F03).doi:10.1029/2011JF002289
James, M.R., & Robson, S. (2014). Mitigating systematicerror in topographic models derived from UAV andground-based image networks. Earth Surface Processesand Landforms, 39(10), 1413–1420. doi:10.1002/esp.v39.10
James, M.R., Robson, S., d’Oleire-Oltmanns, S., &Niethammer, U. (2017). Optimising UAV topographicsurveys processed with structure-from-motion: Groundcontrol quality, quantity and bundle adjustment.Geomorphology, 280, 51–66. doi:10.1016/j.geomorph.2016.11.021
Lague, D., Brodu, N., & Leroux, J. (2013). Accurate 3Dcomparison of complex topography with terrestrial laser
scanner: Application to the Rangitikei canyon (NZ).ISPRS Journal of Photogrammetry and Remote Sensing,82, 10–26. doi:10.1016/j.isprsjprs.2013.04.009
Lowe, D.G. (2004). Distinctive image features from scale-invariant keypoints. International Journal of ComputerVision, 60(2), 91–110. doi:10.1023/B:VISI.0000029664.99615.94
Mancini, F., Dubbini, M., Gattelli, M., Stecchi, F., Fabbri,S., & Gabbianelli, G. (2013). Using unmanned aerialvehicles (UAV) for high-resolution reconstruction oftopography: The structure from motion approach oncoastal environments. Remote Sensing, 5(12), 6880–6898. doi:10.3390/rs5126880
McLeod, T., Samson, C., Labrie, M., Shehata, K., Mah, J.,Lai, P., & Elder, J.H. (2013). Using video acquired froman unmanned aerial vehicle (UAV) to measure fractureorientation in an open-pit mine. Geomatica, 67(3), 173–180. doi:10.5623/cig2013-036
Rothermel, M., & Haala, N. (2011, June 14-17). Potential ofdense matching for the generation of high quality digitalelevation models. In ISPRS Hannover 2011 WorkshopHigh-Resoultion Earth Imaging for GeospatialInformation, Hannover (pp. 331–343).
Rupnik, E., Nex, F., & Remondino, F. (2014). Obliquemulti-camera systems–orientation and dense matchingissues. The International Archives of Photogrammetry,Remote Sensing and Spatial InformationSciences, 40(3), 107. doi:10.5194/isprsarchives-XL-3-W1-107-2014
Shahbazi, M., Sohn, G., Théau, J., & Ménard, P. (2015).UAV-based point cloud generation for open-pit minemodelling. The International Archives ofPhotogrammetry, Remote Sensing and SpatialInformation Sciences, 40(1), 313. doi:10.5194/isprsarc-hives-XL-1-W4-313-2015
Snavely, N., Seitz, S.M., & Szeliski, R. (2006). Photo tour-ism: Exploring photo collections in 3D. ACMTransactions on Graphics, 25(3), 835–846. doi:10.1145/1141911
Tong, X., Liu, X., Chen, P., Liu, S., Luan, K., Li, L., . . .Hong, Z. (2015). Integration of UAV-based photogram-metry and terrestrial laser scanning for the three-dimen-sional mapping and monitoring of open-pit mine areas.Remote Sensing, 7(6), 6635–6662. doi:10.3390/rs70606635
EUROPEAN JOURNAL OF REMOTE SENSING 221