combining visualization and statistical analysis to...
TRANSCRIPT

Combining Visualization and Statistical Analysis to Improve OperatorConfidence and Efficiency for Failure Detection and Localization
Peter Bodı́k‡, Greg Friedman†, Lukas Biewald†, Helen Levine§, George Candea†, Kayur Patel†
Gilman Tolle‡, Jon Hui‡, Armando Fox†, Michael I. Jordan‡, David Patterson‡
‡UC Berkeley, †Stanford University, §Ebates.com
Abstract
Web applications suffer from software and configurationfaults that lower their availability. Recovering from failureis dominated by the time interval between when these faultsappear and when they are detected by site operators. We in-troduce a set of tools that augment the ability of operatorsto perceive the presence of failure: an automatic anomalydetector scours HTTP access logs to find changes in userbehavior that are indicative of site failures, and a visualizerhelps operators rapidly detect and diagnose problems. Vi-sualization addresses a key question of autonomic comput-ing of how to win operators’ confidence so that new toolswill be embraced. Evaluation performed using HTTP logsfrom Ebates.com demonstrates that these tools can enhancethe detection of failure as well as shorten detection time.Our approach is application-generic and can be applied toany Web application without the need for instrumentation.
1. Introduction
Web applications are becoming increasingly complexand hard to manage. In particular, non-failstop application-level faults that cause user-visible failures are hard to detectwithout special case checks, yet they have a first-order im-pact on the user’s experience that may result in temporaryor permanent site abandonment. As much as 75% of timespent recovering from these failures is spent just detectingthem [4]. Although a new focus on statistical anomaly de-tection and pattern recognition [10] promises to reduce themanual configuration and tuning required by current mon-itoring tools, statistical techniques invariably suffer fromfalse positives (and sometimes false negatives), reducing theoperator’s confidence in the monitoring system.
Rather than ignoring this fundamental trust issue andremoving the human from the loop, we believe a more
promising path is an operator-aware division of labor fordetecting such failures. To the computer we assign what thecomputer does best: statistical analysis of log data. For thehuman operator, we provide a tool to help bring her systemexperience and expertise to bear on interpreting and reactingto the alarms raised by the analysis engines; specifically, weprovide rich visualizations of traffic information that allowher to quickly spot the sources of potential problems and tocross-check the reports of the statistical analysis tools. Bytaking advantage of the fact that human beings are excel-lent performers at visual pattern recognition, visualizationhelps the operator interpret failure alarms and identify theirpossible causes as well as keeping the effective cost of falsealarms low by allowing her to rapidly identify them as such.
In determining what kind of analysis to perform onsite logs, we observe that the site’s end users are excel-lent “detectors” of site failures, in that their behavior typ-ically changes when they encounter a malfunction. For ex-ample, if the link from the /shopping cart page to the/checkout page is broken, users simply can’t reach the/checkout page. Similarly, if a particular page does notload or render properly, users might click “Reload” severaltimes to try to fix the problem. Since such behaviors arecaptured in HTTP logs, we can build statistical models ofnormal access patterns and then detect anomalies in userbehavior. Since HTTP logs are application-generic, our ap-proach can be applied to other Web applications withoutadditional instrumentation.
Contributions
We present a visualization tool that allows operators toquickly spot anomalies or possible problems on their site inreal time as well as confirm or investigate problem alarmsreported by automated detection systems. To illustrate thelatter ability, we apply some relatively well-known anomalydetection techniques to spot non-failstop failures in serverlogs from a real mid-sized Internet site Ebates.com; the ba-sic insight is to look for anomalous patterns in end-users’
Proceedings of the Second International Conference on Autonomic Computing (ICAC’05) 0-7695-2276-9/05 $ 20.00 IEEE
Authorized licensed use limited to: Drexel University. Downloaded on October 10, 2008 at 15:51 from IEEE Xplore. Restrictions apply.

behavior as possible indicators of a failure. The informationfrom these anomaly detectors is fed to the visualization tool,allowing the operator to visually inspect the anomaly in thecontext of previous and current traffic patterns and correlatethe anomaly-score information to the traffic timeline. Un-like traditional visualization systems whose structure oftenreflects the architecture of the system, our tool visualizesmetrics derived from users’ site-visit behavior, which thesite operators can more readily understand. We find that theuse of the combined visualization and analysis tools wouldhave allowed Ebates operators to detect and localize manyactual site problems hours or days earlier than they actuallydid.
We make the following specific contributions:
• We use information-rich visualization to address theproblem of operator trust in statistical learning algo-rithms. The synergy of visualization and automatic de-tection allows an operator to use human pattern match-ing to easily verify the warnings produced by our mon-itoring system.
• We monitor user behavior and automatically detectanomalies when the site is available but individ-ual applications or functionalities are beginning tofail. This allowed us to quickly detect and help lo-calize application-level failures from a real system:Ebates.com.
• Visualization of information was not based on systemsarchitecture, which is the norm, but on metrics basedon “black-box” user behavior. These user-orientedmetrics offer greater insight into the status of the siteand match our statistical algorithms. This match buildsthe trust relationship. Since our approach uses justHTTP logs to monitor user behavior, it can be usedwith any Web application.
Section 2 outlines our approach to combining visualiza-tion with automatic statistical anomaly detection. Section 3describes the details of the algorithms themselves, our ex-perimental setup and methodology, and evaluation metrics.Section 4 presents the results of applying our tools to realdatasets, concentrating on the relative strengths and weak-nesses of the different algorithms and the use of visualiza-tion to allow the operator to rapidly bring her experienceand judgment into play to resolve ambiguities in failure re-porting across the different algorithms. Section 5 discussessalient aspects of our results in light of our goal—helpingthe operator work more efficiently with automated detectiontechniques—and draws some tentative conclusions aboutimplications for continuing work in this area. We then re-view some related work, outline possible future directions,and conclude.
2. Approach: Combining Anomaly Detectionand Visualization
Our anomaly detection approach is relatively simple: wechose to look for abrupt changes in hit frequencies to thetop 40 pages (which cover about 98% of traffic at Ebates).Fundamentally, this problem involves learning a baseline ofhit frequencies, detecting deviations (anomalies) from thatbaseline, and determining the extent to which a “long lived”anomaly should influence the baseline (i.e., the sensitivitywith which the baseline itself shifts in response to recentand/or anomalous data). Furthermore, when an anomalousfrequency shift is detected, we need to localize the problem,i.e. determine which page(s) are most likely implicated ascausing the anomaly.
To perform this analysis we use two statistical meth-ods: Naive Bayes classification and the !2 (Chi-square)test. (The details of these algorithms are described in sec-tion 3). Other anomaly detection methods such as SupportVector Machines may perform better, but they don’t allowus to easily determine which pages are the most anomalous.On the other hand, both Naive Bayes and !2 allow us toquantify the anomaly for each page.
While these techniques are useful for their ability toidentify patterns in large amounts of data, as Hamming hassaid, “The purpose of computation is insight, not numbers.”We augment the tools with information visualization, “theuse of computer-supported, interactive, visual representa-tions of abstract nonphysically-based data to amplify cog-nition”, which has been shown to reduce the mental effortrequired to do search, recognition, and inference in connec-tion with problem solving (see the first chapter of [2] fornumerous examples).
The tool we built provides a compact and information-rich visual representation of: a) traffic to the 40 most re-quested pages, and b) transitions from and to these top 40pages in user sessions. Figure 1 shows a screenshot of themain visualization interface of the tool. Instead of simplyreporting detected anomaly at 3:25pm, the operatorcan immediately see the historic and current traffic patternsto confirm the anomaly. The tool also provides a simpleinterface for manual inspection of traffic patterns.
The emphasis on “live” interaction with the data distin-guishes visualization from static graphical presentation. Inour case, the operator can drill down on one of the visually-obvious traffic anomalies in Figure 1 to examine the page-transition rates during the anomalous interval, as shown inFigure 2.
The anomaly detection algorithms mentioned previouslyalso feed information to the visualization tool. As wewill describe, the algorithms report about once a minuteon whether anomalous behavior was detected during thatminute. To avoid bombarding the operator with alarms
Proceedings of the Second International Conference on Autonomic Computing (ICAC’05) 0-7695-2276-9/05 $ 20.00 IEEE
Authorized licensed use limited to: Drexel University. Downloaded on October 10, 2008 at 15:51 from IEEE Xplore. Restrictions apply.

Figure 1. An annotated screen shot of the visualization tool. (Note: if possible, figures 1, 2, and 3 should be viewed in color.)The horizontal axis is time in 5-minute intervals. Each horizontal bar represents the hit count to one of the 40 most-requested pages;the bottom bar counts hits to all other pages combined. A blue tile means the corresponding page received > 100 hits during that5-minute interval; green > 10 hits, yellow > 1 hit, white (no tile) zero hits. The graph on the top shows the corresponding anomalyscores. In this screenshot we clearly see two anomalies from data set 1: A (1:49pm to 1:58pm) and B (7:24pm to 9:05pm).
for anomalies that persist over several minutes, consecu-tive anomalies after the first are grouped into a single warn-ing. In addition, for each warning the tool reports the mostanomalous pages, as scored by the anomaly detection algo-rithms, and the change in transition rates to and from themost anomalous pages; this information may help the oper-ator localize the cause of the problem. For example, if theoperator clicks on the “Warnings” tab in Figure 1 after se-lecting the anomaly marked as B in the figure, the Warningpanel will display the following:
warning #2: detected on Sun Nov 16 19:27:00start: Sun Nov 16 19:24:00 PST 2003end: Sun Nov 16 21:05:00 PST 2003
anomaly score = 7.03
Most anomalous pages: anomaly score:/landing.jsp 19.55/landing_merchant.jsp 19.50/mall_ctrl.jsp 3.69
change in transitions FROM /landing.jsppage: before: after:/landing_merchant.jsp 37.13% 93.17%/mall_ctrl.jsp 21.85% 0.83%
Proceedings of the Second International Conference on Autonomic Computing (ICAC’05) 0-7695-2276-9/05 $ 20.00 IEEE
Authorized licensed use limited to: Drexel University. Downloaded on October 10, 2008 at 15:51 from IEEE Xplore. Restrictions apply.
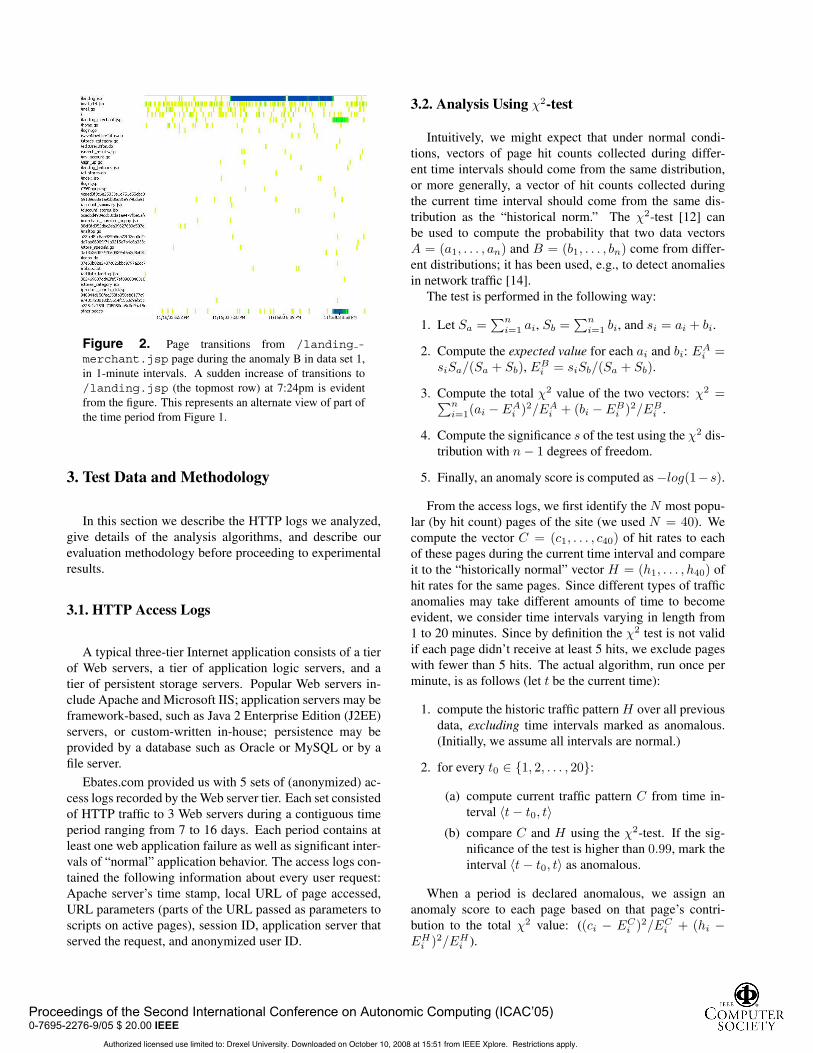
Figure 2. Page transitions from /landing -merchant.jsp page during the anomaly B in data set 1,in 1-minute intervals. A sudden increase of transitions to/landing.jsp (the topmost row) at 7:24pm is evidentfrom the figure. This represents an alternate view of part ofthe time period from Figure 1.
3. Test Data and Methodology
In this section we describe the HTTP logs we analyzed,give details of the analysis algorithms, and describe ourevaluation methodology before proceeding to experimentalresults.
3.1. HTTP Access Logs
A typical three-tier Internet application consists of a tierof Web servers, a tier of application logic servers, and atier of persistent storage servers. Popular Web servers in-clude Apache and Microsoft IIS; application servers may beframework-based, such as Java 2 Enterprise Edition (J2EE)servers, or custom-written in-house; persistence may beprovided by a database such as Oracle or MySQL or by afile server.
Ebates.com provided us with 5 sets of (anonymized) ac-cess logs recorded by the Web server tier. Each set consistedof HTTP traffic to 3 Web servers during a contiguous timeperiod ranging from 7 to 16 days. Each period contains atleast one web application failure as well as significant inter-vals of “normal” application behavior. The access logs con-tained the following information about every user request:Apache server’s time stamp, local URL of page accessed,URL parameters (parts of the URL passed as parameters toscripts on active pages), session ID, application server thatserved the request, and anonymized user ID.
3.2. Analysis Using !2-test
Intuitively, we might expect that under normal condi-tions, vectors of page hit counts collected during differ-ent time intervals should come from the same distribution,or more generally, a vector of hit counts collected duringthe current time interval should come from the same dis-tribution as the “historical norm.” The !2-test [12] canbe used to compute the probability that two data vectorsA = (a1, . . . , an) and B = (b1, . . . , bn) come from differ-ent distributions; it has been used, e.g., to detect anomaliesin network traffic [14].
The test is performed in the following way:
1. Let Sa =!n
i=1 ai, Sb =!n
i=1 bi, and si = ai + bi.
2. Compute the expected value for each ai and bi: EAi =
siSa/(Sa + Sb), EBi = siSb/(Sa + Sb).
3. Compute the total !2 value of the two vectors: !2 =!ni=1(ai ! EA
i )2/EAi + (bi ! EB
i )2/EBi .
4. Compute the significance s of the test using the !2 dis-tribution with n ! 1 degrees of freedom.
5. Finally, an anomaly score is computed as !log(1! s).
From the access logs, we first identify the N most popu-lar (by hit count) pages of the site (we used N = 40). Wecompute the vector C = (c1, . . . , c40) of hit rates to eachof these pages during the current time interval and compareit to the “historically normal” vector H = (h1, . . . , h40) ofhit rates for the same pages. Since different types of trafficanomalies may take different amounts of time to becomeevident, we consider time intervals varying in length from1 to 20 minutes. Since by definition the !2 test is not validif each page didn’t receive at least 5 hits, we exclude pageswith fewer than 5 hits. The actual algorithm, run once perminute, is as follows (let t be the current time):
1. compute the historic traffic pattern H over all previousdata, excluding time intervals marked as anomalous.(Initially, we assume all intervals are normal.)
2. for every t0 " {1, 2, . . . , 20}:
(a) compute current traffic pattern C from time in-terval #t ! t0, t$
(b) compare C and H using the !2-test. If the sig-nificance of the test is higher than 0.99, mark theinterval #t ! t0, t$ as anomalous.
When a period is declared anomalous, we assign ananomaly score to each page based on that page’s contri-bution to the total !2 value: ((ci ! EC
i )2/ECi + (hi !
EHi )2/EH
i ).
Proceedings of the Second International Conference on Autonomic Computing (ICAC’05) 0-7695-2276-9/05 $ 20.00 IEEE
Authorized licensed use limited to: Drexel University. Downloaded on October 10, 2008 at 15:51 from IEEE Xplore. Restrictions apply.

We also detect significant changes in page transitionsthat occurred when the anomaly started. We compare thetraffic before the anomaly (time interval #t0!t, t0$, where t0is the start of the anomaly) and during the anomaly (#t0, t1$,where t1 is current time). Thus, every minute of an anoma-lous traffic we compare the transitions to and from the top40 pages before and during the anomaly using the !2-test.
3.3. Analysis Using Naive Bayes Classifier
The second type of analysis involves training a NaiveBayes classifier [6] to detect anomalies. Again, we use theaccess logs to compute the hits per unit time to each of thetop N pages on the site, (c1, . . . , cN ), during the currenttime interval. The ci’s are normalized by dividing by the to-tal hit count during the interval so that they are in the rangeof 0 to 1. We also compute the combined hit frequency toall remaining pages on the site and the difference in total hitcount between the previous time period and the current one.By using the Naive Bayes model we make an (incorrect)simplifying assumption that all the 42 (=N +2) features areconditionally independent. However, Naive Bayes is veryoften successfully used in practice even though this theoret-ical requirement is rarely satisfied.
We divide time into 10-minute time intervals and use thisclassifier to determine whether the current time interval isnormal (S = s+) or anomalous (S = s!). The conditionalprobability of each feature fi given S = s+ is modeled bya Gaussian distribution whose mean µi and variance "2
i areestimated for each feature using maximum-likelihood esti-mation from the previous time intervals.
If we knew a priori which time intervals were anomalousand which were normal (in the parlance of machine learn-ing, if we had labeled data), it would be trivial to calculatethe mean and variance of p(fj |S = s+) and p(fj |S = s!)using maximum likelihood estimation (MLE). However, asis typical for real systems, our data is unlabeled (i.e. wedon’t know which periods are anomalous) so we have todo unsupervised learning. In the absence of labeled exam-ples of s!, we choose to model the conditional probabilityp(fj |S = s!) using a uniform distribution over the range ofpossible values (i.e., 0 to 1).
The standard approach of using Expectation Maximiza-tion (EM) to simultaneously learn the value of s and p(f |s)is too slow for real-time use on high-volume data, so weapproximate it with two separate methods:
• Unweighted learning (Eager NB): We estimate µi and"2
i with the assumption that every previous time inter-val is normal, i.e. we “label” every previous intervalas S = s+. This is a reasonable first-order assump-tion as long as the majority of states are in fact normal,in other words, as long as failures are rare. However,if an anomaly occurs and persists, this technique will
quickly “adjust” to the anomaly by treating it as nor-mal. We therefore call this an “eager” learner.
• Probabilistically-weighted learning (Careful NB): Inestimating µi and "2
i , we weight each past time in-terval by the probability that it is normal. Thus, themore anomalous a time interval appears, the less itis incorporated into the model of normal behavior.This method will continue to detect an anomaly evenwhen it persists for a long time, but if the long-lived“anomaly” is in fact a new steady state, it will takelonger for this method to adjust to it. We therefore callthis a “careful” learner.
In our Naive Bayes approach, we don’t learn the prior prob-abilities of normal and anomalous time intervals. Instead,we use the priors as a parameter that trades off between alow false positive rate (for low Prob(anomalous)) and ahigh anomaly detection rate (for high Prob(anomalous)).
The classifier reports an anomaly score for each time pe-riod; this score is calculated as !log(Prob(f |normal))/n,where n is the number of features used. To local-ize the most likely features that caused the anomaly,we assign an anomaly score to each feature fi as!log(Prob(fi|normal)).
Note that in many cases, the judgment of whether a long-lived anomaly is in fact a new steady state may require oper-ator intervention. Therefore, rather than trying to automati-cally determine this, we allow the operator to visualize boththe raw data and the anomaly scores over time reported byeach algorithm.
3.4. Methodology
The logs we received were collected in the past, and thefailure incidents reflected in them had already been diag-nosed and dealt with. Our methodology therefore consistedof the following steps:
1. With little or no knowledge of what events occurred ina data set, run our detection algorithms. For each dataset, the models were initialized as untrained at the be-ginning of the data set and learned in an online fashion.
2. For each anomalous period (and some normal regionsas well), examine the traffic patterns during that pe-riod using our visualization tool in conjunction withthe graphs of anomaly scores reported by our anomalydetectors.
3. Use the visualizations and graphs to discuss each re-ported incident with the CTO and operations engineersat Ebates to reconstruct “what really happened” duringthat incident as completely as possible.
Proceedings of the Second International Conference on Autonomic Computing (ICAC’05) 0-7695-2276-9/05 $ 20.00 IEEE
Authorized licensed use limited to: Drexel University. Downloaded on October 10, 2008 at 15:51 from IEEE Xplore. Restrictions apply.

4. Based on these discussions, classify each reportedanomaly as either a true positive, a false positive(clearly attributable to a non-fault event, such as afailure-free update to the Web site), or a possible falsepositive (one we could not attribute to an event, ormore often, that we could attribute but we could notunambiguously determine whether or not the associ-ated event was a failure).
5. Based on these discussions, determine how muchsooner a site failure could have been detected or pre-vented had our tools been in place at the time of theincident.
3.5. Evaluation Metrics
Traditionally, failure detection is evaluated in terms ofprecision and time-to-detection. Precision is defined as truepositives divided by all positives, i.e., TP/(TP + FP ),where true positives are the number of actual failures de-tected and false positives the number of identified eventsthat are not failures. However, in dealing with real datafrom a complex service, these metrics are problematic.
First, part of the motivation behind our work is preciselythat existing detection techniques do not detect certain kindsof fail-stop failures. Hence, in cross-checking our resultsagainst the best knowledge available to the operations staff,we do not have 100% certainty that the list of known failuresis exhaustive. Second, some false positives are attributedto non-fault events that result in a change in user behavior,or events that cause bona fide performance anomalies thatare nonfatal under moderate load (for example) but lead touser-visible failure under heavier load. To be conservative,we count such incidents as “false positives” in our evalu-ation. Finally, the notion of “time to detect” presupposesthat there exists an instant in time before which there wasno failure and after which there was unambiguously a fail-ure. For non-failstop failures, especially those that mani-fest only under increased load, it is unclear how to choosethis moment. Furthermore, even if we could assume thatthe time of fault occurrence was well-defined, we lack theground-truth knowledge to establish conclusively what thattime was.
The information we do have includes the time a par-ticular failure was in fact detected by existing techniques(whether automatically or manually by Ebates staff) andthe ostensible cause of the failure (localization information)as determined by Ebates staff. When we measure true andfalse positives, then, we assume the best case corresponds todetecting all failures detected by Ebates staff and misclassi-fying no other events. We also measure advance warning—the amount of extra reaction time the staff would have hadbecause our tool identified a potential failure before the staffdid, and whether this advance warning might have helped
mitigate or avoid a failure. Finally, we ask the question:had the staff been given the localization information pro-vided by our algorithms, how useful would it have been inidentifying the cause of the failure? In our measurementswe report the qualitative answer, on a scale of 1 (not useful)to 10 (vitally useful) given by Ebates staff. (We did not col-lect localization score data on one of our algorithms, EagerNB.)
4. Discussion of Results for Each Data Set
In this section we discuss the results of combininganomaly detection and visualization on each of the datasetswe examined. We then summarize the overall performanceof our techniques, paying particular attention to the differ-ences in each algorithm’s ability to detect particular fail-ures, the role of visualization in helping the operator sortout “what really happened”, and the implication for com-bining both types of operator information.
4.1. Data Set 1: Account Page
The major problem that occurred during this week wasa site slowdown (and then crash) caused by the accountpage. The bad account page had existed for a long time,but this time period saw a larger-than-ever hit rate to thepage as customers logged in to check their accounts follow-ing a quarterly mailing of rebate checks to customers. Theproblem was first detected by Ebates on Monday (Day 3 ofthe data set) at approximately 6:23am, diagnosed by Ebatesat approximately 12 noon, and the offending page removedat about 12:30pm. The problem reappeared on Day 4 from5:38am to 7:13am as Ebates staff tried putting the page backup, but took it down again. On Day 6 starting about 8pm,there was massive quality assurance of this page against 2servers on the live site to confirm the fix. The fix was ver-ified on Day 6 at 11:21pm. Given this chronology recon-structed from Ebates’ information, we now compare it withthe behavior of our algorithms.
Day 2. We detected a mid-size anomaly (A) on Day 2at 1:49pm and a significant anomaly (B) on the same dayfrom 7:24pm until 9:05pm, centered around two pages notdirectly related to account activity. The number of hitsto these pages increased from less than 5 every minute toabout 50 hits a minute. Anomaly B can be seen on Fig-ure 1. After zooming in on this anomaly and switchingto the transitions view (Figure 2), we can see a significantchange in the pattern of pages an HTTP session visits im-mediately after visiting /landing merchant.jsp. Thiscan be potentially very important information for the opera-tor. We later learned that these two anomalies correspondedto database alarms raised by Ebates’ database monitoringsystem as a result of a quarterly batch job that placed a
Proceedings of the Second International Conference on Autonomic Computing (ICAC’05) 0-7695-2276-9/05 $ 20.00 IEEE
Authorized licensed use limited to: Drexel University. Downloaded on October 10, 2008 at 15:51 from IEEE Xplore. Restrictions apply.
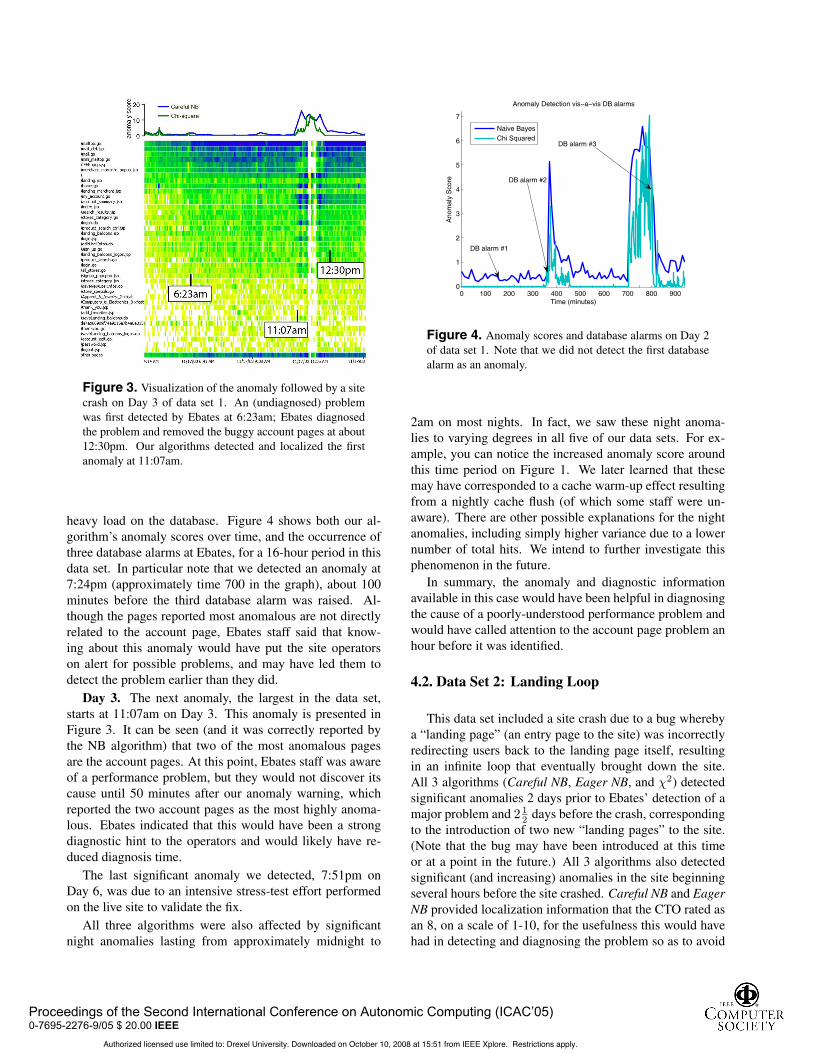
Figure 3. Visualization of the anomaly followed by a sitecrash on Day 3 of data set 1. An (undiagnosed) problemwas first detected by Ebates at 6:23am; Ebates diagnosedthe problem and removed the buggy account pages at about12:30pm. Our algorithms detected and localized the firstanomaly at 11:07am.
heavy load on the database. Figure 4 shows both our al-gorithm’s anomaly scores over time, and the occurrence ofthree database alarms at Ebates, for a 16-hour period in thisdata set. In particular note that we detected an anomaly at7:24pm (approximately time 700 in the graph), about 100minutes before the third database alarm was raised. Al-though the pages reported most anomalous are not directlyrelated to the account page, Ebates staff said that know-ing about this anomaly would have put the site operatorson alert for possible problems, and may have led them todetect the problem earlier than they did.
Day 3. The next anomaly, the largest in the data set,starts at 11:07am on Day 3. This anomaly is presented inFigure 3. It can be seen (and it was correctly reported bythe NB algorithm) that two of the most anomalous pagesare the account pages. At this point, Ebates staff was awareof a performance problem, but they would not discover itscause until 50 minutes after our anomaly warning, whichreported the two account pages as the most highly anoma-lous. Ebates indicated that this would have been a strongdiagnostic hint to the operators and would likely have re-duced diagnosis time.
The last significant anomaly we detected, 7:51pm onDay 6, was due to an intensive stress-test effort performedon the live site to validate the fix.
All three algorithms were also affected by significantnight anomalies lasting from approximately midnight to
0 100 200 300 400 500 600 700 800 9000
1
2
3
4
5
6
7
Anomaly Detection vis!a!vis DB alarms
Time (minutes)
Ano
mal
y S
core
Naive BayesChi Squared
DB alarm #1
DB alarm #2
DB alarm #3
Figure 4. Anomaly scores and database alarms on Day 2of data set 1. Note that we did not detect the first databasealarm as an anomaly.
2am on most nights. In fact, we saw these night anoma-lies to varying degrees in all five of our data sets. For ex-ample, you can notice the increased anomaly score aroundthis time period on Figure 1. We later learned that thesemay have corresponded to a cache warm-up effect resultingfrom a nightly cache flush (of which some staff were un-aware). There are other possible explanations for the nightanomalies, including simply higher variance due to a lowernumber of total hits. We intend to further investigate thisphenomenon in the future.
In summary, the anomaly and diagnostic informationavailable in this case would have been helpful in diagnosingthe cause of a poorly-understood performance problem andwould have called attention to the account page problem anhour before it was identified.
4.2. Data Set 2: Landing Loop
This data set included a site crash due to a bug wherebya “landing page” (an entry page to the site) was incorrectlyredirecting users back to the landing page itself, resultingin an infinite loop that eventually brought down the site.All 3 algorithms (Careful NB, Eager NB, and !2) detectedsignificant anomalies 2 days prior to Ebates’ detection of amajor problem and 2 1
2 days before the crash, correspondingto the introduction of two new “landing pages” to the site.(Note that the bug may have been introduced at this timeor at a point in the future.) All 3 algorithms also detectedsignificant (and increasing) anomalies in the site beginningseveral hours before the site crashed. Careful NB and EagerNB provided localization information that the CTO rated asan 8, on a scale of 1-10, for the usefulness this would havehad in detecting and diagnosing the problem so as to avoid
Proceedings of the Second International Conference on Autonomic Computing (ICAC’05) 0-7695-2276-9/05 $ 20.00 IEEE
Authorized licensed use limited to: Drexel University. Downloaded on October 10, 2008 at 15:51 from IEEE Xplore. Restrictions apply.

7/24 7/25 7/26 7/27 7/28 7/29 7/30 7/31
0
0.1
0.2
0.3
0.4
0.5
0.6
0.7
0.8
0.9
1
Time
Ano
mal
y S
core
(R
elat
ive)
Normal StateUnknown StateError StateCareful NB
"landing" pages introduced
"landing looping"begins
site crashes
site back up, problem fixed
Figure 5. Anomaly scores over time for Careful NB ondata set 2, “Landing Loop”. The time period from the in-troduction of the landing pages until Ebates’ detection ofthe landing loop problem is marked as an unknown sys-tem state, since we haven’t been able to determine with100% certainty whether this time period was problematicfor Ebates or not.
the crash. !2 had one (possible) false positive: the earlydetection 2 1
2 days before the crash. Eager NB and CarefulNB each had two (possible) false positives. According to theCTO, even if the initial detection 2 1
2 days before the crashdid not represent the onset of the major bug, the warning andlocalization information provided at that time would havebeen very helpful in diagnosing the problem when the majorfailure did start to occur.
Figure 5, which shows the anomaly scores over time forCareful NB for this data set, illustrates the effect of care-ful learning. At the introduction of the problematic pages,Careful NB detects a significant change in the distributionof the traffic to the site. Because this raises the anomalyscore significantly, Careful NB weights this time period ex-tremely low in incorporating it into its model of “normal”.Traffic characteristics to which Careful NB is sensitive re-main anomalous for the next two days, so Careful NB isvery slow to decide that this is in fact “normal” behavior. Incontrast, as shown in Figure 6 (which represents data set 3),the “eager learner” Eager NB quickly concludes that a newand different traffic pattern is no longer anomalous, due itsassumption that the behavior of all previous time periodsshould contribute equally to the profile of “normal” behav-ior. The third algorithm, !2 (shown in Figure 7 for data set5), works by detecting changes in traffic patterns over rela-tively short time periods, and therefore exhibits much morebimodal behavior than Careful NB.
10/7 10/9 10/11 10/13 10/15 10/170
2
4
6
8
10
12
14
16
18Data Set 3 Anomaly Scores: Eager NB vs. Careful NB
Date
Ano
mal
y S
core
Careful NBEager NB
Problembegins
Problemfixed
Figure 6. Whereas “careful learner” Careful NB contin-ues to detect the broken signup page anomaly (data set 3)for all 7 days, “eager learner” Eager NB quickly decidesthat this new behavior is normal.
4.3. Data Set 3: Broken Signup
This data set does not contain a crash, but rather an in-complete deployment of a “new user sign up” page whichhad gone undetected by Ebates operators. Served to newusers for over a week, this page displayed a blank page withan error on it instead of the expected site content, renderingit impossible for new users to come to the site. The problemdid not affect existing users.
Careful NB and !2 detected the introduction of the prob-lem 7 days before Ebates’ diagnosis. (Eager NB detectedan anomaly at this time too, but it was close to its noisethreshold, so we do not count this as a detection for EagerNB.) Careful NB provided localization information at prob-lem introduction time, and during the entire 7 day anomaly,that Ebates said would have been extremely helpful in lo-calizing the problem. Because of the length of the anomaly,Eager NB and !2 began to view the anomalous period asnormal, but Careful NB (the “careful learner”) continuedto report an anomaly for the entire 7 days, as seen in Fig-ure 6. This is another example of a case in which the op-erator’s understanding of the system would help resolve theambiguous result of applying algorithms that are sensitiveto different timescales.
4.4. Data Set 4: Badly Optimized Page Bug
In data set 4, a new page that invoked an inefficientdatabase query caused a site crash when its hit rate in-creased as a result of a large email campaign. The resultingdatabase overload subsequently led to site failure. CarefulNB and Eager NB detected the anomaly 4.5 hours before
Proceedings of the Second International Conference on Autonomic Computing (ICAC’05) 0-7695-2276-9/05 $ 20.00 IEEE
Authorized licensed use limited to: Drexel University. Downloaded on October 10, 2008 at 15:51 from IEEE Xplore. Restrictions apply.

1 2 3 4 5 6 7 8 9 10 11 12 13 14 15 16
0
0.1
0.2
0.3
0.4
0.5
0.6
0.7
0.8
0.9
1
Day
Rel
ativ
e A
nom
aly
Sco
re!2 anomaly scores over data set 5
Normal StateUnknown StateError State
!2
Figure 7. Anomaly scores over time for !2 on data set5, “Bad URL and Runaway Query”. The major failures oc-cured on days 4 and 10.
the crash (3 hours before Ebates staff detected the prob-lem). The anomaly level was initially low, increasing as theproblem escalated. !2 detected the problem 3 minutes afterEbates staff detected the problem. Ebates staff believe theycould have avoided the crash if they had had the anomalylocalization information provided by Careful NB.
4.5. Data Set 5: Bad URL and Runaway Query
Data set 5 contained 2 significant failures. The first fail-ure due to a configuration error in which the ’shopping url’for one of Ebates’ merchants was inadvertently mapped toa popular search engine site. All Ebates users who followedthat link were instead sent back to Ebates where shoppingsessions were generated continuously and in rapid succes-sion until the site crashed.
!2 detected this failure 5.5 hours before Ebates could di-agnose the problem. Both NB algorithms detected the prob-lem at the same time, but the anomaly scores were withinthe noise level, so we don’t count this in our results as a de-tection for the NB algorithms. However, once again Ebatesstaff said the localization information provided by the NBalgorithms would have been a tremendous diagnostic aid.
The second significant failure was a runaway query caus-ing significant database performance problems. All threealgorithms detected this failure concurrently with Ebates’detection. Figure 7 illustrates the !2 algorithm’s behaviorover this data set.
4.6. Summary of Results
Table 1 summarizes the overall results of our analysis.For five of the six major faults in our log data, at least one
Table 1. Summary of our results over all 5 data sets. Formajor faults, !2 had a higher detection rate and fewer falsepositives than Careful NB or Eager NB, but Careful NB pro-vided more useful diagnostic information.
Major fault Careful NB Eager NB !2
Faults Detected 5/6 4/6 6/6Known FP’s 1 1 1Possible FP’s 3 3 2Detection rate 83% 67% 100%Precision 56-83% 50-80% 67-86%Local. score 8.6/10 n/a 4/10
Minor faults Careful NB Eager NB !2
Faults detected 4/7 4/7 4/7Known FP’s 3 3 0Possible FP’s 5 4 2Detection rate 57% 57% 57%Precision 33-57% 36-57% 67-100%
of the algorithms detected the problem as well as provideduseful localization information prior to Ebates being able todiagnose the problem; the sixth was detected concurrentlywith its occurrence. Our algorithms performed less well onthe seven minor faults (four database alarms, one brief out-age associated with a code push, one brief re-introductionof a buggy page, and one massive QA effort on the live siteto verify a fix). Of the three missed faults (false negatives),two were database alarms that may not have had any dis-cernible impact on users and the third was a brief introduc-tion and then removal of a buggy page. The three knownfalse positives were all failure-free code updates to the ap-plication. Note that we did not consider the predictablenightly anomalies as false positives, since they were eas-ily filtered out by time. We did not perform localization oradvance-warning analysis on the minor faults.
Table 2 summarizes our results broken down by data set.For each data set we show number of major and minor faultsdetected (out of the total number of total major and minorfaults respectively); number of known false positives andpossible false positives; the advance warning time (AWT)for major faults, i.e. how long from the time our algorithmsdetected an anomaly until Ebates’ initial localization of therelated fault; and the localization score, the usefulness of di-agnostic information as estimated by Ebates staff on a scaleof 1 to 10, lowest to highest, for the major faults. In dataset 2 we are not certain whether if that detection representsthe actual onset of the problem (see section 4.2); if not, thedetection in this data set was approximately concurrent withEbates’ detection.
Proceedings of the Second International Conference on Autonomic Computing (ICAC’05) 0-7695-2276-9/05 $ 20.00 IEEE
Authorized licensed use limited to: Drexel University. Downloaded on October 10, 2008 at 15:51 from IEEE Xplore. Restrictions apply.

Table 2. Performance by data set, using !2 for detectionand Careful NB for localization.
Measure DS1 DS2 DS3 DS4 DS5 Total
Major faults 1/1 1/1 1/1 1/1 2/2 6/6Minor faults 3/5 0/0 1/1 0/0 0/1 4/7Known FP’s 0 0 1 0 0 1Possible FP’s 0 1 1 1 1 4AWT 1h 50h? 7d 0m 5.5h,0m avg: 37hLocal. score 8 8 9 10 8 avg: 8.6
5. Discussion: Role of the Operator
5.1. Classifying False Positives
In our experience, support from operations staff is essen-tial for asserting the ground truth of a warning system. Inour case, we needed their help to interpret the failure dataand verify the conclusions of our anomaly detectors; butin general, dealing with false positives may require opera-tor intervention, since the operator(s) may be best qualifiedto determine whether an anomaly, transient or long-lived,is a true problem or a false alarm. Figure 8 illustrates thetradeoff between early detection and false positives: the in-troduction of a new and bug-free “Father’s Day” page tothe site caused both Careful NB and Eager NB to declarean anomaly; Careful NB took 9 hours to decide that thisnew page was not problematic, while Eager NB reached thisconclusion in only 90 minutes. Similarly, an anomaly wedetected several hours before the anomalous pages causeda site crash might be dismissed by the operator since at thetime Ebates had just sent emails to all its customers, stimu-lating increased site activity; but if anomalous behavior per-sisted, the operator might realize that the localization infor-mation could help drill down on the problem and determineif there was really cause for concern.
5.2. Detecting Different Types of Anomalies
Naive Bayes and !2 respond to different kinds ofchanges in traffic patterns and are useful for complemen-tary tasks. Naive Bayes is sensitive to increases in fre-quency to infrequent pages. Consider a page that normallyaccounts for only 0.1% of hits to the site with variance0.01%: since Naive Bayes models each page’s hit frequencyas a Gaussian distribution, an increase in that page to, say,5% of page hits is modeled as extremely improbable. Inour datasets many failures were related to bugs in relativelyinfrequently-accessed pages, which made NB an effectivediagnostic tool.
In contrast, the !2 test is robust to changes in hit countsto unpopular pages, in part because the validity of the test
0 1 2 3 4 5 6 7 8 9 10 11 120
1
2
3
4
5
6False positive behavior: Careful vs. Eager NB
Elapsed Time (Hours)
Ano
mal
y S
core
Careful NBEager NB
Father’s Daypage put up
Eager NB "recovers"
Careful NB "recovers"
Figure 8. Differing behavior of Careful vs. Eager learn-ing in handling false positives. Careful NB takes 9 hours to”recover” from the false positive, while Eager NB reocoversin about 90 minutes.
requires excluding any page not receiving at least five hitsin a given time interval. This results in !2 being more sen-sitive to increases and decreases in frequent pages, but lessuseful for precise localization: its bias toward frequently-accessed pages often caused it to report those pages as themost anomalous, but that is not useful since frequently-accessed pages are generally going to be affected at somepoint by most failures anyway. For this reason, the sum-mary of per-dataset results reported in Table 2 rely on !2 fordetection and Naive Bayes with probabilistically-weightedlearning (Careful NB) for localization.
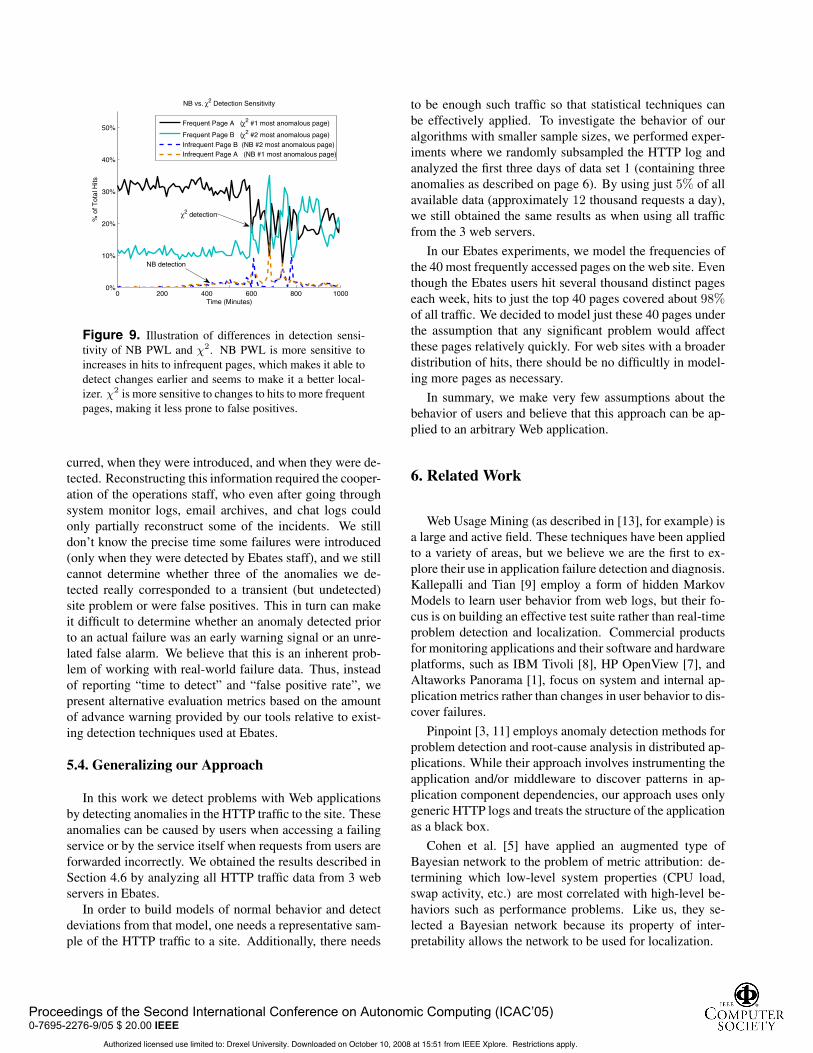
The difference in behavior between the techniques canbe seen in Figure 9, which represents data set 4. NB is ableto detect this anomaly 3 hours before !2, because it detectsan increase in hits to very infrequent pages. These pagescontinue to increase in frequency, and 3 hours later they endup having a major deleterious effect on the site. This causeschanges in hits to highly frequent pages, which !2 then de-tects. Thus, the determination of which algorithm detectedthe anomaly tells the operator something about the nature ofthe anomaly, and with experience, an operator could learnto recognize “patterns” such as this one, in which detectionby one algorithm is later followed by detection by another.Again, our contribution is the pervasive use of visualizationto take advantage of the operator’s experience with and un-derstanding of the system as well as her ability to rapidlyabsorb visually-presented information.
5.3. Reconstructing the Ground Truth
To precisely compute the accuracy, time to detect, andfalse positive/false negative rates of our techniques, we needto know the “ground truth” of exactly what problems oc-
Proceedings of the Second International Conference on Autonomic Computing (ICAC’05) 0-7695-2276-9/05 $ 20.00 IEEE
Authorized licensed use limited to: Drexel University. Downloaded on October 10, 2008 at 15:51 from IEEE Xplore. Restrictions apply.
0 200 400 600 800 10000%
10%
20%
30%
40%
50%
NB vs. !2 Detection Sensitivity
Time (Minutes)
% o
f Tot
al H
its
Frequent Page A (!2 #1 most anomalous page)
Frequent Page B (!2 #2 most anomalous page)Infrequent Page B (NB #2 most anomalous page)Infrequent Page A (NB #1 most anomalous page)
NB detection
!2 detection
Figure 9. Illustration of differences in detection sensi-tivity of NB PWL and !2. NB PWL is more sensitive toincreases in hits to infrequent pages, which makes it able todetect changes earlier and seems to make it a better local-izer. !2 is more sensitive to changes to hits to more frequentpages, making it less prone to false positives.
curred, when they were introduced, and when they were de-tected. Reconstructing this information required the cooper-ation of the operations staff, who even after going throughsystem monitor logs, email archives, and chat logs couldonly partially reconstruct some of the incidents. We stilldon’t know the precise time some failures were introduced(only when they were detected by Ebates staff), and we stillcannot determine whether three of the anomalies we de-tected really corresponded to a transient (but undetected)site problem or were false positives. This in turn can makeit difficult to determine whether an anomaly detected priorto an actual failure was an early warning signal or an unre-lated false alarm. We believe that this is an inherent prob-lem of working with real-world failure data. Thus, insteadof reporting “time to detect” and “false positive rate”, wepresent alternative evaluation metrics based on the amountof advance warning provided by our tools relative to exist-ing detection techniques used at Ebates.
5.4. Generalizing our Approach
In this work we detect problems with Web applicationsby detecting anomalies in the HTTP traffic to the site. Theseanomalies can be caused by users when accessing a failingservice or by the service itself when requests from users areforwarded incorrectly. We obtained the results described inSection 4.6 by analyzing all HTTP traffic data from 3 webservers in Ebates.
In order to build models of normal behavior and detectdeviations from that model, one needs a representative sam-ple of the HTTP traffic to a site. Additionally, there needs
to be enough such traffic so that statistical techniques canbe effectively applied. To investigate the behavior of ouralgorithms with smaller sample sizes, we performed exper-iments where we randomly subsampled the HTTP log andanalyzed the first three days of data set 1 (containing threeanomalies as described on page 6). By using just 5% of allavailable data (approximately 12 thousand requests a day),we still obtained the same results as when using all trafficfrom the 3 web servers.
In our Ebates experiments, we model the frequencies ofthe 40 most frequently accessed pages on the web site. Eventhough the Ebates users hit several thousand distinct pageseach week, hits to just the top 40 pages covered about 98%of all traffic. We decided to model just these 40 pages underthe assumption that any significant problem would affectthese pages relatively quickly. For web sites with a broaderdistribution of hits, there should be no difficultly in model-ing more pages as necessary.
In summary, we make very few assumptions about thebehavior of users and believe that this approach can be ap-plied to an arbitrary Web application.
6. Related Work
Web Usage Mining (as described in [13], for example) isa large and active field. These techniques have been appliedto a variety of areas, but we believe we are the first to ex-plore their use in application failure detection and diagnosis.Kallepalli and Tian [9] employ a form of hidden MarkovModels to learn user behavior from web logs, but their fo-cus is on building an effective test suite rather than real-timeproblem detection and localization. Commercial productsfor monitoring applications and their software and hardwareplatforms, such as IBM Tivoli [8], HP OpenView [7], andAltaworks Panorama [1], focus on system and internal ap-plication metrics rather than changes in user behavior to dis-cover failures.
Pinpoint [3, 11] employs anomaly detection methods forproblem detection and root-cause analysis in distributed ap-plications. While their approach involves instrumenting theapplication and/or middleware to discover patterns in ap-plication component dependencies, our approach uses onlygeneric HTTP logs and treats the structure of the applicationas a black box.
Cohen et al. [5] have applied an augmented type ofBayesian network to the problem of metric attribution: de-termining which low-level system properties (CPU load,swap activity, etc.) are most correlated with high-level be-haviors such as performance problems. Like us, they se-lected a Bayesian network because its property of inter-pretability allows the network to be used for localization.
Proceedings of the Second International Conference on Autonomic Computing (ICAC’05) 0-7695-2276-9/05 $ 20.00 IEEE
Authorized licensed use limited to: Drexel University. Downloaded on October 10, 2008 at 15:51 from IEEE Xplore. Restrictions apply.
7. Future Work
Ebates has expressed interest in deploying our visualiza-tion tools on live data and in working with us to develop abetter “ground truth” for evaluation. However, our experi-ence suggests that a 100% accurate ground truth might beunrealistic, so we are in the process of obtaining similar datasets from two other companies to repeat our experiments.
We want to incorporate real-time feedback from the op-erator into our models and produce more informed warn-ings. For example, if the current long-term anomaly rep-resents a normal behavior, the operator should be able tospecify that this is actually the new normal behavior. Onthe other hand, if the recent anomaly represented a normalbehavior (e.g., page update), we shouldn’t report a warn-ing the next time a similar anomaly appears. Also, we arecurrently extending our models of web traffic to capture thecorrelations between the frequencies of pages.
8. Conclusion
Notwithstanding the promise of statistical analysis tech-niques for detecting and localizing Internet service fail-ures, the judgment of experienced operators can help dis-ambiguate conflicting warnings, resolve apparently spuri-ous warnings, and interpret problems flagged by such al-gorithms. We showed that visualization combined withanomaly detection and localization can help human opera-tors bring their expertise and experience more efficiently tobear on such problems, reducing detection time, diagnosticeffort, and the cost of classifying false positives.
In particular we detected anomalies in user traffic to areal mid-sized Internet site using Naive Bayes and the !2-test. Our techniques detected four out of six failures morequickly than the site’s staff, and the visualization helped tounderstand the types and sources of anomalies reported bythe algorithms.
There is a critical synergy between visualization and au-tomatic detection from the perspective of the autonomiccomputing. Many traditional visualization tools are basedon the organization of the system. In contrast, our toolspresent information in a format that is useful to operators,helping them monitor their system and allowing them torapidly decide whether the visualization tool works and ishelpful. From that foundation of trust, we then automati-cally point to behaviors at certain times that we think aresuspicious using that same visualization format. The opera-tors can then quickly decide whether or not these warningsare useful.
Without a visualization tool, we believe it would havetaken scores of warnings for each operator to decidewhether or not he or she trusted the tool. Since the detectorand visualizer use the same metric, it makes it much easier
and faster for the operator to decide whether the warning isa false positive. False positives thus become much cheaper;they are either significant behavior changes that operatorsmay want to know about anyway, or they can be easily fil-tered out manually and visually. Since visual checking isquick, we may be able to afford a higher false positive ratein practice.
Acknowledgments
We would like to thank Mike Chen, Mark Verber, andEmre Kıcıman for their valuable insights and help with thispaper. We also thank Alessandro Isolani, CEO of Ebates,for allowing us to use sanitized web log data.
References
[1] Altaworks, Altaworks Panorama. http://www.altaworks.-com/solutionsPanorama.htm.
[2] S. K. Card, J. D. Mackinlay, and B. Shneiderman. Readingsin Information Visualization: Using Vision To Think. Mor-gan Kaumann, San Francisco, CA, 1999.
[3] M. Chen, E. Kıcıman, E. Fratkin, A. Fox, and E. Brewer.Pinpoint: Problem determination in large, dynamic internetservices. DSN 2002.
[4] M. Y. Chen, A. Accardi, E. Kıcıman, D. Patterson, A. Fox,and E. A. Brewer. Path-based failure and evolution manage-ment. In NSDI, pages 309–322, 2004.
[5] I. Cohen, J. S. Chase, M. Goldszmidt, T. Kelly, andJ. Symons. Correlating instrumentation data to systemstates: A building block for automated diagnosis and con-trol. In 6th USENIX Symposium on Operating Systems De-sign and Implementation, San Francisco, CA, Dec 2004.
[6] E. Eskin. Anomaly detection over noisy data using learnedprobability distributions. In Proceedings of the InternationalConference on Machine Learning, pages 255–262, 2000.
[7] Hewlett Packard Corporation, HP OpenView Software.http://www.openview.hp.com.
[8] IBM Corporation, IBM Tivoli Software. http://www.ibm.-com/software/tivoli.
[9] C. Kallepalli and J. Tian. Measuring and modeling usageand reliability for statistical web testing. IEEE Transactionson Software Engineering, 27:1023–1036, 2001.
[10] J. O. Kephart and D. M. Chess. The vision of autonomiccomputing. IEEE Computer, 36(1):41–50, 2003.
[11] E. Kıcıman and A. Fox. Detecting application-level fail-ures in component-based internet services. Technical report,Stanford, 2004.
[12] G. W. Snedecor and W. G. Cochran. Statistical methods.Eighth Edition, Iowa State University Press, 1989.
[13] J. Srivastava, R. Cooley, M. Deshpande, and P.-N. Tan. Webusage mining: Discovery and applications of usage patternsfrom web data. SIGKDD Explorations, 1:12–23, 2000.
[14] N. Ye, Q. Chen, S. M. Emran, and K. Noh. Chi-square sta-tistical profiling for anomaly detection. In IEEE Systems,Man, and Cybernetics Information Assurance and SecurityWorkshop June 6-7, 2000 at West Point, New York, pages187–193, June 2000.
Proceedings of the Second International Conference on Autonomic Computing (ICAC’05) 0-7695-2276-9/05 $ 20.00 IEEE
Authorized licensed use limited to: Drexel University. Downloaded on October 10, 2008 at 15:51 from IEEE Xplore. Restrictions apply.