combustion products and their effects on life...
TRANSCRIPT

6-11
Combustion Products and Their Effects on Life Safety
Revised by
Richard G. Gann Nelson P. Bryner
Along with heat, the burning of every combustible material or product* produces smoke—gases and aerosols that, in sufficiently high concentration, present hazards to people in the vicinity.
Products near those already burning may also contribute to the smoke as they decompose from exposure to the heat from the fire. Predominant among the hazards, which generally occur simul-taneously, are the following:
Sensory irritation of the upper and/or lower respiratory tract, which can affect speed of move-ment and the ability to negotiate escape and, at higher exposures, can lead to incapacitation or deathCentral nervous system depression resulting from inhalation of asphyxiant fire gases, which can, in ascending exposures, lead to impaired judgment, disorientation, loss of motor coordina-tion, unconsciousness, and, ultimately, deathThermal effects, including hyperthermia and thermal burns of the skin and respiratory tract
Exposure to these hazards is often prolonged by eye irritation and diminished visibility due to smoke obscuration, which can affect the ability of occupants to see and negotiate escape routes efficiently. Survivors from a fire may also experience postexposure complications that can lead to delayed health effects or even death.
The nature and concentration of the generated smoke depends on a variety of factors. These include the quantity of the product that is burning, whether the product is flaming or pyrolyzing, the ventilation in the area, and distance from the fire. Thus, smoke toxicity is not a singular property of a product.
The threat to people from the heat and smoke depends on additional factors, including the entire ensemble of burning products, the location of people relative to the fire, the locations of exits from the burning enclosure and the paths to those exits, the time (in the fire growth history) at which people are in the vicinity of the fire-generated atmosphere, and individual susceptibility of each per-son to the components of the smoke. Thus, the hazard and risk to people from exposure to the fire effluent (heat and smoke) from a burning product is also not a singular property of the product.
See also Section 2, Chapter 3, “Flammability Hazard of Materials”; Section 4, Chapter 2, “Calculation Methods for Egress Prediction”; and Section 6, Chapter 3, “Concepts and Protocols of Fire Testing.”
•
•
•
*In this chapter, product refers to a finished commercial item, and material refers to a single substance. Thus, for example, a chair (the product) is composed of several materials (e.g., a wooden frame, polyurethane padding, cotton batting, an aramid fire barrier, and a polyester/cotton cover fabric).
Richard G. Gann, Ph.D., and Nelson P. Bryner, M.S., are in the Building and Fire Research Laboratory of the National Institute of Standards and Technology (NIST). Dr. Gann, a senior research scientist, was formerly chief of the NIST Fire Science Division and is currently the chair of ISO TC92 SC3, Fire Threat to People and the Environment. Mr. Bryner is a chemical engineer with experience in fire research including lab- and full-scale experiments. He is head of the Fire Fighting Technology Group at NIST.
This chapter was prepared by federal employees and is not subject to copyright.
Chapter Contents
Fire and Combustible Materials
Generation of Fire GasesToxicity of Fire GasesQuantification of Toxic
PotencyTest Methods for Toxicity
of SmokeEstimation of Toxic Hazard
in FiresDevelopment of Toxic
Hazards in Full-Scale Fires
Key Terms
asphyxiant, available safe egress time (ASET), carbon dioxide, carbon monoxide, combustion product, cup furnace test, fractional effective dose, hydrogen cyanide, irritant, LC50, mass loss model, N-gas model product of combustion, pyrolysis, radiant panel test, required safe exit time (RSET), smoke, Station Nightclub fire, stoichiometric, supertoxicant, test, toxic gas model, toxicity, University of Pittsburgh (UPITT) device
06-02.indd 1106-02.indd 11 11/6/2007 8:57:51 AM11/6/2007 8:57:51 AM
SECTION 6Chapter 2

6-12 SECTION 6 ■ Characteristics of Materials and Products
FIRE AND COMBUSTIBLE MATERIALS
Pyrolysis and Combustion
Almost all polymeric materials, both natural (e.g., wood) and synthetic (e.g., polyurethane or nylon), can undergo pyrolysis and/or combustion. Pyrolysis is defined as a “process of simulta-neous phase and chemical species change caused by heat,” with combustion being defined as “a chemical process of oxidation that occurs at a rate fast enough to produce temperature rise and usually light, either as a glow or flame.”1 The processes of pyrolysis and combustion have both physical and chemical aspects.2
Polymeric materials, on exposure to sufficient thermal en-ergy, typically first undergo phase change, such as melting in the case of thermoplastics, followed by chemical decomposition. These are endothermic processes, resulting in the production of volatile low-molecular-weight products, which may or may not then undergo actual combustion.
If pyrolysis produces gases that are themselves combustible, flaming may occur if the following exist in the same volume:
Sufficient oxidizing agent (air)An ignition source of sufficient intensitySufficient gaseous fuel vapors or volatiles
The nature of the gases generated by the pyrolysis can have a significant effect on when and whether ignition takes place. For example, a material that contains a readily volatile fire retardant may not ignite until the fire retardant has been sufficiently de-pleted. Should the fire retardant and the host polymer continu-ously volatilize until the polymer is depleted, ignition may be prevented altogether.
For the process of combustion to be self-sustaining, it is necessary for the burning gases to impart sufficient heat energy to the material to continue the production of ignitable volatiles. The process is a continuous feedback loop: heat transferred to the material causes the generation of flammable volatiles, these volatiles react with oxygen in the air to generate heat, and a part of this heat is transferred back to the material to continue the process. The chemical oxidation processes for flaming combus-tion of organic materials are generally quite exothermic, with more than enough energy being produced to continue the pyrol-ysis and bond-breaking processes if the heat transfer is efficient and heat losses to the environment are not too great.
Smoldering is a different form of combustion occurring only in certain porous materials. Here, air diffuses into the pores of the material and reacts directly with the interior surfaces of the pores. The combustion products from this slower process are typically quite different from those from flaming combustion. They are, however, a significant cause of fire deaths when a per-son is close to the smoldering product, as can occur following cigarette ignition of a bed or piece of upholstered furniture.3
Flammability Properties of Materials and Products
It is difficult to generalize the flammability properties of mate-rials, since fire performance is influenced by a number of fac-tors, including the chemical composition and structure of the
•••
material, the use of additives in formulated systems, and even the conditions of the fire. Highly crosslinked thermoset poly-mers normally burn less readily than thermoplastics. Cellular plastics (foams) generally burn quite readily due to their large surface area and good thermal insulating properties, which pre-vent dissipation of heat. Polymer systems containing halogen atoms (e.g., polyvinyl chloride [PVC]) burn with difficulty; however, the addition of plasticizers increases the propensity of these polymer systems to burn. Fire-retardant additives, which include organic halogen and phosphorus-containing compounds and several metal oxides and hydrates, are employed to increase resistance to ignition and/or lower burning rates of polymer sys-tems.4 However, inherently fire-resistant polymers and polymer systems containing fire-retardant additives will still burn under sufficiently severe thermal conditions.
GENERATION OF FIRE GASES
Smoke is commonly defined as “the airborne solid and liquid particulates and gases evolved when a material undergoes py-rolysis or combustion.”1 The particulates and aerosols produced affect occupants’ visibility as they attempt to escape from a fire; this will be addressed in a later portion of this chapter. Consider-ation will be given first to the formation and toxicity of the gases commonly produced in fires.
Carbon Dioxide
In well-ventilated flaming fires, nearly all the carbon lost from the combustibles is converted to carbon dioxide (CO2). Even in postflashover fires, the fraction of carbon conversion to CO2 is fairly high. Thus, the yield* of CO2 has been used to esti-mate the burning rate of products when a direct measurement of mass loss is not possible. Carbon dioxide is also generated in smoldering fires, but the generated carbon monoxide is far more hazardous.
Carbon Monoxide
Carbon monoxide (CO) is produced from both smoldering and flaming combustion. The production of CO from smoldering fires is quite slow, but these fires are not accompanied by vigor-ous mixing and diluting of the combustion products with room air. Thus, lethal concentrations of CO can be generated in the immediate vicinity of the ignition within 10 minutes. Lethal concentrations of CO elsewhere in the room may take 1 to 3 hours. By then, smoldering may have ceased or may have un-dergone transition to flaming combustion.5
The production of CO from flaming combustion is a gas phase process. The fuel vapor or carbon-containing decomposi-tion products react in a complex sequence with the oxygen in the air to form carbon monoxide. Subsequent reaction further oxi-dizes the CO to CO2. The completeness of this process is largely dependent on the local supply of oxygen. Oxygen available to
*The yield of a fire-generated gas is defined as the mass of the gas produced divided by the mass of the combustibles consumed in the burning. A parallel definition applies to the overall yield of smoke.
06-02.indd 1206-02.indd 12 11/6/2007 8:57:52 AM11/6/2007 8:57:52 AM

CHAPTER 2 ■ Combustion Products and Their Effects on Life Safety 6-13
a fire can be limited either by lowering the oxygen concentra-tion in the incoming air supply or by reducing the volume flow of air to a fire. The formation of CO is related to the fuel-to-air equivalence ratio,6 which is defined as
φ = (kg fuel/kg air)
(kg fuel/kg air)stoich
(1)
where “stoich” denotes conditions at which the ratio between fuel and oxygen is that required for complete combustion, with no excess oxygen. Thus, when φ = 1, exact stoichiometric condi-tions exist between fuel and air. For values of φ < 1, the fire is fuel-lean and well ventilated; for values of φ > 1, the fire is fuel-rich and ventilation controlled. These latter conditions (φ > 1) are ones that favor the formation of CO.
Studies have shown that under well-ventilated conditions (φ < 0.5), yields of CO are very low, typically less than 0.01.6 Above equivalence ratios of about 0.5, the yield of CO increases rapidly as the value of φ increases. For compartments of mod-erate size and ventilation, this rise in the yield of CO occurs near the point of flashover. Flashover occurs when the thermal environment is sufficiently intense that many or all the combus-tibles in the compartment burst into flame. The result is a high density of combustible vapors, a decrease in the oxygen within the compartment, and thus a sharp increase in φ. This is the same condition that favors generation of CO. According to NFPA 269, Standard Test Method for Developing Toxic Potency Data for Use in Fire Hazard Modeling, once φ reaches a value greater than about 1.5, the CO yield becomes rather constant at about 0.2 kg CO/kg fuel consumed, with the production rate being de-pendent principally on the mass burning rate. For a sufficiently large fire whose flame radiative heat flux and mass generation rate of material vapor have approached their asymptotic values, the mass burning rate remains rather constant, and, thus, the CO production rate is also fairly constant (until the fuel supply becomes depleted).7 These phenomena have been observed with large-scale fire tests involving fully furnished rooms.8
The ratio of the concentrations of carbon dioxide to carbon monoxide, often used as a descriptive characteristic of a fire, depends more on the ventilation conditions of the fire than on the nature of the materials being burned.9 Studies of the depen-dence of CO2/CO ratios on the equivalence ratio show that for well-ventilated fires (i.e., φ � 1), essentially all the fuel carbon is oxidized to CO2 and the ratio exceeds 20.10 Once the equiva-lence ratio has exceeded that associated with flashover, indicat-ing a fuel-rich or ventilation controlled fire, the CO2/CO ratio reaches a plateau at about 2 to 10.6,10 The bases for this range have not been established.
Hydrogen Cyanide
The generation of hydrogen cyanide (HCN) is both material-dependent and temperature-dependent. In smoldering fires and pyrolysis from flaming fires, HCN can be produced by decom-position of some nitrogen-containing polymers. HCN can be generated from nitrogen-containing polymers during flaming combustion as well. In neither case is there evidence of toxi-cologically significant HCN formation by fixation of the nitro-gen in the air. In contrast to CO, there have been insufficient
studies on HCN to enable quantitative prediction of its forma-tion in fires. If sufficient oxygen is present, oxides of nitrogen (NOx) may also be formed from nitrogen-containing materials. Although one study reported NOx production from nitrogen-containing fuels to be far less than that for HCN, there are conflicting data in the literature.11 HCN has also been seen to be oxidized to NOx when flames extended from a flashed-over room and continued to burn outside the doorway.12
Halogen Acids
Polymer systems containing halogen atoms (fluorine, chlo-rine, or bromine) result in the formation of the halogen acids— hydrogen fluoride (HF), hydrogen chloride (HCl), and hydrogen bromide (HBr), the production of which is largely material-dependent as long as thermal decomposition tempera-tures are reached. The halogen acids are formed in the pyroly-sis component of the combustion process and are not oxidized further. Thus, the halogen acids are produced even if flaming combustion does not occur. Since the production efficiencies for the formation of HF, HCl, and HBr are close to being unity, maximum yields might be expected in fires. For example, HCl is readily evolved from polyvinyl chloride (PVC) at tempera-tures of about 437 to 527°F (225 to 275°C).2 Since HCl can be released before significant carbon from the material is com-busted, the mass yield of HCl can exceed the stoichiometric value early in the material’s decomposition. Nonetheless, the maximum possible concentrations of halogen acids are gener-ally not encountered. Far lower yields have been found from PVC that contains a high fraction of calcium carbonate filler.13 Presumably, this reflects reaction with the chlorine atoms to form (solid) calcium chloride, which is thermally stable under ordinary fire conditions. Furthermore, halogen acid concen-trations decay rather quickly in the presence of adsorptive surfaces14 and water droplets present in most fire effluents at temperatures below 212°F (100°C).
Organic Irritants
Pyrolysis and/or incomplete combustion of organic materials can lead to a wide variety of organic irritant species. Those considered to be the most important toxicologically are form-aldehyde, unsaturated aldehydes (especially acrolein), and isocyanates (from nitrogen-containing polymers15). The first two result from partial oxidation of the carbon in the material. (Further oxidation leads to the formation of CO and then CO2.) Acrolein, in particular, has been demonstrated to be present in many fire atmospheres.16 It is also formed from the smoldering of all cellulosic materials and from the oxidative pyrolysis of polyethylenes.17
Other Gases and Aerosols
Depending on the composition of the combusting products, ad-ditional toxic components of smoke can be produced in a fire. For example, phosphorus-containing fire retardants can result in phosphoric acid aerosol, and sulfur-containing polymers can generate sulfur oxides. There is yet no predictive capability for the yields of such species.
06-02.indd 1306-02.indd 13 11/6/2007 8:57:52 AM11/6/2007 8:57:52 AM

6-14 SECTION 6 ■ Characteristics of Materials and Products
TOXICITY OF FIRE GASESFire gas toxicants are usually considered as belonging to one of three basic classes:
1. Asphyxiants, or narcosis-producing toxicants 2. Sensory/upper respiratory irritants or pulmonary irritants 3. Toxicants exhibiting other or unusual effects; although
always a possibility, this class has few documented examples
The toxicological effects of smoke produced from fires usu-ally involve relatively high concentrations of toxicants inhaled over quite short periods of time. Thus, many criteria commonly used in conventional toxicology to describe hazardous condi-tions, such as threshold limit values (TLVs18) and occupational long-term exposure values, are normally of little use in combus-tion toxicology.
This section addresses the toxicity of the major fire gases in a largely descriptive manner. It also provides guidance on limiting criteria for exposure of humans in fires.
Asphyxiants
In combustion toxicology, the term narcosis refers to the effects of asphyxiant toxicants that are capable of resulting in central nervous system depression, with loss of consciousness and ul-timately death. Effects of these toxicants depend on the accu-mulated dose, that is, both concentration and duration of the exposure. The severity of the effects increases with increasing dose.
Carbon Monoxide. The toxic effects of carbon monoxide are those of anemic hypoxia.19 Hypoxia refers to the condition in which there is an inadequate supply of oxygen (O2) to body tissue, with anemic hypoxia being characterized by a lowered oxygen-carrying capacity of the blood, even when the arterial partial pressure of O2 and the rate of blood flow are normal. This is due to competition between O2 and CO for the heme-binding sites of hemoglobin, with the affinity of hemoglobin for CO being about 250 times greater than that for O2.19 Even partial conversion of hemoglobin to carboxyhemoglobin (COHb) sig-nificantly reduces the oxygen-transport capability of the blood such that serious toxic signs and symptoms are produced. Ad-ditionally, partial conversion of hemoglobin to COHb causes oxygen that is bonded as oxyhemoglobin (HbO2) to be more tightly held and less available to body tissues. The extent to which blood hemoglobin is converted to COHb can readily be measured in a clinical laboratory and is expressed as percentage of COHb saturation. An ISO standard for these measurements is being processed in ISO TC 92/SC 3.20
The signs and symptoms produced by exposure to CO are directly related to the percentage of blood hemoglobin that is converted to COHb.21 Deaths of humans exposed to CO pro-duced in fires have been associated with COHb saturations rang-ing from 1 to 99 percent.22 Although most deaths have been reported to be in the 50 to 70 percent COHb range, both lower and higher values are not unusual.23,24 Low COHb values in fire victims may be due to preexisting physiological conditions,
such as pulmonary insufficiency or cardiovascular disease, which may have already compromised the individual. The high oxygen demand resulting from physical exertion may also cause a person to succumb to low COHb saturation. High COHb val-ues at death may be attributed to the low oxygen demand of a person either at rest or at quite low physical activity. There is no specific COHb saturation below which one would be expected to live and above which death would occur. As with essentially all biological responses, there is a distribution of COHb satura-tions associated with death.24 Sometimes, in the case of even a single exposure, permanent harm may result from hypoxic dam-age to neural structures.19 The peak incidence of such delayed neurological impairment is with the elderly.25
Binding of O2 and CO with hemoglobin occurs as an equi-librium, with both association and dissociation taking place.19 Thus, CO and hemoglobin are in equilibrium with COHb, with the concentration of COHb being dependent on the par-tial pressure (or concentration) of CO in the atmosphere. Each concentration of CO is associated with an equilibrium COHb saturation, or, stated another way, for any given value of COHb saturation there is a minimum concentration of CO that will at-tain it. At any given O2 concentration, higher equilibrium COHb saturations can be obtained only by increasing the concentration of CO.
The competition between O2 and CO for bonding sites on hemoglobin is defined by the Haldane equation:19
(COHb)
(HbO2) = M
(PCO)
(PO2 )
(2)
where
(COHb)/(HbO2) = Ratio of carboxyhemoglobin to oxy-hemoglobin
(PCO)/(PO2 ) = Ratio of the respective partial pressures
(or concentrations)
M = A constant that is, to some extent, spe-cies dependent
The Haldane equation is commonly used to calculate the CO concentration that would be in equilibrium with any given COHb saturation.
The time required for a human subject to attain a given COHb saturation can be approximated from the Stewart- Peterson equation:26
% COHb = (3.32 × 10⁻⁵)(CO)1.036(RMV)(t) (3)
where
(CO) = CO concentration (µL/L)*
RMV = Respiratory minute volume (L/min)
t = Exposure time (min)
At rest, the RMV for humans averages approximately 8.5 L/min,23 but may increase during strenuous activity to as much as
*The concentration in µL/L is numerically equal to the frequently used unit of “ppm.” The use of the latter unit is discouraged.
06-02.indd 1406-02.indd 14 11/6/2007 8:57:53 AM11/6/2007 8:57:53 AM

CHAPTER 2 ■ Combustion Products and Their Effects on Life Safety 6-15
100 L/min. Curves showing the relationship between CO con-centration and time of exposure for various COHb saturation values for humans have been constructed using the Stewart- Peterson equation.27
Studies using rats have shown that elevated temperatures have an exacerbating effect on CO intoxication,28 possibly through increased rate of respiration. This is likely to occur with humans as well. The obvious treatment for persons exposed to CO is to provide for inhalation of fresh air or even pure oxygen. For example, the half-recovery time in terms of blood COHb levels for resting adults breathing air at 1 atmosphere is 320 minutes.19 When oxygen is given at 1 atmosphere, the time is reduced to 80 minutes.
Hydrogen Cyanide. Hydrogen cyanide (HCN), whose lethal dose is approximately 25 times smaller than that of carbon mon-oxide, is a very rapidly acting toxicant.29 The action of HCN is due to the cyanide ion, which is formed by hydrolysis in the blood. Unlike CO, which remains primarily in the blood, cya-nide ions are distributed throughout the body water and make contact with the cells of tissues and organs. Cyanide ions read-ily react with the enzyme cytochrome oxidase to form a cy-tochrome oxidase–CN complex and also with methemoglobin to form cyanomethemoglobin. If the concentration of cyanide ions is not sufficiently great to cause death, the ions are slowly released from the complexes with cytochrome oxidase and met-hemoglobin and converted to thiocyanate ions by the enzyme rhodanese. This detoxification process, along with the fact that cyanide is distributed throughout the body, makes correlation of blood cyanide content with actual exposure to HCN difficult.
Cytochrome oxidase occupies a central role in the utiliza-tion of oxygen in practically all cells. Its inhibition rapidly leads to loss of cellular functions (cytotoxic hypoxia) and then to cell death. In contrast to CO, cyanide ions do not decrease the avail-ability of oxygen but rather prevent the utilization of oxygen by cells. The heart and brain are particularly susceptible to this inhibition of cellular respiration, with bradycardia, cardiac ar-rhythmia, and EEG brain wave activity, indicative of central ner-vous system depression, having been reported in studies using monkeys.30 Although cardiac irregularities are often noted in HCN intoxication, the heart tends to outlast respiration, and death is usually due to respiratory arrest of central nervous sys-tem origin.
A complication resulting from the inhalation of HCN is one of respiratory stimulation or hyperventilation,23 presumably due to the body’s regulating chemoreceptor cells responding to a need for oxygen. This causes a more rapid uptake of not only HCN but also other toxicants that may be present. The hyper-ventilatory effect of HCN may also account for its rather steep dose-response relationship.
Data relating symptoms in humans to various concentra-tions of HCN are very limited. One widely referenced descrip-tive account of HCN intoxication of humans reports that 50 µL/L may be tolerated for 30 to 60 minutes without difficulty, 100 µL/L for that same period is likely to be fatal, 130 µL/L may be fatal after 30 minutes, and 181 µL/L may be fatal after 10 minutes.31
The role of HCN as a causative agent in human fire fa-talities is considerably less clear than that of CO. Documented cases are rare in which HCN alone can be shown to be the pri-mary toxicant. Blood can be analyzed for cyanide, but the proce-dure is more complex than that for CO, and the reliability of the results is dependent on proper blood storage conditions prior to analysis. Analyses should be interpreted with caution, with con-sideration given to the analytical method used, the blood storage history, and the past performance of the responsible laboratory. It is generally held that blood cyanide concentrations greater than 1.0 µg/ml are indicative of possibly significant toxicologi-cal effects due to inhalation of HCN.22,32 Blood cyanide levels greater than 3.0 µg/ml are generally considered to be lethal. Significant concentrations of blood cyanide are normally found associated with carboxyhemoglobin saturation due to inhalation of CO.32,33 The contribution of each to death often cannot be determined with confidence. There is no evidence for synergism between HCN and CO, and it is generally agreed that these two toxicants are additive in their effects.34,35
Carbon Dioxide. Carbon dioxide (CO2) is quite low in its own toxicological potency and is not, by itself, normally considered to be significant as a toxicant in fire atmospheres. However, it does stimulate both the rate and depth of breathing, thereby in-creasing the RMV. The RMV, increasing about 50 percent with only 2 percent CO2, may be as much as 8 to 10 times normal in the presence of 10 percent CO2. Such respiratory stimulation causes accelerated inhalation of other toxicants leading, for ex-ample, to an increased rate of formation of blood COHb from inhalation of CO. However, the same equilibrium COHb satura-tion of blood is reached as in the absence of CO2.36
Increased incidence of lethality of rats has also been re-ported with combinations of CO and CO2, particularly occurring after the exposure period.37 This effect may be associated with the combined insult of respiratory acidosis (caused by CO2) and metabolic acidosis (caused by CO), a condition from which the rodent has difficulty recovering postexposure. Whether or not this latter effect of CO2 also occurs with people has not been determined.
Oxygen Depletion. Since oxygen is consumed in the combus-tion process, oxygen depletion or vitiation must also be con-sidered a toxic component of smoke. When oxygen drops from its usual level of nearly 21 percent in air to approximately 17 percent, a person’s motor coordination may be impaired. When oxygen drops to the range of 14 to 10 percent, a person can be still conscious but may exercise faulty judgment and will be quickly fatigued. In the range of 10 to 6 percent, a person loses consciousness and must be revived with fresh air or oxy-gen within a few minutes to prevent death.38 During periods of exertion, increased oxygen demands may result in oxygen deficiency symptoms at higher oxygen levels.
Irritants
Both inorganic irritants (e.g., halogen acids and those formed from nitrogen oxides) and organic irritants (e.g., aldehydes) can be formed in fires. Irritant effects, produced from exposure
06-02.indd 1506-02.indd 15 11/6/2007 8:57:53 AM11/6/2007 8:57:53 AM

6-16 SECTION 6 ■ Characteristics of Materials and Products
to essentially all fire atmospheres, are normally considered by combustion toxicologists as being of two types:
1. Sensory irritation, including irritation of the eyes and the upper respiratory tract
2. Pulmonary irritation affecting the lungs
Most fire irritants produce signs and symptoms characteristic of both sensory and pulmonary irritation.
Eye irritation, an immediate effect that depends primarily on the concentration of an irritant,39 may significantly impair a person’s escape from a fire. Nerve endings in the cornea are stimulated, causing pain, reflex blinking, and tearing. Severe irritation may also lead to subsequent eye damage. Victims may shut their eyes, partially alleviating these effects; however, this action may also impair their escape from a fire.
Airborne irritants also enter the upper respiratory tract, causing burning sensations in the nose, mouth, and throat, along with the secretion of mucus. These sensory effects are also primarily related to the concentration of the irritant and do not normally increase in severity as the exposure time is increased.39
Following signs of initial sensory irritation, significant amounts of inhaled irritants may also be quickly taken into the lungs, with the symptoms of pulmonary or lung irritation being exhibited. Lung irritation is often characterized by coughing, bronchoconstriction, and increased pulmonary flow resistance. Tissue inflammation and damage, pulmonary edema, and sub-sequent death may follow exposure to high concentrations, usually within 6 to 48 hours. Inhalation of pulmonary irritants also appears to increase susceptibility to postexposure bacterial infection. Unlike sensory irritation, the effects of pulmonary ir-ritation are dependent both on the concentration of the irritant and on the duration of the exposure.
Halogen Acids. The halogen acids have received particular at-tention, with the most prevalent case being hydrogen chloride (HCl) resulting from the decomposition of polyvinyl chloride (PVC). HCl is both a potent sensory irritant and a strong pul-monary irritant. Volume fractions as low as 75 to 100 µL/L are extremely irritating to the eyes and the upper respiratory tract, suggesting possible impairment of physical activity such as is needed for escape.40 Although HCl was found not to be physi-cally incapacitating to baboons subjected to volume fractions up to 17,000 µL/L for 5 minutes, postexposure deaths were reported from doses that did not appear to incapacitate.41 Comparable studies have not been conducted using actual PVC smoke.
Another study, using baboons exposed for 15 minutes to (flaming) PVC smoke containing 5000 µL/L HCl, did not show any smoke-related impairment of pulmonary function when tested at 3, 90, 180, and 360 days postexposure.42 Lesions to mucosal surfaces of the mouth were observed, however, along with evidence of bronchoconstriction and lowered PaO2 (arte-rial oxygen) levels during the exposure.
Considerable controversy has existed as to what concen-tration of HCl may be hazardous to humans. It is questionable whether data from numerous studies with rodents can be di-rectly extrapolated to humans because of significant anatomi-cal differences between the respiratory tracts of the rodent and
the primate which, in turn, result in very different responses to HCl. Rodents exhibit a decrease in respiratory rate and minute volume on exposure to HCl, whereas these values have been shown to increase for primates.43 Interestingly, exposure doses (concentrations × time) of HCl causing postexposure lethality in rats are in the same range as those that have resulted in post-exposure deaths of baboons.44 However, the data for baboons are very limited, and the comparison made is rather subjective. From studies using exposure of baboons, HCl would not appear to be physically incapacitating, nor would it seem to produce significant chronic respiratory complications after short expo-sures to volume fractions of 5000 µL/L and below. Although acute symptoms, ranging from severe discomfort to noticeable upper respiratory tissue damage, may be experienced, signifi-cant pulmonary function changes would not be expected except at higher concentrations.
It would still be prudent, however, to recognize that HCl is likely to be dangerous to humans at concentrations far below those indicated from studies using baboons. Evidence of bron-choconstriction and markedly lowered PaO2 levels from in-halation of HCl were observed with baboons,45 suggesting a potential for adverse effects with humans. Furthermore, persons having preexisting compromised pulmonary function may be more susceptible than healthy individuals.
Fire-retardant additives based on chlorine or bromine are also sources of halogen acids in fires. Fluoropolymers are a major source of HF. Although studies using the halogen acids HF and HBr have been very limited, it would appear that these acid gases exhibit irritant effects similar to those of HCl at com-parable concentrations.23
The determination of incapacitation threshold criteria for the initial effect of the halogen acids (and for irritant gases in general) has involved considerable controversy, since very few controlled studies have been made that relate to the effects of human exposure. Most information has been only anecdotal. Taking expert cognizance of relevant published information, ISO 13571 suggests the following incapacitating volume fractions:46 FHCl = 1000 µL/L, FHBr = 1000 µL/L, and FHF = 500 µL/L. These are for use in Equation (7) on p. 6-20.
Nitrogen Oxides. Nitrogen dioxide (NO2) and nitric oxide (NO) are the major components of a mixture of nitrogen ox-ides usually referred to as NOx. Nitric oxide is only about one-fifth as potent as NO2.11 Studies on rats exposed to NO2 under the conditions of smoke toxicity test methods indicate NO2 to have a lethal toxic potency comparable to HCN.47 In contrast to HCN, the toxicity of NOx is primarily due to its properties as a pulmonary irritant, with lethality of rats being postexposure, usually within one day. A consensus (ISO 13571) incapacitating volume fraction is FNO2
= 250 µL/L.
Other Inorganic Irritants. As indicated above, the presence of other atoms in the burning materials can lead to the generation of inorganic oxides and acids, which behave as irritants as well. The toxic effects of these gases are likely to be additive with the irritants discussed above. A consensus value for the incapacitat-ing volume fraction of SO2 is 150 µL/L. Consensus values for other inorganic irritants have not yet been determined.
06-02.indd 1606-02.indd 16 11/6/2007 8:57:53 AM11/6/2007 8:57:53 AM

CHAPTER 2 ■ Combustion Products and Their Effects on Life Safety 6-17
Organic Irritants. Although numerous organic irritants may be produced in fires, only acrolein has received significant at-tention in combustion toxicology. It is deemed to be the most potent of the organic irritants. Volume fractions of acrolein as low as a few µL/L are extremely irritating to the eyes and upper respiratory tract. Interestingly, studies with baboons showed that volume fractions up to 2780 µL/L (5700 g/m3) for 5 minutes were not physically incapacitating during exposure.41 Pulmo-nary complications caused by that and even lower concentra-tions resulted in death within hours after the exposure, however. Values of incapacitating volume fractions for acrolein and form-aldehyde are 30 µL/L and 250 µL/L, respectively.46 However, given the results of the baboon studies, this figure for acrolein seems conservative.
Supertoxicants
Concern regarding potential “supertoxicants” (materials gen-erating smoke of extremely high potency) in fire atmospheres was prevalent in the 1970s and 1980s. With more experience in the testing of materials, this concern has diminished, since there have been few documented examples. One involved the formation of a neurotoxin from the thermal decomposition of a noncommercial rigid polyurethane foam,48 whereas another concerned the extreme toxic potency exhibited by polytetra-fluoroethylene in some laboratory tests. The latter eventually came to be regarded as largely an artifact of the test methods.49 For most materials and products it is now widely accepted that smoke toxicity can, to a large extent, be explained both qualita-tively and quantitatively on the basis of a small number of com-mon toxic gases.50,51 A protocol for identifying a supertoxicant is presented below in the section Test Methods for Toxicity of Smoke.
QUANTIFICATION OF TOXIC POTENCY
The LC50
The standard in combustion toxicology for quantifying the toxic potency of individual fire gases or of smoke has mostly been the LC50 for 30 minute exposure of rats.52,53 The LC50 is defined as the volume fraction of toxic gas in µL/L or smoke in g/m3 statistically calculated from concentration-response data to pro-duce lethality in 50 percent of test animals within a specified exposure and postexposure time.* The IC50 is similarly defined for incapacitation. It is significant that consensus among experts has been to recognize that the rat is a reasonably acceptable animal model for human exposure to smoke when the principal effects are due to inhalation of asphyxiant toxicants.27,54 Over the years, LC50 values have been experimentally determined for rodent (and less frequently, other laboratory animals) exposure to individual fire gases,54 as well as for many materials and products.55
Lethal Toxic Potency from Chemical Analysis
Although individual fire gas toxicants may exert quite differ-ent physiological effects through different mechanisms, when present in a mixture each may result in a certain degree of com-promise experienced by an exposed subject. It should not be unexpected that varying degrees of a partially compromised condition may be roughly additive in contributing to death. The extensive bank of rodent lethality data became useful in the development of a strategy for calculating smoke LC50 values from combustion analytical data without the need for exposure of animals. As early as 1972, Tsuchiya and Sumi proposed that a toxicity index could be constructed from the sum of terms for all the gases generated by a fire. Each term was the ratio of the actual concentration of the gas divided by the concentra-tion fatal to a person in a 30 minute exposure.56 Three further developments made this concept tractable for estimating lethal toxic potency.
Additivity Studies
The additive effects of combustion gases were demonstrated in a number of studies using rodents.34,35 As a result, it is now fairly well agreed that the asphyxiants CO and HCN are addi-tive. Furthermore, analysis of data from experiments exposing rats to mixtures of HCN and CO, and also mixtures of HCl and HCN, suggests that their effects leading to lethality may also be approximately additive.57,58
Fractional Effective Dose (FED)
The additive effects of fire gases was advanced to include con-sideration of variable exposure time. This strategy is commonly referred to as the fractional effective dose (FED) methodol-ogy.34,59,60 The FED is “the ratio of the Ct product (concentra-tion × time) for a gaseous toxicant produced in a given test to that Ct product of the toxicant that has been statistically deter-mined from independent experimental data to produce lethality in 50 percent of test animals within a specified exposure and postexposure time.”53
The additivity of FEDs has become a useful tool in com-bustion toxicology for the calculation of lethal toxic potencies from combustion product analysis data, as well as for the assess-ment of potential toxic hazards to humans.51 Mathematically, the principle is expressed as
FED = n
}
i = 1
t2 }
t1
Ci
(Ct)i
∆t (4)
where
Ci = Concentration of toxic component i
(Ct)i = Specific dose (concentration × time) required to produce lethality
t = Time increment (min)
When the accumulated FED = 1, it is expected that the mixture of gaseous toxicants would be lethal to 50 percent of exposed animals, that is, the LC50.
*“Within a specified exposure” refers to the time interval during which the animals can inhale the gas or smoke. A “specified postex-posure time” refers to a length of time after that, when the animals are breathing fresh air.
06-02.indd 1706-02.indd 17 11/6/2007 8:57:54 AM11/6/2007 8:57:54 AM

6-18 SECTION 6 ■ Characteristics of Materials and Products
N-Gas Model
The combustion of the complex formulations used in com-mercial products generates hundreds of different gases. The evaluation of the FED values and the nature of the combination of those FED values would have been a daunting, if not insur-mountable, task. Researchers at the National Institute of Stan-dards and Technology (NIST) proposed the N-gas model. This concept suggests that the toxic potency of most commercial products could be estimated from the contributions of a small number, N, of the combustion gases.35,51 The results of rat expo-sure experiments to single and mixed gases were compared with experiments in which rats were exposed to the gases generated by the combustion of a number of materials. The mean FED value corresponding to the LC50 was 1.07, using the “N-gas” calculation, with 95 percent confidence limits of 0.20.61
This provided substantial support for this concept.
Two equations have been developed to fit rodent data.52 The first, Equation 5, was developed empirically by Levin and coworkers9 from exposure of laboratory rats to individual and mixed gases:
FED = m · fCO
fCO2 – b
+ 21 – fO2
(21 – 5.4) +
fHCN
150 +
fHCl
3700 +
fHBr
3000 (5)
where m and b are, respectively, the slope and intercept of the interactive curve of CO and CO2, which depicts the increasing toxicity of CO as CO2 concentration increases. The values of m and b depend on the volume fraction of CO2. If fCO2
≤ 0.05, m = –18 and b = 122,000. If fCO2
> 0.05, m = 23 and b = –38,600. Confirmatory work using this model has been published by Pauluhn.61
The terms fx are the volume fractions of those species in µL/L, except for O2 and CO2, where the volume fractions are in volume percent.
The second, Equation 6, was developed by Purser,62 fitting the rat LC50 data obtained mainly by Levin et al.61,63 and Kaplan and Hartzell.27
FED = ‹
fCO
LC50,CO
+ fCN
LC50,HCN
+ fX
LC50,X
+
fY
LC50,Y
�
VCO2 + A +
21 – fO2
(21 – 5.4) (6)
where, in addition to the definitions for Equation 5,
fCN = The volume fraction of HCN in µL/L, corrected for the presence of other nitriles and the protective effect of NO2, and is equal to fHCN + ftotal organic nitriles – fNO2
LC50,X = The LC50 of each acid gas irritant in µL/L
LC50,Y = The LC50 of each organic irritant in µL/L
VCO2 = A multiplication factor for CO2-driven hyperven-
tilation equal to 1 + e[(0.14 · CO2%) – 1] /2
A = An acidosis factor equal to fCO2 × 0.05
The 30 minute LC50 values used in Equation 6 are given in Table 6.2.1.54
Between the two equations, there are small numerical dif-ferences in the LC50 values for HCN, HCl, and HBr. These dif-ferences are within the uncertainties of the experiments from which the values were derived.
There are also functional form variations in the way CO, CO2, and depleted O2 are included in the two equations. These variations will lead to modest differences in the calculated val-ues of the FED. A reasonable estimate of agreement between the two equation calculations is ±30 percent for FED values ≈ 1.
Sublethal Effects of Fire Smoke
Smoke inhalation can lead to a succession of sublethal effects that each can affect how readily a person can find safety from a fire. For nearly all of these, there are few quantitative data from controlled experiments or actual fire experience for the degree to which these effects alter the ability of laboratory animals or people to escape from a fire. Although tests have been devel-oped for assessment of incapacitation due to sensory irritation,64 they have not received significant use. This is due, at least in part, to a lack of validation between the tests and actual effects on humans. This has led the experts assigned to ISO TC92 SC3 to affirm that the focus should be on incapacitation.10 Incapaci-tation is defined as the inability to take action to accomplish an escape from a fire.
Some measurements have been made of incapacitation on rodents.27 A literature review of the animal exposure data for CO and HCN showed that the concentrations that caused in-capacitation were one-third to one-half those that resulted in death.27 A subsequent review was performed of the literature of the animal exposure data for exposure of animals to combus-tion smoke from a wide variety of materials and products.55 The mean value of the ratios of the IC50 to the LC50 and the standard deviation were 0.50 and 0.21, respectively.
Although considerable attention was once directed toward incapacitation studies, testing for smoke toxicity ultimately made no such assessment. Incapacitation is simply inferred from lethality data, with combustion toxicologists generally re-garding incapacitating exposure doses to be about one-third to one-half of those required for lethality.27
Combustion 30 min LC50 Product (µL/L)
CO 5700HCN 165HCl 3800HBr 3800HF 2900SO2 1400NO2 170Acrolein 150Formaldehyde 750
TABLE 6.2.1 30 Minute LC50 Values for Rats
Source: Data from International Organization for Standardization.
06-02.indd 1806-02.indd 18 11/6/2007 8:57:54 AM11/6/2007 8:57:54 AM

CHAPTER 2 ■ Combustion Products and Their Effects on Life Safety 6-19
TEST METHODS FOR TOXICITY OF SMOKE
Evolution of Testing
In the 1970s and 1980s, the dominant philosophy was that smoke toxicity was a property of a material and that control of this property was the proper approach to improving life safety in fires. Accordingly, a number of bench-scale apparatus were developed to measure the toxicity of smoke produced from the burning of materials and, sometimes, products.65 These tests ex-posed a sample of a material or a finished product to a thermal exposure that was deemed appropriate to simulate a fire. Multi-ple rats or, less commonly, mice were exposed to the combustion products. Sufficient experiments were performed to estimate the LC50 for a 30 minute exposure and frequently within a postex-posure period of up to 14 days. The LC50 values were expressed in units of g/m3, that is, grams of the test specimen that were consumed (and presumed to be present as smoke) per unit expo-sure chamber volume (for closed box apparatus) or total air flow (for flow-through apparatus). One test method, The University of Pittsburgh (UPITT) device, expresses the LC50 only as grams of material subjected to the test protocol, which is not a true expression of concentration. In general, care should be taken in comparing LC50 values obtained from different test methods to ensure that the basis for reporting data is the same.
Although this type of testing may have led some manufac-turers to not market certain products, regulation on this basis was limited. For a number of years, the state of New York re-quired the testing and filing of test data for certain construction and finish materials using the “LC50” value from the UPITT method. However, when it became widely recognized that the results of such testing were often irrelevant to the toxic haz-ards of real fires, the regulation was repealed and most of the laboratory testing ceased. At present, there are no laboratories conducting nonproprietary animal tests for smoke toxicity on a routine basis.
In recent decades, there has been growing resistance to the routine use of laboratory animals for testing products, whether this be for skin care or fire safety. This has resulted in a move to-ward the N-gas concept. Unfortunately, there were, and continue to be, some regulations based on limiting the concentration of one or more gases generated using a particular test apparatus. As noted in the introduction to this chapter, this is not likely to help achieve a desired level of fire safety, since the gas yields are not singular properties of a product.
More recently, there has been enhanced awareness that the proper use of smoke toxic potency data is as input to a fire haz-ard or risk assessment, rather than stand-alone pass/fail testing of materials or products.10 The values to be used are the yields of the toxic gases. This is the mass of the gas generated divided by the combusted mass of the test specimen. Less commonly, the calculations use the specimen mass subjected to the test conditions. (These values will be identical if the specimen is completely combusted with no residue.)
Per NFPA 269 and ASTM E1678-02,53 there is now a protocol that balances the need for accuracy in toxic potency measurement while minimizing the use of laboratory animals. In this method, the measured concentrations of the principal
toxicants that are generated when a test specimen is combusted are used to estimate the LC50 using the N-gas equation. Rats are then exposed to smoke at concentrations 30 percent below and 30 percent above this value. If the animal mortality agrees with the predicted LC50, then it is presumed that the smoke is “normal” and the estimated value is used. This will generally be the case for a product whose chemistry is similar to other products for which the animal confirmation test was successful. If the smoke is unusually toxic to rats, then additional research or testing is warranted.
The question then arises as to which of the many tests avail-able gives toxic potency values that are “right.” ISO 16312-1 describes the characteristics of the ideal fire effluent toxicity test method:66
The combustor (or physical fire model) replicates one or more fire stages (radiative pyrolysis, well-ventilated flam-ing, etc.).The test specimens are representative of as-used products.*The apparatus itself does not affect the results.The apparatus is straightforward to use.The method generates gas/smoke yields and specimen mass loss data.The method has demonstrated accuracy relative to real-scale fires.The results are repeatable and reproducible.
The standard then provides criteria to evaluate a real method. ISO/TR 16312-2 (not a Standard, but a Technical Report that presents the ISO TC 92/SC 3 assigned experts’ appraisal) ap-plies these criteria to twelve test methods in use today.67
The following sections present the essential features of some of the tests whose data are most likely to appear in the published literature or which are more commonly used for the regulation of materials and products. For a broader coverage of the many apparatus that have been developed over the years, the reader is referred to more complete compilations.66,67
Cup Furnace Test
The cup furnace test,68 described in Figure 6.2.1, combusts a test specimen in a quartz beaker (the “cup”); the effluent rises and expands to fill an 0.2 m3 closed box. Data for both non-flaming and flaming combustion are obtained by conducting tests just below and just above the autoignition temperature of the specimen, respectively. In each test, six rats are held in tu-bular restrainers, with their heads inside the box. They inhale the smoke for 30 minutes and then are observed for the follow-ing 14 days. Multiple experiments are conducted, with varying masses of the test specimen placed in the cup furnace, leading
•
•
•••
•
•
*This may be the most difficult of the characteristics with which to comply. Some test methods can accommodate a specimen prepared to resemble, as much as possible, a product in its form of use as it would be exposed in a fire. Other test methods require, or can only accommo-date, a ground or crumpled specimen. The latter is less representative of a product having complex construction (e.g., layers of different materi-als). These two approaches may yield different results for the toxicity of smoke produced by a product.
06-02.indd 1906-02.indd 19 11/6/2007 8:57:54 AM11/6/2007 8:57:54 AM

6-20 SECTION 6 ■ Characteristics of Materials and Products
to different concentrations of smoke in the box. The number of animal deaths per test is plotted against the smoke concentra-tion (specimen mass in the furnace divided by the box volume). Statistical analysis of the data then generates an estimate of the LC50 (30 minute exposure plus 14 day postexposure period). Chemical analysis of the principal toxicants enables a second estimation of the LC50 using Equation 5 for FED = 1. The use of rats can be minimized by using the animal check test protocol as noted above under “Evolution of Testing.”
Extensive data on individual fire gases, combinations of those gases, materials, and products have been produced using this method. The data can be found in the references to Levin and coworkers in the bibliography of this chapter. This method is no longer in use since the radiant furnace apparatus (discussed next) manifests a more fire-like exposure of the test specimen. However, the data from the cup furnace method are still widely referenced.
Radiant Furnace Test
The radiant furnace test53 uses the same 0.2 m3 box as the cup burner test. However, the cup furnace is replaced by an assembly that applies a fixed radiant flux to the test specimen, as shown in Figure 6.2.2.69 A spark source is used to ignite the fuel vapors. The test is particularly applicable to layered products, such as furniture or wall coverings. In the operation of the method,9 a test specimen up to 10 cm by 15 cm by 5 cm thick is exposed to
a radiative flux of 50 kW/m2 for 15 minutes. The smoke enters the box through the center hole of a three-slot chimney. Air from the box is recirculated to the combustion zone through the two outer slots. The rat exposures and gas analyses are the same as with the cup furnace test. Successive tests are performed, with the top surface area of the specimen being varied to vary the concentration of smoke in the box.
The lethal toxic potency, LC50, of the smoke from the test specimen is predicted from the combustion atmosphere analytical data by first calculating the FED for the test. The 30 minute LC50 is then calculated as that specimen mass loss that would yield FED = 1 within a chamber volume of 1 m3 from the equation:
LC50 = Specimen mass loss
FED × Chamber volume (7)
where the specimen mass loss is in grams and the chamber vol-ume is 0.2 m3. The resulting LC50 has the units of g/m3. The predicted LC50 is then confirmed in limited tests using rats to ensure that the monitored toxicants account for the observed toxic effects.
The apparatus and procedures have been standardized (identically) as ASTM E1678, Standard Test Method for Mea-suring Smoke Toxicity for Use in Fire Hazard Analysis53 and NFPA 269, Standard Test Method for Developing Toxic Potency Data for Use in Fire Hazard Modeling. Both standards also pro-vide for a mathematical adjustment of experimental LC50 values in order to make them appropriate for the toxic hazard assess-ment of oxygen-vitiated, postflashover fires.
The test results have been compared to results from room-scale postflashover fires.70 Prior to performing the comparison, an adjustment was made to the CO yield. Following flashover, the oxygen concentration in a room drops precipitously. Were this condition replicated in the current test, the animals would succumb to the reduced oxygen, regardless of the effects of the other gases in the smoke. A literature search indicated that postflashover fires typically generate yields of CO of about 0.2 kg CO per kg fuel consumed. This yield is substituted for the CO yield determined in the tests. For five different criteria, the bench-scale apparatus produced results consistent with the room-scale data. Accuracy to within a factor of three was estab-lished as both attainable and practical.
University of Pittsburgh (UPITT) Test
The UPITT test,71
per test to fire effluent produced in a flow-through system from the 68°F (20°C) per minute ramped heating of a specimen in a box or muffle furnace. Exposures are for 30 minutes, starting when 1 percent of the sample weight has been lost. The animals are also observed for 10 minutes following the exposure to the combustion gases. Animal measurements include concentration- response for lethality and time-to-death. Although the results are reported as LC50 values, the values are actually the weight of test specimen charged to the furnace, rather than actual concen-trations of smoke, which varies considerably during a test. Thus, “LC50” values obtained from this test are not directly compa-rable to those from other methods. Between 1987 and 1998, this
1000 ml quartz beaker
Ceramic with recessed vertical heating elements
Thermocouple well
Heating element in bottom
Thermocouple
Insulation
Galvanizedsheet
Gas sampling port Pressure relief panel
FurnaceAnimal ports
(a)
(b)
FIGURE 6.2.1 Schematic of the Cup Furnace Apparatus. (a) Orientation of furnace to exposure box. (b) Details of cup furnace. (Source: National Institute of Standards and Technology)
06-02.indd 2006-02.indd 20 11/6/2007 8:57:55 AM11/6/2007 8:57:55 AM
shown in Figure 6.2.3, exposes four mice

CHAPTER 2 ■ Combustion Products and Their Effects on Life Safety 6-21
test was required by the state of New York for certain construc-tion and finish materials. No acceptance levels or criteria for classification of materials were ever set. During the years over which testing was conducted, LC50 values were reported and filed with the state of New York for over 15,000 products.72
There are a number of differences between real-scale fires and the conditions in this apparatus. There is no ignition source, so the samples autoignite or don’t, depending on the mix of gases generated, the point in the temperature ramp, and the suf-ficiency of the oxygen at that point. Furthermore, it is not clear
FIGURE 6.2.2 ASTM E1678/NFPA 269 Test Apparatus (Source: National Institute of Standards and Technology)
Filter
Flowmeter
Flowmeter
Pump
Animal chamber
Gas sampling port
Exposurechamber
Dilutionair
Ice bath
Weightsensor
Recorder
Thermocouple
Air
Furnace
FIGURE 6.2.3 Schematic of the University of Pittsburgh Apparatus (Source: National Institute of Standards and Technology)
06-02.indd 2106-02.indd 21 11/6/2007 8:57:55 AM11/6/2007 8:57:55 AM

6-22 SECTION 6 ■ Characteristics of Materials and Products
when the combustion conditions in the furnace resemble pre-flashover burning, postflashover burning, or neither. Because the combustion gases flow past the mice, the mice can be ex-posed to some gases in series, rather than concurrently.
Closed Cabinet Toxicity Test
The closed cabinet toxicity test is illustrated in Figure 6.2.4. This apparatus, standardized in NFPA 270, Standard Test Method for Measurement of Smoke Obscuration Using a Coni-cal Radiant Source in a Single Closed Chamber, and ISO 5659-2,73 was designed for measurement of smoke optical density. However, with the addition of gas concentration measurements, it is used by the International Maritime Organization and the European Union, among others, as an acceptance test based on gas concentrations.
In a test, a planar test specimen, 7.5 cm by 7.5 cm by up to 2.5 cm thick, is exposed to a radiant flux of either 25 kW/m2 or 50 kW/m2 for 10 minutes. A pilot flame is standard, but provi-sion is made for testing without the pilot flame. The combus-tion products accumulate in the 0.5 m3 chamber. Combustion products are sampled through a probe whose tip is located at the geometric center of the chamber. Should the concentration
of any of the specified fires gases exceed a prescribed limit, the material or product fails the test.
During the course of a test, the air in the chamber becomes vitiated, and the generation rates of the combustion products evolve.74 Thus, it is not clear what stage of a fire is being repli-cated. It follows that the use of the gas concentration data are of questionable value as an indicator of fire safety. There have been no reported comparisons of data from this apparatus with data from real-scale fire tests of the same materials or products.
Tube Furnaces
There are a number of designs of these apparatus in use around the world. Two are described here, the first because of the data that have been generated, the second because of its potential as an ISO standard.
The DIN 53436 Test, developed by the German Standards Institution and shown in Figure 6.2.5, is characterized by the use of a moving cylindrical tube furnace operating at a constant temperature in the range of 392 to 1832°F (200 to 1000°C).75 The furnace is programmed to travel the length of a quartz tube containing the sample, which has a volume of about 40 mL. Decomposition, taking place in an air stream countercurrent to the direction of furnace travel, is intended to result in the continuous flow of fire effluents of constant composition. The standard procedure includes exposure of 10 rats to the effluent and measurement of the gases generated.
This test device, used in six European countries, offers a rather wide range of well-controlled combustion conditions. Ratios of CO2/CO can be made to vary widely, depending on the air flow used. Thus, both well-ventilated and ventilation-limited fires may be simulated. Specimens may undergo either flaming or nonflaming combustion, depending on the imposed heat flux.
Combustion product analytical data obtained from the DIN 53436 test have been used for the calculation of LC50 values using the FED principle, as well as the N-gas method described in connection with the ASTM E1678 test. 76 Comparisons be-tween calculated and experimental LC50 values for over 30 ma-terials tested revealed fairly good correlation and predictability, giving additional credibility to the concept that lethal toxic po-tency can largely be attributed to a small number of major toxic gases.
The tube furnace used in ISO/TS 1970077 is larger in di-
The boat is driven through a tube furnace at a set temperature,
well-ventilated flaming combustion, and 1520°F (825°C) for postflashover combustion. The fixed sample speed and the vari-able air flow though the tube allows predetermination of the equivalence ratio. There is a small open box at the exit end of the tube from which the effluent gases are sampled. The box can be adapted for exposing laboratory animals. The apparatus is identical to the tube furnace in BS 7990;78 there is a less well-defined version that has been adopted by the International Electrotechnical Commission.
Because of the wide variation in tube furnaces, ISO/TS 19700 was developed to encourage broad construction of uni-
Photomultipliertube housing
Optical systemfloor window
Blow-outpanel
Radiator cone
Pilotburner
FIGURE 6.2.4 Typical Arrangement of the Closed Cabinet Test Chamber (Source: NFPA 270, Standard Test Method for Measurement of Smoke Obscuration Using a Conical Radiant Source in a Single Closed Chamber, 2002 ed., Figure 4.1)
06-02.indd 2206-02.indd 22 11/6/2007 8:57:57 AM11/6/2007 8:57:57 AM
ameter (4.3 cm) than the DIN furnace. It is described in Figure
660°F (350°C) for oxidative pyrolysis, 1200°F (650°C) for
6.2.6. The test specimen fills a boat that is at least 0.8 m long.

CHAPTER 2 ■ Combustion Products and Their Effects on Life Safety 6-23
form devices. A correlation has been found between CO yields in real-scale fire tests and those from the tube furnace.79
ESTIMATION OF TOXIC HAZARD IN FIRESThe fundamental principle in designing for the safety of people in fires is to provide sufficient time for them to escape or find a place of refuge before being overcome by the flames, heat, or smoke.
In quantitative terms, the objective is for ASET to be greater than RSET. ASET, the available safe egress time, is the interval between the time of ignition of the fire and the time at which an individual is incapacitated. RSET, the required safe egress time, is the time it takes that individual to find a safe location. Each person may have a different value for each of these terms, depending on such factors as his/her starting location, physical condition, and susceptibility to smoke. The magnitude of the difference between ASET and RSET is an indicator of the degree of safety being provided.
FIGURE 6.2.5 Schematic of the DIN 53436 Tube Furnace (Source: National Institute of Standards and Technology)
FIGURE 6.2.6 Schematic of the ISO/TS 19700 Tube Furnace (Source: National Institute of Standards and Technology)
06-02.indd 2306-02.indd 23 11/6/2007 8:57:58 AM11/6/2007 8:57:58 AM
Secondaryair stream
Dilutionunit
Quartztube
Thermocouple
Testspecimen Movement
of furnace
Inletair
Flowmeter
CO, CO2, O2 monitors
Cooler
Condensate
Filterunit
Exhaust
Additionalgas sampling
port
Exposurechamber
Mixing chamber Gas samplingSecondary air
Furnace
Sampleboat
Directionof samplemovement
Sample drivemechanism
Aspiratedbubbler chain
Meteringpump
Smoke meter
Exhaust
Primaryair

6-24 SECTION 6 ■ Characteristics of Materials and Products
A fire simultaneously generates gases, heat, and aerosols. Each of these three can lead to a state in which a person cannot effect his or her own escape, which is the definition of inca-pacitation. Typically, one estimates an independent ASET value for flames, heat, or smoke.* The limiting hazard is the effluent component that leads to the shortest value of ASET.
The following sections summarize the consensus of the as-signed experts to ISO TC 92/SC 3 regarding the best represen-tation of incapacitating levels of these three threats. Additional information may be found in ISO 13571.46
Response of People to Fire Gases
The modeling of this component of toxic hazard assessment can take either of two forms, depending on the nature of available input data. 80 In each case, a person moves from a location at the time of ignition to a final location (which may be a site of safety or a site of incapacitation), passing through a time-varying field of combustion products. In some simplified calculations, the person remains in a fixed location. The tenability of various lo-cations is then examined as a function of time following ignition of the fire. There are very few data on exposures of an hour or more. Thus, using the following information for estimation of incapacitation or lethality due to long exposures to very low levels of heat and smoke is not advised.
Toxic Gas Model
The toxic gas model is most useful in considering fires where the time varying concentrations of the individual fire gases can be simulated using a fire growth and effluent spread model, such as the Fire Dynamics Simulator (FDS).81† The effects of asphyxiant toxicants and sensory/upper respiratory irritants are considered separately. This is because effects due to asphyxiants are related to their accumulated exposure dose (concentration × time), whereas the initial effects due to sensory/upper respira-tory irritants are related largely to their concentration. Thus, the model also requires as input the exposure dose for each asphyxi-ant and concentration for each irritant that would be expected to cause incapacitation. These latter values are obtained from exposure of laboratory animals, with the results then being ex-trapolated to people. ISO 13571 contains consensus estimates of the incapacitating values and two equations, one for the effects of asphyxiant gases and one for the effects of irritant gases.
The modeling of the asphyxiant gases involves the same FED concept used to calculate LC50 values from analytical data. As before, incremental exposure doses of each gas are accu-mulated over time, with the incremental time interval being at the discretion of the modeler. However, rather than determining the accumulated FED by integration over 30 minutes, here the
exposure doses of the gases are accumulated until the time at which a chosen FED criterion is reached.46 For example, the time required to reach FED = 1 can be defined as the most fre-quently expected time for incapacitation to occur. ISO 13571 indicates lower FED criteria could provide safety for a larger fraction of the population at large, as well as for the subpopula-tions that are more sensitive to fire smoke.46
The FED equation for incapacitation due to asphyxiants is
FED = t2 }
t1
[CO]
35,000 µL/L · min ∆t +
t2 }
t1
exp ([HCN]/43)
220 min ∆t (8)
where CO and HCN volume fractions are in µL/L. Equation 8 is derived from actual incapacitation experiments using nonhu-man primates.23,41 It is most applicable when oxygen volume fractions are not lower than 0.13, and CO2 volume fractions do not exceed 0.02.
The sensory/upper respiratory irritant component of toxic hazard is addressed in a somewhat analogous manner, with the exception that instantaneous concentrations, rather than accu-mulated doses, are used. For irritants, the time at which the total fractional effective concentration (FEC) becomes equal to 1 is the time at which the average person will become incapacitated.
A generic equation for incapacitation due to sensory/upper respiratory irritants is
FEC = fHCl
FHCl
+ fHBr
FHBr
+ fHF
FHF
+ fSO2
FSO2
+ fNO2
FNO2
+
facrolein
Facrolein
+ fformaldehyde
Fformaldehyde
+ 3 firritant
Firritant
(9)
where irritant volume fractions are in µL/L. Consensus values of the denominator constants, F, were given in the prior section of this chapter.
Mass Loss Model
For many combustibles, there are no data and no predictive ca-pability for the yields of the toxic gases as a function of time. However, if an LC50 or an IC50 value has been measured, a simulation of toxic hazard is still possible. Rather than generat-ing individual gases and then distributing them throughout the building, this model distributes a single “gas,” the combusted mass from the burning fuels. The basic FED concept is then employed, giving Equation 10.46
FED = n
}
i = 1
t2 }
t1
∆m
V(Cti) ∆t (10)
where
∆m = Average accumulated mass loss (g) over the time increment, ∆t
V = Volume (m3) into which fire effluents are dispersed
∆t = Time increment (min)
(Cti) = ½(LCt)i in g · m–3 · min as determined from test meth-ods (e.g., NFPA 269)
*Although it is likely that the three components of the fire effluent act in combination to retard the escape process, there are very few data on which to base the quantification of the interactions. Thus, for example, it is not known whether or how elevated temperature affects a person’s ability to find his or her way through dense smoke.
†FDS, as well as all current “fire” models, does not contain the chem-istry to predict the generation rates of fire gases or aerosols. The yields of these species are input parameters, and the computational model dis-tributes the species around the building.
06-02.indd 2406-02.indd 24 11/6/2007 8:58:00 AM11/6/2007 8:58:00 AM

CHAPTER 2 ■ Combustion Products and Their Effects on Life Safety 6-25
As with the toxic gas model, the time required to reach FED = 1 can be defined as the most frequently expected time for incapacitation to occur for the person of median susceptibility to fire smoke. The mass loss model represents a considerable simplification for assessment of the life-threatening effects of combustion atmospheres:
It combines the effects of irritant and asphyxiant gases. Although there are data to indicate the additive effect of HCl and CO on the lethality for rats, there are no published data to verify this (or any other mode of combination) for people.It also presumes that the two types of gases stay in the same proportion to each other as they spread away from the fire. In this sense, the mass loss model is conservative, because the acid gases, for instance, are likely to stick to surfaces. Their concentrations thus diminish relative to those of the narcotic gases as one gets farther from the fire.
Further Simplification
An even further simplification employs a “generic” LCt50 value for lethal toxic potency when combustible fuel in a fire consists of a mixture of materials and products that are un-identified as to their nature and relative quantity. Suggested “generic” LCt50 values are 900 g/m3·min for well-ventilated, preflashover fires and 450 g/m3·min for vitiated, postflashover fires.46 For incapacitation, values of (Cti) in Equation 8 then be-come 450 g/m3·min for well-ventilated, preflashover fires and 220 g/m3·min for vitiated, postflashover fires. It is cautioned that these “generic” LCt50 values represent only an approxima-tion and their use should be subject to expert toxicological and engineering judgment.
Whereas compiled data of laboratory determination of LC50 values have a mean value of about 30 g/m3 for well- ventilated combustion, the measured values range from about 5 to 60 g/m3.55 Thus, there are some materials whose smoke is over five times as potent as the average material. Fortunately, flaming fires of toxicological importance generally involve a mixture of materials, and it is infrequent that such large fires would be dominated by a single product whose smoke is of very high toxicity. Nonetheless, the person performing the haz-ard or risk analysis should be aware of the presence of such materials.
Variability of Human Responses to Fire Gases
The variability of the responses of people to the toxicological insults of fires is best represented by a statistical distribution that takes into account their varying susceptibilities. The overall human population contains a number of subpopulations that ex-hibit a greater than average sensitivity to fire gas toxicants. The largest of such subpopulations are the very young, the elderly, and those who suffer from compromised respiratory systems (e.g., asthmatics). Infants and young children are particularly susceptible to asphyxiant toxicants due to a greater volume of air inhaled per minute relative to their body weight. The elderly, particularly those with compromised cardiovascular systems, are also especially susceptible to asphyxiant toxicants. Asth-matics, along with sufferers of other lung conditions such as
•
•
chronic bronchitis and reactive airways dysfunction syndrome, are particularly susceptible to bronchoconstriction from even brief exposure to low concentrations of irritants, with collapse and sometimes even death resulting. To provide a degree of pro-tection to these more vulnerable subpopulations, safe levels for exposure of the human population to fire gas toxicants must always be significantly lower than those that might cause inca-pacitation or other adverse effects with healthy young adults.
According to the methodology described, FED and/or FEC values of 1.0 are associated with sublethal effects that would incapacitate persons of average susceptibility. In the absence of information to the contrary, a log-normal distribution of human responses is a reasonable choice, with FED and/or FEC values of 1.0 corresponding to the median value of the distribution. (Half the population would be more susceptible to an insult and half would be less susceptible.) Statistics then show that at FED and/or FEC criteria of 0.3, 11.4 percent of the population would be susceptible to less severe exposures (lower than 0.3) and, therefore, be statistically subject to incapacitation.82
Lower criteria would reduce that portion of the popula-tion. These would be appropriate for occupancies in which the people are expected to be more susceptible to heat and smoke or for whom escape is more difficult and thus might take lon-ger. Examples of such occupancies are hospitals and schools for very young children. Note, however, that there is no criterion so low as to be statistically safe for all people. For proper balance between the effects of narcotic and irritant gases, the FEC and FED threshold criteria should be equal.
A consequence of the statistical distribution of human responses resulting from exposure of people to smoke atmo-spheres is that the distributions for two such responses, such as incapacitation and death, may overlap. This gives rise to a probability that some may die without others even being inca-pacitated. It is known that this occurs in real fires.
Extrapolation of Rodent Data to Humans
The propensity for smoke to have the same effects on humans in fires can only be inferred to the extent that the rat or mouse can be correlated with humans as a biological system. As a result of comparisons of rodent data with limited human and nonhu-man primate data, the use of the rat as an acceptable model for human exposure, at least for the asphyxiant gases, has received general endorsement among smoke toxicologists.54 The 30 minute exposure time for animals in laboratory smoke toxicity tests is considered by some to be rather long compared to most human exposures to smoke in fires. Traditional extrapolation of toxic potency test data for shorter exposures has presumed that the product of lethal concentration and exposure time is a constant.
A recent publication83 provides an estimation method for relating the normal rat lethality data to incapacitation values for smoke-sensitive people:
For materials and products that do not generate strong acid gases, assume that CO (as a surrogate for asphyxiants) is the primary toxicant and use one-fourth the 30 minute rat LC50 as the 5 minute human ICsens.For materials and products that do generate strong acid gases, narcotic gases still generally account for the majority
•
•
06-02.indd 2506-02.indd 25 11/6/2007 8:58:01 AM11/6/2007 8:58:01 AM
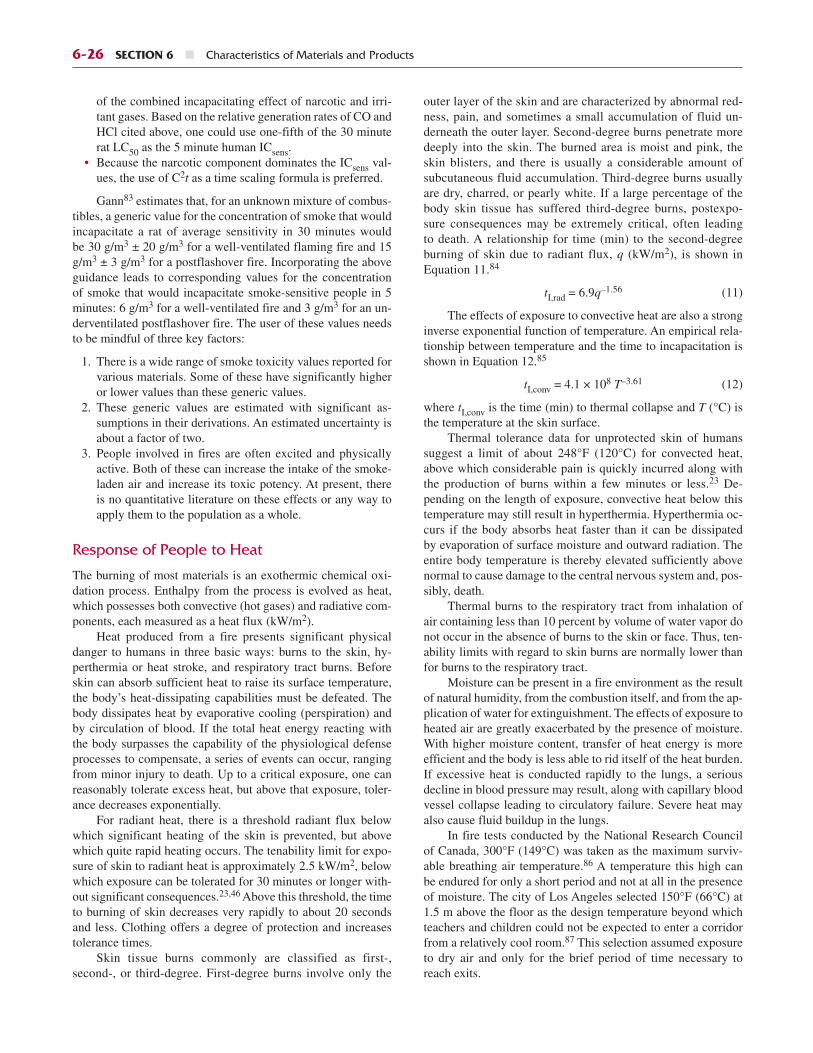
6-26 SECTION 6 ■ Characteristics of Materials and Products
of the combined incapacitating effect of narcotic and irri-tant gases. Based on the relative generation rates of CO and HCl cited above, one could use one-fifth of the 30 minute rat LC50 as the 5 minute human ICsens.Because the narcotic component dominates the ICsens val-ues, the use of C2t as a time scaling formula is preferred.
Gann83 estimates that, for an unknown mixture of combus-tibles, a generic value for the concentration of smoke that would incapacitate a rat of average sensitivity in 30 minutes would be 30 g/m3 ± 20 g/m3 for a well-ventilated flaming fire and 15 g/m3 ± 3 g/m3 for a postflashover fire. Incorporating the above guidance leads to corresponding values for the concentration of smoke that would incapacitate smoke-sensitive people in 5 minutes: 6 g/m3 for a well-ventilated fire and 3 g/m3 for an un-derventilated postflashover fire. The user of these values needs to be mindful of three key factors:
1. There is a wide range of smoke toxicity values reported for various materials. Some of these have significantly higher or lower values than these generic values.
2. These generic values are estimated with significant as-sumptions in their derivations. An estimated uncertainty is about a factor of two.
3. People involved in fires are often excited and physically active. Both of these can increase the intake of the smoke-laden air and increase its toxic potency. At present, there is no quantitative literature on these effects or any way to apply them to the population as a whole.
Response of People to Heat
The burning of most materials is an exothermic chemical oxi-dation process. Enthalpy from the process is evolved as heat, which possesses both convective (hot gases) and radiative com-ponents, each measured as a heat flux (kW/m2).
Heat produced from a fire presents significant physical danger to humans in three basic ways: burns to the skin, hy-perthermia or heat stroke, and respiratory tract burns. Before skin can absorb sufficient heat to raise its surface temperature, the body’s heat-dissipating capabilities must be defeated. The body dissipates heat by evaporative cooling (perspiration) and by circulation of blood. If the total heat energy reacting with the body surpasses the capability of the physiological defense processes to compensate, a series of events can occur, ranging from minor injury to death. Up to a critical exposure, one can reasonably tolerate excess heat, but above that exposure, toler-ance decreases exponentially.
For radiant heat, there is a threshold radiant flux below which significant heating of the skin is prevented, but above which quite rapid heating occurs. The tenability limit for expo-sure of skin to radiant heat is approximately 2.5 kW/m2, below which exposure can be tolerated for 30 minutes or longer with-out significant consequences.23,46 Above this threshold, the time to burning of skin decreases very rapidly to about 20 seconds and less. Clothing offers a degree of protection and increases tolerance times.
Skin tissue burns commonly are classified as first-, second-, or third-degree. First-degree burns involve only the
•
outer layer of the skin and are characterized by abnormal red-ness, pain, and sometimes a small accumulation of fluid un-derneath the outer layer. Second-degree burns penetrate more deeply into the skin. The burned area is moist and pink, the skin blisters, and there is usually a considerable amount of subcutaneous fluid accumulation. Third-degree burns usually are dry, charred, or pearly white. If a large percentage of the body skin tissue has suffered third-degree burns, postexpo-sure consequences may be extremely critical, often leading to death. A relationship for time (min) to the second-degree burning of skin due to radiant flux, q (kW/m2), is shown in Equation 11.84
tI,rad = 6.9q–1.56 (11)
The effects of exposure to convective heat are also a strong inverse exponential function of temperature. An empirical rela-tionship between temperature and the time to incapacitation is shown in Equation 12.85
tI,conv = 4.1 × 10⁸ T–3.61 (12)
where tI,conv is the time (min) to thermal collapse and T (°C) is the temperature at the skin surface.
Thermal tolerance data for unprotected skin of humans suggest a limit of about 248°F (120°C) for convected heat, above which considerable pain is quickly incurred along with the production of burns within a few minutes or less.23 De-pending on the length of exposure, convective heat below this temperature may still result in hyperthermia. Hyperthermia oc-curs if the body absorbs heat faster than it can be dissipated by evaporation of surface moisture and outward radiation. The entire body temperature is thereby elevated sufficiently above normal to cause damage to the central nervous system and, pos-sibly, death.
Thermal burns to the respiratory tract from inhalation of air containing less than 10 percent by volume of water vapor do not occur in the absence of burns to the skin or face. Thus, ten-ability limits with regard to skin burns are normally lower than for burns to the respiratory tract.
Moisture can be present in a fire environment as the result of natural humidity, from the combustion itself, and from the ap-plication of water for extinguishment. The effects of exposure to heated air are greatly exacerbated by the presence of moisture. With higher moisture content, transfer of heat energy is more efficient and the body is less able to rid itself of the heat burden. If excessive heat is conducted rapidly to the lungs, a serious decline in blood pressure may result, along with capillary blood vessel collapse leading to circulatory failure. Severe heat may also cause fluid buildup in the lungs.
In fire tests conducted by the National Research Council of Canada, 300°F (149°C) was taken as the maximum surviv-able breathing air temperature.86 A temperature this high can be endured for only a short period and not at all in the presence of moisture. The city of Los Angeles selected 150°F (66°C) at 1.5 m above the floor as the design temperature beyond which teachers and children could not be expected to enter a corridor from a relatively cool room.87 This selection assumed exposure to dry air and only for the brief period of time necessary to reach exits.
06-02.indd 2606-02.indd 26 11/6/2007 8:58:01 AM11/6/2007 8:58:01 AM

CHAPTER 2 ■ Combustion Products and Their Effects on Life Safety 6-27
Response of People to Visible Smoke
In addition to fire gases, smoke also consists of particulate mat-ter, formed from the burning of most materials under the condi-tions of incomplete combustion, and suspended liquid droplets known as aerosols. Since the average size of the particulates and aerosols is about the same as the wavelength of visible light, light is scattered and vision through smoke can be obscured. Petroleum-derived materials, especially those from aromatic hydrocarbons, are particularly prone to the formation of dark, sooty smoke. There is, however, no established relationship be-tween the color of the smoke and the toxicity of fire gases that may be present.
Since smoke obscures the passage of light, visibility to exits may be hampered, impairing escape from a fire. The de-velopment of quantities of smoke sufficient to impair egress can be very rapid and usually is the first hazard to occur in a fire. As evidenced in nearly every one of the Los Angeles school fire tests, smoke in the corridors arising from fires in the basement reached untenable levels before temperatures attained hazard-ous condition.87 Smoke was therefore the principal hazard. Al-though smoke frequently provides an early warning of fire, it also limits visibility because of its blinding and irritating effects, slowing escape.
Obscuration of vision due to smoke is related to its con-centration and is usually expressed as optical density per meter, OD (m–1). Visibility is, then, the reciprocal of the OD. People’s response to obscuration of vision and its detrimen-tal effects on the speed of movement and way-finding effi-ciency is highly variable. Visibility requirements for escape depend to a large extent on the size of an enclosure and oc-cupants’ familiarity with escape routes. Suggested OD limits for impairment of egress have ranged from 0.5 m–1 (2 m vis-ibility),88 for occupants of small rooms who are familiar with escape routes, down to about 0.065 m–1 (15 m visibility),89 for large enclosures in which occupants are unfamiliar with their surroundings.
For visible smoke, the equivalent of toxicological incapaci-tation for fire gases is an inability to orient oneself with one’s surroundings. This is the equivalent to not being able to see one’s hand in front of one’s face. ISO 13571 estimates that this occurs when a person is confronted with a fuel mass loss concentration of 20 g/m3 for well-ventilated fires and 10 g/m3 for underventi-lated fires.46 This is based on a minimum detectible contrast of 0.0290 for a distance of 0.5 m, published smoke yields,91,92 and a generic value of the mass specific extinction coefficient of the smoke91 of 10 m2/g. At these high smoke densities, the presence of light-reflecting or light-emitting exit signs does not change the incapacitation criterion significantly. The equivalent smoke optical density is 1.7 m–1.
The analog to people who are sensitive to the inhalation of fire gases is people who require a higher degree of contrast to discern an object against a background. If one intended to provide the same additional degree of protection as with, for example, the FED value of 0.3, the incapacitating concentra-tions of smoke would be 15 g/m3 for well-ventilated fires and 7 g/m3 for underventilated fires. This reflects the logarithmic dependence on the capacity for visual perception.
Smoke particulates and aerosols also can be harmful when inhaled, and long exposure may cause damage to the respiratory system. Also, smoke particulates often are of a sufficiently small size that enable them to be inhaled deeply into the lungs, where adsorbed toxicants may produce damage to the respiratory sys-tem. These effects have not been sufficiently studied to enable a full understanding of their consequences.
DEVELOPMENT OF TOXIC HAZARDS IN FULL-SCALE FIRES
Importance of Full-Scale Experiments
While lab-scale tests and fire models can provide valuable in-sight into ignition and fire growth, full-scale experiments are still necessary to understand and validate critical fire phenom-ena. Full-scale fire reconstructions can document many im-portant interactions within a fire environment not captured by small-scale tests or fire models. These interactions can include how fuel density can impact fire growth, how the thermal feed-back from a hot smoke layer may increase the pyrolysis of the fuel, how specific fuels may generate toxic gases in vitiated smoke layers, or how the lack of ventilation can limit fire de-velopment. Full-scale experiments or reconstructions are often used to better understand the development of toxic hazards in specific fire incidents, especially scenarios with unusual condi-tions. An example of an incident that exhibited some unusual conditions, including rapid fire growth, quick smoke layer de-velopment, and multiple toxic gas species, was a fire that oc-curred on February 20, 2003, in the Station Nightclub in West Warwick, Rhode Island.
Reconstruction of Station Nightclub Fire
Full-scale experiments were conducted at NIST to reconstruct the fire and better understand how the toxic hazard may have developed that night in the Station Nightclub.93 During a band performance at the nightclub, pyrotechnics ignited polyurethane foam insulation that lined the walls and ceiling of the band plat-form. The fire spread quickly along the walls and ceiling area over the dance floor. Smoke was visible in the exit doorways in a little more than 1 minute, and flames were observed break-ing through a portion of the roof in less than 5 minutes. Egress from the nightclub, which was not equipped with sprinklers, was hampered by crowding at the main entrance to the building. One hundred people lost their lives in the fire.
In order to characterize the fire growth and spread in the early stage of the fire, two real-scale mockup experiments re-constructed approximately 20 percent of the nightclub with polyurethane foam covered walls, a drummer’s alcove, a raised platform, carpeting, and wood paneling. Figure 6.2.7 shows the dimensions of the mock-up floor plan and Figure 6.2.8 compares the test compartment to a floor plan of the nightclub. Full-scale data, including gas temperatures, heat fluxes, and gas concentra-tions, provided insight as to how quickly the toxic hazards, in particular, the generation of CO and HCN, can develop during the early stages of a fire.
06-02.indd 2706-02.indd 27 11/6/2007 8:58:01 AM11/6/2007 8:58:01 AM

6-28 SECTION 6 ■ Characteristics of Materials and Products
A physical mock-up was created at the NIST Large Fire Laboratory with overall floor dimensions of the test room of 10.8 m by 7.0 m, and a ceiling height of 3.8 m. A single open-ing, 0.91 m wide and 2.0 m high was located in the wall opposite the alcove. The test area was constructed with a structural steel
frame, lined with two layers of 12 mm thick calcium silicate board, covered with 12 mm thick gypsum board. The walls of the alcove and the raised floor area had 5.2 mm thick plywood paneling installed over the gypsum board. The paneling had a flame spread index of 200 or less, as tested by ASTM E84, Stan-
Polyurethane foam
Wood paneling
Remaining wallsand ceiling (lined
with gypsum board)
3.8 m
3.8 m
3.1 m
2.28 m7 m
Door opening(0.91 m wide × 2 m high)
Main floor(lined with gypsum board)
2.7 m
1.2 m1.1 m
1.56 m
0.74 m
0.4 m
5.94 m
2.44 m 2.4 m
Alcove (walls and ceiling lined with polyurethane foam, floor nylon carpeting)
Raised floor(nylon carpeting)
FIGURE 6.2.7 Isometric View of Test Compartment and Fuels (Source: National Institute of Standards and Technology)
Office Restroom
Restroom
Side bar
Kitchen
Mainbar
Rear
Raiseddining area
Dancefloor Alcove
Raised
platform
Sunroom
Dressingroom
FrontFront entrance
doors
Kitchenexit door
Main barside exit
door
32.8 m
26.5 m
20.9 m
Platformexit door
FIGURE 6.2.8 Full-Scale Mock-Up Floor Plan Versus Station Nightclub Floor Plan (Source: National Institute of Standards and Technology)
06-02.indd 2806-02.indd 28 11/6/2007 8:58:01 AM11/6/2007 8:58:01 AM

CHAPTER 2 ■ Combustion Products and Their Effects on Life Safety 6-29
dard Test Method for Surface Burning Characteristics of Build-ing Materials,94 according to the manufacturer. The plywood paneling extended 3.6 m from the raised floor along the rear wall of the test area. The rear wall was adjacent to the platform on the right as one stands on the platform facing the audience (stage-right). A non-fire-retardant, ether-based polyurethane foam was glued over the paneling in the alcove and along the walls on both sides of the alcove opening and to the rear wall. The flat side of the foam was mounted next to the plywood and the convoluted side was left exposed. The foam was installed from the top of the wall down to 1.35 m above the floor. It was also applied to the ceiling of the alcove and extended for 2.4 m from the raised floor along the rear wall.
The test room (Figure 6.2.9) was equipped with thermo-couples, video cameras, heat flux gauges, bidirectional probes, and gas extraction probes to measure CO, CO2, O2, and HCN. In addition, fixed temperature and rate-of-rise heat detectors were installed, as were sprinklers. Data for 194 channels were recorded at 1 second intervals. Ignition of the foam was initi-ated simultaneously using electric matches at two locations on the outer corners of the alcove, 1.66 m above the raised floor area. The fire gases that emerged from the open door on the end of the test room were captured in the hood of the oxygen depletion calorimeter. The succession of video frames in Figure 6.2.10 show how rapidly the fire spreads during the first 90 seconds.
Data were collected at several locations as indicated in Fig-ure 6.2.9. Selected data (collected at Location D, on the center-line of the doorway and 6 m from the front of the drummer’s
alcove) including gas concentrations (O2, CO, CO2, and HCN), gas temperatures, and heat fluxes, are presented in Figures
ignited at two locations on either side of the drummer’s alcove. The fire spread up the polyurethane foam wall lining on both sides of the alcove and within 60 seconds the alcove was fully involved. The smoke layer continued to descend quickly and, within 90 seconds, the layer was near the floor of the mock-up compartment.
In less than 90 seconds, conditions at Location D and 1.4 m above the floor included gas temperatures exceeding 750°F (400°C), total heat flux in excess of 30 kW/m2, O2 volume frac-tions below 0.05, and HCN and CO volume fractions greater than 0.0015 and 0.03, respectively. The tenability of the com-partment deteriorated quickly due to high temperature, high heat flux, O2 depletion, and toxic concentrations of HCN and CO. Exceeding the tenability limit does not imply that any or all oc-cupants who are present in that environment will succumb due to a particular limit exceeded. The length of time exposed, the rate of change of the environmental conditions, the individual’s starting location, his/her breathing rate, and the susceptibility of the individual all play a role. Occupants in this compartment would have likely have had less than 1½ minutes to escape safely from this rapidly growing fire.
A second mock-up experiment was also conducted and was a duplicate of the first except that automatic water sprinklers were installed and charged. Sprinkler heads began to activate in less than 30 seconds and quickly controlled the fire growth. Through-out the second experiment, conditions in the compartment at
TC TC TC TC TC TC TC TC TC TC TC TC TC TC TC TC
TC
TC
TC
TC
TC
TC
TC
TC
TCTC
TC
HF
HF
TC
TC
V
V
V
TC TC
TC TC
TC
TCHF TC
TC
HF
G G
G
V
Water sprinkler
Thermocouple
Gas sampling
Heat flux
Video camera
2.35 m
4.25 m
7.1 m
Front wall
Rear wall
Main floor
Raisedplatform
Alcove
Location ALocation B
Location C
Location D
2.85 m 3.66 m 1.83 m
1.2 m
1.67 m
3.66 m
1.67 m
2.74 m
FIGURE 6.2.9 Schematic Floor Plan with Instrumentation Positions (Source: National Institute of Standards and Technology)
06-02.indd 2906-02.indd 29 11/6/2007 8:58:02 AM11/6/2007 8:58:02 AM
6.2.11 and 6.2.12. As can be seen in Figure 6.2.10, the fire was
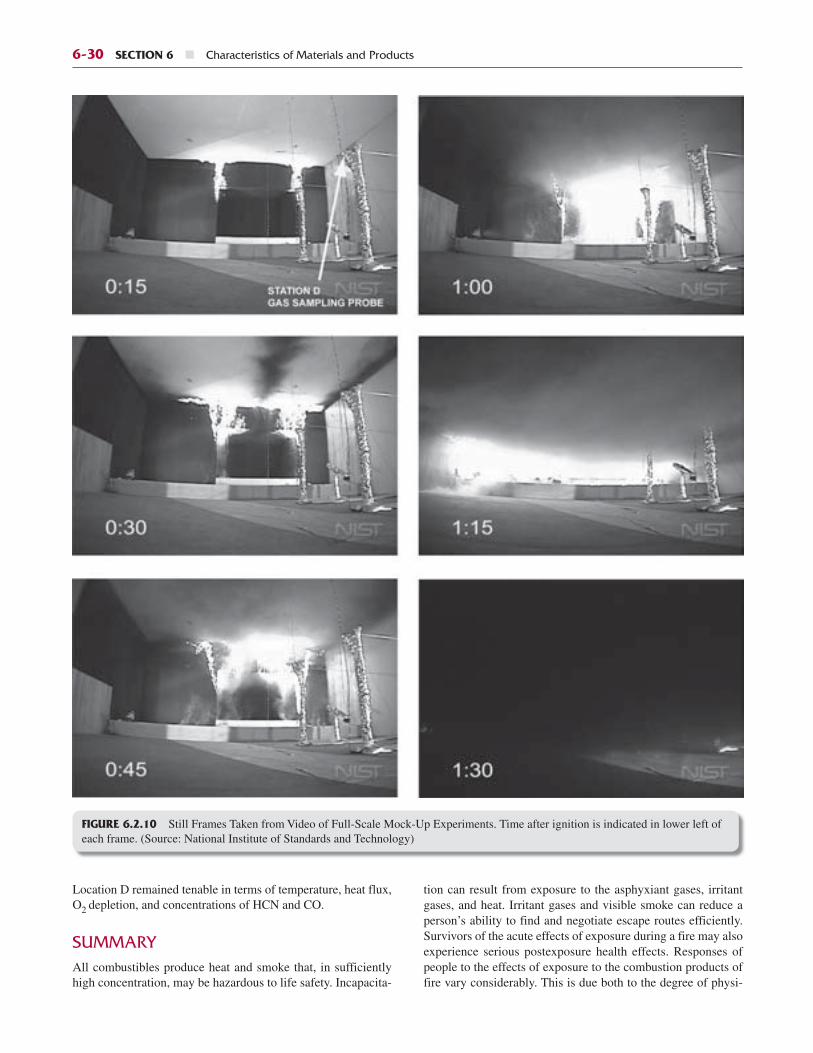
6-30 SECTION 6 ■ Characteristics of Materials and Products
Location D remained tenable in terms of temperature, heat flux, O2 depletion, and concentrations of HCN and CO.
SUMMARYAll combustibles produce heat and smoke that, in sufficiently high concentration, may be hazardous to life safety. Incapacita-
tion can result from exposure to the asphyxiant gases, irritant gases, and heat. Irritant gases and visible smoke can reduce a person’s ability to find and negotiate escape routes efficiently. Survivors of the acute effects of exposure during a fire may also experience serious postexposure health effects. Responses of people to the effects of exposure to the combustion products of fire vary considerably. This is due both to the degree of physi-
FIGURE 6.2.10 Still Frames Taken from Video of Full-Scale Mock-Up Experiments. Time after ignition is indicated in lower left of each frame. (Source: National Institute of Standards and Technology)
06-02.indd 3006-02.indd 30 11/6/2007 8:58:03 AM11/6/2007 8:58:03 AM

CHAPTER 2 ■ Combustion Products and Their Effects on Life Safety 6-31
cal activity during exposure and to the vulnerability of certain subpopulations. Techniques are available for estimating the fire environments that can led to incapacitation of building occu-pants. The understanding for estimating other sublethal effects and postexposure harm is not yet developed.
The testing of materials and products in the laboratory does not, in itself, address their toxic hazards when involved in fires. Numerous other factors, including their heat release and mass burning rates, contribution of other combustibles present, size and configuration of the enclosure, ventilation, smoke transport, the nature of the occupants, and occupant movement also affect toxic fire hazard. These factors must all be considered in concert.
BIBLIOGRAPHYReferences Cited
1. ASTM E176-04, Standard Terminology of Fire Standards, ASTM International, W. Conshohocken, PA, 2004.
2. Beyler, C. L., and Hirschler, M. M., “Thermal Decomposition of Polymers,” SFPE Handbook of Fire Protection Engineering, 3rd ed., P. J. DiNenno et al. (Eds.), National Fire Protection Associa-tion, Quincy, MA, 2002, pp. 1-110–1-131.
3. Gann, R. G., Babrauskas, V., Peacock, R. D., and Hall, J. R., Jr., “Fire Conditions for Smoke Toxicity Measurement,” Fire and Materials, Vol. 18, No. 2, 1994, pp. 193–199.
4. Babrauskas, V., Harris, R. H., Jr., Gann, R. G., Levin, B. C., Lee, B. T., Peacock, R. D., Paabo, M., Twilley, W., Yoklavich, M. F.,
0 50 100
Time, sec
150 200
1000
800
600
400
200
0 0
10
20
30
40
50
Gas
tem
pera
ture
, ˚C
Tota
l hea
t flu
x, k
W/m
2
Gas temperature at ceiling
Gas temperature 1.4 m above floor
Total heat flux—1.4 m above floor, gauge facing ceiling
Total heat flux—1.4 m above floor, gauge facing alcove
Ignitionat t = 0
FIGURE 6.2.12 Gas Temperatures and Total Heat Fluxes Measured at Location D During First 200 Seconds of Unsprinklered Mock-Up Experiment. Ignition occurred at t = 0. (Source: National Institute of Standards and Technology)
0 50 100
Time, sec
150 200
25
20
15
10
5
0 0
1
2
3
4
5
6O
xyge
n, v
olum
e %
0
2
0
4
6
8
10
12
14
16
Car
bon
diox
ide,
vol
ume
%
0.05
0
0.1
0.15
0.2
0.25
Hyd
roge
n cy
anid
e, v
olum
e %
Car
bon
mon
oxid
e, v
olum
e %
Oxygen concentration, volume %
Carbon dioxide concentration, volume %
Carbon monoxide concentration, volume %
Hydrogen cyanide concentration, volume %
Ignition at t = 0
FIGURE 6.2.11 Gas Concentrations Measured at Location D During First 200 Seconds of Unsprinklered Mock-Up Experiment. Gas sampling probe was located 1.4 m above the floor. Ignition occurred at t = 0. (Source: National Institute of Standards and Technology)
06-02.indd 3106-02.indd 31 11/6/2007 8:58:06 AM11/6/2007 8:58:06 AM
6-32 SECTION 6 ■ Characteristics of Materials and Products
and Clark, H. M., “Fire Hazard Comparison of Fire-Retarded and Non-Fire-Retarded Products,” NBS Special Publication 749, National Bureau of Standards, U.S. Department of Commerce, Gaithersburg, MD, 1988.
5. Ohlemiller, T. J., “Smoldering Combustion,” SFPE Handbook of Fire Protection Engineering, 3rd ed., P. J. DiNenno et al. (Eds.), National Fire Protection Association, Quincy, MA, 2002, pp. 2-200–2-211.
6. Pitts, W. M., The Global Equivalence Ratio Concept and the Prediction of Carbon Monoxide Formation in Enclosure Fires, NIST Monograph 179, National Institute of Standards and Tech-nology, Gaithersburg, MD, 1994.
7. Tewarson, A., “Generation of Heat and Chemical Compounds in Fires,” SFPE Handbook of Fire Protection Engineering, 3rd ed., P. J. DiNenno et al. (Eds.), National Fire Protection Association, Quincy, MA, 2002, pp. 3-82–3-161.
8. Grand, A. F., Kaplan, H. L., Beitel, J. J., Switzer, W. G., and Hartzell, G. E., “An Evaluation of Toxic Hazards from Full-Scale Furnished Room Fire Studies,” Special Technical Publica-tion 882, ASTM International, W. Conshohocken, PA, 1986, pp. 330–353.
9. Babrauskas, V., Levin, B. C., Gann, R. G., Paabo, M., Harris, R. H., Jr., Peacock, R. D., and Yusa, S., “Toxic Potency Measure-ment for Fire Hazard Analysis,” NIST Special Publication 827, National Institute of Standards and Technology, Gaithersburg, MD, 1991.
10. ISO 19706, “Guidelines for Assessing the Fire Threat to People,” International Organization for Standardization, Geneva, Switzer-land, 2007.
11. Tsuchiya, Y., “Relative Significance of NOx and HCN in Fire Gas Toxicity,” Fire Safety Science—Proceedings of the 2nd International Symposium, T. Wakamatsu (Ed.), Hemisphere Pub-lishing Co., New York, 1989, pp. 381–390.
12. National Institute of Standards and Technology, unpublished results.
13. Chandler, L. A., Hirschler, M. M., and Smith, G. F., “A Heated Tube Furnace Test for the Emission of Acid Gas from PVC Wire Coating Materials: Effects of Experimental Procedures and Mechanistic Considerations,” European Polymer Journal, Vol. 23, 1987, pp. 51–61.
14. Beitel, J. J., Bertello, C. A., Carroll, W. F., Jr., Grand, A. F., Hirschler, M. M., and Smith, G. F., “Hydrogen Chloride Trans-port and Decay in a Large Apparatus: II, Variables Affecting Hy-drogen Chloride Decay,” Journal of Fire Sciences, Vol. 5, No. 2, 1987, pp. 105–145.
15. Herzberg, T., Blomqvist, P., Dalene, M., and Skarping, G., Par-ticles and Isocyanates from Fires, Report 2003:05, SP Swedish National Testing and Research Institute, Boras, Sweden, 2003.
16. Burgess, W. A., Treitman, R. D., and Gold, A., Air Contaminants in Structural Firefighting, Harvard School of Public Health, Bos-ton, 1979.
17. Potts, J. W., Lederer, T. S., and Quast, J. F., “A Study of Inhala-tion Toxicity of Smoke Produced upon Pyrolysis and Combus-tion of Polyethylene Foams, Part I: Laboratory Studies,” Journal of Combustion Toxicology, Vol. 5, 1978, pp. 408–433.
18. 2006 TLVs and BEIs, American Conference of Governmental Industrial Hygienists, Cincinnati, OH, 2006.
19. Smith, R. P., “Toxic Responses of the Blood,” Casarett and Doull’s Toxicology, 3rd ed., Macmillan, New York, 1986, pp. 228–231.
20. DIS 27368, “Analysis of Blood for Asphyxiant Toxicants— Carbon Monoxide and Hydrogen Cyanide,” ISO TC92 SC3, International Organization for Standardization, Geneva, Switzer-land, 2007.
21. Roughton, F. J. W., and Darling, R. C., “The Effect of Carbon Monoxide on the Oxyhemoglobin Dissociation Curve,” Ameri-can Journal of Physiology, Vol. 141, 1944, pp. 17–31.
22. Esposito, F. M., and Alarie, Y., “Inhalation Toxicity of Carbon Monoxide and Hydrogen Cyanide Gases Released During the Thermal Decomposition of Polymers,” Advances in Combustion
Toxicology, Vol. III, G. E. Hartzell (Ed.), Technomic Publishing Co., Inc., Lancaster, PA, 1992, pp. 78–125.
23. Purser, D. A., “Toxicity Assessment of Combustion Products,” SFPE Handbook of Fire Protection Engineering, 3rd ed., P. J. DiNenno et al. (Eds.), National Fire Protection Association, Quincy, MA, 2002, pp. 2-83–2-171.
24. Hirschler, M. M. (Ed.), Carbon Monoxide and Human Lethality, Elsevier Science Ltd., Oxford, UK, 1993.
25. Christian, S. D., and Shields, T. J., “Safe Tolerability Limits for Carbon Monoxide? A Review of the Clinical and Fire Engineer-ing Implications of a Single, Acute, Sublethal Exposure,” Jour-nal of Fire Sciences, Vol. 18, 2000, pp. 308–323.
26. Stewart, R. D., Peterson, J. E., Fisher, T. N., Hosko, M. J., Bar-etta, E. D., Dodd, H. C., and Herrmann, A. A., “Experimental Human Exposure to High Concentrations of Carbon Monoxide,” Archives of Environmental Health, Vol. 26, 1973, pp. 1–7.
27. Kaplan, H. L., and Hartzell, G. E., “Modeling of Toxicological Effects of Fire Gases: I. Incapacitating Effects of Narcotic Fire Gases,” Journal of Fire Sciences, Vol. 2, No. 4, 1984, pp. 286–305.
28. Sanders, D. C., and Endecott, B. R., “The Effect of Elevated Temperature on Carbon Monoxide–Induced Incapacitation,” Advances in Combustion Toxicology, Vol. 3, G. E. Hartzell (Ed.), Technomic Publishing Co., Lancaster, PA, 1992, pp. 343–357.
29. Swinyard, E. A., “Noxious Gases and Vapors: Carbon Monox-ide, Hydrocyanic Acid, Benzene, Gasoline, Kerosene, Carbon Tetrachloride, and Miscellaneous Organic Solvents,” The Phar-macological Basis of Therapeutics, 3rd ed., L. Goodman and A. Gilman (Eds.), Macmillan, New York, 1965, pp. 915–928.
30. Purser, D. A., Grimshaw, P., and Berrille, K. R., “Intoxication by Cyanide in Fires: A Study in Monkeys Using Polyacrylonitrile,” Archives of Environmental Health, Vol. 39, 1984, p. 394.
31. Kimmerle, G., “Aspects and Methodology for the Evaluation of Toxicological Parameters During Fire Exposure,” Journal of Fire and Flammability/Combustion Toxicology Supplement, Vol. 1, 1974, p. 42.
32. Halpin, B. M., and Berl, W. G., “Human Fatalities from Un-wanted Fires,” Report NBS-GCR-79-168, U.S. National Bureau of Standards, Washington, DC, 1978.
33. Harland, W. A., and Woolley, W. D., “Fire Fatality Study,” Build-ing Research Establishment Information Paper, IP 18/79, Univer-sity of Glasgow, Glasgow, UK, 1979.
34. Hartzell, G. E., Switzer, W. G., and Priest, D. N., “Modeling of Toxicological Effects of Fire Gases: V. Mathematical Modeling of Intoxication of Rats by Combined Carbon Monoxide and Hy-drogen Cyanide Atmospheres,” Journal of Fire Sciences, Vol. 3, No. 5, 1985, pp. 330–342.
35. Levin, B. C., Paabo, M., Gurman, J. L., and Harris, S. E., “Ef-fects of Exposure to Single or Multiple Combinations of the Pre-dominant Toxic Gases and Low-Oxygen Atmospheres Produced in Fires,” Fundamental and Applied Toxicology, Vol. 9, 1987, pp. 236–250.
36. Hartzell, G. E., and Switzer, W. G., “On the Toxicities of Atmo-spheres Containing Both CO and CO2,” Journal of Fire Sciences, Vol. 3, No. 5, 1985, pp. 307–309.
37. Levin, B. C., Paabo, M., Gurman, J. L., Harris, S. E., and Braun, E., “Toxicological Interactions Between Carbon Monoxide and Carbon Dioxide,” Proceedings of the 16th Conference of Toxi-cology, Air Force Medical Research Laboratory, Dayton, OH, 1986; Toxicology, Vol. 47, 1987, pp. 135–164.
38. Reinke, R. W., and Reinhardt, C. F., “Fire, Toxicity, and Plas-tics,” Modern Plastics, Feb. 1973, pp. 94–98.
39. Purser, D. A., “Toxicity Assessment of Combustion Products,” SFPE Handbook of Fire Protection Engineering, 3rd ed., P. J. DiNenno et al. (Eds.), National Fire Protection Association, Quincy, MA, 2002, pp. 2-83–2-171.
40. Kane, L. E., Barrow, C. S., and Alarie, Y., “A Short-Term Test to Predict Acceptable Levels of Exposure to Airborne Sensory Irritants,” American Industrial Hygiene Association Journal, Vol. 40, 1979, pp. 207–229.
06-02.indd 3206-02.indd 32 11/6/2007 8:58:07 AM11/6/2007 8:58:07 AM

CHAPTER 2 ■ Combustion Products and Their Effects on Life Safety 6-33
41. Kaplan, H. L., Grand, A. F., Switzer, W. G., Mitchell, D. S., Rog-ers, W. R., and Hartzell, G. E., “Effects of Combustion Gases on Escape Performance of the Baboon and the Rat,” Journal of Fire Sciences, Vol. 3, No. 4, 1985, pp. 228–244.
42. Kaplan, H. L., Switzer, W. G., Hinderer, R. K., and Anzueto, A., “Acute and Long-Term Effects of Polyvinylchloride (PVC) Smoke on the Respiratory System of the Baboon and a Compari-son with the Effects of Hydrogen Chloride (HCl),” Journal of Fire Sciences, Vol. 11, No. 6, 1993, pp. 485–511.
43. Kaplan, H. L., Switzer, W. G., Hinderer, R. K., and Anzueto, A., “Studies of the Effects of Hydrogen Chloride and Polyvinyl-chloride (PVC) Smoke in Rodents,” Journal of Fire Sciences, Vol. 11, No. 6, 1993, pp. 512–552.
44. Hartzell, G. E., Packham, S. C., Grand, A. F., and Switzer, W. G., “Modeling of Toxicological Effects of Fire Gases: III. Quantifi-cation of Postexposure Lethality of Rats from Exposure to HCl Atmospheres,” Journal of Fire Sciences, Vol. 3, No. 3, 1985, pp. 195–207.
45. Kaplan, H. L., Switzer, W. G., Hinderer, R. K., and Anzueto, A., “A Study on the Acute and Long-Term Effects of Hydrogen Chloride on the Respiratory Response and Pulmonary Func-tion and Morphology in the Baboon,” Journal of Fire Sciences, Vol. 11, 1993, pp. 459–484.
46. ISO 1357l, Life-Threatening Components of Fire—Guidelines for the Estimation of Time Available for Escape Using Fire Data, International Organization for Standardization, Geneva, Switzer-land, 2007.
47. Levin, B. C., Paabo, M., Highbarger, L., and Eller, N., “Syn-ergistic Effects of Nitrogen Dioxide and Carbon Dioxide Fol-lowing Acute Inhalation Exposures in Rats,” NISTIR 89-4105, National Institute of Standards and Technology, Gaithersburg, MD, 1989.
48. Petajan, J. H., Voorhees, K. J., Packham, S. C., Baldwin, R. C., Einhorn, I. N., Grunnet, M. L., Dinger, B. G., and Birky, M. M., “Extreme Toxicity for Combustion Products of a Fire-Retarded Polyurethane Foam,” Science, Vol. 187, 1975, pp. 742–744.
49. Baker, B. B., Jr., and Kaiser, M. A., “Understanding What Hap-pens in a Fire,” Analytical Chemistry, Vol. 63, 1991, pp. 79–83.
50. Purser, D. A., and Woolley, W. D., “Biological Studies of Com-bustion Atmospheres,” Journal of Fire Sciences, Vol. 1, No. 2, 1983, pp. 118–144.
51. Levin, B. C., Paabo, M., Bailey, C., Harris, S. E., and Gurman, J. L., “Toxicological Effects of the Interactions of Fire Gases and Their Use in a Toxic Hazard Assessment Computer Model,” The Toxicologist, Vol. 5, 1985, p. 127.
52. ISO 13344, “Determination of the Lethal Toxic Potency of Fire Effluents,” International Organization for Standardization, Ge-neva, Switzerland, 2004.
53. ASTM E1678-02, Standard Test Method for Measuring Smoke Toxicity for Use in Fire Hazard Analysis, ASTM International, W. Conshohocken, PA, 2002.
54. ISO/TR 9122, Part 5, “Prediction of the Toxic Effects of Fire Ef-fluents,” International Organization for Standardization, Geneva, Switzerland, 1993.
55. Neviaser, J. L., and Gann, R. G., “Evaluation of Toxic Potency Values for Smoke from Products and Materials,” Fire Technol-ogy, Vol. 40, No. 2, 2004, pp. 177–199.
56. Tsuchiya, Y., and Sumi, K., “Evaluation of Toxicity of Combus-tion Products,” Journal of Fire and Flammability, Vol. 2, 1972, pp. 46–50.
57. Hartzell, G. E., Grand, A. F., and Switzer, W. G., “Modeling of Toxicological Effects of Fire Gases: VI. Further Studies on the Toxicity of Smoke Containing Hydrogen Chloride,” Journal of Fire Sciences, Vol. 5, No. 6, 1987, pp. 368–391.
58. Hartzell, G. E., Grand, A. F., and Switzer, W. G., “Toxicity of Smoke Containing Hydrogen Chloride,” Fire and Polymers, G. L. Nelson (Ed.), American Chemical Society, Washington, DC, 1990, pp. 12–20.
59. Hartzell, G. E., Priest, D. N., and Switzer, W. G., “Modeling of Toxicological Effects of Fire Gases: II. Mathematical Modeling
of Intoxication of Rats by Carbon Monoxide and Hydrogen Cyanide,” Journal of Fire Sciences, Vol. 3, No. 2, 1985, pp. 115–128.
60. Hartzell, G. E., and Emmons, H. W., “The Fractional Effective Dose Model for Assessment of Toxic Hazards in Fires,” Journal of Fire Sciences, Vol. 6, No. 5, 1988, pp. 356–362.
61. Pauluhn, J., “A Retrospective Analysis of Predicted and Ob-served Smoke Lethal Toxic Potency Values,” Journal of Fire Sci-ences, Vol. 11, No. 2, 1993, pp. 109–130.
62. Purser, D. A., “Interactions Among Carbon Monoxide, Hydrogen Cyanide, Low Oxygen Hypoxia, Carbon Dioxide and Inhaled Irritant Gases,” Carbon Monoxide Toxicity, Penney, D. G. (Ed.), CRC Press, Boca Raton, FL, 2000, pp. 157–191.
63. Levin, B. C., Paabo, M., Gurman, J. L., Clark, H. M., and Yoklavich, M. F., “Further Studies of the Toxicological Effects of Different Time Exposures to the Individual and Combined Fire Gases: Carbon Monoxide, Hydrogen Cyanide, Carbon Di-oxide, and Reduced Oxygen,” Polyurethanes ’88—Proceedings of the 31st Society of the Plastics Industry, Polyurethane Divi-sion Meeting, Technomic Publishing, Lancaster, PA, 1988, pp. 249–252.
64. Barrow, C. S., Alarie, Y., and Stock, M. F., “Sensory Irritation Evoked by the Thermal Decomposition Products of Plasticized Poly-Vinyl Chloride,” Fire and Materials, Vol. 1, 1976, pp. 147–153.
65. Kaplan, H. L., Grand, A. F., and Hartzell, G. E., Combustion Toxicology: Principles and Test Methods, Technomic Publishing, Lancaster, PA, 1983.
66. ISO 16312-1, “Guidance for Assessing the Validity of Physical Fire Models for Obtaining Fire Effluent Toxicity Data for Fire Hazard and Risk Assessment—Part 1: Criteria,” International Standards Organization, Geneva, Switzerland, 2006.
67. ISO/TR 16312-2, “Guidance for Assessing the Validity of Physi-cal Fire Models for Obtaining Fire Effluent Toxicity Data for Fire Hazard and Risk Assessment—Part 2: Evaluation of Indi-vidual Physical Fire Models,” International Standards Organiza-tion, Geneva, Switzerland, 2007.
68. Levin, B. C., Fowell, A. J., Birky, M. M., Paabo, M., Stolte, A., and Malek, D., “Further Development of a Test Method for Assessment of the Acute Inhalation Toxicity of Combustion Products,” NBSIR 82-2532, National Institute of Standards and Technology, Gaithersburg, MD, 1982.
69. Grand, A. F., “Development of a Product Performance Smoke Toxicity Test,” Final Report to the National Institute of Building Sciences, Project 01-1744, Southwest Research Institute, San Antonio, TX, 1990.
70. Babrauskas, V., Harris, R. H., Jr., Braun, E., Levin, B. C., Paabo, M., and Gann, R. G., The Role of Bench-Scale Test Data in As-sessing Real-Scale Fire Toxicity, NIST Technical Note 1284, Na-tional Institute of Standards and Technology, Gaithersburg, MD, 1991.
71. “New York State Uniform Fire Prevention and Building Code,” Article 15, Part 1120, Combustion Toxicity Testing, Office of Fire Prevention and Control, Department of State, New York State, Albany, NY, 1986.
72. Chien, W. P., Delain, G. E., and Richards, R. S., “New York State Fire Gas Toxicity Requirements: Past, Present, and Future,” Journal of Fire Sciences, Vol. 9, No. 3, 1991, pp. 173–182.
73. ISO 5659-2, “Plastics—Smoke Generation—Part 2: Determina-tion of Optical Density by a Single-Chamber Test,” International Standards Organization, Geneva, Switzerland, 2005.
74. Babrauskas, V., and Mulholland, G., “Smoke and Soot Data Determinations in the Cone Calorimeter,” Mathematical Model-ing of Fires, ASTM STP 983, ASTM International, W. Con-shohocken, PA, 1987, pp. 83–104.
75. DIN, “Erzeugung Thermischer Zersetzungsproducte von Werk-stoffen unter Luftsufuhr und ihre Votikologische Prufung. Teil 1, Zersetzungsgerat und Bestimmung de Versuchstemperature. Teil 2, Verfahren zur Thermischen Zersetzung. Teil 3, Entwurf-Verfahren zur Inhalations-Toxikologischen Untersuchung
06-02.indd 3306-02.indd 33 11/6/2007 8:58:07 AM11/6/2007 8:58:07 AM

6-34 SECTION 6 ■ Characteristics of Materials and Products
Thermischer Zersetzungsprodukte,” DIN 53436, German Insti-tute for Standardization, Berlin, Germany, 1981.
76. Pauluhn, J., “A Retrospective Analysis of Predicted and Ob-served Smoke Lethal Toxic Potency Values,” Journal of Fire Sci-ences, Vol. 11, No. 2, 1993, pp. 109–130.
77. ISO/TS 19700, “Controlled Equivalence Ratio Method for the Determination of Hazardous Components of Fire Effluents,” In-ternational Standards Organization, Geneva, Switzerland, 2007.
78. BS 7990:2003, “Tube Furnace Method for the Determination of Toxic Product Yields in Fire Effluents,” British Standards Institu-tion, London, UK, 2003.
79. Hull, T. R., Carman, J. M., and Purser, D. A., “Prediction of CO Evolution from Small-Scale Polymer Fires,” Polymer Interna-tional, Vol. 49, 2000, pp. 1259–1265.
80. Hartzell, G. E., “Smoke Toxicity and Toxic Hazards in Fires,” ASTM Standardization News, Vol. 22, No. 11, 1994, pp. 38–43.
81. McGrattan, K., Fire Dynamics Simulator (Version 4) Technical Reference Guide, NIST Special publication 1018, National Insti-tute of Standards and Technology, Gaithersburg, MD, 2004.
82. Hoel, P. G., Introduction to Mathematical Statistics, 3rd ed., Appendix Table II, Normal Areas and Ordinates, John Wiley & Sons, New York, 1962.
83. Gann, R. G., “Estimating Data for Incapacitation of People by Fire Smoke,” Fire Technology, Vol. 40, No. 2, 2004, pp. 201–207.
84. Engineering Guide for Predicting 1st and 2nd Degree Skin Burns, Society of Fire Protection Engineers, Bethesda, MD, 2000.
85. Crane, C., Human Tolerance Limits to Elevated Temperature: An Empirical Approach to the Dynamics of Thermal Collapse, Memorandum Report No. ACC-114-78-2, Federal Aviation Ad-ministration, Washington, DC, 1978.
86. Shorter, G. W., et al., “The St. Lawrence Burns,” NFPA Quar-terly, Vol. 53, No. 4, 1960, pp. 300–316.
87. Operation School Burning, National Fire Protection Association, Quincy, MA, 1959, p. 25.
88. Babrauskas, V., “Full-Scale Burning Behavior of Upholstered Chairs,” Technical Note 1103, National Institute of Standards and Technology, Gaithersburg, MD, 1979.
89. Jin, T., “Studies of Emotional Instability in Smoke from Fires,” Journal of Fire and Flammability, Vol. 12, 1981, p. 130.
90. Friedlander, S., Smoke, Dust, and Haze, John Wiley, New York, 1977, p. 143.
91. Mulholland, G. W., and Choi, M. Y., “Measurement of the Mass Specific Extinction Coefficient for Acetylene and Ethene Smoke Using the Large Agglomerate Optics Facility,” Proceedings of the Combustion Institute, Vol. 27, 1998, pp. 1515–1522.
92. Tewarson, A., “Generation of Heat and Chemical Compounds in Fires,” SFPE Handbook of Fire Protection Engineering, 2nd ed., P. J. DiNenno (Ed.), National Fire Protection Association, Quincy, MA, 1995, p. 92
93. Grosshandler, W. L., Bryner, N., Madrzykowski, D., and Kuntz, K., Report of the Technical Investigation of the Station Nightclub Fire, NIST NCSTAR-2, Volume I and II, National Institute of Standards and Technology, Gaithersburg, MD, June 2005.
94. ASTM E84, Standard Test Method for Surface Burning Char-acteristics of Building Materials, ASTM International, W. Con-shohocken, PA, 2002.
NFPA Codes, Standards, and Recommended Practices
Reference to the following NFPA codes, standards, and recommended practices will provide further information on combustion products and their effects on life safety discussed in this chapter. (See the latest ver-sion of The NFPA Catalog for availability of current editions of the following documents.)
NFPA 269, Standard Test Method for Developing Toxic Potency Data for Use in Fire Hazard Modeling
NFPA 270, Standard Test Method for Measurement of Smoke Ob-scuration Using a Conical Radiant Source in a Single Closed Chamber
Reference
Gann, R. G., Averill, J. D., Butler, K., Jones, W. W., Mulholland, G. W., Neviaser, J. L., Ohlemiller, T. J., Peacock, R. D., Reneke, P. A., and Hall, J. R., Jr., “International Study of the Sublethal Effects of Fire Smoke on Survival and Health: Phase I Final Re-port,” Technical Note 1439, National Institute of Standards and Technology, Gaithersburg, MD, 2001.
06-02.indd 3406-02.indd 34 11/6/2007 8:58:08 AM11/6/2007 8:58:08 AM