combustion technology for incinerating ...9 2d3 combustion technology for incinerating hastes from...
TRANSCRIPT

7AD-Ri]9 2D3 COMBUSTION TECHNOLOGY FOR INCINERATING HASTES FROM AIR 1/2FORCE INDUSTRIAL PROCESSE5(U) NATIONAL BURERU OFSTANDARDS WRSHINGTON DC N M SHRUB ET AL. FEB 84
UNCLASSIFIED AFESC/ESL-TR-83-14 MIPR-N-9i46 F/G 13/2 N
EEEEEEEEEEEEEEmEEmhEEEmhEEEEmEEmhEEEEEEshE
I fllfllflfflfflfl.fl

...'...... _L2--S -
-LS.
00
-7. 7.% .7%..

-11111, )83,4
c ¢z COMBUSTION TECHNOLOGY FORINCINERATING WASTES FROM AIR FORCEINDUSTRIAL PROCESSES
W.M. SHAUB. WING TSANG
d.. NATIONAL BUREAU OF STANDARDSWASHINGTON D.C. 20234
FEBRUARY 1984
FINAL REPORTJUNE 1981 - JUNE 1983
• DTI C
M44 84
APPROVED FOR PUBLIC RELEASE, DISTRIBUTION UNLIMITED
ENGINEERING AND SERVICES LABORATORYAIR FORCE ENGINEERING AND SERVICES CENTERTYNDALL AIR FORCE BASE, FLORIDA 32403
84 03 19 0&5. "" -, -, ,--.- ---% . %_V- . .-- , %-' '. , .. . • .,.. .,.,.. . .. ...-. .. -.-. ,..,.-. . . , . , ,

NOT ICE
PLEASE DO NOT REQUEST COPIES OF THIS REPORT FROM
HQ AFESURD (ENGINEERING AND SERVICES LABORATORY), V
ADDITCOAL COPIES MAY BE PURCHASED FROM:
NATIONAL TECHNICAL INFORMATION SERVICE
5285 PORT bYAL 1'tAD
SPRINGFIELD, VIRGINIA 22161
FEDERAL GOVERNMENT AGENCIES AND THEIR CONTRACTORS
REGISTERED WITH DEFENSE TECHNICAL INFORMATION CENTER
SHOULD DIRECT REQUESTS FOR COPIES OF THIS REPORT TO:
DEFENSE TECHNICAL INFORMATION CENTER
CAMERON STATION
ALEXANDRIA, VIRGINIA 22314
. . . . ... . .. ... .,,., 2... . , . , . , . - .

. - .- - a - .•.-.-.-
UNCLASSIFIED
SECURITY CLASSIFICATION OF THIS PAGE (Ifhen Date Entered)
REPORT DOCUMENTATION PAGE READ INSTRUCTIONS• BEFORE COMPLETING FORM
1. REPORT NUMBER 2. GOVT ACCESSION NO. 3. RECIPIENT'S CATALOG NUMBERESL TR-83-14,,./, ,/ ,.
4. TITLE (and Subtitle) 5. TYPE OF REPORT & PERIOD COVERED
COMBUSTION TECHNOLOGY FOR INCINERATING WASTES Final ReportFROM AIR FORCE INDUSTRIAL PROCESSES Jun 81 - Jun 83
6 PERFORMING OAG. REPORT NUMBER
7. AUTHOR(s) 8. CONTRACT OR GRANT NUMBER(s)
Walter M. Shaub* Wing Tsang MIPR N 8146 I
9. PERFORMING ORGANIZATION NAME AND ADDRESS 10 PROGRAM ELEMENT. PROJECT, TASK
. National Bureau of Standards AREA & WORK UNIT NUMBERS
Washington D.C. 20234 PE 63723FJON 21037012
S11. CONTROLLING OFFICE NAME AND ADDRESS 12. REPORT DATE
" Air Force Engineering and Services Center February 1984Tyndall Air Force Base, Florida 32403 13. NUMBER OF PAGES
"" _11314. MONITORING AGENCY NAME & ADDRESS(II dillerent Irom Controlling Office) IS. SECURITY CLASS. (of this ,sport)
UNCLASSIFIEDISa. DECLASSIFICATION/OOWNGRAOING
SCHEDULE
16. DISTRIBUTION STATEMENT (of this Report)
Distribution Unlimited: Approved for Public Release.
-17. DISTRIBUTION STATEMENT (of the abstract entered in Block 20, ii different from Report)
* 18. SUPPLEMENTARY NOTES
• Availability of this report is specified on reverse of front cover.
19 KEY WORDS (Continue on reverse aide it necessary and Identify by binck number)
Incineration Energy RecoveryHazardous Wastes Pollution ControlCombustion Technology Incinerability IndexResource Recovery Destruction and Removal EfficienciesSolid Waste Management Thermal Processing
20 ABSTRACT (Contnuo. on ro , p e , if oceuar, idenIt.il b6 bok n-be,)-Air Force bases, particularly r ogis C enters, generate siqnificant amountsof process wastes from a variety of industrial operations. Some of these wastesare classified hazardous under the Resource Conservation and Recovery Act and areproperly disposed at cost to the Air Force. Onsite incineration with heatrecovery is being considered as a disposal option, to reduce the overall disposalcosts. Since relatively small amounts of single wastes are generated at any onebase, an incineration system must be flexible to handle a wide variety ofmaterials.
(Con tinued)
DD ,J A," 1473 EDITION OF 1 NOV 65 IS OBSOLETE UNCLASSIFIED
SECURITY CLASSIFICATION OF THIS PAGE (W"Art Dlete Fna.red)
"- .. . , . "% " . . .. . . , . .. .... . ..

UNCLASSIFIED
%'.* SIECURITY CLASSIFICATION OF THIS PAGE hen Dee. Ent.erd)
- e-sults indicate a technical basis for using Air Force industrial wastesas supplemental fuels. Suggestions made in this report should enable Air
-'_ broe personnel t) design and execute program to destroy such wastes, reoverenergy, and show emirically that applicable environmental laws and regulationshave been properly taken into account. Furthermore, a technique to allowdecision makers to select least-ost options to use the suggestions made inthis report exists, i.e., a modified form of the resource recovery planning
" -model (RRPLAN) developed at the National Bureau of Standards.
0
.',[%
4..
-1
UNCLASSIFIED"'-' .* SECURITY CLASSIICATIONI OF
r T-11 PAG iE(W1 en Date Entreae)
%7.
-4.o
-"-.4 ' .. . '. ".. .-,' v ..,,,,.,-. .- ., v --- .- , .. -.- ., .. - .. - -, - ,- . . , -.-.-• -. . . ,. -,.-. - . -.- .,..-. , , ,
S ; ' " '* ,. ? ' ., " , '- " " " -' '' ' " " o _ ! * * " ' % " ' " " " " ' _ a-- - " " "

-. - S.- . -- 5 i-..-
[-j
PREFACE
This report was prepared by personnel of the National Bureau of Standards,Washington, DC 20234, under MPR N 8146 for the Air Fbrce Engineering andServices Center, Engineering and Services Laboratory (AFESC/RDVW), Tyndall AirForce Base, Florida 32403. The report describes work perfonred between June1981 and June 1983.
The AFESC/RD Project Officer was Captain Randy L. Gross.
Results indicate that there is a technical basis for using Air Forceindustrial wastes as supplemental fuels. Suggestions made in this Reportshould enable Air Force personnel to design and execute programs to destroy
*such wastes, recover energy, and show empirically that applicable environmentallaws and regulations have been properly taken into account. Furthermore, atechnique to allow decision makers to select least-cost options to use thesuggestions made in this report exists, i.. a,a modified form of the resourcerecovery planning model (RRPLAN) developed at the National Bureau of Standards.
This report has been reviewed by the Public Affairs Office (PA) and isreleasable to the National Technical Information Services (NTIS). At NTIS itwill be available to the general public,including foreign nationals.
This technical report has been reviewed and is ppr ved for publica on..%
L SS, Ca USAF, BSC ROBERT . BOYER, , USAFProject Officer Director, Enginee i g and Services
Laboratory
4 IMe Y Nv FORD, Lt Col, USAFChietXvirnics Division
A . ..
I i
(The reverse of this page is blank)
%; , . ,..," " ", . . , - . . .

- . V .. . . . .-. .. . - , °o
-'p
TABLE OF CONTENTS
Section Title Page
I. INTRODUCTION ...... ..................... . . ...
II. LITERATURE REVIEW ........ .................. 4
III. UNKNOWN (1): ORIGINS OF UNWANTED ORGANIC EMISSIONS,E.G., POSSIBLE FORMATION OF DIOXINS DURINGCOMBUSTION .......... ...................... 6
IV. UNKNOWN (2): CONTROL AND/OR PREVENTION OF ORGANICEMISSIONS FROM ENERGY RECOVERY UNITS; PROCESSMODIFICATIONS THAT CAN RESULT IN MEETING ENVIRON-MENTAL REQUIREMENTS AT LOWEST COST AND RISK ..... ... 11
V. UNKNOWN (3): MEANS AND METHODS TO VERIFY SUCCESSFULCONTROL AND/OR PREVENTION OF ORGANIC EMISSIONS FROMENERGY RECOVERY UNITS ........ ................ 24
VI. UNKNOWN (4): METHODS TO ASSESS HAZARDS TO HUMANS ANDECOSYSTEMS AS A RESULT OF INCINERATION OF INDUSTRIALPROCESS WASTES IN VARIOUS COMBUSTION CHAMBERS ........ 30
VII. UNKNOWN (5): SYSTEMS ANALYSIS METHODS TO CORRECTLYCOMPARE ECONOMIC ASPECTS OF OPTIONS TO RECOVERENERGY, REUSE, RECYCLE, MARKET, TREAT OR DISPOSE OFVARIOUS WASTES CREATED IN VARIABLE QUANTITIES OVERWIDE GEOGRAPHIC AREAS ....... ................. 35
VIII. UNKNOWN (6): POSSIBLE IMPACT OF PENDING LEGISLATION,REGULATIONS AND JUDICIAL INTERPRETATIONS OF EXISTINGLAWS AND REGULATIONS ....... ................. 40
-40
IX. CONCLUSIONS ....... ..................... .... 42
REFERENCES ...... ..................... ..... 43
APPENDIXA. SELECTED BIBLIOGRAPHY ........ ................. 45
B. EVALUATING THE RISKS OF SOLID WASTE MANAGEMENTPROGRAMS: A SELECTED APPROACH ... ............ .... 51
C. A SIMPLE DEGREE OF HAZARD SYSTEM FOR HAZARDOUSWASTES ....... ........................ .... 71
D. RECENT LEGISLATIVE INITIATIVES PERTAINING TOINDUSTRIAL WASTES ..... .................. .... 92
"'t? t "~~~~~~.. ...- ".':.' .. ..--. "."........... .. ........ "........." *', ". . ".'.". '. , -. '.".". - ". . "-''' " "....-..' -.. " .. .. .. .. " '.'." -

LIST OF FIGURES
Figure Title Page
1. A Decision Scheme for Hazardous Waste Incinerationand Energy Recovery in Boilers ...... ............ 13
2. Incinerability Curves for Some RepresentativeChemical Species ........ ................... 28
-:- B-i. How RRPLAN Addresses the Economics of ResourceRecovery ....... ....................... .... 57
B-2. Risk Assessment for Steam vs Electricity (NoGrowth) ....... ....................... .... 66
B-3. Risk Assessment for Steam vs Electricity (GrowthScenario) ...... .. .................... .... 67
C-1. A Stylized Dose-Response Curve and Some ExtrapolatedCurves ....... ....................... .... 84
C-2. Calculated Excess Cancer Risk as a Function ofConcentration of Chemicals Shown in Drinking Water,Assumes Linear Dose-Response Relationship in RegionShown. (EPA Carcinogen Assessment Group Data) . . .. 85
C-3. Calculated Excess Cancer Risk as a Function ofConcentration of Chemicals Shown in Drinking Water,Assumes Linear Dose-Response Relationship in RegionShown. (National Academy of Sciences Data) .. ..... 86
C-4. Pollutant Pathways From Soil to Man. (After Reference2) ........ .......................... ... 87
C-5. Pollutant Pathway From Soil to Man via Water, Plant,and Animal Compartments. (After Reference 2) . . . . 88
C-6. Probability That No Individual in an Exposed Popula-tion is Harmed as a Function of the Ratio Cx/PPLV . .. 89
C-7. Cumulative Probability vs Error Term for the ExtendedPPLV Method ...... .... ..................... 90
C-8. Upper Bound of 95 percent Confidence Limit (see FigureC7) for P 0 . . . . . . . . . . . . . . . . . .. . .. . . . . . . . . . 91
iv
7.

. -. . - . , . o .. , . .
LIST OF TABLES
Table Title PageB-I. EQUATIONS USED BY RRPLAN .... ............... .... 58
B-2. ACTIVITIES CONSIDERED BY RRPLAN ..... ........... 59
B-3. DISCOUNTED COST PER TON OF MSW PROCESSED FOR A WASTE-TO-ENERGY PLANT SUPPLYING STEAM .. ........... .... 61
B-4. DISCOUNTED COST PER TON OF MSW PROCESSED FOR A WASTE-TO-ENERGY PLANT SUPPLYING ELECTRICITY . ........ ... 61
B-5. BREAK-EVEN POINTS FOR SELECTED CAPITAL OUTLAYS . . . . 62
C-i. CONCENTRATION OF DRINKING WATER CONTAMINANTS ANDCALCULATED EXCESS CANCER HAZARD OF ONE-IN-A-MILLION .......... ....................... 82
C-2. SINGLE PATHWAY PPLVS FOR SEVEN COMPOUNDS ORIGINATING
IN SOIL (MG KG 1)A AFTER REFERENCE [2] ........ .... 83
V
(The reverse of this page is blank)
Wv 'Js -.. 11 J.. 7.W.;.. .
SECTION I
INTRODOCTION.
Air Force personnel responsible for assuring that the USAF meets allrequirements of existing laws and Executive Orders pertaining to treatment,storage and disposal of industrial process wastes have concluded that:
0 Air Force bases, particularly Air Logistics Centers, generatesignificant amounts of process wastes from operations such aspaint removal, electroplating, industrial waste treatment,carbon removal and cleaning. Some of these wastes are classi-fied as hazardous under the Resource Conservation and RecoveryAct, and all are handled and disposed of appropriately at AirForce expense.
. Over the long term, thermal processing (including pyrolytic andexcess air incineration) may be a suitable alternative forreducing waste volume, mass and toxicity. Recovery of the heatreleased during thermal processing could reduce the costs ofwaste incineration.
0 * Normally, relatively small amounts of individual wastes aregenerated at a given location, presenting strong economiclimitations to incineration systems designed for a singlematerial. Some potential exists for developing a singlethermal processing technology with the flexibility to be usedindividually on a variety of wastes. Such a system could makefeasible the reduction or elimination of a variety of processwastes in an environmentally compatible, energy-efficient andcost-effective manner.
a Before such a system can be implemented, considerable develop-mental work is required to chemically characterize the wastematerials generated, estimate their performance in a field-scalethermal processing system, determine the expected pollutantemissions (ash, residue, gases), and derive a quantitativelybased design concept for a prototype system, subject to follow-on test and evaluation.
The implications of these conclusions were discussed by personnel of theAir Force Engineering and Services Center (AFESC), Tyndall Air Force Base andthe National Bureau of Standards (NBS). As a result of these discussions,AFESC contracted for NBS to perform the developmental work required to charac-terize the wastes and to suggest means to deal with them in an environmentallyand economically sound manner. The specific tasks assigned to NBS were asfollows:
Task 1: Literature Review. Conduct a literature review dealing with thechemical analysis, chemical composition, combustion parameters and characteris-tics, environmental aspects, corrosion potential and incineration of industrial
i 1

process wastes, including: paint chips, chlorinated solvents, oil and greasesludges, oil skimmings, waste hydraulic fluids, carbon removal baths, highlyconcentrated phenolic solutions, general industrial waste sludges and wastenonrecyclable petroleum oils and lubricants.
Task 2: Chemical Characterization. Advise and carry out research onprocedures for the characterization of industrial process wastes.
Task 3: Combustion Analysis. Determine and quantify the essentialcombustion parameters of industrial process wastes with respect to heat-recovery thermal processing system design.
Task 4: Environmental Analysis. Estimate the potential environmentalproblems associated with unabated combustion (pyrolytic and excess air) ofindustrial process wastes.
Task 5: Corrosion Potential. Advise and carry out necessary research on''.the corrosion potential associated with a facility capable of using all waste
materials separately.Task 6: Heat-Recovery Potential. Quantify the heat-recovery potential
associated with industrial process wastes.
Task 7: System Concept. Provide a recommended system concept for afacility capable of heat-recovery thermal processing of industrial processwastes.
In addition, NBS was to obtain samples of the wastes listed above atvarious Air Force bases. However, because of the wide variability of thewastes on each base, representative samples could not be provided. As aresult, some aspects of Tasks 2, 3, 5, and 6 could not be performed.
This Final Report includes the following major categories:
1. A careful search and evaluation of existing data pertaining toenergy recovery from incineration of potentially hazardouswastes,
2. Detailed strategies which would enable the Air Force to establish. a program for incinerating various wastes in a manner which
would allow compliance with enviromental requirements at lowestcost to the Air Force (i.e., economic and hazard assessmentstaken into account),
3. A consideration of the physical basis of hazardous wastesincineration in order to suggest incinerability scales, and
4. A brief listing of current legislative and regulatory activitieswhich might affect Air Force incineration actions.
2

I
With this report, the Air Force can evaluate the suitability of existingequipment to incinerate Air Force wastes in an environmentally acceptable,efficient process.
I
I-9.
I
I
4-
4.
p
I
S.
S.
p
S
p
3
**.**.9K..*..*..~.*.y -..... ** . - - . . - 1-~ S. -..........
SECTION II
LITERATURE REVIEW
Examination of published data and conclusions concerning incineration ofhazardous wastes allowed a critical evaluation of these results to determinewhat is and is not known about all aspects of energy recovery from industrialwastes used as fuels. Appendix I lists a selected group of publications (manymore were reviewed) which provide a suitable cross section of data and resultsfor making the "know" or "do not know" decisions.
Based on our review of the existing literature, NBS concluded that thefollowing issues can be resolved without further Air Force research:
1. Corrosion problems; the boiler manufacturer can design tominimize these difficulties. Certainly, the corrosive natureof wastes used a3 supplemental fuels cannot be ignored, butgiven present knowledge, such characteristics can be taken into
-. account,
2. Heat recovery methods; waste heat boilers are commerciallyavailable,
3. Economic evaluation of various systems for waste destructioncombined with heat recovery,
4. Control of atmospheric emissions by particulates, HCI, Cl, andother common pollutants arising from combustion processes,
5. Staff training requirements.
On the other hand, NBS concluded that the following issues are unknown orhighly uncertain:
1. Origins of unwanted organic emissions, e.g., possible formationof dioxins during combustion,
2. Control and/or prevention of orgaric emissions from energy-recovery unit process modifications that can result in meetingenvironmental requirements at lowest cost and risk,
3. Existence of means and methods to verify successful controland/or prevention of organic emissions from energy-recoveryunits,
4. Methods to assess hazards to humans and ecosystems as a resultof incineration of industrial process wastes in various combus-tion chambers,
5. Systems analysis methods to correctly compare economic aspectsof options to recover energy, reuse, recycle, market, treat, or
4
dispose of various wastes created in variable quantities overwide geographic areas, and
6. Possible impact of pending legislation, regulations, andjudicial interpretations of existing laws and regulations.
Accordingly, NBS has chosen to deal with these "unknowns" as individualentities. What follows is meant to provide a detailed strategy for dealingwith the first five issues on the foregoing list as well as an "awareness"
. . statement concerning the last item.
.5
°..
S'"
. 5 .5
.- -'
..........................-. ...... . . . . . . . . . . . . . . . . .
. . .. . . . . . . . . . . . . ** * a. * '.. . . . . .
SECTION III
UNKNOWN (1): ORIGINS OF UNWANTED ORGANIC EMISSION(, E.G.,
POSSIBLE FORMATION OF DIOXINS DURING COMBUSTION
GOAL
* Identify physical and chemical processes which control theformation of dioxins during combustion to delineate operationswhich will minimize dioxin emissions from municipal incineratorsor Energy-Recovery Units (ERUs).
OBJECTIVES
O Use existing literature to establish a basis for constructingmodels for gas- and non-gas-phase dioxin formation duringcombustion, then construct the models.
0 Compare dioxin emission levels predicted by the models withreported dioxin emission levels from municipal incinerators andERUs.
- Suggest possible engineering operations to control dioxin" emissions from municipal incinerators and ERUs.
BACKGROUND KNOWLEDGE OF DIOXIN FORMATION AND DESTRUCTION IN THERMAL
• - ENVIRONMENTS
Field Measurements
- There is great variability in the levels of particle-bound andgas-phase dioxin emissions from thermal processing units.
; Other chloroorganics are observed to be emitted when dioxinsare emitted, e.g., chlorodibenzofurans, chlorophenols, andchlorobenzenes. Chlorophenols and chlorobenzenes are usuallymore predominant than dioxins and furans.
a There is partioning of dioxins between the gas and fly ash inemissions. This partitioning is variable, but generally, thereappears to be as many or more dioxins in the gas phase in thepostflame combustion zone than in the solid phase. This
*+ apportionment may reverse on exit from the stack of an incinera-tor or ERUs.
0 In emissions, isomer distributions are often skewed towardsincreasingly chlorinated species.
6.-.:.............*N

L. . .. -W .-
Laboratory Measurements
* Dioxins can be formed from chlorobenzenes and chlorophenolswhen these are heated in quartz ampoules with oxygen at elevatedtemperatures.
0 Chlorodibenzofurans are preferentially formed from PCBs insimilar experiments.
a There are many catalysts and pathways for the synthesis ofdioxins.
0 Dioxins can be formed by heating coal in the presence of HCl or
Cl 2. Dioxin formation from heating coal in the presence of
NaCl is much less.
0 Dioxins can be readily destroyed at elevated temperatures.
* Dioxins can be formed as secondary products from variousreactions under various conditions.
a Comparisons between some laboratory and field measurements showsimilarities in isomer distribution patterns.
* Dioxins can be formed by heating wood in the presence of airsaturated with HCl.
Theoretical Analyses
a There are no thermodynamic equilibrium barriers to dioxindestruction at elevated temperatures.
* Dioxin formation and destruction is controlled by kineticprocesses and mass transport effects in municipal incineratorsand ERUs.
_ * Catalytic processes are probably operative in some laboratory
experiments. Other non-gas-phase processes are also likely.
a Many hypothetical chemical pathways have been proposed.
a An increasing degree of chlorination of dioxins makes them moreresistant to oxidative bimolecular attack.
* A statistically representative analysis of the chloroorganiccompounds in the input waste feedstreams of municipal incinera-tors or ERUs may not be a practical possibility.
General Observation
* The above information has been selectively chosen to highlightwhat is known about dioxin formation and destruction in thermal
7
.I.--.

* - * .... S. S .
environments. More information is available than has been
outlined above.
PROBLEMS
Field Measurements
] Consensus sampling and analytical methods for dioxin emissionshave not yet been established.
* There is uncertainty as to what measurements would be useful.
- The quality, completeness, and utility of reported measurementresults are variable.
Laboratory Measurements
S In experiments, concentrations of reactants and reactionconditions are often not representative of those found inmunicipal incinerators or ERUs.
* -Details of experiments and results should often be more com-pletely reported to interpret results.
- In situ, noninterfering diagnostic methods for monitoringdioxin formation and destruction in thermal environments havenot been developed and applied.
THEORY
-, Currently proposed mechanisms for dioxir formtion and destruct-ion: (1) are not adequately delineated acording to gas- andnon-gas-phase ontributions, and (2) have not been made quan-titative.
a Kinetic data for individual chemical reaction steps in proposedmechanisms have not been obtained.
* utions of physical processes to dioxin formation and
'-ion are not well characterized.
General
" Conse is statistical methods for validating data in terms ofthe precision and accuracy of measurements, particularly withrespect to the probability of false positives and false nega-
,. tives, have not been applied.
° -a
.= .,"

PROGRAM
Thesis
0 The construction of theoretical models for gas- and non-gas-phase dioxin formation and destruction processes is possible.These models can be used to provide insight about dioxinemissions from municipal incinerators and ERUs, which isconsistent with stated goals and objectives.
Gas-Phase Modeling
Action
" Develop and apply a model to assess the likelihood thatgas-phase processes contribute to the formation of dioxinsin municipal incinerators and ERUs.
Approach
OR * Identify a likely precursor (chlorophenol) for dioxins toform from.
* Construct a "worst-case" model (beyond what is reasonablylikely to occur) for gas-phase dioxin formation from theprecursor.
0 Test the model using input parameters, e.g., residencetime, temperature, gas-phase species concentrations, whichare typical of the thermal environment of a municipalincinerator or ERUs.
Non-gas-Phase Modeling
Action
* Develop and apply a model to assess the likelihood thatnon-gas-phase processes may be important contributors ofdioxin emissions from municipal incinerators and ERUs.
Approach
* As an example, assume that a gas-solid catalysis processcontributes to dioxin formation in municipal incinerators
and ERUs.
0 Construct a model for dioxin formation consistent with agas-fly ash catalysis mechanism.
* Test the model using input parameters, e.g., residencetime, temperature, gas-phase and fly ash surface speciesconcentrations, which are typical of the thermal environ-ment of a municipal incinerator or ERUs.
9

* Force the model to predict dioxin emission levels consis-tent with typical reported emission levels from municipalincinerators and ERUs.
* Determine if the kinetic parameters required to force themodel predictions to agree with reported results areconsistent with kinetic parameters characteristic ofcatalytic surface reactions and desorption processes.
Conclusions
1. Gas-phase dioxin formation processes alone cannot account forreported dioxin emissions from municipal incinerators and ERUs.
2. Catalytic and other non-gas-phase processes need to be consider-ed in order to account for reported dioxin emissions frommunicipal incinerators and ERUs (eferencs 1-3). Predictedrate parameters from modeling are consistent witn expectationsbased on prior experience among chemical kineticists.
Predictions
1. Additional experiments can be designed that would providefurther insight consistent with the stated goals and objectivesof this section.
2. The goal of identifying process modifications for minimizingdioxin emissions from municipal incinerators and ERUs appearsreasonable, based on research which has been performed to date.As brought out in sevqrp 1;reports developed at the NationalBureau of Standards 1rsx 1-3), some potential operationsfor minimizing dioxin emissions from municipal incinerators andERUs are recommended to the engineering community for furtherinvestigation. It is premature to speculate on the utility ofthe suggested approaches without an extensive program ofcarefully designed tests.
10
• .

SECTION IV
UNKNOWN (2): CONTROL AND/OR PREVENTION OF ORGANIC EMISSIONS FROM ENERGYRECOVERY UNITS: PROCESS MODIFICATIONS THAT CAN RESULT IN MEETINGENVIRONMENTAL REQUIREMENTS AT LOWEST COST AND RISK
GOAL (BOILERS WILL BE CONSIDERED AS AN EXAMPLE OF AN ENERGY RECOVERY UNIT.)
0 Delineate significant decisions concerning emission control
methods for hazardous waste incineration in boilers.
OBJECTIVES
. Identify technical problems associated with hazardous wasteincineration in boilers which may cause pollutant emissions.
0 Identify engineering options which may reduce emissions producedfrom hazardous waste incineration in boilers.
0 Develop a schematic diagram which suggests relationships. between the technical problems and the engineering options.
BACKGROUND
0 Boilers which incinerate hazardous waste mixtures may emitpollutants such as organic chemical compounds, particulates andHCl.
0 * Current federal regulations, as promulgated under RCRA, regulatepermissible emission levels for many organic compounds whenthey are destroyed in incinerators. Those organic compoundswhich are regulated are called Principal Organic HazardousConsitituents, or POHCs.
* In the future, these regulations may apply when incineratinghazardous waste mixtures in boilers. In that event, engineer-ing options may be necessary to control pollutant emissionlevels from boilers.
* Engineering options may be determined by the technical problemsassociated with hazardous waste incineration in boilers.
PROBLEM
* It is difficult to determine engineering options which may beapplied to control pollutant emissions produced by hazardouswaste incineration in boilers.
0 This difficulty is particularly pronounced when selectingengineering options for controlling POHCs emissions fromboilers.
11

L°% . . .-
PROGRAM
Thesis
. A schematic diagram can be constructed to suggest how potentialengineering options may be applied to control pollutant emissionsresulting from the incineration of hazardous wastes in boilers.
Action
* Identify technical problems associated with the incineration ofhazardous wastes in boilers which may result in pollutantemissions. Determine the relationships between the technicalproblems and possible remedial engineering options to controlthese problems. Use schematic diagrams to illustrate thepotential problem-control option relationships.
Approach
* Examine the existing literature to determine if technicalproblems and potential control options have been reported.
* If the information obtained from the literature is incomplete,analyze technical uncertainties associated with pollutantemission and control in boilers by: (1) establishing theorieswhich suggest the underlying physical and chemical nature ofpresently uncertain aspects of pollutant emissions, and (2)examining the implications for control options that thesetheoretical investigations may suggest.
. Determine relationships between technical problems and controloptions.
0 * Hierarchically order the technical problems and control options
with respect to the sequence of events which,together, describethe incineration-energy recovery process in boilers. Thissequence includes: (1) waste feed preparation, (2) wasteinjection into the boiler, (3) combustion of the waste, (4)postcombustion of the waste, (5) heat recovery, and (6) airpollution control.
0 Construct a diagram (Figure 1) which: (1) suggests the rela-tionships between technical problems and control options, and(2) illustrates the sequential events associated with hazardouswaste incineration in boilers and resulting pollutant emissions.
RESULTS
* A delineation has been established regarding significantdecisions which may be made concerning methods to control theemissions of pollutants. The delineation is presented in the
12
" . .-.% --.-. . . . . .
(STIRM OfPCA ALL fGANIOS IN ECass OF It C IACOSTS OF 0101-MARADOUS WASTES CNIU
CAD
.4ESTIMTE DISMOA IA ME LLMLPESCOSTS Of N4ANCUS
WASTES 0 EtNIU
SEPARATE ANDCOMPUTE SEPARATION
CNFtEL IS ToOf SRE ND FOR ESTIMATE TOTAL TREATMINTANE HAZAROSS ENERGY RESOUJRCE COSTS.* INC~LUDE COST OF
ANDERT NONSLIE SOT ENER.GY NOT NOW PROVIODCOMONENTS SEXCESS AIR (HIGHER ORt LOWER IF IT OPTIO!-4 OF E~F.RGT RECOVER .
PARA T' REQUIRED ST BOILER IIANULJACIUREA) * M'.4
t04W05E A $OILER DESIGN. EStAlLfSK BOILCI C4OST. E
MATERIALS REETALSE
HZROSWSE? 0 ANT IN THE FLUEL CAU1SE RE'0VE SO0C OF THESE MET
AN FTEFOLLONING 1%L"? ESTIMATE REMO~VAL COTS
A a)CORROSION *CM
C) TOXICITYd) HIGH VOLATILITY METALS
EMISSIONS __________THE A
ITHERE STILL A SUBSTAN TIAL Ef STISIATE CflST Of K[NOVAI.ME ITALS A110/00 SILICECONTCNTL.... WOF "l *AL TES
THEN
CONTINUE
Figure 1. A Decision Scheme for Hazardous Waste Incnrto adEegyR ov y
in Boilers.
13**.' .
7. -7,77 - .t -- .V- -
Is TN(AC STUL it sueslwlu ESTIMATE COST OF QW)VAL~ r or Low 6,U ORGANIC YES 4 OF SCV1C Olt ALL OF THESEFUEL Cor*VWNISI OR 12 COMPONENTS AHIGH Watt* CONTINT? (D INno CONTINUE
IS THE M CONTENT Of THE ADO HIGH BTU AUXILIARY FUELFUEL STILL KLOW NECOMMIN 0 TO WASTE STREAMLEVEL FOG WILER TYPE? ESTIMATE COSTS Of FUEL
CAUK I
C CAN FUEL It FED INTO 101M IN ESTIMATE COSTS 0;PRESENT STATE (i.e.. IS IT PUIPAOLE?. MODIFYING THE FUEL.VISCOSITY ACCEPTABLE? WTICULATE (IF ANY A(size O.K.1 ETC.)? IS) .
OWE INZVJ A
C'm
YES
ACONCE PONCS IN FUEL
3lot
17CINJI
RDRING TO A KINETICSCALE OF INCINERABILITY
TAND IDENTIFY LEASTINCINERABLE CIE 0 MIGN BTU &UXILIANY FUELE I 0 WASTE STREAM Q0 ESTIMATE
COSTS
ACC UZZ
YESC
_STED? I MUST'T'
yHC
10 IS AUXILIARY FUEL TOI S AjUXILIARFUEL T OUSING L.I.S. KINETIC I( AOUSTEO? IT MUSTRATE CONSTA14TS CALCULATE NO BE IF EXCESS AIR IS MCIV".99 104 A
IF EXCESS
IR IS9
FLAME RESIDENCE TIKOF 20 MILLISECONDSIF 00 PamC% PRESENT. I ESTIMATE ADJUSTMENT
99.99 TO EXCESS AIR COSTS NoL- 9 1 - C
,-,CALCULAT' CALCULATE ADIABATIC'EMP "SFLAK TEMPERATURE YES
ToIS EXCESS AIR TO SE
ADJUSTED?14 4-iD=4-
% YES
I, T99.99 0 AT I ? No CAN EXCESS PIR CE AWUSTIO
15 WITMI% $OILER !-J.'ItIFACTURERSLIMItS?
YES
*SINCE TK CCCIStoN FLOW PAY PossIsLy CYCLE THR(k" mis sox rmy Tipts DUE 10 A TEST SWITCHCOULD K ADDED To SEE If AN? NEW PONCS ARE BEING COMSIDERED.
Figure 1. A Decision Scheme for Hazardous Waste Incineration and Energy Recoveryin Boilers. (Continued)
14
%

.7
CALCULAI THENCI DEV POINT PAINIFAeTup llcalwwalTEMPERATURE "All"U" AWL -( MILEROP(IIIATI vAr
OP(RATI,,r ItfVEIZA
if WNCI. To 0.
no
00 A NEAT BALANCE(S) CALCULATE R(WINK(S) V C WE C
T TESTEDfait THE 101LIR TO It FROM ENERGYESTED AND CALCULATE RECOVERY
THE IOILER OPERATING
1134PERATUat (AVERAGE) C NEW No
E T V.- C WE
IF 00 MCI. RATE - 0.
OILER
CALCULATE THE
CALCUL0
IF 0
$OIL[* CORROSION PAT[T".U . .. .1. 1 ARE X
I - - .- - - [on 7 AND Z NO No
VUnit
R T YES
UTIMTE RATE OFCAPITAL EQUIPMENT YESCOMPONENT LOS$ DUE TOWEI CORROSION RATE
ERROR FLAG
8IF NO KI. RATE 0. N
SIT q-0ARE LOSSC% ADJUSTING (-to) AOJUS ING. (-10) w1volrymUNACCEPTA&LE USTION OPERATING-1 FUEEL V, NINE ImILINOlt US CHLORINE LOADING ITIONS? CONUNT PATMALS
SPECIFIED RANGEXCEEDED 901LIN MWAMMWWFACtnU lot E IF lag C .OMIT STE COMPOSITIO.4
n IVES Y S It YESj
ICALCULATt AWUSTMEN ALCULATE CALCULATE
a YES 23 COSTS AOJUSTICNT rixtricATIomCAW I COSTS COSTS
01 CAOJ Z CAOJ 3
W AUXILIARYL7A 0 DLEFUEL ADDEDI
'ART
CALCMATE
18 1 ESP] 40 jigs I ES M
C UK 3I CALCIAATI
MCOIT5
WAS AIR/FUEL C AUK 3
p VARATIO VARIED
-if IN($ PATH IS CHOSEN. THE No ESOPfIUkTO4 MAT SET AT LEASTONE Of IN( OPrIM . x.t on N G
Olt ELSE AN C9QM FLAZ 4 6SHOULD It RAISED AND
UNACCIPTABU LOSSES IGNORED.
Figure 1. A Decision Scheme for Hazardous Waste Incineration and Energy Recoveryin Boilers. (Conttnued)
15 4

0, 1Y5 Do2 99" .9
'I ?rCALCULATE FREETOICES
CHLORINE TEMPERATUR IXNALFSAD A TvcIW
inOCT Boiers (Cotined
1 16
A eFO AT E

ESTIMATE COSTS TH4EN
REMOVET AMOUNT DIUT EOPO
Do KIPP ( i OPRAIf CHLORINEAR To CONEV O AIRP:15IOEQJIPMN REU AIONSEIIC INIPOSTNETSQtP1
REPAIRt COSSTSa K
OSSOLSEN0 CYESS
REDUCETIC LSHOTERETIFCMEETIATSAVETR COSOTETBTS OSBE?10 CSTO I
AlT NOT REVI9.JLV !CCOMTEOFOO
in Boilers. (Continued
17ED
______YES

TO DO A RE~LSERHBILRTPEOT
B URO CANDIAT A-1 Of-DO19VEHI 04 IL TS MT) O i i O W E T CALCULATI OS l O A t E F A T~t I O L A 4 ~
AT RANGE OF FUELV~ COMPNENT
VOAIIYP1CO ULCMOET HG4AN I OAIEFATOSS~L A4HV
VICST inNG Boles (Concluded)ANE F .COPOENS
KINTI IN K"1LTY ANE O FELCOMO 1NT

form of a diagram (Figure 1) which: (1) suggests the relation-ships between technical problems and control options, and (2)illustrates the sequential events associated with hazardouswaste incineration in boilers and resulting pollutant emissions.In the diagram, encircled numbers correspond with a numberedcommentary following Figure 1 which provides additional discus-sions about the information presented in the diagram.
- -DISCUSSION
. The constructed diagram is useful for making decisions onhazardous waste incineration in boilers. Refinements arerequired: (1) to optimize the logic of the diagram, and (2) toimplement the suggested options for pollutant control.
19

FURTHER COMMENTS TO THE DECISION FLOW SCHEME PRESENTED IN FIGURE 2
1. This first step would be mandatory if RCRA regulations wereextended to hazardous waste disposal in boilers. Someoverlap in the listings occur, but each class, e.g., POHCs,metals, etc., plays a part in the suggested decision-makingprocess. Identifying the weight percent of chlorine in anyparticular waste stream is also useful. In energy recoveryunits, chlorine content of waste streams should be carefullycontrolled, unless the boiler is constructed from corrosion-resistant materials, e.g., silicon carbide-lined furnacewalls, monel boiler tubes, etc. (Reference 4).
2. Volatile materials may be recoverable by simple distillation.Components recovery may depend on whether or not MILSPECS onthe original materials would have to be met.
3. The extensions of the Resource Recovery Plan (RRPLAN)discussed in this report can provide guidance for estimatingrecycling costs.
4. Some components (particularly the most volatile) such asmethylene chloride, are probably recyclable within MILSPECS.
5. Contact recyclers for quotes.
6. Metals including RCRA-regulated toxic metals, chromium,lead, zinc, cadimum, copper, potassium, calcium, sodium, andaluminum should be kept to a minimum, if not completelyexcluded (References 5,6).
7. To be realistic, removal cost estimates must also includethe disposal alterative.
8. These removals help to reduce ash content and erosionproblems, eliminate materials which have no intrinsicheating value and act as catalytic surfaces for probable(Reference 3) secondary product formation. As in 7, alter-nate disposal costs need to be factored in.
9. There are general rules of thumb for determining the relativemerits of retaining fuel for use when the BTU content is low(References 4,7,8). These guidelines can be used with
0 regional energy pricing to determine lower limits of accept-ability for the BTU content of candidate fuels.
10. If the BTU content of the fuel falls below the recommendedcutoff limit of the boiler manufacturer, makeup fuel must beprovided. Local pricing and availability must he considered.
11. Blockaqe of the input feedstream can be economically undesir-able in enerqv recovery operations, particularly if no
* 20

system redundancy exists. In the case of liquid injection,ease and extent of atomization can affect sooting, flamestability and related parameters (References 7,8). Techno-logical solutions are available for dealing with theseproblems.
12. A procedure for ordering POHCs according to a kinetic scaleof incinerability has been reported in the literature(References 9,10).
13. This is a subjective estimate of residence time of a POHC inthe hot zone of a flame (Reference 1). A hot-zone flamelength of 10 centimeters and a gas-flow velocity of 500centimeters per second are assumed. T99.99 is the tempera-
ture required for achieving "four nines" (0.9999) Destruc-tion and Removal Efficiency (DRE) of POHCs.
14. The calculation of adiabatic flame temperatures has beenreported in the literature (Reference 11).
15. As a minimum, the adiabatic flame temperature must exceedthe maximum four nines destruction temperature to achievesuccessful destruction of POHCs. Temperature fluctuationsare extensive in turbulent diffusion flames (Reference 12).The AT1 factor is an attempt to correct for this
observation. If an estimate of AT1 is not available from
fast transient (>100 Hz) thermal fluctuation measurements,AT1 should be set to a value of at least 200 'C. This '
based on the observation that, at least for turbocombustors,these fluctuations can be quite large (Reference 12).
* 16. The HCI dewpoint temperature is the temperature at which
substantial amounts of HCl in the gas stream will begin to-".- condense out onto the boiler surfaces. If substantial
amounts of HCl are present, maintain boiler operatingtemperatures above the limiting dewpoint temperature (Refer-ence 4).
- 17. See Reference 8 for information.
18. Revenues are artificial, since DOD is its own customer ifthe operation is in-house.
19. Boiler corrosion rates are difficult to estimate. Theserates depend upon operating conditions, levels of chloridesand other corrosives in the flow stream, boiler materials ofconstruction, etc. (References 4,7,8).
40; 20. Commercial corrosion monitoring equipment is available(Reference 13).
21
- -.........

0:
21. Recommendations of the boiler manufacturer should be followed.
22. The boiler operating temperature should exceed the HCIdewpoint temperature if substantial amounts of chlorine arepresent in the flowing gas stream. The AT2 adjustment is
for reasons given in 15 above. The AT2 should be at least
100 'C. However, since the dewpoint temperature of HCl isusually rather high, this will probably not be practical.If not, a lower AT2 may be set by backing off on the
chlorine loading in the boiler or by utilizing a boilerconstructed from corrosion-resistant materials (Reference7).
23. Calculation of the free chlorine temperature (the tempera-ture at which substantial amounts of Cl may causedownstream corrosion problems) is reported in the literature
(Reference 7).
24. Comments apply here as applied in 15 and 22 above. AT3should be more than 100 'C, if practical.
25. These calculations deal with the difference in DRE likely tobe achieved in incinerators and boilers due to the presenceof relatively cool walls in the boilers. These calculationsassume AT4 is at least 200 °C and that the thermal boundarylayer is 10 percent or less of the thickness of the velocity
S'.. boundary calculated for fully developed turbulent flow.Since fully developed turbulent flow is unlikely in anactual boiler, the approximation has dubious validity in theabsence of tests. A linear temperature drop is assumedbetween flame and boiler wall temperatures. A correctionfor kinetics is applied, assuming the reactions stop oncethe temperature falls below the four nines temperature.
4.5-' Where Tw exceeds T99 .9 - AT4 this correction is minimal,
since the flame fluctuations at the walls are probablysufficient to effect destruction. The parameters in theequations are:
T wall temperature (Degrees Kelvin)T• adiabatic temperature (Degrees Kelvin)ar radius of cylindrical boiler - a cylindrical boiler
0 is assumed (Meters)x length of cylindrical boiler (Meters)Re Reynold's number (Re = 2rup/u)u gas flow velocity (Meters per Second)d gas density (Grams per Cubic Meter)
gas viscosity (Grams per Meter per Second)Tg.99 four nines destruction temperature of the POHC most
difficult to incinerate, based upon a kinetic scaleof incinerabilitv (Degrees Kelvin)
22

26. If low destruction efficiencies for POHCs due to cold-walleffects are indicated, one approach would be to increasemixing of gases to get the unburned POHCs near the coldwalls back out into the main hot-gas flow stream.
27. In liquid droplet burning (References 14,15), droplet batchdistillation effects will cause initial evaporation of themost volatile components. This can be problematical if theevaporating chemical species contained in droplets arechlorinated and flame-inhibiting (see also discussions inReference 3).
28. If the BTU content of the selectively evaporating componentsis low, it must be boosted by adding a high-volatility, high-BTU-fuel.
29. If the evaporating components are chlorinated, large amountsof high-BTU, high-volatility fuel must be added to compensatefor flame-inhibiting effects.
. 30. If POHCs cannot be detected, concentration levels should notbe set equal to lower-bound analytical detection limits.
31. These costs tend to be high: equipment is very complicatedand analyses are manpower-intensive.
32. The RCRA has set limits on HCI emission levels.
33. References 7 and 8 provide solie guidance. The RCRA has setlimits on particulate emissiJn levels.
34. NBS is developing cost-effective alternatives to POHCs asmonitors of DREs.
.91
23
.. . . -. c, --, . -. . ,,,. , . ., .. .. .. . , , , 5 . .* ... , ..:2i:.-. .. .I ~.... .. . :. .. ., .,i.-..*.

"' L " ''' " ;b " 11 " 2 -. 1 " . . - - '. ' %' ' " ' "--'--° -' ' ' .N'" _'o -: -,- 7..' 7- 7.: ;" . .
K.
SECTION V
UNKNOWN (3): MEASUREMENT METHODS TO VERIFY SUCCESSFUL CONTROLAND/OR PREVENTION OF ORGANIC EMISSIONS FROM ENERGY RECOVERY UNITS
GOAL
0 Identify candidate chemical tracer methods for verifying highDestruction and Removal Efficiencies (DREs) of PrincipalOrganic Hazardous Constituents (POHCs) in Energy Recovery Units(ERUs).
OBJECTIVES
- Use existing literature to establish a basis for the selectionof candidate chemical compounds which may be used as tracers toverify high DREs of POHCs.
* Apply a scale of incinerability to compare the thermochemicalkinetic stability of candidate tracers with POHCs.
* Suggest analytical methods for detecting tracers: (1) prior tointroduction into, (2) while inside of, and (3) on emissionfrom ERUs.
, Suggest possible technical uncertainties which must be furtherinvestigated to refine and make a kinetic scale of incinerabilitymore reliable.
DEFINITIONS (AS USED IN THIS SECTION)
- THERMAL STRESS: Stress due to elevated temperatures. The morethe temperature of an environment exceeds some definedreference temperature, the greater the stress at the elevatedtemperature when compared to the stress at the referencetemperature.
* THERMOCHEMICAL KINETIC STABILITY: A measure of the dynamic(time-dependent) unimolecular or bimolecular decomposition ofchemical species, when subjected to thermal stresses.
0 UNIMOLECULAR DECOMPOSITION: The self-decomposition of chemicalspecies due to thermal stresses.
0 BIMOLECULAR DECOMPOSITION: The decomposition of one chemicalspecies through reaction with another chemical species, whilesubject to thermal stresses.
* KINETIC SCALE OF INCINERABILITY: A hierarchical ordering ofchemical species according to their relative thermochemicalkinetic stability.
24

* PRINCIPAL ORGANIC HAZARDOUS CONSTITUENTS (POHCs): Hazardouschemical species contained in a hazardous waste mixture. POHCsare identified according to current federal regulations, aspromulgated under the authority of the Resource ConservationRecovery Act (RCRA). To comply with mandated federal incinera-tor emission standards, fractional DREs of 0.9999 (or higher)
•. .must be demonstrated for certain POHCs when combusted in anincinerator. These regulations do not presently apply to thecombustion of hazardous wastes in ERUs.
" DESTRUCTION and REMOVAL EFFICIENCY (DRE): A number taken froma numerical scale ranging from 0.0 to 1.0. A DRE of 1.0corresponds to complete destruction and removal of a POHC uponincineration. A DRE of 0.0 corresponds to no thermal destructionand removal of a POHC upon incineration.
- INCINERATION: Thermal processing by combustion, with orwithout use of air pollution control equipment. The objectiveof thermal processing is to destroy chemical species, and theobjective for using air pollution control equipment is toremove chemical species.
NOTE
In the following discussions, DREs will be considered in terms of combus-%-% tion in incinerators or ERUs which are not equipped with auxiliary air pollutioncontrol equipment.
BACKGROUND
" Current federal regulations, as promulgated under RCRA, mandatethe demonstration of 0.9999 (or higher) DREs of POHCs inhazardous waste mixtures treated by incineration.
- Under RCRA-promul gated regulations, an incinerator for which0.9999 (or higher) DREs of POHCs are not demonstrated will notbe permitted for treating hazardous waste mixtures.
PROBLEM
- The demonstration of 0.9999 (or higher) DREs of POHCs is often:(1) difficult, (2) expensive, (3) manpower-intensive, and (4)
. time- consuming.
10, PROGRAM
Thesis
o Specific chemical compounds can be used as surrogates forPOHCs. These may result in the reduction of the difficulty,
* ,expense, manpower requirements and/or time required to demon-strate that 0.9999 (or higher) DREs of POHCs have been achieved
25
7,o |
--- i

when hazardous wastes containing POHCs are combusted in incinera-tors or ERUs. These specific compounds are referred to astracers.
Action
0 Identify candidate tracer compounds which are not indigenous toa hazardous waste mixture. If the hazardous waste mixture isto be combusted in incinerators or ERUs, determine methods for:(1) homogeneously mixing the tracers with the hazardous wastemixture prior to combustion, and (2) monitoring the emissionsof tracers such that DREs of the emitted tracers may be deter-mined.
- Identify and evaluate technical problems associated with theuse of candidate tracer compounds.
Approach
0 Develop a mathematical relationship which can be used todetermine: (1) residence times of chemical species (POHCs ortracers) in an incinerator or ERU, and (2) correspondingtemperatures which the chemical species must be subjected to inan incinerator or ERU; in order to achieve a specified DRE.
* Survey existing literature and collect thermochemical kineticdata necessary for using the mathematical relationship (asoutlined above) to construct a kinetic scale of incinerability.
* Construct a kinetic scale of incinerability for: (1) POHCs inhazardous waste mixtures, and (2) candidate tracers which areadded to the hazardous waste mixtures.
* Describe methods so that one or more tracers may be homogeneous-ly mixed with the hazardous waste mixture prior to incineration.
0 Describe methods for monitoring emissions of tracers fromincinerators or ERUs.
o Describe methods for determining the DREs of tracers.
. (1) survey the literature to identify the technical problems inusing candidate tracers , (2) evaluate these technical problems,and (3) suggest approaches for solving them.
Results
- Candidate tracer compounds have been identified. Tracercompounds include, but are not limited to: SF6 , CF4 , C2F6,C3F8 , and C4F10 .
26
. .. .._. •J __ -K r° .W .. .. . . .
6 A mathematical relationship has been developed which can beused to determine: (1) residence times of chemical species(POHCs or tracers) in an incinerator or ERU, and (2) correspond-ing temperatures which the chemical species must be subjectedto in an incinerator or ERU; in order to achieve a specifiedDRE. The mathematical relationship is:
t = -(ln(A))/k(1
where t is the residence time in seconds, A~ 1 -DRE, and k
k+ kbi(OHEQ). At any specified temperature, for each
candidate tracer or PQHC, the parameters, ku and kbi may be
obtained from measurements or estimation kechniques which arereported in the literature (References 9,16). A method forcalculating a value for the parameter OHE is also described in
the literature (Reference 2).
0 A kinetic scale of incinerability which uses these mathematicalequations is illustrated in Figure 2. The example shown inFigure 1 compares the thermochemical kinetic stability of SFwith several POHCs, including several explosive compounds. oreach chemical species shown, a temperature-versus-time curvehas been plotted,assuming a 0.9999 ORE is always to be achieved.The kinetic scale of incinerability follows from the observationthat,at any given temperature, the longer the time required toachieve 0.9999 ORE for a chemical species, the more stable(thermochemical kinetic stability) the chemical species is.Thus, the rightmost curves in Figure 1 correspond to the moststable chemical species. Therefore, for the chemical speciesshown in Figure 2, SF is the chemical species most difficultto destroy at any spe~ified temperature. If a mixture contain-ing these chemical species is incinerated, a high ORE for SFeffectively guarantees all POHCs in the combusted mixture wifihave even higher OREs, subject to technical uncertaintiesdiscussed below.
* On the basis of numerous comparisons of the relative thermo-chemical kinetic stabilities of candidate tracer compounds withPOHCs likely to be found in hazardous waste streams, SF 6 is
recommnended for further consideration in developing a chemicaltracer method for verifying that high OREs of POHCs are achieved.
a Technical problems associated with the use of the candidatetracers have been identified, as reported in the literature(Reference 10). These problems include multicomponent phaseseparation, flame inhibition, mass transport and heat balanceeffects. When these problems develop, combustion can be
L* nonuniform.
27

(04
E
CL)
0 CL
Cl0)
0
4 0
0
co))
o- z
01 0 I)So =
coo0 0)
0zqp
z), 3a Vld 3
28C

0 Solutions for technical problems associated with the use oftracers have been reported in the literature (Reference 10).These solutions include: (1) improving fuel atomization, (2)improving mixing of fuels with combustion air, (3) providingfor a high temperature combustion zone transit time whichsignificantly exceeds fuel droplet burnout and mixing times,and (4) employing afterburners.
* Methods for monitoring emissions of tracer compounds fromincinerators and ERUs have been reported in the literature(Reference 10). These methods include the use of gas chroma-tography and infrared spectroscopy.
0 Technical problems remain on how to homogeneously mix candidate
tracer compounds with hazardous waste mixtures to be treated byincineration.
Discussion
- Further research is required to resolve technical uncertaintiesand is ongoing at NBS.
. The likelihood that chemical tracer methods will be incorporatedinto federal regulations concerned with incineration of hazardous
* - waste mixtures is uncertain at this time.
.'
.'p
29
'Irk . ° , •. *.- . , -. . - -' . ' . - ' - ' - ' - . . ' . - .. . - . . . . . . o '. - . , - . - , " , , , ' ., ." , , . ,, , . . - - ' -' ,

SECTION VI
UNKNOWN (4): METHODS TO ASSESS HAZARDS TO HUMANS AND ECOSYSTEMS AS ARESULT OF INCINERATION OF INDUSTRIAL PROCESS WASTES IN VARIOUSCOMBUSTION CHAMBERS
GOAL
Achieve an appropriate risk assessment (RA) system for Air Force decisionmakers to use when electing options for dealing with industrial processwastes.
OBJECTIVES
Provide a basis for such a risk assessment system.
BACKGROUND
Components of risk assessment include, but are not limited to, thefollowing:
1. Are any supplemental fuels stored and/or treated at an AirForce site prior to firing? If so, what is the probabilityfor:
a. Improper release?b. Adverse effects on the exposed population and/or ecosystem?
2. Is there an increased possibility of improper release ofpotentially harmful constituents from the combustor effluentwhen industrial wastes are being used as supplemental fuels?If so, what is the probability for:
a. Such constituents to migrate to a place where harm mightoccur?
b. Computing accurately the time lapse for such migration tooccur?
c. Accurately measuring the concentration of such constituentsat the new time and place, i.e., after migration?
d. Evaluating the potential for harm at this new time andplace?
3. What safeguards might be considered in coping with allegationsof improper release of potentially harmful constituents?Activities might include, but not be limited to, the following:
a. Baseline studies prior to using such wastes as supplementalfuels.
b. An approved monitoring system for the effluents and forthe enqineering aspects of the combustion operationitself.
30
S. .. ." ..".-...- -..,.-. .. ..'. .. ' ..... .- . . . . ..... ..: . . .... .... ....-... ... -......- . , -a" ,

-6 -7. _..-.i-
c. An agreed method between the permit grantor and thegrantee, i.e., Air Force or Air Force Contractor, concerninglevels of concentration to be used as targets (i.e., howclean is clean?).
d. An agreed method between permit grantor and grantee onevaluating risks from the facility.
e. An appropriate economic protection arrangement.
The evaluation of the issues associated with 1 and 2 above is uncertainand controversial. For example, the EPA established an Agency-wide task groupto deal with toxic material. This group is reportedly considering policy inthe areas of:
0 Science risk assessment and policy.
* Coordination of interagency risk assessment efforts, e.g.,mutual policy issues between EPA and the Occupational, Safety,and Health Administration (OSHA), Consumer Product SafetyCommission (CPSC), and the Food and Drug Administration (FDA).
Existing judicial rulings which involve certain issues of 1 and 2 areconflicting. Therefore, clear-cut resolution of these issues is not expectedsoon. In that case, a strong program dealing with the requirements of 3 maywell afford the permit seeker a reasonable probability of obtaining permissionto utilize industrial wastes as supplemental fuels and still realize anacceptable return on total investment. Lack of such a program might well bethe basis for lengthy continuations of the permit process or even permitdenial. The remainder of this brief discussion of RA will therefore deal withthe components of Question 3 as related to the Air Force.
COMPONENTS OF RISK SAFEGUARDS PROGRAM FOR ENERGY-RECOVERY OPERATIONS
Baseline Studies
Data might be obtained on certain potentially harmful effluents fromoperations utilizing industrial wastes as supplemental fuels. These data rmaybe taken over time to establish the degree of cleanliness prior to initiatingroutine operations. Involvement of state officials in designing studies and"certifying" the results might be useful. The downside risk is that opponentsof using industrial wastes as fuels might suggest that any increase in concen-tration of the constituents being monitored is due to Air Force activities.
Monitoring Systems
1. A step-by-step process should be developed to show that releaseof potentially harmful constituents is minimized or eliminated.
2. Monitoring methods to prove that such release is minimized oreliminated need to be developed, and the strengths and weakness-
es of such methods need to be evaluated. Of special importanceis the sampling methodology.
31
"- S
'44
How Clean is Clean?
Rosenblatt and co-workers at the U.S. Army Biomedical Research andDevelopment Laboratory have developed a technique known as the PreliminaryPollutant Limiting Value (PPLV) method for evaluating the question of cleanli-ness (References 17-24). Briefly, in Rosenblatt's words:
Initially, each pathway for transfer of a pollutant from the environ-ment to man is treated as if it involved either (a) one environmental
compartment, or (b) a series of successive compartments containingthe pollutant at equilibrium. Transfer from the final compartmentto humans is considered a nonequilibrium process occurring at anassumed rate. A PPLV is that concentration of the pollutanL in thefirst compartment that is calculated to result in reception by thetarget human being of exactly the acceptable daily dose D via oneor more pathways. The basic concept may be modified asthlsituation requires.
Rosenblatt has indicated that PPLVs are not standards or criteria, but arevalues which can be used to choose alternative courses of actions for:
* Developing renovation options for contaminated areas.
* Suggesting land utilization limits near facilities.
* Specifying monitoring procedures.
0 Establishing analytical sensitivity requirements.
The basic premise is that once a PPLV is found for a specific area in whichthe treatment-storage-disposal facility is presumably contained, and if theconcentration of the constituents can be reduced to PPLV or are never allowedto exceed PPLV, then the interaction of humans with the area or its productsis "safe" for any exposed population (i.e., the acceptable daily dose of thepollutants will not be exceeded).
As for uncertainties in PPLV, Rosenblatt and co-workers have discussedsources of error in some detail but have not carried out a formal numericalanalysis. Three major sources of uncertainty are:
* The assumption of equilibrium between environmental compartments.
* The statistical extrapolations yielding "safe" doses of variousconstituents.
* Data uncertainties of likely fate of various constituents in
varioujs environments. For example, the following summarizessome relations of physicochemical properties to environmentalheha ior:
32

Physical-Chemical Data Related to
(1) Solubility in Water Leaching, degree of adsorption,mobility in environment
- . (2) Latent Heat of Solution Adsorption, leaching, vaporization fromsurfaces
(3) Partition Coefficient Bioaccumulation potential, adsorptionby organic matter
(4) Hydrolysis Persistence in environment and biota
(5) Ionization Route and mechanism of adsorption oruptake, persistence, interaction withother molecular species
(6) Vapor Pressure Atmospheric mobility, rate of vaporization
Reference 25 has considered both the availability and validity ofcurrent data in these areas.
Evaluating Risk from the Facility
The PPLV method can be extended to suggest the probability that no one inthe exposed population to a potentially harmful constituent will be harmed,even if the PPLV is exceeded (Reference 25). The basic conclusions of thiswork are given in Appendix 3. The user of hazardous industrial wastes assupplemental fuels can thus argue that small excursions of a potentiallyharmful constituent above PPLV are unlikely to cause harm.
Economic Risk Issues
One unit of measurement in dealing with improper release of potentiallyharmful constiLuents is the dollar. Indeed, the first question put to theGovernor of New Jersey by a homeowner whose land was near a site found tocontain 0.04 to 11 parts per billion of "dioxin" was: "Does this influence
the price of our homes here?" [New York Times, June 19, 1983, Section 1, page1.] The Governor's reply was: "It should not," but no quantitative data areavailable to evaluate this issue. However, if property owners conclude thatthe existence of an Air Force operation which burns industrial waste assupplemental fuel may cause economic downgrading of their holdings and/or thepossibility for adverse health effects, then the Air Force operation may, inturn, suffer adverse economic effects. In fact, many property owners nearsuch Air Force operations may oppose the issuing of a permit. Therefore, anapproach which serves to reduce possible adverse economic consequences throughthe use Df some form of insurance could be a strong positive influence inobtaining the permit.
In this approach, certain important financial issues can be taken intoaccount in advance. This data will be required in any case under ComprehensiveEnvironmental ikesponse, Compensation, and Liability Act (CERCLA) (4? USC 9601
33
> > "-",'-" ' "-'"-'"-'"--"~~~~ . .,"-". .----*.'" - . , " -, - " '" " ' "- - - - - -. -- '" "'.-. " . -

i . .7 7 7 . . . - . T .7 171.
-* et seq.) at Section 108[b](1) which requires the President to promulgatefinancial responsibility requirements for all classes of facilities involvedin the production, transport, treatment, storage and disposal of nazardoussubstances. CERCLA requires operators of a facility involved with hazardoussubstances to establish and maintain evidence of financial responsibilityconsistent with degree and duration of risk associated with the hazardoussubstances at the facility. Issues which the EPA are currently examininginclude:
0 What constitutes "Risk of Injury"?
6 How should "Risk of Injury" be used to rank classes offacilities?
Therefore, consideration of RA alternatives by the prospective user of hazardousindustrial wastes as supplemental fuels is likely to be useful in currentpermit activities and necessary in future dealings with state and Federalentities.
34

SECTION VII
UNKNOWN (5): SYSTEMS ANALYSIS METHOPS TO CORRECTLY COMPARE ECONOMIC ASPECTSOF OPTIONS TO RECOVER ENERGY, REUSE, RECYCLE, MARKET, TREAT, OR DISPOSE OFVARIOUS WASTES CREATED IN VARIABLE QUANTITIES OVER WIDE GEOGRAPHIC AREAS
Methods have been developed at NBS for dealing with municipal solidwastes (Appendix II). Recently NBS personnel have suggested to the DefenseLogistics Agency that the existing resource recovery planning model, known as
RRPLAN, be modified to encompass hazardous wastes. Upon completion of such atransformation, Air Force decision makers could then select optimum economicalmeans to deal with industrial process wastes.
GOAL
To provide a means of evaluating options for recycling, reusing ordisposing of industrial wastes.
OBJECTIVE
This project will provide an economic model of hazardous waste recoveryand management that will enable the DOD to comply with Executive Order 12088,"Federal Compliance with Pollution Control Standards." Specifically, themodel will define the most cost-effective means for handling recyclablehazardous wastes generated by DOD. Disposal alternatives addressed by themodel will include: (1) destructive disposal (incineration or landfill), (2)sale (commercial recycling), (3) off-base recycling (material is returned forreuse), (4) onbase recycling, and (5) removal (commercial firms are paid toremove the material with recycling or destructive disposal). A majortransformation of the Resource Recovery Planning Model (RRPLAN) will be doneto facilitate the development of an analytically sound approach for assessingthe economics of recovering commodities from hazardous wastes.
BACKGROUND
Large volumes of industrial wastes are generated on a continuing basis atDOD installations. The final disposition of these wastes requires properconsideration of the environmental consequences, the eaonomics, and theviability of the disposition method. These factors have always been integralparts of the disposition decision process. However, the environmental factorshave assumed increasing importance as a res,'' of the federal environmentalregulations of hazardous waste materials under the Resource Conservation andRecovery Act (RCRA) of 1976. These regulations are designed to define respon-sibility for the environmentally acceptable disposition of a wide range ofhazardous wastes.
DOD compliance with these, as well as other environmental regulations is
mandated by Executive Order 12088. The military is complying with the regula-tions and with the regulatory structure as it evolves. Much of this effortcenters on the identification and management of hazardous wastes, particularly
35

at the installation level. The oxsts of haidling and disposing of these wastes
will be of increasing concern as hazardoub waste regulations are pr(1I ulqated.
Until recently, the individual services have been responskDie for disposing of
their own hazardous wastes. While the installation commander has the uverallresponsibility for complying with environmental regulations under current DODpolicy (DEQPPM 80-8), the DOD has established the Defense Property DisposalService (DPDS) under the Defense Logistics Agency (DLA). The DPDS is thefocal point for hazardous waste disposal activities. To centralize thedisposal management function and ensure DOD compliance with federal and localregulations, DOD assigned responsibility for storage and disposal of hazardousmaterials to DPDS. Recent Congressional Hearings (Subcommittee on Environment,Energy and Natural Resources of the Committee on Government Operations)re-emphasized reliable planning and control systems for monitoring DOD wasteswhich could be reused, recycled, or, if necessary, disposed.
THE RESOURCE RECOVERY PLANNING MODEL (RRPLAN)
The economic analysis of resource recovery options is extremely complicated,requiring an in-depth analysis of facility design and cost a5 well as marketsize, structure and location. To address these complicating factors, RRPLANdeals with two interdependent issues. On the one hand, RRPLAN explicitlyincorporates potential economies of scale in the construction and operation ofa solid waste processing facility. The model is thus able to support thebasic trade-off of savings from centralized processing versus the costs ofadditional hauling required to bring such savings about. On the other hand,RRPLAN uses a detailed cost accounting system to attack the economic issues bycarefully estimating the effects on overall program costs from decisions onsiting, routing, marketing and financing. By integrating the technical issuesof processing with these four major decision points, RRPLAN carefully examinesa variety of questions.
RRPLAN is a computer model designed with three purposes in mind: (1) theability to generate a preferred plan for resource recovery, (2) the capabilityto evaluate a scenario specified by the decision maker for technical andeconomic feasibility, and (3) its use as a tool to facilitate the decision-making process by providing answers to many "what-if" questions through anin-depth sensitivity analysis.
To handle the three types of issues just mentioned, RRPLAN includes a setof cost categories, energy categories, and commodities. Cost categories arethe heart of RRPLAN's accounting system. They are included so that thedifterential impacts of the regional plan on the various segments of thepopulation can be measured as vll as financial transfers into the region frommarketing activities. Individual cost categories are classified as eitheropE rating (i.e., recurrinj annual costs) or capital. Each cost category has acost-growth scenario (differential inflation rate) associated with it, so thatit, may incredse more (or less) rapidly than the general rate of inflation.Financidl arrangements are explicit in all capital cost accounting. Allcapital items, except those currently in use, are assumed to he purchased atthe beginning of the planning period. Replacements which occur within theplnninn' reriod are inflated by the differential inflation rate from the first
36
................ .................. w

* ". . .-... .'. . . . .
year of the planning period to the year of replacement. A standard amortiza-tion calculation is used to generate an annual cost for each year of thecapitalization of the loan. A series of cost-summation categories permits theuser to aggregate cost categories having differential inflation rates, usefullives, etc., into a single-cost summation category for further analysis.Energy categories may be handled in a similar manner. The model greatlyfacilitates the process of performing a detailed cost analysis, once a solutiornhas been found, by leaving the user ample opportunity to define the types ofcommodities processed and sold (e.g., municipal solid waste (MSW) and steam).The use of separate commodity categories also permits one to measure theeffects of differential transportation costs (e.g., handling MSW versusnewsprint) as well as cost-sharing arrangements for processing and/or revenue-sharing arrangements among municipalities for marketing activities.
The model approaches the challenge of siting and sizing solid wastemanagement facilities by first approximating nonlinearities in the capital andoperating cost functions due to economies of scale with up to three linearsegments. Each segment has an intercept (a fixed charge) and a slope (anincremental cost associated with increased processing activities). Decreasing
-returns to scale in the market revenue functions are allowed due to thepotential for market saturation.
The introduction of fixed charges imposes certain complications, due tothe existence of local optima. Such circumstances require a specially designedoptimization technique to generate meaningful solutions. The technique usedin RRPLAN involves a fixed-charge linear programming algorithm with a forcingprocedure meant to insure that the model can pass over an area of temporarilyincreasing cost in the solution domain (i.e., a local optimum) to find thetrue optimum. RRPLAN adds new forcing methods representing a significantimprovement over methods used in other models in which each site (or site-process combination) which was in the solution is forced out of the solutionand vice-versa. This approach permits the solution domain to be searched in amore coordinated way of operating on all activities (e.g., transportation,processing, marketing) associated with a particular site (or site-processcombination).
Equation (2) is a general economic expression governing resource recoveryor most other businesses where a product is produced via the use of capitalequipment and sold on a per unit basis. For the case of resource recovery,
" "the values of a, b and c should be minimized. In effect, the fixed-chargelinear programming algorithm of RRPLAN implicitly selects values for a, b andc, given the problem structure imposed by the input data, to minimize the costper unit (CPU).
0. CPU = a + b • (CAP/UPY) + c • RPU + (2)
where CPU = cost per unit (the variable of interest),CAP = capital cost,UPY = units per year,RPU = revenues per unit,
a,b,c = parameters of interest,a (stochastic) disturbance.
37
.. .
• . -, . .. ,. -. . . . , , - . _ ", .- . ., ," .. ' . - . - . , ., .- . " • . • . .- -. .

The term E, accounts for uncertainties in the input data (e.g., discountrate, inflation rate, useful life of capital stock, transport network) whichcan affect estimates of the parameters, a, b and c. Equation (2) is thus acapsule summary of the economic and technical challenges facing planners anddecision makers in selecting the best resource recovery scenario. Using thisequation, planners can assess the effect of specific uncertainties on theeconomics of any resource recovery scenario. The basic approach involvesselecting values for CAP, UPY, and RPU, based on their expected ranges, and
* analyzing their effect with the model. Application of the model permits thedecision maker to monitor changes in the cost per unit (CPU). Parameters a, band c can then be estimated through the use of statistical techniques. Therisk of a specific plan can then be evaluated through the use of computer-basedapplications of probability theory.
TECHNICAL APPROACH
A hazardous waste recovery and management computer program could bedeveloped through a major transformation of 'he RRPLAN model. The resultingmodel would include a front end, an optimizer and a back end. The front endwould read all data inputs and construct the application problem. Theoptimizer would use a fixed-charge linear programming algorithm to solve theapplication problem. The back end would interpret the solution and output theresults of the analysis. The outputs of the hazardous waste recovery and
management model would be patterned after those of RRPLAN. (A sample of thisoutput and guidelines for interpreting it are given in Chapter 4 of NBSSpecial Publication 657 (Reference 26). Persons from DOD responsible forhazardous waste activities would be contacted to identify the assumptions anddata requirements needed to design, construct and implement the model.
The model's primary objective would be minimizing life cycle costs. A
separate scenario evaluation capability would also be incorporated into themodel so that a prespecified plan could be evaluated for feasibility.
The model would allow for user-defined commodity categories. Commoditieswould include generated hazardous wastes, various intermediate recoverableproducts, final recoverable products and residues. Intermediate recoverableswould be inputs into secondary recovery processes. Those process outputswhich could be treated specifically in the model (e.g., marketed, entered intosecondary recovery, destructive disposal) would be declared as commodities.The user would also have the option to represent recoverables as revenues (netcost of hauling to market) and residues as costs (hauling cost plus disposal)without declaring such recoverables and residues as commodities. The modelwould allow for user-defined cost categories. All cost categories would besummarized in the back end. The full-cost accounting system of RRPLAN wouldbe included.
The input file would define each hazardous waste source, its location,commodities produced, generation rates and cost accounting system. Eachprocess would be defined by type, input commodity, output commodities and costaccounting system. Markets would be defined by location, input commodity andrevenue schedule. The full range of market analysis included in RRPLAN wouldbe built irto this model. Each site would have a location associated with it.A spt of site-process combinations would be used to specify the cost structure
* 38
-: . -

077%.. .-. C * k -- 0.
of the problem for analysis as well as to set constraints on processing.. activities. Sources, sites and markets would be linked together via a transpor-
tation network. Transportation categories would be used to cover the costs ofhauling that commodity. All linkages in the solution would be summarized in
." the back end.
The model could be tested using data (supplied to NBS by DOD) on anactual facility or region. The test case should have sufficient detail toexercise all major features of the model.
Guidelines would be developed for performing a systematic sensitivityanalysis which permits the values of a, b and c in Equation (2) to be estimated.Techniques for measuring risks, in terms of the overall costs of the plan,would also be developed.
Documentation for the model would be summarized in two reports. Thefirst report would provide the information necessary to assess the model'sinput requirements (including time, money, and other resources) and theusefulness of the model's results. This report would be designed for thenonprogramming model user. The second report would be designed for use byprogrammers and analysts. Information contained in this report would havesufficient detail to enable the programmer to understand the operation of themodel, trace through it for debugging, make modifications, and determine ifand how the model can be converted to other computer systems. An in-depthdiscussion of the model's functional structure, the algorithms used, and thetechniques employed for model verification and validation would also beincluded.
A series of tutorials would be developed and taught to give potentialmodel users "hands on" experience in a controlled environment.
Extensions of the model dealing with the risks from releases of toxicsubstances into the environment would also be studied. Emphasis would beplaced on how these extensions could address the issues (implementing proce-dures for the coordination of response actions to releases of hazardoussubstances into the environment) raised in Executive Order 12316.
The hazardous waste recycling and management model would:
0 Define the most cost-effective means of handling the wastesgenerated.
o Contain a scenario evaluation capability.
o Help determine a cost-effective allocation of funds amonghazardous waste sites.
o Help decision makers rank sites according to which ones givethe biggest payoff for the funds allocated.
o Combine sensitivity analysis with a technique for assessingrisks.
39i." .......................................... ' 7

SECTION VIII
UNKNOWN (6): POSSIBLE IMPACT OF PENDING LEGISLATION, REGULATIONS ANDJUDICIAL INTERPRETATIONS OF EXISTING LAWS AND REGULATIONS
GOAL
Estimate possible impacts of legal and regulatory actions on aspects of
industrial wastes used as supplemental fuels.
OBJECTIVE
List current and proposed actions which could require alterations in AirForce plans and programs to deal with industrial wastes.
BACKGROUND
Specific rules on incineration of potentially hazardous wastes werepromulgated in the Federal Register (47FR27520) on June 14, 1982. A listingof various regulations and references in the Federal Register and Code ofFederal Regulations is summarized below. At the present time, there are noregulations governing the burning of hazardous wastes in heat recovery thermalprocessing units. In addition, any provisions of the Clean Air Act which mayaffect methods to utilize potentially hazardous wastes as supplemental fuels,are not yet under law, voted or enacted.
CFR REFERENCES TO RCRA REGULATIONSa
To implement the various sections of RCRA, Subtitle C, EPA has issued thefollowing sets of regulations in TItle 40 of the Code of Federal Regulations:
Part 260: Hazardous Waste Management System: General
Part 261: Hazardous Waste Management System: Identification
and Listing of Hazardous Wastes
Part 262: Standards for Generators of Hazardous Wastes
Part 263: Standards for Transporters of Hazardous Wastes
Part 264: Standards for Owners and Operators of Hazardous WasteTreatment, Storage, and Disposal Facilities
Part 265: Interim Status Standards for Owners dnd Operators ofHazardous Waste Land Disposal Facilities
Part 1?2- 124: Consolidated Permit Regulations (4ncludinq permit
regulations for hazardous waste facilities and Stateprogram authorization)
aInformation provided by Mr. James Lyons of Coan, Couture, Lyons and
Moorhead (a law firm in Washington, PC), on 19 Octoher 1982.
40
Le * " . - " , ' " , o, . _. , , , . , . , , - , ., . , ,- • -

These regulations have been promulgated in several stages and are containedchiefly in the following Federal Register publications, although there hasbeen a continuing process of amendment:
1. 45 FR 33066, May 19, 1980: Parts 260-263 and 265, generalprovisions of Part 264, and Parts 122-124.
2. 45 FR 47832, July 16, 1980: Listing of additional hazardouswastes in Part 261.
3. 46 FR 2804, January 12, 1981: Parts 264 and 122, standards forstorage and treatment facilities; and Parts 264, 265, and 122,standards for closure, postclosure care, and financial respon-sibility.
4. 46 FR 7666, January 23, 1981: Parts 264 and 122, standards forincinerators.
5. 46 FR 12414, February 13, 1981: Part 267, interim permittingstandards for four classes of new land disposal facilities.
However, Congress is clearly intent on dealing with the use of industrialwastes as supplemental fuels. The Hazardous Waste Control and Enforcement Actof 1983 introduced in the House of Representatives as HR 2867 in May, 1983 andfavorably reported by the Committee on Energy and Commerce (John Dingell, D.,MI, Chairman) as Report 98-198, Part 1, states that stringent requirements arelikely to be applied to wastes used as fuels (Appendix D). In addition,small-quantity generation of potentially hazardous waste is dealt with by HR2867. Certain Air Force bases previously exempt from regulation by virtue of
- producing less than one metric ton of waste per month will be regulated if HR2867 becomes law. Thus, Air Force personnel may need to plan for this contin-gency in advance. (The modifications proposed for RRPLAN could aid Air Forcedecision makers if the small generator exemption is revoked.)
A number of State laws may also affect Air Force activities using industri-
al wastes as supplemental fuels. Again, the RRPLAN modifications could aidAir Force decision makers in selecting least-cost options to deal appropriatelywith industrial wastes.
41

SECTION IX
CONCLUSIONS
The technical basis for using Air Force industrial wastes as supplementalfuels certainly exists. Suggestions made in this report should enable AirForce personnel to design and execute programs to destroy such wastes, recoverenerqv and show empirically that applicable environmental laws and regulationshave been properly taken into account. Furthermore, a technique to allowdecision makers to select least-cost options to use the suggestions madein this report exists, i.e., a modified form of the resource recoveryplanning model (RRPLAN) developed at the National Bureau of Standards.
42

.- F. ... 7
-.. .
REFERENCES
1. Shaub, W. and Tsang, W., "Physical and Chemical Properties of Dioxin, inRelation to Their Disposal," Human and Environmental Risks of ChlorinatedDioxins and Related Compounds Tucker, R. E., Young, A., and Gray, A. P.,eds., pp. 731-748, Plenum Publishing Corp., N.Y., 1983.
2. Shaub, W. M. and Tsang, W., "Dioxin Formation in Incinerators," acceptedfor publication in Environmental Science and Technology, 1983.
3. Shaub, W. M. and Tsang, W., "Overview of Dioxin Formation in Gas andSolid Phases Under Municipal Incinerator Conditions," paper ENVR 98, 1983American Chemical Society Annual Meeting, Washington, DC, 28 August - 2
-. September 1983.
4. Shields, C. D., Boilers: Types, Characteristics and Functions, McGraw-- Hill Book Co., N.Y., 1961.
. 5. Kox, W. M. A. and Van Der Vlist, E., "Thermal Treatment of Heavy-Metal-Containing Wastes," Conservation & Recycling, vol. 4, p. 29, 1981.
6. Velzey, C. 0., "Corrosion Experiences in Incineration," Paper No. 133presented at the Corrosion 74 Symposium, Palmer House, Chicago, Illinois,4-8 March 1974.
7. Kiang, Y. and Metry A., Hazardous Waste Processing Technology, Ann ArborScience Pub., Inc., Ann Arbor, MI 1982.
8. Bonner, T., Desai, B., Fullenkamp, J., Hughes, T., Kennedy, E., McCormick,R., Peters, J., and Zanders, D., Engineering Handbook for Hazardous WasteIncineration, EPA Contract No. 68-03-2250, EPA, Washington, DC, November
- 1980.
9. Tsang, W. and Shaub, W. M., "Chemical Processes in the Incineration ofHazardous Materials," in Detoxification of Hazardous Wastes, Exner, J.,ed., Ann Arbor Press, Ann Arbor, Michigan, 1982.
10. Tsang, W. and Shaub, W. M., Surrogates as Substitutes for PrincipalOrganic Hazardous Constituent Validation of Incinerator Operation, DRAFTReport (available from W. M. Shaub), no report number, National Bureau ofStandards, Washington, DC, August 1983.
11. See for example: Samuelsen, G. S., "The Combustion Aspects of AirPollution," Adv. in Enviro. Sci. and Tech., Volume 5, Pitts, J. N. and
0 Metcalf, R. L., eds., John Wiley and Sons, Inc., N.Y., N.Y., pp. 220-3241975.
12. Dils, R. R. and Follansbee, P. S., "Use of Thermocouples for Gas Tempera-ture Measurements in Gas Turbine Combustors," in Characterization of HighTemperature Vapors and Gases, Hastie, J. W., ed., NBS Spec. Pub. 561,
*; Washington, DC, pp 1027-1070 1979.
43
• ... ..-..-..............-.....-...........-. .. . ".-. .-. .,. .--- '..,-;..v °.., ,-,i.,"'"-2-2. ,?¢'.

REFERENCES (CONCLUDLD)
*13. See for example: Britton, C. F., "Corrosion Monitoring," Chemistry inBritain, vol. 17, p. 108, 1981.
14. Wood, B. J., Wise, H., and Inami, S. H., "Heterogeneous Combustion ofMulticomponent Fuels," Combustion and Flame, vol. 4, p. ?35, 1960.
15. Law, C. K., "Recent Advances in Droplet Vaporization and Combustion,"Prog. Energy Comb. Sci., vol. 8, p. 171, 1982.
16. Benson, S. W., Thermochemical Kinetics, 2nd ed., John Wiley and Sons, NewYork, 1977.
17. Congress of the United States, Office of Technology Assessment, Assessmentof Technologies for Determining Cancer Risks from the Environment, U.S.Government Printing Office, Washington, DC, June 1981.
18. Rosenblatt, D. H., Dacre, J. C., and Cogley, D. R., An Environmental FateModel Leading to Preliminary Pollutant Limit Values for Human HealthEffects, U.S. Army Medical Research and Development Command TechnicalReport 8005, 47 pp., April 1980 (AD B0499172).
19. Dacre, J. C., Rosenblatt, D. H., and Cogley, D. R., Envir. Sci. andTech., vol. 14, pp. 778-784, 1980.
20. Rosenblatt, D. H. and Small, M. J., Preliminary Pollutant Limit Valuesfor Alabama Army Ammunition Plant, U.S. Army Medical Research and Develop-ment Command Technical Report 8105, 48 pp., August 1981 (AD A104203).
21. Rosenhlatt, D. H., Environmental Risk Assessment for Four Munitions-RelatedContaminants at Savanna Army Depot Activity, U.S. Army Medical Researchand Development Command Technical Report 8110, 14 pp., November 1981 (ADA116650).
22. Rosenblatt, D. H. and Kainz, R. J., Options and Recommendations for aPolybromobiphenyl Control Strategy at the Gratiot County, MichiganLandfill, U.S. Army Medical Research and Development Command TechnicalReport 8204, 36 pp., August 1982.
23. Rosenblatt, D. H., Dacre, J. C., and Cogley, D. R., An Environmental FateModel Leading to Preliminary Pullutant Limit Values for Human HealthEffects, Environmental Risk Analysis for Chemicals, R. A. Conway, ed.,
*, van Nostrand Reinhold Co., New York, pp. 474-505, 1982.
24. Lyman, W. 3., Reehl, W. F. and Rosenblatt, D. H., Handbook of ChemicalProprpt Estimation Methods, McGraw-Hill, New York, 198?.
25. Yakowitz, H., "A Simpl Degree of Hazard System for Hazardous Wastes,", Proc._C-F A C .onf., Livermore, CA, tlarch, 1083, in press.
26. Chopm1,n, R. .. and (5erm ,n, E. B., The Resource Recovery Planning Model:A ew Tool for clid Waste Managepent, National Bureau of Standards,SpeciaTThTiVMio 65-7NBS Washington DC, 1983.
44
% . " .v ' ." - ... " -. - - . -

APPENDIX A
SELECIED BIBLIOGAMfY
45

APPENDIX A
SELECTED BIBLIOGRAPHY
Bonner, T., Desai, B., Fullenkamp, J., Hughes, T., Kennedy, E., McCormick, R.,Peters, J., and Zanders, D., Engineering Handbook for Hazardous WasteIncineration, EPA Contract No. 68-03-2550, EPA, Washington, DC, November1980.
Boris, J. P. and Oran, E. S., "Modeling Turbulence: Physics or CurveFitting?" Bowen, R., Manson, N., Oppenheim, A. K., and Soloukin, R. I.,eds., Combustion in Reactive Systems; Progress in Astronautics andAeronautics, vol. 76, p. 187, 1981.
Cato, G. A., Maloney, K. L., and Sotter, J. G., Reference Guideline forIndustrial Boiler Manufacturers to Control Pollution with CombustionModification. Final Report. June 73-September 77. Tustin, CA, KVB,Inc.; Research Triangle Park, NC, Industrial Environmental Research Lab.,November 1977. NTIS Order No. PB-276 715/OST. EPA Order No.600/8-77-033b.
Cowherd, Jr., C., Hazardous Emission Characterization of Utility Boilers.Final Report. November 1973-July 1975. Midwest Research Institute, KC,Missouri; Environmental Protection Agency, RTP, NC, July 1975. NTISOrder No. PB-245 017. EPA Order No. 600/2-75-066.
Cox, J. D. and Pilcher, G., Thermochemistry of Organic and OrganometallicCompounds, Academic Press, N.Y., 1970.
Dinesh, C. A., "Corrosion Problems on a Wide Range of Waste Incinerators,"HazMat 83, Philadelphia, Pennsylvania, 12-14 July 1983; Proceedings ofHazMat 83, in press, 1983.
Dils, R. R. and Follansbee, P. S., "Use of Thermocouples for Gas TemperatureMeasurements in Gas Turbine Combustors," in Characterization of HighTemperature Vapors and Gases, Hastie, J. W., ed., NBS Special Publication561, Washington, DC, pp. 1027-1070, 1979.
Hannum, J., Ed., Proceedings of the JANNAF S&EPS Workshop on Hazardous WasteManagement, CPIA Publication 364, 1983.
Hanson, S., Beer, J. M., and Sarofim, A. F., "Nonequilibrium DistillationEffects in Vaporizing Droplet Streams," in Combustion of Synthetic Fuels,W. Bartok, ed., ACS Symposium Series 217, ACS, Washington, DC, 1983.
Hecklinger, R. S., "The Relative Value of Energy Derived From MunicipalRefuse," J. Energy Resources Tech., vol. 101, p. 251, 1979.
4ecklinger, R. S., Velzy, C. 0., and Trautwein, W. F., "Oceanside DisposalPlant Improvement Program - Desiyn, Construction and OperatingExperience," in Proceedings of 1978 National Waste Processing Conference- Energy Conservation Through Waste Utilization, ASME, N.Y., 1978.
*46

Kiang, Y. and Metry, A., Hazardous Waste Processing Technology, Ann ArborScience Pub., Inc., Ann Arbor, MI 1982.
Kox, W.M.A. and Van Der Vlist, E., "Thermal TreatmEnt ofHeavy-Metal-Containing Wastes," Conservation & Recycling, vol. 4, 29(1981).
Krause, H. H., Cover, P. W., Berry, W. E., and Olexsey, R. A., "Corrosion andDeposits From Combustion of Solid Waste, Part VII - Coincineration ofRefuse and Sewage Sludge," Trans. ASME, vol. 102, p. 698, 1980.
Law, C. K., "Recent Advances in Droplet Vaporization and Combustion," PEnergy Com. Sci., vol. 8, p. 171, 1982.
Office of Technology Assessment, Technologies and Management Strategies ForHazardous Waste Control, U.S. Government Printing Office, Washington, DC,1983.
Oran, E. S. and Boris, J. P., Detailed Modeling of Combustion Systems, NRLMemorandum Report 4371, U.S. Naval Research Laboratory, Washington, DC,1980.
Samuelsen, G. S., "The Combustion Aspects of Air Pollution," Adv. in Enviro.Sci. and Tech., vol. 5, Pitts, J. N. and Metcalf, R. L., eds., John Wileyand Sons, Inc., N.Y,, N.Y., pp. 220-324, 1975.
Shaub, W. M. and Tsang, W., "Dioxin Formation in Incinerators," accepted forpublication in Environmental Science and Technology, 1983.
Shaub, W. and Tsang, W., "Physical and Chemical Properties of Dioxins inRelation to Their Disposal," in Human and Environmental Risks ofChlorinated Dioxins and Related Compounds, R. E. Tucker, A. L. Young, andA. P. Gray, eds., pp. 731-748, Plenum Publishing Corp., N.Y., 1983.
Shaub, W. M. and Tsang, W., Overview of Dioxin Formation in Gas and SolidPhases Under Municipal Incinerator Conditions, in Proceedings of theSymposium on Chlorinated Dioxins and Dibenzofurans in the TotalEnvironment, Part 2, L. H. Keith, G. Choudhary, and C. Rappe, eds., AnnArbor Science Pub., Inc., Ann Arbor, MI, in press, 1983.
Shields, C. P., Boilers: Types, Characteristics and Functions, McGraw-HillBook Co., N.Y., 1961.
Stull, D. R. and Prophet, H., JANAF Thermochemcial Tables, NSRDS-NBS 37, U.S.Government Printing Office, Washington, DC, 1971.
Stull, D. R., Westrum, E. F., Jr., and Sinke, G. C., Chemical Thermodynamicsof Organic Compounds, John Wiley, N.Y., 1969.
Tsang, W. and Shaub, W. M., "Chemical Processes in the Incineration ofHazardous Materials," in Detoxification of Hazardous Wastes, J. Exner,ed., Ann Arbor Press, Ann Arbor, Michigan, 1982.
9, 47

974.'
Tsang, W. and Shaub, W. M., "Environmental Consequences Arising From theCombustions of Municipal Solid Waste," in Resource Recovery from SolidWastes, S. Sengupta, K. F. V. Wong, eds., Pergamon Press, N.Y., pp.219-228, 1982.
Tsang, W. and Shaub, W., Surrogaes as Substitutes for Principal OrganicHazardous Constituent Validation of Incinerator Operation, NationalBureau of Standards, Washington, DC, 1983.
Velzey, C. 0., "Corrosion Experiences in Incineration," Paper No. 133presented at the Corrosion 74 Symposium, Palmer House, Chicago, Illinois,4-8 March 1974.
Wood, B. J., Wise, H., and Inami, S. H., "Heterogeneous Combustion ofMulticomponent Fuels," Combustions and Flame, vol. 4, p. 235 1960.
.4
4 48
. ° .
APPENDICES B-D
These Appendices were reproduced from multiple sources and areincluded as originally printed. Only the table, figure andequation numbers have been changed to avoid confusion withthose in the text. Format, wording and usage are as theoriginal authors intended.
49
(The reverse of this " , 1

I7
APPENDIX BEVALUATING THE RISKS OF SOLID WASTE MANAGEMENT PROGRAMS:
A SUGGESTED APPROACH
Robert E. Chapmanand
Harvey YakowitzNational Bureau of Standards
Washington, DC 20234
BACKGROUND
Solid waste management is imong the most complex municipal or regionalgovernmental tasks facing policy makers today. The physical problem of whereto locate needed facilities is further complicated by the increasing costs ofdisposal, new technologies, environmental regulations and the unavailabilityof the land for landfill. The problem becomes even more challenging when onenotes that solid waste management facilities may exhibit economies of scale inconstruction and processing. This possibility implies that the benefitsassociated with lower per unit processing costs can only be achieved throughregionalization. However, the process of regionalization creates twofundamental problems: (1) the complexity of the regional system design; and(2) the need for political consensus. Both of these problems may be addressedby developing and clearly presenting technical and economic data about theconsequences of various regional approaches. Finally, by opting forregionalization, decisionmakers must weigh the benefits of reduced processingcosts against the risks of cost overruns which are inherent in largeconstruction projects.
The approach outlined in this paper attempts to integrate the regional planningproblem with a technique for evaluating the risks of resource recovery options.This is accomplished in two stages. First, the Resource Recovery PlanningModel (RRPLAN) is described. This section of the paper summarizes the model'sassumptions, major components and modes of operation. An algebraic statementof the problem is then given along with a description of the solutionalgorithm. The second section consists of an in-depth case study for centralMississippi. A coordinated set of questions are hypothesized and solved toillustrate how the model would be applied in an actual planning context. Themodel's results are then used to develop statistical relationships whichpermit an explicit assessment of project risk.
THE RESOURCE RECOVERY PLANNING MODEL (RRPLAN)
Over the past decade, there has been a proliferation of mathematical modelsdealing with such issues as facility location, vehicle routing and manpowerplanning (Liebman [1975]). Due to unrealistic data requirements or thecomplexity of using and interpreting the model's results, the application ofthese models to the solid waste management problem has sometimes beendisappointing. More recent modeling approaches have attempted to couple theanalytical power of the computer with the ability to organize systematicallythe thoughts of the decisionmaker so that important pieces of information arenot overlooked (Jenkins [1982], Chapman and Berman [1983]). From these
51

experiences, it s possible to define a set of criteria that any model whichpurports to deal with solid waste manaqement problems should satisfy. At aminimum, any such model should be able to derive explicitly the effects ofalternative financial and cost-sharing arrangements, allow for economies ofscale, and be amenable to sensitivity analysis associated with a well-choseset of "what if" quest'ans.
Although the general solid waste management problem poses some formidabledifficulties to decisionmakers, the economic analysis of resource recoveryoptions is significantly more complicated, since an in-depth analysis offacility design and cost as well as market size, structure and location isrequired. In order to address these complicating factors, RRPLAN deals withtwo inderdependent issues. On the other hand, RRPLAN explicitly incorporatespotential economies of scale in the construction and operation of a solidwaste processing facility. The model is thus able to support the basictradeoff of savings from centralized processing versus the costs of additionalhaul required to bring such savings about. On the other hand, RRPLAN uses adetailed cost accounting system to attack the economic issues by carefullyestimating the effects on overall program costs due to decisions affectingsiting, routing, marketing, and financing. By integrating the technicalissues of processing with these four major devision points, RRPLAN permits awide variety of questions to be examined carefully.
RRPLAN may be thought of as a descendant of two earlier models. These modelsare known as WRAP, Waste Resource Allocation Program (Berman [1977], Hensey[1977]), and RAMP, Recovery and Market Planning (Berman [1976]). Both modelswere developed by the Mitre Corporation, the former through funding from theEnvironmental Protection Agency. There are substantial differences betweenthe two models, especially regarding their software support systems and theirtreatment of market structure. Both models use the same optimizer as RRPLAN.In WRAP, as in RRPLAN, a front end is available to build the equations forinput into the optimizer, and a back end is available to interpret thesolution. In RAMP a more sophisticated equation structure is available,including the full market structure in RRPLAN, but the user must prepareequations for direct input into the optimizer, and must interpret itssolution. The major focus of WRAP is on the identification of a preferreaplan which includes the best candidate sites, the appropriate processing anddisposal technology at each site, the sizing of each site and alltransportation linkages among centers of waste generation, processing sites,and disposal sites. A major weakness of WRAP is its implicit assumption thatany market for recoverables (e.g., ferrous products and newsprint) isunlimited. If market saturation is an important consideration, then WRAP'ssolution would represent an overly optimistic plan which could lead to seriouscash flow problems if the plan were implemented. RAMP adds the saturationeffect by incorporating both declining price and limited size markets.
RRPLAN, on the other hand, incorporates all of the capabilities of WRAP andRAMP, as well as numerous enhancements which render its cost accounting systemfar superior to those used in it predecessors. Furthermore, RRPLAN's morereasonable data requirements than WRAP, coupled with the type and nature ofit- output, should permit RRPLAN to greatly facilitate the regional planningand decision making processes. RRPLAN contains a more realistic cost model,
52

built-in source-separation options, an automatic dedicated transfer stationfunction, user defined cost, energy, and commodity categories, and anextensive analysis of costs by source and site, including a projected fullcost tipping fee for each site.
RRPLAN is a computer model designed with three purposes in mind. First andforemost, is the ability to generate a preferred plan for resource recovery.Second, is the capability to evaluate a scenario specified by the decisionmaker for technical and economic feasibility. Third, is its use as a tool tofacilitate the decision making process by providing answers to many what-ifequations through an in-depth sensitivity analysis.
The model has five basic modes of optimization. Each mode serves to defineSohe type of objective which is to be minimized or maximized. The first twomooes of optimization minimize the total cost of the regional plan over aspecified planning period. The first-mode minimizes the discounted costs ofthe Regional plan. Such an objective function would be required if both thetiming and magnitude of cash flows are important. If only the magnitude ofeach flows the important, then the second mode, minimization of undiscountedcases should be chosen. The choice of discounted rather than undiscountedcosts or vice versa, may cause both the costs of the plan and the physicalflows with the system to differ. The first mode, minimize lifetime discountedcosts, is the preferred criterion for plan selection and evaluation. Thethird mode of operation seeks to maximize the net energy of the regional plan(i.e., energy produced (saved) from (due to) resource recovery activitiesminus all other energy inputs). Such an objective function might be useful incomparing various waste-to-energy programs. The fourth mode of operationseeks to minimize a linear form (weighted sum) of program cost and net energycategories this approach might prove useful in comparing mixtures oftraditional and waste-to-energy programs if some form of matching formula forfunds was in effect. This mode of optimization will permit the user to weightcost of energy categories other than equally. The fifth mode focuses on thetopic of scenario evaluation. For example, a region may propose a plan which
-- needs to be evaluated from the viewpoint of technical and economicfeasibility. Typical questions addressed under this mode of operation wouldinclude the following: Are all facilities able to process the indicated wastestream without exceeding their rated capacity, or that of plants down the lineinto which they feed? Can resources be reallocated so that overall costs arereduced?
In order to handle the five types of objectives just discussed, RRPLANincludes a lot of cost categories, energy categories, and commodities. Cost
- categories are the heart of RRPLAN's accounting system. They are included sothat the differential impacts of the regional plan on the various segments of
* "the population, as well as financial transfers into the region from marketingactivities, can be measured. Individual cost categories are classified aseither operating (i.e., recurring annual costs) or capital. Each costcategory has a cost growth scenario (differential inflation rate) associatedwith it, so that it may increase more (or less) rapidly than the general rateof inflation. Financial arrangements are explicit in all capital cost
4P accounting. All capital items, except those currently in use, are assumed tobe purchased at the beginning of the planning period. Replacements which
53

- - ..* k. .t
occur within the planning period are inflated by the differential inflationrate from the first year of the planning period to the year of replacement. Astandard amortization calculation is used to generate an annual cost for eachyear of the capitalization of the loan. A series of cost summation categoriespermit the user to aggregate cost categories having differential inflationrates, useful lives, etc., into a single cost summation category for furtheranalysis. Energy categories may be handled in a similar manner. The modelgreatly facilitates the process of performing a detailed cost analysis, once asolution has been found, by leaving the user ample opportunity to define thetypes of commodities processed and sold (e.g., municipal solid waste (MSW) andsteam). The use of separate commodity categories also permits one to measurethe effects of differential transportation costs (e.g., handling MSW versus
-_ newsprint) as well as cost-sharing arrangements for processing and/orrevenue-sharing arrangements among municipalities for marketing activities.
The basic structure of RRPLAN consists of a set of equations and activitiesrelating sources of solid wastes, sites where the wastes can be processed andmarkets for energy or recovered materials. Figure BI, a capsule summary ofthe major physical system details, outlines the relationship between themodel's equations and activities.
Both the model and the physical system begin with a source of waste, or "wastegeneration zone." At this point RRPLAN permits the user to offer two types ofsource separation for consideration or to ship the mixed MSW directly to aprocessing facility. Under the first source separation scenario, the modelassumes that all paper, glass and cans are removed from the waste stream, sentto a central collection point, and then shipped to the respective market.This option is referred to as unconditional source separation. Under thesecond source separation scenario, paper, glass and cans are always removedbut paper is treated separately. As in the previous scenario, cans and glassare sent to the central collection point and marketed. Paper, on the otherhand, is put to two possible uses which reflect both its fiber value inrecycling and its energy value in combustion. This option is referred to asconditional source separation. The rationale behind this scenario is asfollows. If the price of paper exceeds some prespecified price (up to fivesuch "trigger" prices are available) then it will be marketed for its fibervalue; otherwise the paper will be burned. If multiple options are offered ata source, the model selects the preferred option. For example, alltransportation linkages emanating from the source in Figure BI are coded todifferentiate whether the link is carrying wastes or recoverables. The samecoding system is used throughout the diagram. If source separated paper, cansand glass (or any other marketable commodity) are to be shipped to themarket, then they flow along the clear linkage. If, on the other hand, mixedMSW or the residue from source separation is to be shipped, then flow occursalong the shaded linkage. Note that all wastes generated enter intotransportation.
Each transportation, processing, and marketing activity has associated with ita set of costs. For transportation, these costs include the periodicreplacement of the rolling stock as well as the cost of physically hauling thewastes or recoverables. The facilities where processing takes place requiregreater care in cost accounting. For example, there may be site preparation
54
, ?..:,,-,,-.-. , ,'.._.-.-.,... . , , . . . ....... p, -. -. . .... . .- .> ...- ,,-

. . .. .- - '' .. .. .. • - . -
costs (e.g., access roads) over and above the plant construction costs and thenormal costs of day-to-day operations. No economies of scale are assumed intransportation. However, economies of scale are admissible for both facilityconstruction and all future processing activities. Thus, the model cancapture the basic trade off of savings from centralized processing versus thecosts of additional haul required to bring such savings about. In addition tocosts, the appropriate capacity associated with a processing facility at aparticular site (site-process combination) can be selected. The setting of
* "capacity can be based ot. either political or technical constraints. Setting a- capacity would thus prevent the model from shipping to a single site more
waste than would be technically or politically feasible.
Two types of markets are also shown in the diagram. RRPLAN treats the marketsfor energy (e.g., steam or electricity) and materials in a much more
*I comprehensive manner than WRAP. RRPLAN can handle four types of marketstructure: (1) unlimited fixed price markets; (2) capacitated fixed pricemarkets; (3) declining price markets with no upper limit; and (4) capacitateddeclining price markets. An example of an unlimited fixed price market mightbe an electric utility which will purchase any amount of electricity from the
M plant at a flat rate of 4¢ per kWh. An example of a capacitated decliningprice market might be a nearby industrial facility which will purchase processsteam for $3 per K (thousand) lbs for the first 900 M (million) lbs; but willpay only $2 per K lbs for the next 900 M lbs; and cannot productively use thesteam above 1800 M lbs. The market is considered saturated at 1800 M lbs.RRPLAN also permits revenue sharing arrangements among municipalities to beincorporated into the market analysis.
The model approaches the difficult problem of siting and sizing solid wasteprocessing facilities by first approximating nonlinearities in the capital andoperating cost functions with up to three linear segments. Each segment has
- an intercept (a fixed charge) and a slope (an incremental cost associated withincreased processing activities). The introduction of fixed charges imposescertain complications, due to the existence of local optima. Suchcircumstances require a specially designed optimization technique to generatemeaningful solutions. The technique used in RRPLAN involves a fixed-chargelinear programming algorithm with a forcing procedure meant to insure that themodel can pass over an area of temporarily increasing costs in the solution
* .domain (i.e., a local optimum) to find the true optimum (Walker [1976]).RRPLAN adds new forcing methods representing a significant improvement overmethods used in other models (Berman, Chapman, and Jung [1983]) in which eachsite (or site-process combiration) which was in the solution is forced out ofthe solution and vice-versa. This approach permits the solution domain to besearched in a more coordinated way by operating on all activities (e.g.,
*. transportation, processing, marketing) associated with a particular site (orsite-process combination). WRAP's methods of single or double column (i.e.,the activities described in table B2) forcing is of questionable efficiency,particularly where a site is linked to three or more sources or other sites.
Furthermore, column forcing operates from within the optimizer, so it is blindin the sense that there is no information within the optimizer on what thevarious columns (activities) represent.
9 55* a-- . . a, .*.
". . .. . . ..,i . . - *- -. -

Assuming that cost minimization is the sole objective of the decisionmaker,the problem to be solved by the optimizer may be states as
nminimize Z = j fj(xj) (Bi)
subject to the linear constraints
AX = b (i)
X 0
where
fj(x.) c x. + kjoj (iii)
with
6 0 if xj = 0
.. 1 if x. > 0.
The vector X contains n elements known as activities (e.g., shipments of MSWfrom source to a site). The tilde is used to distinguish the vector, X, fromthe elements x.. The matrix A contains m rows and n columns. (It is assumedthat n is greaier than m.) The rows refer to the equations defined in table Iand the columns to the activities defined in table 2. The c. in condition(iii) are variable costs and the k. are the fixed charges. CThe k. values arerequired to be greater than or equal to zero. If the activity has no fixedcharges, then k. is equal to zero. If the activity has no fixed charges, thenk. is equal to ero.)
RRPLAN AS A PLANNING TOOL: A CASE APPLICATION FOR CENTRAL MISSISSIPPI
After preliminary testing of the RRPLAN model with data from New York City'sDepartment of Sanitation and the California Solid Waste Management Board, themodel was applied to data from a three county area surrounding the city ofJackson in central Mississippi. The primary objective was to determine howRRPLAN could be used as the basis for developing the economic requirements fora vdriety of municipal solid waste options which might be exercised in theJackson area.
Data on costs, markets, amount of MSW, inflation rates, and sites in theJackson area were provided by the Bureau of Pollution Control of theMississippi Department of Natural Resources. In summary, approximately 360thousand tons per year (KTPY) of MSW were calculated to be generated in thearea. Stear' and/or electricity from a potential waste-to-energy facilitycould be marketed--steam to the packing industry and electricity to the localutility. Source separation was not to be implemented regionally; there waslittle or no market for recnvered materials except aluminium. Landfill could
O; be used if necessary (i.e., siting could be accomplished). Financing for a
K 56
.... .. ,,-,, ,. ..,:.. .., . .- ;., .

LII.
C>
C:-
oi <
uj 0
4-
cc) V. 54
LU -
ILL 00 0
cl) -)
LU LALU -JS.-
V,) <-C(,n
0 3:
o 0
S.-
La
0 4 oLAw L fI II
ui .
57

TARLE 3-I. EnUATIONS USED BY RRPLAN
Equation Type PurposeSource balance equations Requires all waste generated at each
source to be entered into transporta-tion.
Source paper balance equations Requires all source-seDarated paper tobe entered into transportatior.
Site input residue balance equations Generates a residue activity at a siteequal to the residue arriving at thesite.
Site input paper balance equations Generates a paper activity at a siteequal to the paper arriving at thesite.
Site input balance equations for Requires the total amount of MSW and
MSW and other commodities other commodities arriving at a siteto equal the amount of processingactivity at the site.
Site output balance equations Generates transpo*wtation activitiesof a commodity from a site equal tothe process output of the commodityat that site.
Market input balance equations Generates a total market activityequal to the amount of commodityarriving at the market.
Site capacity constraints Insures that processing at a site doesnot exceed capacity.
Land capacity constraints Insures that land uses does not exceedland available at any landfill.
Market bounds Requires the sum of activity at amarket in sements less than or equalto the jth (1<j<5) segment to he !esthan or equal tn the jth cuPRlativebound for the market.
Constroint on artificial Provides an upper bound fnr artificialprocesino activities activities used to preserve the
structure of the A matrix.
9, 58

'g 7-
TABI.F 8L-2. ACTIVITIFS CONS1DFRED rY RRPLAN
Activity Purpose
Transportation category 2 Site-to-site shipments.
Transportation cateqory 3 Site-to-market shipments.
Transportation cateqory 4 Source-to-site shipments of unseparateds dtSW.
Transportation category 5 Source-to-site shipments of unconditionalsource separated MSW (national paper
riarketa)•
Transportation category 6 Source-to-site shipments of unconditionalsource separated MSW (local paper m, 1arket).
Transportation category 8 Source-to-site shipments of pre-separatedpaper (local paper market).
Transportation category 9 Source-to-market shipments of prp-separatedpaper (local paper market).
Transportation cateqories 11-15 Source-to-site shipments of conditionalsource separated tISW (national papermarket) with I to 5 trigger prices.
Residue activities Measures thousands of tons per year ofsource-separated residue arriving at asite.
Paper activities Measures thousands of tons per year ofsource-separated paper arriving at a site.
Process activities Measures number of commodity unitsprocessed per year per linear segment at aSite.
Market activities Measures number of commodity unitspurchased per "ear oer linear segment at awiarket.
Artificial processing Take on arhitrarily small values to
preserve structure of the A matrix.
NZ Relipves infeasibilities associated with anadvanced starting point.
NZX Relieves infPasihilities when ev;luatina aprespeci fipd pla,.
aThe nature of the paper market depends on whether the quantities of paper
processed by the model will or will not affect the price. I tho price iC,
unaffected, then the market is desiqnated as national. ff the price isaffected, then the market is designiafed as local.
59

- . .°°- . ."** )*
waste-to-energy facility could probably be obtained at a 10 percent rate for a15 year term; the useful life of the facility was anticipated to be 20 years.
*.". The first task for RRPLAN was to estimate the cost of an all landfill-norecovery option given collection costs, disposal costs, land costs and laborand transportation costs in the Jackson area. This computation was meant toprovide a datum against which all other options could be compared. RRPLANcomputed the discounted cost of this option as $21.20 per ton for the 20-yearperiod beginning January 1, 1985 and ending December 21, 2004. This cost canbe interpreted to mean that it would take $21.20 of money at January 1, 1985value to collect, transport, and dispose of one ton of Jackson area MSW (i.e.,all MSW for 20 years could be disposed at this discounted costs.) Allsubsequent RRPLAN calculations were discounted on the same basis. Hence, inwhat follows, all costs are on the same basis (i.e., discounted to a presentvalue as of January 1, 1985). A cost difference between two options of $1 pcrton on this basis results in a $7.2 million cost difference for the total of20 years since 20 years times 360 KTPY is 7.2 million tons of MSW.
A waste-to-energy facility was then considered at a site in the city ofJackson. In the absence of such a plant, eight landfills in the tri-countyregion surrounding Jackson would continue to receive 360 KTYP of MSW at adiscounted cost of $21.20 per ton. Once the new facility was in place, RRPLANpredicted that about 300 KTPY of waste could be processed there. Severallandfills would cease operations; the remainder of the MSW would go to therest. RRPLAN never predicted that siting, construction and use of transferstations would be economically advantageous for the Jackson area. Note thatRRPLAN selects the optimum activity level for each site (i.e., waste tonnage)and the most economical transportation linkages to utilize these sites. Foran input of 300 KTPY, facility capacity needs to be about 1150 tons per day.
A sensitivity analysis was then performed to determine how variations in thecapital cost of the facility and anticipated revenues would affect thediscounted cost per ton. Two basic scenarios were analyzed. The first wasbased on steam sales to the packing industry. The second was based onelectricity sales to the local utility. For both scenarios, we assumed thatone tone of MSW would yield either 6 MBTU (million BTUs) of steam or 625 kwhof electricity for delivered use. These figures assume an incineratorefficiency of 67 percent for steam conversion and a turbine efficiency of35.6 percent. The results of the sensitivity analysis are summarized inTables B3 and B4. The steam and electricity revenues shown in these tablesshould be viewed as representing likely ranges for the facility rather thannegotiated contract values.
The data from Tables B3 and B4 were fitted using the ordinary least squaresroutine of the DATAPLOT statistical analysis package (Filliben [1982]). Inboth cases, the response variable was the discounted cost per ton. Theexplanatory variables were: (1) an intercept term constrained to a value of$21.20, representing the cost of the all landfill option; (2) the capital costof the facility in millions of dollars; and either (3) the revenue per MBTU ofsteam output; or (4) the revenue per kwh of electricity output. The estimatedvolues of these relationships are shown in Equations (B2) (steam) and (B3)(electricity):
60. * . -,

TABLE 13-3. DISCOUNTED COST PER TON OF MSW PROCESSED FOR AWASTE-TO-FNFRGY P1 ANT SUPPI YTNG 5TFAtI
REV.NUFat FACILITY COST IN Mi1 I TONS OF )OI.LARS.- REVENUES a 7 5 85 100
2.50 ?3.16 24.03 25.933.33 ?o.q3 ??.04 23.714.17 18.70 19.81 21.485.00 16.08 17.20 18.87
"Dollars per MBTU.
TABLE B-4. DISCOUNTED COST PER TON OF MSW PROCESSED FOR AWASTE-TO-ENERGY PLANT SUPPLYING ELECTRICITY
ELECTRCTY FACILITY COST IN MILLIONS OF DOLLARSLREVENUES 80 90 100 110 120
4 21.21 22.33 23.44 24.55 25.665 18.03 19.14 ?0.25 21.37 22.486 15.19 16.30 17.42 18.53 19.64
-Cents per kwh.
DCS 21.20 + 0.118.CAP - 2.775.REV5 (02)
(65.55) (-68.34)
and
DCE =1.20 + 0.129-CAP - 2.74 9 .PEV E (B3)(29.35) E (-31.42)
whcre
DC* = discounted cost per ton;CAP* = capital cost of the facility in millions of dollars;REV* = revenue per unit of output delivered; and
* S (steam) or E (electricity)
The values i, parenthesis beneath each coefficient arp the t-statistics
associated with the fit. The importance of the explanatory variables isreflected in the hiqh values of thp t-statistics. A cursory review of Equations(B?) and (R3) indicate that the coefficients have the proper signs and assume
* values which are of the same order. However, an important difference is that,othpr things hPinn equal, the discounted cost of the electricity supplyingfacility is somewhat more sensitive to changes in capital cost and less
rtse .iive to chanqes in revenues.
If ST* (A = S or C) is desionated as the savings per ton of MSW handled a''. compared to the all landfill option, then
61

-_7 W 7. 7
ST* 2 1].?0 - DC* (4)
The value for DC (Equation (,2)) or DC (Equation (B3) Fnay thpn ho inserted
into Equation (B). If ST* is positive, then the recovery optinn ic, r'oreecoremical then the all-landfill option. Conversely, if ST* is negative, thenthe recovery option is less economical than the all landfill option. . valupof ST* equal to zero defines the break-oven points, in terms of revenup perunit. of output, for each type of recovery facility are oiven hv enoraions (B5,(steam) and (36) (electricitv)-
REV S (0.0425).CAPS (B5)
and
REVE = (O.0469)'CAP (6)
Break-even points for five capital cost figures are summarized in Table B5.As may be seen in equations 5 and 6, the revenues required to break ever, aremore sensitive to changes in the capital cost of the electricity producingfacility.
TABLE 5-5. BRFAK-EVEN POINTS FOR SEIECTEP, CAPITAL O1TLAYS
TYPE OF FACILITY COST IN MILLIONS OF DOLLARSFACILITY 080 90 10 110 120
STEAM a h 3.40 3.83 4.25 - -
ELECTRICITYb 3.75 4.?? 4.69 5.16 5.63
-Dollars per MB1I1 in revenue required to break-even.bCents per kwh in revenue required to hreak-even.
Since the turbine represents a considevable additional first cost, the cost ofa faicility' to generate elect ri city is likelIy to be higher than that. of afacility to qeneratoe steam. Thus the value of DF - DC is of interest inevaluatinq the additional initial risk:
C - DCS = (O.I?1-CAP 0.]18.CAPM) - (?.74q.PFV - 9 .775.REV,.)
B7)
lqta i on 7 may now be used to (alculiatf, the afftordi b 1r, eytr,-, turbine c stc, for-* ay (iven value of DC DC which is deemed to w ho risk accertahle. In
ew ,r I , if a firm value ()f P V i , available, then the, r-venue per FHI3TH of-t arg to be equivalrrt is":
BE -- (F.(',.04 ..Ap F O.u14 .( P -* l..- ' ( ),~ - lI;') + ]Q I. I
S 6 '
. .- - . - - . . . . . -. -

If, on the other hand, a firm value of REV S is available, then the revenue petkwh of electricity to be equivalent is:
REVE (O.047CAPE O.043-CAP S) - 0.364.(DCE - DCs) + 1.009.REV S
(B9)
Thus, a complete risk analysis for any reasonable baseline scenario can beperformed in terms of the market prices for steam and electricity as well asfor the capital cost of the facility. It is important to point out, however,that all of these calculations assume that approximately 300 KTPY willactually be processed at the facility, and that all of the energy recoveredfrom the MSW processed can be sold. The effect of changes in the baselinetonnage processed (KTPYb) on the discounted cost per ton remains to beanalyzed.
In order to compute the relationship, and hence sensitivity of DC* to thebaseline tonnage processed, the following equation may be used:
DC* = a + b.(CAP*/KTPY) + c.RPT* + (RIO)
where RPT* = the revenue per ton of MSW i ; and= a (stochastic) disturbance term.
If a tipping fee is charged per ton of .SW input, then its value would beincorporated into RPT* alonq with any revenues from steam or electricitysales. The values of a, b and c in Equation (BIO) are functions of the RRPLAN
. input data (e.g., discount rate, terms of loin, useful life of the facility).
The analysis of the central Mississippi case study indicates that
DC* = 21.20 + 6*.(CAP*/KTPY) - 0.449.RPT* (B11)
where P* = 39.50 if * = E (electricity,, or34.37 if * = S (steam).
As in the previous cases, a, has been constrained to a value of $21.20, thediscounted cost per ton for all-landfill option.
Equations (BIO) and (B11) closely resemble the one suggested by Yakowitz[1981] for the approximate break-even cost for any resource recovery facility.The crucial difference is that Equation (BO), if based on results fromRRPLAN, represents fully discounted dollars over the lifetime of the facilitywhereas the relation given by Yakowitz represents current dollars for thefirst year of a publicly owned facility.
The relationship given in Equation (BIO) is a general economic expressiongoverning rpsource recovery or most other businesses where a product isproduced via the use of capital equipment and sold on a per unit basis. Forthe case of resource recovery, one wishes to minimize the values of a, b, andc. In effect, the fixed-charge linear programming algorithm of RRPLANimplicitly selects values for a, b and c, given the problem structure imposed
63

a, b-and c;(3) the input data (e.g., discount rate, inflation rate, useful
life of the capital stock, transportation network); and(4) the stochastic nature of a, b and c (e.g., as reflected by the
- . width of the confidence intervals about the predicted values).
If all variables in equation (B31) are subject to uncertainty, then the totaldifferential may be used to approximate the risk associated with the baselinevalues:
* .ADC* = a.(Aa/a) + b-(CAP*/KTPY).[Ab/b)+(ACAP*/GAP*)-(AKTPY/KTPY)] (B12)+ c-RPT-[(AC/c)+(ARPT/RPT)]
The first, second and fifth A ratio terms of equation (812) are associated
low with uncertainties in the estimates of a, b, and c. The other A ratio termsare associated with uncertainties in the input data. Note that uncertaintiesin the input data will affect the estimates of the parameters a, b, and c.These effects will be of a second order nature, however, and are modeledthrough the inclusion of the stochastic term in Equation (BIe).
Equation (B12) is a capsule summary of the economic and technical challengesfacing planners and decisionmakers in selecting the best resource recovery
* scenario. Through reference to this equation, local planners can assess theeffect of specific uncertainties on the economics of any resource recovery
* scenario. For example, if only KTPY can vary, then equation 12 becomes
ADC* = a- bb(CAP*/KTPY).(KTPY/KTPY) (B13)
where the minus sign in equation (B13) indicates that a decrease in tonnagewill result in an increase in the discounted cost per ton, DC*. For example,if the capital cost of the facility was $100 million and 300 KTPY were to beprocessed, then a decrease of 15 KTPY would result in an increase ofapproximately 50 cents per ton for a steam-producing facility of 60 cents perton for an electricity-producing facility.
A closer examination of equation (1312) is now in order. If a nominal revenueof $30 per ton is assumed along with a five percent range on each variable anda two percent range on each of the three parameters (based on the width oftheir 90 percent confidence intervals), then the increase in discounted costcould be as high as $3.00 per ton, or 15 percent of the estimated value of thediscounted cost per ton. Hence, for purposes of planning, the uncertainty canperhaps be approximated by a figure of 20 percent. Thus, if a combination ofcosts, tonnages and income can be obtained such that RRPLAN redicts areduction in DC of $3 to $4 with respect to the all landfill option (which isalso subject to similar uncertainty calculations), then the risk associatedwith investing in the resource recovery facility is probably worth seriousconsiderdtion. Althou h equation (B12) provides valuable information on how
9 64
, . f$0prtni asue alon witha fie pecen rang on eahvaibl n

47k
costs may vary due to uncertainty, it does not yield an explicit measure ofrisk. In order to remedy this deficiency, a series of Monte Carlo experimentswas performed. The three explanatory variables (CAP*, RPT* and KTPY) inequation (B11) were the focus of the experiment. Based on previous work onprobablistic cost estimation (Vergara [1977]), the capital cost of thefacility, CAP*, was assumed to be lognormally distributed with a mean of $85million and a standard deviation of $7 million for the facility serving thesteam market an a mean of $105 million and a standard deviation of $10 millionfor the facility serving the local utility. The lognormal distribution isparticularly attractive for large construction projects because it isasymmetric. Consequently, the lognormal distribution explicitly allows forlow-probability high-cost events. Since the revenue per ton, RPT*, is
" . dependent on the outcome of contract negotiations, we assumed that the revenueper unit (i.e., per MBTU or kwh) was uniformly distributed. For a uniformdistribution, each value within the range is equally likely. The rangeconsidered was $2.50 to $6.00 per MBTU for steam and 4t to 6¢ per kwh forelectricity.
The treatment of random variations about the volume of waste processed is morecomplicated since the rate of waste generation may increase. Two scenarioswere thus hypothesized. In the first, the amount of MSW processed was assumedto be normally distributed with a mean of 300 KTPY and a standard deviation of30 KTPY; this case corresponds to a "No Growth Scenario." In the second, theamount of MSW processed was assumed to be lognormally distributed with a meanof 300 KTPY and a standard deviation of 40 KTPY, this corresponding to a"Growth Scenario." A lognormal distribution was selected for the growthscenario because it shifts the bulk of the probability distribution towardshigher rates of processing (e.g., more waste is generated, so more is availablefor processing). The standard deviation was increased from 30 to 40 KTPY tohighlight the uncertainty associated with such growth projections.
The Monte Carlo experiments were carried out through application of the NBSDATAPLOT statistical analysis package. As a first step, a vector of randomnumbers from the standard forms for each of the three probability distributionswere generated. Vectors of length 100, 200, and 500 were tried to assess theimpact of sample size on the results. A qualitative analysis of the experi-ments indicated that the results were relatively insensitive to sample size.The random numbers were then used to generate a vector of random values forCAP*, KTPY and RPT* based on the ranges and parameter values given earlier.These values were then inserted into equation (B11). The resultant estimatesof discounted cost per ton were then sorted from smallest to largest. Theranked estimates (i.e., order statistics) were then used to construct afrequency based probability distribution.
* For a given value of discounted cost per ton, dc, such a distribution showsthe probability that the "true" cost will fall below dc. If dc is taken to bethe cost of the all-landfill option, then the experiment shows the probabilitythat the cost of the waste-to-energy facility will fall below the all-landfilloption. A similar statement can be made for a selected risk margin (say $3,or a value of dc equal to $18.20). The results of the Monte Carlo experimentbased on a sample size of 500, are summarized in Figures B2 and B3. Figure B2presents the results of the no-growth scenario experiment; figure B3 summarizes
65

o0) (1) N~ 0
I I I I q :D
LI)C-) 0
0 _
1* Liel -i (2f 4-
LJ L)0 c
LON 0 ~CLJ
NV
10
Zu)UU
(.) D)
OZ 0co00 0
4.L
4~c . 4 4. 4
4- 4 lleVM d 3A.i -.n n-.
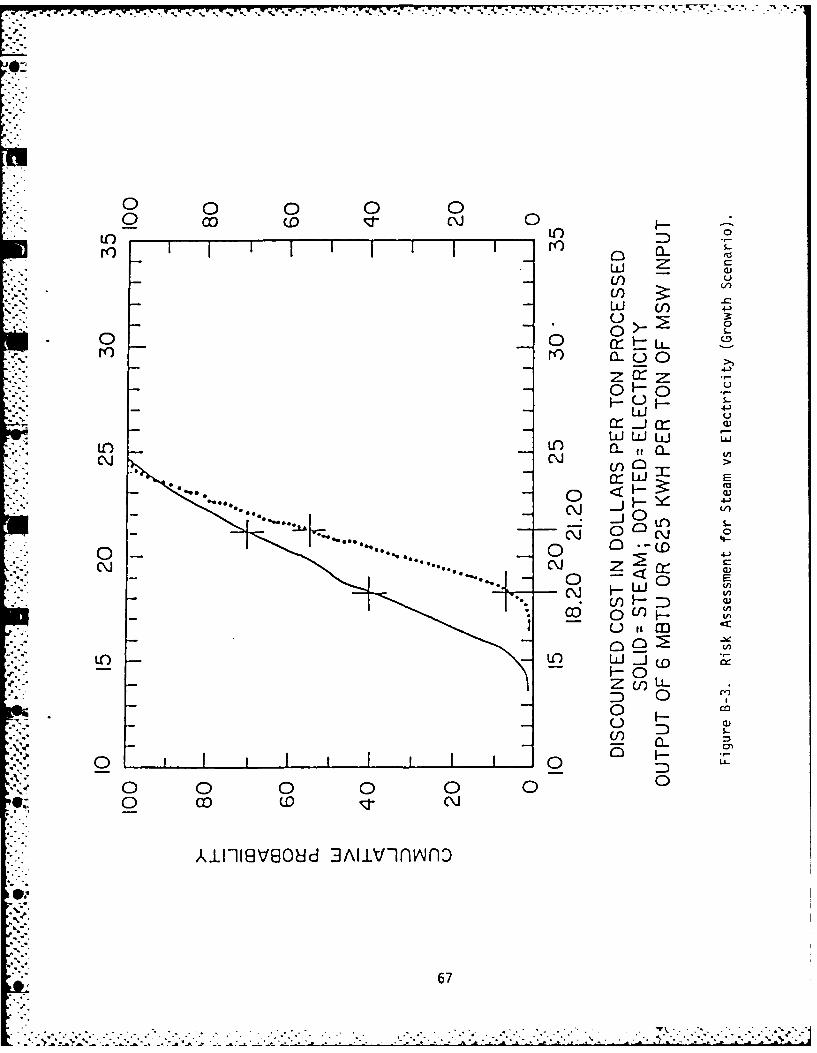
o 0D 00o CL 0 -
rOO V)..U)
N Lii 4/0
S.-
CC-
4-)
0LLj OOJLl Q
oto W j 0
0~~ 0 -0 H
0 0)
-
U-) LA J -AX0
0 0/ 0LL0 00 0 09(.0 M
A.LI18VS~ JAIV~flA~f0Or0
67)U S-W
*. . . . . . .. . . . . . . . . . . . . . .

- -. . . .-
the growth scenario experiment. The horizontal axis of each figure recordsthe discounted cost per ton, whereas the vertical axis records the probabilitythat discounted cost falls below the estimate.
An examination of figure B2 reveals several important points. First, thediscounted cost per ton for the facility producing steam is always less thanthe discounted cost for the facility producing electricity. The major reasonsfor this difference are the magnitude of the capital outlay ($105 million vs$85 million on the average) and the size of the P coefficient in equation 11(i.e., aE > a ). Second, if the discounted costs for each facility arecompared to those of the all-landfill option, the facility generating steamhas a probability slightly in excess of 0.7 that the incurred costs will fallbelow the $21.20 figure. The facility generating electricity, on the otherhand, has a corresponding probability of approximately 0.6 (i.e, investment inthe electricity generating facility is about 15 percent more risky thaninvesting in the steam generating facility). Third, the $3 margin (i.e., adiscounted cost of $18.20) can be achieved with a probability of slightly over0.4 if the facility which generates steam is selected. If the facility whichgenerates electricity is chosen, however, the probability is reduced to avalue of approximately 0.15. These figures imply that investment in a streamgenerating facility could be expected to better the $3 margin 40 percent ofthe time, whereas investment in the electricity generating facility could beexpected to better the $3 margin only 15 percent of the time. Finally, highlyunprofitable events can occur with both types of facilities. For example, theprobability of exceeding a discounted costs of $22.00 per ton is 0.2 for thesteam generating facility and 0.3 for the electricity-generating facility.
When the rate of generation of the waste stream is allowed to grow, a slightlydifferent picture emerges. Figure B3 shows that the probabilities that thefacilities will incur costs below the $21.20 figure are virtually unchanged at0.7 for steam and 0.6 for electricity. This result may be explained in partby noting that a switch from the normal to the lognormal distribution was madefor the volume of MSW produced. The ratio of two lognormal (CAP/KTPY)distributions can be converted to a normal distribution through a non-lineartransformation of vdriables. The variance resulting from the transformationis the sum of the variances of the two distributions. The symmetry of thenormal distribution and a slightly tighter variance (hence standard deviation)therefore tends to reduce the maximum and increase the minimum values of DC.The changes are not in the same proportion, however. Since KTPY entersequation 11 in the denominator, equal increased above 300 KTPY will result insmaller changes in DC than will equal decreases below 300 KTPY. Bothprobability distributions are therefore steeper than their no-growthcounterparts. With regard to the $3 margin, the steam-generating facilitystill has a probability of 0.4 of incurring costs less than $18.20, whereasthe electricity generating facility has fallen to a probability under 0.05.
The data shown in the two figures thus provide a strong argument in favor ofthe facility supplying steam to the local packing industry. The decision ofwhether or not to proceed with a resource recovery facility should alsoinclude a similar analysis of the costs uf landfilling. Such an analysis,based on a coordinated set of RRPLAN runs, would establish the likely lowerand upper limits on the discounted cost for the all-lardfill option. These
68
costs could then be compared with those presented in figures B2 and B3 todetermine if the steam-producing facility is still competitive.
CONCLUDING REMARKS
The role of RRPLAN in assessing resource recovery options can be summarized asfollows:
(1) RRPLAN identifies a minimum cost plan by comparing the variousDC* values for each option.
(2) In every case, the optimizer minimizes individual DC* values asa function of the specific input data offered by the user.
(3) RRPLAN does not compute unique values for the variables a, b,and c in Equation (B1O).
(4) By varying the input data to RRPLAN, specific estimates for a,b, and c, as well as preliminary estimates for the uncertaintiesin these variables can be obtained. RRPLAN probably providesthe best available means to predict a, b, and c accurately.
(5) Equation (BI2) represents the "risk evaluator" for a specificset of data and the uncertainties in these data.
(6) A planning basis for a waste management strategy is incompleteuntil all terms in equations (BO) and (B12) are evaluatednumerically for various options.
Thus, RRPLAN, if used properly, provides the foundation for planning.But considerable additional assessment may well be necessary in order tochoose the proper strategy for a given region. This assessment involvesprobabilistic estimation for the input variables (discount rate, costs,etc.), followed by multiple RRPLAN evaluations. The results will providevalues for all terms in equations 10 and 12. Unless all of these stepsare taken, RRPLAN results need to be treated with extreme caution. Thelack of a coordinated approach or reliance on outmodel or inaccurate datasignificantly increases the risks of adopting a resource recovery plan.The U.S. has had several cases where resource recovery options have not
. lived up to proponents' expectations. RRPLAN and the approach outlinedin this paper provides an opportunity to avoid some of these pitfalls.
RRPLAN, as developed for and by the National Bureau of Standards' Office ofRecycled Materials, represents an appropriate means to begin evaluation ofspecific resource recovery options for a city, state, or region. The inputdata requirements will tend to require the prospective RRPLAN client todetermine each item of data as accurately as possible. Careful dataassessment, intelligent use of RRPLAN and solutions to Equations (B10) and(B12) should help to reduce the risk associated with resource recovery. Inturn, the data gathering process and the sbsequent RRPLAN and probablisticanalysis should clearly highlight potential or actual institutional problems.
69
L*.* - ' .

ACKNOWLFDGEMENTS
* The authors wish to express their appreciation to Jack McMillan, Director,Division of Solid Waste Management, Buredu of Pollution Control of the Stateof Mississippi for providing data upon which the case study was based and forcritiquing our results. Dr. Grace Yan and Stefan Leigh, National Bureau ofStandards, also provided many useful comments on how to apply DATAPLOT to theproblem of risk assessment. Special thanks goes to Ed Berman, Edward B.Berman, Associates, Inc., for his pioneering role in the development of theRRPLAN model.
REFERENCES
Berman, E. B., Use of RAMP (Recovery and Market Planning) for the Evaluationof Policy Issues in Resource Recovery, mimeo, 1976.
Berman, E. B., WRAP - A Model for Regional Solid Waste Planning: User'sGuide, U.S. Environmental Protection Agency, SW-574, 1977.
Berman, E. B., Chapman, R. E., and Hung, H. K., Program Documentation for theResource Recovery Planning Model, National Bureau of Standards, NBSIR 83-2745,1983.
Chapman, R. E. and Berman, E. B., The Resource Recovery Planning Model: A NewTool for Solid Waste Management, National Bureau of Standards, SpecialPublications 657, 1983.
Filliben, J. J., "DATAPLOT--An Interactive High-Level Language for Graphics,Non-Linear Fitting, Data Analysis, and Mathematics," Proceedings of the ThirdAnnual Conference of the National Computer Graphics Association, 1982.Hensey, V., WRAP - A Model for Regional Solid Waste Planning: Programmer's
Manual, U.S. Environmental Protection Agency, SE-573, 1977.
Jenkins, L.. "Parametric Mixed Integer Programming: An Application to SolidWaste Management," Management Science, Vol. 28 (1982), pp. 1270-1284.
Liebman, J. C., "Models in Solid Waste Management," in S. sass and R. Sisson,A Guide to Models in Governmental Planning and Operations (Potomac, Maryland:Sauger Books, 1975), pp. 137-16'4.
Vergara, A. J., Probabilistic Estimation and Applications of Portfolio Theoryin Construction, unpublished Ph.D. thesis, University of Illinois, 1977.
Walker, W. E., "A Heuristic Adjacent Extreme Point Algorithm for the FixedCharge Problem," Manaqement Science, vol. 22 (1976), pp. 587-596.
Yakowitz, H., "Recent Federal Actions Which Will Affect Prices and Demands forDiscarded Fibers", in Technical Activities 198] Office of Recycled Materials,National Bureau of .Ja-nd-ards, NBSIR 81-2417, 191, pp. 119-142.
9 ~70
.- . *,., . , .. , , a . - . . . -- . - - - - . - , - - . - .

APPENDIX C. A SIMPLE DEGREE OF HAZARD SYSTEMFOR HAZARDOUS WASTES
H. Yakowitz
National Measurement LaboratoryNational Bureau of Standards
Washington, DC 20234
The purpose of this brief exposition is to suggest a methodfor classifying waste treatment, storage and disposal facilitieswith respect to potential hazard posed by the existence of thefacility. Existing, proposed and inactive or abandoned facilitiescan be classified by the method to be described; final disposal maybe by thermal destruction or burial.
HAZARD-CONCENTRATION RELATIONSHIPS
The dose experienced by some population or ecosystem as aresult of hazardous waste operations or storage--via any path ofescape from a facility--needs to be related to observed instancesof harm or the possibility of harm at some undefined future date.In all of the following discussions, assume that the exposure ordose occurs as a result of a hazardous waste facility. Further,assume that the exposure can be measured accurately and that thesampling procedure is statistically valid; these are admittedlylarge assumptions.
Toxicity testing for incidence of adverse effects in animalsand humans as related to exposure or dosage usually results in asigmoidal or S-shaped dose-hazard curve (see fig. 1). Here zerodose means zero hazard. But, the probability of harm to theexposed population as a function of very low dose or levels ofexposure is extremely difficult to measure or to predict theo-retically as indicated in Figure C1. Note that "hazard" suggests athreat posed by chance or something largely beyond one's controlwhile "risk" may imply voluntary exposure to harm or loss.
Consider models for extrapolating from measurable exposuredata to the hazard at lower exposures. In one experiment, some24,000 female mice were subjected to a known bladder and liver
carcinogen in order to study dose responses down to a one-percenttumor incidence, i.e., the concentration of the carcinogen whichwould cause one mouse in 100 to develop liver or bladder tumors'.Results of these tests were not especially enlightening. Forexample, a linear extrapolation and a Weibull model were applied tothe data.
For a one-in-a-million risk (P = 10-6) of liver cancer in themice, an 0.045 part-per-billion dose of the carcinogen was predictedby the linear model; the Weibull model predicted a 4.5 part-per-billion dose for P 10-6 or an exposure of 100 times greater forthe same risk'.
71

The EPA Carcinogen Assessment Group has stated that:
"There is no really solid scientific basis for anymathematical extrapolation model which relates carcinogenexposure to cancer risks at the extremely low level of con-centration that must be dealt with in evaluating theenvironmental hazard."
With respect to the prediction of "time-to-tumor" data, thereis no agreement between available models. Results are different,and reliable prediction appears impossible at present'.
As stated by the Congressional Office of Technology Assess-ment:
"The accuracy of the relation between exposure and incidence(of adverse effects) is always limited. Practical restraintson the number of animals that can be tested means that the
- data are always subject to significant experimental error; italso means that only relatively high incidences, almost always
* greater than 10%, can be measured in the experiments. Thereis also no agreement about which mathematical models bestextrapolate from the exposure levels measured in studies tothose encountered in the environment. Linear models, whichassume that incidence is proportional to exposure at lowexposure levels, are used by Federal agencies."'
Note that use of a linear model as compared to other possibleextrapolation models, e.g., log-normal, log-logistic, Weibull,predict a higher probability for harm at lower exposure levels. Asa practical matter, there is often no alternative to the linearmodel, since there are essentially no empirical data to supportother extrapolation schemes.
Some of the technical difficulties will be apparent from anexamination of Table C1 in which two objective and competent groups
S.-' of scientists attempted to define cancer hazard from drinking-overan entire lifetime-water containing one part-per-billion (onemicrogram per liter) of known carcinogens. The table purports toindicate the number of persons per million exposed who are likelyto fall victim to cancer from drinking this water. Note that inseveral cases, a tenfold to hundredfold difference exists betweenthe two estimates. Data taken from Table C1 are shown plotted inFigures C2 and C3 assuming a linear relationship between concentra-tion and cancer risk, in excess of that which would obtain if C
* were zero, i.e.,
P mx C where (Cl)"1-"R x x"- P is the proportion of the exposed population who are likely to
."ffer the adverse effect, m is the slope of the linear relation-O ship obtained by dividing the value tabulated (Table Cl) by C of 1
PPB, and C is the concentration of the constitutent, x, whicA isp,'esumed to pose the hazard.
72

DETERMINING THE EXPOSED POPULATION
Determining the exposed population, i.e., the group subjectedto higher than baseline concentrations of the substances from asite, is no simple challenge. In principle, the various paths bywhich substances might reach the group can be identified. Monitor-ing, which relies on qualitative and quantitative determinations atvarious points away from the site, can be implemented. Thus,what--if anything--is escaping and how much will be known as afunction of distance from the site. When thp slope of the concen-tration against distance curve changes upward, the boundary for aparticular path can be located. Wind, other climatic factors, andwater flow patterns may well alter the results over a period oftime. Airborne or rain-based factors may enter. Concentrations ofsubstances produced by other means than the waste disposal site mayintervene, e.g., from the plants generating the waste or othersources. Thus, attempting unambiguous identification of who isexposed to higher concentrations of potentially harmful substancesfrom a waste disposal site is likely to be exceedingly difficult,time-consuming, expensive, and inaccurate.
ESTIMATION OF HAZARD
But, even if the exposed population, N, could be accuratelydetermined and the hazard of cancer or other disease were knownaccurately, prediction of adverse events due to hazardous wasterequires a probabilistic estimation scheme. Since the hazards tendto be fairly small in a probabilistic sense, the Poisson distribu-tion function may represent an appropriate model.
Consider a fixed unit of time, T, in which certain events mayoccur. Assume that the events occur independently and that forperiods of time, At, which are very short in comparison to T, theprobability of one event is proportional to the length of time At,i.e., is equivalent to CAt/T, where "C" is constant during the timeperiod T. Assuming the probability of two or more events in timeAt is negligible and defining Ct/T as A:
k -F(k) - (C2)
k!
In other words, the probability that "k" events will occur beforetime "t" is given by the Poisson distribution.
If the time interval is taken to be a human being's lifetimeand if the "event" is taken to be the occurrence of an adverseeffect due to exposure to the hazardous waste constitutents, thenthe value of A for an exposed population of human beings, N, can beestimated. Assume some proportion, "p" of individuals in thepopulation, N, suffer an adverse effect due to exposure to thehazardous waste; the remaining proportion, (1-p), do not suffer theadverse effect. If the product Np is equal to or less than five,then the parameter "A" in equation (C2) can be taken as Np. Since
73
C~~ ~ . . . . .C. .. .- ." . .

the time interval is taken to be a lifetime, the value of A is themean number of occurrences of the event, i.e., adverse effect dueto exposure to hazardous waste, within the exposed population. Theprobability of occurrence of the event within the specified timeinterval will be very small compared with the total number ofoccurrences of such events, and the Poisson distribution thus mayrepresent an appropriate model for our purposes.
If 1000 persons were exposed to 1.1 PPM of chloroform in theirwater according to Figure C2, the hazard (or p) is 10-3 and A = Np
(1000)(10 '.) = 1.0. Note Equation (C2) indicates that theprobability that no one in the exposed population will be adverselyaffected, P is simply:
P = e (C3)
Furthermore, if the linear risk relationship of equation (Cl) isutilized to determine the proportion of individuals likely to beadversely affected due to the presence of constituent x at con-centration Cx, then
A= m NC (C4)X x
since A - NPR, i.e., A is related to population size. Hence, ifthe slope, m , the exposed population, N and the concentration Ccan be determined: x
Po = exp[-(mxNC x)] (C5)
The parameter P , the probability that no one in the exposed0
population is adversely affected, provides an appropriate figure ofmerit for ranking the potential hazard from a site. But un-certainties in determining the value of N and C for specificsituations and the more general problem of ascertaining values of"m" for potentially harmful substances suggest that large un-certainties in determining P^ are likely to occur. In any event,the uncertainty AP can be e timated as:
0
A P I P n P [ ( - x) ( = ) + ( k ) ]N )
( C 6 )
Equation (C6) assumes errors are independent. Furthermore, theapproximation to IAP I becomes worse as the values of (Am/m),(AN/N), (AC X/C ) bec~me large. Nevertheless, equation (6) can beused as an indicator to show that unacceptably large values of IAP0 iare likely to occur-
Members of the exposed population can point to the difficultiesin ascertaining m, N, and C as a means to exclude proposed facilities,or to demand immediate remedial action--which may or may not bewartanted--in the case of existing facilities. Finally, uncertaintiesin P could increase the chances for persons associated with theraci~ity to he held liable under state and/or Federal statutes.
74
1-./Z ... .......... _................. ..........

While the concept of utilizing P as an appropriate means toclassify possible risk from the facilty is appealing, practicalapplication of equation (C5) could be exceedingly difficult.
fTherefore, some means to deal in a practical sense with sitespecific characteristics in an appropriate fashion is needed. Inparticular, the issues of "How clean is clean?" for inactive sitesis well as reasonable performance measures for existing andproposed facilities need to be addressed. Furthermore, whatevermethod is selected must provide a means to account for costeffectiveness of proposed actions based on the results of applyingthe method. The remainder of this paper will propose a methodwhich:
o Utilizes P as the basic measure of hazard.0
o Takes into account site specific characteristics.
o Is amenable to fairly rigorous uncertainty analysis.
0 Provides guidance as to the monitoring and analyticalregime required for a specific facility.
o. Avoids the problems associated with determining the"exact" population exposed, N and with determining theslope of the hazard relation, mx.
o Utilizes--in most instances--critically evaluated data asinputs.
THE EXTENDED PRELIMINARY POLLUTANT LIMIT VALUE METHOD
The Preliminary Pollutant Limit Value (PPLV) method for humanhealth effects was developed by Rosenblatt and co-workers at theU.S. Army Medical Bioengineering Research and DevelopmentLaboratory. These authors have published a series of articles andreports detailing the basis of the method as well as variouspractical applications 2 -. In addition, basic chemical datarequired for input to the model have been critically evaluated andpublished8 . Therefore, only a brief summary of the basic PPLVmethod will be presented here:
"Initially, each pathway for transfer of a pollutant from theenvironment to man is treated as if it involved either (a) oneenvironmental compartment, or (b) a series of successivecompartments containing the pollutant at equilibrium. Transferfrom the final compartment to humans is considered a non-equilibrium process occurring at an assumed rate. A PPLV isthat concentration of the pollutant in the first compartmentthat is calculated to result in reception by the target human
-.- being of exactly the acceptable daily dose, D via one ormore pathways. The basic concept may be modified as thesituation requires.
''7
.. '.-/o
-9'i
°. ,

-..-.07
Figures 4 and 5 indicate the basic processes and assumptions inschematic form. Table C2 presents some results from Reference 2
- giving some PPLV values for se en compounds in soil. Rosenblatthas indicated that PPLV's are not standards or criteria but theyare values which can be used to choose alternative courses of
* action for:
o Developing renovation options for contaminated areas.
o Suggesting limits on land utilization near facilities.
o Specifying monitoring conduct.
o Establishing analytical sensitivity requirements.
* The basic premise is that once a PPLV is found for a specificarea in which the treatment-storage-disposal facility is presumablycontained, if the concentration of the constituents can be reducedto PPLV or are never allowed to exceed PPLV, then the interactionof humans with the area or its products is "safe" for any exposedpopulation, i.e., the acceptable daily dose of the pollutants willnot be exceeded. However, the questions of what occurs if PPLV isexceeded or if the cost of achieving PPLV is prohibitively largeremain to be dealt with.
If PPLV is achieved, the exposed population is presumed tohave some extremely small probability to suffer adverse effects.Note well that PPLV is site specific and only the population forwhich the particular PPLV has been computed is included in thisas:umption. If linearity between the proportion of affectedindividuals and PPLV is assumed, then
P R = (PPLV)mx (C7)
But since PPLV supposedly includes N, then, in this case,
P A (PPLV)mx (C8)
If PPLV is achieved, then the probability that an adverse effecte will occur is supposedly very small. If an assumption is made that
this probability is to be 10-4 , then m may be estimated as:
m = 10-4/PPLV (C9)x
if PR were taken as something other than 10-, cle&,'ly m wouldthen be different. Hence, under these assumptions, A at OPLV is10' and P0 which is exp(-A) is 0.9999. Thus, if PPLV is achievedthere is a 99.99% chance that no one in the exposed population willbe harmed. If PPIV is exceeded we assume that A increases linearlywith (concenttration ot constituent x, i.e.
I q 4- C /PPiV (CIOa)
• /6

and
P0 exp[-(10-4 CX/PPLV)I. (ClOb)
The assumption that A increases linearly with C seems likely toprovide a reasonable rate of increase for A in Oiew of the previousdiscussion pertaining to extrapolation models. The concept ofacceptable daily dose, DT, is related to lifetime hazard in thePPLV formulation so that Equation (C10) is consistent with ourprevious assumptions regarding the applicability of the Poissonprocess as well as with the PPLV basis. Nevertheless, the assump-tion of independence of N remains to be investigated in moredetail. Figure C6 shows P vs. the ratio (C /PPLV). Clearly,Figure 6 indicates that C °can exceed PPLV b a considerable amountbefore P falls to 0.95. gut the uncertainty in P due to uncer-tainties in the computation of PPLV and the measurement of C stillneeds to be considered:
AP0 1, 4CX) ACx 2 + (PPLV) 2 (C)
P 0 PPLV ) [PP LV ]
If a term, E, is defined as:
E=IxI + (PPLV) 2EPPLV /j , then (C12)
E (C13)
As with Equation (C6), the errors are assumed independent and theapproximations for AP /P and AA/ become worse as APPLV/PPLVand/or AC /C increasd. °If some estimates for "E" can be made,then cumufatfve probability as a function of E can be estimated aswell. With regard to the term (AC /C ), the National Bureau ofStandards (NBS) evaluated analyticAl 6ata obtained in the vicinityof the Love Canal in Niagara Falls, New York9 . In addition, NBShas investigated several aspects of the challenges to the analyticalchemist posed by low levels of constituents in variable matrices i0 .Based upon these results, a reasonable range for the uncertaintiesin determining the concentration of constituent X is O<AC /C <5,with a most probable value being about 0.5 to 1.
So far as uncertainties in PPIV are concerned, Rosenblatt andco-workers have discussed sources of error in some detail but havenot carried out a formal quantitative analysis. Three majorsources of uncertainty are:
5O 77

" The assumption of equilibrium between environmentalcompartments.
0 The statistical extrapolations yielding "safe" doses ofvarious constituents.
o Uncertainties in data with respect to likely fate ofvarious constituents in various environments. Forexample, the following summarization indicates somerelations of physicochemical properties to environmentalbehavior:
Physical Chemical Data Related To:
1. Solubility in Water Leaching, degree of adsorption,
mobility in environment.
2. Latent Heat of Solution Adsorption, leaching, vaporizationfrom surfaces.
3. Partition Coefficient Bioaccumulation potential, adsorption
by organic matter.
4. Hydrolysis Persistence in environment and biota.
5. Ionization Route and mechanism of adsorption oruptake, persistence, interaction withother molecular species.
6. Vapor Pressure Atmospheric mobility, rate ofvaporization.
Reference 8 has considered both the availability and validity ofcurrent data in these areas. In addition, NBS has sponsoredcritical data reviews and original research aimed at improvingthese data'0 13 as have many other institutions. Given theseuncertainties, a range for A(PPLV)/PPLV of O<A(PPLV)/PPLV<15 withthe most probable value being about 5 or 6 seems to be reasonable.
"*'. Nevertheless, more formal analysis is warranted to provide a betterestimate.
From these considerations an approximate cumulative probabilitycurve for the term E - A/A could be constructed. This curve isshown as Figure C7; the curve indicates that there is a 95%cumulative probability that the term "E" does not exceed eleven.Given this result, the 95% upper bound for P can be calculated.Figure C8 shows this result as well as a repeat of Figure C6.These results indicate fairly clearly that if the ratio C /PPLVPxceeds 100, then significant uncertainty in determining ^ may
occur. Nevertheless, the 95% probability curve for the upper boundof P is available as a guide for personnel responsible for actionat t~e site in question.
78
SUMMARY AND CONCLUSIONS
The Poisson statistical distribution is suggested as anappropriate approximation to the potential distribution of adverseeffects in a population exposed to substances, such as toxicwastes. The probability that no one in the exposed population willbe harmed is a reasonable ranking parameter to describe the hazardfrom a facility treating, storing and/or disposing of such wastes.However, this parameter may be subject to a number of uncertainties.
A method to estimate both the probability that no one in anexposed population will be adversely affected and the uncertaintyassociated with this estimate has been developed. The basis forthis method is the preliminary pollutant limiting value (PPLV)technique developed by Rosenblatt and co-workers at the U.S. ArmyMedical Bioengineering Research and Development Laboratory. ThePPLV method has been extended to consider the possible consequencesof exceeding the safe limiting concentration calculated as PPLV.Results indicate effects for exceeding PPLV by factors up to 100.If PPLV is exceeded by more than 100, the probability for adverseeffects in the exposed, population increases rapidly.
Nevertheless, the extended PPLV method can be applied toproposed, existing or inactive treatment, storage, and disposalfacilities including those that dispose by thermal treatment orburial. Application of the extended PPLV method can provide abasis for selecting economically and environmentally sound optionsregarding activities associated with the site. Inactive or aban-doned sites can also be ranked if necessary. Thus, the extendedPPLV method might provide a simple degree of hazard system.
79S .-. _ . - .. , , -. . . , . .. , . . . . ... . . _ .

REFERENCES
1. Congress of the United States, Office of TechnologyAssessment, Assessment of Technologies for Determining CancerRisks from the Environment, 240 pp., June, 1981.
- 2. Rosenblatt, D. H., Dacre, J. C.; and Cogley, D. R., AnEnvironmental Fate Model Leading to Preliminary PollutantLimit Values for Human Health Effects, U.S. Army MedicalResearch and Development Command Technical Report 8005, 47pp., April, 1980 (AD B0499172).
3. Dacre, J. C., Rosenblatt, 0. H., and Cogley, D. R., Environ-mental Science and Technology 14, 778-784 (1980).
4. Rosenblatt, D. H. and Small, M. J., Preliminary PollutantLimit Values for Alabama Army Ammunition Plant, U.S. Army
- Medical Research and Development Command Technical Report8105, 48 pp., August, 1981 (AD A104203).
5. Rosenblatt, D. H., Environmental Risk Assessment for FourMunitions-Related Contaminants at Savannah Army DepotActivity, U.S. Army Medical Research and Development CommandTechnical Report 8110, 14 pp., November, 1981 (AD A116650).
6. Rosenblatt, D. H. and Kainz, R. J., Options and Recommenda-tions for a Polybromobiphenyl Control Strategy at the GratiotCounty, Michigan Landfill, U.S. Army Medical Research andDevelopment Command Technical Report 8204, 36 pp., August,
1982.
7. Rosenblatt, D. H., Dacre, J. C., and Cogley, D. R., AnEnvironmental Fate Model Leading to Preliminary PollutantLimit Values for Human Health Effects, Chapter 15 inEnvironmental Risk Analysis for Chemicals, R. A. Conway, ed.,van Nostrand Reinhold, Co., New York, (1982), pp. 474-505.
8. Lyman, W. J., Reehl, W. F. and Rosenblatt, D. H., Handbook ofChemical Property Estimation Methods, McGraw-Hill, New York(1982).
9. NBS Review Panel (W. H. Kirchhoff, Chairman), Review ofMaterial Provided by EPA on the Analysis for Organic Chemicalsin the EPA Love Canal Monitoring Study, NBSIR 82-2511, 46 pp.,May, 1982.
10. Yakowitz, H. (ed.), Final Report--NBS Office of RecycledMaterials (1983)--in press.
11. Wasik, S. P., Tewari, Y. B., Miller, M. M., and Martire, D.• "-E., Octanol/Water Partition Coefficients and AqueousS Solubilities of Organic Compounds, NBSIR 81-2406, December,
1981, 56 pp.
80

12. Wasik, S. P., Tewari, Y. B., Miller, M. M., and Purnell, J.H., J. Res. NBS 87 (4) 311-315 (1982).
13. Mackay, D. and Shiu, W. Y., "A Critical Review of Henry's LawConstants for Chemicals of Environmental Interest," J. Phys.Chem. Ref. Data 10 (4) 1175-1199 (1981).
* 81
..
. . . .

E:-
L..
TABLE C-1. Concentration of Drinking Water Contaminantsand Calculated Excess Cancer Hazard of One-in-a-Million
NASa CAGb
ug/1 c ug/1c
Aciylonitrile ................................. . 0.47 0.034Arsenic ....................................... ND 0.004Benzene ....................................... ND 3.0Benzo(a)pyrene ................................ ND NDBeryllium ..................................... ND 0.02Bis(2-chloroethyl)ether ....................... 0.83 NDCarbon tetrachloride .......................... 9.09 0.086Chlordane ..................................... 0.056 0.012Chloroform .................................... 0.59 0.48DDT ........................................... 0.083 ND1,2-Dichloroethane ............................ 1.4 1.461,1-Dichloroethylene .......................... ND 0.28Dieldrin ...................................... 0.004 NDEthylenedibromide ............................. 0.11 0.0022ETU ........................................... 0 .46 NDHeptachlor .................................... 0.024 2.4Hexachlorobutadiene ........................... ND 1.4Hexachlorobenzene ............................. 0.034 NDN-nitrosodimethylamine ........................ ND 0.0052Kepone ........................................ 0.023 NDLindane . ..................................... 0.108 NDPCB ........................................... 0 .32 NDPCNB .......................................... 7.14 NOTCDD .......................................... ND 5.0 x 10⁻⁶Tetrachloroethylene ........................... 0.71 0.82Trichloroethylene ............................. 9.09 5.8Vinyl chloride ................................ 2.13 106.0
aStandardized to hazards from National Academy of Sciences Drinking
Water and Health for consumption of 1 1/water/day.
bRecalculated to exclude aquatic food intake from Cancer Assessment
Group, Ambient Water Quality Criteria. Standardized to 1 i/water/dayintake.
CAverage adult water consumption is 2 1/day.
dNot discussed.
SOURCE: Office of Technology Assessment.
L '- '.''....' '- .',. ". '.' ', ' ,', -".. ". ',' '," ..' .' -" : .'.'-. -. -..' .,',' .'-' ., .". ,." " • ",..-' .--.,- ,'1

I- V. -% 'w .. * b.7.. V% C. _ - . .
CV) (Ni cV) C:)C:) CD CD r-4
r - r-4
0 m(
F- e'nL
I I 0)CV') C) C) r-4 -
Ir-4 -3-. 5c Co
-o q x x-~ -
v-f C- C
U) 0
C0) C 4
- C II I CY) N CY) fuC -- C:) C> CD CD CD C) > 4-
5- - r-4 r-4I r-4 r-4I -4
r-4
r_
'aS- x xxx
LI) ''- LI) V (Ni kD n ~) cV) 00 - . . . ) u
C CIO C) N F- r4 1-I Ln U
CYa)
C*
'a) C) U) C C
7 u) 0 LA 0
C 00V CD v-4 CD CD4-))
0 wE "af NJF-~ )
C 0
0- C) 3)0 r-r
V)U
o a) 0 0
lp ~ ~ ~ C LA l C C L
C x- x) 0 0 -
a) S- CD0 m O ) 1 a)> LJ 5- -4-) o) C) >V 8- u 0) -m) 4-- LA 4- (D0 5 c . - -U"
I) C) Li 0 0.4 U a 10D.
oM 0 1 00a - 4- C 0
4- 0) IV) wjJ9 4-- CD 0 41-
(A 1 a_ .- (A- C
0~ 1- 0 m- u V-m) 0- (U >V CV L 0 4-C 'a .
0 4- E 4- E. - -ON0 ~ L4- 4-- (A (-D 0. 0 mD 8D 00-vI
I 0 x 4- 5- * 0 d) V .0uw4L)Li o) 0 LA m4-.) 0 m CL 0 w => -
c- 0 r 4- U 0 II. 0 0 -00L - cr s--- 0 Ii - 4
o.- 0U - ) U - x *-=0 - - I-- aU- )
0)3 4- Y)f 0 '1, M DI CL-C) U)) 0- 0 o 0 - 0 0)4 w ) C E
C- 0v 0) go 40 S.. a) M) m)0 -o *v- s S 3 0
:3 ) 0D v-M U) 0 - 0U U Ll- >- :U)0 0 CU c 4- C 0: C:
L)~~~~ LU 0 00. .4) 0 U 0.0 W) 4- 5) 5
C83 C 0 4 U 0 54) 5.~
90P5
80 TP4) X
70 70
CL
C.
a) 50
C40
0 P2E
C 30
W. 20
T10 ~ P1
0118 114 1/2 1 D 20 3 D
Dose of test Chemical
aExcess tumor incidence (percent) is defined 2s:
tumors in exposed population -tumors In controt populationX10
number of exposed population number of exposed populationa sigmoid dose-response curve: infratinear between 0 and P,
* linear extrapolation-- supralinear extrapolation
line projected to a threshold
N SOURCE: Office of Technology Assessment.
riiure C-i. A Stylized Dose-Response Curve and Some Extrapolated Curves.
* 84

zz
LLL.
.4 0L) Zj
.4 LJ
> i_ CM
2.4
23
2.2-2.1-
2X,0-3 EPA-1.9- CAG DATA
LI.J
< 1.7 CHLOROFORM
c,1.5
I.-5
O 1.2Luj1- 1.1
_j 10-31, 1 DICHLORO--J 1UETYLENE.
C-7-
6
5
3-
2 ACRYLO-4 NITRILE
10-' Br
0200 600 1000 1400 1800
CONCENTRATION (PPB)
Figure C-2. Calculated Excess Cancer Risk as a Function of* Concentration of Chemicals Shown in Drinking
Water. Assumes Linear Dose-Response Relationshipin Region Shown. (EPA Carcinogen AssessmentGroup Data.)
85

q:1
w L tJ _j
z L )z Ljt. L< zQZ U
00 -
2.52.4-2.3- A2.2- DATA
2.1- C HUORO -
2x13 FORM
1.8-
1.7-
C) 1.6-
1.4-1.3
1.2P9
LLI
7-
< ~6-o) LINDANE5- AND4- EDS
2sA0 4 CHLQRDANE-4 HEXACHLORO-
io~ ~ I HETACHLOR
0 200 400 600 B00 1000 1200 1400 1600 130C
CONCENTRATION (PPB)
Fiqjure C-3. Calculated Excess Cancer Risk as a Function ofConcentration of Chemicals Shown in OrinkinqWate r. Assumes Linear Dose-Response RelationshipL in Reqion Shown. (National Academy of Sciences Data.)
86

CT-
)4-A
cm )t a ,)
.L
04 - 0k

< .
C
cvo
o -
IL 0 L o
L) >
x o 0 '-
-o L) 4 c-J
- - 4--)
.; E a' .4-
0 S- --~-~
' 4- )
3:~r >1z c0a' aCL -
-~ --
'o .'j a' ur E a)
-- 0
U-
_ 0
C-1
0 C)L 0 0
0 a)
>< c
-J C
LO -- c
88

1 r
00
0Ca-
'V
00-
0. J
0
CL
U 04-2
0~0cp
0 0
<-- 00
4-3
C)) C) C-) L) CF m )M ca) C)(7) C cr) -)U-
0 0 . 0 .0 0 0 ) C 02
0U 0d (A 1 V 7 -GC
AD-Ri39 20] COMBUSTION TECHNOLOGY FOR INCINERRTING HSTES FROM IR 2/2,
FORCE INDUSTRIAL PROCESSESCU) NATIONAL BUREAU OFSTANDARDS WASHINGTON DC W M SHRUB ET AL. FEB 84UI
UNCLASSIFIED AFESC/ESL-TR-83-14 MIPR-N-8i46 F/G 13/2 N

L11
1.00 11112.0
BJJL.25 4 1.
MICROCOPY RESOLUTION TEST CHART
NAT'ONAL JFFLAJ OF SIANDARDS 19fi
OW"
.~. ~.p
hAu%..
'*--~.. %* * ***as,

'44
-.-
-4 -v-
0 N1 1
-j -u
LLL
4 C.)ILOJ
- LI- Z-U J
Z L) .0aJ Z 0 ~j
<cnZ 0 % 1-o-jL ) LL 4 04.
0cLL ) it -)0
cr l < U)=- T ()4-) 4)
0- X ~ - >-to mL - Xr E: Im>
> wU
< 0
U- aLa U . i)r '
-0 0 CD r o to IT4 C-;N
90

I,.-'
00
L0
104.-
'00
-J-
-4--
00 0%
04-
0 07J 0 n <)
00 co
>S.-
F- JOa-'- 0
< u
:D 0 L )C
-lni III ON iVIki-19e:
I 91

APPENDIX D.RECENT LEGISLATIVE INITIATIVES PERTAINING TO
INDUSTRIAL WASTES
(Report No. 98-198, Part 1]
-;: To amiend rte Solid ' aste Disposal Act to authorize appropriations for the fiscal%-cars 19S%4 through 1986, and for other purposes.
IN THE HOUSE OF REPRESENTATIVES
MAY 3, 1983
Mr. FLORIO (for himself, Mr. LENT, MS. MIKULSKI, Mr. ECKAsT, Mr. TAUZIN,
and Mr. RICHARDSON) introduced the following bill; which was referred tothe Committee on Energy and Commerce
MAY 17, 1983
Reported with an amendment, referred to the Committee on the Judiciary for a
period ending not later than June 15, 1983. for consideration of such provi-sions of the bill and amendments as fall wi6thin that comnmittee's jurisdictionpursuant to clause 1(m), rule X
ftft N[Strike out all after the enacting clause and insen the piart printed in italic].. (For text of introdued bill. see copy of bill as i:rrdjced ont May P,. IS3)
A BILLft To amend the Solid Waste Disposal Act to authorize appropri-
ations for the fiscal years 1984 through 1986, and for other
= - purposes.
I Be it enacted by the Senate and House of JReresenta-
2 tives of the United States of America in Congress assembled,
92

I "and S1.500,000 for each of the fical yvears 19,q4 through
2 1986"
3 (i) CRvIA L lN'ESTIG.4TORS.-Section 2007 is
4 amended by adding the following new subsection at the end
5 thereof:
6 "(e) CRIMINAL 1NVESTIGA TORS. -There is authorized
7 to be appropriated to the Administrator $3,246,000 for the
8 fiscal year 1984, $2,408,300 for the fiscal year 1985, and
9 $2,529,000 for the fiscal year 1986 to be used-
10 "(1) for additional officers or employees of the
11 Environmental Protection Agency authorized by the
12 Administrator to conduct criminal investigations (to in-
13 vestigate, or supervise the investigation of, any activity
14 for which a criminal penalty is provided) under this
15 Act; and
16 "(2) for support costs for such additional officers
17 or employees. ".
18 SMALL QUANTITY GENERATOR WASTE
19 SEC. 3. Section 3001 is amended by adding the follow.
20 ing at the end thereof:
21 "(d) SMALL QLA.NTITY GENERATOR WASTE.-(1)
22 Effective twenty.four months from the date of enactment of
23 the Hazardous Vaste Control and Enforcement Act of 1983,
214 hazrdous 'aste generated by any ygenerator yena'rating a
2.5 total qualitity of huzardous i..te yr(,ater than one hundred
- 93m"~ll i ll2,;7 II

066
1 kilograms but less than one thousand kilograms during a cal-
2 entdar inonth shall be subject to the same requirements under
3 this subtitle as ha:ardous waste produced by a generator in
4 amounts greater than one thousand kilograms during a calen-
5 dar month, until the standards referred to in paragraph (2) of
6 this subsection have become effective.
7 "(2) Not later than eighteen months after the date of
8 enactment of the Hazardous Waste Control and Enforcement
9 Act of 1983, the Administrator shall promulgate standards
10 under sections 3001, 3002, 3003, and 3004 for hazardous
11 waste generated by a generator generating a total quantity of
12 hazardous waste greater than one hundred kilograms but less
13 than one thousand kilograms during a calendar month.
14 Except as provided in paragraph (3), such standards, includ-
15 ing standards applicable to the legitimate use, reuse, recy.
16 cling, and reclamation of such wastes, may vary from the
17 standards applicable to larger quantity generators but must
18 be sufficient to protect human health and the environment.
19 "(3) Standards promulgated under paragraph (2) shall
20 at a mininum provide that-
21 "(A) onsite storage of hazardous waste generated
22 bY a .enert/or yrnera/ing a /otal quantity of hazardous
h23 uwi,/, trctr th,,ir one hundred kiloriams but less than
2 ".4 i' tI,' )l ,i/,buyrai. during a calendar month, may
94
• o..o(1
-". fit :,," .l

/ /.p'."
c1 occur for 1!1 to one hUndrcd (Ind ci/ht.l dU j.; without
2,r the r(quircI'It of (I pcrmit;
3 "(B) ill other tircaticfi, storage, or dipo.sul of
4 ha:ardous wastes generated by such generators shall
5 occur at a facility with a permit under this subtitle;
6 and
"7 "() any hazardous waste generated by such gen-
8 erators which is shipped off the premises on which such
9 waste is generated, shall be accompanied by a mani-
10 fest, except that the specific requirements for entries on
S11 such manifest may tary from those applicable to the
12 manifest required for larger quantity generators.
13 "(4) No later than ninety days after the enactment of
14 the Hazardous Waste Control and Enforcement Act of 1983,
15 eny hazardous waste which is part of a total quantity gener-
16 ated by a generator generating greater than twenty-five kilo.
17 grams but l tha t/n one thousand kilogrUms during one cal.18 endar month aid which is shipped off the premises on which
19 such waste is generated shall be accompanied by a copy of the
20 Envirnomental Protection Agency Uniform hazardous waste
21 manifest form signed by the generator. This form shall con.
.. 22 tain the following information:
23 "6A) the name and address of the genierator of the-- ' 24 waste;
,-'. 95
IIR 2'%67 11,,A.. .. , ,,. ... t ",c %
%" :
, v ' ' ' ' ' '"" "" # .... ''"" : " " " ".".''"' """ """ " ""'
- "(B) the United States Department of Transpor-
2 tation description of the waste, including the proper
3 shipping name, hazard class, and identification
4 number (UN 'NA), if applicable;
5 "(C) the number and type of containers;
a - 6 "(D) the quantity of waste being transported.
7 If subparagraph (B) is not applicable, in lieu of the descrip-
8 tion refer'ed to in such subparagraph (B), the form shall con-
|:2. 9 tain the Environmental Protection Agency identification
-a.J 10 number, or a generic description of the waste, or a description
11 of the waste by hazardous waste characteristic. Additional
12 requirements related to the manifest shall apply only if deter-
13 mined necessary by the Administrator to protect human
14 health and the environment.
15 "(5) Except as provided in paragraphs (1) through (4),
16 nothing in this subsection shall be construed to affect or
17 impair the validity of regulations of the Administrator pro-
18 mulgated prior to the date of enactment of the Solid Waste
19 Disposal Act Amendments of 1983 with respect to hazardous
-. 20 waste generated by generators of less than one thousand kilo-
21 grams per calendar month.
99 "(6) The Administrator may promulgate regulations
23 under this ,subtitle which establish special standards for, or
24 exempt from reguitions, hazardous Ciastes which are genir-
'.- 96
a.-.... HMt fill:o- -' .-. . . -. . . o° , - . . .

.9 . 9.- - . -.~.. . ... - . . . . . .
aI i M .;I.ldI ele{ri tor wiho do(s loPnt (c aiutl ll .( th,l ,l I,
n "~~2 h,,,,/rd /,lq m;of ha:ardolls 1,.,t, 1 ,,1.,I .,,,,b
9 "(7) .\ot/iny 1 I/is .su1 hs1c"tion .hall h- coliti-(d to
4 affect or impair the validity of reyulations promulgated by
5 the Secretary of Transportation pursuant to the Hazardous
6 Materials Transportation Act.
7 "(8) Notwithstanding the last sentence of section
8 3010(b), no regulation promulgated by the Administrator as
9 provided in this subsection may take effect before the date
10 twenty-four months after the date of the enactment of this
11 subsection. ".
12 INTERIM CONTROL OF HAZARDOUS WASTE INJECTION
13 SEC. 4. (a) NEW SECTION 7010.-Subtite G is14 ame~d-d by adding the following n1ew sectio (it th end
15 thereof:
16 "INTERIM CONTROL OF HAZARDOUS WASTE INJECTION
17 "SEC. 7010. (a) UNDERGROUND SOURCE OF DRINK-
I 1NG WVATER.-lNo hazardous waste may be disposed of by
19 underground injection-
20 "(1) into a formation which contains (within one-
21 quarter mile of the well used for .such undeiyround in-
22 j-ection) an u nderground source of drinking lwater: or
23 "(2) abote such a formation.
24 Th- prohibition established uindcr pmwa iyraph ( 1) J ll 'lot
_. aply if the i'(r1soi ,j(-Ctiny such hr(i /oil w st (-' bli.'hc,
97I " --

,, *,, 4-. S, . ~ * t * . *. . . a . .. ..
18
I to pretreatment and detorificat ion prior to land disposal, and
2 limitations on waste dilution. "
3 BURNING AND BLENDING FOR ENERGY RECOVERY
4 SEc. 6. (a) NOTICE.-(1) Section 3010 is amended by
5 inserting the following after the first sentence thereof: "Not
6 later than twelve months after the date of the enactment of
7 this sentence-
8 "(1) the owner or operator of any facility which
9 produces a fuel (A) from any hazardous waste identi-
10 fied or listed under section 3001, (B) from such haz-
11 ardous waste identified or listed under section 3001
12 and any other material, (C) from used oil, or (D) from
13 used oil and any other material;
14 "(2) the owner or operator of any facility which
15 burns for purposes of energy recovery any fuel pro-
16 duced as provided in paragraph (1) or any fuel which
17 otherwise contains used oil or any hazardous waste
18 identified or listed under section 3001; and
19 "(3) any person who distributes or markets any
20 fuel which is produced as provided in paragraph (1) or
21 any fuel which otherwi.e contains ulsed oil or any ha:-
22 ardous iraste identified or listed unde'r section .3001;
23 shall file wilt the .ld(iinistr, 101 (an;d tAc, State in the crsr of
24 (1 State with t n (I I ?thori:ed t1,1::rdo ,ls wi.ste, /)'oyrai) (I /titl-2"5 ficat loll st till! It I l i IIC 1W / ,IC'riptio o1" the
98
-..... . .,, . .

I facility, toy /thir w'ith a description of /I identificd or listed
"2 Iii:irdou. wust( invrolved and. in the ca.se of a facility re-
,. f,,',d to in pa ragraph (1) or (2), a dcscripton of the produc-
4 rion or cneryy recovery activity carlried out at the facility and
5 such other information as the Administrator deems neces-
6 sary. For purposes of the preceding sentence, the term 'haz-
7 ardous waste listed under section 3001' also includes any
8 commercial chemical product which is listed under section
9 3001 and which, in lieu of its original intended use, is (i)
10 produced for use as (or as a component of) a fuel, (ii) distrib-
S11 uted for use as a fuel, or (iii) burned as a fuel. Not more than
12 one notification shall be required under this subsection in the
13 case of a facility which burns for purposes of energy recovery
14 any fuel which is generated at the site of such facility unless
15 the burning practices to which such notice applies changes
16 following such notification. Notification shall not be required
S17 under this subsection in the case of facilities (such as resi-
18 deiitial boilers) where the Administrator determines that such
S 19 notification is not necessary in order for the Administrator to
20 obtain sufficient information respecting current practices of
21 facilities using hazardous waste for energy recovery. Nothing
'22 in this subsection shall be construed to affect or impair the
23 provisions of section 3001(bh)(3). Nothing in this subsection
24 shall affect regulatory determinations u nder section 3012 (as
25 amended hy the Used Oil Recycli,,y Act of 1980,). ".
fill 2s7 ll 99

Li
20J
1 (2) Section 3011) is amended by striking out "the pre-
2 ceding sentence'" and -sub-stitutilg "the preceding provisions.
.3 (b) STANDARDS.-(1) Section 3004 is amended by
4 adding the following at the end thereof:
5 "(g) HAZARDOUS IWASTE USED AS FUEL.-Not later
6 than two years after the date of the enactment of this subsec-
7 tion, and after notice and opportunity for pvblic hearing, the
8 Administrator shall promulgate regul ons establishing
9 such-
10 "(1) standards applicable to th, xners and oper-
11 ators of facilities which produce a fuel (A) from any
12 hazardous waste identified or listed under section
13 3001, or (B) from any hazardous waste identified or
14 listed under section 3001 and any other material;
15 "(2) standards applicable to the owners and oper-
16 ators of facilities which burn for purposes of energy re-
17 covery any fuel produced as provided in paragraph (1)
18 or any fuel which otherwise contains any hazardous
19 waste identified or listed under section 3001; and
20 "(3) standards applicable to any person who dis-
21 tributes or markets any fuel which is produced as pro-
22 ided in paragraph (1) o,- ag fuel which otherwise
.-..._.- contains (Iny ha:,idoius wu.,t identificd or ll.,ted under
24 Sw'i. 3001
1000% 2

21
1 t., mayq be nQe.sriVr/ to pro/uct hliit health unid (hl( elI'l
2ul i/u/li. Suc shCimNlard I/lita /1101/ an1 i yU of lt 'cquilie-
3 ,~ js .cffo~th n ](lagrunhs (1) ib 101191 (7) of .'+bsect'o
4 (a) (m may be appropri ate. The s/an'da ids under p)aragraph
5 (2) may consider differences in destruction efficiency, and
6 waste content of the fuel, and shall, where appropriate, not
7 include requirements beyond the notification referred to in
section 3010. Nothing in this subsection shall be construed to
9 affect or impair the provisions of section 3001a(h)(3). For
10 purposes of this subsection, the term 'hazardous waste listed
11 under section 3001' includes any commercial chemical prod-
1.2 uct which is listed Under section 3001 and which, in lieu of
13 its original intended use, is (A) produced for use as (or as a
14 component of) a fu~ 1, (B) distributud for use (is a fuel, or (C)
15 burned as a fuel.
16 "(h) L.4BELx.G.-N otwiths, talndinig any other prov'ision
17of law, it shall be unlawful for any person who is required to
18 file a notification in accordance wvith paragraph (1) or (3) of
19 section 3010 to distribute or market any fuel which is pro-
20 duced from any haz ardous waste identified or listed under
21 section 31001, or any fuel which otherwise contains any haz-
22(Ildous itaste identified or i'sted under section 3001 ifthe
23 Inroice or the b~ill of sale fals-
101

1 "(1) to bear the following statement: 'WAR.-
. I.VG: THIS FUEL CONVTAINS HAZARDOUS
:3 WASTES', and
4 "(2) to list the haZardous wastes contained there-
5 in.
6 Such statement shall be located in a conspicuous place on
7 every such invoice or bill of sale and shall appear in con-
*8 spicuous and legible type in contrast by typography, layouts,
9 or color with other printed matter on the invoice or bill of
10 sale.
11 "(i) EXEMPTION.-(1) Unless the Adminstrator deter-
12 mines, otherwise as may be necessary to protect human health
13 and the environment, the requirements of subsection (h) shall
14 not apply to fuels produced from petroleum refining waste
15 containing oil if-
16 "(A) such materials are generated and reinserted
17 onsite into the refining process;
18 "(B) contaminants are removed; and
19 "(C) such refining waste containing oil is con-
20 erted along with normal process streams into petro-
. 21 leum-derived fuel products
22 at ( facility at which crude oil is refined into petroleum prod-
S"2: ?rt, and l which is classified a.' a number SIC 29)11 facility24 lii der the Offi'e of Mall yelet a ld Budyet .t, dcI rd ln-
"" , .trial ('lu..i'ica tiol .lu a ii al.
'T 102

s W. W
23
I "(2) "or exemption of used oil ichich is r(cyclcd from
2 sta ndards ueter this section, ,ec ..ection 3012(c."
3 (2) Section 3003 is anended by adding the following
4 new subsection at the end thereof:
5 "(c) FUEL FROM HAZARDOUS 14STE.-_Vot later
6 than two years after the date of the enactment of this subsec-
7 tion and after opportunity for public hearing, the Adminis-
8 trator shall promulgate regulations establishing standards,
9 applicable to transporters of fuel produced (1) from any haz-
10 ardous waste identified or listed under section 3001, or (2)
11 from any hazardous waste identified or listed under section
12 3001 and any other material, as may be necessary to protect
" 13 human health and the environment. Such standards may in-
14 lude any of the requirements set forth in paragraphs (1)
15 through (4) of subsection (a) as may be appropriate."
16 INTERIM STATUS; PERMITS
17 SEC. 7. (a) EXPANSION DuRING INTERIM STATUS.-
18 Section 3005() is amended by inserting "(1)" after "IN-
19 TER1M STATUS.-", redesignating paragraphs (1) through
20 (3) as subparagraphs (A) through (C), and adding the follow-
21 ing at the end thereof:
22 "(2) Any owner or operator of a treatment, storage, or
23 disposal facility operating under interim status pursuant to
24 this subsection who expands tht capacity of the facility
2. (5rcejt the caIpacityI for storayP Or tr (wi,lt ill tl,,a's or con-
103
f.l...... . ......... .. . . . . . ..

* * *o*-. *W.*
41
9STH CONGRESS HO USE OF REPRESENTATIVES REPT. 9E-19Is( Session PartI
HAZARDOUS WASTE CONTROL AND ENFORCEMENT ACT OF1983
MAY 17. 1983-Ordered to be printed
Mr. DINGELL, from the Committee on Energy and Commerce,submitted the following
REPORT
together with
MINORITY VIEWS
[To accompany H.R. 2867)
[Including cost estimate of the Corgressional Budget Office]
The Committee on Energy and Commerce, to whom was referredthe bill (H.R. 2867) to amend the Solid Waste Disposal Act to au-thorize appropriations for the fiscal years 1984 through 1986, andfor other purposes, having considered the same, report favorablythereon with an amendment and recommend that the bill asamended do p ass..I
The amendment is as follows:.Strike out all after the enacting clause and insert in lieu thereof
the following:SHORT TITLE ANZD TALE OF CONTENTS
SECTION 1. (a) This Act may be cited as the "Hazardous Waste Control and En-forcement Act of 19839.
TABLE OF CONTENTSSec. 1. Short title and table of contents.Sec, 2. Authorization for fiscal years 1984 through 1986.Sec. 3. Small quantity generator waste.Sec 4. Interim control of hazardous waste injection.S ec. 5. Land disposal of hazardous waste.
SSec. 6. Burning and blendin for energy recovery.
.°Q9
Sc7Itermtaus p togeh
; ., ~ ~ ~ ~~ e 8.Resenrccling cost eclmatifth on. :eso ude fie
:_,r_. .~ ~ ~ ~~~~e 9.orize aorinactions.frtefsa er t hog 9 nIo Iohe pupss0aigcniee tesmrpr aoal
-'.- threo wih a amndmnt ad rcomendtha th bi10a

25
for the personnel, equipment and other resources to conduct crimi-nal investigations of any activity for which a criminal penalty isprovided under this Act. The Committee stror,;ly believes that thecriminal enforcement program should be one of the EPA's and theJustice Department's highest priorities and therefore intends thatadequate funding be available for that purpose. The Committee ex-pects that criminal investigators be permanently stationed in eachof EPA's regions and that the investigative program under this Actbe closely coordinated with the Department of Justice, the FederalBureau of Investigation, and other Federal law enforcement agen-cies as well as state and local law enforcement agencies.
%! Section 3. Small quantity generatorsThe purpose of this provision is to direct EPA to regulate under
Subtitle C hazardous waste from generators who generate a totalquantity of hazardous waste between 100 and 1,000 kilograms percalendar month (kg/mo). EPA is required to promulgate suchstandards within 18 months of enactment. However, if EPA fails tomeet the statutory deadline for promulgation, then on the date 24months after enactment, hazardous wastes generated by smallquantity generators become subject to all of the Subtitle C stand-ards applicable to hazardous waste generated by larger generators(i.e., generators of more than 1,000 kilograms of hazardous wasteper month). Should this occur, hazardous waste from small quanti-ty generators will remain subject to standards applicable to hazard-ous waste from larger generators until such time as special stand-ards for small quantity generators are promulgated and in effect.For purposes of this provision, EPA is authorized to waive the six-month effective.date requirement of Section 3010 and promulgateregulations which are either immediatel effective or effectiveafter some period of less than six months but in no event are theregulations to become effective before the date 24 months after en-actment. In addition, this section also contains a notice require-ment applicable to all off-site shipments of hazardous waste by gen-erators of more than 25, but less than 1,000, kilograms of hazard-ous waste per calendar month.
The Committee has included this provision to correct a currentregulatory exclusion from the Act that was not envisioned by theCongress. Under regulations promulgated on May 19, 1980 (40 CFR261.5). the Agency excluded from most RCRA requirements gener-ators who generate 1,000 kilograms/calendar month of hazardouswaste or less. As a consequence of this exclusion such generatorsare allowed to dispose of their waste into permitted licensed andregistererd sanitary landfills, or into sewer lines that are connected
-P to publicly owned treatment works-facilities that frequently arenot suited to manage or treat hazardous wastes. Such generators
~ .,. are also not required to manifest, transport, treat or maintain,'-'.:"proper records for the wastes they generate.The Committee believes that this exclusion is unwarranted and
allows substantial quantities of otherwise hazardous waste to bedisposed of in an environmentally unsound manner. The Agency
. - estimates that only one percent of total hazardous waste escapecoverage, yet, the Office of Technology Assessment has estimatedthat an amount up to 10 percent of the 40 million metric tons of
105
. ,'.:

I.--.
i 7..
26
hazardous waste that are currently regulated under the Ac: maybe escaping proper controls through this exclusion. Furthermore,in its May 19, 19S0 regulations the Agency committed to lov.eringthe level of this exclusion from 1,000 kg/mo bone metric ton; to 100kg/mo (1/,o of one metric ton). By enacting this provision, the Com-mittee is ensuring implementation of the Agency's previous com-mitment to lower the present small quantity generators exclusionten fold within 18 months so that the same universe of hazardouswastes is regulated for both large and small generators.
The Committee recognizes that the hazard of a given waste is im-parted by its intrinsic toxicity and other inherent properties suchas ignitability, corrosivity and reactivity, and is not a function ofthe specific volume in which the waste is produced by a given gen-erator. The Committee also recognizes that the handling, transport,and disposal of hazardous wastes are important factors in control-ling the magnitude and extent of the health and environmentalhazards posed by such wastes. Given those considerations, it is theCommittee's intention that the wastes produced by this class ofnewly covered generators (those who produce more than 100 kg/mo
"." but less than 1000 kg/mo) will be manifested, transported, stored,treated, and disposed on in a manner consistent with the currentrequirements for generators of greater than 1000 kg/mo, while atthe same time limiting the administrative burden. EPA is there-fore given discretion to vary the standards applicable to smallquantity generators (and the hazardous waste they generates) from
"- . the standards applicable to hazardous waste from larger generatorsexcept in three specific areas. Standards applicable to small quanti-ty generators must, at a minimum, provide that:
1. Small quantity generators may store their wastes on-sitefor up to 180 days without a permit;
2. All other treatment, storage, and disposal of hazardouswaste from small quantity generators must occur at a facilitywith interim status or a Subtitle C permit; and
3. All off-site shipments of hazardous waste from small quan-tity generators must be accompanied by a manifest; however,the manifest need not necessarily contain all the informationrequired on the manifest used by larger generators.
* In providing for on-site storage for up to IS0 days, EPA may pre-scribe design or operating standards as necessary to protect humanhealth and the environment. However, small quantity generators
-2.L shall not be required to have or obtain interim status or a permitfor such storage.
For those generators which generate 100 kg/mo or less of hazard-ous waste, the Administrator may promulgate requirements, in ad-dition to those that apply under current regulation (40 CFR 261.5),as may be necessary to protect public health and the environment.Nothing in this provision shall be construed to remove the currentdisposal requirements for generators of acutely hazardous wastesas listed in 40 CFR 261.33(e) or to impair the Administrator's dis-cretion to impose disposal requirements on other categories ofacutely or chronically hazardous waste, irrespective of the quanti-ties in which they are generated. The Committee also believes thatit would be both prudent and reasonable for generators of 100 kg/mo or less of hazardous waste to be required to notify the disposer
106
% ' "" '," "

27
of such wastes of its qualitative content so as to minimize the haz-ards to personnel involved in the disposal of such wastes.
With regard to the requirement for a manifest, the Committeeenvisions that small quantity generators will be required to use thesame manifest forms as larger generators but will not necessarilybe required to fill out all the information on the form. EPA. in con-junction with the Department of Transportation (DOT), may chooseto require some sort of indication on the manifest form that thesource of the waste is a small quantity generator.
Other than these specified standards, EPA may vary the smallquantity generator standard from the larger generator standardsfor waste identification, waste analysis, recordkeeping, reporting,pre-transport requirements, or any other requirements under Sec-tions 3001, 3002, 3003, or 3004. However, in all cases standards forsmall quantity generators must be sufficient to protect humanhealth and the environment.
Until special small quantity generator standards are in effect, orthe full set of Subtitle C standards are applied by the operation ofSection 3001(d), waste from small quantity generators can continueto be sent to Subtitle D facilities to the extent provided by existingEPA regulations. However, the Committee believes that there is animmediate need to provide notice to transporters, disposers, andother handlers of small quantity generator's wastes, of the type ofwaste they are handling. Such notice %ill enable handlers to insti-tute proper precautions to assure that waste is safely managed. Ac-cordingly, the amendment contains a requirement that any off-siteshipments of hazardous waste by generators generating between 25and 1,000 kilogram of hazardous waste per month must be accom-panied by the EPA uniform hazardous waste manifest form. signedby the generator. This requirement is intended to be self imple-menting in that no regulations are necessary to implement it. Therequirement becomes effective 90 days from enactment.
EPA and the DOT jointly proposed the uniform hazardous wastemanifest form on March 4, 1982 (47 FR 9336). Under the proposal,both EPA and DOT would require use of the uniform manifest forall regulated shipments of hazardous waste. Although the uniformmanifest form has not been promulgated as a final rule, EPA andDOT expect it to be promulgated prior to enactment of this legisla-tion.
Under the amendment, small quantity generators are required tocomplete only the follwing information on the form: (1) the nameand address of the generator; (2) the DOT description of the waste,including the proper shipping name, hazard class, and identifica-tion number; (3) the number and type of containers; and (4) thequantity of waste being transported. Although the form containsspace for other specific information, small quantity generators areonly required by this provision to supply the four specified pieces ofinformation. If the DOT description of the wastes is not providedunder applicable DOT and EPA regulations. then the form wouldcontain, in lieu of the DOT description, the EPA identificationnumber, or a generic description of the waste by hazardous wastecharacteristic. Furthermore, this provision does not impose record-keeping or reporting requirements on small quantity generators.However, the Administrator is authorized to require that addition-
107
'a%'. • ; . .- . . .. - .-... . .. . .. ".- '. .". . . ''; '''.,., '',, ''...,.,, . . ", 't, ',,.,'.': ,; -; "" " " " " "",, ",' ,' -a" " - ,"

28
al information be included on the form by small quantity gener-ators or even to require recordkeeping and reporting, if deemednecessary to protect human health and the environment.
The notice provision is intended as an interim requirement forgenerators of between 100 and 1,000 kilograms of hazardouswaste-that is, standards promulgated by EPA applicable to suchgenerators will supersede this requirement. However, EPA maychoose to continue to require a partially completed Uniform Na.tional Manifest. If EPA fails to promulgate standards on time andgenerators of between 100 and 1,000 kilograms of hazardous wasteper month become subject to the full Subtitle C standards, then forsuch generators this interim requirement would be replaced by thefull manifest requirements applicable by regulation to larger gen-erators.
For generators of hazardous waste in the 25 to 100 kilogramrange, the notice requirement in this amendment will remain ineffect. EPA may add additional requirements for generators in this
* range, but at a minimum the notice provision shall remain applica-* ble.
None of the requirements in this amendment are intended to su-persede DOT requirements relating to the transport of hazardousmaterials. Thus, to the extent that any generator of less than 1,000kilograms per month of hazardous waste is subject to DOT regula-tions under the Hazardous Materials Transportation Act, such gen-erators shall remain subject to those rules.
Section 4. Interim control of underground injectionSection 4 establishes an interim program of regulation of under-
ground injection of hazardous waste. This provision is similar toone included in last year's bill, H.R 6307, that was adopted by theHouse.
Underground injection is the process of forcing liquid into a well.Because underground injection, if improperly done, can lead to con-
- - tamination of underground sources of drinking water, the SafeDrinking Water Act requires that EPA develop minimum require-ments for State programs controlling underground injection (Sec-tion 1421). If a'State does not incorporate these requirements intoits program, EPA is required to establish a satisfactory under-ground injection control program for that State (Section 1422).
Under the schedule established by the Safe Drinking Water ActAct, EPA was directed to promulgate the requirements within 360days of the Act's enactment on December 16, 1974. In fact, theserequirements were not even proposed until 1976 and were then re-proposed in 1979 as a result of adverse comments from States andaffected industries. (See 41 FR 36730, August 31, 1976, and 44 FR23738 April 20, 1979). The requirements were not finally promul-gated until June, 1980. (See 45 FR 42473, June 24, 1980).
Even this delay was apparently not sufficient to enable the
L ".
Agency to carry out the statutory mandate fully. Instead. EPA an-% nounced when the requirements were promulgated that it would
defer- the promulgation of minimum requirements for injection of
1 .8
"S .
n 18-'-.' lifrainb nlddo h omb ml uniygnrS-...ao. ree orqiercrkeigadrprig fdee
4. Th4oiepoiini.nedd sa nei eurmn o
"- eesayt roe.hmn elhan h nvrnet

192
Section 6. Burning a2nd blcndinL' /c: d', s cucste for energ-, reco'-
Section 6 corrects a major deficier.: i. the present RCRA regu-lations by requiring EPA to exercis_ i-s existing authority overhazardous waste-derived fuels by regula::ng their production, dis-tribution and use. The Committee in:ends that EPA exercise thisauthority in tandem with its authori:y over used oil so that usedoil-derived fuels are regulated at the same time.
Currently, EPA exempts facilities that burn hazardous waste forthe primary purpose of energy recovery EPA has estimated that10 or 15 million metric tons of hazardous wastes are burned eachyear in boilers; over one-half of all hazardous waste generated is
* -. burned in facilities not now regulated under RCRA. EPA has ac-knowledged that burning hazardous wastes for energy recovery issimilar to incinerating then and "could pose a parallel or greaterrisk of enviornmental dispersal of hazardous waste constituentsand products of incomplete combustion." (48 FR 14481-2 (April 4,1983)).
Fuel blending is one of several areas where EPA's failure to pro-mulgate regulations has led to direct threats to human health andthe environment. Hazardous wastes have been blended with heat.ing oil and sold to unsuspecting customers who burn them underconditions which may not protect human health or the environ-ment.
The potential impact of this loophole is even more significant asmore and more wastes may be burned in boilers, cement kilns, orother heat recovery units to avoid RCRA regulation and treatmentcosts. In addition to the obvious adverse health and environmentalconsequences of continued unregulated burning, the present loop-hole acts as a disincentive to the development and expansion ofhazardous waste treatment facilities. The Committee intends hissection and Section 5, restricting the !and disposal of hazardouswaste, to provide a meaningful regulatory program to increase thetreatment of hazardous waste and the development of new treat-ment capacity.
EPA has asserted its jurisdiction over burning and blending ofhazardous wastes for energy recovery. EPA also has established en-
-. forcement guidelines to identify "illegtirrate' or "sham" burningfor energy recovery and bring such practices under regulation.
The Committee commends these new initiatives by EPA. Howev-er, the Committee still believes, as it did last year, that legislationis necessary to assure that the Committee's objectives in compel-ling EPA to develop and implement a comprehensive regulatoryprogram over burning and blending for energy recovery areachieved, within the timetables set by the Committee. The provi-sions of Section G do not grant EPA any new statutory authority;RCRA now provides EPA full authority to regulate hazardouswastes that are blended or burned for energy recovery and to regu-late the owners and operators of the blending and burning facili-ties. The Committee wants to assure that EPA will exercise its au-thority over all facilities that blend or burn hazardous waste forenergy recovery.
"..
C.
p 109
L'-'

410
The term "facility," as defined under RCRA and as intended tobe applied by the Committee, includes cement kilns and industrialfurnaces, not just boilers, that burn hazardous waste for energy re-covery. EPA has recently proposed that cement kilns and "indus-
" trial furnaces" that burn hazardous waste for fuel would continueto be exempt from regulation. The Committee does not considersuch exemption, particularly for cement kilns, to be consistent withits intent in closing the burning and blending exemption if it wereto be extended beyond the two year date for promulgating regula-tions contained in this Section. This continued exemption couldwell be inconsistent with the RCRA mandate to regulate hazardous
,.- **.wastes as necessary to protect human health and the environment.The Committee does not consider cement kilns burning hazardouswaste for energy (not recycling cement kiln dust for clinker) to bedistinguishable from a commercial hazardous waste incinerator in
-" its potential impact on human health and the environment.Notification. -Subsection (a) amends RCRA Section 3010 to re-
quire filing of a notification by anyone who is producing a hazard-ous waste-derived fuel, burning a hazardous waste fuel for energyrecovery, or distributing an, marketing a fuel produced from ahazardous waste (including transporters). This is a self-implement-ing requirement, so that if EPA fails to issue timely regulations, allpersons covered by the provisions are required to notify. The Com-mittee intends this program to apply to hazardous waste-derivedfuels, fuels blended with hazardous wastes, and hazardous wastesburned without blending as fuels. Hazardous waste, as used in thisprovision, includes not only wastes identified or listed as hazardousunder EPA's regulations, but also includes any commercial chemi-cal product (and related materials) listed pursuant to 40 CFR261.33, which is not used for its originally intended purpose but in-stead is burned or processed as fuel. (Under current EPA regula-tions, burning as fuel is not deemed to be a form of discard; hencelisted commercial chemical products, unlike spent materials, by-products or sludges, are not deemed to be "wastes" when burned asfuel. They are only "wastes" when actually discarded or intendedfor discard.) Hazardous waste or used oil generators who do not
* -'.deal directly with the persons who ultimately burn the wastes (orused oil) as a fuel, and do not burn these materials themselves, arenot covered by this provision because they neither produce,market, nor distribute a waste-derived fuel.
.,. The Committee desires that the Agency assemble an accurate-'- picture of the current nature and scope of current hazardous waste
fuel production, distribution, and burning. In this regard, the Com-mittee recommends that the 3010 notices that are required underSection 6 of these amendments contain the following information:
From Fuel Producers:wastes utilized in fuel production, toxic constituents in the
waste and in the waste portion of the fuel, and percentage ofthe waste component of the fuel;
BTU content of the fuel produced;where and to whom the fuels are sent;quantities of waste-derived fuels produced.
From Marketers Distributors:where they got the fuel from:
110
'.,:.-.,,,,..-,. ,,.: ,,,,,-,.- . . . . .~.. .. . .§j • & .I-... . ... : . . . . . .. , . .

41
whether they change the content;where and to whom they market the fuel:quantities of fuel distributed, and frequency of distribution.
From Ultimate Users:source of their waste-derived fuel;types of wastes or waste-derived fuel burnt, and quantities
burnt;description of the combustion unit in which the fuels are
burnt (including such information as boiler design, heat inputand out-put, and temperature of combustion);
type of primary boiler fuel used and portion of heat inputprovided by the waste or the waste-derived fuel;
BTU content.The notification requirement is contained in an amended Section
3010(aXI). This has two-fold significance. First, all notificationsfiled under this provision will go to both EPA and to states withauthorized hazardous waste programs rather than to one or the
a other, as with other notifications. Second, the notification is a pre-requisite for interim status (see RCRA Section 3005(e)(2j) if EPAlater determines that these persons should be regulated as hazard-ous waste management facilities. This should create a strong incen-tive for persons required to notify to comply with the requirement.
The bill also contains a provision indicating that special classesof waste material listed in Section 3001(b(3)(A), which are not nowsubject to regulation as hazardous wastes, are not subject to the no-tification and regulatory provisions of these amendments. An ex-ample are the high volume wastes generated from the combustionof coal or other fossil fuel, typical of the utility industry. However,utilities that burn hazardous wastes such as spent solvents, spentacids, or corrosive boiler cleaning wastes in their boilers are subjectto the noti-fication requirement and could be subject to the stand-ards requirements as well.
Standards for Production, Burning, Distribution, and Market-ing.-Subsection (66tb of the bill amends Section 3004. It requiresthe Administrator to promulgate regulations, as may be necessary
-- to protect human health and the environment, governing hazard-ous waste-derived fuel production, burning, distribution and mar-keting. Used oil, (whether or not a hazardous waste) mixed withother hazardous wastes can be regulated under these provisions.The regulations apply to anyone required to submit a Sec. 3010 no-tification under this section, e.g., the owners and operators of anyfacility that blends or burns hazardous wastes as a fuel or anyonewho markets or distributes hazardous waste fuels
The Committee believes that the standards should include the re-quirements listed in subsection (a) of Section 3004 as appropriate.EPA may make different standards effective at different times. Forexample, manifesting and recordkeeping may be immediately re-quired, while other performance or technical standards may be im-posed at a later time within the two year deadline. The technicalNtandards applicable to facilities burning hazardous waste as a fuelmav consider various factors, including destruction efficiency, andwaste content of the fuel. Furthermore, it is the Committee's inten-tion that the Administrator. in controlling the burning of hazard-nus waste and the emissions from such facilities, make no such dis-
111

42
tinction on the basis of whether the facility is on the site of thegenerator, or is an off-sit2 facl:v.
Because EPA already has th- authority to regulate the blendingand burning of hazardous was-:es for purposes of energy recovery,the Committee's objective is to accelerate the Agency's rulemakingto close a major gap in the present regulations and to set an out-side deadline for the regulation of all burning of hazardous wastesand blended fuels. In promulgating regulations, the Agency mustregulate all combustion units burning hazardous waste-derivingfuel for energy recovery-including boilers, cement kilns, and otherindustrial furnaces-under the same ultimate standards as otherhazardous waste management facilities regulation as may be neces-sary to protect human health and the environment. This may leadto the result that these units are regulated under the same sub-stantive requirements as apply to presently regulated treatmentfacilities. When a combustion unit operates like an incinerator-es-pecially in terms of the type and volume of hazardous waste beingurned -the Committee expects that the Agency will apply the
same substantive requirements as are now applied to presently reg-ulated treatment facilities.
Labeling.-The Committee intends that the Agency expeditiouslyimplement a requirement for fuel blenders to notify their custom-ers of the presence of hazardous wastes in their fuel. The Commit-tee is concerned that people are unwittingly burning hazardouswastes in uncontrolled circurnstances, with obvious health and en-vironmental risks. The user could be at risk not only from boileremissions, but could be exposed to fire or explosion hazard (sincehazardous waste-derived fuels may have a lower flash point), orrisk boiler damage (from hydrochloric acid formed by chlorinatedwastes) as well. Transporters also may be unaware that they maybe facing special risks from carrying hazardous waste-derived fuels.
Consequently, starting one year after the passage of the Hazard-ous Waste Control and Enforcement Act of 1983, distributors ofhazardous waste-derived fuels who are required to notify must puta warning label on the invoices or bill of sale accompanying eachshipment of hazardous waste-derived fuel. (The provision does notapply to fuels which contain used oil alone.) The label would haveto warn the user (and transporter, that the fuel contains hazardouswaste and identify the hazardous waste it contains. This latter re-quirement can be satisfied by identifying wastes by generic classes(for instance, "chlorinated solvents") rather than by the precisechemical name ("spent tricloroethylene").
Although this provision is self-implementing (i.e., regulations arenot needed to effectuate the requirement), the requirement is tiedto the noitification provisions of this bill. Thus, if EPA acts to limitthe class of blenders and distributors required to notify, these per-sons may not have to prepare warning labels if EPA determinessuch labels would not be needed to protect human health and wel-fare and to carry out the Committee's intent in requiring a label.
It is the Committee's intent that this provision apply not only inthose states where EPA is operating a hazardous waste program,but in authorized states as well. This will assure that users andtransporters of hazardous waste-derived fuels in authorized stateswill not have to wait until their states adopt labeling legislation or
A.
1 12
_, -A%

7- - 7V .- .V*%
43
regulations-a process that cOu~c take several years-oefore theyreceive the warnings required by -his section,
Exemptito for Petroleum Fuel Products Produced at Refieries.-This provision provides a iited and conditional exemp:on fromthe labeling requirement for certain petroleum fuel refiners. Refin-eries often take oily refining wastes and reintroduce these wastesinto the refining process where the oil component is incorporatedinto product and contaminants are removed. The Committee doesnot believe that refineries should automatically have to place awarning label on these fuels should EPA fail to exempt refineriesfrom the labeling requirements within 12 months.
The exemption from the labeling requirement is narrow. howev-er. EPA may still explicitly require a warning label for these fuelsas may be necessary to protect human health and the environment.
aIn addition, the exemption applies only to wastes generated on-sitein the refining process itself. It does not apply to other wastes gen-erated at a refinery such as spent solvents or discarded pesticides.
"' Finally, these wastes must be introduced into the refining processat a point where contaminants are removed. (This standard isdrawn from the definition of "re-refined oil" contained in Section1004(3) of RCRA.)
Standard for Transporters. -This provision amends Section 3003by adding a new subsection (c) that requires EPA, no later thantwo years after enactment, to promulgate regulations, as may benecessary to protect human health and the environment, to controltransporters of hazardous waste-derived fuels. In developing stand-ards, EPA may require transporters to meet the requirements con-tained in Section 3003(a), but may vary these requirements, oradopt different ones, as may be necessary to protect human healthand the environment.
Utility and Mining Wastes. -Section 6;g) provides that "nothingin this subsection shall be con-trued to affect or impair the provi-sions of section 3001tbK3)." That section, added to RCRA in 19S0,provides that specified utility and mining wastes I should not besubject to regulation under subtitle C until at least six monthsafter EPA submitted studies of those wastes to Congress. The sec-tion then specified that the Administrator could request. gather,and make public, information about the generation, handling, anddisposal of those waste materials.
Reference to Section 3001(b, 31 in this bill has one specific pur-pose. We are reaffirming our intent that substantive regulation ofthe specified wastes must await completion of the relevant studies.It should be clear, however, that that deferment is limited to thewastes specified in 3001(bK3); it does not include solvents, de-greasers, pesticides, smelting or other wastes generated independ-ently of the processes listed in 300irb,(3. Thus, facilities burning orblending those other wastes are not exempt from the provisions ofthis bill. Furthermore, we reaffirm the intent of the 19i0 Act thatthe Administrator has the duty and the authority to gather and
F1y a.h - .ctr. bottom a.h %%asit s!, ; --t 'I - pa5 e , l~cir-n u ,.rt, ,.:e cent-t-
I-d prmariy frurr, the cornbus ion of (osl . ::n.t to.! ".tes. -Li s;::d e !rcr. :'e ex:'ac-
'L-n b-entfication. .and pru.eF.Int it ofte.r ar . :,.:udmng pi'u-phist rtkK ..c o~ert..r.din from the mining of uranium ore. and ii: cte t LUn dust %aste
1.3Cop ovilble to DTIC does not(Theree rLi ble ti Tpsoducio
113
(The reverse of this page is bla,, )
,... - - - -+V°+ -

~ A4
N,~'i:
ItI
T.,t
:4' ~ 'IN4 ~