combustion visualization in a large bore gas engine - · pdf filecombustion visualization in a...
TRANSCRIPT
Combustion Visualization in a
Large Bore Gas Engine
Jeudi Duong
Thesis for the Degree of Licentiate in Engineering, 2013
Division of Combustion Engines
Department of Energy Sciences
Faculty of Engineering (LTH)
Lund University
www.energy.lth.se

Copyright Jeudi Loan Duong, 2013
Division of Combustion Engines
Department of Energy Sciences
Faculty of Engineering (LTH)
Lund University
P.O. Box 118, SE-22100, Lund, Sweden
ISBN 978-91-7473-738-4
ISRN LUTMDN/TMHP-13/7084-SE
ISSN 0282-1990
I
List of publications
Paper I
Visualization of the Combustion in Wärtsilä 34SG Pre-chamber ignited Lean Burn Gas Engine
Jeudi Duong1, 2
, Rikard Wellander3, Jari Hyvönen
2, Öivind Andersson
1, Mattias Richter
3
1 Division of Combustion Engines, Lund University, Sweden
2 Wärtsilä Finland Oy, Finland
3 Division of Combustion Physics, Lund University, Sweden
Presented in 27th
CIMAC World Congress, Shanghai, China, May 13th
– 16th
2013, Paper no.: 414
Paper II
High speed combustion imaging in a large bore gas engine – the relationship between pre- and main
chamber heat release
Jeudi Duong1, 2
, Rikard Wellander3, Jari Hyvönen
2, Öivind Andersson
1, Mattias Richter
3, Bengt
Johansson1, Marcus Aldén
3
1 Division of Combustion Engines, Lund University, Sweden
2 Wärtsilä Finland Oy, Finland
3 Division of Combustion Physics, Lund University, Sweden
Will be presented in ASME IMECE Congress, San Diego, U.S.A, November 15th
– 21th
2013, Paper no.:
IMECE2013-64286
Related work
Study of the early flame development in a spark-ignited lean burn four-stroke large bore gas engine
by planar laser induced fluorescence
Rikard Wellander1, Jeudi Duong
2, 3, Joakim Rosell
1, Mattias Richter
1, Öivind Andersson
2, Jari Hyvönen
3,
Bengt Johansson2, Marcus Aldén
1
1 Division of Combustion Physics, Lund University, Sweden
2 Division of Combustion Engines, Lund University, Sweden
3 Wärtsilä Finland Oy, Finland
Abstract for SAE World Congress, Detroit, U.S.A, April 8th
– 10th
2014

II
Acknowledgement This work has been conducted at Waskiluoto Validation Center of Wärtsilä Finland Oy. It was partially
financed by NordForsk PPP (Private Public Partnership) program, ref. no: 080345.
First of all, I would like to thank my supervisor and former boss Jari Hyvönen at Wärtsilä, for his support,
knowledge and for always sparing time for a discussion despite his busy schedule. Everything he taught
me will surely stay with me and help me in the future. I never had a good boss like him!
I would also like to thank my supervisor Professor Öivind Andersson for giving various suggestions on
problem solving. His incredible knowledge within combustion engines and combustion physics are
remarkable. I am very grateful to him for teaching me the difference between a scientific and an
engineering work!
I would like to express my gratitude to entire personnel of the SCE engine team; Jussi Autio, Jussi Seppä,
Staffan Nysand, Alberto Cafari, Kristian Haka, Jukka Ylimartimo, Lasse Soinila, Jarkko Ruutiainen, and
Mikko Huissi for the help and co-operation during the past years. Especially I would like to thank my co-
supervisor Mattias Richter and Rikard Wellander from the division of combustion physics, together with
SCE team we struggled long hours to get the engine and the camera system to work. Mattias Richter gave
the exact advice about optical diagnostics. Especially I am thankful to Rikard Wellander for conducting
endless image processing from our experiments.
I would like to extend my sincerest thanks to my co-supervisor Professor Bengt Johanssons for accepting
me as an Industrial Ph.D student and for sharing his knowledge and good ideas. I would also like to show
my appreciation to Professor Marcus Aldén, Robert Ollus and Arto Järvi, for their involvement related to
this study.
Furthermore, I would like to thank all my colleagues at the division of combustion engines for fun
discussions during coffee breaks. Special thanks go to Peter Larsson, Ted Lind, Yann Gallo, my room
mates, for making me laugh everyday. Guillaume Lequien, for interesting discussions about optical
reseach. Kenan Muric, for helping me solving mysterious Matlab problems. Gökhan Coskun, for
introducing me into the world of Turkish yogurt. Maja Novakovic, for always being a good listener.
Prakash Arunachalam Narayanan, for being a non-chili master chef. Marcus Lundgren, for showing
formula student racing cars. Ashish Shah, for always helping out in every situation and become one of my
good friends.
Last but certainly not least, I would like to thank my family for all the support during early years of my
life and studies.
III
Nomenclature
ANG Adsorbed Natural Gas
AT Area of the nozzle holes
ATDC After Top Dead Centre
Awall Area of the wall
B Bore
BDC Bottom Dead Centre
BTDC Before Top Dead Centre
CA Crank Angle
CI Compression-Ignited
CNG Compressed Natural Gas
CO Carbon Monixide
CO2 Carbon Dioxide
Cd Discharge coefficient
cp Specific heat capacity of pressure
cv Specific heat capacity of volume
DF Dual fuel
dm Mass flow
ECA Emission Control Area
EGR Exhaust Gas Recirculation
F Frequency
h Heat transfer coefficient
hf Sensible enthalphy of the fuel
HC Hydrocarbon
HCN Hydrocyanic Acid
IV
H2O Hydrogen Hydroxide or water
IMEP Indicated Mean Effective Pressure
IMO International Maritime Organization
IVC Inlet Valve Closing
LAG Lavinia Aktyvatsia Gorenia
LNG Liquefied Natural Gas
LIF Laser-Induced Fluorence
MC Main Chamber
MEPC Marine Environment Protection Committee
m1 Main Chamber mass
m2 Pre-Combustion Chamber mass
mf Mass flow
NH3 Ammonia
NHV Net Heating Value
NO Nitric Oxide
NO2 Nitrogen Dioxide
NOx Nitrogen Oxides
O3 Ozone
PCC Pre-Combustion Chamber
PJC Pulsed Jet Combustion
PM Particular Matter
pc Combustion pressure
ρ Density
pivc Inlet Valve Closing pressure
p1 Main Chamber pressure
p2 Pre-Combustion Chamber pressure
V
pm Motored pressure
R Specific gas constant
RoHR Rate of Heat Release
rpm Revolutions per minute
SCE Single Cylinder Engine
SCR Selective Catalyst Reduction
SI Spark Ignition
Sp Mean piston speed
TA Luft Technische Anleitung zur Reinhaltung der Luft
TDC Top Dead Centre
T1 Main Chamber temperature
T2 Pre-Combustion Chamber temperature
Tgas Gas temperature
Tivc Inlet Valve Closing temperature
Tref Reference temperature
Twall Wall temperature
U1 Internal Energy of the Pre-Combustion Chamber
U2 Internal Energy of the Main Chamber
UN United Nations
Vd Displacement volume
Vivc Inlet Valve Closing volume
V1 Main Chamber volume
V2 Pre-Combustion Chamber volume
γ Specific Heat Ratio
γ0 Reference Value of Specific Heat Ratio
Δp Delta pressure
III
Contents
List of publications ...................................................................................................................................... I
Acknowledgement ....................................................................................................................................... II
Nomenclature ............................................................................................................................................ III
1 Introduction .............................................................................................................................................. 1
1.1 Combustion engines ...................................................................................................................... 1
1.2 Emissions ....................................................................................................................................... 3
2 Gas engine combustion ........................................................................................................................ 7
2.1 General concept ............................................................................................................................. 7
2.2 Pre-combustion chamber ............................................................................................................... 7
3 Motivation ............................................................................................................................................ 9
4 Engine experiments ........................................................................................................................... 10
4.1 Test engine ................................................................................................................................... 10
4.2 Optical engine .............................................................................................................................. 10
4.3 Measurement system ................................................................................................................... 11
4.3.1 Data acquisition ....................................................................................................................... 11
4.3.2 Camera systems ....................................................................................................................... 12
4.4 Experimental setup ...................................................................................................................... 12
4.5 Fuel .............................................................................................................................................. 14
4.6 Operation conditions ................................................................................................................... 15
4.7 Diagnostic methods ..................................................................................................................... 16
4.7.1 Heat release analysis ................................................................................................................ 16
4.7.2 Optical diagnostics .................................................................................................................. 20
4.7.3 Image processing ..................................................................................................................... 21
5 Results and discussion ....................................................................................................................... 24
5.1 Cycle-to-cycle variation .............................................................................................................. 24
5.2 Heat release.................................................................................................................................. 24
5.3 Flame appearance inside cylinder ............................................................................................... 27
5.4 Flame front velocity .................................................................................................................... 30
5.5 Chemiluminescence intensity in the main chamber .................................................................... 31
5.6 Combustion process inside the cylinder ...................................................................................... 32
6 Conclusion .......................................................................................................................................... 37
7 Summary of papers ........................................................................................................................... 38
8 References........................................................................................................................................... 40
1
1 Introduction
1.1 Combustion engines Internal combustion engines have been developed over a hundred years. In 1859, Etienne Lenoir built the
first gas-fired internal combustion engine despite a little knowledge of thermodynamics. Four years later,
Alphonson Beau de Rochas developed the four-stroke cycle. He realized the importance of compressing
the charge before combustion, but never managed to build an engine. It was Nikolaus A. Otto who built
the first four-stroke cycle spark ignition (SI) engine in 1876. After that Rudolf Diesel invented the
compression-ignited (CI) engine in 1892 [1- 4].
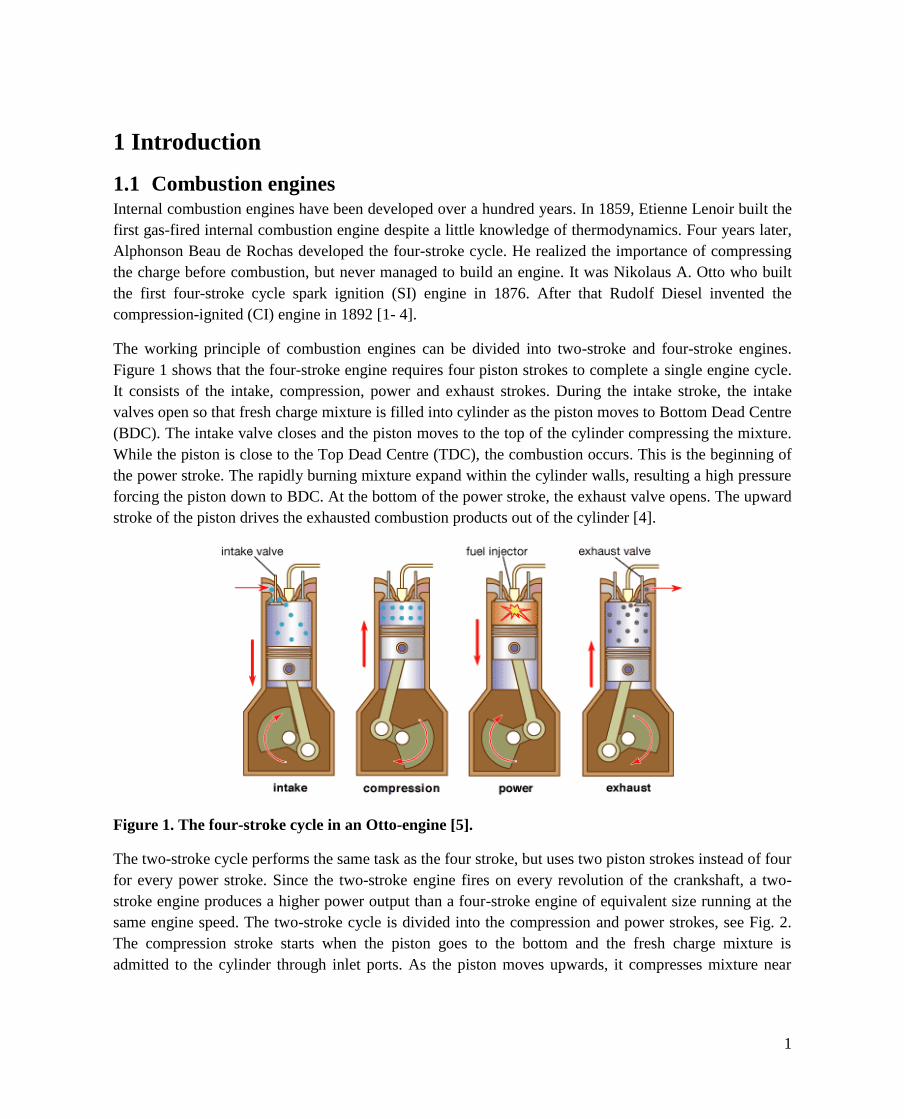
The working principle of combustion engines can be divided into two-stroke and four-stroke engines.
Figure 1 shows that the four-stroke engine requires four piston strokes to complete a single engine cycle.
It consists of the intake, compression, power and exhaust strokes. During the intake stroke, the intake
valves open so that fresh charge mixture is filled into cylinder as the piston moves to Bottom Dead Centre
(BDC). The intake valve closes and the piston moves to the top of the cylinder compressing the mixture.
While the piston is close to the Top Dead Centre (TDC), the combustion occurs. This is the beginning of
the power stroke. The rapidly burning mixture expand within the cylinder walls, resulting a high pressure
forcing the piston down to BDC. At the bottom of the power stroke, the exhaust valve opens. The upward
stroke of the piston drives the exhausted combustion products out of the cylinder [4].
Figure 1. The four-stroke cycle in an Otto-engine [5].
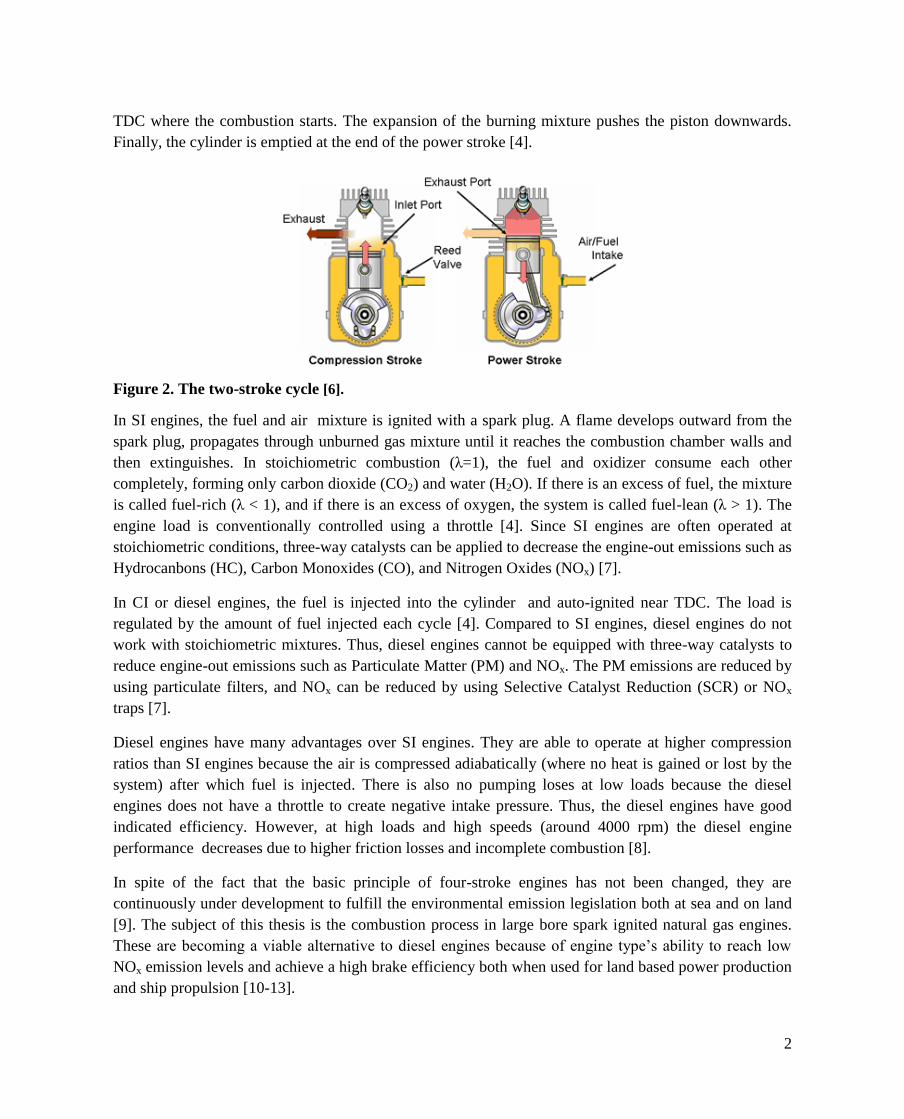
The two-stroke cycle performs the same task as the four stroke, but uses two piston strokes instead of four
for every power stroke. Since the two-stroke engine fires on every revolution of the crankshaft, a two-
stroke engine produces a higher power output than a four-stroke engine of equivalent size running at the
same engine speed. The two-stroke cycle is divided into the compression and power strokes, see Fig. 2.
The compression stroke starts when the piston goes to the bottom and the fresh charge mixture is
admitted to the cylinder through inlet ports. As the piston moves upwards, it compresses mixture near
2
TDC where the combustion starts. The expansion of the burning mixture pushes the piston downwards.
Finally, the cylinder is emptied at the end of the power stroke [4].
Figure 2. The two-stroke cycle [6].
In SI engines, the fuel and air mixture is ignited with a spark plug. A flame develops outward from the
spark plug, propagates through unburned gas mixture until it reaches the combustion chamber walls and
then extinguishes. In stoichiometric combustion (λ=1), the fuel and oxidizer consume each other
completely, forming only carbon dioxide (CO2) and water (H2O). If there is an excess of fuel, the mixture
is called fuel-rich (λ < 1), and if there is an excess of oxygen, the system is called fuel-lean (λ > 1). The
engine load is conventionally controlled using a throttle [4]. Since SI engines are often operated at
stoichiometric conditions, three-way catalysts can be applied to decrease the engine-out emissions such as
Hydrocanbons (HC), Carbon Monoxides (CO), and Nitrogen Oxides (NOx) [7].
In CI or diesel engines, the fuel is injected into the cylinder and auto-ignited near TDC. The load is
regulated by the amount of fuel injected each cycle [4]. Compared to SI engines, diesel engines do not
work with stoichiometric mixtures. Thus, diesel engines cannot be equipped with three-way catalysts to
reduce engine-out emissions such as Particulate Matter (PM) and NOx. The PM emissions are reduced by
using particulate filters, and NOx can be reduced by using Selective Catalyst Reduction (SCR) or NOx
traps [7].
Diesel engines have many advantages over SI engines. They are able to operate at higher compression
ratios than SI engines because the air is compressed adiabatically (where no heat is gained or lost by the
system) after which fuel is injected. There is also no pumping loses at low loads because the diesel
engines does not have a throttle to create negative intake pressure. Thus, the diesel engines have good
indicated efficiency. However, at high loads and high speeds (around 4000 rpm) the diesel engine
performance decreases due to higher friction losses and incomplete combustion [8].
In spite of the fact that the basic principle of four-stroke engines has not been changed, they are
continuously under development to fulfill the environmental emission legislation both at sea and on land
[9]. The subject of this thesis is the combustion process in large bore spark ignited natural gas engines.
These are becoming a viable alternative to diesel engines because of engine type’s ability to reach low
NOx emission levels and achieve a high brake efficiency both when used for land based power production
and ship propulsion [10-13].

3
1.2 Emissions The emission levels of the lean burn spark ignited natural gas engine are legally regulated when operating
an engine both at sea and on land. One of the most important regulations is made by the Marine
Environment Protection Committee (MEPC) of the International Maritime Organization (IMO) as a
United Nations (UN) specialized agency from 1948. Currently IMO has 170 (out of 193 UN) member
states and three associate members, i.e. Faroes, Hong Kong and Macao. The purpose of IMO is to
promoto maritime safety and control of marine pollution from ships when operating inside the Emission
Control Areas (ECA), i.e. the North American Emission Control Area and the United States Caribbean
Sea Area [14].
The IMO emission standards are often referred as MARPOL Annex or so called Tier I...III standards for
monitoring NOx emission limits at different rated engine speed, see Fig. 3. Other emission such as HC
and CO are to a large extant not yet regulated for large lean burn gas engines. IMO Tier I NOx limits were
introduced on January 1st 2000 where the total weighted cycle NOx emission limit was 17 g/kWh at
engine’s rated speed less than 200 rpm. A year later, NOx emission control level was reduced by 15.4 %
when switching from Tier I to Tier II mode. From January 1st 2016 on, IMO Tier II NOx emission control
level will be reduced for 76.4 % to Tier III NOx level. Later on in May 2013, the MEPC proposed draft
amendments to Tier III NOx emission limits within ECAs from January 1st 2016 to 2021. The MEPC
decision regarding the draft amendments will be voted again in March 2014. If the Tier III NOx emission
limits are delayed, it would be applied from 2016 only for US flagged vessels [14, 15].
Figure 3. IMO Tier I...III NOx emissions limits at different rated engine speed.
4
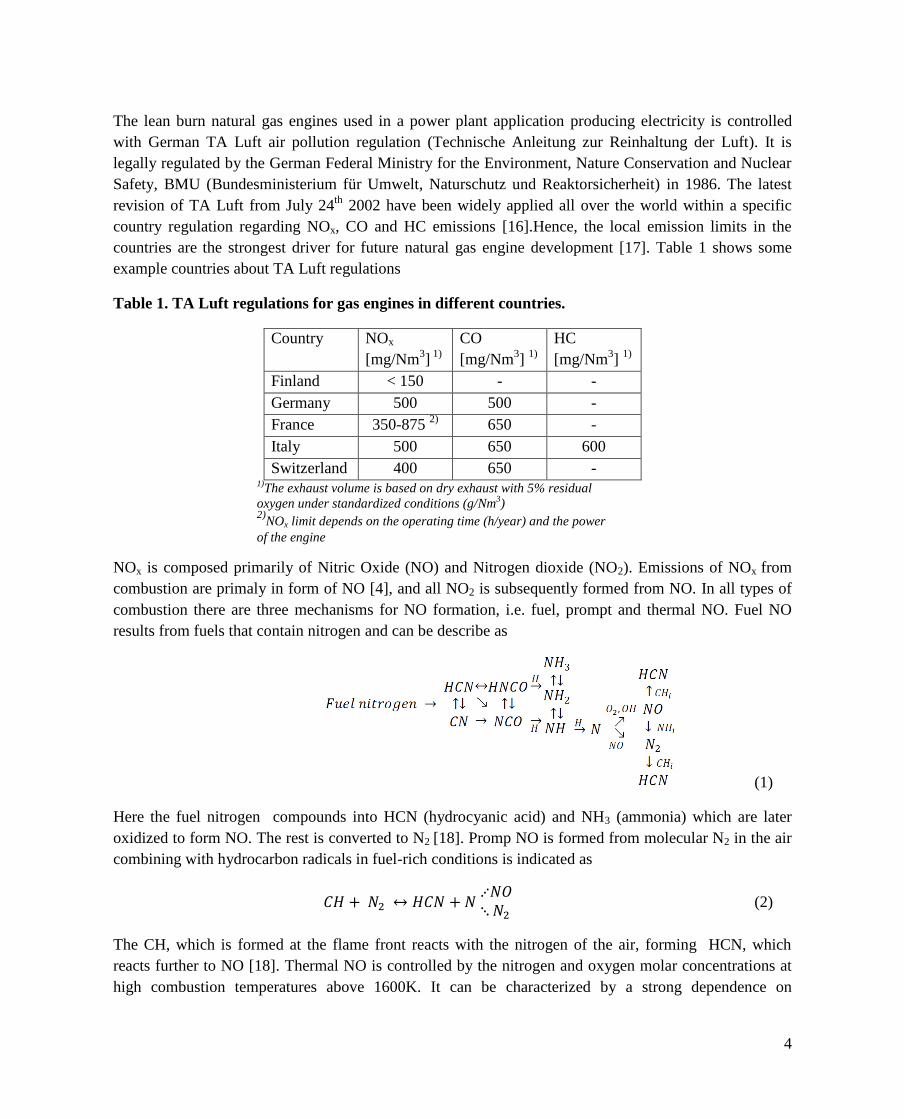
The lean burn natural gas engines used in a power plant application producing electricity is controlled
with German TA Luft air pollution regulation (Technische Anleitung zur Reinhaltung der Luft). It is
legally regulated by the German Federal Ministry for the Environment, Nature Conservation and Nuclear
Safety, BMU (Bundesministerium für Umwelt, Naturschutz und Reaktorsicherheit) in 1986. The latest
revision of TA Luft from July 24th
2002 have been widely applied all over the world within a specific
country regulation regarding NOx, CO and HC emissions [16].Hence, the local emission limits in the
countries are the strongest driver for future natural gas engine development [17]. Table 1 shows some
example countries about TA Luft regulations
Table 1. TA Luft regulations for gas engines in different countries.
Country NOx
[mg/Nm3] 1)
CO
[mg/Nm3]
1)
HC
[mg/Nm3]
1)
Finland < 150 - -
Germany 500 500 -
France 350-875 2)
650 -
Italy 500 650 600
Switzerland 400 650 - 1)
The exhaust volume is based on dry exhaust with 5% residual
oxygen under standardized conditions (g/Nm3)
2)NOx limit depends on the operating time (h/year) and the power
of the engine
NOx is composed primarily of Nitric Oxide (NO) and Nitrogen dioxide (NO2). Emissions of NOx from
combustion are primaly in form of NO [4], and all NO2 is subsequently formed from NO. In all types of
combustion there are three mechanisms for NO formation, i.e. fuel, prompt and thermal NO. Fuel NO
results from fuels that contain nitrogen and can be describe as
(1)
Here the fuel nitrogen compounds into HCN (hydrocyanic acid) and NH3 (ammonia) which are later
oxidized to form NO. The rest is converted to N2 [18]. Promp NO is formed from molecular N2 in the air
combining with hydrocarbon radicals in fuel-rich conditions is indicated as
(2)
The CH, which is formed at the flame front reacts with the nitrogen of the air, forming HCN, which
reacts further to NO [18]. Thermal NO is controlled by the nitrogen and oxygen molar concentrations at
high combustion temperatures above 1600K. It can be characterized by a strong dependence on
5
temperature and relatively slow reaction rates. In case of natural gas fuelled engines, thermal NO is the
dominating mechanism behind the NO emissions. The reaction mechanism of thermal NO or so called
Zeldovich mechanism [19] can be expressed as
(3)
(4)
(5)
where in the Eq. (3) O atoms react with N2 producing NO and N radical species. Then N atoms react
quickly with O2 in Eq. (4) to form another NO and O radicals. By adding Eq. (5) we obtain the extended
Zeldovich mechanism. NOx is not only an important air pollutant by itself, but also reacts in the
atmosphere to form trospospheric ozone (O3) in the ambient air and acid rain. There are several ways to
reduce NOx when operating large bore gas engines, e.g. lean burn (facilitated through pre-combustion
chamber (PCC) technology), ignition timing, and exhaust gas recirculation (EGR) [14, 20].
HC is produced due to incomplete combustion, for example due to low temperature, quenching of flames
on cold walls or hydrocarbons absorbed by the lubrication oil [4]. The wall quenching mechanism occurs
when combustion temperature near combustion chamber walls becomes too low to fully oxidize the fuel
due to heat loss. This phenomena is very sensitive to wall temperatures and lambda (λ). The latter one is
defined as the ratio of the actual air quantity relative to the ideal stoichiometrically required quantity.
Other sources of HC are mixtures that are either too rich (λ < 1) or too lean (λ > 1) to burn completely. In
large bore spark ignited gas engines, with λ < 1, HC increases due to a little amount of oxygen for
complete combustion in the combustion chamber. The amount of HC can thereby be reduced by
increasing lambda (λ ≤1) until specific limit and the ignition limit of the mixture is reached, which leads
to misfiring when there is homogeneous mixture formation. An increase in compression ration results in a
better lean-off capability and allows the ignition to be retarded due to the fast combustion. This enables
reduced HC and NOx emissions. Another is the EGR technique where recycled exhaust gas is mixed with
fresh intake air to reduce the flame temperature [21-23]. High rates of EGR tend to increase the HC
emissions.
CO is one reaction step in the hydrocarbon oxidation mechanism, the last being the oxidation of CO into
CO2 can be describe as
(6)
Thus, CO emissions are the results of incomplete combustion in intermediate temperature regions where
OH concentration becomes low and results in diminished conversion of CO to CO2. Therefore, the
combustion temperature affects CO emissions significantly where the CO emissions decrease
substantially when the temperature reaches the critical temperature level. CO emissions are controlled
mainly by the lambda. When λ > 1, the CO is very low and nearly independent of lambda value. CO
emissions can be reduced by using an oxidation catalyst in the exhaust duct, converting CO in the exhaust
gas to CO2 through reaction with O2 [4, 23].
6
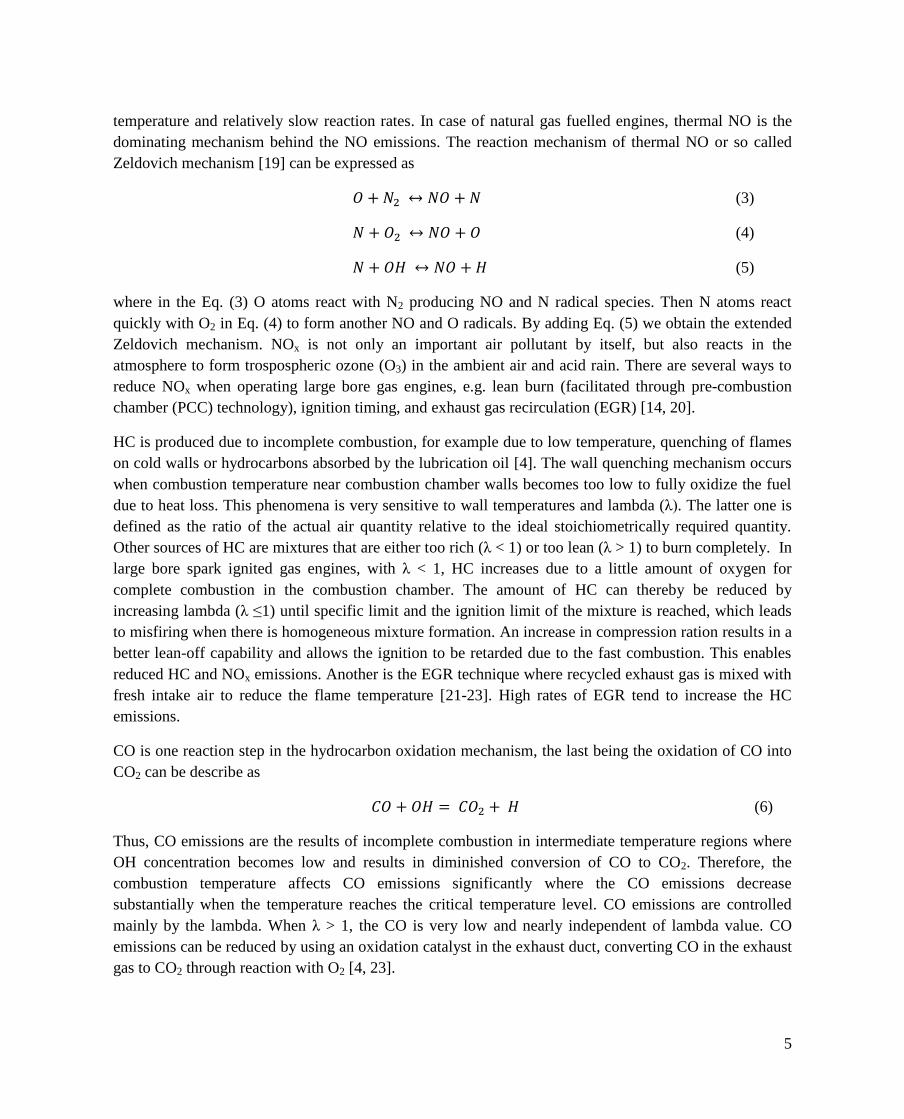
Overall, the most important factor determining SI engine emissions is the lambda. Figure 4 shows
qualitatively the shapes of NOx, HC and CO emission curves close to stoichiometric condition (λ≈1). On
the left side of the figure, the leaner mixture results in lower NOx emissions and increasing HC and CO
emissions. This is associated with poor combustion quality [4]. To take into account the spark-ignited gas
engine as a whole, all the emission reduction methods such as by using EGR and oxidation catalyst are
very challenging. The EGR rate is limited by the EGR system capacity where a high EGR rate could
reduce NOx by around 50%. EGR application might be sufficient for the marine engines, but not for the
power plant engines due to the country specific emission regulations for HC (mostly methane) and CO,
see Table 1. These emissions are reduced using oxidation catalysts. The principle of the catalyst is that the
methane emissions from the natural gas requires a temperature above 500 °C to oxidizes with catalyst.
Also a higher emission reduction rates can be achieved by adopting other engine technologies [23].
Figure 4. Quallitative trends of NO, CO and HC emissions with fuel/air equivalence ratio of a
spark-ignited engine [4].
7
2 Gas engine combustion
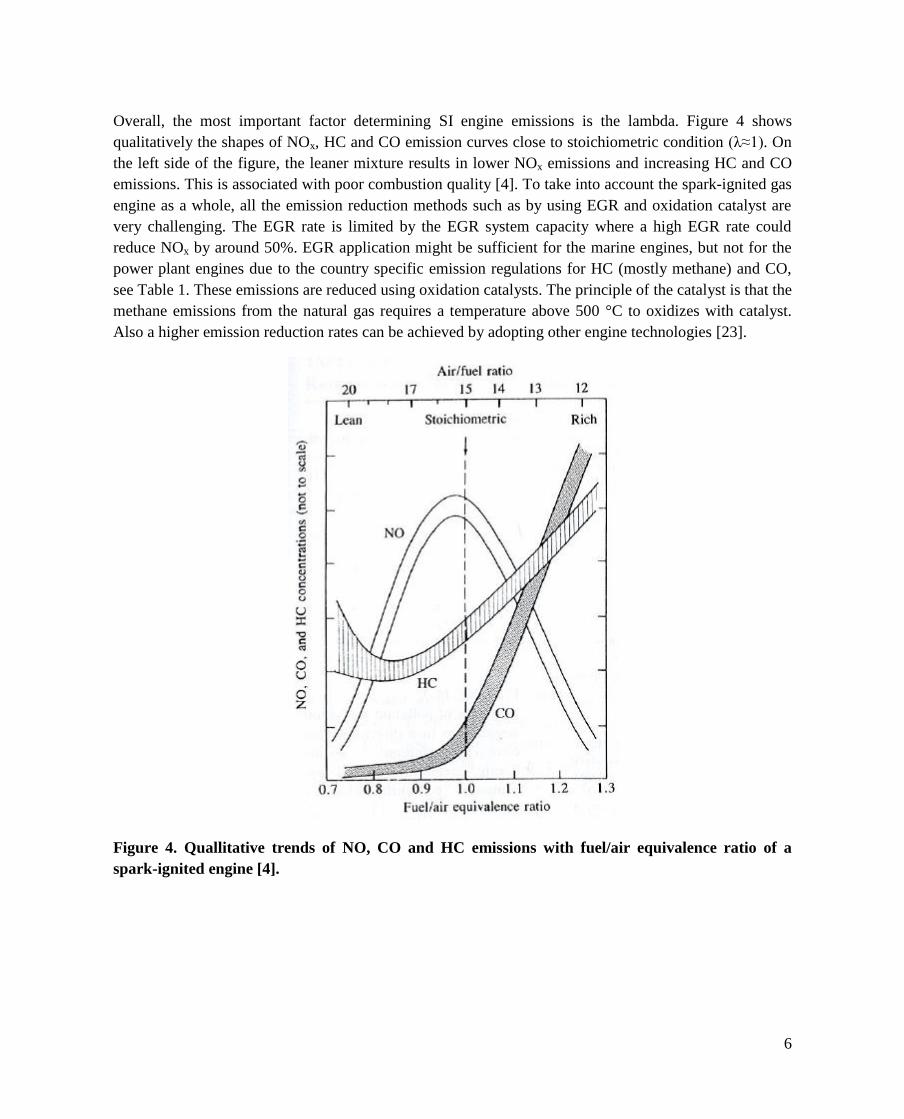
2.1 General concept Lean burn large bore spark-ignited natural gas engines have two individual combustion chambers, the
pre-combustion chamber (PCC) and the main chamber (MC) with seperated gas fuel supplies, see Fig. 5.
The aim is to produce a near stoichiometric air-fuel mixture (λ≈1) inside the PCC, while keeping the MC
mixture lean (λ≈2). The purpose of the lean natural gas combustion is to reduce the NOx emissions and
the specific fuel consumption. Upon spark ignition the PCC pressure increases rapidly, forcing the
burning PCC charge into the MC in the form of jet flames. These ignite the charge, allowing stable and
efficient combustion under lean conditions [24].
Figure 5. The working principle of the W34SG spark-ignited lean burn gas engine [25].
2.2 Pre-combustion chamber The ignition process of the PCC technology has been studied for long time in CI engines. In 1867, Otto
and Langen investigated a high temperature flame torch by products of complete combustion near to
stoichiometric mixture [2]. In 1890, Herbert Akroyd Stuart applied the first PCC technology to the
horizontal hot-bulb oil engine. A separated vaporizer (hot-bulb) is mounted on the cylinder head by the
contracted passage. The air was drawn into the cylinder through the hot-bulb, compressed and then the oil
was sprayed onto the hot-bulb chamber walls where the ignition occurs. The burning charge from hot-
bulb proceeded into the cylinder forcing the piston outward on the power stroke. After this, a poppet
exhaust valve was opened by a cam turning at half engine speed [2]. Later on in 1903, Grdina [26]
reported a flame transfer from the PCC with stratified charge described by Ricardo in 1916 [27]
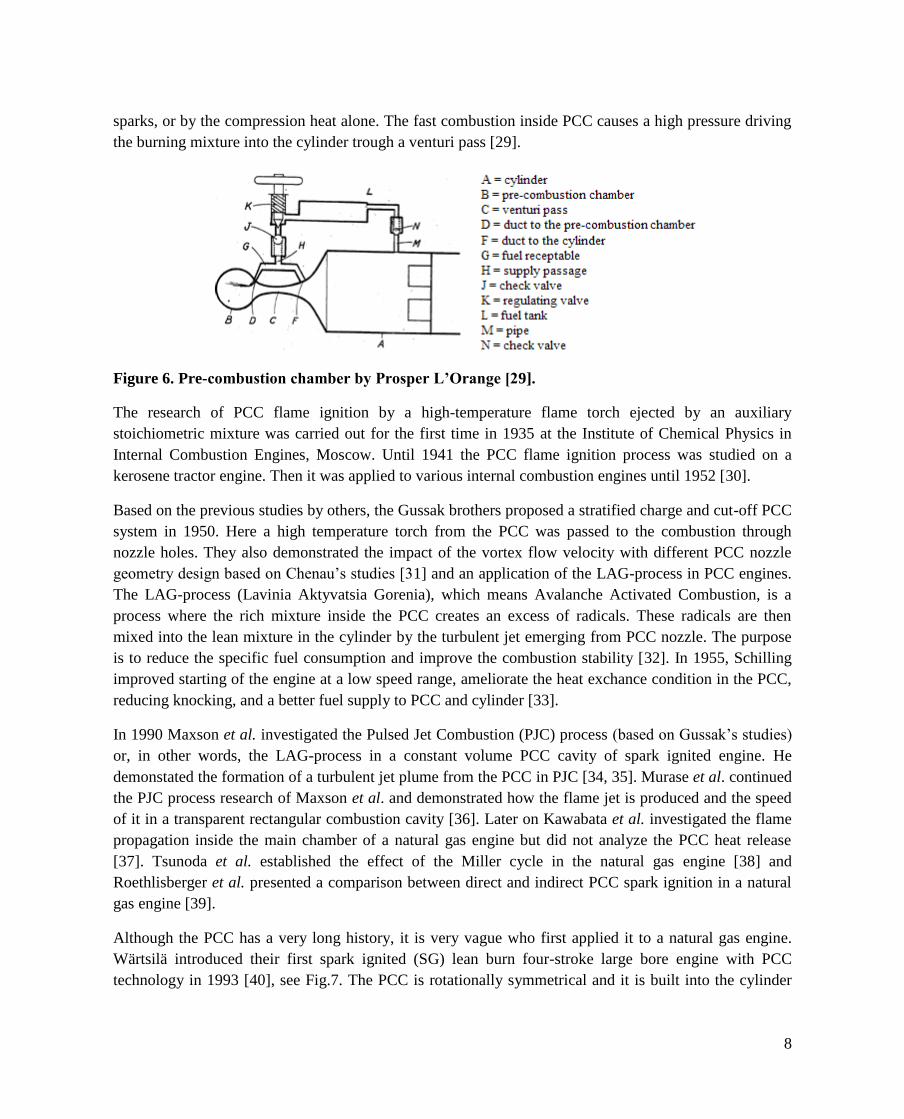
Meanwhile, L’Orange patented the first PCC technology for diesel engines in 1909 [28], see Fig. 6. A
semispherical PCC which is 20 % of the total cylinder volume is connected to the cylinder by a venturi
passage. The diesel-air mixture is injected separately into the both PCC and cylinder from the fuel
receptacle through a duct. The fuel receptacle receives fuel from a tank through a regulating valve and a
supply passage controlled by a check valve. The fuel tank is also connected to the cylinder through a
check valve and a pipe. Therefore, the gas pressure is applied to the tank for feeding fuel into the
receptacle. The combustion is taking place inside the PCC by heating the chamber wall, by electric
8
sparks, or by the compression heat alone. The fast combustion inside PCC causes a high pressure driving
the burning mixture into the cylinder trough a venturi pass [29].
Figure 6. Pre-combustion chamber by Prosper L’Orange [29].
The research of PCC flame ignition by a high-temperature flame torch ejected by an auxiliary
stoichiometric mixture was carried out for the first time in 1935 at the Institute of Chemical Physics in
Internal Combustion Engines, Moscow. Until 1941 the PCC flame ignition process was studied on a
kerosene tractor engine. Then it was applied to various internal combustion engines until 1952 [30].
Based on the previous studies by others, the Gussak brothers proposed a stratified charge and cut-off PCC
system in 1950. Here a high temperature torch from the PCC was passed to the combustion through
nozzle holes. They also demonstrated the impact of the vortex flow velocity with different PCC nozzle
geometry design based on Chenau’s studies [31] and an application of the LAG-process in PCC engines.
The LAG-process (Lavinia Aktyvatsia Gorenia), which means Avalanche Activated Combustion, is a
process where the rich mixture inside the PCC creates an excess of radicals. These radicals are then
mixed into the lean mixture in the cylinder by the turbulent jet emerging from PCC nozzle. The purpose
is to reduce the specific fuel consumption and improve the combustion stability [32]. In 1955, Schilling
improved starting of the engine at a low speed range, ameliorate the heat exchance condition in the PCC,
reducing knocking, and a better fuel supply to PCC and cylinder [33].
In 1990 Maxson et al. investigated the Pulsed Jet Combustion (PJC) process (based on Gussak’s studies)
or, in other words, the LAG-process in a constant volume PCC cavity of spark ignited engine. He
demonstated the formation of a turbulent jet plume from the PCC in PJC [34, 35]. Murase et al. continued
the PJC process research of Maxson et al. and demonstrated how the flame jet is produced and the speed
of it in a transparent rectangular combustion cavity [36]. Later on Kawabata et al. investigated the flame
propagation inside the main chamber of a natural gas engine but did not analyze the PCC heat release
[37]. Tsunoda et al. established the effect of the Miller cycle in the natural gas engine [38] and
Roethlisberger et al. presented a comparison between direct and indirect PCC spark ignition in a natural
gas engine [39].
Although the PCC has a very long history, it is very vague who first applied it to a natural gas engine.
Wärtsilä introduced their first spark ignited (SG) lean burn four-stroke large bore engine with PCC
technology in 1993 [40], see Fig.7. The PCC is rotationally symmetrical and it is built into the cylinder
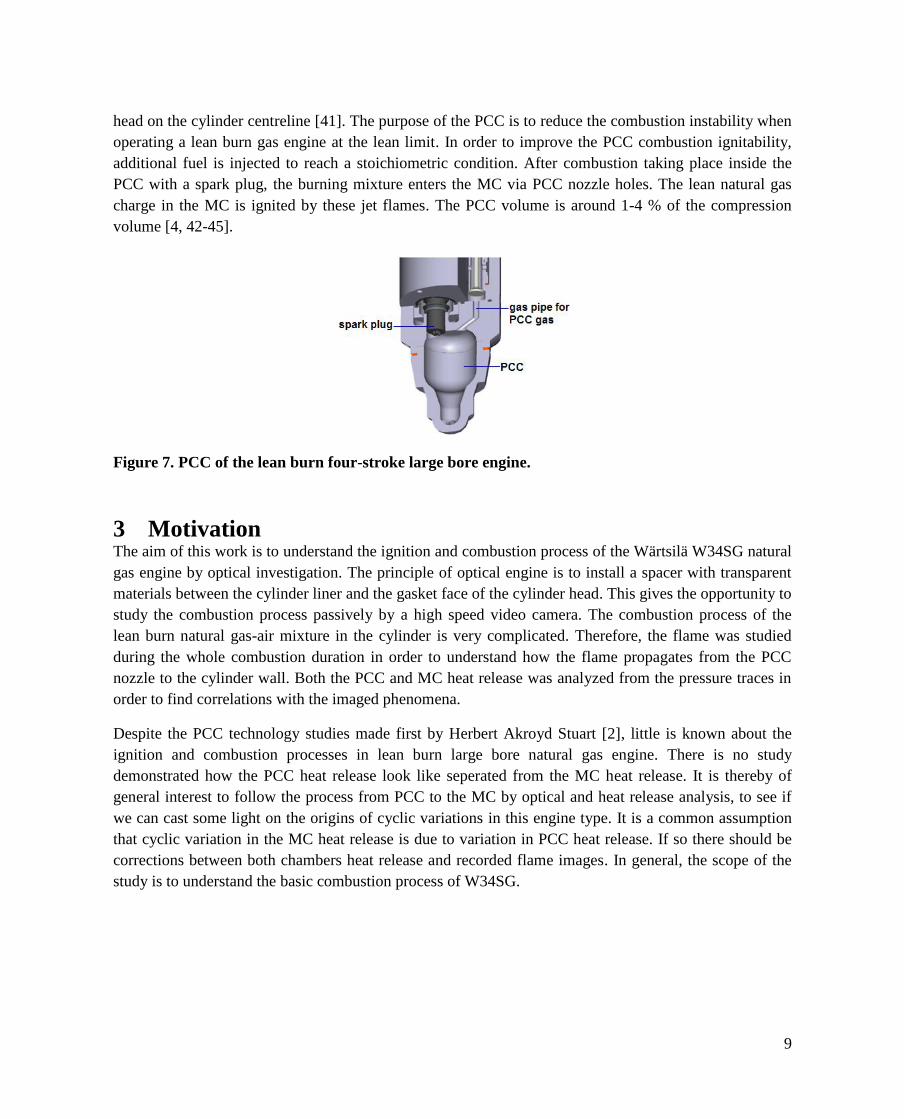
9
head on the cylinder centreline [41]. The purpose of the PCC is to reduce the combustion instability when
operating a lean burn gas engine at the lean limit. In order to improve the PCC combustion ignitability,
additional fuel is injected to reach a stoichiometric condition. After combustion taking place inside the
PCC with a spark plug, the burning mixture enters the MC via PCC nozzle holes. The lean natural gas
charge in the MC is ignited by these jet flames. The PCC volume is around 1-4 % of the compression
volume [4, 42-45].
Figure 7. PCC of the lean burn four-stroke large bore engine.
3 Motivation The aim of this work is to understand the ignition and combustion process of the Wärtsilä W34SG natural
gas engine by optical investigation. The principle of optical engine is to install a spacer with transparent
materials between the cylinder liner and the gasket face of the cylinder head. This gives the opportunity to
study the combustion process passively by a high speed video camera. The combustion process of the
lean burn natural gas-air mixture in the cylinder is very complicated. Therefore, the flame was studied
during the whole combustion duration in order to understand how the flame propagates from the PCC
nozzle to the cylinder wall. Both the PCC and MC heat release was analyzed from the pressure traces in
order to find correlations with the imaged phenomena.
Despite the PCC technology studies made first by Herbert Akroyd Stuart [2], little is known about the
ignition and combustion processes in lean burn large bore natural gas engine. There is no study
demonstrated how the PCC heat release look like seperated from the MC heat release. It is thereby of
general interest to follow the process from PCC to the MC by optical and heat release analysis, to see if
we can cast some light on the origins of cyclic variations in this engine type. It is a common assumption
that cyclic variation in the MC heat release is due to variation in PCC heat release. If so there should be
corrections between both chambers heat release and recorded flame images. In general, the scope of the
study is to understand the basic combustion process of W34SG.
10
4 Engine experiments
4.1 Test engine The four stroke lean-burn natural gas engine used in the present experiments has been built from
beginning to end into a single cylinder engine (SCE). One of the great advantages of SCE engine is to
have a cost efficient in engine performance testing. Also a flexible fundamental investigation on different
combustion concepts, i.g. diesel and dual fuel (DF) conceps. SCE engine is also modified for the optical
access to understand the in-cylinder combustion process of the metal SCE engine. The engine
specification is shown in Table 2. The engine speed is 750 rpm, typical for 50 Hz genset applications. The
engine is optimized to deliver about 500kW/cylinder [9].
Table 2. Engine specification of SCE engine
Engine type W34SG Cycle 4-stroke Combustion type Lean burn Number of intake valves 2 Number of exhaust valves 2 Bore 340 mm Stroke 400 mm Displaced volume 36.3 L
Speed 750 rpm Output 500 kW
kW/cylinder Compression ratio 11
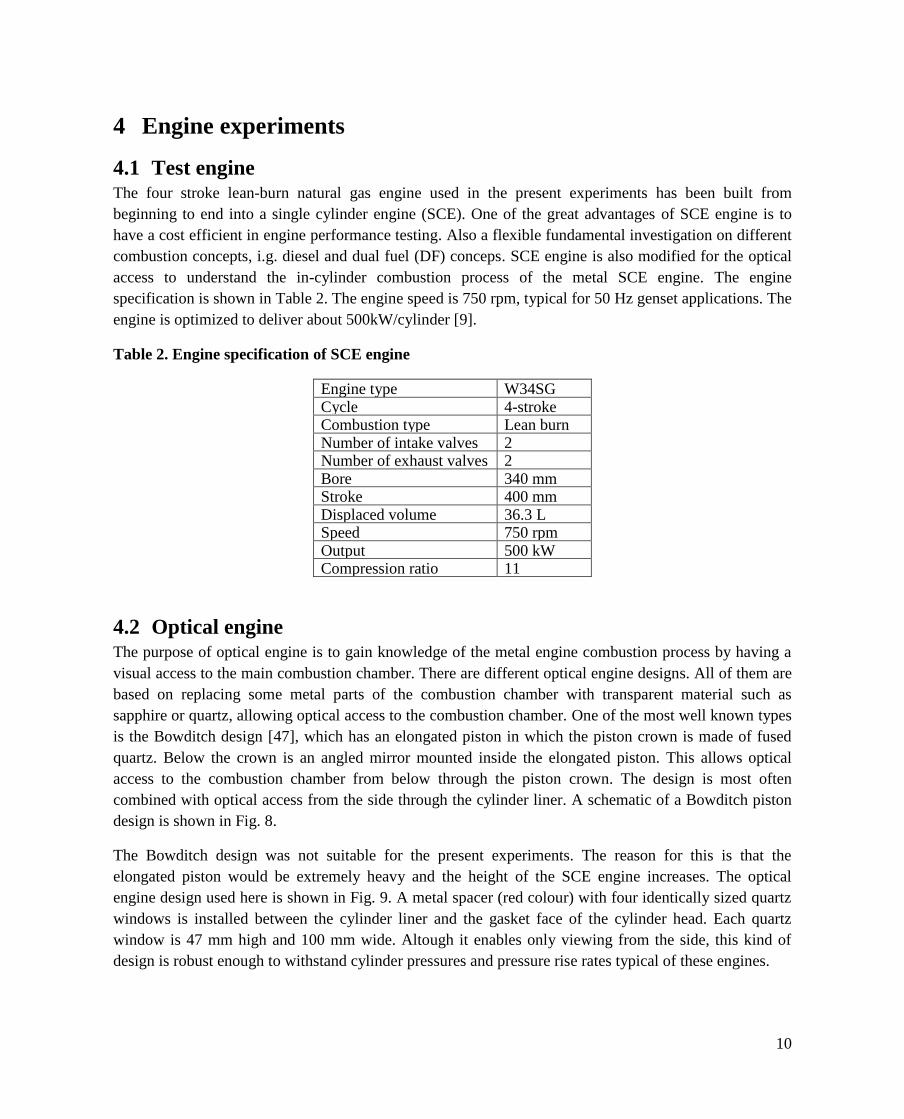
4.2 Optical engine The purpose of optical engine is to gain knowledge of the metal engine combustion process by having a
visual access to the main combustion chamber. There are different optical engine designs. All of them are
based on replacing some metal parts of the combustion chamber with transparent material such as
sapphire or quartz, allowing optical access to the combustion chamber. One of the most well known types
is the Bowditch design [47], which has an elongated piston in which the piston crown is made of fused
quartz. Below the crown is an angled mirror mounted inside the elongated piston. This allows optical
access to the combustion chamber from below through the piston crown. The design is most often
combined with optical access from the side through the cylinder liner. A schematic of a Bowditch piston
design is shown in Fig. 8.
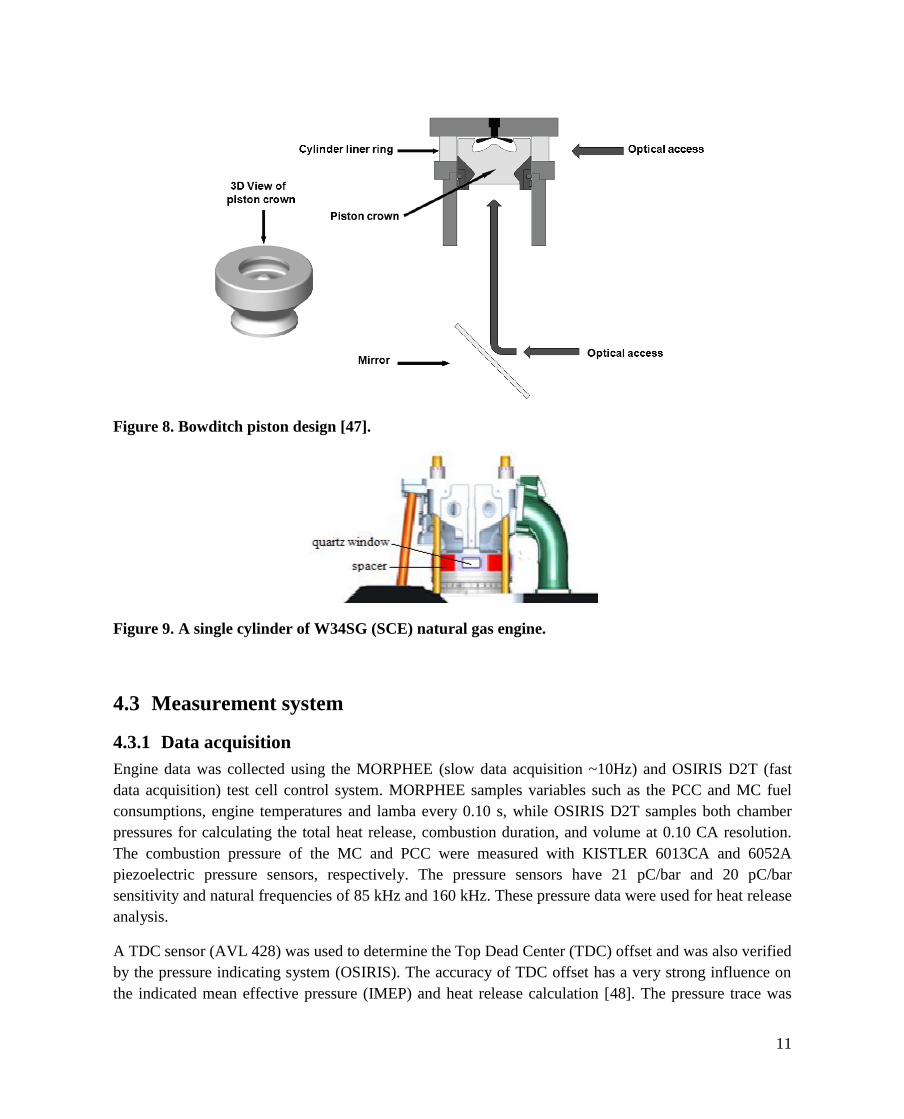
The Bowditch design was not suitable for the present experiments. The reason for this is that the
elongated piston would be extremely heavy and the height of the SCE engine increases. The optical
engine design used here is shown in Fig. 9. A metal spacer (red colour) with four identically sized quartz
windows is installed between the cylinder liner and the gasket face of the cylinder head. Each quartz
window is 47 mm high and 100 mm wide. Altough it enables only viewing from the side, this kind of
design is robust enough to withstand cylinder pressures and pressure rise rates typical of these engines.
11
Figure 8. Bowditch piston design [47].
Figure 9. A single cylinder of W34SG (SCE) natural gas engine.
4.3 Measurement system
4.3.1 Data acquisition
Engine data was collected using the MORPHEE (slow data acquisition ~10Hz) and OSIRIS D2T (fast
data acquisition) test cell control system. MORPHEE samples variables such as the PCC and MC fuel
consumptions, engine temperatures and lamba every 0.10 s, while OSIRIS D2T samples both chamber
pressures for calculating the total heat release, combustion duration, and volume at 0.10 CA resolution.
The combustion pressure of the MC and PCC were measured with KISTLER 6013CA and 6052A
piezoelectric pressure sensors, respectively. The pressure sensors have 21 pC/bar and 20 pC/bar
sensitivity and natural frequencies of 85 kHz and 160 kHz. These pressure data were used for heat release
analysis.
A TDC sensor (AVL 428) was used to determine the Top Dead Center (TDC) offset and was also verified
by the pressure indicating system (OSIRIS). The accuracy of TDC offset has a very strong influence on
the indicated mean effective pressure (IMEP) and heat release calculation [48]. The pressure trace was
12
pegged to the intake pressure, assuming that the cylinder pressure is equal to the intake pressure in a
crank angle window near the BDC during the intake stroke.
4.3.2 Camera systems
A high speed video camera, Photron fastcam SA5, was used to capture the combustion process from the
PCC to the MC frame by frame. The camera was operated at 20000 Hz with the engine speed of 750 rpm
taking 4.4 images per CAD. At this framing rate, image resolution was set to 960 x 392 pixels. Exposure
times varied between 11.4-49.8 μs depending on the signal strength. The camera can be also used in
combination with image intensifier to get shorter exposure times with less smearing of the image. For all
cases no additional filters or image intensifier were used.
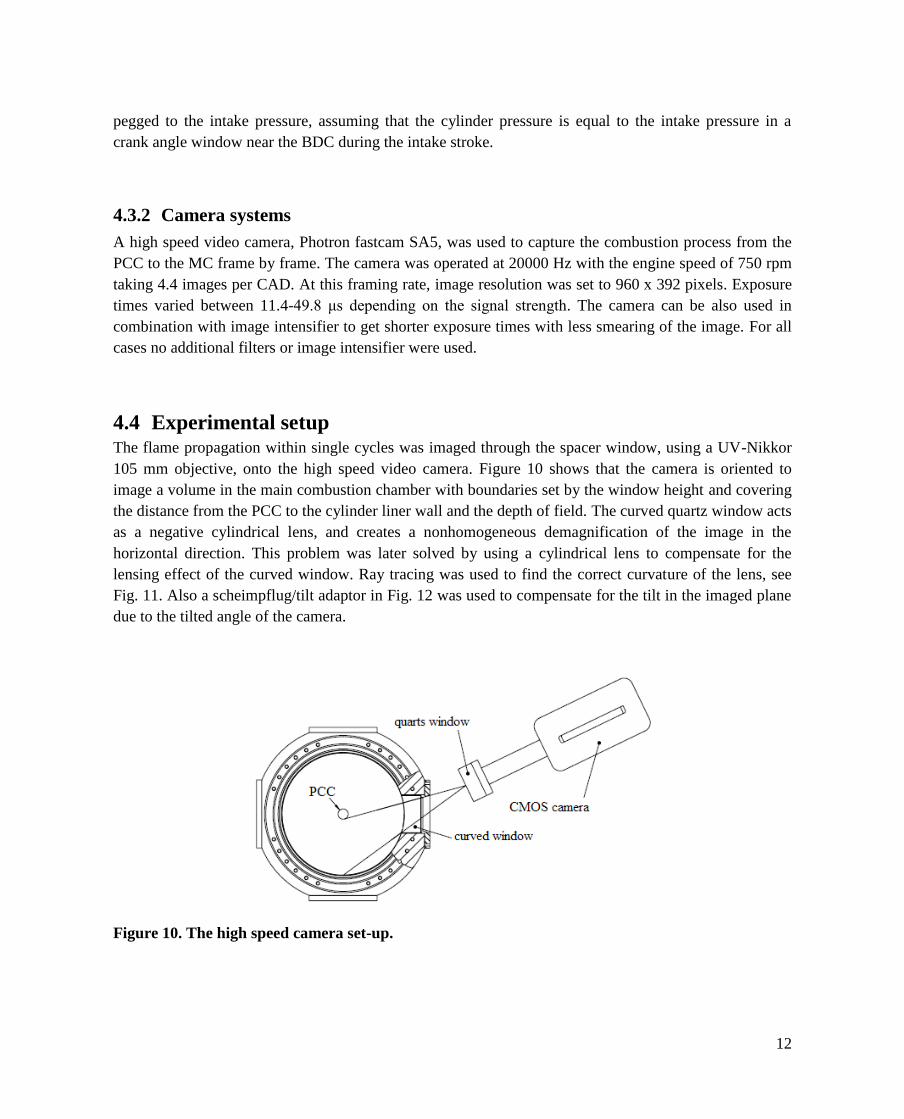
4.4 Experimental setup The flame propagation within single cycles was imaged through the spacer window, using a UV-Nikkor
105 mm objective, onto the high speed video camera. Figure 10 shows that the camera is oriented to
image a volume in the main combustion chamber with boundaries set by the window height and covering
the distance from the PCC to the cylinder liner wall and the depth of field. The curved quartz window acts
as a negative cylindrical lens, and creates a nonhomogeneous demagnification of the image in the
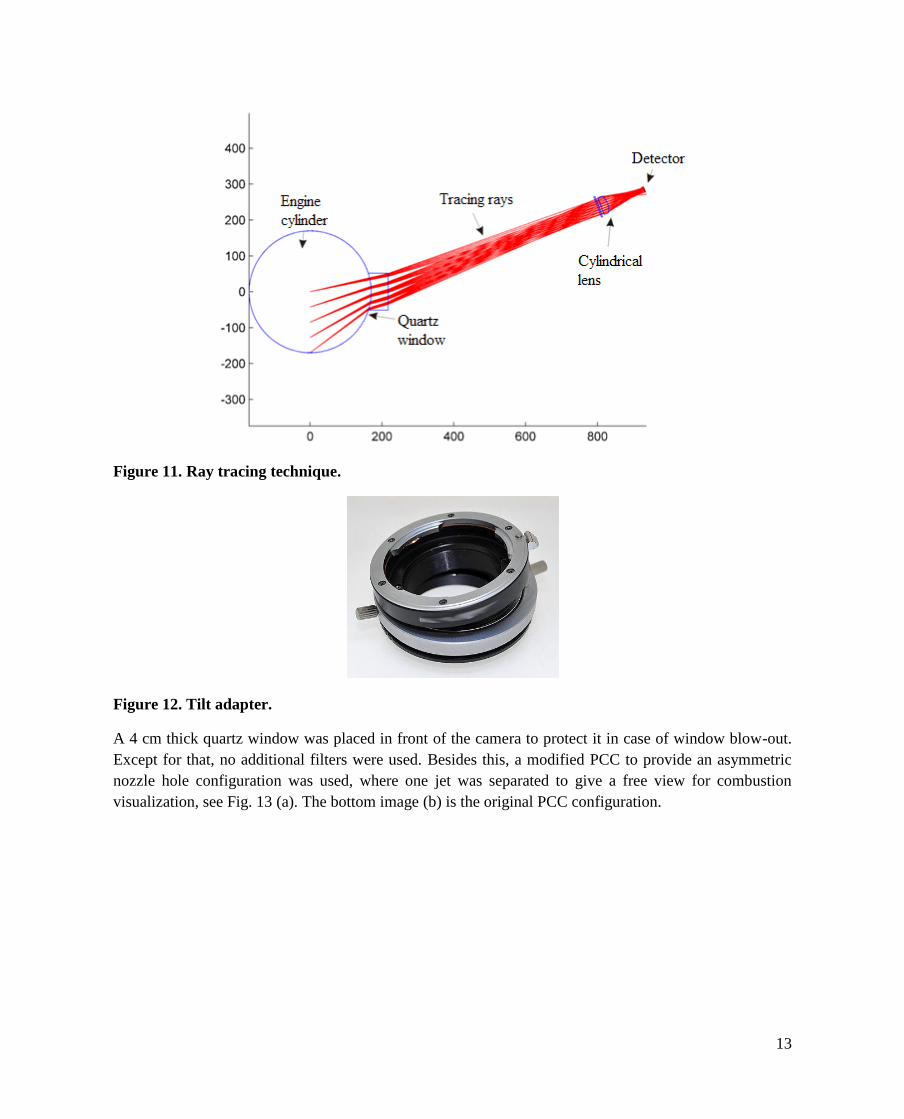
horizontal direction. This problem was later solved by using a cylindrical lens to compensate for the
lensing effect of the curved window. Ray tracing was used to find the correct curvature of the lens, see
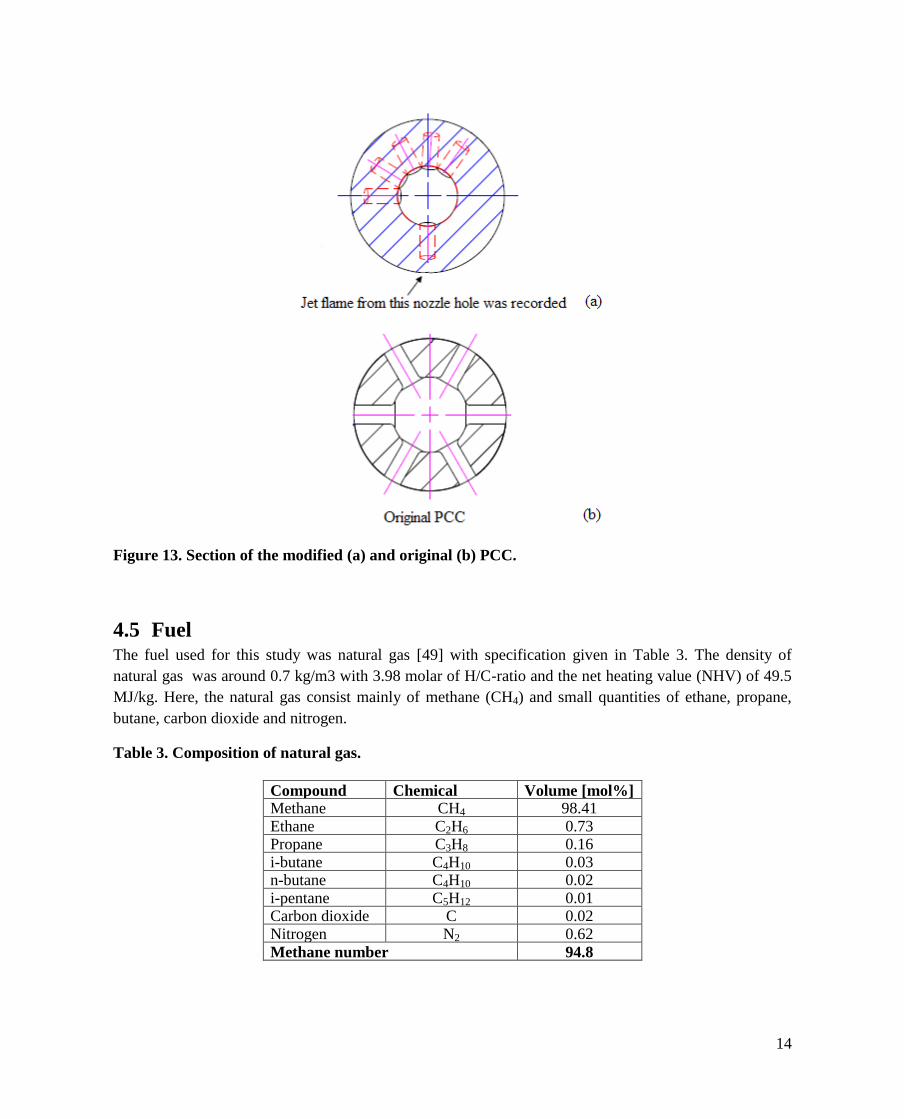
Fig. 11. Also a scheimpflug/tilt adaptor in Fig. 12 was used to compensate for the tilt in the imaged plane
due to the tilted angle of the camera.
Figure 10. The high speed camera set-up.
13
Figure 11. Ray tracing technique.
Figure 12. Tilt adapter.
A 4 cm thick quartz window was placed in front of the camera to protect it in case of window blow-out.
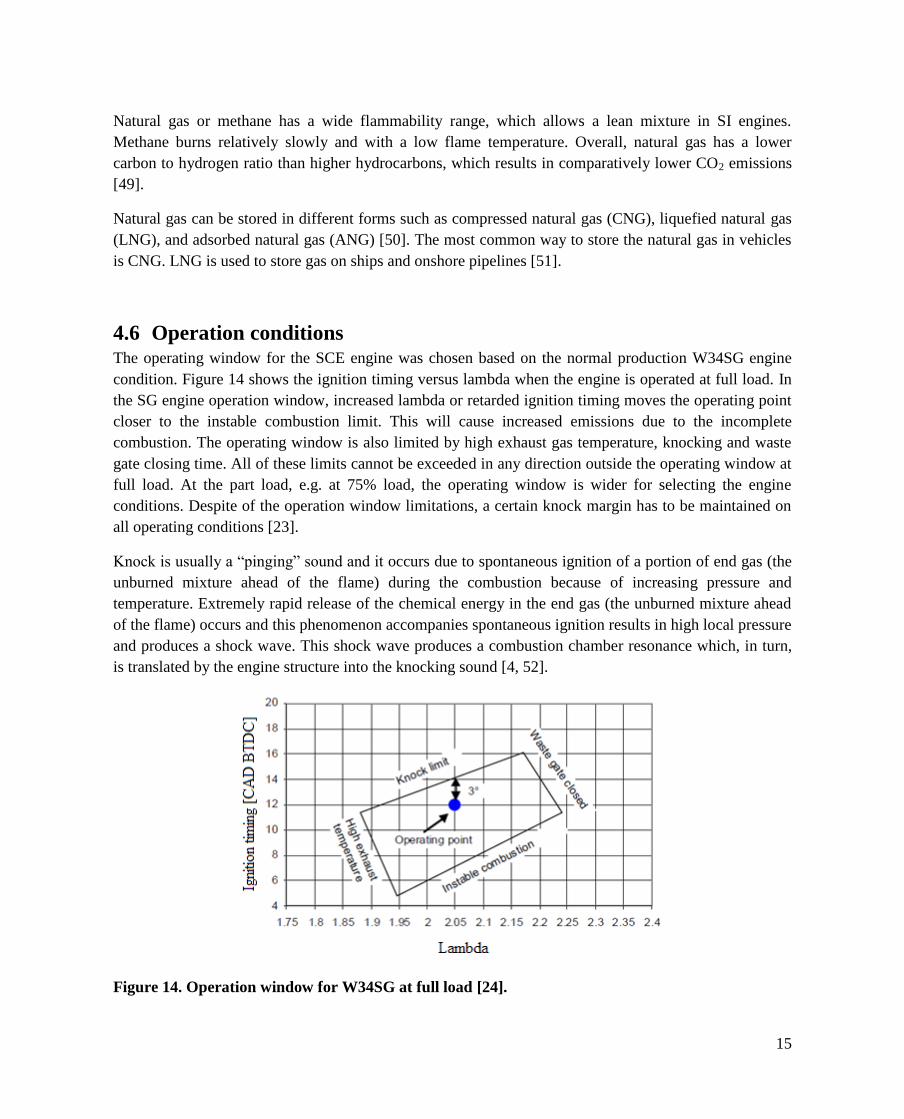
Except for that, no additional filters were used. Besides this, a modified PCC to provide an asymmetric
nozzle hole configuration was used, where one jet was separated to give a free view for combustion
visualization, see Fig. 13 (a). The bottom image (b) is the original PCC configuration.
14
Figure 13. Section of the modified (a) and original (b) PCC.
4.5 Fuel The fuel used for this study was natural gas [49] with specification given in Table 3. The density of
natural gas was around 0.7 kg/m3 with 3.98 molar of H/C-ratio and the net heating value (NHV) of 49.5
MJ/kg. Here, the natural gas consist mainly of methane (CH4) and small quantities of ethane, propane,
butane, carbon dioxide and nitrogen.
Table 3. Composition of natural gas.
Compound Chemical
Formula
ForFormula
Volume [mol%] Methane CH4 98.41 Ethane C2H6 0.73 Propane C3H8 0.16 i-butane C4H10 0.03 n-butane C4H10 0.02 i-pentane C5H12 0.01 Carbon dioxide C 0.02 Nitrogen N2 0.62
Methane number 94.8
15
Natural gas or methane has a wide flammability range, which allows a lean mixture in SI engines.
Methane burns relatively slowly and with a low flame temperature. Overall, natural gas has a lower
carbon to hydrogen ratio than higher hydrocarbons, which results in comparatively lower CO2 emissions
[49].
Natural gas can be stored in different forms such as compressed natural gas (CNG), liquefied natural gas
(LNG), and adsorbed natural gas (ANG) [50]. The most common way to store the natural gas in vehicles
is CNG. LNG is used to store gas on ships and onshore pipelines [51].
4.6 Operation conditions The operating window for the SCE engine was chosen based on the normal production W34SG engine
condition. Figure 14 shows the ignition timing versus lambda when the engine is operated at full load. In
the SG engine operation window, increased lambda or retarded ignition timing moves the operating point
closer to the instable combustion limit. This will cause increased emissions due to the incomplete
combustion. The operating window is also limited by high exhaust gas temperature, knocking and waste
gate closing time. All of these limits cannot be exceeded in any direction outside the operating window at
full load. At the part load, e.g. at 75% load, the operating window is wider for selecting the engine
conditions. Despite of the operation window limitations, a certain knock margin has to be maintained on
all operating conditions [23].
Knock is usually a “pinging” sound and it occurs due to spontaneous ignition of a portion of end gas (the
unburned mixture ahead of the flame) during the combustion because of increasing pressure and
temperature. Extremely rapid release of the chemical energy in the end gas (the unburned mixture ahead
of the flame) occurs and this phenomenon accompanies spontaneous ignition results in high local pressure
and produces a shock wave. This shock wave produces a combustion chamber resonance which, in turn,
is translated by the engine structure into the knocking sound [4, 52].
Figure 14. Operation window for W34SG at full load [24].
16
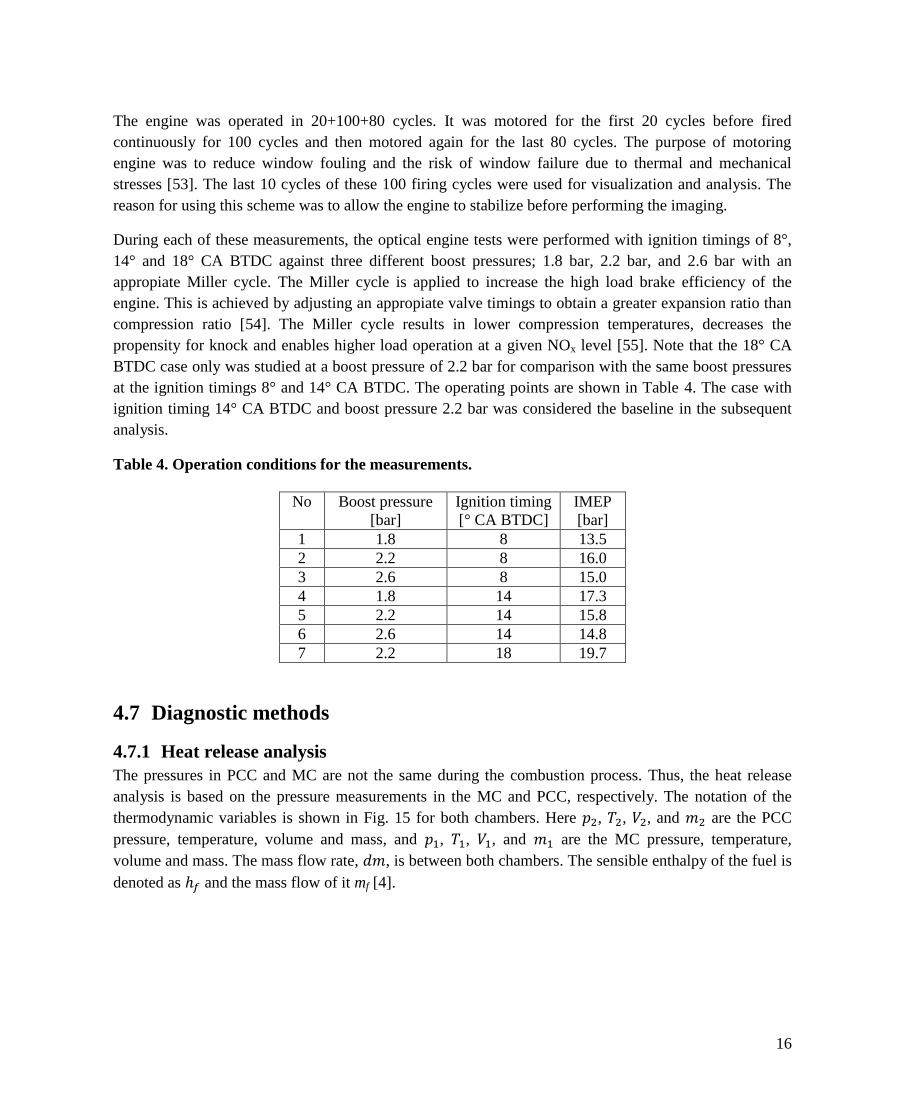
The engine was operated in 20+100+80 cycles. It was motored for the first 20 cycles before fired
continuously for 100 cycles and then motored again for the last 80 cycles. The purpose of motoring
engine was to reduce window fouling and the risk of window failure due to thermal and mechanical
stresses [53]. The last 10 cycles of these 100 firing cycles were used for visualization and analysis. The
reason for using this scheme was to allow the engine to stabilize before performing the imaging.
During each of these measurements, the optical engine tests were performed with ignition timings of 8°,
14° and 18° CA BTDC against three different boost pressures; 1.8 bar, 2.2 bar, and 2.6 bar with an
appropiate Miller cycle. The Miller cycle is applied to increase the high load brake efficiency of the
engine. This is achieved by adjusting an appropiate valve timings to obtain a greater expansion ratio than
compression ratio [54]. The Miller cycle results in lower compression temperatures, decreases the
propensity for knock and enables higher load operation at a given NOx level [55]. Note that the 18° CA
BTDC case only was studied at a boost pressure of 2.2 bar for comparison with the same boost pressures
at the ignition timings 8° and 14° CA BTDC. The operating points are shown in Table 4. The case with
ignition timing 14° CA BTDC and boost pressure 2.2 bar was considered the baseline in the subsequent
analysis.
Table 4. Operation conditions for the measurements.
No Boost pressure
[bar]
Ignition timing
[° CA BTDC]
IMEP
[bar]
1 1.8 8 13.5
2 2.2 8 16.0
3 2.6 8 15.0
4 1.8 14 17.3
5 2.2 14 15.8
6 2.6 14 14.8
7 2.2 18 19.7
4.7 Diagnostic methods
4.7.1 Heat release analysis
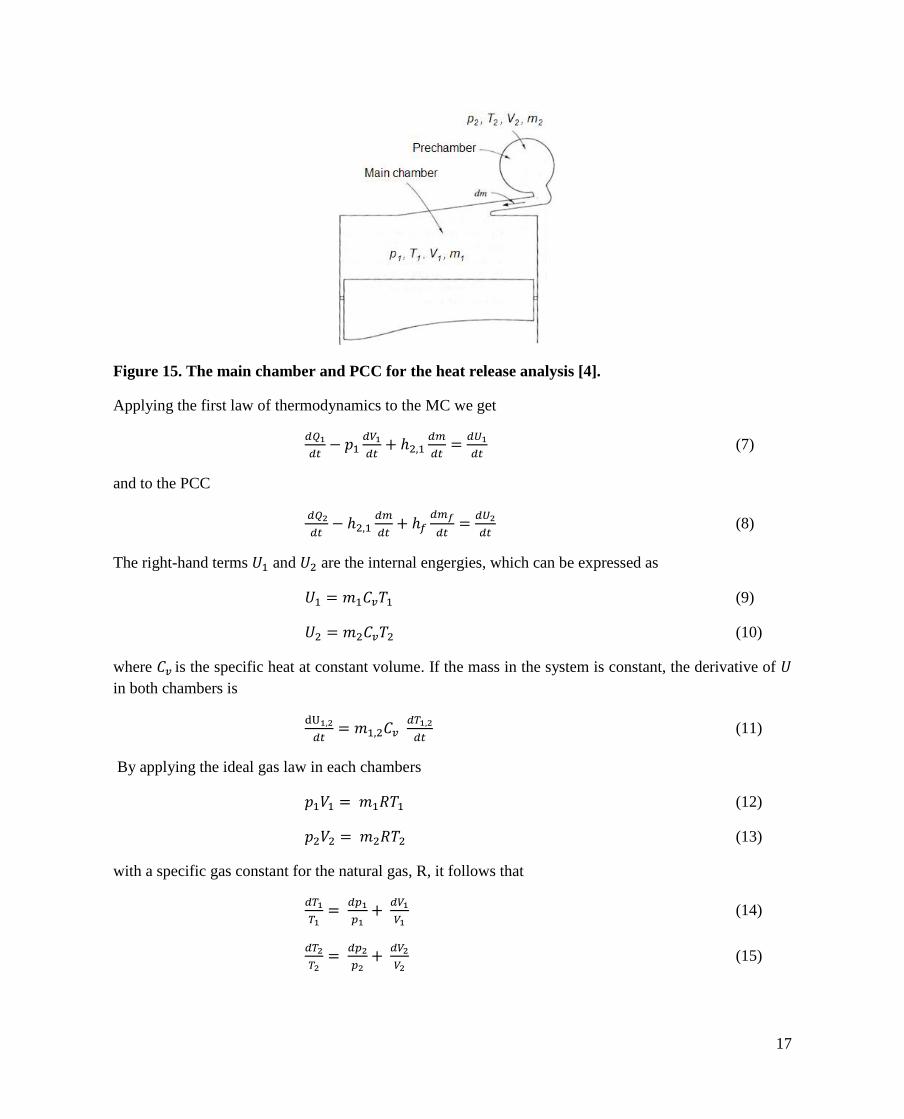
The pressures in PCC and MC are not the same during the combustion process. Thus, the heat release
analysis is based on the pressure measurements in the MC and PCC, respectively. The notation of the
thermodynamic variables is shown in Fig. 15 for both chambers. Here , , , and are the PCC
pressure, temperature, volume and mass, and , , , and are the MC pressure, temperature,
volume and mass. The mass flow rate, , is between both chambers. The sensible enthalpy of the fuel is
denoted as and the mass flow of it mf [4].
17
Figure 15. The main chamber and PCC for the heat release analysis [4].
Applying the first law of thermodynamics to the MC we get
(7)
and to the PCC
(8)
The right-hand terms and are the internal engergies, which can be expressed as
(9)
(10)
where is the specific heat at constant volume. If the mass in the system is constant, the derivative of
in both chambers is
(11)
By applying the ideal gas law in each chambers
(12)
(13)
with a specific gas constant for the natural gas, R, it follows that
(14)
(15)
18
Using Eqs. (14) and (15), and can be eliminated from Eqs. (12) and (13) to obtain the time
derivative of for the MC
(16)
and for the constant volume PCC
(17)
The specific gas constant can be stated as
(18)
The specific heat ratio is obtained using the Gatowski model [56]
(19)
where γ0 is a reference value, K1 is a constant (0.08) and Tref is a reference temperature (300 K).
For the mass flow rate [57], , calculation through the PCC nozzle to the MC, the discharge coefficient
Cd was stated as
(20)
Where C is flow coefficient and beta factor
is based on height of the nozzle d1, and diameter of
nozzle d2. If the flow is ideal, and can be expressed as
(21)
By introducing the Mach number
, where is the speed of sound [52] in an ideal gas is given by
(22)
where γ is the specific heat ratio (see Eq. (19)), p is the PCC pressure trace ( ), and ρ is the density.
or
(23)
The right-hand term of Eq. (21) can be rewritten as
(24)
19
The mass flow rate can be rearranged as
(25)
where AT is the area of the nozzle holes. Since the discharge coefficient is introduced, the mass flow rate
through the PCC nozzle to the MC is
(26)
If in Eqs. (7) and (8) the derivative of the mass flow rate,
, is greater than zero then ,
otherwise . Also if the mass is flowing out of the PCC into the MC, the PCC gas temperature T2
is used, and vice versa [58]. Since no fuel is added to the system during the closed cycle, the term
due to . Thus, the Eqs. (16) and (17) can be used to write Eqs. (7) and (8) as
(27)
(28)
The PCC heat release rate in Eq. (28) is different because the PCC volume V2 is fixed, so there are no
terms that involve volume change. The specific heat capacity cp is evaluated assuming the mixture of air
and natural gas properties in the MC and PCC. The mass flow and flow direction between the PCC and
MC are estimated by Eq. (26) from the pressure difference between the PCC and MC. The total net
(apparent) heat release in the both MC and PCC is
(29)
The apparent heat release as a function of crank angle degree (CAD), θ, can be rewritten as
(30)
(31)
(32)
There is also convective heat transfer to the wall which should be taken into account in the heat release
calculation. Assuming a uniform and constant wall temperature
(33)
20
where, is the wall area, is the mean gas temperature, is the mean wall temperature, is
the heat transfer coefficient. The following is developed by Woschni
(34)
with a constant, , the cylinder bore, , and a characteristic speed given by
(35)
where and are constants, is the mean piston speed, is the displacement volume, , and
are the temperature, pressure and volume at inlet valve closing (IVC), is the pressure during
combustion and is the pressure during a motored cycle [4].
There are some challenges in heat release calculations. First, how much unburned mass has flowed
between PCC and MC before the combustion starts inside PCC. Second, the Woschni model cannot apply
to the constant PCC volume. Thus, the apparent heat release Eqs. (30) and (31) are the basis for the heat
release calculations in this thesis. In the overall model, pressure, volume, temperature and specific heat
ratio of the MC and the PCC are not the same.
4.7.2 Optical diagnostics
Optical diagnostics can be devided into passive and active diagnostics. In passive optical diagnostics,
light emitted spontaneously during combustion is imaged with a camera. The imaged signal could for
example be chemiluminescence, which is light emitted as a result of a chemical reaction. Active optical
diagnostics are based on generating a signal from a species of interest, for example using a laser. The
advantage of using lasers is that they make it possible to study a greater selection of parameters than
passive diagnostics do, such as certain species concentrations, local temperatures, flow velocities, and
particle distributions. The disadvantage are the cost of the laser equipment and the complexity of using it
[59, 60]. The most widely used technique in active optical diagnostics for species detection is laser-
induced flourence (LIF), which is based on detection of the emissions from molecules that have been
excited to higher energy levels by laser radiation [61].
Passive optical diagnostic have been used in the work of this thesis to understand the basic combustion
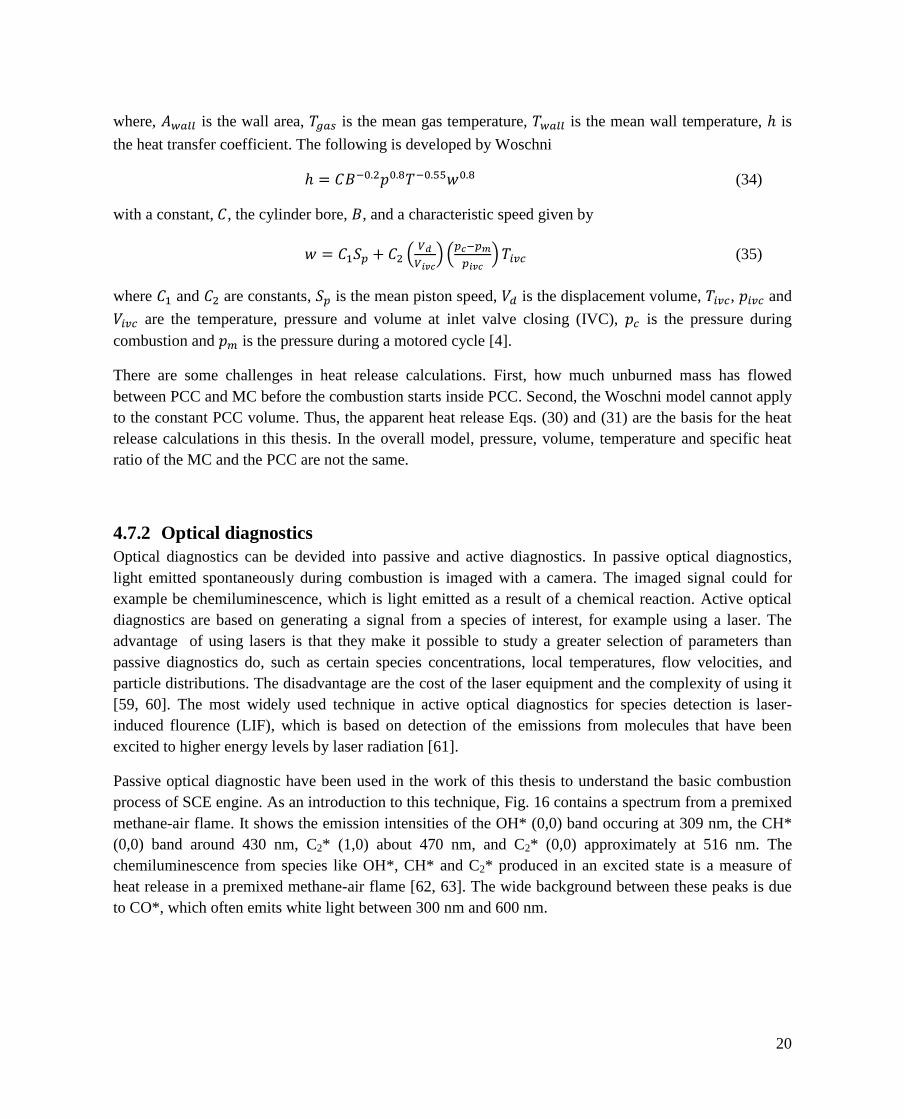
process of SCE engine. As an introduction to this technique, Fig. 16 contains a spectrum from a premixed
methane-air flame. It shows the emission intensities of the OH* (0,0) band occuring at 309 nm, the CH*
(0,0) band around 430 nm, C2* (1,0) about 470 nm, and C2* (0,0) approximately at 516 nm. The
chemiluminescence from species like OH*, CH* and C2* produced in an excited state is a measure of
heat release in a premixed methane-air flame [62, 63]. The wide background between these peaks is due
to CO*, which often emits white light between 300 nm and 600 nm.
21
Figure 16. The emission intensity in a premixed methane-air flame [62].
Since the use of interference filters centered at the emission wavelengths of typical light emitting species
showed no good effect due to limited energy loss by the molecule prior to emission, we can suppose that
there is quite substantial contribution from CO* (at high pressure) in the recorded flame images. Apart
from this, we can also assume that mainly CH* spectrum chemiluminescence (blue colour) is seen in the
recorded flame images as the camera is not UV sensitive. Nevertheless, both CO* and CH* are good
markers of zones where heat release occurs.
4.7.3 Image processing
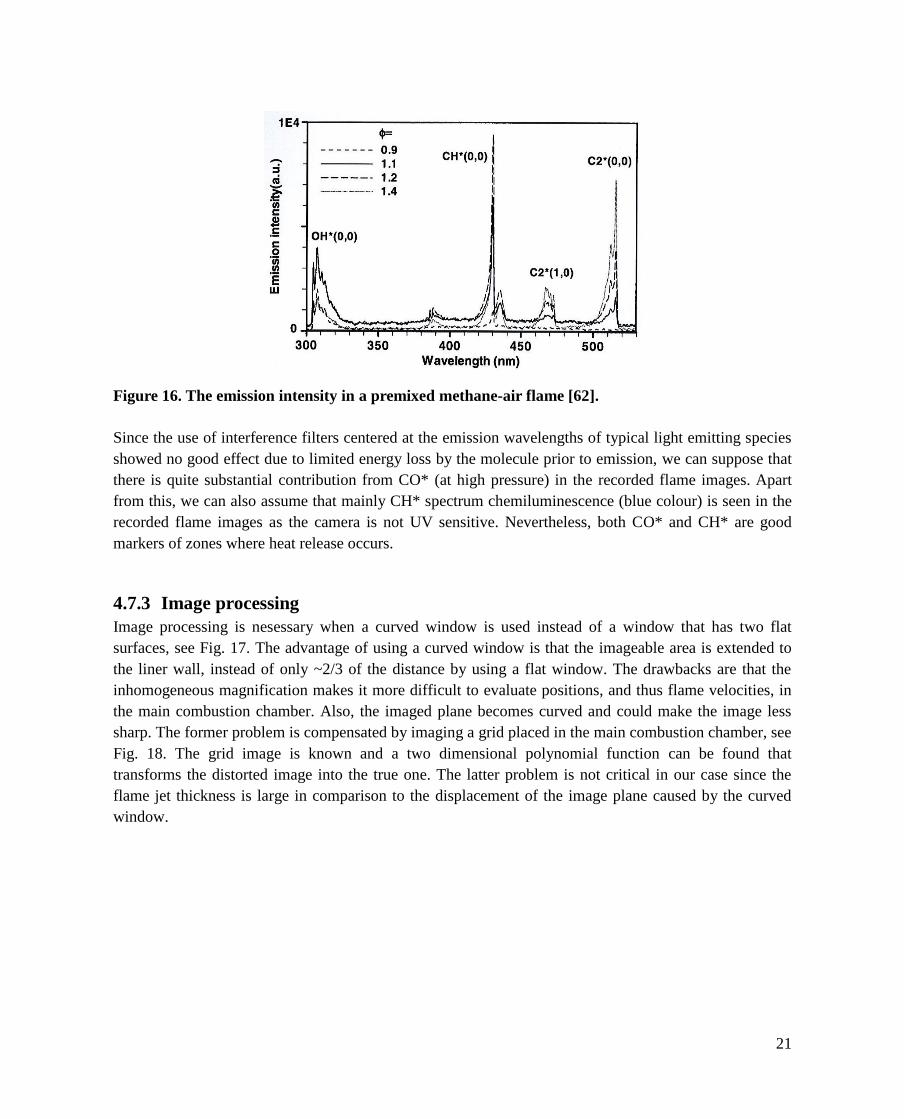
Image processing is nesessary when a curved window is used instead of a window that has two flat
surfaces, see Fig. 17. The advantage of using a curved window is that the imageable area is extended to
the liner wall, instead of only ~2/3 of the distance by using a flat window. The drawbacks are that the
inhomogeneous magnification makes it more difficult to evaluate positions, and thus flame velocities, in
the main combustion chamber. Also, the imaged plane becomes curved and could make the image less
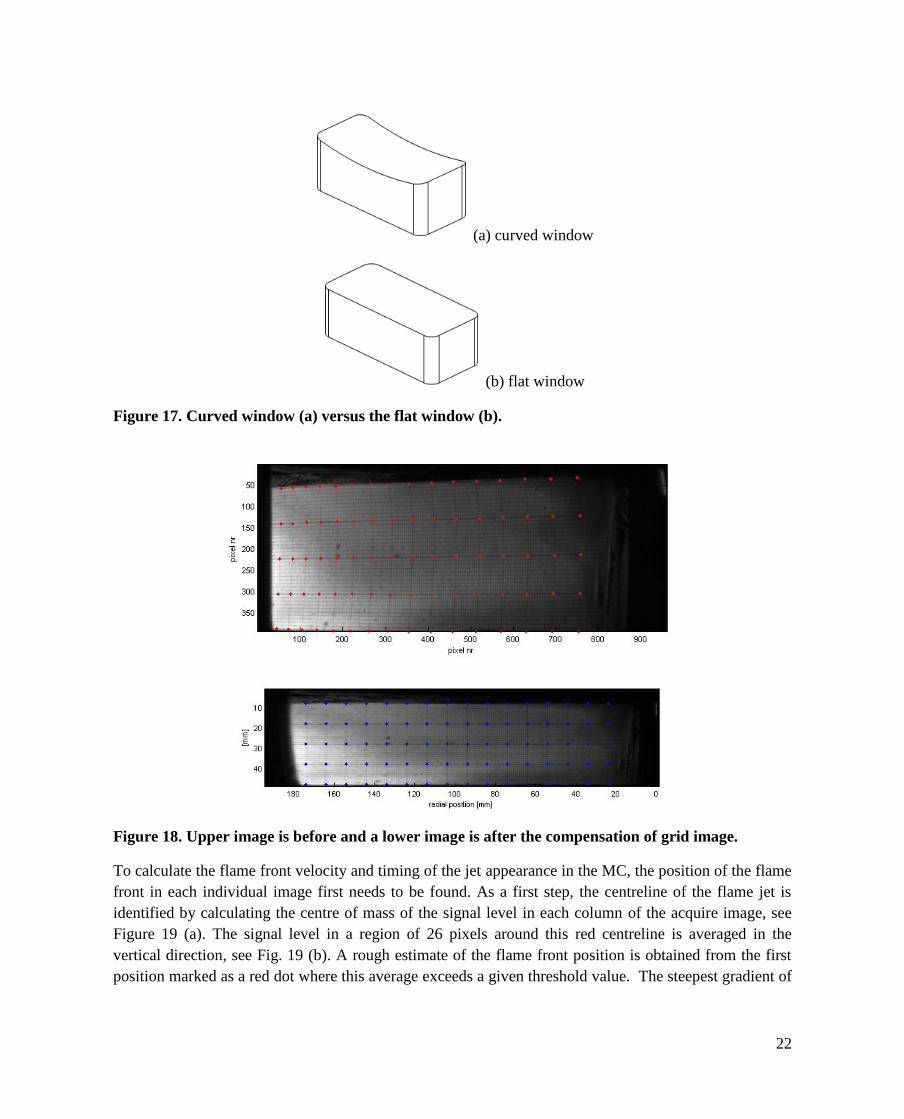
sharp. The former problem is compensated by imaging a grid placed in the main combustion chamber, see
Fig. 18. The grid image is known and a two dimensional polynomial function can be found that
transforms the distorted image into the true one. The latter problem is not critical in our case since the
flame jet thickness is large in comparison to the displacement of the image plane caused by the curved
window.
22
(a) curved window
(b) flat window
Figure 17. Curved window (a) versus the flat window (b).
Figure 18. Upper image is before and a lower image is after the compensation of grid image.
To calculate the flame front velocity and timing of the jet appearance in the MC, the position of the flame
front in each individual image first needs to be found. As a first step, the centreline of the flame jet is
identified by calculating the centre of mass of the signal level in each column of the acquire image, see
Figure 19 (a). The signal level in a region of 26 pixels around this red centreline is averaged in the
vertical direction, see Fig. 19 (b). A rough estimate of the flame front position is obtained from the first
position marked as a red dot where this average exceeds a given threshold value. The steepest gradient of
23
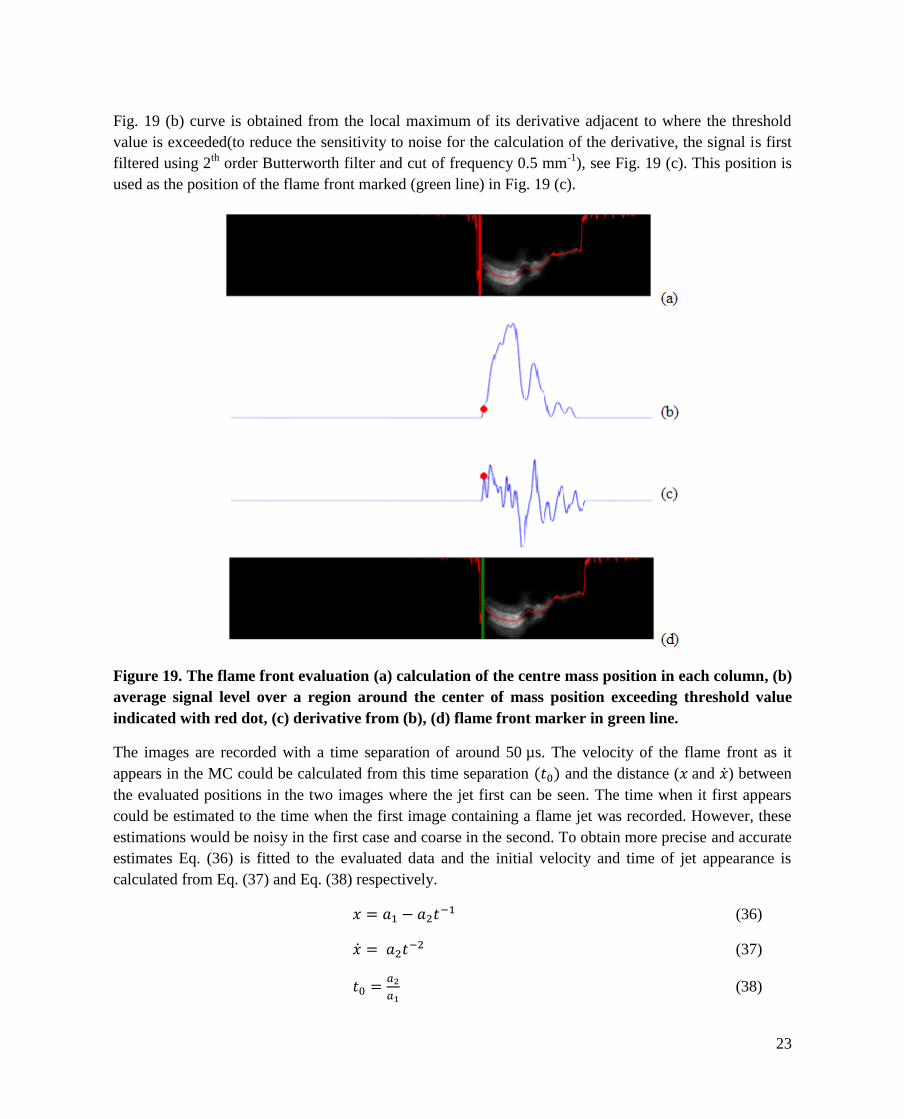
Fig. 19 (b) curve is obtained from the local maximum of its derivative adjacent to where the threshold
value is exceeded(to reduce the sensitivity to noise for the calculation of the derivative, the signal is first
filtered using 2th
order Butterworth filter and cut of frequency 0.5 mm-1
), see Fig. 19 (c). This position is
used as the position of the flame front marked (green line) in Fig. 19 (c).
Figure 19. The flame front evaluation (a) calculation of the centre mass position in each column, (b)
average signal level over a region around the center of mass position exceeding threshold value
indicated with red dot, (c) derivative from (b), (d) flame front marker in green line.
The images are recorded with a time separation of around 50 µs. The velocity of the flame front as it
appears in the MC could be calculated from this time separation and the distance ( and ) between
the evaluated positions in the two images where the jet first can be seen. The time when it first appears
could be estimated to the time when the first image containing a flame jet was recorded. However, these
estimations would be noisy in the first case and coarse in the second. To obtain more precise and accurate
estimates Eq. (36) is fitted to the evaluated data and the initial velocity and time of jet appearance is
calculated from Eq. (37) and Eq. (38) respectively.
(36)
(37)
(38)

24
Here and are fitting coefficients. During these measurements, a modified PCC was used with
asymmetric nozzle holes configuration where one jet was separated to give a free view for combustion
visualization, see Fig. 13 (a).
5 Results and discussion
5.1 Cycle-to-cycle variation Figure 20 shows the cycle-to-cycle variation of the pressure difference Δp between the PCC and MC for
the baseline case (ignition timing 14° CA BTDC and boost pressure 2.2 bar). The pressure difference
mainly results from the PCC combustion and drives the jet flames into the main combustion chamber.
The legend of the figure indicates the cycle number. There is substantial variation (33-51 bar) between the
cycles. In the following discussion, a representative cycle (cycle number five) in the middle of the Δp
range was chosen as an example.
Figure 20. Cycle-to-cycle variation of the delta pressure, Δp.
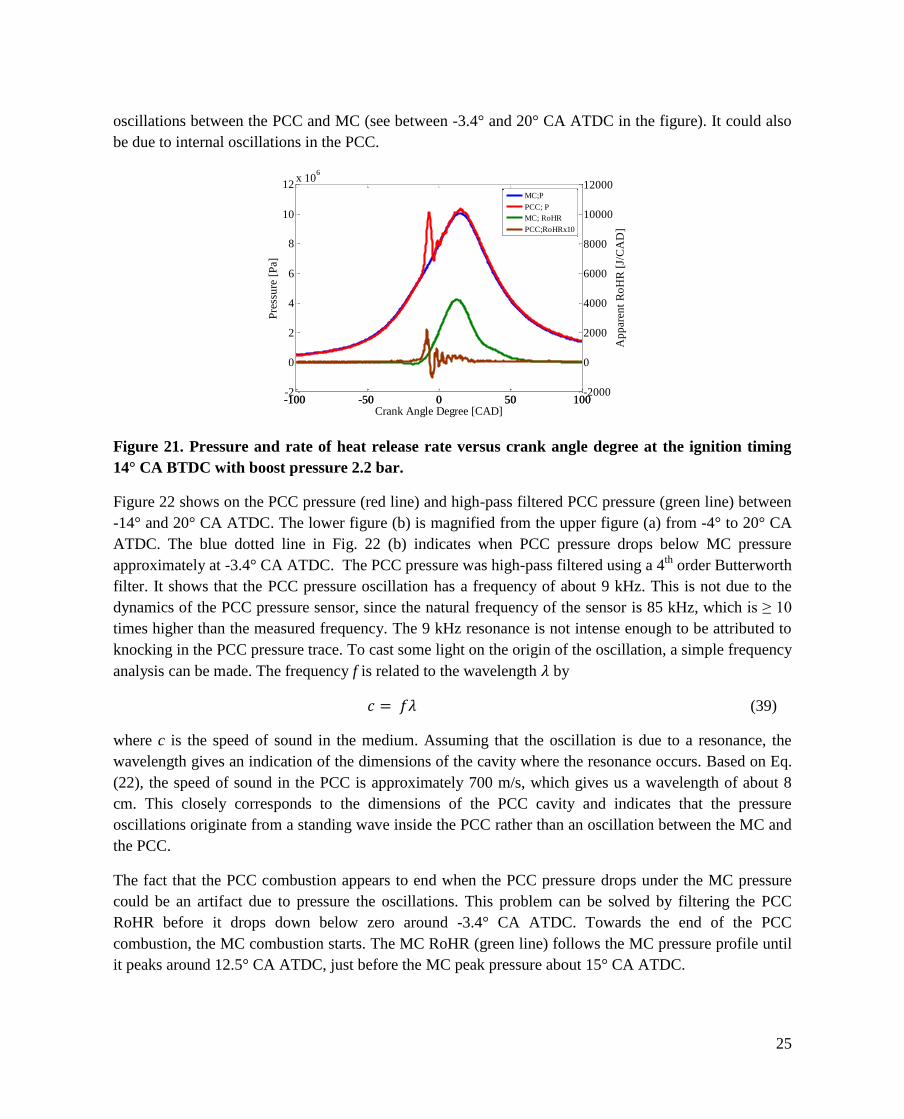
5.2 Heat release In Figure 21, the axis on the left side of the figure shows the pressure and the right one shows the rate of
heat release (RoHR) for the reference case. The PCC and MC RoHR have been low-pass filtered with 4th
order Butterworth filter in order to remove resonance effects in both combustion chambers. The PCC
pressure trace (red line) follows the MC pressure (blue line) except between around -14° and -3° CA
ATDC, when the PCC combustion takes place. During this period, the PCC pressure rises about 50%
above MC pressure. The PCC RoHR (brown line) follows the PCC pressure profile and reaches a
maximum around -8.6° CA ATDC. This is just before the PCC pressure peaks at approximately -7° CA
ATDC. After this, it drops below zero around -3.4° CA ATDC. This is also seen in the PCC pressure
trace, which drops below the MC pressure and then increases again. This could be caused by pressure
-14 -12 -10 -8 -6 -4 -2
0
1
2
3
4
5
x 106
p
[P
a]
Crank Angle Degree [CAD]
1
2
3
4
5
6
7
8
9
10
25
oscillations between the PCC and MC (see between -3.4° and 20° CA ATDC in the figure). It could also
be due to internal oscillations in the PCC.
Figure 21. Pressure and rate of heat release rate versus crank angle degree at the ignition timing
14° CA BTDC with boost pressure 2.2 bar.
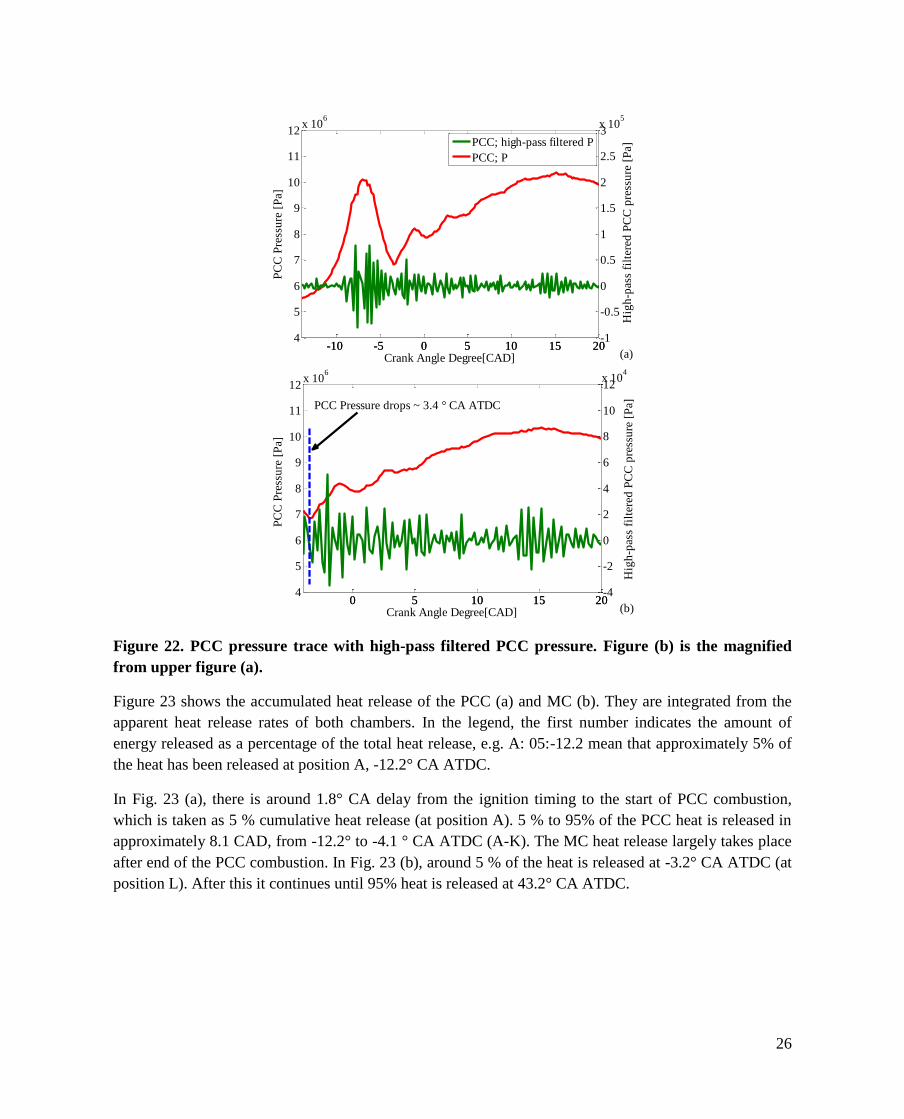
Figure 22 shows on the PCC pressure (red line) and high-pass filtered PCC pressure (green line) between
-14° and 20° CA ATDC. The lower figure (b) is magnified from the upper figure (a) from -4° to 20° CA
ATDC. The blue dotted line in Fig. 22 (b) indicates when PCC pressure drops below MC pressure
approximately at -3.4° CA ATDC. The PCC pressure was high-pass filtered using a 4th
order Butterworth
filter. It shows that the PCC pressure oscillation has a frequency of about 9 kHz. This is not due to the
dynamics of the PCC pressure sensor, since the natural frequency of the sensor is 85 kHz, which is ≥ 10
times higher than the measured frequency. The 9 kHz resonance is not intense enough to be attributed to
knocking in the PCC pressure trace. To cast some light on the origin of the oscillation, a simple frequency
analysis can be made. The frequency f is related to the wavelength by
(39)
where c is the speed of sound in the medium. Assuming that the oscillation is due to a resonance, the
wavelength gives an indication of the dimensions of the cavity where the resonance occurs. Based on Eq.
(22), the speed of sound in the PCC is approximately 700 m/s, which gives us a wavelength of about 8
cm. This closely corresponds to the dimensions of the PCC cavity and indicates that the pressure
oscillations originate from a standing wave inside the PCC rather than an oscillation between the MC and
the PCC.
The fact that the PCC combustion appears to end when the PCC pressure drops under the MC pressure
could be an artifact due to pressure the oscillations. This problem can be solved by filtering the PCC
RoHR before it drops down below zero around -3.4° CA ATDC. Towards the end of the PCC
combustion, the MC combustion starts. The MC RoHR (green line) follows the MC pressure profile until
it peaks around 12.5° CA ATDC, just before the MC peak pressure about 15° CA ATDC.
-100 -50 0 50 100-2
0
2
4
6
8
10
12x 10
6
Pre
ssu
re [
Pa]
-100 -50 0 50 100-2000
0
2000
4000
6000
8000
10000
12000
Ap
par
ent
Ro
HR
[J/
CA
D]
Crank Angle Degree [CAD]
MC;P
PCC; P
MC; RoHR
PCC;RoHRx10
26
Figure 22. PCC pressure trace with high-pass filtered PCC pressure. Figure (b) is the magnified
from upper figure (a).
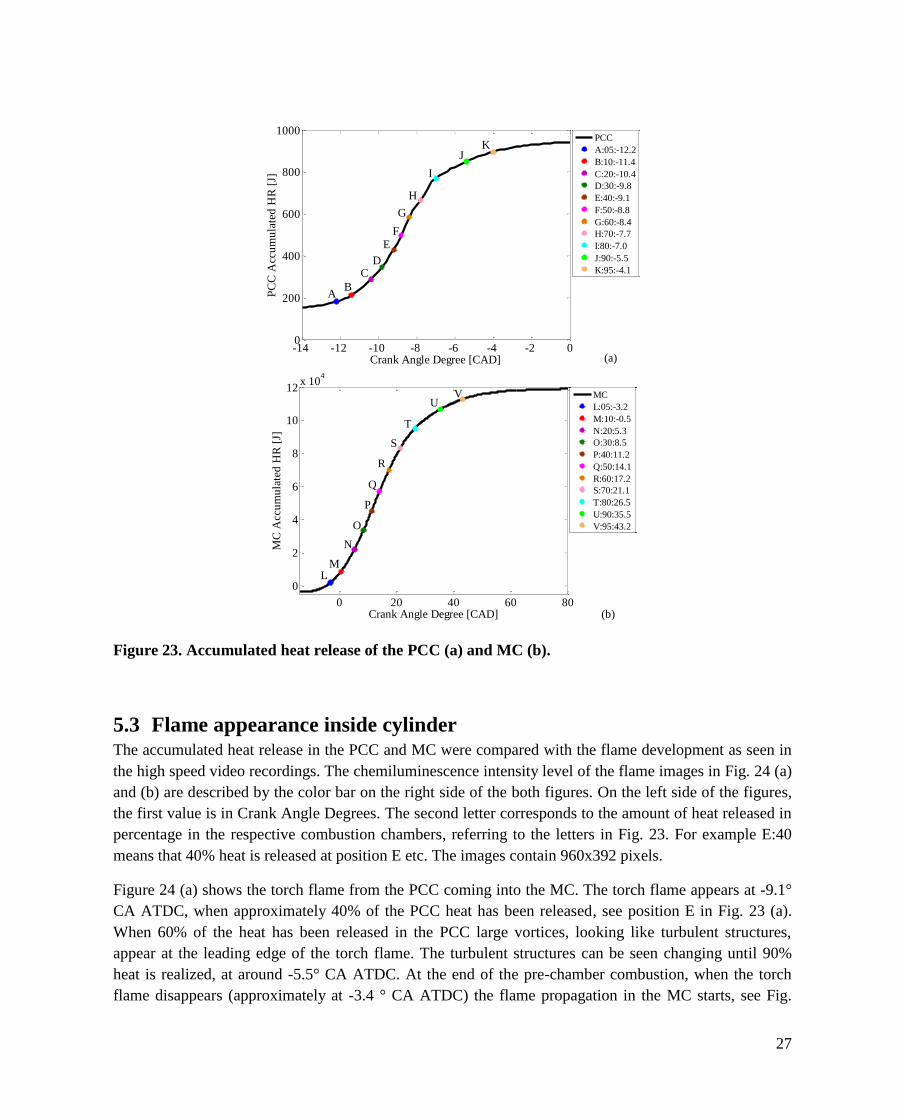
Figure 23 shows the accumulated heat release of the PCC (a) and MC (b). They are integrated from the
apparent heat release rates of both chambers. In the legend, the first number indicates the amount of
energy released as a percentage of the total heat release, e.g. A: 05:-12.2 mean that approximately 5% of
the heat has been released at position A, -12.2° CA ATDC.
In Fig. 23 (a), there is around 1.8° CA delay from the ignition timing to the start of PCC combustion,
which is taken as 5 % cumulative heat release (at position A). 5 % to 95% of the PCC heat is released in
approximately 8.1 CAD, from -12.2° to -4.1 ° CA ATDC (A-K). The MC heat release largely takes place
after end of the PCC combustion. In Fig. 23 (b), around 5 % of the heat is released at -3.2° CA ATDC (at
position L). After this it continues until 95% heat is released at 43.2° CA ATDC.
-10 -5 0 5 10 15 204
5
6
7
8
9
10
11
12x 10
6
PC
C P
ress
ure
[P
a]
Crank Angle Degree[CAD]-10 -5 0 5 10 15 20
-1
-0.5
0
0.5
1
1.5
2
2.5
3x 10
5
Hig
h-p
ass
filt
ered
PC
C p
ress
ure
[P
a]
PCC; high-pass filtered P
PCC; P
(a)
0 5 10 15 204
5
6
7
8
9
10
11
12x 10
6
PC
C P
ress
ure
[P
a]
Crank Angle Degree[CAD]0 5 10 15 20
-4
-2
0
2
4
6
8
10
12x 10
4
Hig
h-p
ass
filt
ered
PC
C p
ress
ure
[P
a]PCC Pressure drops ~ 3.4 ° CA ATDC
(b)
27
Figure 23. Accumulated heat release of the PCC (a) and MC (b).
5.3 Flame appearance inside cylinder The accumulated heat release in the PCC and MC were compared with the flame development as seen in
the high speed video recordings. The chemiluminescence intensity level of the flame images in Fig. 24 (a)
and (b) are described by the color bar on the right side of the both figures. On the left side of the figures,
the first value is in Crank Angle Degrees. The second letter corresponds to the amount of heat released in
percentage in the respective combustion chambers, referring to the letters in Fig. 23. For example E:40
means that 40% heat is released at position E etc. The images contain 960x392 pixels.
Figure 24 (a) shows the torch flame from the PCC coming into the MC. The torch flame appears at -9.1°
CA ATDC, when approximately 40% of the PCC heat has been released, see position E in Fig. 23 (a).
When 60% of the heat has been released in the PCC large vortices, looking like turbulent structures,
appear at the leading edge of the torch flame. The turbulent structures can be seen changing until 90%
heat is realized, at around -5.5° CA ATDC. At the end of the pre-chamber combustion, when the torch
flame disappears (approximately at -3.4 ° CA ATDC) the flame propagation in the MC starts, see Fig.
-14 -12 -10 -8 -6 -4 -2 00
200
400
600
800
1000
Crank Angle Degree [CAD]
PC
C A
ccu
mu
late
d H
R [
J]
PCC
A:05:-12.2
B:10:-11.4
C:20:-10.4
D:30:-9.8
E:40:-9.1
F:50:-8.8
G:60:-8.4
H:70:-7.7
I:80:-7.0
J:90:-5.5
K:95:-4.1
(a)
K
AB
CD
E
F
G
H
I
J
0 20 40 60 80
0
2
4
6
8
10
12x 10
4
Crank Angle Degree [CAD]
MC
Acc
um
ula
ted
HR
[J]
MC
L:05:-3.2
M:10:-0.5
N:20:5.3
O:30:8.5
P:40:11.2
Q:50:14.1
R:60:17.2
S:70:21.1
T:80:26.5
U:90:35.5
V:95:43.2
(b)
VU
T
S
R
Q
P
O
N
ML
28
24(b). It was noticed that the flame propagation in the MC does not occur simultaneously with the
appearance of the torch flame. Approximately 5% heat in the MC is released at -3.2° CA ATDC, see also
Fig. 23 (b) L. An oval shape appears on the right side of the flame image at 5.3° CA ATDC. This is due
to the flame propagation from the other nozzle holes appearing in the imaged region. After this, the flame
continues propagating forward to the cylinder wall and reaches it around 21.1° CA ATDC, see also Fig.
23 (b) S. During the flame propagation, the edge of the flame looks rather diffuse. This is due to the depth
of field in the image, resulting in parts of the flame being out of focus. The expansion rate of the flame is
around 20-60 m/s throughout the whole dataset, which is greater than one would expect in pure turbulent
flame propagation [64]. However, this is probably due to the jet penetration speed being added to the
flame propagation speed. There is no reason to suspect that combustion proceeds by any other process
than turbulent flame propagation in this engine. As images were recorded until around 30° CA ATDC,
there are no flame propagation images when 90% and 95% heat is released in the MC.

29
(a) (b)
Figure 24. (a) The torch flame from the PCC into the MC (b) Flame propagation inside the MC. On
the left side of both figures, the first value is in Crank Angle Degree BTDC. The letter below the
first value corresponds to the amount of released heat in percentage (given in Fig. 23), e.g. E:40
means that 40% heat has been released inside PCC (at position E) around -9.1° CA ATDC etc.
30
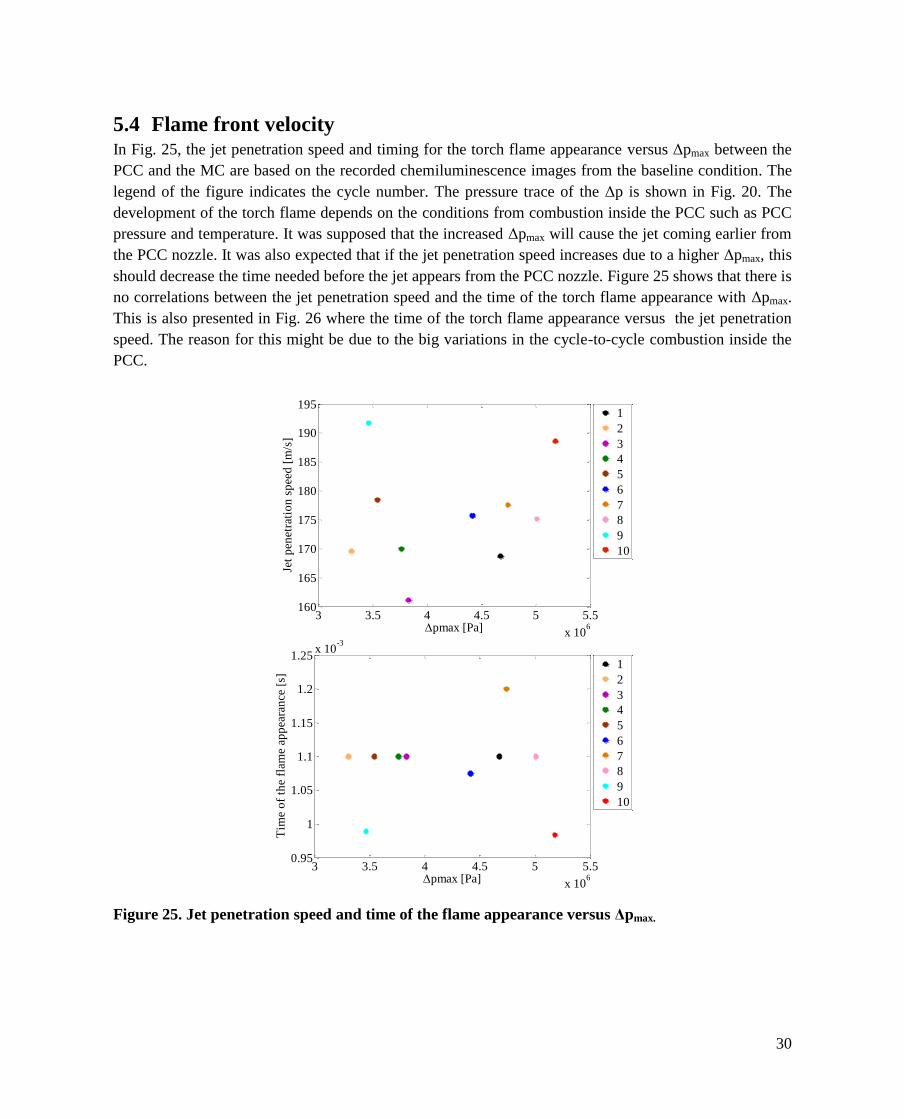
5.4 Flame front velocity In Fig. 25, the jet penetration speed and timing for the torch flame appearance versus Δpmax between the
PCC and the MC are based on the recorded chemiluminescence images from the baseline condition. The
legend of the figure indicates the cycle number. The pressure trace of the Δp is shown in Fig. 20. The
development of the torch flame depends on the conditions from combustion inside the PCC such as PCC
pressure and temperature. It was supposed that the increased Δpmax will cause the jet coming earlier from
the PCC nozzle. It was also expected that if the jet penetration speed increases due to a higher Δpmax, this
should decrease the time needed before the jet appears from the PCC nozzle. Figure 25 shows that there is
no correlations between the jet penetration speed and the time of the torch flame appearance with Δpmax.
This is also presented in Fig. 26 where the time of the torch flame appearance versus the jet penetration
speed. The reason for this might be due to the big variations in the cycle-to-cycle combustion inside the
PCC.
Figure 25. Jet penetration speed and time of the flame appearance versus Δpmax.
3 3.5 4 4.5 5 5.5
x 106
160
165
170
175
180
185
190
195
pmax [Pa]
Jet
pen
etra
tio
n s
pee
d [
m/s
]
1
2
3
4
5
6
7
8
9
10
3 3.5 4 4.5 5 5.5
x 106
0.95
1
1.05
1.1
1.15
1.2
1.25x 10
-3
pmax [Pa]
Tim
e o
f th
e fl
ame
app
eara
nce
[s]
1
2
3
4
5
6
7
8
9
10

31
Figure 26. The time of the flame appearance versus Δpmax.
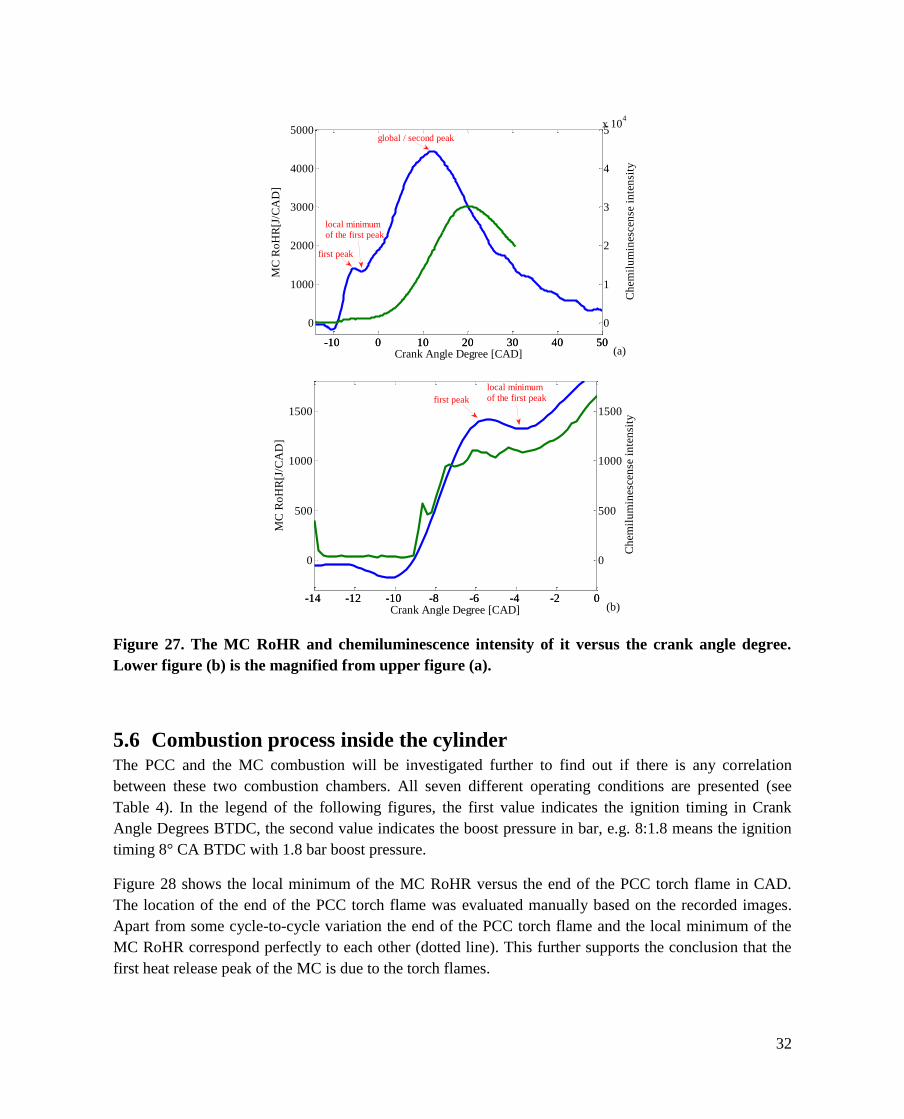
5.5 Chemiluminescence intensity in the main chamber Figure 27 (a) shows the MC RoHR (blue curve) and the integrated chemiluminescence intensity level
from the recorded flame images (green curve) versus CAD. There are two peaks in the heat release, which
represents the baseline operating condition. The first peak location is about -5.2° CA ATDC. The second
(global) peak appears around 12.5° CA ATDC.
The chemiluminescence intensity is based on the integrated signal levels in the images recorded at the
corresponding crank angle positions. It was noticed that the peak chemiluminescence intensity is phasing
later than the second peak of the MC RoHR. This is partly because the piston is blocking parts of the
spacer window up to 20° CA ATDC, making the signal peak later than the heat release, see Fig. 24 (b).
An additional reason for the lag between the heat release and the chemiluminescence intensity could be
that the MC bulk charge ignition is more efficient in the non-imaged part of the combustion chamber
where there are five closely spaced jet flames, see Fig. 13 (a). At any rate, the chemiluminescence
intensity follows the heat release reasonably well in these images (and throughout the whole dataset),
meaning that the imaged area is representative of the combustion process in the entire cylinder.
Figure 27 (b) shows the same data but in the region between -14° and -2° CA ATDC. It shows that the
first peak is followed by a local minimum around -3.4° CA ATDC before it increases again towards the
second peak, approximately at 12.5° CA ATDC. It was noticed that the torch flame ends at approximately
the location where the MC RoHR reaches this local minimum. It was concluded that the first peak is due
to the torch flames. In the following section, the MC RoHR is therefore separated into two parts. The first
is called the torch heat release (between -14° and -3.4° CA ATDC) and the second is called the MC
global heat release rate (after -3.4° CA ATDC). The location of the torch heat release is located manually
by looking into the recorded flame images.
160 165 170 175 180 185 190 1950.95
1
1.05
1.1
1.15
1.2
1.25x 10
-3
Jet penetration speed [m/s]
Tim
e o
f th
e fl
ame
app
eara
nce
[s]
1
2
3
4
5
6
7
8
9
10
32
Figure 27. The MC RoHR and chemiluminescence intensity of it versus the crank angle degree.
Lower figure (b) is the magnified from upper figure (a).
5.6 Combustion process inside the cylinder The PCC and the MC combustion will be investigated further to find out if there is any correlation
between these two combustion chambers. All seven different operating conditions are presented (see
Table 4). In the legend of the following figures, the first value indicates the ignition timing in Crank
Angle Degrees BTDC, the second value indicates the boost pressure in bar, e.g. 8:1.8 means the ignition
timing 8° CA BTDC with 1.8 bar boost pressure.
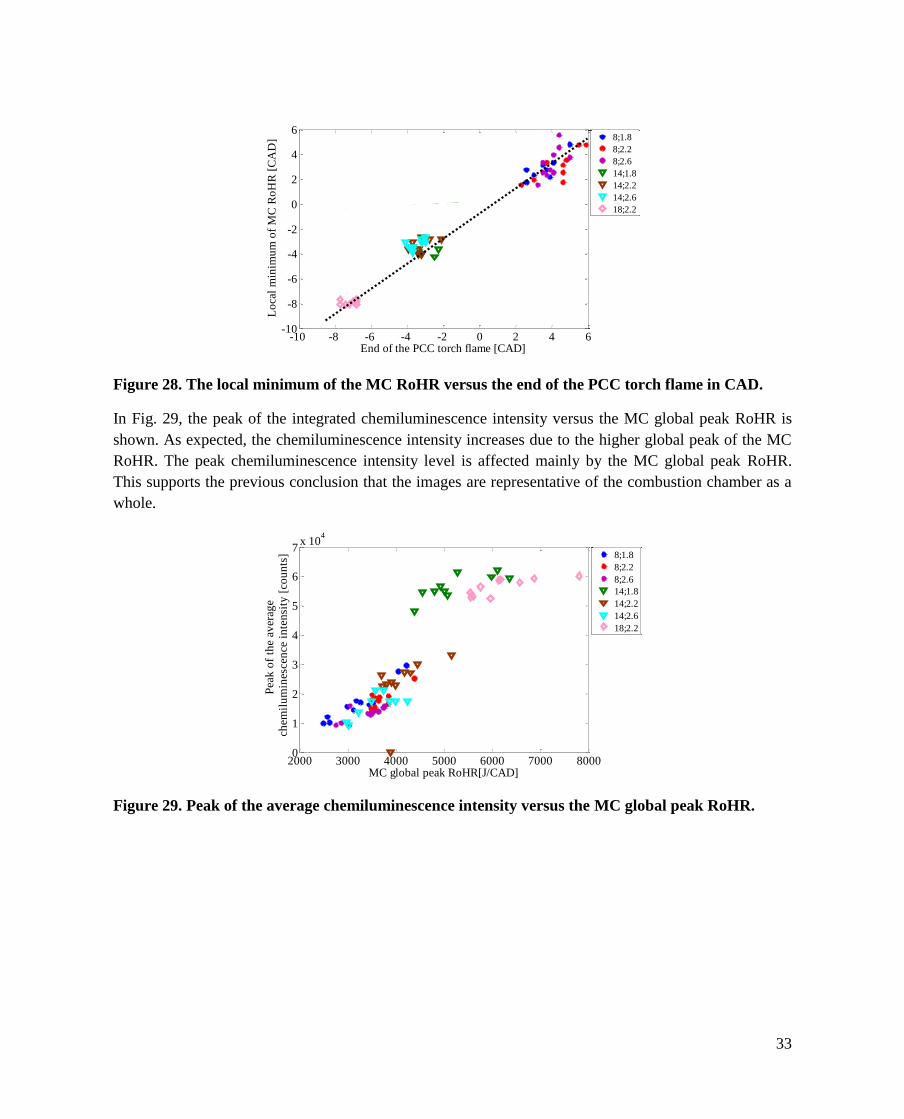
Figure 28 shows the local minimum of the MC RoHR versus the end of the PCC torch flame in CAD.
The location of the end of the PCC torch flame was evaluated manually based on the recorded images.
Apart from some cycle-to-cycle variation the end of the PCC torch flame and the local minimum of the
MC RoHR correspond perfectly to each other (dotted line). This further supports the conclusion that the
first heat release peak of the MC is due to the torch flames.
-10 0 10 20 30 40 50
0
1000
2000
3000
4000
5000
MC
Ro
HR
[J/C
AD
]
Crank Angle Degree [CAD]-10 0 10 20 30 40 50
0
1
2
3
4
5x 10
4
Ch
emil
um
ines
cen
se i
nte
nsi
ty
local minimumof the first peak
first peak
global / second peak
(a)
-14 -12 -10 -8 -6 -4 -2 0
0
500
1000
1500
MC
Ro
HR
[J/C
AD
]
Crank Angle Degree [CAD]-14 -12 -10 -8 -6 -4 -2 0
0
500
1000
1500
Ch
emil
um
ines
cen
se i
nte
nsi
ty
local minimum
of the first peakfirst peak
(b)
33
Figure 28. The local minimum of the MC RoHR versus the end of the PCC torch flame in CAD.
In Fig. 29, the peak of the integrated chemiluminescence intensity versus the MC global peak RoHR is
shown. As expected, the chemiluminescence intensity increases due to the higher global peak of the MC
RoHR. The peak chemiluminescence intensity level is affected mainly by the MC global peak RoHR.
This supports the previous conclusion that the images are representative of the combustion chamber as a
whole.
Figure 29. Peak of the average chemiluminescence intensity versus the MC global peak RoHR.
-10 -8 -6 -4 -2 0 2 4 6-10
-8
-6
-4
-2
0
2
4
6
Lo
cal
min
imu
m o
f M
C R
oH
R [
CA
D]
End of the PCC torch flame [CAD]
8;1.8
8;2.2
8;2.6
14;1.8
14;2.2
14;2.6
18;2.2
2000 3000 4000 5000 6000 7000 80000
1
2
3
4
5
6
7x 10
4
MC global peak RoHR[J/CAD]
Pea
k o
f th
e av
erag
e
chem
ilu
min
esce
nce
in
ten
sity
[co
un
ts] 8;1.8
8;2.2
8;2.6
14;1.8
14;2.2
14;2.6
18;2.2
34
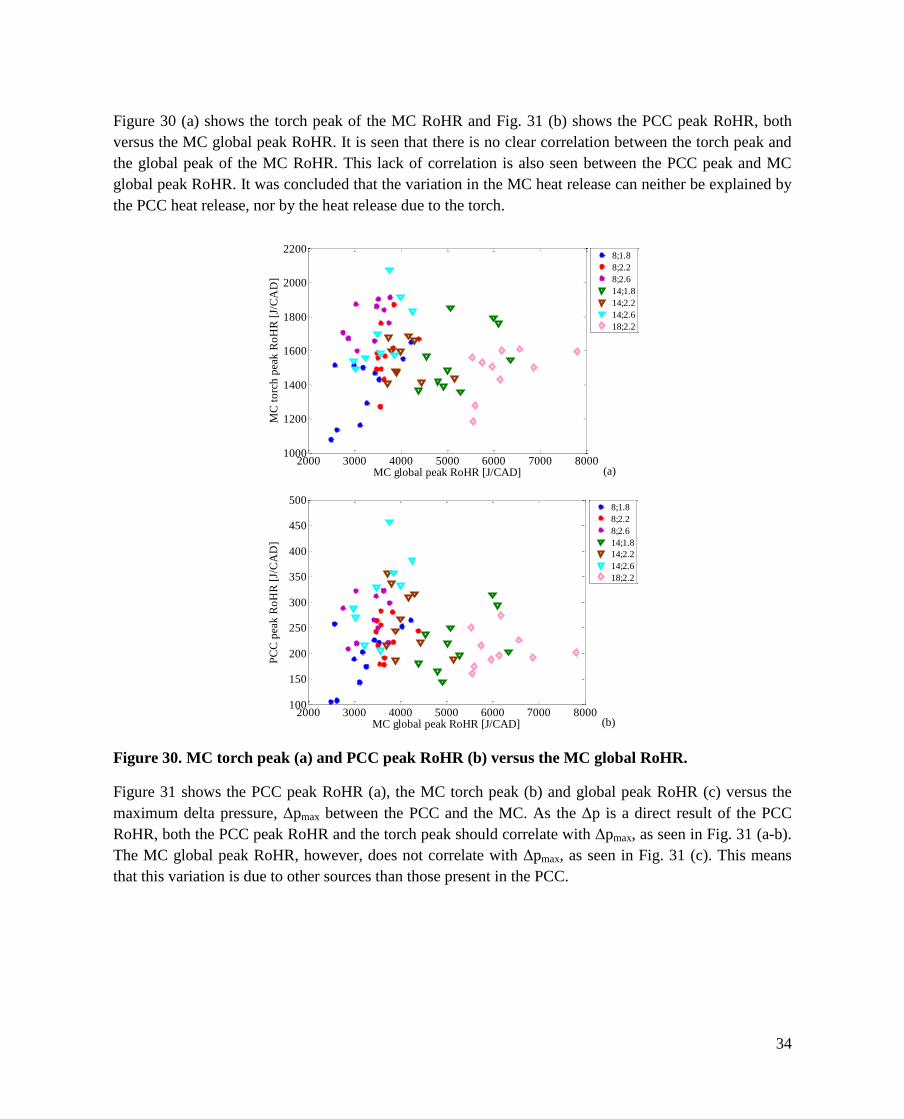
Figure 30 (a) shows the torch peak of the MC RoHR and Fig. 31 (b) shows the PCC peak RoHR, both
versus the MC global peak RoHR. It is seen that there is no clear correlation between the torch peak and
the global peak of the MC RoHR. This lack of correlation is also seen between the PCC peak and MC
global peak RoHR. It was concluded that the variation in the MC heat release can neither be explained by
the PCC heat release, nor by the heat release due to the torch.
Figure 30. MC torch peak (a) and PCC peak RoHR (b) versus the MC global RoHR.
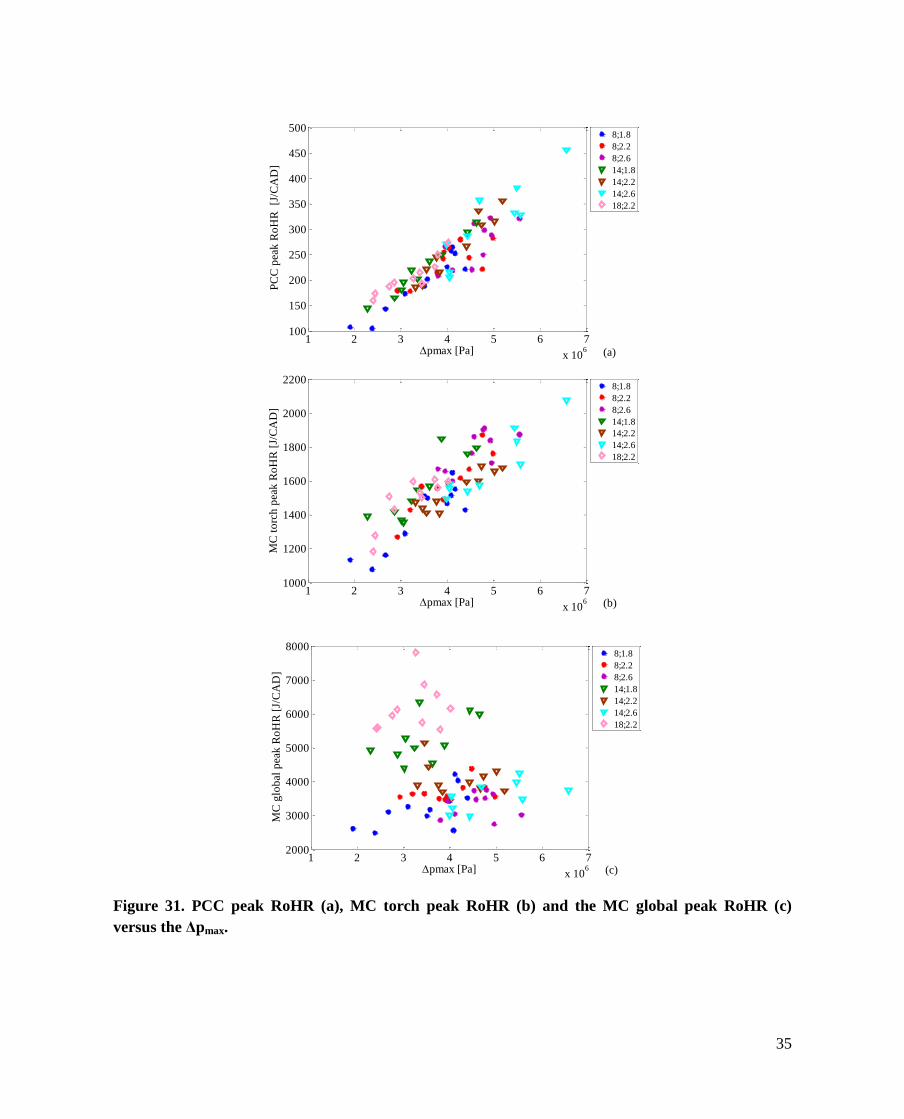
Figure 31 shows the PCC peak RoHR (a), the MC torch peak (b) and global peak RoHR (c) versus the
maximum delta pressure, Δpmax between the PCC and the MC. As the Δp is a direct result of the PCC
RoHR, both the PCC peak RoHR and the torch peak should correlate with Δpmax, as seen in Fig. 31 (a-b).
The MC global peak RoHR, however, does not correlate with Δpmax, as seen in Fig. 31 (c). This means
that this variation is due to other sources than those present in the PCC.
2000 3000 4000 5000 6000 7000 80001000
1200
1400
1600
1800
2000
2200
MC global peak RoHR [J/CAD]
MC
to
rch
pea
k R
oH
R [
J/C
AD
]
8;1.8
8;2.2
8;2.6
14;1.8
14;2.2
14;2.6
18;2.2
(a)
2000 3000 4000 5000 6000 7000 8000100
150
200
250
300
350
400
450
500
MC global peak RoHR [J/CAD]
PC
C p
eak
Ro
HR
[J/
CA
D]
8;1.8
8;2.2
8;2.6
14;1.8
14;2.2
14;2.6
18;2.2
(b)
35
Figure 31. PCC peak RoHR (a), MC torch peak RoHR (b) and the MC global peak RoHR (c)
versus the Δpmax.
1 2 3 4 5 6 7
x 106
100
150
200
250
300
350
400
450
500
pmax [Pa]
PC
C p
eak
Ro
HR
[J
/CA
D]
8;1.8
8;2.2
8;2.6
14;1.8
14;2.2
14;2.6
18;2.2
(a)
1 2 3 4 5 6 7
x 106
1000
1200
1400
1600
1800
2000
2200
pmax [Pa]
MC
to
rch
pea
k R
oH
R [
J/C
AD
]
8;1.8
8;2.2
8;2.6
14;1.8
14;2.2
14;2.6
18;2.2
(b)
1 2 3 4 5 6 7
x 106
2000
3000
4000
5000
6000
7000
8000
pmax [Pa]
MC
glo
bal
pea
k R
oH
R [
J/C
AD
]
8;1.8
8;2.2
8;2.6
14;1.8
14;2.2
14;2.6
18;2.2
(c)
36
In summary, the cycle-to-cycle variation in the PCC heat release does not explain the variations in the
MC heat release. These must be due to other factors than the PCC combustion, such as temperature
stratification in the MC, the modified PCC nozzle configuration, spatial variation in lambda, cyclic
variation in turbulence or something similar.
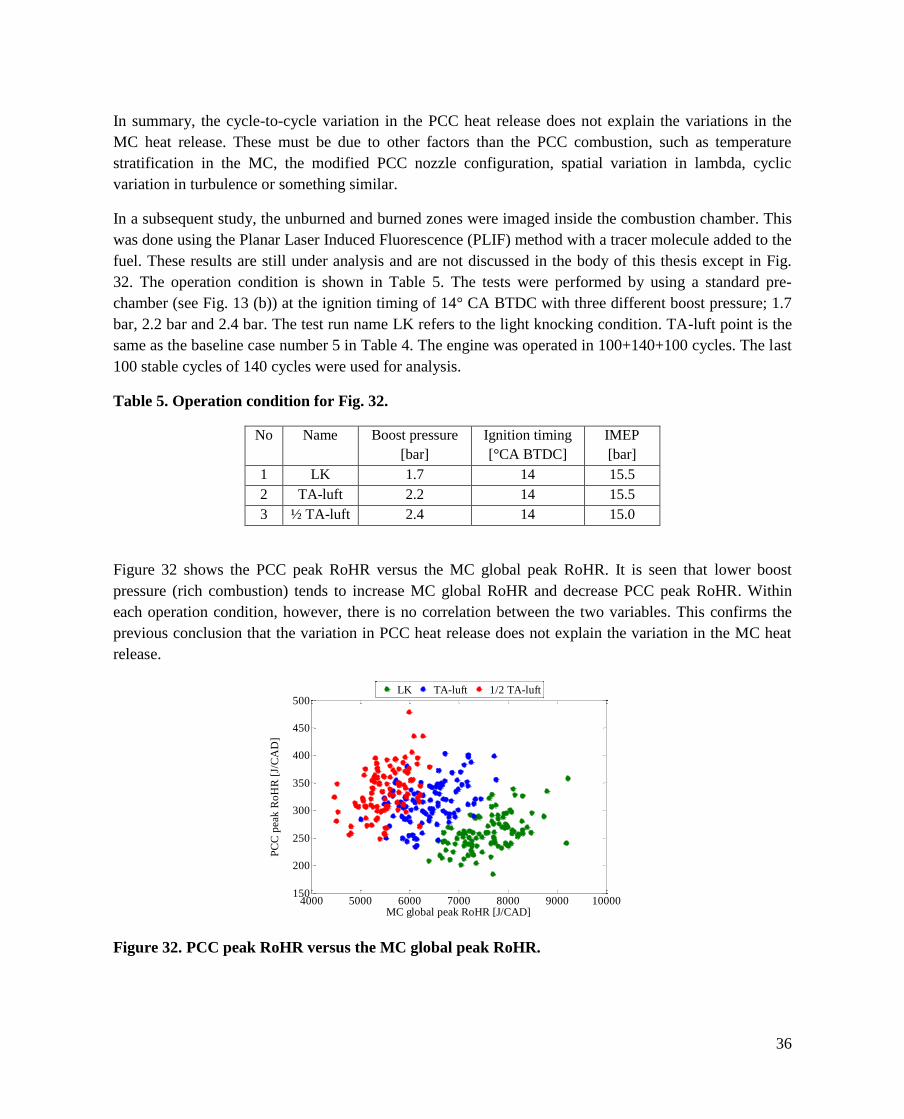
In a subsequent study, the unburned and burned zones were imaged inside the combustion chamber. This
was done using the Planar Laser Induced Fluorescence (PLIF) method with a tracer molecule added to the
fuel. These results are still under analysis and are not discussed in the body of this thesis except in Fig.
32. The operation condition is shown in Table 5. The tests were performed by using a standard pre-
chamber (see Fig. 13 (b)) at the ignition timing of 14° CA BTDC with three different boost pressure; 1.7
bar, 2.2 bar and 2.4 bar. The test run name LK refers to the light knocking condition. TA-luft point is the
same as the baseline case number 5 in Table 4. The engine was operated in 100+140+100 cycles. The last
100 stable cycles of 140 cycles were used for analysis.
Table 5. Operation condition for Fig. 32.
No Name Boost pressure
[bar]
Ignition timing
[°CA BTDC]
IMEP
[bar]
1 LK 1.7 14 15.5
2 TA-luft 2.2 14 15.5
3 ½ TA-luft 2.4 14 15.0
Figure 32 shows the PCC peak RoHR versus the MC global peak RoHR. It is seen that lower boost
pressure (rich combustion) tends to increase MC global RoHR and decrease PCC peak RoHR. Within
each operation condition, however, there is no correlation between the two variables. This confirms the
previous conclusion that the variation in PCC heat release does not explain the variation in the MC heat
release.
Figure 32. PCC peak RoHR versus the MC global peak RoHR.
4000 5000 6000 7000 8000 9000 10000150
200
250
300
350
400
450
500
MC global peak RoHR [J/CAD]
PC
C p
eak
Ro
HR
[J/
CA
D]
LK TA-luft 1/2 TA-luft
37
6 Conclusion In this experimental study, the in-cylinder combustion in a spark ignited four-stroke large bore gas engine
of W34SG was investigated. The flame propagation inside the cylinder was recorded by a high speed
video camera. The main observations and conclusions are:
The torch flame appears in the main chamber roughly halfway through the pre-combustion
chamber heat release. It disappears at the end of the pre-combustion chamber heat release.
The flame propagation inside the main chamber does not occur simultaneously with the torch
flame from the pre-combustion chamber. The main chamber heat release commences towards the
end of the pre-combustion chamber heat release.
After the torch phase, the flame growth in the main chamber occurs at a rate that is higher than
typical turbulent flame propagation speeds, but this could be due to the jet penetrating at a high
speed in the same direction. There is no evidence to suggest that the flame grows through any
other process than flame propagation.
The variation of the chemiluminescence intensity over time resembles the main chamber heat
release rate. This means that the imaged jet is representative of the other jets in the combustion
chamber.
There no correlation between the flame velocity and the time of the flame appearance. This might
be due to the cycle-to cycle variation inside the pre-combustion chamber.
There is no correlation between the pre-combustion chamber peak heat release rate and the main
chamber global peak heat release rate. There is also no correlation between the main chamber heat
release rate during the torch phase and that occurring after the torch phase. This means that the
cycle-to-cycle variation in the main chamber heat release rate neither originates from the pre-
combustion chamber nor from the torch. The variation must thereby be due to main chamber
parameters, e.g. variations in turbulence, temperature stratification, inhomogeneous air-to-fuel
ratio, or something similar. Further research is needed to isolate the exact origin of the cycle-to-
cycle variability.
38
7 Summary of papers Paper I
Visualization of the Combustion in Wärtsilä 34SG Pre-chamber ignited Lean Burn
Gas Engine
ASME CIMAC paper 414
By Jeudi Duong, Rikard Wellander, Jari Hyvönen, Öivind Andersson and Mattias Richter
The purpose of the study was to investigate how the pre-combustion chamber jet flames affect the main
chamber combustion at the ignition timing 14° CA bTDC with a boost pressure 2.2 bar . The reference
case of the minimum, mean and the maximum were chosen to find correlations between the pre-
combustion chamber and the main chamber heat release, combustion duration, and flame. Also the jet
penetration speed and time of the flame appearance were also carried out.
The experiments were performed by Jeudi Duong together with Rikard Wellander, supported by SCE test
team and Mattias Richter. The data was analysed by Jeudi Duong. Rikard Wellander performed the image
analysis and assisted Jeudi Duong writing the paper.
Paper II
High speed combustion imaging in a large bore gas engine – therelationship between
pre – and main chamber heat release
ASME IMECE2013-64286 paper
By Jeudi Duong, Rikard Wellander, Jari Hyvönen, Öivind Andersson, Mattias Richter, Bengt Johansson,
Marcus Aldén
The work focused to find the correlations between the pre-combustion chamber and the main chamber
apparent heat release rate with the recorded flame images. Also the main chamber apparent heat release
rate and the chemiluminescence intensity level from the recorded flame images are investigated.
The experiments were performed by Jeudi Duong together with Rikard Wellander, supported by SCE test
team and Mattias Richter. The data was analysed by Jeudi Duong. Rikard Wellander performed the image
analysis and assisted Jeudi Duong writing the paper.
39
Related work:
Study of the early flame development in a spark – ignited lean burn four – stroke
large bore gas engine by planar laser induced fluorescence
Submitted to the SAE World Congress, April 8th
– 10th
2014, Detroit
By Rikard Wellander, Jeudi Duong, Joakim Rosell, Mattias Richter, Öivind Andersson, Jari Hyvönen,
Bengt Johansson, Marcus Aldén
In this work the pre- to main chamber ignition process is studied in a Wärtsilä 34SG spark-ignited lean
burn four-stroke large bore optical engine (bore 340 mm) operating on natural gas. Unburnt and burnt gas
regions in planar cross-sections of the combustion chamber and at different timings in the combustion
cycle are identified by means of planar laser induced fluorescence (PLIF) from acetone seeded to the fuel.
The emerging jets from the pre-chamber, the ignition process and flame propagation is studied as the
boost pressure is varied. Quantitative data on the temporal delay between the occurrence of a delta
pressure across the pre-chamber holes and the appearance of burnt/burning gases at the nozzle exit shows
that there is a significant amount of unburnt mixture exiting the pre-chamber in the initial phase of
ignition, indicating incomplete mixing of the gases in the pre-chamber prior ignition. To the author’s
knowledge, this is the first time PLIF is recorded from a large bore gas engine. Thus, the challenges, in
terms of achieving optical access, proper seeding, and compensating for optical aberrations that are
associated with laser based optical measurement in such large combustion chambers are addressed.
The experiments were performed by Rikard Wellander together with Jeudi Duong and Joakim Rosell,
supported by SCE test team and Mattias Richter. The data was analysed by Rikard Wellander who also
wrote the paper and performed the image analysis with Joakim Rosell. Jeudi Duong carried out the engine
data analysis
40
8 References 1. Hardenberg HO. The Middle Ages of the International-Combustion Engine 1794-1886.
Warrendale. Society of Automotive Engineers; 1999.
2. Cummins LC Jr. Internal Fire. 3th ed. Wilsonville. Carnot Press; 2000.
3. Lenoir ETJ. Gas-Engine. United State Patent no:. 345,596. 1886.
4. Heywood JB. Internal combustion Engine Fundamentals. New York. McGraw-Hill Book Co;
1988.
5. Automobilescraze.com [homepage on the Internet] [updated 29 June 2012; cited 16 October
2013] Available from http://automobilescraze.com/?p=202 29/6/2012
6. Mpoweruk.com [homepage on the Internet] [updated 29 June 2012; cited 16 October 2013]
Available from http://www.mpoweruk.com/piston_ engines.htm 29/6/2012
7. Ferguson CR, Kirkpatrick AT. Internal combustion engines: Applied thermosciences. New York.
John Wiley & Sons; 1985.
8. Guibet JC. Fuels and Engines Technology, Energy, Environment. Éditions Technip; 1999.
9. Sillanpää H, Astrand U. Wärtsilä gas engines – the green power alternative. CIMAC Congress
paper no.:95. 2010.
10. Goto Y, Narusawa K. Combustion stabilization of a spark ignition natural gas engine. JSAE
Review 17(3), pp.251-258. 1995 .
11. Kawabata Y, Mori D. Combustion Diagnostics & Improvement of a Prechamber Lean-Burn
Natural Gas Engine. SAE Technical Paper 2004-01-0979. 2004.
12. Laiho J, Rösgren C. Pre-combustion chamber unit of combustion engine. Patent no.:
EP2265806A1. Wärtsilä Finland Oy. 2008.
13. Manivannan A, Tamil P, Chandrasekaran S. Lean Burn Natural Gas Spark Ignition Engine-An
Overview. SAE international 2003-01-0638. 2003.
14. Imo.com [homepage on the Internet] [updated 2013; cited 16 October 2013] Available from
http://www.imo.org/Pages/home.aspx
15. Dieselnet.com [homepage on the Internet] [updated 2013; cited 16 October 2013] Available
from http://www.dieselnet.com/standards/inter/imo.php
16. Engines and Systems. Exhaust Emission Legislation Diesel- and Gas engines. VDMA. 2006.
17. Wik C. Tier III technology development and its influence on ship installation and operation.
CIMAC paper no.: 159. 2013.
18. Warnatz J, Maas U, Dibble RW. Combustion: Physical and chemical fundamentals, modeling and
simulation, experiments, pollutant formation . 4th ed. Berlin Heidelberg. Springer; 2006.
19. Zeldovich YB, Sadonikov PY, Frank – Kamenetskii DA. Oxidation of nitrogen in combustion.
Acad. Sci. USSR. Inst. Chem. Phys.1947.
20. Ruter MD. Large bore natural gas engine performance improvements and combustion stabilization
through reformed natural gas precombustion chamber fueling. Master Thesis of Department of
Mechanical Engineering. Colorado State University Fort Collins; 2010.
21. Costanzo VS. Effect of In-cylinder Liquid Fuel Films on Engine-Out Unburned Hydrocarbon
Emissions for SI Engines. Doctor Thesis of Philosophy in Mechanical Engineering at the
Massachusetts Institute of Technology; 2011.
41
22. Wit J, Johansen K, Hansen PL, Rossen H, Rasmussen NB. Catalytic emission control with respect
to CH4 and CO for highly efficient gas fueled decentralised heat and power production. SAE
Thechnical paper. 2007.
23. Järvi A. Methane slip reduction in Wärtsilä lean burn gas engines. CIMAC paper no.: 106. 2010.
24. Wartsila.com [homepage on the Internet] [updated 2013; cited 16 October 2013] Available from
http://www.wartsila.com/en/powerplants/technology/ combustion-engines/gas-engines
25. Ingemar N. Status and potentials of the gas engines. CIMAC paper no.: 163. 2013
26. Grdina V. Prikladnaya Mekhanika. Ekaterinoslav. 1903.
27. Ricardo HR. US Pat. Off. 1,271, 942. 19l6.
28. Daimler.com [homepage on the Internet] [updated 14 Febuary 2011; cited 16 October 2013]
Available from http://media.daimler.com/dcmedia/0-921-614820-1-826757-1-0-0-0-0-0-11702-
614318-0-1-0-0-0-0-0.html
29. L’Orange P. Internal Combustion Engine. United State Patent Office no.: 2,106,914. 1934.
30. Gussak LA. High Chemical Activity of Incomplete Combustion Products and a Method of
Prechamber Torch Ignition for Avalanche Activation of Combustion in Internal Combustion
Engines. SAE Trans. 84, 2445. 1876 .
31. Gussak LA. The Role of Chemical Activityand Turbulence Intensity in Prechamber-Torch
Organization of Combustion in Stationary Flow of a Fuel-Air Mixture, SAE Paper 830592. 1983.
32. Gussak LA, Karpov VP, Tikhonov YV. The Application of LAG-Process in Prechamber Engines.
SAE Paper 790692. 1979.
33. Schilling O. Prechamber Compression Ignition Engine. United State Patent no.: 2,719,514. 1955.
34. Maxson JA, Oppenheim AK. Pulsed Jet Combustion – Key to a refinement of the stratified charge
concept. 21nd Symposium (International) on Combustion/ The Combustion Institute, pp. 1041-
1046. 1990.
35. Maxson JA, Hensinger DM, Hom K, Oppenheim AK. Performance of Multiple Stream Pulsed Jet
Combustion Systems. SAE International. 1991.
36. Murase E, Ono S, Hanada K, Oppenheim AK. Initation of Combustion in Lean Mixtures by
Flame Jets. Combust. Sci. Tech., Vols. 113-114, pp. 167-177. 1996.
37. Kawabata Y, Mori D. Combustion Diagnostics & Improvement of a Prechamber Lean-Burn
Natural Gas Engine. SAE Technical Paper 2004-01-0979. 2004.
38. Tsunoda A, Shimoda H, Takaishi T. Mitsubishi Lean-burn Gas Engine with World’s Highest
Thermal Efficiency. Technical Review Vol.40 No.4. 2003.
39. Roetlisberger RP, Favrat D. Comparision between direct and indirect (prechamber) spark ignition
in the case of a cogeneration natural gas engine, part II: engine operating parameters and
turbocharger characteristics. Elvisier 2002.
40. Wärtsilä Sweden. Historien om Verkstain – NOHAB and Wärtsilä Diesel in Trollhätten. Lilla
Edels Trykeri AB; 2003.
41. Laiho J, Rösgren C. Pre-chamber unit of a combustion engine. Patent no.: EP2265806 for Wärtsilä
gas engines. 2008.
42. Maddox R. N., Moshfeghian, N. Idol J. D., and Johannes A. H.Natural Gas. Riegel’s Handbook of
Industrial Chemistry 10th Edition, pp. 545-569. 2006
42
43. Ruter MD, Olsen DB, Scotto MV, Perna MA. NOx reduction from a large bore natural gas engine
via reformed natural gas prechamber fueling optimization. Elvisier. 2011.
44. Elisa T, Harold JS. A Review of Pre-Chamber Initiated Jet Ignition Combustion Systems. SAE
Technical Paper 2010-01-2263. 2010.
45. Bergner G. Internal Combustion Engines Russian translation from German. Sev. Zap. Prombyuro
VSNKh. 1926.
46. Bowditch FA. New Tool for Combustion Reseach A Quartz Piston Engine. SAE Technical paper
610002. 1961.
47. Aronsson U. Optical Investigations of Combustion in Diesel Engines. Thesis for the Degree of
Licentiate in engineering, Division of Combustion Engines, Department of Energy Sciences,
Faculty of Engineering, Lund University. 2009.
48. Tunestål P. TDC Offset Estimation from motored Cylinder Pressure Data based on Heat Release
Shaping. IFP Energies nouvelles, Vol.66, No. 4, pp. 705-716. 2011.
49. Maddox RN, Moshfeghian M, Idol JD, Johannes AH. Natural Gas. Springer. 2007.
50. Kaiadi M. Diluted Operation of a Heavy-duty Natural Gas Engine. Doctoral Thesis. Division of
Combustion Engines, Department of Energy Sciences, Faculty of Engineering, Lund University.
2011.
51. Epa.com [homepage on the Internet] [updated 2013; cited 16 October 2013] Available from
http://www.epa.gov/ghgreporting/ghgdata/reported/petroleum .html
52. Draper C. The physical effect of detonation in a closed cylindrical chamber. Technical Report 493
NACA. 1935.
53. Aronsson U, Chartier C, Horn U. Andersson Ö, Johansson B, Egnell R. Heat Release Comparison
Between Optical and All-Metal HSDI Diesel Engines. SAE Technical paper 2008-01-1062. 2008.
54. Miller R. Supercharged engine. United state patent office no.: 2817322. 1957.
55. Endo H, Tanaka K, Kakuhama Y, Goda Y, Fujiwaka T, Nishigaki M. Development of the Lean
Burn Miller cycle Gas Engine. COMODIA. 2001.
56. Gatowski JA, Balles EN, Chun KM, Nelson FE, Ekchian JA, Heywood JB. Heat release analysis
of engine pressure data. SAE Technical Paper 841359. 1984.
57. Arcoumanis C, Bae CS, Hu Z. Flow and Combustion in a Four-Valve Spark-Ignition Optical
Engine. SAE International 940475. 1994.
58. Ceviz MA. Kaymaz I. Temperature and air-fuel ratio dependent specific heat ration functions for
lean burned and unburned mixture. Elsevier. 2005.
59. Alkemade CThJ. A Theoretical discussion on some aspects of atomic flourescence spectro.
Netherlands. Rikjs-University;1970.
60. Harrinton JE, Moser M, Santaro RJ, Smyth KS. Laser-induced flourescence measurements of
formaldehyde in a methane/air diffusion flame. Chemical Physics Letters, vol. 202, No. 3-4, pp.
196-202. 1993.
61. Eckbreth AC. Laser Diagnostics for Combustion Temperatures and species. 2th ed. Amsterdam.
Gordon and Breach; 1996.
62. Kojima J, Ikeda Y, Nakajima T. Spatially resolved measurement of OH, CH, and C2
chemiluminescence in the reaction zone of laminar methane/air premixed flames. Proceedings of
the Combustion Institute, Volume 28, pp. 1757-1764. 2000.

43
63. Higgins B, McQuay MQ, Lacas F, Candel S. An experimental study on the effect of pressure and
strain rate on CH chemiluminescence of premixed fuel-lean methane/air flames. Elsevier. 2001.
64. Yukiyoshi F, Haruo H, Shigeo K. In-Cylinder Combustion in a Natural Gas Fuelled Spark
Ignition Engine Probed by High Speed Schlieren Method and Its Dependence on Engine
Specifications. SAE Technical paper 1999-01-1493. 1999.

I

© CIMAC Congress 2013, Shanghai Paper No. 414 2
INTRODUCTION
Increasing environmental emission legislation and laws both at sea and on land have increased the use of the gas engines compared to diesel engines [1]. Thus, the large bore spark-ignited gas engines are becoming a viable alternative, because of the engine type’s ability to reach low NOx emission levels and achieve a high brake efficiency both when used for land based power production and for ship propulsion [2-5]. To improve the brake efficiency of the lean burn gas engine combustion at high load, the Miller cycle is applied. The Miller cycle is when the shorter compression stroke compared to expansion stroke is applied with appropriate valve timings [6]. Thus, the expansion ratio is greater than the compression ratio. The application of the Miller cycle enables lower compression temperatures, decreasing sensitivity for knock and enables a higher load at constant NOx levels [7-8].
When operating a lean burn gas engine at the lean limit with excess air, the combustion instabilities and misfiring probability raise. Unfortunately, lean burning is associated with increased cycle-by-cycle combustion variations. To counteract this effect, pre-combustion chamber technology allows the engine operation at lean conditions [9-10]. The pre-combustion chamber is built into the cylinder head, which is indirectly connected to the main combustion chamber in order to ignite the lean premixed natural gas mixture by a spark plug [10-12]. Typically a pre-combustion chamber volume is around 1-4 % of the compression volume [13].
To the best of the author’s knowledge, no comparable work with a pre-combustion chamber heat release analyses of the four stroke large bore natural gas spark ignited engines has been published with the flame imaging. Kawabata et al. demonstrated with the flame propagation inside the main chamber [3]. Tsunoda et al. established the effect of the Miller cycle in the natural gas engine [7] and Roethlisberger et al. presented the comparison between direct and indirect pre-combustion chamber spark ignition of the natural gas engine [14]. However, there is little known about the combustion processes of the constant volume pre-combustion chamber. Therefore, it is important to focus on heat release and behaviour of flame jet from the pre-combustion chamber into the main chamber to gain a general understanding of these combustion phenomena.
The first Wärtsilä spark ignited (SG) lean burn four-stroke large bore engine was introduced in 1993
[15]. Here, the 34SG (cylinder bore of 340 mm and stroke of 400 mm) engine has a pre-combustion chamber with fuel natural gas supply separated from the main fuel gas flow as shown in Fig. 1. The purpose of having separated fuel supply to pre-combustion chamber is to have close to stoichiometric air-fuel mixture (λ≈1) inside the pre-combustion chamber compared to the lean fuel gas (λ≈2) in the main chamber. The, close to stoichiometric, air-fuel mixture causes a fast combustion in the pre-combustion chamber resulting in high pressure forcing the pre-combustion chamber jet flame to exit into the main chamber generating turbulence and igniting the lean air-fuel mixture in the whole main chamber. This system allows stable and efficient combustion of lean mixtures [16].
Figure 1. The working principle of the W34SG spark ignited lean burn gas engine [17]
The present study has been performed on an optical single cylinder engine. These are described in the next section followed by discussion of the results and conclusions.
EXPERIMENTAL SET-UP
Test engine
The engine used for this work is an optical single cylinder four-stroke lean burn Wärtsilä W34SG natural gas engine. The W34SG has a 400 mm stroke, a 340 mm bore and operates at 750 rpm. The engine is optimized to deliver 500 kW/ cylinder [1]. It also has two intake valves and two exhaust valves, and a pre-combustion chamber (PCC) is attached in the centre of the main chamber, see Fig. 1 and the engine specification in Table 1.
Figure 2 shows the optical engine configuration, which allows access to the combustion chamber. A spacer (red colour) containing four quartz windows were installed between the engine liner and the
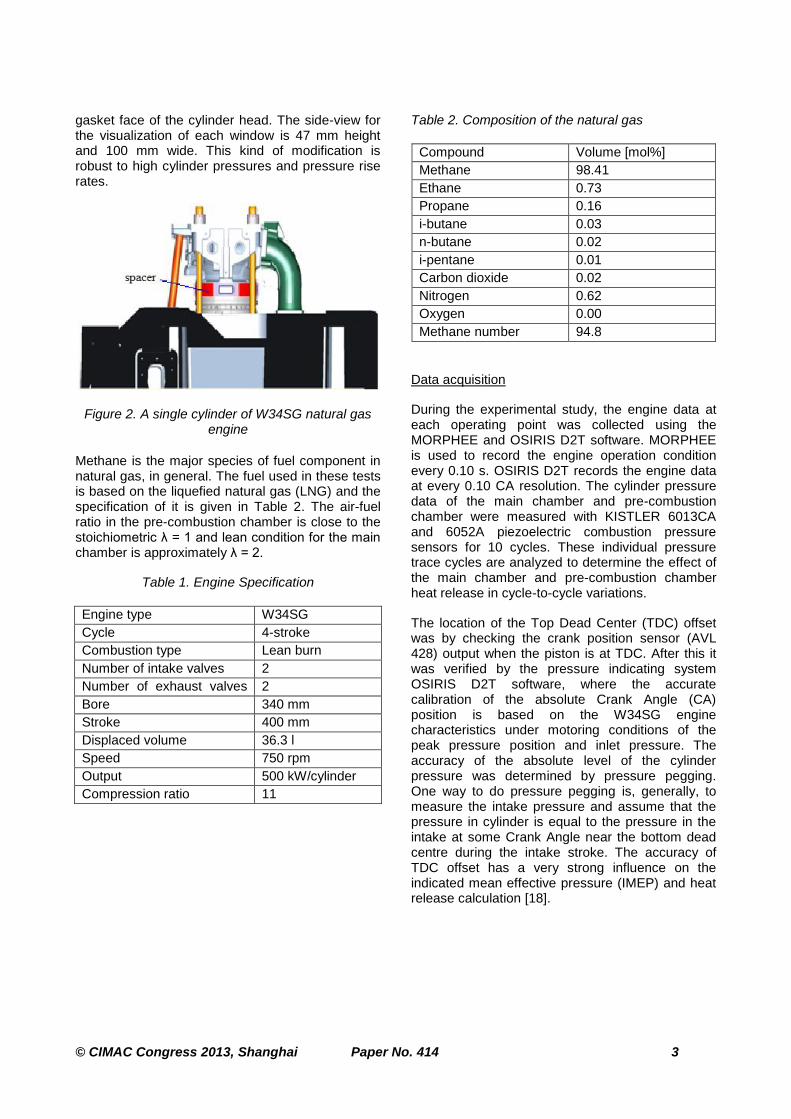
© CIMAC Congress 2013, Shanghai Paper No. 414 3
gasket face of the cylinder head. The side-view for the visualization of each window is 47 mm height and 100 mm wide. This kind of modification is robust to high cylinder pressures and pressure rise rates.
Figure 2. A single cylinder of W34SG natural gas engine
Methane is the major species of fuel component in natural gas, in general. The fuel used in these tests is based on the liquefied natural gas (LNG) and the specification of it is given in Table 2. The air-fuel ratio in the pre-combustion chamber is close to the stoichiometric λ = 1 and lean condition for the main chamber is approximately λ = 2.
Table 1. Engine Specification
Engine type W34SG
Cycle 4-stroke
Combustion type Lean burn
Number of intake valves 2
Number of exhaust valves vvvvvalvalves
2
Bore 340 mm
Stroke 400 mm
Displaced volume 36.3 l
Speed 750 rpm
Output 500 kW/cylinder
Compression ratio 11
Table 2. Composition of the natural gas
Compound Volume [mol%]
Methane 98.41
Ethane 0.73
Propane 0.16
i-butane 0.03
n-butane 0.02
i-pentane 0.01
Carbon dioxide 0.02
Nitrogen 0.62
Oxygen 0.00
Methane number 94.8
Data acquisition
During the experimental study, the engine data at each operating point was collected using the MORPHEE and OSIRIS D2T software. MORPHEE is used to record the engine operation condition every 0.10 s. OSIRIS D2T records the engine data at every 0.10 CA resolution. The cylinder pressure data of the main chamber and pre-combustion chamber were measured with KISTLER 6013CA and 6052A piezoelectric combustion pressure sensors for 10 cycles. These individual pressure trace cycles are analyzed to determine the effect of the main chamber and pre-combustion chamber heat release in cycle-to-cycle variations.
The location of the Top Dead Center (TDC) offset was by checking the crank position sensor (AVL 428) output when the piston is at TDC. After this it was verified by the pressure indicating system OSIRIS D2T software, where the accurate calibration of the absolute Crank Angle (CA) position is based on the W34SG engine characteristics under motoring conditions of the peak pressure position and inlet pressure. The accuracy of the absolute level of the cylinder pressure was determined by pressure pegging. One way to do pressure pegging is, generally, to measure the intake pressure and assume that the pressure in cylinder is equal to the pressure in the intake at some Crank Angle near the bottom dead centre during the intake stroke. The accuracy of TDC offset has a very strong influence on the indicated mean effective pressure (IMEP) and heat release calculation [18].
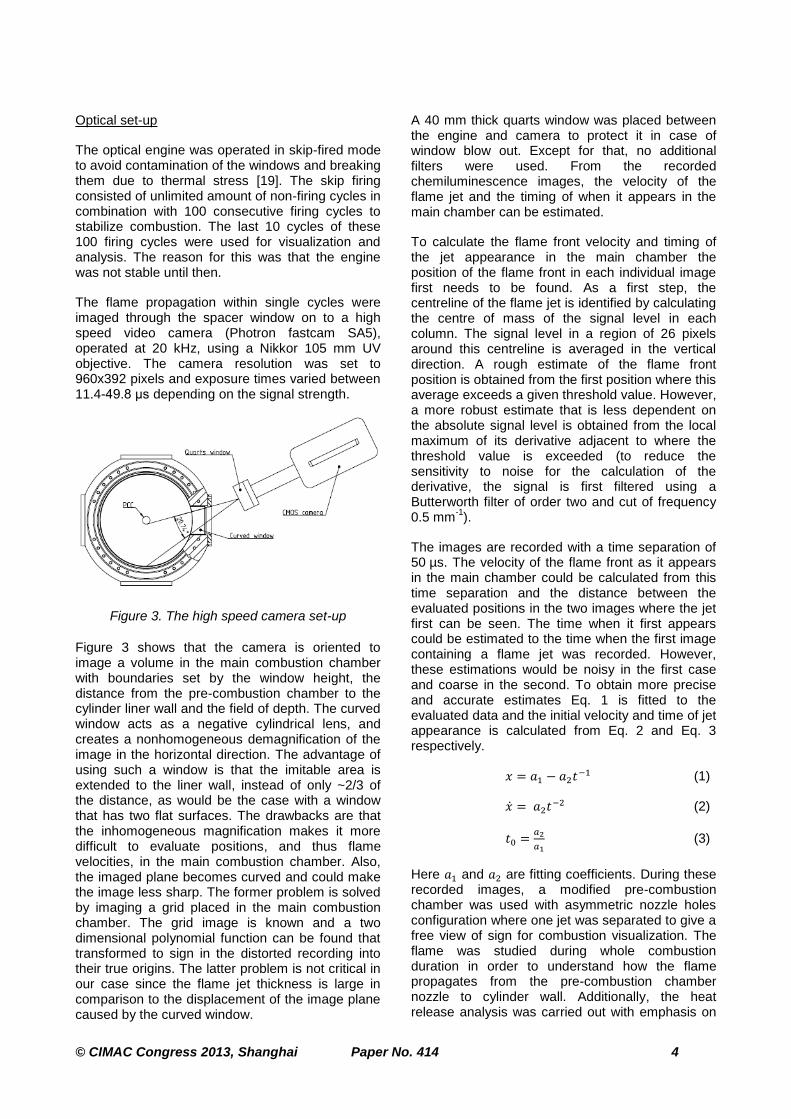
© CIMAC Congress 2013, Shanghai Paper No. 414 4
Optical set-up
The optical engine was operated in skip-fired mode to avoid contamination of the windows and breaking them due to thermal stress [19]. The skip firing consisted of unlimited amount of non-firing cycles in combination with 100 consecutive firing cycles to stabilize combustion. The last 10 cycles of these 100 firing cycles were used for visualization and analysis. The reason for this was that the engine was not stable until then.
The flame propagation within single cycles were imaged through the spacer window on to a high speed video camera (Photron fastcam SA5), operated at 20 kHz, using a Nikkor 105 mm UV objective. The camera resolution was set to 960x392 pixels and exposure times varied between 11.4-49.8 μs depending on the signal strength.
Figure 3. The high speed camera set-up
Figure 3 shows that the camera is oriented to image a volume in the main combustion chamber with boundaries set by the window height, the distance from the pre-combustion chamber to the cylinder liner wall and the field of depth. The curved window acts as a negative cylindrical lens, and creates a nonhomogeneous demagnification of the image in the horizontal direction. The advantage of using such a window is that the imitable area is extended to the liner wall, instead of only ~2/3 of the distance, as would be the case with a window that has two flat surfaces. The drawbacks are that the inhomogeneous magnification makes it more difficult to evaluate positions, and thus flame velocities, in the main combustion chamber. Also, the imaged plane becomes curved and could make the image less sharp. The former problem is solved by imaging a grid placed in the main combustion chamber. The grid image is known and a two dimensional polynomial function can be found that transformed to sign in the distorted recording into their true origins. The latter problem is not critical in our case since the flame jet thickness is large in comparison to the displacement of the image plane caused by the curved window.
A 40 mm thick quarts window was placed between the engine and camera to protect it in case of window blow out. Except for that, no additional filters were used. From the recorded chemiluminescence images, the velocity of the flame jet and the timing of when it appears in the main chamber can be estimated.
To calculate the flame front velocity and timing of the jet appearance in the main chamber the position of the flame front in each individual image first needs to be found. As a first step, the centreline of the flame jet is identified by calculating the centre of mass of the signal level in each column. The signal level in a region of 26 pixels around this centreline is averaged in the vertical direction. A rough estimate of the flame front position is obtained from the first position where this average exceeds a given threshold value. However, a more robust estimate that is less dependent on the absolute signal level is obtained from the local maximum of its derivative adjacent to where the threshold value is exceeded (to reduce the sensitivity to noise for the calculation of the derivative, the signal is first filtered using a Butterworth filter of order two and cut of frequency 0.5 mm
-1).
The images are recorded with a time separation of 50 µs. The velocity of the flame front as it appears in the main chamber could be calculated from this time separation and the distance between the evaluated positions in the two images where the jet first can be seen. The time when it first appears could be estimated to the time when the first image containing a flame jet was recorded. However, these estimations would be noisy in the first case and coarse in the second. To obtain more precise and accurate estimates Eq. 1 is fitted to the evaluated data and the initial velocity and time of jet appearance is calculated from Eq. 2 and Eq. 3 respectively.
(1)
(2)
(3)
Here and are fitting coefficients. During these recorded images, a modified pre-combustion chamber was used with asymmetric nozzle holes configuration where one jet was separated to give a free view of sign for combustion visualization. The flame was studied during whole combustion duration in order to understand how the flame propagates from the pre-combustion chamber nozzle to cylinder wall. Additionally, the heat release analysis was carried out with emphasis on
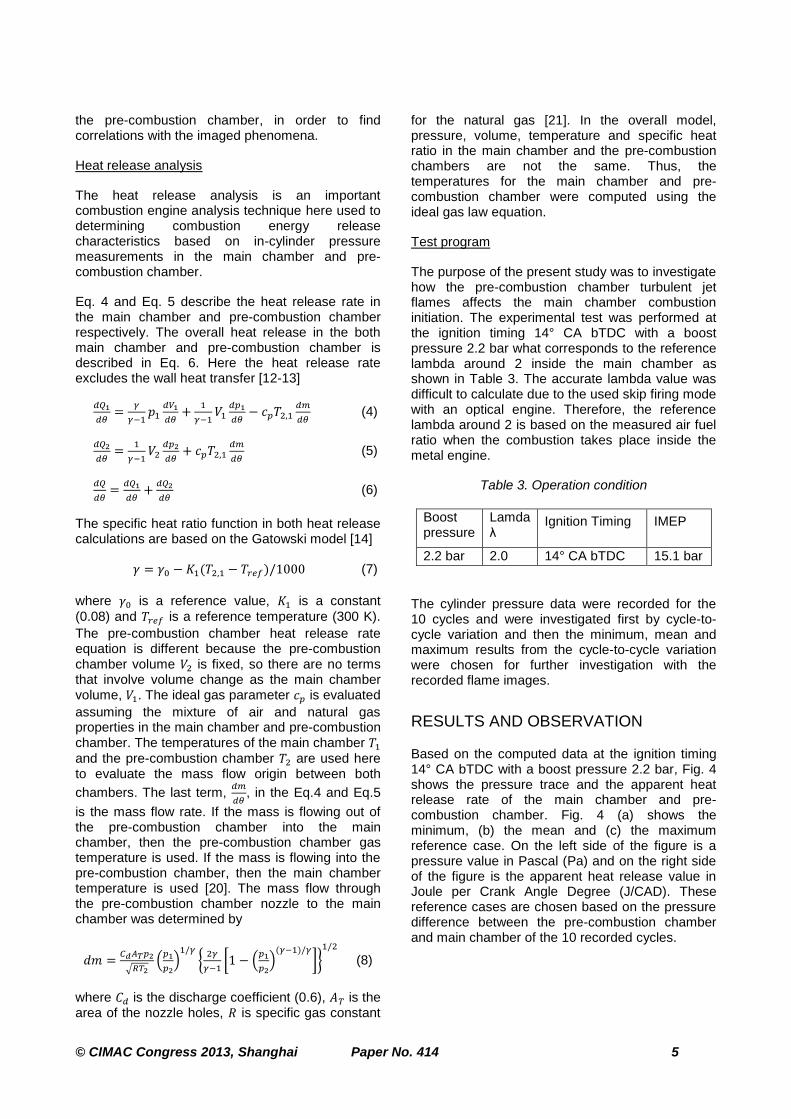
© CIMAC Congress 2013, Shanghai Paper No. 414 5
the pre-combustion chamber, in order to find correlations with the imaged phenomena.
Heat release analysis
The heat release analysis is an important combustion engine analysis technique here used to determining combustion energy release characteristics based on in-cylinder pressure measurements in the main chamber and pre-combustion chamber.
Eq. 4 and Eq. 5 describe the heat release rate in the main chamber and pre-combustion chamber respectively. The overall heat release in the both main chamber and pre-combustion chamber is described in Eq. 6. Here the heat release rate excludes the wall heat transfer [12-13]
(4)
(5)
(6)
The specific heat ratio function in both heat release calculations are based on the Gatowski model [14]
(7)
where is a reference value, is a constant
(0.08) and is a reference temperature (300 K).
The pre-combustion chamber heat release rate equation is different because the pre-combustion chamber volume is fixed, so there are no terms that involve volume change as the main chamber volume, . The ideal gas parameter is evaluated
assuming the mixture of air and natural gas properties in the main chamber and pre-combustion chamber. The temperatures of the main chamber
and the pre-combustion chamber are used here to evaluate the mass flow origin between both
chambers. The last term,
, in the Eq.4 and Eq.5
is the mass flow rate. If the mass is flowing out of the pre-combustion chamber into the main chamber, then the pre-combustion chamber gas temperature is used. If the mass is flowing into the pre-combustion chamber, then the main chamber temperature is used [20]. The mass flow through the pre-combustion chamber nozzle to the main chamber was determined by
(8)
where is the discharge coefficient (0.6), is the area of the nozzle holes, is specific gas constant
for the natural gas [21]. In the overall model, pressure, volume, temperature and specific heat ratio in the main chamber and the pre-combustion chambers are not the same. Thus, the temperatures for the main chamber and pre-combustion chamber were computed using the ideal gas law equation.
Test program
The purpose of the present study was to investigate how the pre-combustion chamber turbulent jet flames affects the main chamber combustion initiation. The experimental test was performed at the ignition timing 14° CA bTDC with a boost pressure 2.2 bar what corresponds to the reference lambda around 2 inside the main chamber as shown in Table 3. The accurate lambda value was difficult to calculate due to the used skip firing mode with an optical engine. Therefore, the reference lambda around 2 is based on the measured air fuel ratio when the combustion takes place inside the metal engine.
Table 3. Operation condition
Boost pressure
Lamda λ
Ignition Timing IMEP
2.2 bar 2.0 14° CA bTDC 15.1 bar
The cylinder pressure data were recorded for the 10 cycles and were investigated first by cycle-to-cycle variation and then the minimum, mean and maximum results from the cycle-to-cycle variation were chosen for further investigation with the recorded flame images.
RESULTS AND OBSERVATION
Based on the computed data at the ignition timing 14° CA bTDC with a boost pressure 2.2 bar, Fig. 4 shows the pressure trace and the apparent heat release rate of the main chamber and pre-combustion chamber. Fig. 4 (a) shows the minimum, (b) the mean and (c) the maximum reference case. On the left side of the figure is a pressure value in Pascal (Pa) and on the right side of the figure is the apparent heat release value in Joule per Crank Angle Degree (J/CAD). These reference cases are chosen based on the pressure difference between the pre-combustion chamber and main chamber of the 10 recorded cycles.
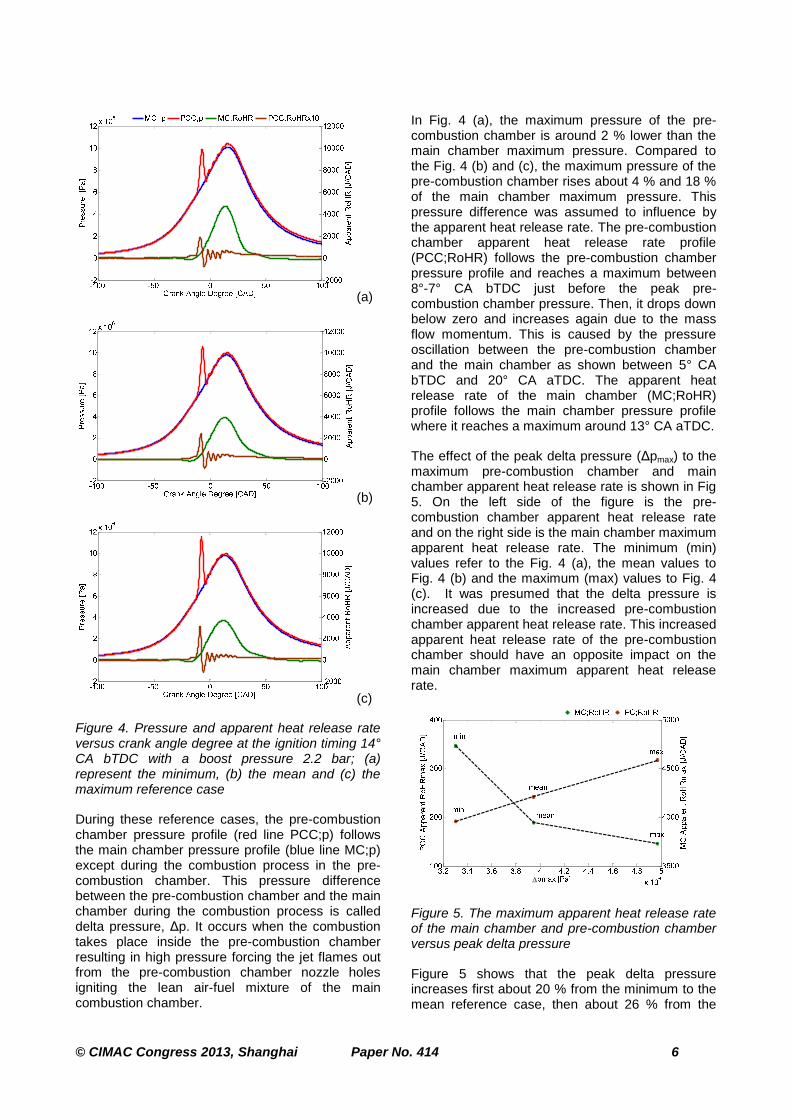
© CIMAC Congress 2013, Shanghai Paper No. 414 6
(a)
(b)
(c)
Figure 4. Pressure and apparent heat release rate versus crank angle degree at the ignition timing 14° CA bTDC with a boost pressure 2.2 bar; (a) represent the minimum, (b) the mean and (c) the maximum reference case
During these reference cases, the pre-combustion chamber pressure profile (red line PCC;p) follows the main chamber pressure profile (blue line MC;p) except during the combustion process in the pre-combustion chamber. This pressure difference between the pre-combustion chamber and the main chamber during the combustion process is called delta pressure, Δp. It occurs when the combustion takes place inside the pre-combustion chamber resulting in high pressure forcing the jet flames out from the pre-combustion chamber nozzle holes igniting the lean air-fuel mixture of the main combustion chamber.
In Fig. 4 (a), the maximum pressure of the pre-combustion chamber is around 2 % lower than the main chamber maximum pressure. Compared to the Fig. 4 (b) and (c), the maximum pressure of the pre-combustion chamber rises about 4 % and 18 % of the main chamber maximum pressure. This pressure difference was assumed to influence by the apparent heat release rate. The pre-combustion chamber apparent heat release rate profile (PCC;RoHR) follows the pre-combustion chamber pressure profile and reaches a maximum between 8°-7° CA bTDC just before the peak pre-combustion chamber pressure. Then, it drops down below zero and increases again due to the mass flow momentum. This is caused by the pressure oscillation between the pre-combustion chamber and the main chamber as shown between 5° CA bTDC and 20° CA aTDC. The apparent heat release rate of the main chamber (MC;RoHR) profile follows the main chamber pressure profile where it reaches a maximum around 13° CA aTDC.
The effect of the peak delta pressure (Δpmax) to the maximum pre-combustion chamber and main chamber apparent heat release rate is shown in Fig 5. On the left side of the figure is the pre-combustion chamber apparent heat release rate and on the right side is the main chamber maximum apparent heat release rate. The minimum (min) values refer to the Fig. 4 (a), the mean values to Fig. 4 (b) and the maximum (max) values to Fig. 4 (c). It was presumed that the delta pressure is increased due to the increased pre-combustion chamber apparent heat release rate. This increased apparent heat release rate of the pre-combustion chamber should have an opposite impact on the main chamber maximum apparent heat release rate.
Figure 5. The maximum apparent heat release rate of the main chamber and pre-combustion chamber versus peak delta pressure
Figure 5 shows that the peak delta pressure increases first about 20 % from the minimum to the mean reference case, then about 26 % from the
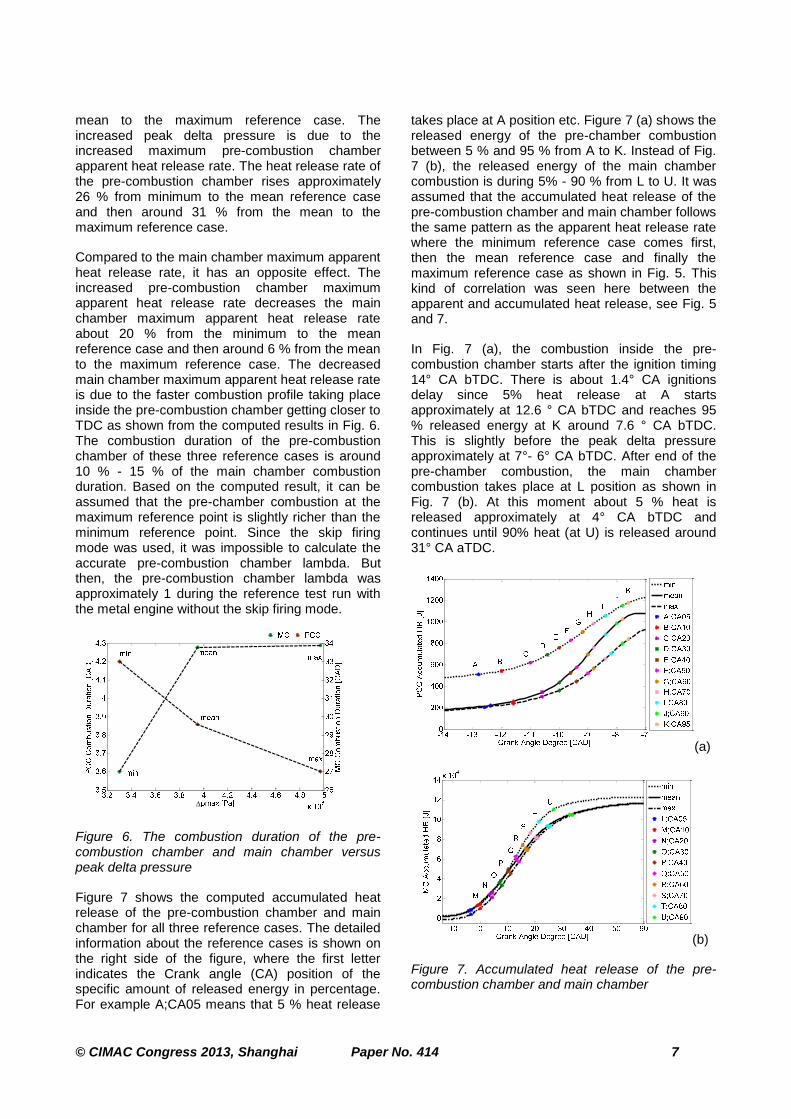
© CIMAC Congress 2013, Shanghai Paper No. 414 7
mean to the maximum reference case. The increased peak delta pressure is due to the increased maximum pre-combustion chamber apparent heat release rate. The heat release rate of the pre-combustion chamber rises approximately 26 % from minimum to the mean reference case and then around 31 % from the mean to the maximum reference case.
Compared to the main chamber maximum apparent heat release rate, it has an opposite effect. The increased pre-combustion chamber maximum apparent heat release rate decreases the main chamber maximum apparent heat release rate about 20 % from the minimum to the mean reference case and then around 6 % from the mean to the maximum reference case. The decreased main chamber maximum apparent heat release rate is due to the faster combustion profile taking place inside the pre-combustion chamber getting closer to TDC as shown from the computed results in Fig. 6. The combustion duration of the pre-combustion chamber of these three reference cases is around 10 % - 15 % of the main chamber combustion duration. Based on the computed result, it can be assumed that the pre-chamber combustion at the maximum reference point is slightly richer than the minimum reference point. Since the skip firing mode was used, it was impossible to calculate the accurate pre-combustion chamber lambda. But then, the pre-combustion chamber lambda was approximately 1 during the reference test run with the metal engine without the skip firing mode.
Figure 6. The combustion duration of the pre-combustion chamber and main chamber versus peak delta pressure
Figure 7 shows the computed accumulated heat release of the pre-combustion chamber and main chamber for all three reference cases. The detailed information about the reference cases is shown on the right side of the figure, where the first letter indicates the Crank angle (CA) position of the specific amount of released energy in percentage. For example A;CA05 means that 5 % heat release
takes place at A position etc. Figure 7 (a) shows the released energy of the pre-chamber combustion between 5 % and 95 % from A to K. Instead of Fig. 7 (b), the released energy of the main chamber combustion is during 5% - 90 % from L to U. It was assumed that the accumulated heat release of the pre-combustion chamber and main chamber follows the same pattern as the apparent heat release rate where the minimum reference case comes first, then the mean reference case and finally the maximum reference case as shown in Fig. 5. This kind of correlation was seen here between the apparent and accumulated heat release, see Fig. 5 and 7.
In Fig. 7 (a), the combustion inside the pre-combustion chamber starts after the ignition timing 14° CA bTDC. There is about 1.4° CA ignitions delay since 5% heat release at A starts approximately at 12.6 ° CA bTDC and reaches 95 % released energy at K around 7.6 ° CA bTDC. This is slightly before the peak delta pressure approximately at 7°- 6° CA bTDC. After end of the pre-chamber combustion, the main chamber combustion takes place at L position as shown in Fig. 7 (b). At this moment about 5 % heat is released approximately at 4° CA bTDC and continues until 90% heat (at U) is released around 31° CA aTDC.
(a)
(b)
Figure 7. Accumulated heat release of the pre-combustion chamber and main chamber
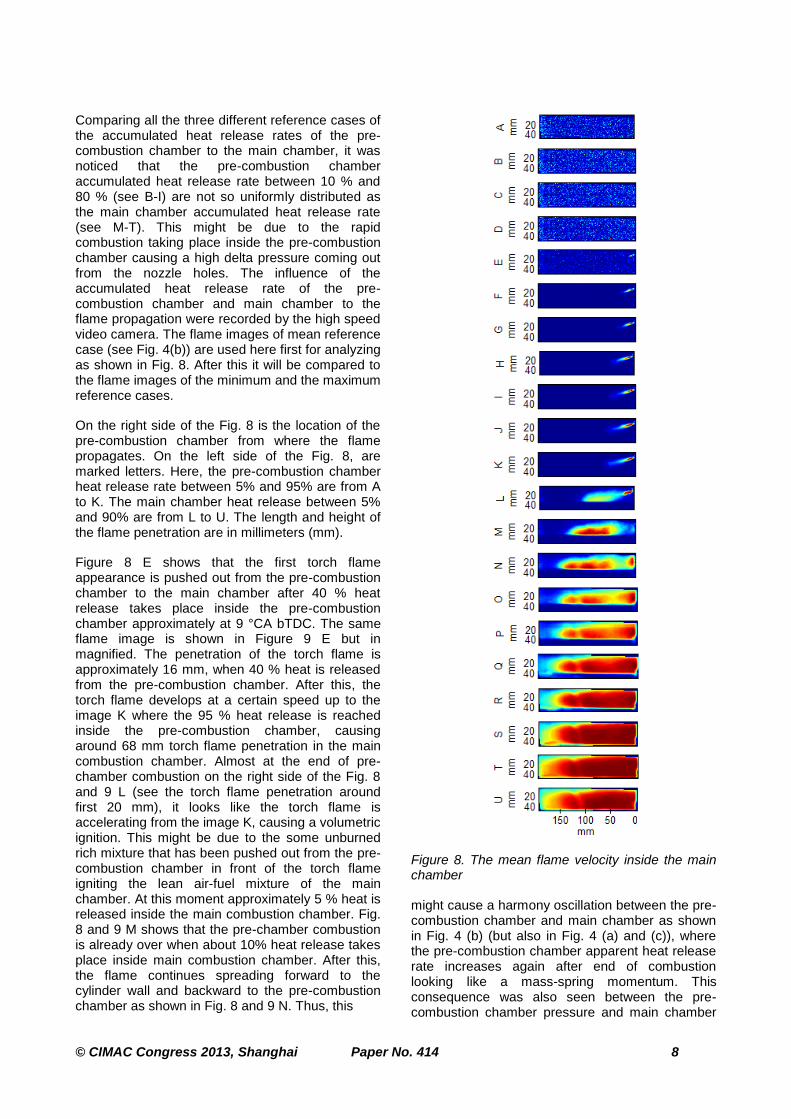
© CIMAC Congress 2013, Shanghai Paper No. 414 8
Comparing all the three different reference cases of the accumulated heat release rates of the pre-combustion chamber to the main chamber, it was noticed that the pre-combustion chamber accumulated heat release rate between 10 % and 80 % (see B-I) are not so uniformly distributed as the main chamber accumulated heat release rate (see M-T). This might be due to the rapid combustion taking place inside the pre-combustion chamber causing a high delta pressure coming out from the nozzle holes. The influence of the accumulated heat release rate of the pre-combustion chamber and main chamber to the flame propagation were recorded by the high speed video camera. The flame images of mean reference case (see Fig. 4(b)) are used here first for analyzing as shown in Fig. 8. After this it will be compared to the flame images of the minimum and the maximum reference cases.
On the right side of the Fig. 8 is the location of the pre-combustion chamber from where the flame propagates. On the left side of the Fig. 8, are marked letters. Here, the pre-combustion chamber heat release rate between 5% and 95% are from A to K. The main chamber heat release between 5% and 90% are from L to U. The length and height of the flame penetration are in millimeters (mm).
Figure 8 E shows that the first torch flame appearance is pushed out from the pre-combustion chamber to the main chamber after 40 % heat release takes place inside the pre-combustion chamber approximately at 9 °CA bTDC. The same flame image is shown in Figure 9 E but in magnified. The penetration of the torch flame is approximately 16 mm, when 40 % heat is released from the pre-combustion chamber. After this, the torch flame develops at a certain speed up to the image K where the 95 % heat release is reached inside the pre-combustion chamber, causing around 68 mm torch flame penetration in the main combustion chamber. Almost at the end of pre-chamber combustion on the right side of the Fig. 8 and 9 L (see the torch flame penetration around first 20 mm), it looks like the torch flame is accelerating from the image K, causing a volumetric ignition. This might be due to the some unburned rich mixture that has been pushed out from the pre-combustion chamber in front of the torch flame igniting the lean air-fuel mixture of the main chamber. At this moment approximately 5 % heat is released inside the main combustion chamber. Fig. 8 and 9 M shows that the pre-chamber combustion is already over when about 10% heat release takes place inside main combustion chamber. After this, the flame continues spreading forward to the cylinder wall and backward to the pre-combustion chamber as shown in Fig. 8 and 9 N. Thus, this
Figure 8. The mean flame velocity inside the main chamber
might cause a harmony oscillation between the pre-combustion chamber and main chamber as shown in Fig. 4 (b) (but also in Fig. 4 (a) and (c)), where the pre-combustion chamber apparent heat release rate increases again after end of combustion looking like a mass-spring momentum. This consequence was also seen between the pre-combustion chamber pressure and main chamber
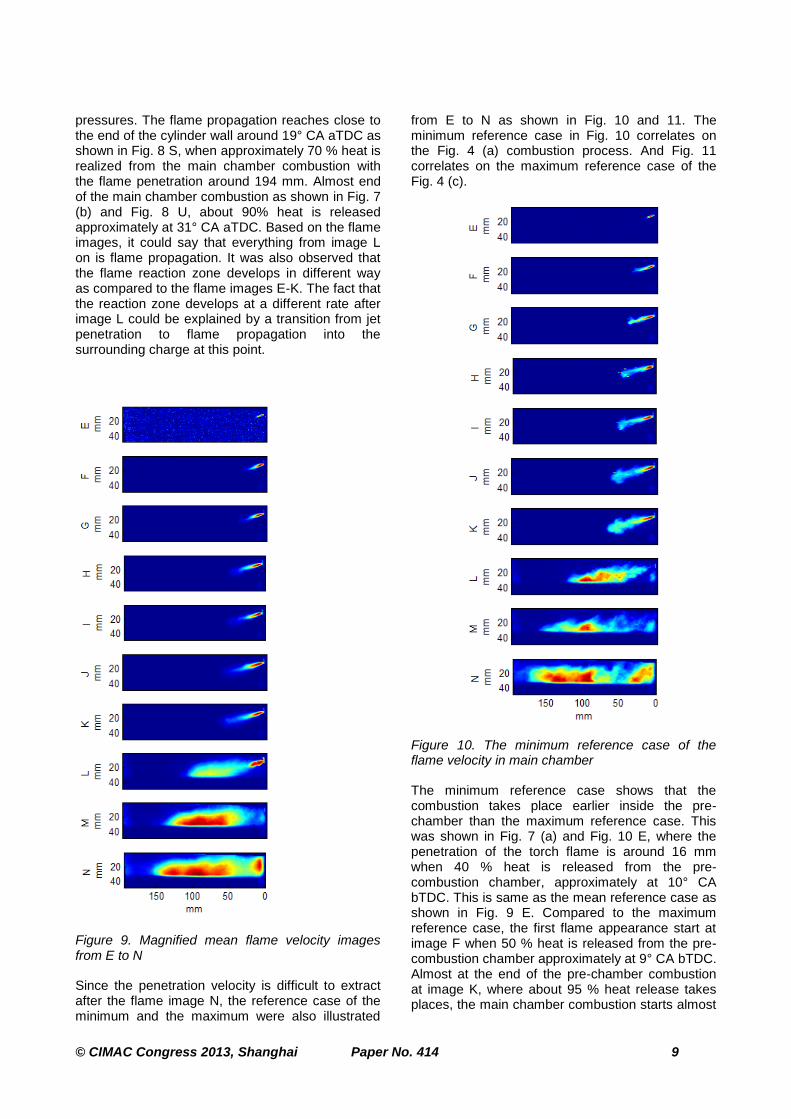
© CIMAC Congress 2013, Shanghai Paper No. 414 9
pressures. The flame propagation reaches close to the end of the cylinder wall around 19° CA aTDC as shown in Fig. 8 S, when approximately 70 % heat is realized from the main chamber combustion with the flame penetration around 194 mm. Almost end of the main chamber combustion as shown in Fig. 7 (b) and Fig. 8 U, about 90% heat is released approximately at 31° CA aTDC. Based on the flame images, it could say that everything from image L on is flame propagation. It was also observed that the flame reaction zone develops in different way as compared to the flame images E-K. The fact that the reaction zone develops at a different rate after image L could be explained by a transition from jet penetration to flame propagation into the surrounding charge at this point.
Figure 9. Magnified mean flame velocity images from E to N
Since the penetration velocity is difficult to extract after the flame image N, the reference case of the minimum and the maximum were also illustrated
from E to N as shown in Fig. 10 and 11. The minimum reference case in Fig. 10 correlates on the Fig. 4 (a) combustion process. And Fig. 11 correlates on the maximum reference case of the Fig. 4 (c).
Figure 10. The minimum reference case of the flame velocity in main chamber
The minimum reference case shows that the combustion takes place earlier inside the pre- chamber than the maximum reference case. This was shown in Fig. 7 (a) and Fig. 10 E, where the penetration of the torch flame is around 16 mm when 40 % heat is released from the pre-combustion chamber, approximately at 10° CA bTDC. This is same as the mean reference case as shown in Fig. 9 E. Compared to the maximum reference case, the first flame appearance start at image F when 50 % heat is released from the pre-combustion chamber approximately at 9° CA bTDC. Almost at the end of the pre-chamber combustion at image K, where about 95 % heat release takes places, the main chamber combustion starts almost
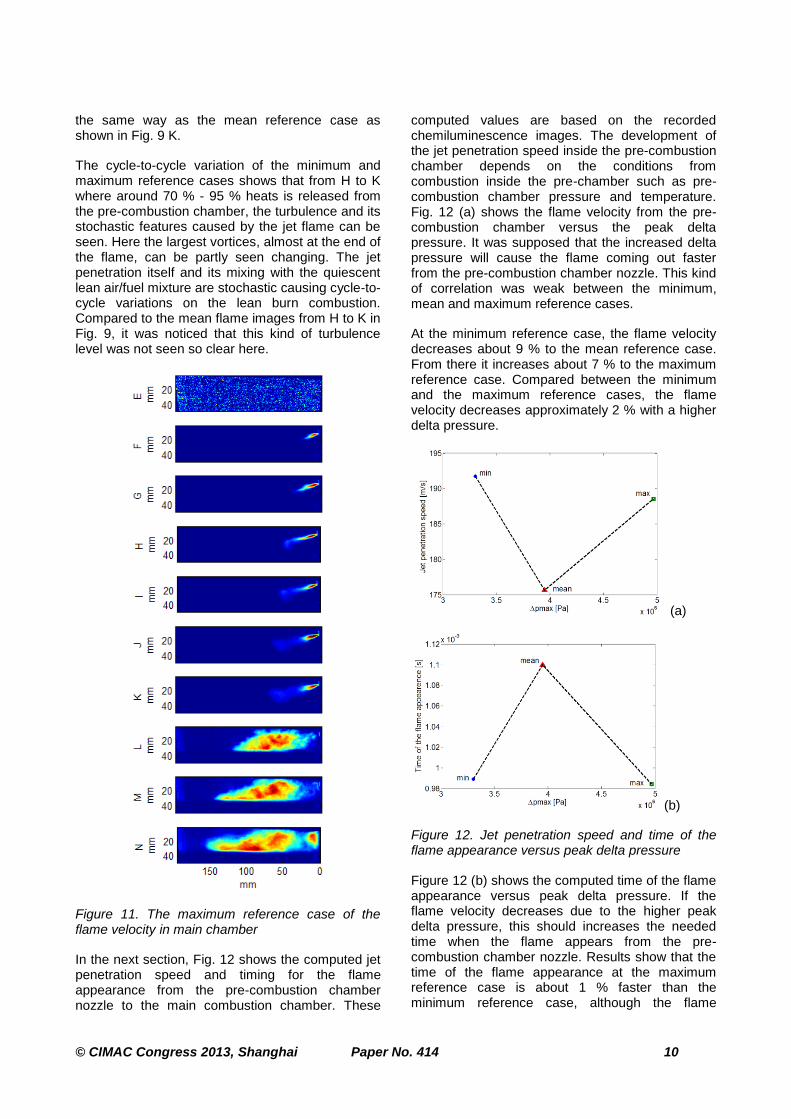
© CIMAC Congress 2013, Shanghai Paper No. 414 10
the same way as the mean reference case as shown in Fig. 9 K.
The cycle-to-cycle variation of the minimum and maximum reference cases shows that from H to K where around 70 % - 95 % heats is released from the pre-combustion chamber, the turbulence and its stochastic features caused by the jet flame can be seen. Here the largest vortices, almost at the end of the flame, can be partly seen changing. The jet penetration itself and its mixing with the quiescent lean air/fuel mixture are stochastic causing cycle-to-cycle variations on the lean burn combustion. Compared to the mean flame images from H to K in Fig. 9, it was noticed that this kind of turbulence level was not seen so clear here.
Figure 11. The maximum reference case of the flame velocity in main chamber
In the next section, Fig. 12 shows the computed jet penetration speed and timing for the flame appearance from the pre-combustion chamber nozzle to the main combustion chamber. These
computed values are based on the recorded chemiluminescence images. The development of the jet penetration speed inside the pre-combustion chamber depends on the conditions from combustion inside the pre-chamber such as pre-combustion chamber pressure and temperature. Fig. 12 (a) shows the flame velocity from the pre-combustion chamber versus the peak delta pressure. It was supposed that the increased delta pressure will cause the flame coming out faster from the pre-combustion chamber nozzle. This kind of correlation was weak between the minimum, mean and maximum reference cases.
At the minimum reference case, the flame velocity decreases about 9 % to the mean reference case. From there it increases about 7 % to the maximum reference case. Compared between the minimum and the maximum reference cases, the flame velocity decreases approximately 2 % with a higher delta pressure.
(a)
(b)
Figure 12. Jet penetration speed and time of the flame appearance versus peak delta pressure
Figure 12 (b) shows the computed time of the flame appearance versus peak delta pressure. If the flame velocity decreases due to the higher peak delta pressure, this should increases the needed time when the flame appears from the pre-combustion chamber nozzle. Results show that the time of the flame appearance at the maximum reference case is about 1 % faster than the minimum reference case, although the flame
© CIMAC Congress 2013, Shanghai Paper No. 414 11
velocity of the minimum reference case is about 2 % faster than the maximum reference case. Compared to mean reference case, the time of the flame appearance is about 11 % slower than the minimum and the maximum reference case. Base on these computed results, there is no correlations between the flame velocity and the time of the flame appearance except at the mean reference case. The reason for this might be due to the big variations in the cycle-to-cycle combustion inside the pre-combustion chamber as seen from the turbulence flame velocities between Fig. 9 and 11.
The further investigation about the impact of the engine parameters to the pre-chamber and main chamber combustion is covered in another paper. This fist part of the paper deals with the flame images from the pre-combustion chamber to the main chamber combustion.
CONCLUSION
An experimental study was made to investigate the in-cylinder combustion in a spark ignited four-stroke large bore gas engine of W34SG. The flame propagation in an optical single cylinder was recorded by the high speed video camera from the pre-combustion chamber to the cylinder wall. The results showed the combustion behavior from cycle-to-cycle variation between the minimum, mean and maximum reference case.
Base on the apparent heat release modeling from the pressure trace data, the following observation and conclusion are made with the computed flame images
The increased pressure difference between the pre-combustion chamber and main chamber is due to the increased pre-combustion chamber apparent heat release rate. This will have an opposite impact on the main chamber apparent heat release rate
The main chamber combustion takes places after 95 % heat is realized from the pre-combustion chamber
The flame propagation for the cycle-to-cycle variation is caused by the turbulence flow inside the main chamber
There is a weak correlation between the flame velocity and the time of the flame appearance. This is due to the cycle-to cycle variation inside the pre-combustion chamber
NOMENCLATURE
area of the nozzle holes
bTDC before top dead centre
CA crank angle
discharge coefficient
Hz hertz
IMEP indicated mean effective pressure
kW kilowatt
L liter
LNG liquefied natural gas
mm millimetre
PCC pre-combustion chamber
main chamber pressure
pre-combustion chamber pressure
specific gas constant
rpm revolutions per minute
TDC top dead centre
PCC temperature
reference temperature
main chamber volume
pre-combustion chamber volume
λ air excess ratio
reference value
ACKNOWLEDGEMENTS
This research work was carried out at Waskiluoto Validation Center of Wärtsilä Finland Oy. It was partially financed by Nordforsk. The authors wish to thank Staffan Nysand, Alberto Cafari, Jussi Seppä, Christian Haka, Jussi Autio, Herman Selvaraj, and Lendormy Eric for all their support during this study
© CIMAC Congress 2013, Shanghai Paper No. 414 12
REFERENCES
1. Sillanpaeae H., and Astrand U., "Wärtsilä gas
engines – the green power alternative", CIMAC
Congress paper no.:95, 2010.
2. Goto Y., and Narusawa K., "Combustion
stabilization of a spark ignition natural gas engine",
Elvisier and Society of Automotive Engineers of
Japan, Rev. Dec. 1995.
3. Kawabata Y., and Mori D., "Combustion
Diagnostics & Improvement of a Prechamber Lean-
Burn Natural Gas Engine, SAE Technical Paper
2004-01-0979, 2004.
4. Laiho J., and Rösgren C., "Pre-combustion chamber
unit of combustion engine ", Patent no.:
EP2265806A1, Wärtsilä Finland Oy, 2008.
5. Manivannan A., Tamil porail P., and
Chandrasekaran S., "Lean Burn Natural Gas Spark
Ignition Engine-An Overview," SAE international
2003-01-0638, 2003.
6. Miller R., "Supercharged engine", United state
patent office no.: 2817322, 1957.
7. Tsunoda A., Shimoda H., and Takaishi T.,
"Mitsubishi Lean-burn Gas Engine with World’s
Highest Thermal Efficiency," Technical Review
Vol.40 No.4, 2003.
8. Endo H., Tanaka K., Kakuhama Y., Goda Y.,
Fujiwaka T., and Nishigaki M., "Development of the
Lean Burn Miller cycle Gas Engine, " COMODIA,
2001.
9. Maddox R. N., Moshfeghian, N. Idol J. D., and
Johannes A. H., "Natural Gas, "Riegel’s Handbook
of Industrial Chemistry 10th Edition, " 2006, pp.
545-569, doi:XXX.
10. Ruter M. D., Olsen D. B., Scotto M. V., and Perna
M. A., "NOx reduction from a large bore natural gas
engine via reformed natural gas prechamber fueling
optimization," Elvisier Fuel, 2011.
11. Kawabata Y., and Mori D., "Combustion
Diagnostics & Improvement of a Prechamber Lean-
Burn Natural Gas Engine, SAE Technical Paper
2004-01-0979, 2004.
12. Tsunoda A., Shimoda H., and Takaishi T.,
"Mitsubishi Lean-burn Gas Engine with World’s
Highest Thermal Efficiency," Technical Review
Vol.40 No.4, 2003.
13. Heywood J.B., " Internal Combustion Engine
Fundamentals, " 1988.
14. Roetlisberger R. P., Favrat D., "Comparision
between direct and indirect (prechamber) spark
ignition in the case of a cogeneration natural gas
engine, part II: engine operating parameters and
turbocharger characteristics", Elvisier Science,
2002.
15. Wärtsilä Sweden, "Historien om Verkstain –
NOHAB och Wärtsilä Diesel i Trollhätten", Lilla
Edels Trykeri AB, 2003, ISBN 91-631-4686-X
16. Wärtsilä homepage
[http://www.wartsila.com/en/power-
plants/technology/combustion-engines/gas-engines]
17. Ingemar Nylund, "Status and potentials of the gas
engines", CIMAC paper no.: 163
18. Tunestål P., "TDC Offset Estimation from motored
Cylinder Pressure Data based on Heat Release
Shaping," IFP Energies nouvelles, 2011, Vol.66,
No. 4, pp. 705-716
19. Aronsson U., Chartier C., Horn U., Andersson Ö.,
Johansson B., Egnell R., "Heat Release Comparison
Between Optical and All-Metal HSDI Diesel
Engines", SAE Technical paper 2008-01-1062,
2008.
20. Ceviz M.A. and Kaymaz I., "Temperature and air-
fuel ratio dependent specific heat ration functions
for lean burned and unburned mixture, " Elsevier
Ltd, 2005, doi:10.1016/j.enconman.2004.12.009.
21. Arcooumanis C., Bae C. S., and Hu Z., "Flow and
Combustion in a Four-Valve Spark-Ignition Optical
Engine," SAE International 940475, 1994.

II
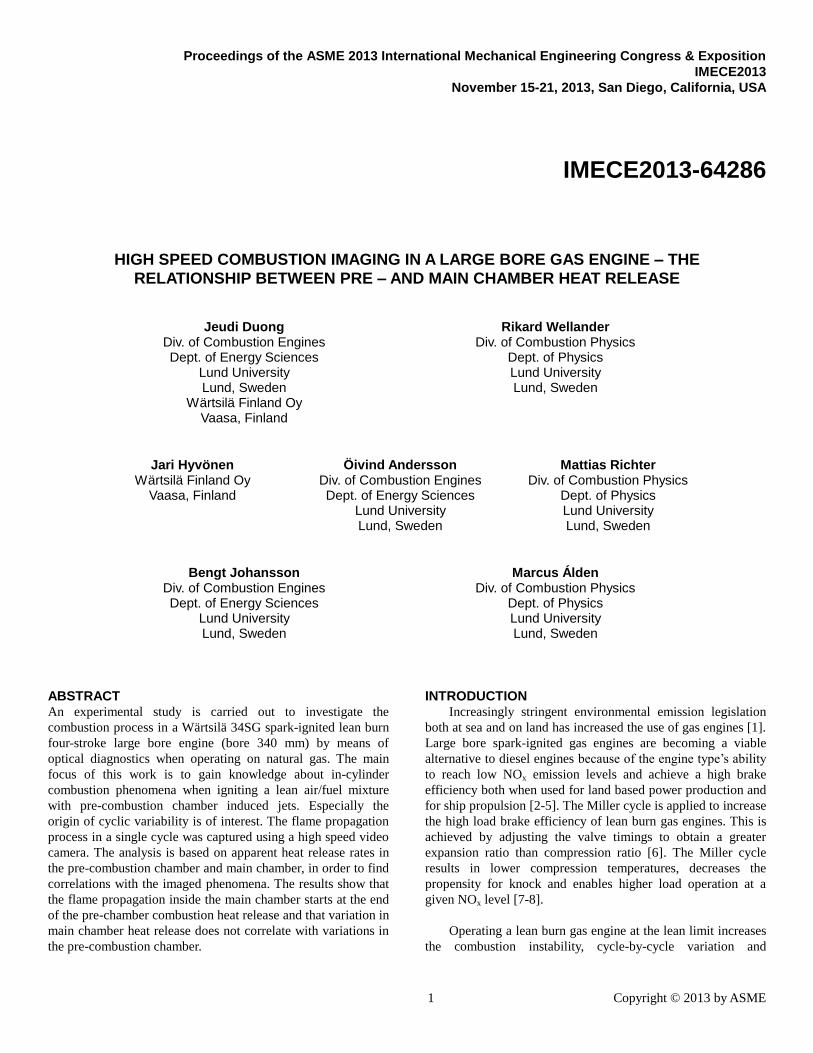
1 Copyright © 2013 by ASME
Proceedings of the ASME 2013 International Mechanical Engineering Congress & Exposition
IMECE2013
November 15-21, 2013, San Diego, California, USA
IMECE2013-64286
HIGH SPEED COMBUSTION IMAGING IN A LARGE BORE GAS ENGINE – THE
RELATIONSHIP BETWEEN PRE – AND MAIN CHAMBER HEAT RELEASE
Jeudi Duong Div. of Combustion Engines Dept. of Energy Sciences
Lund University Lund, Sweden
Wärtsilä Finland Oy Vaasa, Finland
Rikard Wellander Div. of Combustion Physics
Dept. of Physics Lund University Lund, Sweden
Jari Hyvönen Wärtsilä Finland Oy
Vaasa, Finland
Öivind Andersson Div. of Combustion Engines Dept. of Energy Sciences
Lund University Lund, Sweden
Mattias Richter Div. of Combustion Physics
Dept. of Physics Lund University Lund, Sweden
Bengt Johansson Div. of Combustion Engines Dept. of Energy Sciences
Lund University Lund, Sweden
Marcus Álden Div. of Combustion Physics
Dept. of Physics Lund University Lund, Sweden
ABSTRACT An experimental study is carried out to investigate the
combustion process in a Wärtsilä 34SG spark-ignited lean burn
four-stroke large bore engine (bore 340 mm) by means of
optical diagnostics when operating on natural gas. The main
focus of this work is to gain knowledge about in-cylinder
combustion phenomena when igniting a lean air/fuel mixture
with pre-combustion chamber induced jets. Especially the
origin of cyclic variability is of interest. The flame propagation
process in a single cycle was captured using a high speed video
camera. The analysis is based on apparent heat release rates in
the pre-combustion chamber and main chamber, in order to find
correlations with the imaged phenomena. The results show that
the flame propagation inside the main chamber starts at the end
of the pre-chamber combustion heat release and that variation in
main chamber heat release does not correlate with variations in
the pre-combustion chamber.
INTRODUCTION Increasingly stringent environmental emission legislation
both at sea and on land has increased the use of gas engines [1].
Large bore spark-ignited gas engines are becoming a viable
alternative to diesel engines because of the engine type’s ability
to reach low NOx emission levels and achieve a high brake
efficiency both when used for land based power production and
for ship propulsion [2-5]. The Miller cycle is applied to increase
the high load brake efficiency of lean burn gas engines. This is
achieved by adjusting the valve timings to obtain a greater
expansion ratio than compression ratio [6]. The Miller cycle
results in lower compression temperatures, decreases the
propensity for knock and enables higher load operation at a
given NOx level [7-8].
Operating a lean burn gas engine at the lean limit increases
the combustion instability, cycle-by-cycle variation and
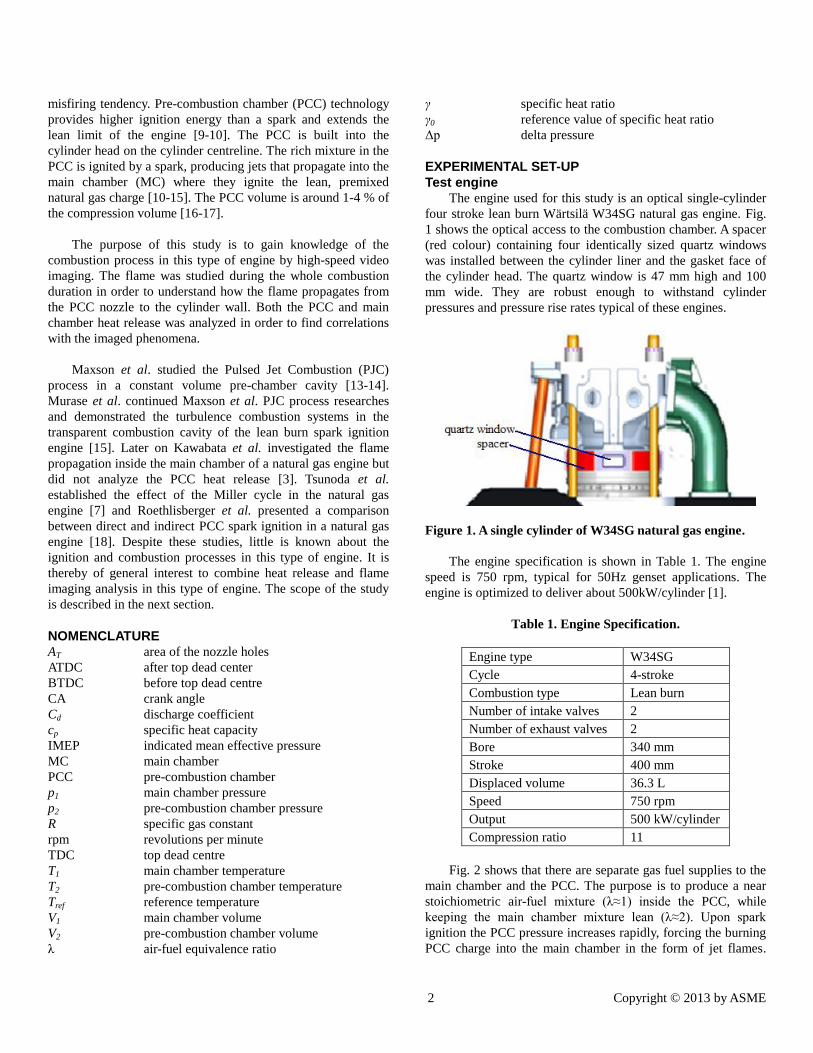
2 Copyright © 2013 by ASME
misfiring tendency. Pre-combustion chamber (PCC) technology
provides higher ignition energy than a spark and extends the
lean limit of the engine [9-10]. The PCC is built into the
cylinder head on the cylinder centreline. The rich mixture in the
PCC is ignited by a spark, producing jets that propagate into the
main chamber (MC) where they ignite the lean, premixed
natural gas charge [10-15]. The PCC volume is around 1-4 % of
the compression volume [16-17].
The purpose of this study is to gain knowledge of the
combustion process in this type of engine by high-speed video
imaging. The flame was studied during the whole combustion
duration in order to understand how the flame propagates from
the PCC nozzle to the cylinder wall. Both the PCC and main
chamber heat release was analyzed in order to find correlations
with the imaged phenomena.
Maxson et al. studied the Pulsed Jet Combustion (PJC)
process in a constant volume pre-chamber cavity [13-14].
Murase et al. continued Maxson et al. PJC process researches
and demonstrated the turbulence combustion systems in the
transparent combustion cavity of the lean burn spark ignition
engine [15]. Later on Kawabata et al. investigated the flame
propagation inside the main chamber of a natural gas engine but
did not analyze the PCC heat release [3]. Tsunoda et al.
established the effect of the Miller cycle in the natural gas
engine [7] and Roethlisberger et al. presented a comparison
between direct and indirect PCC spark ignition in a natural gas
engine [18]. Despite these studies, little is known about the
ignition and combustion processes in this type of engine. It is
thereby of general interest to combine heat release and flame
imaging analysis in this type of engine. The scope of the study
is described in the next section.
NOMENCLATURE AT area of the nozzle holes
ATDC after top dead center
BTDC before top dead centre
CA crank angle
Cd discharge coefficient
cp specific heat capacity
IMEP indicated mean effective pressure
MC main chamber
PCC pre-combustion chamber
p1 main chamber pressure
p2 pre-combustion chamber pressure
R specific gas constant
rpm revolutions per minute
TDC top dead centre
T1 main chamber temperature
T2 pre-combustion chamber temperature
Tref reference temperature
V1 main chamber volume
V2 pre-combustion chamber volume
λ air-fuel equivalence ratio
γ specific heat ratio
γ0 reference value of specific heat ratio
Δp delta pressure
EXPERIMENTAL SET-UP
Test engine The engine used for this study is an optical single-cylinder
four stroke lean burn Wärtsilä W34SG natural gas engine. Fig.
1 shows the optical access to the combustion chamber. A spacer
(red colour) containing four identically sized quartz windows
was installed between the cylinder liner and the gasket face of
the cylinder head. The quartz window is 47 mm high and 100
mm wide. They are robust enough to withstand cylinder
pressures and pressure rise rates typical of these engines.
Figure 1. A single cylinder of W34SG natural gas engine.
The engine specification is shown in Table 1. The engine
speed is 750 rpm, typical for 50Hz genset applications. The
engine is optimized to deliver about 500kW/cylinder [1].
Table 1. Engine Specification.
Engine type W34SG
Cycle 4-stroke
Combustion type Lean burn
Number of intake valves 2
Number of exhaust valves 2
Bore 340 mm
Stroke 400 mm
Displaced volume 36.3 L
Speed 750 rpm
Output 500 kW/cylinder
Compression ratio 11
Fig. 2 shows that there are separate gas fuel supplies to the
main chamber and the PCC. The purpose is to produce a near
stoichiometric air-fuel mixture (λ≈1) inside the PCC, while
keeping the main chamber mixture lean (λ≈2). Upon spark
ignition the PCC pressure increases rapidly, forcing the burning
PCC charge into the main chamber in the form of jet flames.
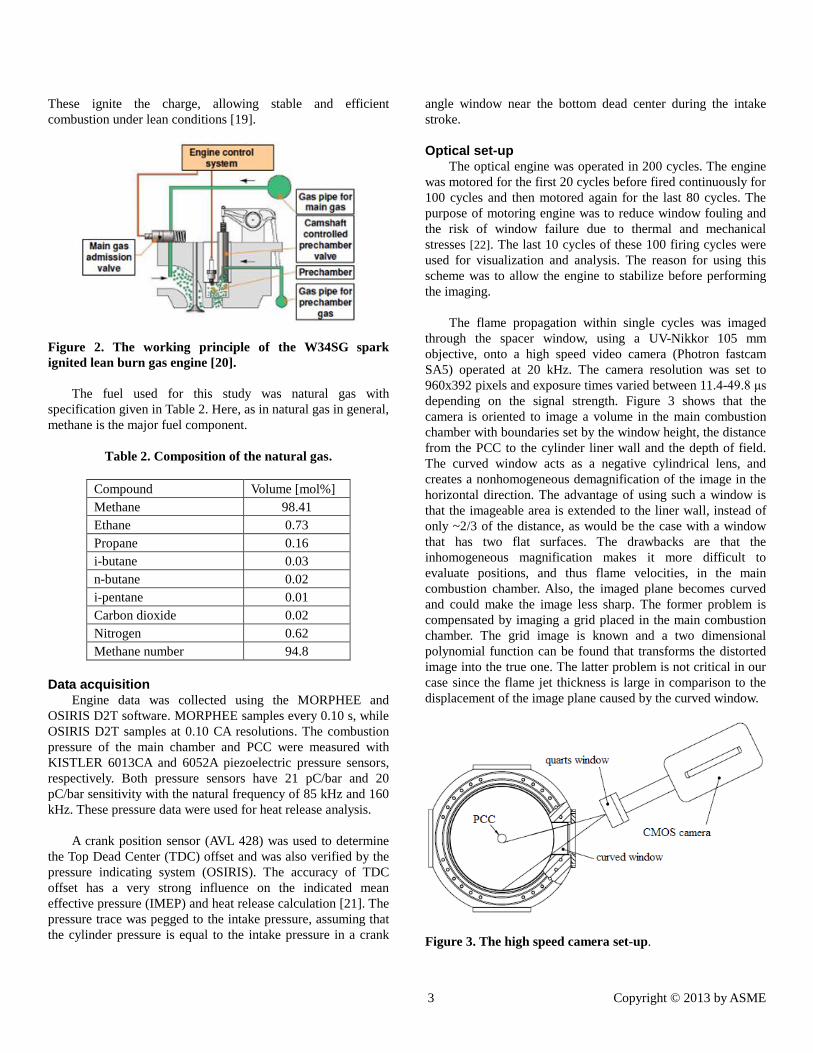
3 Copyright © 2013 by ASME
These ignite the charge, allowing stable and efficient
combustion under lean conditions [19].
Figure 2. The working principle of the W34SG spark
ignited lean burn gas engine [20].
The fuel used for this study was natural gas with
specification given in Table 2. Here, as in natural gas in general,
methane is the major fuel component.
Table 2. Composition of the natural gas.
Compound Volume [mol%]
Methane 98.41
Ethane 0.73
Propane 0.16
i-butane 0.03
n-butane 0.02
i-pentane 0.01
Carbon dioxide 0.02
Nitrogen 0.62
Methane number 94.8
Data acquisition Engine data was collected using the MORPHEE and
OSIRIS D2T software. MORPHEE samples every 0.10 s, while
OSIRIS D2T samples at 0.10 CA resolutions. The combustion
pressure of the main chamber and PCC were measured with
KISTLER 6013CA and 6052A piezoelectric pressure sensors,
respectively. Both pressure sensors have 21 pC/bar and 20
pC/bar sensitivity with the natural frequency of 85 kHz and 160
kHz. These pressure data were used for heat release analysis.
A crank position sensor (AVL 428) was used to determine
the Top Dead Center (TDC) offset and was also verified by the
pressure indicating system (OSIRIS). The accuracy of TDC
offset has a very strong influence on the indicated mean
effective pressure (IMEP) and heat release calculation [21]. The
pressure trace was pegged to the intake pressure, assuming that
the cylinder pressure is equal to the intake pressure in a crank
angle window near the bottom dead center during the intake
stroke.
Optical set-up The optical engine was operated in 200 cycles. The engine
was motored for the first 20 cycles before fired continuously for
100 cycles and then motored again for the last 80 cycles. The
purpose of motoring engine was to reduce window fouling and
the risk of window failure due to thermal and mechanical
stresses [22]. The last 10 cycles of these 100 firing cycles were
used for visualization and analysis. The reason for using this
scheme was to allow the engine to stabilize before performing
the imaging.
The flame propagation within single cycles was imaged
through the spacer window, using a UV-Nikkor 105 mm
objective, onto a high speed video camera (Photron fastcam
SA5) operated at 20 kHz. The camera resolution was set to
960x392 pixels and exposure times varied between 11.4-49.8 μs
depending on the signal strength. Figure 3 shows that the
camera is oriented to image a volume in the main combustion
chamber with boundaries set by the window height, the distance
from the PCC to the cylinder liner wall and the depth of field.
The curved window acts as a negative cylindrical lens, and
creates a nonhomogeneous demagnification of the image in the
horizontal direction. The advantage of using such a window is
that the imageable area is extended to the liner wall, instead of
only ~2/3 of the distance, as would be the case with a window
that has two flat surfaces. The drawbacks are that the
inhomogeneous magnification makes it more difficult to
evaluate positions, and thus flame velocities, in the main
combustion chamber. Also, the imaged plane becomes curved
and could make the image less sharp. The former problem is
compensated by imaging a grid placed in the main combustion
chamber. The grid image is known and a two dimensional
polynomial function can be found that transforms the distorted
image into the true one. The latter problem is not critical in our
case since the flame jet thickness is large in comparison to the
displacement of the image plane caused by the curved window.
Figure 3. The high speed camera set-up.
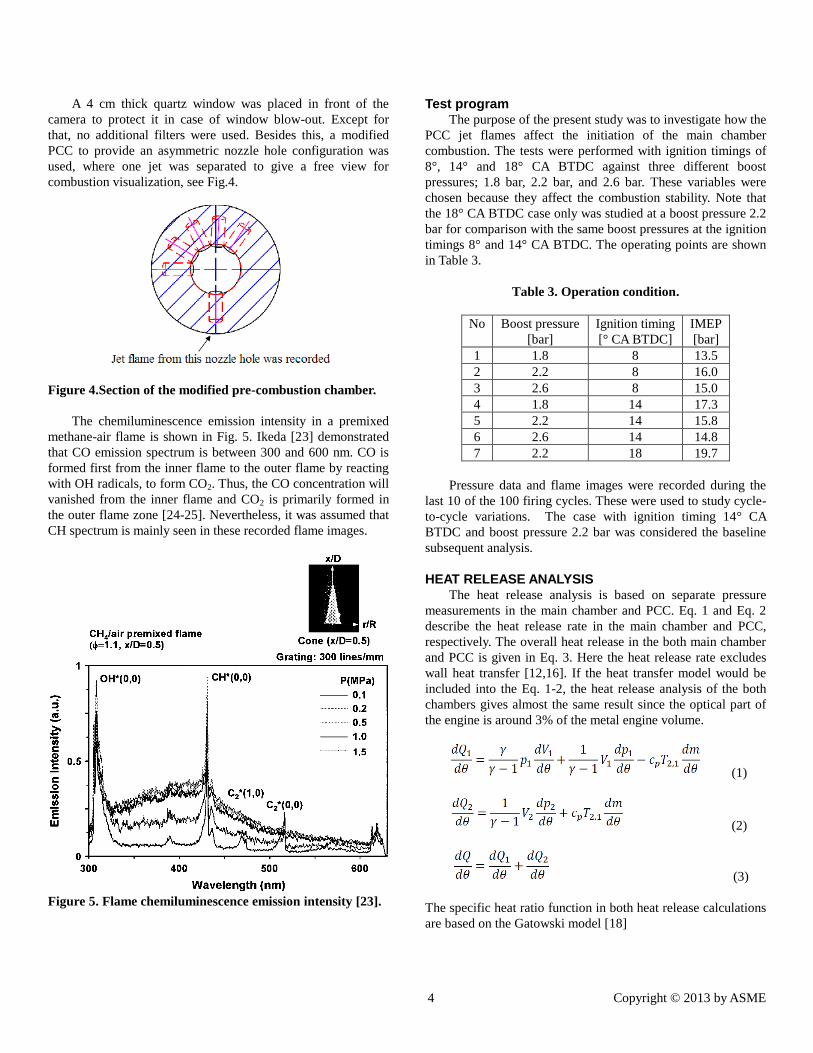
4 Copyright © 2013 by ASME
A 4 cm thick quartz window was placed in front of the
camera to protect it in case of window blow-out. Except for
that, no additional filters were used. Besides this, a modified
PCC to provide an asymmetric nozzle hole configuration was
used, where one jet was separated to give a free view for
combustion visualization, see Fig.4.
Figure 4.Section of the modified pre-combustion chamber.
The chemiluminescence emission intensity in a premixed
methane-air flame is shown in Fig. 5. Ikeda [23] demonstrated
that CO emission spectrum is between 300 and 600 nm. CO is
formed first from the inner flame to the outer flame by reacting
with OH radicals, to form CO2. Thus, the CO concentration will
vanished from the inner flame and CO2 is primarily formed in
the outer flame zone [24-25]. Nevertheless, it was assumed that
CH spectrum is mainly seen in these recorded flame images.
Figure 5. Flame chemiluminescence emission intensity [23].
Test program The purpose of the present study was to investigate how the
PCC jet flames affect the initiation of the main chamber
combustion. The tests were performed with ignition timings of
8°, 14° and 18° CA BTDC against three different boost
pressures; 1.8 bar, 2.2 bar, and 2.6 bar. These variables were
chosen because they affect the combustion stability. Note that
the 18° CA BTDC case only was studied at a boost pressure 2.2
bar for comparison with the same boost pressures at the ignition
timings 8° and 14° CA BTDC. The operating points are shown
in Table 3.
Table 3. Operation condition.
No Boost pressure
[bar]
Ignition timing
[° CA BTDC]
IMEP
[bar]
1 1.8 8 13.5
2 2.2 8 16.0
3 2.6 8 15.0
4 1.8 14 17.3
5 2.2 14 15.8
6 2.6 14 14.8
7 2.2 18 19.7
Pressure data and flame images were recorded during the
last 10 of the 100 firing cycles. These were used to study cycle-
to-cycle variations. The case with ignition timing 14° CA
BTDC and boost pressure 2.2 bar was considered the baseline
subsequent analysis.
HEAT RELEASE ANALYSIS The heat release analysis is based on separate pressure
measurements in the main chamber and PCC. Eq. 1 and Eq. 2
describe the heat release rate in the main chamber and PCC,
respectively. The overall heat release in the both main chamber
and PCC is given in Eq. 3. Here the heat release rate excludes
wall heat transfer [12,16]. If the heat transfer model would be
included into the Eq. 1-2, the heat release analysis of the both
chambers gives almost the same result since the optical part of
the engine is around 3% of the metal engine volume.
(1)
(2)
(3)
The specific heat ratio function in both heat release calculations
are based on the Gatowski model [18]
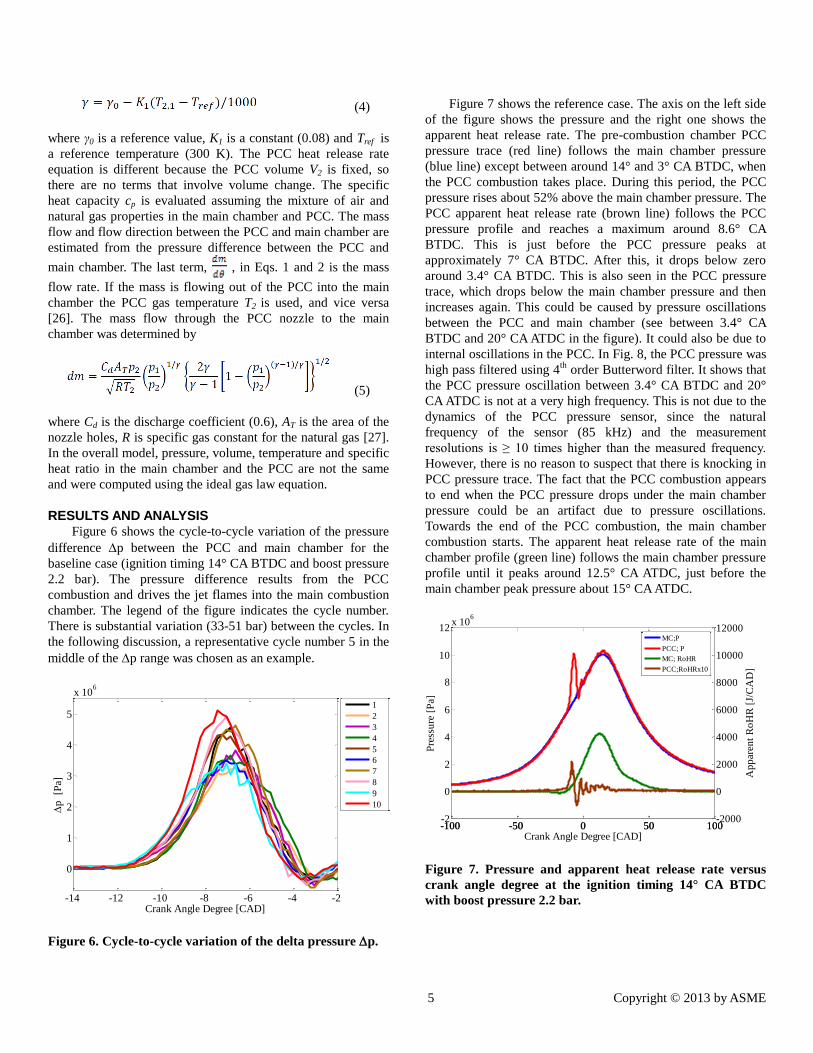
5 Copyright © 2013 by ASME
(4)
where γ0 is a reference value, K1 is a constant (0.08) and Tref is
a reference temperature (300 K). The PCC heat release rate
equation is different because the PCC volume V2 is fixed, so
there are no terms that involve volume change. The specific
heat capacity cp is evaluated assuming the mixture of air and
natural gas properties in the main chamber and PCC. The mass
flow and flow direction between the PCC and main chamber are
estimated from the pressure difference between the PCC and
main chamber. The last term, , in Eqs. 1 and 2 is the mass
flow rate. If the mass is flowing out of the PCC into the main
chamber the PCC gas temperature T2 is used, and vice versa
[26]. The mass flow through the PCC nozzle to the main
chamber was determined by
(5)
where Cd is the discharge coefficient (0.6), AT is the area of the
nozzle holes, R is specific gas constant for the natural gas [27].
In the overall model, pressure, volume, temperature and specific
heat ratio in the main chamber and the PCC are not the same
and were computed using the ideal gas law equation.
RESULTS AND ANALYSIS Figure 6 shows the cycle-to-cycle variation of the pressure
difference p between the PCC and main chamber for the
baseline case (ignition timing 14° CA BTDC and boost pressure
2.2 bar). The pressure difference results from the PCC
combustion and drives the jet flames into the main combustion
chamber. The legend of the figure indicates the cycle number.
There is substantial variation (33-51 bar) between the cycles. In
the following discussion, a representative cycle number 5 in the
middle of the p range was chosen as an example.
-14 -12 -10 -8 -6 -4 -2
0
1
2
3
4
5
x 106
p
[P
a]
Crank Angle Degree [CAD]
1
2
3
4
5
6
7
8
9
10
Figure 6. Cycle-to-cycle variation of the delta pressure p.
Figure 7 shows the reference case. The axis on the left side
of the figure shows the pressure and the right one shows the
apparent heat release rate. The pre-combustion chamber PCC
pressure trace (red line) follows the main chamber pressure
(blue line) except between around 14° and 3° CA BTDC, when
the PCC combustion takes place. During this period, the PCC
pressure rises about 52% above the main chamber pressure. The
PCC apparent heat release rate (brown line) follows the PCC
pressure profile and reaches a maximum around 8.6° CA
BTDC. This is just before the PCC pressure peaks at
approximately 7° CA BTDC. After this, it drops below zero
around 3.4° CA BTDC. This is also seen in the PCC pressure
trace, which drops below the main chamber pressure and then
increases again. This could be caused by pressure oscillations
between the PCC and main chamber (see between 3.4° CA
BTDC and 20° CA ATDC in the figure). It could also be due to
internal oscillations in the PCC. In Fig. 8, the PCC pressure was
high pass filtered using 4th
order Butterword filter. It shows that
the PCC pressure oscillation between 3.4° CA BTDC and 20°
CA ATDC is not at a very high frequency. This is not due to the
dynamics of the PCC pressure sensor, since the natural
frequency of the sensor (85 kHz) and the measurement
resolutions is ≥ 10 times higher than the measured frequency.
However, there is no reason to suspect that there is knocking in
PCC pressure trace. The fact that the PCC combustion appears
to end when the PCC pressure drops under the main chamber
pressure could be an artifact due to pressure oscillations.
Towards the end of the PCC combustion, the main chamber
combustion starts. The apparent heat release rate of the main
chamber profile (green line) follows the main chamber pressure
profile until it peaks around 12.5° CA ATDC, just before the
main chamber peak pressure about 15° CA ATDC.
-100 -50 0 50 100-2
0
2
4
6
8
10
12x 10
6
Pre
ssu
re [
Pa]
-100 -50 0 50 100-2000
0
2000
4000
6000
8000
10000
12000
Ap
par
ent
Ro
HR
[J/
CA
D]
Crank Angle Degree [CAD]
MC;P
PCC; P
MC; RoHR
PCC;RoHRx10
Figure 7. Pressure and apparent heat release rate versus
crank angle degree at the ignition timing 14° CA BTDC
with boost pressure 2.2 bar.
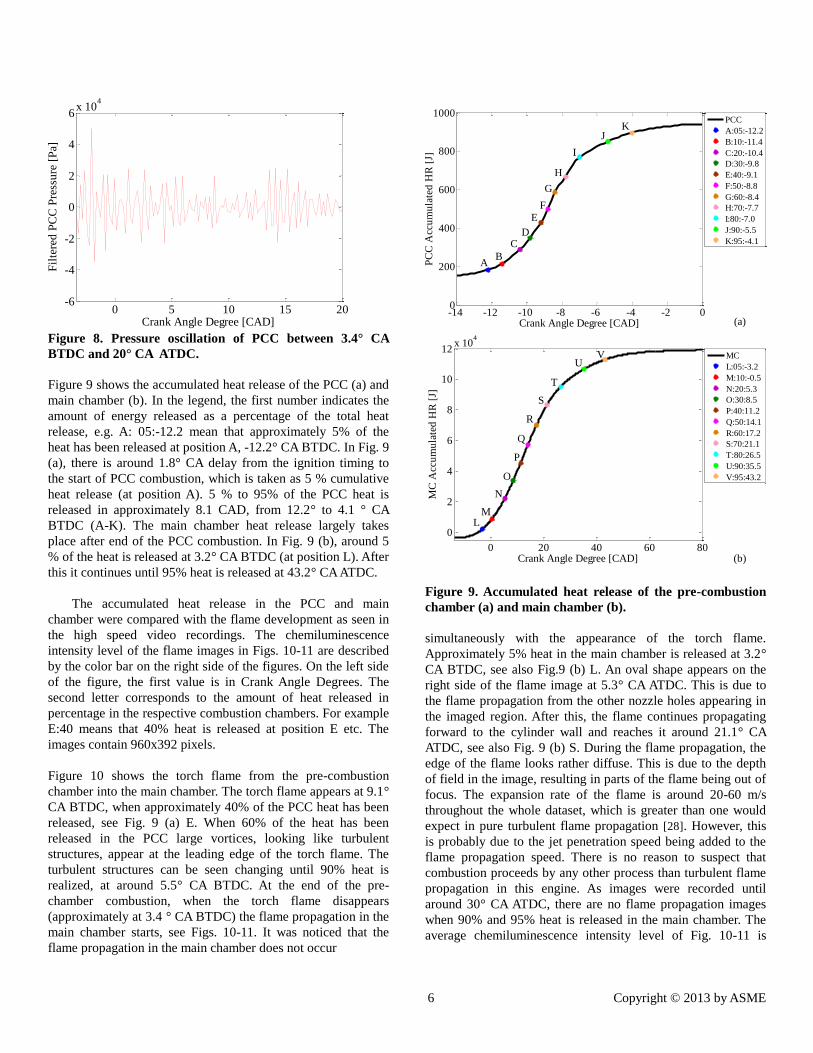
6 Copyright © 2013 by ASME
0 5 10 15 20-6
-4
-2
0
2
4
6x 10
4
Crank Angle Degree [CAD]
Fil
tere
d P
CC
Pre
ssu
re [
Pa]
Figure 8. Pressure oscillation of PCC between 3.4° CA
BTDC and 20° CA ATDC.
Figure 9 shows the accumulated heat release of the PCC (a) and
main chamber (b). In the legend, the first number indicates the
amount of energy released as a percentage of the total heat
release, e.g. A: 05:-12.2 mean that approximately 5% of the
heat has been released at position A, -12.2° CA BTDC. In Fig. 9
(a), there is around 1.8° CA delay from the ignition timing to
the start of PCC combustion, which is taken as 5 % cumulative
heat release (at position A). 5 % to 95% of the PCC heat is
released in approximately 8.1 CAD, from 12.2° to 4.1 ° CA
BTDC (A-K). The main chamber heat release largely takes
place after end of the PCC combustion. In Fig. 9 (b), around 5
% of the heat is released at 3.2° CA BTDC (at position L). After
this it continues until 95% heat is released at 43.2° CA ATDC.
The accumulated heat release in the PCC and main
chamber were compared with the flame development as seen in
the high speed video recordings. The chemiluminescence
intensity level of the flame images in Figs. 10-11 are described
by the color bar on the right side of the figures. On the left side
of the figure, the first value is in Crank Angle Degrees. The
second letter corresponds to the amount of heat released in
percentage in the respective combustion chambers. For example
E:40 means that 40% heat is released at position E etc. The
images contain 960x392 pixels.
Figure 10 shows the torch flame from the pre-combustion
chamber into the main chamber. The torch flame appears at 9.1°
CA BTDC, when approximately 40% of the PCC heat has been
released, see Fig. 9 (a) E. When 60% of the heat has been
released in the PCC large vortices, looking like turbulent
structures, appear at the leading edge of the torch flame. The
turbulent structures can be seen changing until 90% heat is
realized, at around 5.5° CA BTDC. At the end of the pre-
chamber combustion, when the torch flame disappears
(approximately at 3.4 ° CA BTDC) the flame propagation in the
main chamber starts, see Figs. 10-11. It was noticed that the
flame propagation in the main chamber does not occur
-14 -12 -10 -8 -6 -4 -2 00
200
400
600
800
1000
Crank Angle Degree [CAD]
PC
C A
ccu
mu
late
d H
R [
J]
PCC
A:05:-12.2
B:10:-11.4
C:20:-10.4
D:30:-9.8
E:40:-9.1
F:50:-8.8
G:60:-8.4
H:70:-7.7
I:80:-7.0
J:90:-5.5
K:95:-4.1
(a)
K
AB
CD
E
F
G
H
I
J
0 20 40 60 80
0
2
4
6
8
10
12x 10
4
Crank Angle Degree [CAD]
MC
Acc
um
ula
ted
HR
[J]
MC
L:05:-3.2
M:10:-0.5
N:20:5.3
O:30:8.5
P:40:11.2
Q:50:14.1
R:60:17.2
S:70:21.1
T:80:26.5
U:90:35.5
V:95:43.2
(b)
VU
T
S
R
Q
P
O
N
ML
Figure 9. Accumulated heat release of the pre-combustion
chamber (a) and main chamber (b).
simultaneously with the appearance of the torch flame.
Approximately 5% heat in the main chamber is released at 3.2°
CA BTDC, see also Fig.9 (b) L. An oval shape appears on the
right side of the flame image at 5.3° CA ATDC. This is due to
the flame propagation from the other nozzle holes appearing in
the imaged region. After this, the flame continues propagating
forward to the cylinder wall and reaches it around 21.1° CA
ATDC, see also Fig. 9 (b) S. During the flame propagation, the
edge of the flame looks rather diffuse. This is due to the depth
of field in the image, resulting in parts of the flame being out of
focus. The expansion rate of the flame is around 20-60 m/s
throughout the whole dataset, which is greater than one would
expect in pure turbulent flame propagation [28]. However, this
is probably due to the jet penetration speed being added to the
flame propagation speed. There is no reason to suspect that
combustion proceeds by any other process than turbulent flame
propagation in this engine. As images were recorded until
around 30° CA ATDC, there are no flame propagation images
when 90% and 95% heat is released in the main chamber. The
average chemiluminescence intensity level of Fig. 10-11 is
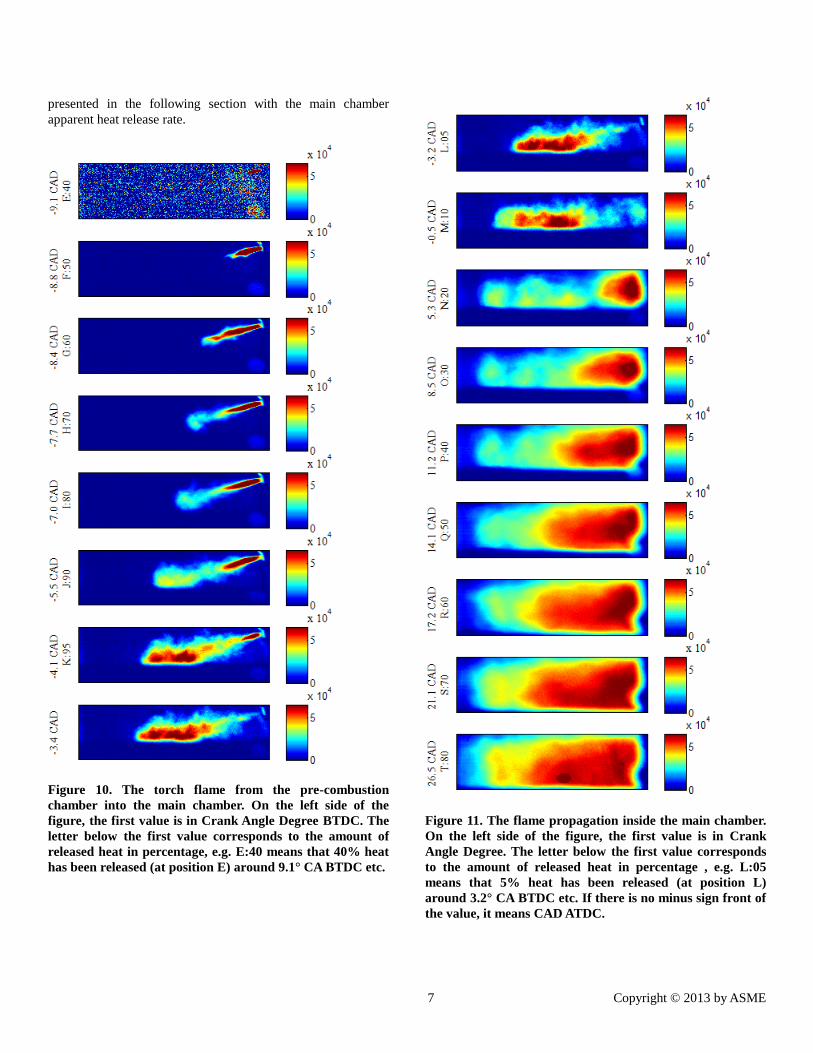
7 Copyright © 2013 by ASME
presented in the following section with the main chamber
apparent heat release rate.
Figure 10. The torch flame from the pre-combustion
chamber into the main chamber. On the left side of the
figure, the first value is in Crank Angle Degree BTDC. The
letter below the first value corresponds to the amount of
released heat in percentage, e.g. E:40 means that 40% heat
has been released (at position E) around 9.1° CA BTDC etc.
Figure 11. The flame propagation inside the main chamber.
On the left side of the figure, the first value is in Crank
Angle Degree. The letter below the first value corresponds
to the amount of released heat in percentage , e.g. L:05
means that 5% heat has been released (at position L)
around 3.2° CA BTDC etc. If there is no minus sign front of
the value, it means CAD ATDC.
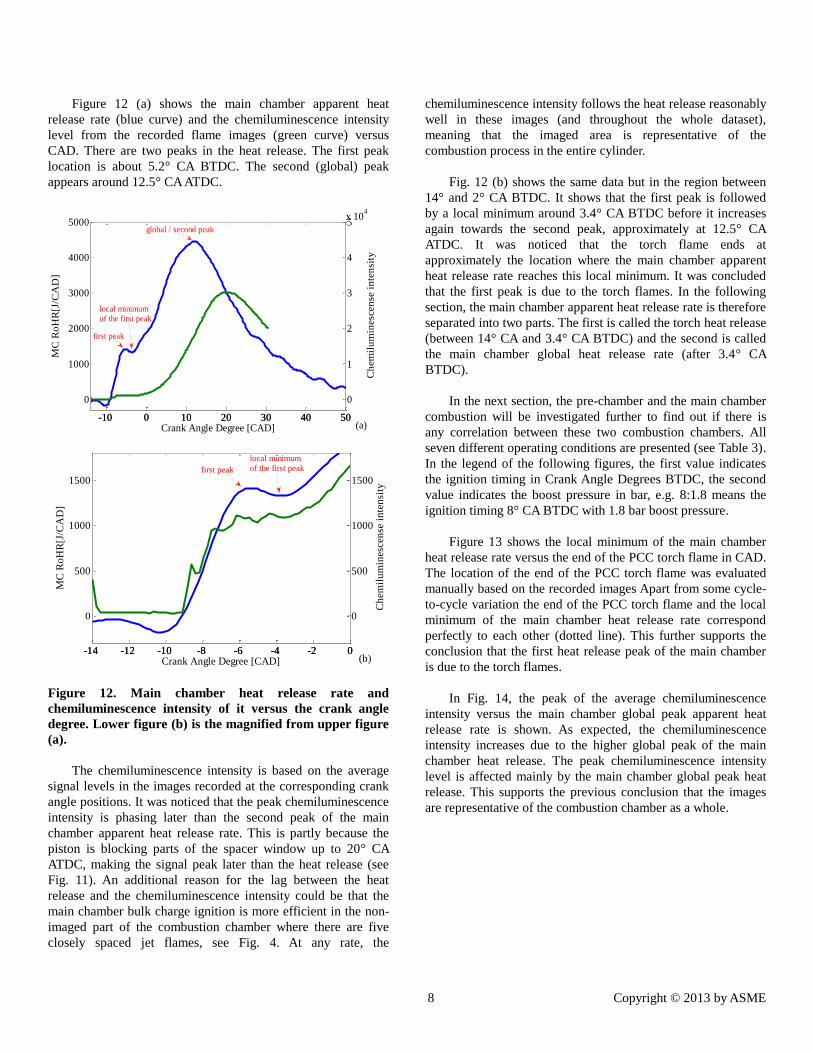
8 Copyright © 2013 by ASME
Figure 12 (a) shows the main chamber apparent heat
release rate (blue curve) and the chemiluminescence intensity
level from the recorded flame images (green curve) versus
CAD. There are two peaks in the heat release. The first peak
location is about 5.2° CA BTDC. The second (global) peak
appears around 12.5° CA ATDC.
-10 0 10 20 30 40 50
0
1000
2000
3000
4000
5000
MC
Ro
HR
[J/C
AD
]
Crank Angle Degree [CAD]-10 0 10 20 30 40 50
0
1
2
3
4
5x 10
4
Ch
em
ilu
min
esc
en
se i
nte
nsi
ty
local minimumof the first peak
first peak
global / second peak
(a)
-14 -12 -10 -8 -6 -4 -2 0
0
500
1000
1500
MC
Ro
HR
[J/C
AD
]
Crank Angle Degree [CAD]-14 -12 -10 -8 -6 -4 -2 0
0
500
1000
1500
Ch
emil
um
ines
cen
se i
nte
nsi
ty
local minimum
of the first peakfirst peak
(b)
Figure 12. Main chamber heat release rate and
chemiluminescence intensity of it versus the crank angle
degree. Lower figure (b) is the magnified from upper figure
(a).
The chemiluminescence intensity is based on the average
signal levels in the images recorded at the corresponding crank
angle positions. It was noticed that the peak chemiluminescence
intensity is phasing later than the second peak of the main
chamber apparent heat release rate. This is partly because the
piston is blocking parts of the spacer window up to 20° CA
ATDC, making the signal peak later than the heat release (see
Fig. 11). An additional reason for the lag between the heat
release and the chemiluminescence intensity could be that the
main chamber bulk charge ignition is more efficient in the non-
imaged part of the combustion chamber where there are five
closely spaced jet flames, see Fig. 4. At any rate, the
chemiluminescence intensity follows the heat release reasonably
well in these images (and throughout the whole dataset),
meaning that the imaged area is representative of the
combustion process in the entire cylinder.
Fig. 12 (b) shows the same data but in the region between
14° and 2° CA BTDC. It shows that the first peak is followed
by a local minimum around 3.4° CA BTDC before it increases
again towards the second peak, approximately at 12.5° CA
ATDC. It was noticed that the torch flame ends at
approximately the location where the main chamber apparent
heat release rate reaches this local minimum. It was concluded
that the first peak is due to the torch flames. In the following
section, the main chamber apparent heat release rate is therefore
separated into two parts. The first is called the torch heat release
(between 14° CA and 3.4° CA BTDC) and the second is called
the main chamber global heat release rate (after 3.4° CA
BTDC).
In the next section, the pre-chamber and the main chamber
combustion will be investigated further to find out if there is
any correlation between these two combustion chambers. All
seven different operating conditions are presented (see Table 3).
In the legend of the following figures, the first value indicates
the ignition timing in Crank Angle Degrees BTDC, the second
value indicates the boost pressure in bar, e.g. 8:1.8 means the
ignition timing 8° CA BTDC with 1.8 bar boost pressure.
Figure 13 shows the local minimum of the main chamber
heat release rate versus the end of the PCC torch flame in CAD.
The location of the end of the PCC torch flame was evaluated
manually based on the recorded images Apart from some cycle-
to-cycle variation the end of the PCC torch flame and the local
minimum of the main chamber heat release rate correspond
perfectly to each other (dotted line). This further supports the
conclusion that the first heat release peak of the main chamber
is due to the torch flames.
In Fig. 14, the peak of the average chemiluminescence
intensity versus the main chamber global peak apparent heat
release rate is shown. As expected, the chemiluminescence
intensity increases due to the higher global peak of the main
chamber heat release. The peak chemiluminescence intensity
level is affected mainly by the main chamber global peak heat
release. This supports the previous conclusion that the images
are representative of the combustion chamber as a whole.
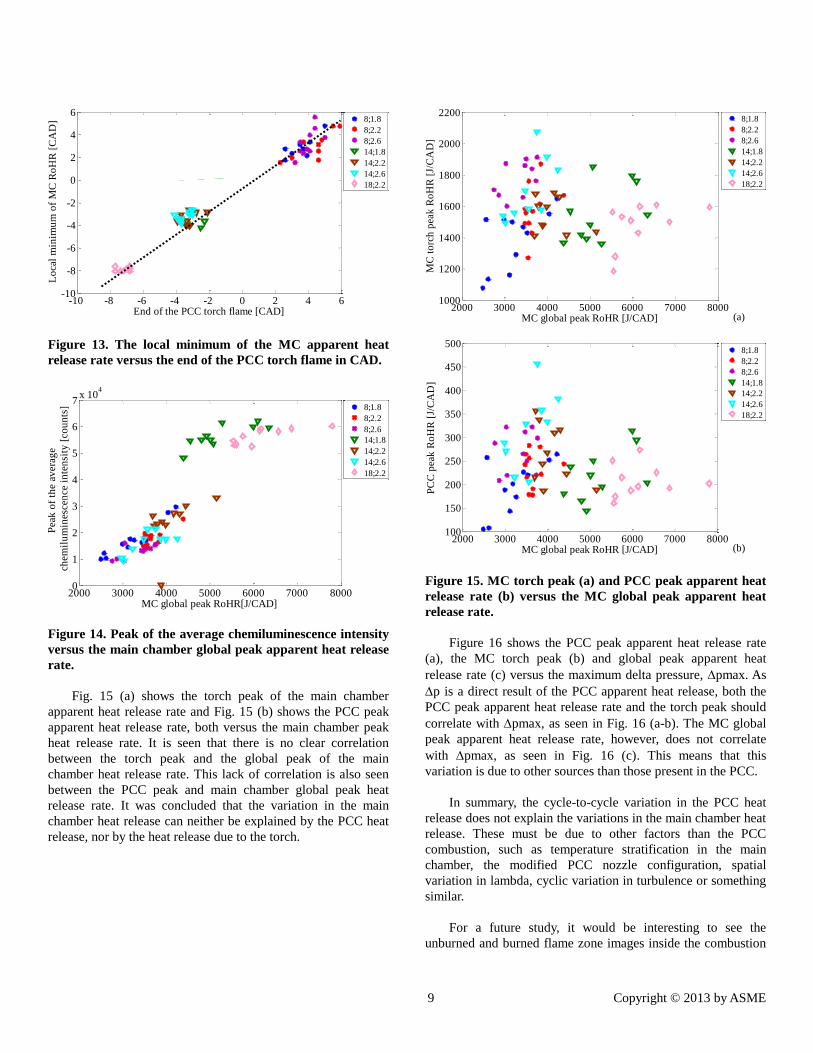
9 Copyright © 2013 by ASME
-10 -8 -6 -4 -2 0 2 4 6-10
-8
-6
-4
-2
0
2
4
6
Lo
cal
min
imu
m o
f M
C R
oH
R [
CA
D]
End of the PCC torch flame [CAD]
8;1.8
8;2.2
8;2.6
14;1.8
14;2.2
14;2.6
18;2.2
Figure 13. The local minimum of the MC apparent heat
release rate versus the end of the PCC torch flame in CAD.
2000 3000 4000 5000 6000 7000 80000
1
2
3
4
5
6
7x 10
4
MC global peak RoHR[J/CAD]
Pea
k o
f th
e av
erag
e
chem
ilu
min
esce
nce
in
ten
sity
[co
un
ts] 8;1.8
8;2.2
8;2.6
14;1.8
14;2.2
14;2.6
18;2.2
Figure 14. Peak of the average chemiluminescence intensity
versus the main chamber global peak apparent heat release
rate.
Fig. 15 (a) shows the torch peak of the main chamber
apparent heat release rate and Fig. 15 (b) shows the PCC peak
apparent heat release rate, both versus the main chamber peak
heat release rate. It is seen that there is no clear correlation
between the torch peak and the global peak of the main
chamber heat release rate. This lack of correlation is also seen
between the PCC peak and main chamber global peak heat
release rate. It was concluded that the variation in the main
chamber heat release can neither be explained by the PCC heat
release, nor by the heat release due to the torch.
2000 3000 4000 5000 6000 7000 80001000
1200
1400
1600
1800
2000
2200
MC global peak RoHR [J/CAD]
MC
to
rch
pea
k R
oH
R [
J/C
AD
]
8;1.8
8;2.2
8;2.6
14;1.8
14;2.2
14;2.6
18;2.2
(a)
2000 3000 4000 5000 6000 7000 8000100
150
200
250
300
350
400
450
500
MC global peak RoHR [J/CAD]
PC
C p
eak
Ro
HR
[J/
CA
D]
8;1.8
8;2.2
8;2.6
14;1.8
14;2.2
14;2.6
18;2.2
(b)
Figure 15. MC torch peak (a) and PCC peak apparent heat
release rate (b) versus the MC global peak apparent heat
release rate.
Figure 16 shows the PCC peak apparent heat release rate
(a), the MC torch peak (b) and global peak apparent heat
release rate (c) versus the maximum delta pressure, pmax. As
p is a direct result of the PCC apparent heat release, both the
PCC peak apparent heat release rate and the torch peak should
correlate with pmax, as seen in Fig. 16 (a-b). The MC global
peak apparent heat release rate, however, does not correlate
with pmax, as seen in Fig. 16 (c). This means that this
variation is due to other sources than those present in the PCC.
In summary, the cycle-to-cycle variation in the PCC heat
release does not explain the variations in the main chamber heat
release. These must be due to other factors than the PCC
combustion, such as temperature stratification in the main
chamber, the modified PCC nozzle configuration, spatial
variation in lambda, cyclic variation in turbulence or something
similar.
For a future study, it would be interesting to see the
unburned and burned flame zone images inside the combustion
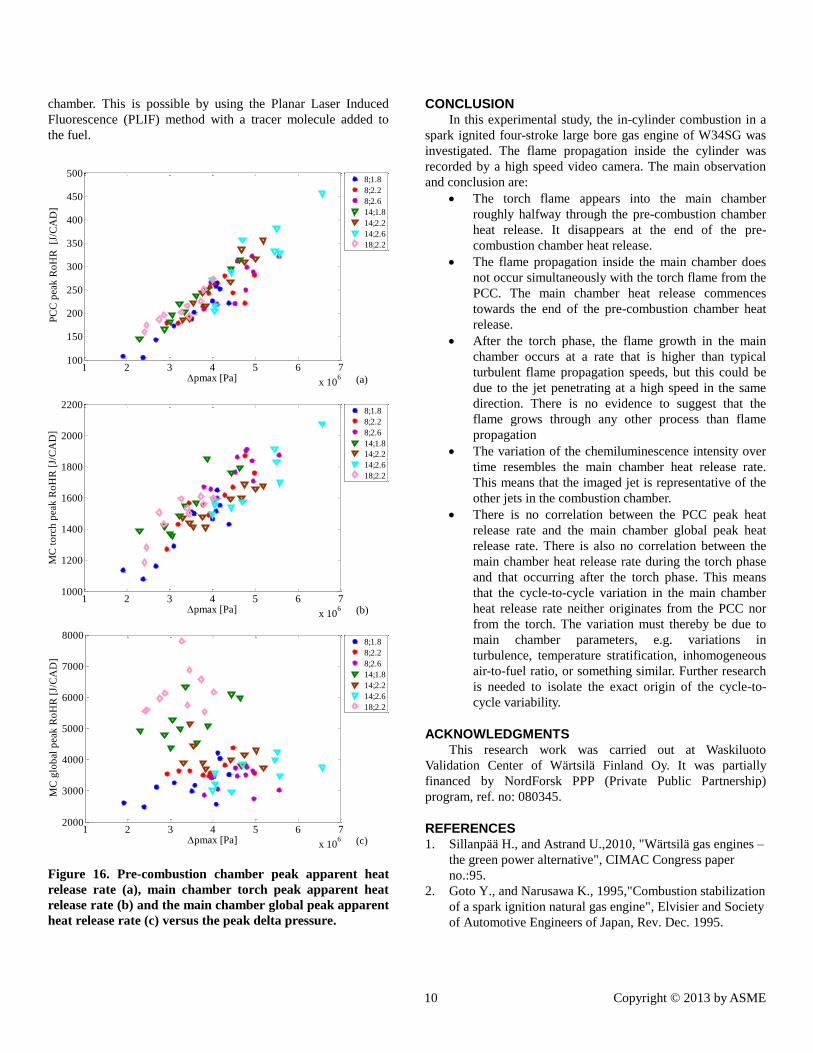
10 Copyright © 2013 by ASME
chamber. This is possible by using the Planar Laser Induced
Fluorescence (PLIF) method with a tracer molecule added to
the fuel.
1 2 3 4 5 6 7
x 106
100
150
200
250
300
350
400
450
500
pmax [Pa]
PC
C p
eak
Ro
HR
[J
/CA
D]
8;1.8
8;2.2
8;2.6
14;1.8
14;2.2
14;2.6
18;2.2
(a)
1 2 3 4 5 6 7
x 106
1000
1200
1400
1600
1800
2000
2200
pmax [Pa]
MC
to
rch
pea
k R
oH
R [
J/C
AD
]
8;1.8
8;2.2
8;2.6
14;1.8
14;2.2
14;2.6
18;2.2
(b)
1 2 3 4 5 6 7
x 106
2000
3000
4000
5000
6000
7000
8000
pmax [Pa]
MC
glo
bal
pea
k R
oH
R [
J/C
AD
]
8;1.8
8;2.2
8;2.6
14;1.8
14;2.2
14;2.6
18;2.2
(c)
Figure 16. Pre-combustion chamber peak apparent heat
release rate (a), main chamber torch peak apparent heat
release rate (b) and the main chamber global peak apparent
heat release rate (c) versus the peak delta pressure.
CONCLUSION In this experimental study, the in-cylinder combustion in a
spark ignited four-stroke large bore gas engine of W34SG was
investigated. The flame propagation inside the cylinder was
recorded by a high speed video camera. The main observation
and conclusion are:
The torch flame appears into the main chamber
roughly halfway through the pre-combustion chamber
heat release. It disappears at the end of the pre-
combustion chamber heat release.
The flame propagation inside the main chamber does
not occur simultaneously with the torch flame from the
PCC. The main chamber heat release commences
towards the end of the pre-combustion chamber heat
release.
After the torch phase, the flame growth in the main
chamber occurs at a rate that is higher than typical
turbulent flame propagation speeds, but this could be
due to the jet penetrating at a high speed in the same
direction. There is no evidence to suggest that the
flame grows through any other process than flame
propagation
The variation of the chemiluminescence intensity over
time resembles the main chamber heat release rate.
This means that the imaged jet is representative of the
other jets in the combustion chamber.
There is no correlation between the PCC peak heat
release rate and the main chamber global peak heat
release rate. There is also no correlation between the
main chamber heat release rate during the torch phase
and that occurring after the torch phase. This means
that the cycle-to-cycle variation in the main chamber
heat release rate neither originates from the PCC nor
from the torch. The variation must thereby be due to
main chamber parameters, e.g. variations in
turbulence, temperature stratification, inhomogeneous
air-to-fuel ratio, or something similar. Further research
is needed to isolate the exact origin of the cycle-to-
cycle variability.
ACKNOWLEDGMENTS This research work was carried out at Waskiluoto
Validation Center of Wärtsilä Finland Oy. It was partially
financed by NordForsk PPP (Private Public Partnership)
program, ref. no: 080345.
REFERENCES 1. Sillanpää H., and Astrand U.,2010, "Wärtsilä gas engines –
the green power alternative", CIMAC Congress paper
no.:95.
2. Goto Y., and Narusawa K., 1995,"Combustion stabilization
of a spark ignition natural gas engine", Elvisier and Society
of Automotive Engineers of Japan, Rev. Dec. 1995.
11 Copyright © 2013 by ASME
3. Kawabata Y., and Mori D., 2004, "Combustion Diagnostics
& Improvement of a Prechamber Lean-Burn Natural Gas
Engine, SAE Technical Paper 2004-01-0979.
4. Laiho J., and Rösgren C., 2008, "Pre-combustion chamber
unit of combustion engine ", Patent no.: EP2265806A1,
Wärtsilä Finland Oy.
5. Manivannan A., Tamil porail P., and Chandrasekaran S.,
2003, "Lean Burn Natural Gas Spark Ignition Engine-An
Overview," SAE international 2003-01-0638.
6. Miller R., 1957, "Supercharged engine", United state
patent office no.: 2817322.
7. Tsunoda A., Shimoda H., and Takaishi T., "Mitsubishi
Lean-burn Gas Engine with World’s Highest Thermal
Efficiency, 2003, " Technical Review Vol.40 No.4, 2003.
8. Endo H., Tanaka K., Kakuhama Y., Goda Y., Fujiwaka T.,
and Nishigaki M., 2001, "Development of the Lean Burn
Miller cycle Gas Engine, " COMODIA.
9. Maddox R. N., Moshfeghian, N. Idol J. D., and Johannes
A. H., 2006, "Natural Gas, "Riegel’s Handbook of
Industrial Chemistry 10th Edition ", 2006, pp. 545-569.
10. Ruter M. D., Olsen D. B., Scotto M. V., and Perna M. A.,
2011, "NOx reduction from a large bore natural gas engine
via reformed natural gas prechamber fueling optimization,"
Elvisier Fuel.
11. Kawabata Y., and Mori D., 2004, "Combustion Diagnostics
& Improvement of a Prechamber Lean-Burn Natural Gas
Engine, SAE Technical Paper 2004-01-0979.
12. Tsunoda A., Shimoda H., and Takaishi T., 2003,
"Mitsubishi Lean-burn Gas Engine with World’s Highest
Thermal Efficiency," Technical Review Vol.40 No.4.
13. Maxson J.A., and Oppenheim A.K., 1990, "Pulsed Jet
Combustion – Key to a refinement of the stratified charge
concept", 21nd Symposium (International) on Combustion/
The Combustion Institute, pp. 1041-1046
14. Maxson J.A., Hensinger D.M., Hom K., Oppenheim A.K.,
1991, "Performance of Multiple Stream Pulsed Jet
Combustion Systems", SAE International
15. Murase E., Ono S., Hanada K., Oppenheim A.K., 1996,
"Initation of Combustion in Lean Mixtures by Flame Jets",
Combust. Sci. Tech., Vols. 113-114, pp. 167-177
16. Heywood J.B., 1988, "Internal Combustion Engine
Fundamentals".
17. Elisa T., and Harold J.S., 2010, " A Review of Pre-
Chamber Initiated Jet Ignition Combustion Systems", SAE
Technical Paper 2010-01-2263.
18. Roetlisberger R. P., Favrat D., 2002, "Comparision
between direct and indirect (prechamber) spark ignition in
the case of a cogeneration natural gas engine, part II:
engine operating parameters and turbocharger
characteristics", Elvisier Science.
19. Wärtsilä homepage [http://www.wartsila.com/en/power-
plants/technology/combustion-engines/gas-engines]
20. Ingemar Nylund, "Status and potentials of the gas engines",
CIMAC paper no.: 163
21. Tunestål P., 2011, "TDC Offset Estimation from motored
Cylinder Pressure Data based on Heat Release Shaping,"
IFP Energies nouvelles, Vol.66, No. 4, pp. 705-716
22. Aronsson U., Chartier C., Horn U., Andersson Ö.,
Johansson B., Egnell R., 2008, "Heat Release Comparison
Between Optical and All-Metal HSDI Diesel Engines",
SAE Technical paper 2008-01-1062.
23. Ikeda Y., Kojima J., Hashimoto H., 2002, "Local
Chemiluminescence spectra measurements in a high-
pressure laminar methane/air premixed flame",
Proceedings of the Combustion Institute, Volume 29,
2002/pp. 1495-1501.
24. Hardalupas Y., and Orain M., "Local measurements of the
time-dependent heat release rate and equivalence ratio
using chemiluminescent emission from a flame", 2004,
Elsevier.
25. Mishra T.K., Datta A., Mukhopadhyay A., 2005,
"Comparison of the structures of methane-air and propane-
air partially pre-mixed flames", 2005, Elsevier.
26. Ceviz M.A. and Kaymaz I., 2005, "Temperature and air-
fuel ratio dependent specific heat ration functions for lean
burned and unburned mixture ", Elsevier Ltd,
doi:10.1016/j.enconman.2004.12.009.
27. Arcooumanis C., Bae C. S., and Hu Z., 1994, "Flow and
Combustion in a Four-Valve Spark-Ignition Optical
Engine", SAE International 940475.
28. Yukiyoshi F., Haruo H., and Shigeo K., 1999, " In-
Cylinder Combustion in a Natural Gas Fuelled Spark
Ignition Engine Probed by High Speed Schlieren Methold
and Its Dependence on Engine Specifications", SAE
Technical paper 1999-01-1493.