combustor flame flashback · 2013-08-30 · under controlled conditions simulating gas turbine...
TRANSCRIPT

DOE/NASAl0290-1 NASA CR-174961 NASA_CR.174961
19860005257
Combustor Flame Flashback
Margaret P. Proctor and James S T'ien Case Wesstern Rese.rve University
rr~_~r~_
I jl)!I.~f1 rr-(
.. It ... " -:tf , j
DEC 2 31985 Lt,
June 1985
Prepared for NATIONAL AERONAUTICS AND SPACE ADMINISTRATION Lewis Research Center Under Grant NAG 3-290
for U.S. DEPARTMENT OF ENERGY Conservation and Renewable Energy Office of Vehicle and Engine R&D
111111111111111111111111111111111111111111111 NF01227
https://ntrs.nasa.gov/search.jsp?R=19860005257 2020-04-12T12:37:56+00:00Z

DISCLAIMER
This report was prepared as an account of work sponsored by an agency of the United States Government Neither the United States Government nor any agency thereof, nor any of their employees, makes any warranty, express or Implied, or assumes any legal liability or responsibility for the accuracy, completeness, or usefulness of any information, apparatus, product, or process disclosed, or represents that ItS use would not infringe privately owned rights Reference herein to any specific commercial product, process, or service by trade name, trademark, manufacturer, or otherWise, does not necessarily constitute or Imply ItS endorsement, recommendation, or faVOring by the United States Government or any agency thereof The views and opinions of authors expressed herein do not necessarily state or reflect those of the United States Government or any agency thereof
Printed In the United States of America
Available from National Technical Information Service U S Department of Commerce 5285 Port Royal Road Spnngfleld, VA 22161
NTIS pnce codes 1 Printed copy A05 Microfiche copy A01
1Codes are used for pnclng all publications The code IS determined by the number of pages In the publication Information pertaining to the pricing codes can be found In the current Issues of the follOWing publications, which are generally available In most IIbranes Energy Research Abstracts (ERA), Government Reports Announcements and Index (GRA and I), SCientifiC and Technical Abstract Reports (STAR), and publication, NTIS-PR-360 available from NTIS at the above address

Combustor Flame Flashback
Margaret P. Proctor and James S. T'ien Case Western Reserve University Cleveland, Ohio
June 1985
Prepared for
DOE/NASA/0290-1 NASA CR-174961
NATIONAL AERONAUTICS AND SPACE ADMINISTRATION Lewis Research Center Cleveland, Ohio 44135 Under Grant NAG 3-290
for U.S. DEPARTMENT OF ENERGY Conservation and Renewable Energy Office of Vehicle and Engine R&D Washington, D.C. 20545 Under Interagency Agreement DE-AI01-77CS51 040
CHAPTER I. 1 1.2 1.3
CHAPTER II II. 1 11.2 II. 3 II. 4
TABLE OF CONTENTS
INTRODUCTION Motivation Literature Survey The Present Study
EXPERIMENTAL APPARATUS Facility Test Section Ins tr u me nta ti on Data Aquisition and Analysis
CHAPTER III. PROCEDURE
CHAPTER IV. EXPERIMENTAL RESULTS AND DISCUS-
Page
1 1 1 4
6 6 6 9
11
13
s�oN 14 IV. 1 Visual Observations 14 IV. 2 Verification of Flashback 15 IV. 3 Gas Analysis Data 16 IV. 4 Parametric Study 17 IV. 5 Pressure Oscillations 20 IV. 6 Flow Reversals 22
CHAPTER V . ANALYSIS OF FLOW REVERSAL IN PREMIXING CHANNELS 24 V. 1 Relevanco 24 V.2 Flow Reversal Model 25 V. 3 Governing Equation and Solution 27 V.4 Values of Nondimensional Parameters 30 V.5 Critical Pressure Gradients Ratio for Flow Reversal 33 V. 6 Velocity Profiles Near the Wall 34 V. 7 Flame Flashback in Oscillatory Flow 36 V. 8 Status of Modeling Periodic Turbulent Flow in Pipes 38
CHAPTER VI CONCLUSIONS AND REOCMMENDATIONS 40
LIST OF REFERENCES 43
iii

CHAPTER 8
INTRODUCTION
1.1. Motivation
Premixed-prevaporized· combustors operate with uniformly lean
fuel/air ratios and consequently produce lower emission levels of
NO and soot than diffusion flame combustors. For this reason. they x
are candidate.s for advanced automotive and aircraft gas turbines.
flashback. a problem that occurs in premixed-prevaporlzed combus-
tors. is the upstream propagation of the flame from the combustor
into the premixing tube. Not only does flashback change the
combustion process from premixed burning to diffusion burning. thus
creating more pollutants, but it also Inflicts considerable damage on
the fuel injector. premixing tube and other equipment upstream.
Therefore. before Implementing the premixed combustor, an under-
standing of the flashback mechanisms should be achieved and a
scheme for preventing its occurrence has to be found.
1.2. Literature Survey
A reasonable number of studies on flame flashback in a bun-
sen burner have been done (see Lewis and von Elbe (1961). for
example) . With this device a premixed flame was first established
at the mouth of the tube. Flashback was then induced by gradually
decreasing the mixture flow rate. The experiments were normally
1

2
conducted in steady"':'state and laminar flow conditions. From experi
mental data. Lewis and von Elba (1961) established a velocity gra
dient criterion based on the velocity balance concept. Simply stat
ed. flashback will occur when the mixture velocity gradient at the
wall becomes small enough that the local mixture velocity at the
edge of the wall quenching layer is less than the flame speed.
lewis and von Elbe were able to correlate a number of flashback
data using this criterion. Further work along a similar line was
done by Putnam and Jensen (1949) who utilized a Peclet number
correlation.
Despite these earlier efforts. a more fundamental analysis has
not appeared until recently. . lee and T'len (1982) formulated and
solved the laminar flame flashback problem in a circular tubeusfng
two-dimensional Navier-Stokes' conservation equations. This more
basic approach can handle more complicated situations such as
non-linear velocity profiles and unequal mixture and wall tempera
tUrf:lS. In addition. the computation provides detailed flame structure
at the flashback limit without making any ad hoc assumptions about
quenching distance.
The investigations above were for steady-state. Since the
laminar flame speeds for most hydrocarbon/air mixtures are rather
low (of the order of 1 m/s or less). in a laminar flow this "classi
cal flashback mode" can only occur when the mixture velocity Is low
and the boundary layer is relatively thick.

3
in comparison, flashback in a premixed flame combustor is far
more complicated. First, the flow Is turbulent; turbulent flame
speeds can be much higher than laminar ones. Also, turbulent
boundary layers. are thinner and quenching distances are smaller be
cause of higher pressures and wall temperatures. Second. because
the combustor Is partially enclosed, a mechanism of gas dynamic
coupling exists. In other words, a disturbance In the combustor
can affect the flow in the premlxer and vice versa. Therefore, con
sideration of transient conditions are necessary.
Since interest In premlxed-prevaporlzed combustors is relatively
recent, intentional investigations of combustor flashback are very
few. Most reported ·flashbacks· occurred when experimenters were
investigating something else. Plee and Mellor (1978) examined
twenty-one cases of reported flame stabilization in the fuel
preparation tube. Because the interiors of these combustors were
not optically accessible, the upstream flame stabllizations were
discovered by either burnt out parts, thermocouple readings In the
premlxer or a change of emission levels. The reasons why the flame
stabilized in the premixer had to be Inferred from the design of each
apparatus rather than from direct observations or measurements.
Plee and Mellor (1978) felt the classical flashback mode was unlike
ly in most cases because mixture velocities were too great. They
concluded that some upstream stabllizations occurred as a result of
flow separation behind consecutive steps or bluff bodies and in other
cases as a result of autolgnltlon. However, these authors did not
consider transient mechanisms.
Coats (1980). In a comment to the review by Plee and Mel
lor, mentioned that flashback and combustion Instability have been
observed to occur simultaneously. In a separate experiment at am
bient conditions using a transparent window on the sidewall of the
combustor. Ganjl and Sawyer (1979) observed a flickering type
flame flashback In concurrence with combustor pressure oscillations.
In the flickering mode. the flame. in a periodic manner. moved
upstream past the flame stabilization hump into the premixing chan
nel and then retreated back into the combustor. In a further study
using the same setup. Keller et al (1981) Identified several combus
tion pressure oscillation modes prior to the induced flashback and
used Schlieren cinematography to study the flame movement. It was
noticed that during the upstream flickering motion. the leading edge
of the flame front was always close to the wall. Thus. a transient
boundary layer flow retardation or reversal may have been present.
and may be responsible for the flame flickering motion [see Plee
and Mellor (1980)].
1.3. The Present Study
The above discussion Illustrates the complicated nature of
combustor flashback phenomena and the lack of information associ
ated with them. For example. it Is not clear whether the concurrent
appearance 01 instability and flashback Is geometrically specific as
suggested by Coats or more general In nature. There has been no
systematic Investigation of flashback over a range of velocities and at

5
high mixture and premlxer wall temperatures.
The objective of the present study was to Investigate flashback
under controlled conditions simulating gas turbine combustor opera
tions to Identify flashback regimes under steady-state and transient
conditions. A premixed-prevaporlzed, rectangular, center-dump
combustor with quartz window sidewalls for visual access was
designed. constructed and tested. The 1 In. high and 4 In. wide
premlxer dumped Into the 4 In. by 4 In. combustor. Gaseous pro
pane and air were burned. A parametric study was done to deter
mine the effects of Inlet air temperature In the range of 600 to 850
K. premixer wall temperature In the range of 450 to 900 K. and
average premlxer velocity in the range of 40 to 80 ftls on the
fuell air equivalence ratio required for flashback. High speed pho
tography and high frequency response pressure transducers were
used to Investigate the mechanism of flashback. Finally. a theoreti..,.
cal analysis was performed for periodic, flow In the premlxer in order
to assess the effect of pressure. oscillation on flame flashback.

CHAPTER II
EXPERIMENTAL APPARATUS
II. 1. Facility
The test section was installed at NASA Lewis Research Center
In cell 11 B of the Combustion Research Laboratory. Operation of the
test combustor was done from the control room where conditions
were monitored and data recorded . Photographs of the control room
and the test section Installed In the facility can be found In Ref.
12. The existing propane. air. water and steam systems were em
ployed with a few changes in orifice and valve sizes. Schematics of
the~e are also in Bef. 12.
11.2. 7 est Section
1 he test section. shown In figures land 2. was a stainless
steel. rectangular. premixed-prevaporized. center-dump combustor.
It was designed to two-dimensionalize the experiment (rectangular
cross section). provide visual access to the combustion process.
withstand five atmospheres pressure. and operate at conditions simi
lar to those of automotive gas turbines.
Non-vitiated preheated air from the facility's natural-gas-flred
preheater was supplied to the premixing tube through a 41 in. long.
Insulated transition section with an Inside cross section 3.5 in. wide
and 1.0 In. high. This length (approximately 30 hydraulic dlame-
6

7
ters) assured a fully-developed velocity profile at the entrance of the
premixing tube.
The fuel injector. figure 3. was a 1/4 In. outside diameter.
0.035 in. thick wall stainless steel tube with eight 0.02 in. diameter
holes evenly spaced along Its length. It was mounted horizontally in
the transition section 8 In. upstream of the step with the holes fac-
ing the downstream direction. Gaseous propane was supplied to
both ends of the fuel Injector. A small portion of data was taken
with the fuel Injector 25 1/2 in. upstream of the step to determine
the effect of mixing length and to verify the location of upstream
flame stabilization.
The propane and air from the transition section mixed In the
premixing tube. 6 1/2 In. long. 1 in. high and 4 in. wide. before
dumping into the 4 In. by 4 in.. 10 1/2 in. long combustion
chamber. At the sudden expansion. recirculation zones formed
behind the two symmetric 1 1/2 in. steps to stabilize the flame.
The temperature of the premixing tube walls was adjusted by passing
air through an Insulated channel adjacent to each wall. This air ei
ther cooled or heated the wall depending on the setting of two 5 kw
electric heaters through which it passed. A 15-joule electric spark
Igniter. flush mounted In the top combustor wall 3 3/4 in. down
stream of the step. was used to Initiate combustion. The Igniter
fired for 30 seconds. If sustained combustion was not attained
within that time the propane trailer valve closed automatically to
prevent propane buildup in the system.

8
Combustion products entcrod the exhaust plenum through a
2.0 In. diameter hole (see Fig. 1 a) . The exhaust plenum. a
stainless steel box. supported a conical plunger and the two
solenoids which moved It. A switch In the control room enabled the
solenoids. pushing the plunger partially Into the 2.0 In. diameter
hole to create either a pulsed or sustained pressure Increase.
Although use of the plunger to create transient conditions was in
tended. no testing was done with it In this study. The plunger
cooling water dumped Into the exhaust plenum to cool the hot gasas
and to protect the exhaust pipes and muffler (see figure 1 a) .
Two 1/2 in. thick, 5 In. by 16 in. optical quality quartz win
dows formed the sidewalls of the test section and provided visual
access to the entire combustion process. Early in the testing. one
quartz window was replaced with a stainless steel plate which provid
ed a better background for viewing the flame. High temperature
gasket material placed between the combustor sidewall and the win
dow formed a 1/16 in. gap above and below the premixing tube
(see figure 1 c) . The upper and lower edges of the window gasket
were unconfined and often blew out when rig pressure was raised to
approximately 20 psia to take gas emissions data.
After warped window flanges resulted In the breaking of
several quartz windows. both windows were replaced by stainless
steel plates. Flashback, previously detected visually. was then
detected by a chromel-alumel thermocouple mounted in one of the
stainless steel plates. 1 in. upstream of the step. centered In the

9
premixing tube 1/8 in. away from the sidewall. The 0.020 In. di
ameter wires were Joined by a 1/16 In. bead. The fll'1al tests were
made with a 6 in. diameter quartz window machined to mount flush
in one of the stainless steel plates as shown in figure 4.
11.3. Instrumentation
Temperature.. Average premixer and combustor wall tempera
tures were measured with chromel-alumel thermocouples embedded
In the top and bottom walls. Open ball platinum-rhodium thermo·-
couples extending 1/2 in. from the combustor wall Into the combus
tion zone measured gas temperatures. The locations of these ther
mocouples are shown In figures 5 and 6. A matrix of chromel-
alumel thermocouples mounted in the transition section just upstream
of the fuel Injector. as shown In figure 1. measured the Inlet air
temperature. All thermocouples had 1/16 in. beads. The tempera
ture of the propane-air mixture was estimated to be between 94 and
98 percent of the Inlet air temperature at operating conditions.
Pressure._ The inlet and combustor pressures were measured
at locations shown in figures 1 and 5. Observation of small pressure
oscillations was facilitated by the use of 2. 0 pslg Endevco piezoelec
tric transducers with a 45.000 Hz resonance frequency. A limited
amount of data was taken with the Inlet transducer at an alternate
location. 41.25 in. upstream of the step. to examine the phase
relation between the two transducers.

10
Flowrates. Flowrates were measured with orifice runs. The
pipe and orifice diameters used to measure the flowrates of combus-
lion air. propane. and wall heating air are presented in Table 1.
Table 1. Orifice and Pipe Diameters
Gas
Combustion air
Propane
Wall heating air
Pipe Diameter ( Inches)
2.0
0.5 (tube)
O. 75
Orifice Diameter ( Inches)
0.4003
0.05
0.15
The. upstream pressure and the pressure drop across the orifice
were measured with 200 psia and 50 psld transducers. respectively.
Chromel-alumel thermocouples measured upstream orifice tempera--
tUrE~S . To insure the gaseous state of propane at its orifice an
upstream pressure of 150 psia and a temperature of at least 180°F
was maintained. A 0.10 gal/mln turbine meter was installed In the
propane system to verify the orifice measurements. Once verlfica-
tion was made. use of the turbine meter was discontinued.
J:xhaust Emissions. Emission measurements were occasionally
made to check the uniformity of the fuell air profile. Exhaust emls-
sions of NO x' CO. CO2 and unburned hydrocarbons were measured
with the facility gas analyzer. To take emissions data the rig pres-
sure was raised to approximately 20 psla. by partially closing the

11
exhaust valve, to force the sample into the gas analyzer probe and
to achieve a sufficient sample flowrate to the analyzer. The probe
was water cooled to rapidly quench the reactions In the sample and
the sample line was heated to 350 0 F to prevent condensation of hy
drocarbons. located near the exit of the combustor (figure 6). the
probe was mounted on an l. C. Smith controller to traverse to
several vertical locations In the combustor. Co'ncentratlons of car
bon monoxide and carbon dioxide were measured with nondlsperslve
Infrared analyzers, total nitrogen oxides (NO and N02
) with a
chemilumlnescent analyzer and unburned hydrocarbons with a flame
ionization detector.
1/.4. Data Acquisition and Analysis
Several systems were used for data acquisition. The bulk of
the data was taken. via Escort II. a dedicated PDP-ll mini-
computer. Raw data (millivolts) from the instrumentation was fed to
Escort II. In the normal running mode, Escort II displayed various
parameters. such as flowrates and temperatures which were calcu
lated from raw data. on a CRT screen. The display was updated
every 2 seconds. When data were recorded by manually pushing
the "record" button. the raw millivolt data were stored on a legal
record tape and transmitted to the IBM 370 computer's data collector
where It was stored In the proper data set for further calculations
and analysis. Certain calculated values were stored In a separate
data set for each reading to facilitate plotting data via the post-test
Interactive graphics package. Selected calculations can be found In
12
Ref. 12.
An 8 channel strip chart recorder was used to monitor pres
sures In the Inlet and combustor. and the flashback thermocouple
temperature. Inlet and combustor pressures were also recorded on
a Bascom-Turner digital data recorder for a few test runs. Data
were recorded every 100 #s for 150 ms and stored on an 8 in.
floppy disk. Data CQuid then be played back to a plotter with ad-
justed scales for maximum readability.
Visual observations were recorded by a video camera in con
junction with a Sony Beta Max video recorder. Most tests run with
visual access were taped. Several 16 mm. high speed movie cam
eras, Including a MUlliken DPM 55. a Hycam II and a Fastax WF3.
were used to film flashback at 200. 400 and 1000 frames/sec.

CHAPTER III
PROCEDURE
The following procedure was followed in collecting flashback
data:
1. The inlet all' temperature.' premlxer wall temperature. and aver
age premlxer velocity were adjusted to the desired values.
2. The video and brush recorders were turned on.
3. The igniter was started and the fuel was permitted to flow to
the test section Initiating combustl~n at the step.
4. After the igniter timed out. the fuellair equivalence ratio was
increased (by Increasing the fuel flowrate) until flashback oc
curred at which time data was recorded. Visual observation of
the flame and/or the trace of the flashback thermocouple on
the brush recorder monitored the occurrence of flashback.
The test conditions were as follows: Inlet all' temperature. 600
to 850 K; premlxer wall temperature. 450 to 900 K; premixing tube
velocity. 40 to 80 ft/s. equivalence ratio. up to 0.8.
13
IV. 1.
CHAPTER ·'V
EXPERIMENTAL RESULTS AND DISCUSSION
Visual Observation
As the fuellalr equivalence ratio was Increased to the point of
flashback. several stages of burning were observed. Photographs
from a video tape of an early test run with a 5 X 16 In. quartz win
dow illustrate these stages and are shown In figure 8. Flow Is from
right to left with the premhcer on the right dumping Into the comb us-
tor on the left. The bright spots near the combustor walls are
thermocouples. Test conditions were: Inlet air temperature. 850
K; . premixer wall temperature. 750 K; average premixer velocity 70
HIs. Photographs a-e are in order of increasing equivalence ratio.
;! with the exception that (a) and (b) have approximately the same
equivalence ratio. A very lean flame (;=0.41) attaches to tho
lower step (a) or in some cases attaches to both steps (b). occa
sionally moving downstream as though It is about to blow off. At
increased equivalence ratio (;=0.44) the flame attaches to both
steps with strong recirculation zones becoming visible behind them
as seen in (c). A further increase In equivalence ratio to O. 56
causes the flame to flicker (sporadic extension of the flame front in
and out of the premixing tube). Figure 8( d) shows the flame front
just upstream of the step as flickering begins. The distance of
flame propagation during flickering Increases with equivalence ratio
14
15
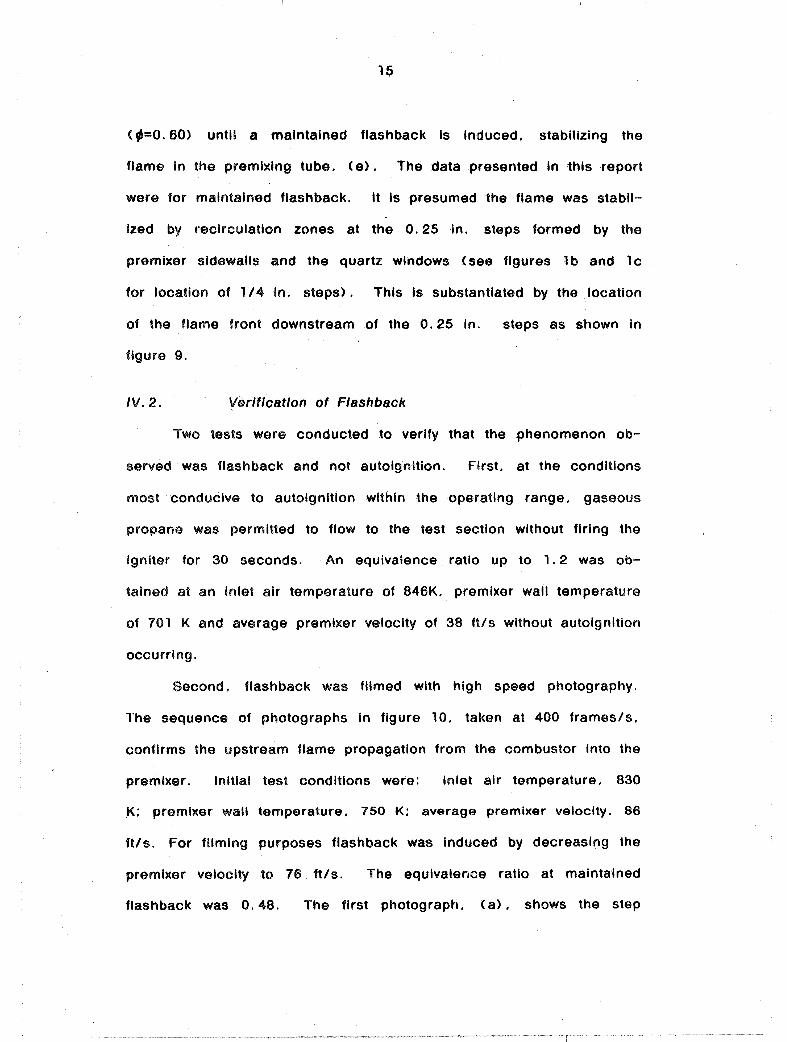
(~=O. 60) until a maintained flashback Is Induced, stabilizing the
flame In the premixing tube, (e). The data presented In this report
were for maintained flashback. It is presumed the flame was stabil
Ized by recirculation zones at the O. 25 In. steps formed by the
premlxer sidewalls and the quartz windows (see figures 1 band 1 c
for location of 1/4 In. steps). This is substantiated by the location
of the flame front downstream of the O. 25 In. steps as shown In
figure 9.
IV.2. Verification of Flashback
Two tests were conducted to verify that the phenomenon ob
served was flashback and not autoignition. First, at the conditions
most conducive to autolgnltlon within the operating range, gaseous
propane was permitted to flow to the test section without firing the
igniter for 30 seconds. An equivalence ratio up to 1.2 was ob
tained at an Inlet all" temperature of 846K, premlxer wall temperature
of 101 K and average premlxer velocity of 38 ft/s without autolgnition
occurring.
Second. flashback was filmed with high speed photography.
The sequence of photographs in figure 10. taken at 400 frames/so
confirms the upstream flame propagation from the combustor into the
premb:er. Initial test conditions were: Inlet all" temperature, 830
,K: premtxer wall temperature. 750 K; average premixer velocity. 86
ft/s. For filming purposes flashback was Induced by decreasing the
premlxer velocity to 16 ft/s. The equivalence ratio at maintained
flashback was O. 48. The first photograph, (a), shows the step
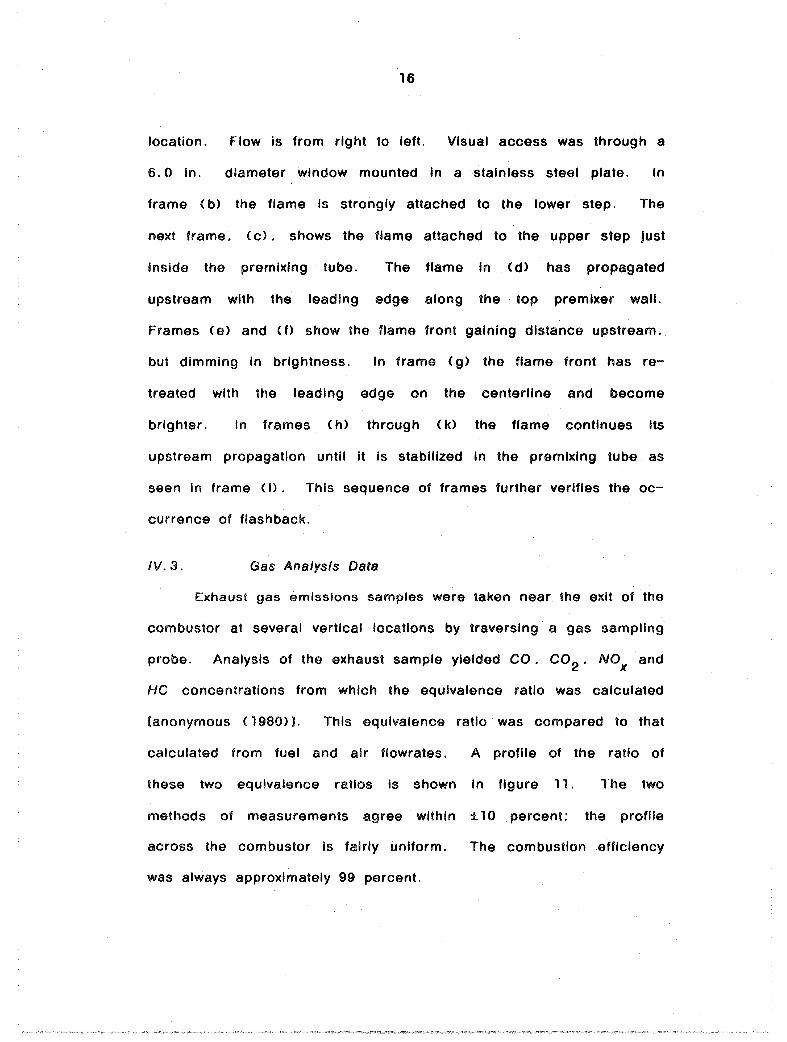
16
location. Flow is from right to left. Visual access was through a
6.0 in. diameter window mounted in a stainless steel plate. In
frame (b) the flame Is strongly attached to the lower step. The
next frame. (c). shows the flame attached to the upper step just
inside the premixing tube. The flame In (d) has propagated
upstream with the leading edge along the top premixer wall.
Frames (e) and (1) show the flame front gaining distance upstream.
but dimming In brightness. In frame (g) the flame front has re
treated with the leading edge on the centerline and become
brighter. In frames (h) through (k) the flame continues its
upstream propagation until It is stabilized in the premixing tube as
seen In frame (I). This sequence of frames further verifies the oc
currence of flashback.
IV.3. Gas Analysis Data
Exhaust gas emissions samples were taken near the exit of the
combustor at several vertical locations by traversing a gas sampling
probe. Analysis of the exhaust sample yielded CO. CO2 , NOx and
HC concentrations from which the equivalence ratio was calculated
[anonymous (1980)]. This equivalence ratio was compared to that
calculated from fuel and air fiowrates. A profile of the ratio of
these two equivalence ratios Is shown In figure 11. The two
methods of measurements agree within :110 percent: the profile
across the combustor Is fairly uniform. The combustion efficiency
was always approximately 99 percent.

17
IV.4. Parametric Study
A parametric study was done to determine the effects of Inlet
air temperature. premlxer wall temperature. premixing tube velocity
and fuel injector location on the minimum equivalence ratio required
for a maintained flashback. Each plotted data point represents a
single set of maintained flashback conditions. Thus the data plots
show the actual data scatter.
The inlet air temperature effect is slight as shown in figure
12. . The equivalence ratio at which maintained flashback occurred is
plotted against Inlet air temperature. As inlet air temperature in
creases the equivalence ratio decreases as expected. At premlxer
velocity of 60 His the equivalence ratio at maintained flashback de
creases from .68 at an inlet air temperature of 600 K to .5 at an
Inlet temperature of 850 K. This trend occurs at premlxer velocities
of 40. 50 and 60 ft! s. Note that the equivalence ratio for main
tained flashback Is lower at a premixer velocity of 60 His than at 40
His.
The effects of premlxer wall temperature and premixing tube
velocity are unclear. figure 13 illustrates the relation of the main
tained flashback equivalence ratio to the average premixing tube
velocity at inlet air temperature of 600 K at six different premlxer
wall temperatures. Data scatter Is such that separate curves for
each premixer wall temperature are indistinguishable. Thus. the ef
fect of the premlxer wall temperature on the flashback equivalence
ratio Is unclear.

18
Originally. it was thought that flame flashback might be caused
in the wall boundary layer by the velocity balance mechanism [lewis
and von Elbe (1961») because of the high wall temperatures. Ac
cording to the velocity balance concept In steady-state. flashback
can occur If the flame speed at the edge of the wall quenching
layer exceeds the local flow velocity. The data In figures 12 and
13, however, do not support this mechanism. Flashback occurred
at lower equivalence ratios as the premlxer velocity was Increased.
(A decrease in equivalence ratio decreases flame speed.) Clearly.
this trend opposes the steady-state velocity balance concept. Furth
ermore, if flashback were to be explained by this concept. one
would expect that as wall temperature was Increased, flashback
would occur at lower equivalence ratios. Fig. 13 shows that such a
trend did not occur in the present tests. When wall temperature
was Increased from 500 to 700K. there was no evident change in
flashback equivalence ratio.
The data discussed so far were taken with the fuel injector
mounted 8 in. upstream of the step. A small portion of data were
taken with the fuel injector 25 1/2 In. upstream of the step. This
greater distance Increased the amount of time for the propane and
air to mix. Flashback equivalence ratios were the same. within data
scatter. for both fuel Injector locations.
At the 25-1/2 in. position the equivalence ratio at which flick
ering first began was also recorded. The magnitude of the differ
ence between the flickering equivalence ratio and flashback
19
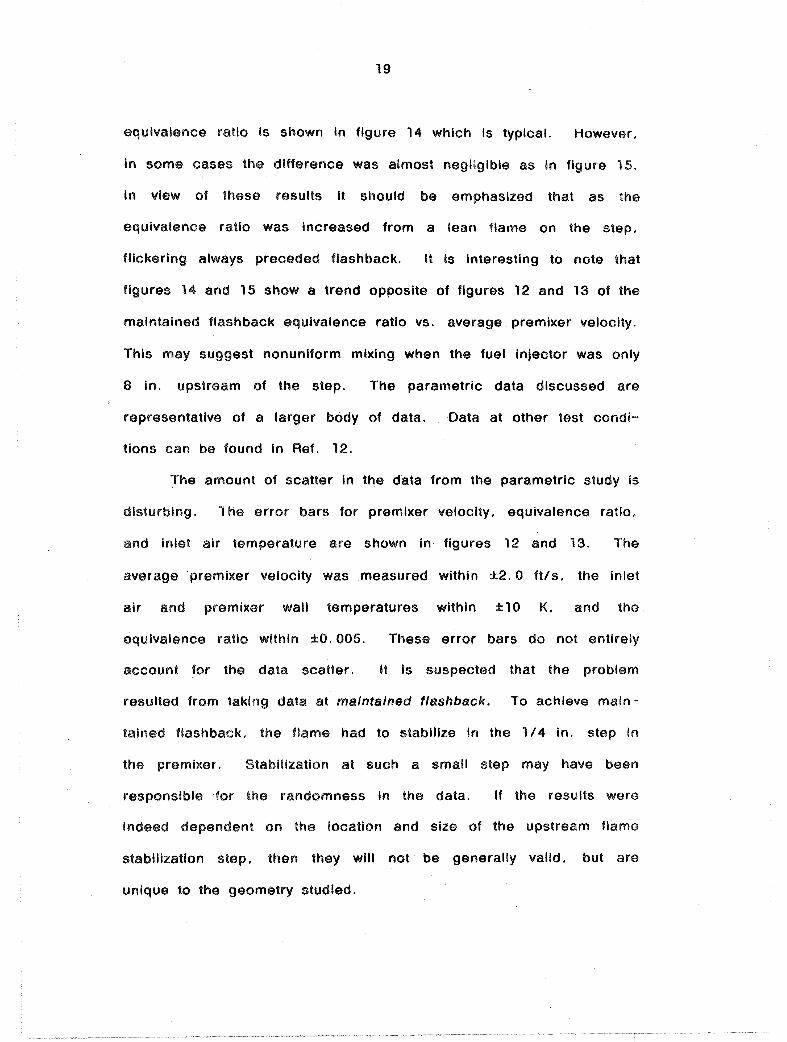
equivalence ratio is shown in figure 14 which Is typical. However.
in some cases the dlffe,'ence was almost negligible as in figure 15.
In view of these results It should be emphasized that as the
equivalence ratio was Increased from a lean flame on the step.
flickering always preceded flashback. It is interesting to note that
figures 14 and 15 show a trend opposite of figures 12 and 13 of the
maintained flashback equivalence ratio vs. average premixer velocity.
This may suggest nonuniform mixing when the fuel Injector was only
8 in. upstream of the step. The parametric data discussed are
representative of a larger body of data. Data at other test condi
tions can be found in Ref. 12.
The amount of scatter in the data from the parametric study is
disturbing. 1 he error bars for premlxer velocity. equivalence ratio.
and inlet air temperature are shown in figures 12 and 13. The
average 'premixer velocity was measured within ±2.0 ftls. the inlet
air and premixer wall temperatures within ± 10K. and tho
equivalence ratio within ±O. 005. These error bars do not entirely
account for the data scatter. It is suspected that the problem
resulted from taking data at maintained flashback. To achieve maIn
tained flashback, the flame had to stabilize In the 1/4 in. step in
the premixer. Stabilization at such a small step may have been
responsible for the randomness In the data. If the results wera
Indeed dependent on the location and size of the upstream flama
stabilization step. then they will not be generally valid. but are
unique to the geometry studied.
20
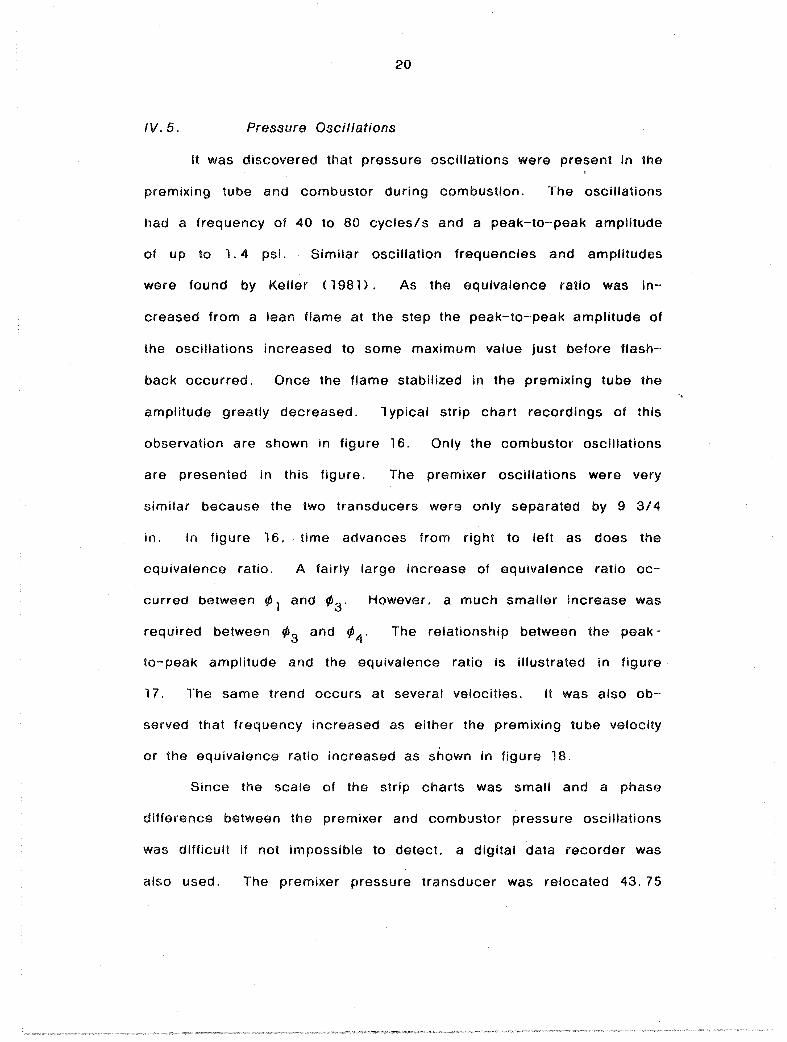
IV.5. Pressure Oscillations
It was discovered that pressure oscillations were present in the
premixing tube and combustor during combustion. The oscillations
had a frequency of 40 to 80 cyclesls and a peak-to-peak amplitude
of up to 1. 4 psi. Similar oscillation frequencies and amplitudes
were found by Keller (1981). As the equivalence ratio was in
creased from a lean flame at the step the peak-to-peak amplitude of
the oscillations increased to some maximum value just before flash
back occurred. Once the flame stabilized in the premixing tube the
amplitude greatly decreased. 1 ypical strip chart recordings of this
observation are shown in figure 16. Only the combustor oscillations
are presented in this figure. The premixer oscillations were very
similar because the two transducers were only separated by 9 3/4
in. In figure 16.· time advances from right to left as does the
oquivalence ratiO. A fairly large increase of equivalence ratio oc-
curred between rfJ 1 and rf>3' However. a much smaller increase was
required between ¢3 and ¢ 4' The relationship between the peak
to-peak amplitude and the equivalence ratio is illustrated in figure
17. The same trend occurs at several velocities. It was also ob
served that frequency increased as either the premixing tube velocity
or the equivalence ratio increased as shown in figure 18.
Since the scale of the strip charts was small and a phase
difference between the premixer and combustor pressure oscillations
was difficult if not impossible to detect. a digital data recorder was
also used. The premixer pressure transducer was relocated 43.75
21
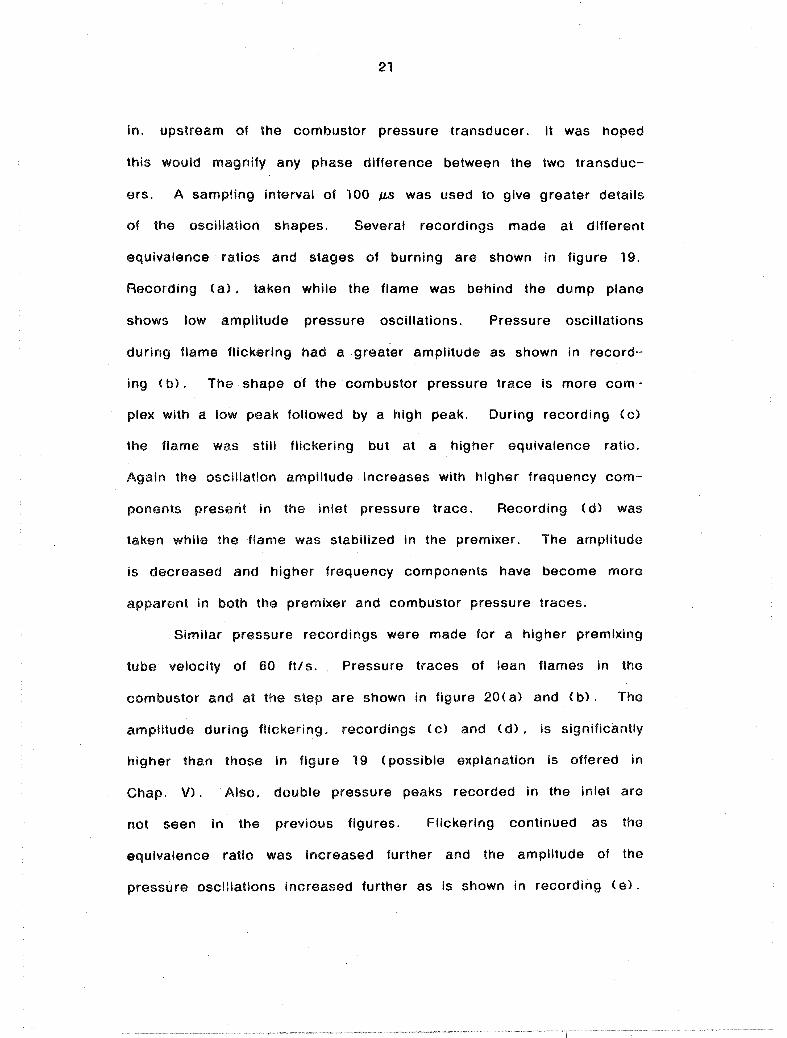
in. upstream of the combustor pressure transducer. It was hoped
this would magnify any phase difference between the two transduc
ers. A sampling interval of 100 J.LS was used to give greater details
of the oscillation shapes. Several recordings made at different
equivalence ratios and stages of burning are shown in figure 19.
Recording (a). taken while the flame was behind the dump plane
shows low amplitude pressure oscillations. Pressure oscillations
during flame flickering had a greater amplitude as shown in record-
jng (b). The shape of the combustor pressure trace is more com
plex with a low peak followed by a high peak. During recording (c)
the flame was still flickering but at a higher equivalence ratio.
Again the oscillation amplitude increases with higher frequency com
ponents present in the inlet pressure trace. Recording (d) was
taken while the flame was stabilized in the premixer. The amplitude
Is decreased and higher frequency components have become more
apparent in both the premixer and combustor pressure traces.
Similar pressure recordings were made for a higher premixing
tube velocity of 60 ft/s., Pressure traces of lean flames In the
combustor and at the step are shown in figure 20( a) and (b). The
amplitude during flickering. recordings (c) and (d) .. is significantly
higher than those in figure 19 (possible explanation is offered in
Chap. V). Also. double pressure peaks recorded in the inlet are
not seen in the previous figures. Flickering continued as the
equivalence ratio was Increased further and the amplitude of the
pressure oscillations increased further as is shown in recording (e).

22
Parts of the pressure traces of recordings (f) and (g) have de
creased amplitudes characteristic of flame stabilization in the premIx
ing tube and others have greater amplitudes like those of flickering.
This Is understandable as the flame was only momentarily stabilized
in the premixing tube when these recordings were made. In all
recordings there exists a phase shift between the combustor pressure
and the inlet pressure peaks. However. the phase shift calculated
using the speed of sound with a one-dimensional standing wave
(see Ref. 12) did not agree entirely with the measured phase shift.
For example. in one case the calculated phase shift was 37 degrees
and the measured phase shift was 51 degrees. In another case the
calculated phase shift was 43 degrees and the measured was 133
degrees. A more complicated analysis was not attempted.
IV. 6. f low Reversals
Although the peak-to-peak amplitude of the pressure oscilla
tions was small (up to 1. 0 psi>. it would have been large enough
to induce local flow reversals in the premixing tube since the pres
sure drop in the premixer is much smaller (see Chap. V for their
estimates) . A simple experiment was performed to determine if flow
reversals did occur near the premixer exit. Ceramic fibers of high
temperature gasket material were cemented with ceramic cement to
the top and bottom premlxer walls 1 In. upstream of the step, to
the top and bottom combustor walls 1 in. downstream of the step.
and to the vertical faces of the step. The ceramic fibers attached
to the vertical faces of the step were blown upstream into the

23
premixing tube during flickering. Thus. flow reversals did occur
near the premixer exit. however the magnitude and the extent of the
reversals have not yet been determined experimentally. A theoretical
analysis of flow reversal in the premixing channel is given in the
next chapter.
CHAPTER V
ANALYSIS OF FLOW REVERSAL IN PREMIXING CHANNELS
V.1. Flelevance
The last chapter on flame flashback experiments strongly sug
gests that flow reversal may occur during combustion oscillation and
can be responsible for the observed flashback phenomenon. To
substantiate this further. the following estimate is given. Fig. 18
indicates that at average premixer velocity of 40 ft/s. the pressure
oscillation frequency is 48 Hz. The time for flame to flicker
upstream is at most half of the oscillating period. i. e. 10.4 ms.
At the instance the flame becomes anchored in the premixer. it has
to travei 6 inches as indicated in Fig. 9. The average velocity for
upstream flame motion is then at least 48 ftl s. 1 his value is too
great for flame burning velocity. Therefore a concurrent fluid flow
must be with the flame motion as it approaches the fuel injector.
In order to obtain more understanding of the flow reversal
phenomenon in the premixing channel. a fluid mechanical analysis is
made based on a simplified model.
24

25
V.2. Flow Reversal Model
The following. assumptions are made:
1. The flow in the premixer is non-chemically reacting.
2. The flow in the premixer is two-dimensional.
3. The flow is fully-developed for both steady and oscillatory
states.
4. The flow is incompressible and laminar.
Before we write down the governing equation for the flow. these as
sumptions will be discussed.
The non-chemically-reacting assumption is valid if thetem
perature in the premixer is not high enough to cause considerable
heat release in the premixing channel; a condition which is satisfied
in our experiments. It also restricts the application of our theoreti
cal results to regions ahead of the flame when flashback occurs.
In the experiment. the premixing channel has a rectangular
cross-section with aspect ratio of 4 to 1. so a two-dimensional ap
proximation is adopted in the analysis.
1 he premixer has a long entrance section (entrance length to
height ratio =47). so the. steady flow in the premixing section
should be fully-developed. The same assumption for the oscillatory
state requires explanation. The observed pressure oscillation fre-
quencies are from 48 to 75 Hz. 1 he corresponding quarter wave
lengths are estimated to be from 9. 5 to 6. 1 feet based on an air
temperature of 800 K. Since the premixing channel is only 6-1/2
inches long and it is the only section of interest to us. the pressure

26
distribution over this section can be taken approximately as linear.
In other words. using this "long wave approximation". the pressure
gradient is a constant over space in the premixer at any given in-
stance during the oscillation. hence a fully-developed flow.
Although the work fluid is gaseous. the incompresible flow as.sump-
, tion is valid because under the long wave approximation. no wave
propagation phenomenon is involved. The flow is driven by pressure
gradient alone and both the pressure differential and the velocity
magnitude are small enough to justify the incompressible assumption.
1 he laminar flow assumption is perhaps the most uncertain.
The Reynolds numbers based on the channel height are from 3800
to 7600 for average flow velocities from 40 to 80 fUsec. According
to the linear theory of hydrodynamic stability. the critical Reynolds
number is 5772 for two-dimensional Poiseuille flow (R.eshotko
(1984)] . So if free stream turublence can be avoided in the
upstream, our flow can either be laminar or transitional (turbulent>.
depending on the operating Reynolds numbers. In reality. a
disturbance-free upstream flow is difficult to achieve; the flows in
our experiments are more likely to be turbulent. 1 he use of laminar
flow in our analysis can only be taken as the first step in the
understanding of this complicated flow phenomena. a discussion of
the status of modeling periodic turbulent pipe flow can be found
later in Section V. 8.
27
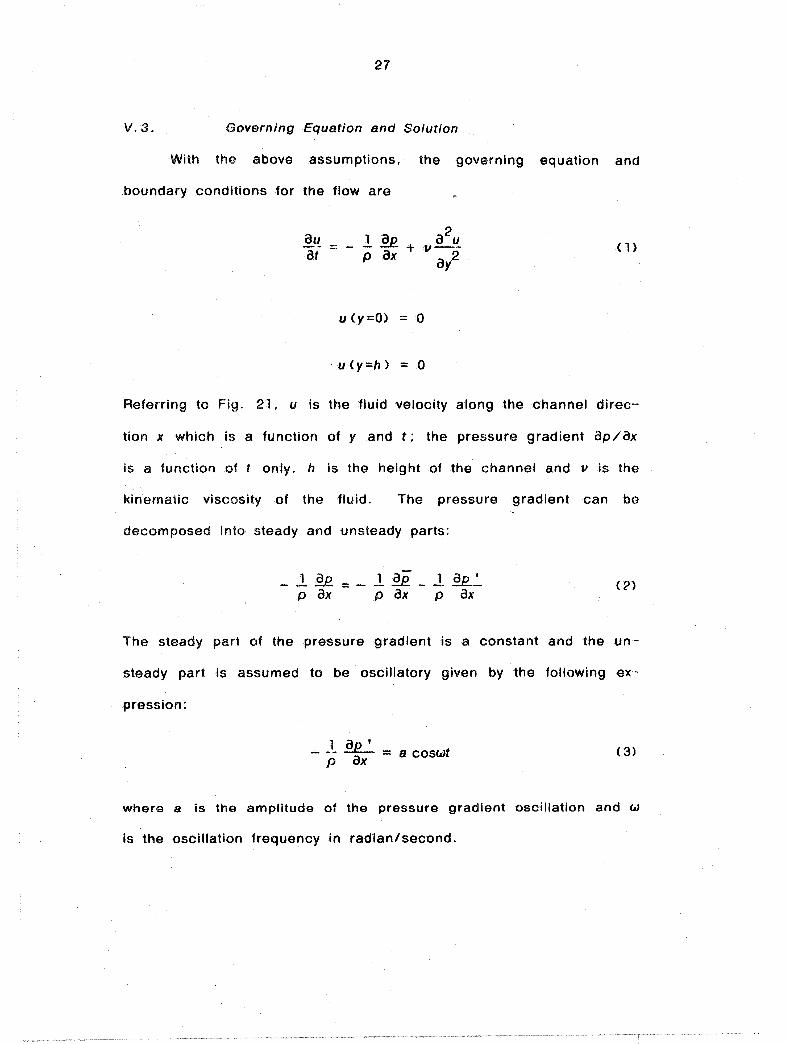
V.3. Governing Equation and Solution
With the above assumptions, the governing equation and
boundary conditions for the flow are
au at
u (y=O) = 0
u (y=h) = 0
( 1)
Referring to Fig. 21, u is the fluid velocity along the channel direc-
tion x which is a function of y .and t; the pressure gradient ap/ax
is a function of t only. h is the height of the channel and 11 is the
kinematic viscosity of the fluid. The pressure gradient can bo
decomposed into steady and unsteady parts:
_ ~ E£ p ax = - lEi_~~
p ax p ax ( ~)
The steady part of the pressure gradient is a constant and the un'-
steady part is assumed to be OSCillatory given by the following ex-
pression:
_ 1 an' .::..r::-.. = 8 coswt p ax
( 3)
where a Is the amplitude of the pressure gradient oscillation and w
is the oscillation frequency in radian/second.

28
Using Eqs. (2) and (3), Eq. ( 1) can be separated into
steady and oscillatory equations as follows:
and au I
at
u'(o,t) =u'(h,t) =0
( 4)
( 5)
Here. we would like to emphasize that the separation into Eqs. (4)
and (5) is due to the linearity of Eq. (1). there is no restriction
on the magnitude of the oscillatory pressure gradient. As a matter
of fact. we shall see later. the more interesting cases are those
when oscillating amplitudes are much greater than the mean.
Eq. (4) is the well-known equation for two-dimensional
Poiseuille flow. 1 he solution is
the mean (average) velocity. U m' is given by
U m
( 6)
(7)
29
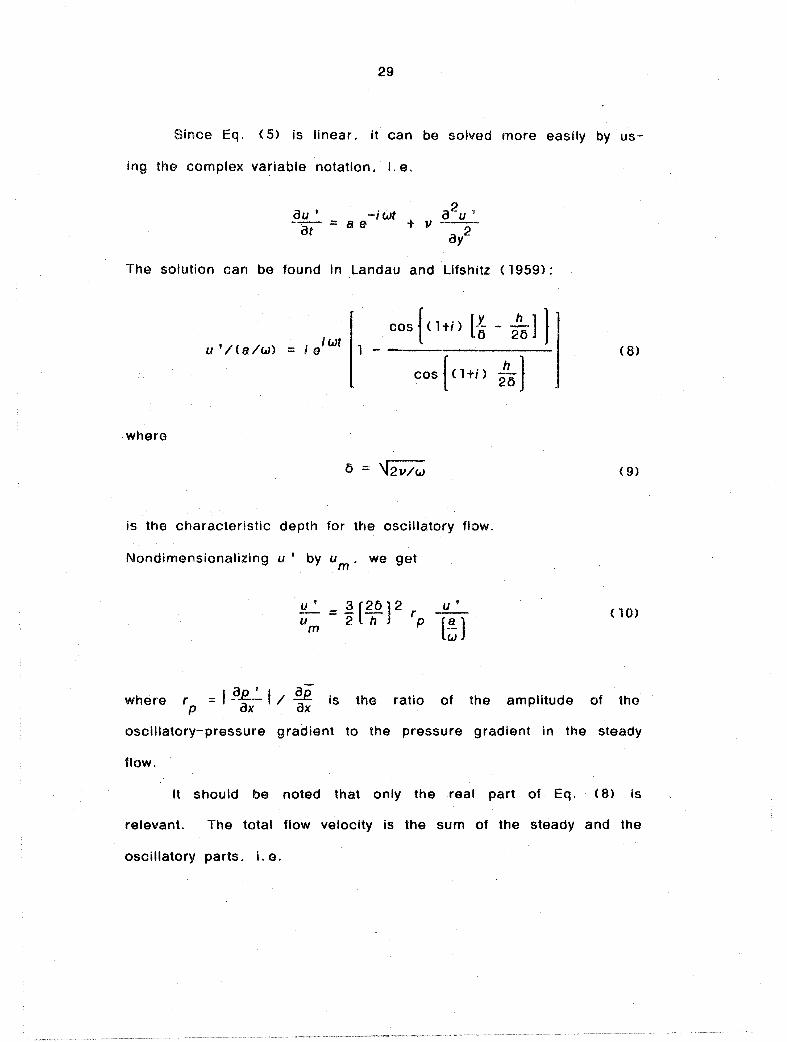
Since Eq. (5) is linear. it can be solved more easily by us-
ing the complex variable notation. I. e.
au ' -;wt a2u u = ae t v at ay2
The solution can be found In Landau and Lifshitz (1959):
u 'I ( a I w) = i e I wt cos {<l+il [E - ;0 J}
1 - ---------
cos { (1+i) ;0 l whero
is the characteristic depth for the oscillatory flow.
Nondimensionalizing u' by u . we get m
where r p
= I !JE..:... I / ~ is ax ax the ratio
u '
[~ ]
of the amplitude
( 8)
( 9)
(10)
of the
oscillatory-pressure gradient to the pressure gradient in the steady
flow.
It should be noted that only the real part of Eq. (8) is
relevant. The total flow velocity is the sum of the steady and the
oscillatory parts. I. e.

u u m
30
:. -lL. + u' u u m m
From Eqs. (6). (8) and (10). we can see that
_y- [~. wt J = function of um
( 11)
In nondimensional form. the velocity depends only on two di-
mensionless parameters. They are the . ratio of the half channel
height to the characteristic oscillation depth and the ratio of the os-
cillatory pressure gradient amplitude to the steady-flow pressure gra-
diant.
V.4. Values of Nondimensional Parameters
Before analyzing the details of the solution. the typical values
of the two nondimensional parameters corresponding to the experi-
mental conditions are listed in Tables 2 and 3.
Table 2. Ratio of Half Channel Height' to Characteristic Oscillation Depth
(for e = 0.47)
Um w h/2 h/26
ttl s Hz cm cm
40 48 0.0735 1.27 17.3
60 60 0.0657 1.27 19.33
70 72 0.0600 1.27 21. 16

31
Table 2 indicates the characteristic oscillation depth, 6 is of the
order of 1 millimeter (slightly less) for the frequency range ob·-
served. and the length ratio h/26 is much greater than unity.
Table 3 gives an estimate of the pressure gradients ratio r. Here . . \ p
in the absence of a precise measurement. both the oscillatory pres-
sure gradient and the steady-flow pressure gradient have to be es-
timated. The maximum oscillatory pressure gradient is taken to be
the ratio of the largest measured pressure amplitude to the quarter
wave length. 1 he steady pressure gradient can be computed from
Eq. ("1) for laminar flow. However, because of the uncertainty of
the flow condition. estimates of the pressure gradient in turbulent
(or transitional> flows are also given. Correspondingly. the pres-
sure gradient ratios are listed for both the laminar and the turublent
flows. During the experiment, as the pressure oscillation increases
in amplitude, the ratio of the pressure' gradients also increases until
the flame becomes anchored in the premixer. The listed pressure
gradient ratios correspond to this final maximum value.
From Table 3. we see that the pressure gradient ratios are
much greater than one. . In other words, the experimental data are
suggesting that the oscillating pressure gradient amplitude has to be
much larger than the steady-flow pressure gradient to have flame-
flashback. 1 he analysis of the influence of r on flow reversal is p
therefore of interest.

Table 3. Estimated Pressure Gradients Ratio
Um w quarter wave max half max max max
length 1/4 oscil!. amp. pp'/ax ap/ax ap/ax r rp p
t\Pmax (=t\p' /( 1/4» (laminar) ( turbulent> (Iam"nar) ( turbulent>
ftls Hz It psi psilft psllft psl/ft
40 48 9.5 0.4 0.0421 0.000364 0.0007- 0.002 115 17 - 60 w
60 60 7.5 O. 7 0.0933 0.000546 0.001 ... 0.004 171 23 - 93 N
33
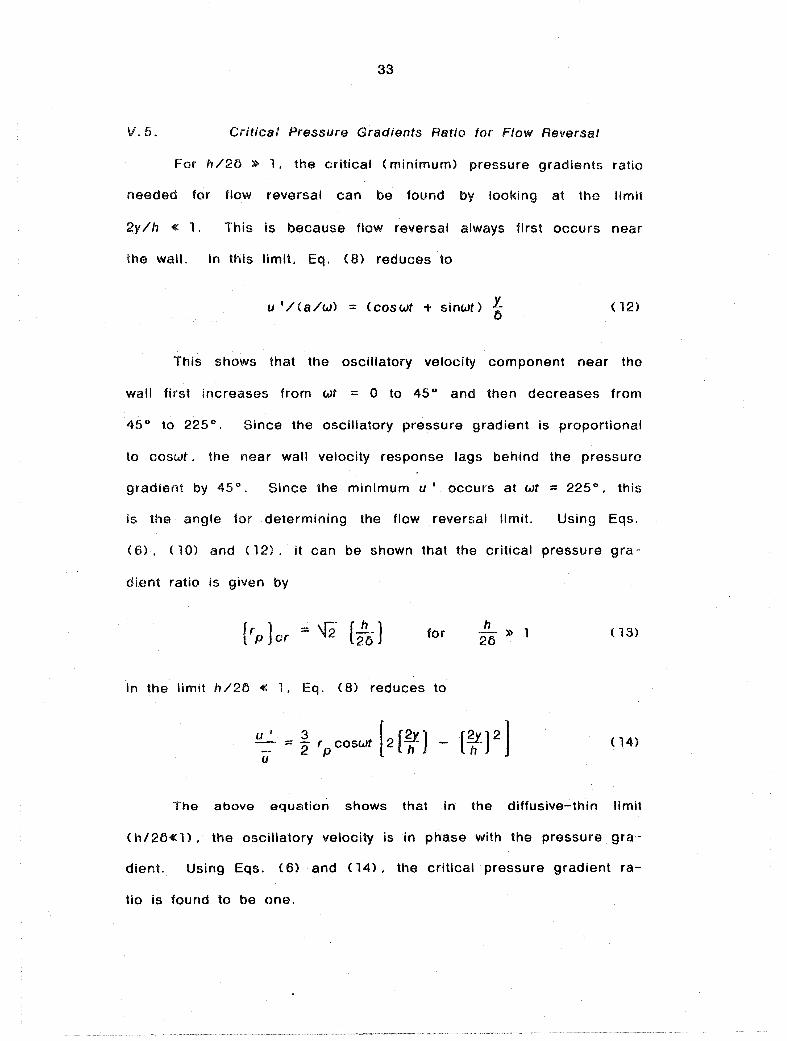
V.5. Critical Pressure Gradients Ratio for Flow Reversal
For h /25 » 1. the critical (minimum) pressure gradients ratio
needed for flow reversal can be found by looking at the limit
2y/h «1. This is because flow reversal always first occurs near
the wall. In this limit. Eq. (8) reduces to
u '/(a/w) = (coswt + sinwt> ~ ( 12)
This shows that the oscillatory velocity component near the
wall first increases from wt = 0 to 45° and then decreases from
45° to 225°. Since the oscillatory pressure gradient is proportional
to coswt. the near wall velocity response lags behind the pressuro
gradient by 45°. Since the minimum u' occurs at wt = 225 0• this
is the angle for determining the flow reversal limit. Using Eqs.
(6). (1 Q) and (12). it can be shown that the critical pressure gra-
cHent ratio is given by
for h
26 » 1 ( 13)
In the limit h /26 « 1. Eq. (8) reduces to
( 14)
The above equation shows that in the diffusive-thin limit
(h/26« 1). the oscillatory velocity is in phase with the pressure gra'-
dient. Using Eqs. (6) and (14). the critical pressure gradient ra-
tio is found to be one.

34
Figure 22 gives the computed (r p) as a function of h/26. It
can be seen that for h/26 > 3. Eq. ( 13) applies. and for
h /26 < O. 3. (r p ) cr ~ 1. Referring to Table 2. for the experiment
at um = 40ft/sec. h/25 is equal to 17.3. from Eq. (13) or Fig.
22. (r) == 24.47; and for um
= 60 fUsec. (r) = 26.87. p cr p cr
Both values fall Into the range of r estimated in Table 3. Howev-p
or. for a substantial extent of flow reversal (higher reverse velocity
and greater flow reverse duration within one cycle). pressure gra-
dient ratio greater than (r) is needed. This will be shown in p cr
the next section using the velocity profiles corresponding to several
values of R . p
V.B. Velocity Profiles Near the Wall
Hg. 23 presents the near-wall velocity profiles as a function
of wt (in degree) for r = 50 and h /25 = 17. 3 <this value . p
corresponds to w = 48 cps) . The profiles show that very close to
the wall. the velocity decelerates from 45 0 tp 225 0 as indicated by
Eq. (12). Moderate flow reversal occurs both in terms of magni-
tudo. penetration depth and duration of reversal. This figure also
shows that there Is a time lag between the near-wall velocity profiles
and those further into the channel interior. For example. comparing
the profiles at 225 0 and 270 0• near the wall. flow is accelerated
from 225 0 to 270 0• but away from the wall. the flow is still de-
celerated during the same period. This time lag mechanism also
produces the wavy profile indicated by the curve at 315 0•

35
At 'p ::: 100. Fig. 24 shows the extent of flow reversal is
greatly increased resulting in a higher reversed velocity and greater
depth of flow reversal layer. furthermore, an Interesting
phenomenon is shown by the velocity profile at 315 0• i. e. a flow
reverse region exists in the fluid interior (0. 9 < Y /6 ( 2. 0>. while
the flow near the wall is not reversed.
The velocity profiles for a , p
close to the critical value
[ (r p] cr :::: 24.47] are shown in Fig. 25. For r :::: 30 at p
h /26 :::: 17. 3. flow reverses near the wall but its extent is very
small.
Since we are studying flame flashback in the premixing chan-
nel. factors contributing to greater flashback potential are of in-
terest. Obviously. higher reverse velocity and greater flow reverse
duration (within one cycle) would favor a greater upstream distance
for the flame to travel. Another factor which should be considered
is' the depth of flow reversal from the wall. This is relevant be-
cause flame may quench near the wall. Fig. 26 presents the max-
imum reversal velocity [ u /u]. the maximum flow reversal depth rev
(y rev/ 0 ] and the duration of flow reversal within one cycle
(i\8 rev' in degrees] as a function of the ratio of pressure gradients
rp for h/26 :::: 17.3. It can be seen that all of the three curves
increase monatonically with r . p
Before we discuss the effect of r on flame flashback. we p
would like to say a few words about the velocities far from the wall.
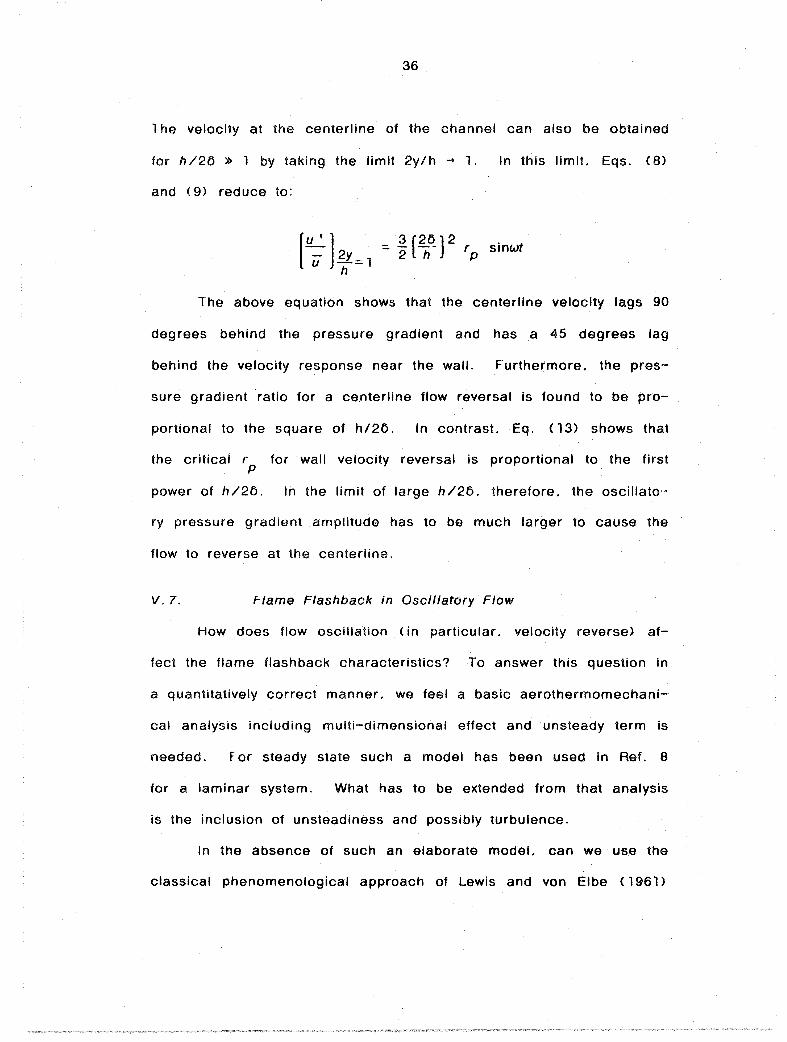
36
The velocity at the centerline of the channel can also be obtained
for h/20 » 1 by taking the limit 2y/h .... 1. In this limit. Eqs. (8)
and (9) reduce to:
IU'] 3[20]2. - :::. - - - r Slnwt U .?1:=:.1 2 h P
h
The above equation shows that the centerline velocity lags 90
degrees behind the pressure gradient and has a 45 degrees lag
behind the velocity response near· the wall. Furthermore. the pres-
sure gradient ratio for a centerline flow reversal is found to be pro-
portional to the square of h/26. In contrast. Eq. (13) shows that
the critical r for wall velocity reversal is proportional to the first p
power of h /20. In the limit of large h /20. therefore. the oscillato--
ry pressure gradient amplitude has to be much larger to cause the
flow to reverse at the. centerline.
V.7. flame Flashback in Oscillatory Flow
How does flow oscillation (in particular. velocity reverse) af-
fect the flame flashback characteristics? To answer this question in
a quantitatively correct manner. we feel a basic aerothermomechani-
cal analysis including multi-dimensional effect and unsteady term is
needed. f or steady state such a model has been used in Ref. 8
for a laminar system. What has to be extended from that analysis
is the inclusion of unsteadiness and possibly turbulence.
In the absence of such an elaborate model. can we use the
classical phenomenological approach of lewis and von Elbe (1961)

37
to predict qualitative trend? In the following, such an attempt will
be made.
Lewis and von Elbe's approach Is based on velocity comparis-
on at the edge of the wall quenching layer. If the flame burning
velocity is greater than the mixture opposed flow velocity, flashback
will occur. In principle, this idea can be applied to oscillatory flows
if the instantaneous flow velocity profile is specified. The other two
quantities needed in this approach is the quenching distance and the
mixture burning velocity.
The data on quenching distance and laminar burning velocity
for lean propane-air flames at 800 K have been hard to find.
Based on the expression given by Andrew and Bradley (1972) for
methane-air systems, we estimate the laminar burning velocity to be
4 ± 1 His and the quenching distance to be around 1 mm for
propane-air equivalence ratio of O. 6. The precision of theso
numbers is perhaps poor.· but it is not too essential for the following
qualitative argument.
Using Table 2, the quenching distance 1 mm is located at
yl (j ::: 1.36. At that height. for pressure gradient r p :::: 30, Fig. 25
shows that th the velocity profile at 270 0 gives ulum ::: 0.09 which
corresponds to u ::: 3.6 ftlsec. ror a burning velocity of 4 ft/s,
the flame can propagate into the premixer. However, since the net
upstream velocity is small and the duration of a positive upstream
propagation is short. only tiny flickering should be observed. f or a
higher r ::.; 50, Fig. 26 shows that at the edge of the quench layer p

38
(y/o == 1.36). the flow velocity is actually reversed. so greater
velocity into the premixer is produced. This. plus the longer flow
reversal duration. should result in a longer distance for the flame to
flashback into the premixing channel. This trend is greatly ac
celerated as the pressure gradients ratio is further increased as
shown by Figs. 24 and 26.
The above qualitative description seems consistent with what
has been observed experimentally. quantitative prediction is more
difficult. however. 1 ake quenching distance. for example. Normal
Iy. it is determined by passing a flame into a narrow channel or a
small diameter tube in a quiescent mixture. In the case when there
is a transient reversal. the wall layer may consist of hot combustion
products drawn from the dump plane. The meaning of quenching
distance is less clear in this situation. furthermore. the hot wall of
the experiment makes definition of a quench layer even more ambi
guous.
The second uncertainty has to do with turbulent flow which will
be briefly mentioned in the next section.
V.B. Status of Modeling Periodic Turbulent Flow in Pipes
As mentioned earlier in Section V. 2. the flow in the premixing
channel may well be turbulent. That being the case. one may think
that the laminar flow analysis just presented Is Irrelevant because the
turbulent flow is known to have much steeper velocity gradient near
the wall. We think. however. the laminar flow analysis does yield
the correct trend and the quantitative predictions on critical pressure

39
gradient ratio. reverse depth and duration of flow reversal may not
be as bad as one might first think. for the following reason.
1 he steeper turbulent wall velocity profile Is the result of the
much larger effective kinematic viscosity. but this same larger
kinematic viscosity is also helping the oscillation to reverse the flow
more effectively by increasing the oscillation depth 0 (see Eq.
(9) ) .
Needless to say. a turbulent flow analysis is justified. The
status of modeling work on turbulent oscillating flow in pipes can be
summarized by using the work of Acherya and Reynolds (1975) and
Tu and Ramaprian (1983). Both works employ a one-equation (k.
turbulent kinetic energy) turbulence model with turbulent scale
prescribed as a function of radial distance. This model has been
used very successfully for steady flows but it failed for' periodic flow
at high frequencies. We expect it will be even more likely to fail in
our case because of the larger oscill~tory pressure gradient. The
reason for failure is probably that the turbulent length scale is as
sumed to be time-Independent. A logical next step seems to be the
relaxation of this assumption by using the k-€ model.
CHAPTER VI
CONCLUSIONS AND RECOMMENDATIONS
In this study. visual access to the combustion process proved
most useful. Not only were several stages of burning identified as
in section 4. 1. but also the upstream propagation of the flame with
the leading edge near the wall was verified with high speed photog
raphy. The oscillatory nature of the flame was recorded on film and
determined to be of the same frequency as that recorded with pres
sure transducers.
The parametric study of the effects of inlet and premixer wall
temperature and premixer velocity on the equivalence ratio created a
data base from which a few conclusions are drawn. First. the ef-
fect of inlet air temperature is slight. However. it is evident that
the flashback equivalence ratio decreases as the inlet air tempera
ture increases. Second. the premixer wall temperature and
premixer velocity are not governing variables over flashback. Third.
the parametric study using the average premixer velocity does not
support the steady-state velocity balance concept as the flashback
mechanism.
It appears that combustion instabilities (spontaneous pressure
oscillations) play an important role in the occurrence of flashback.
In the test conducted. the amplitude of pressure oscillations were
40

41
always observed to increase with the flickering penetration distance
and reach a maximum amplitude just prior to maintained flashback.
The estimated oscillatory pressure gradient Is many times greater
than the mean pressure gradient in the premixer. A theoretical
analysis shows that, in such a condition. the flow will reverse in the
premixer boundary layer. A simple test using ceramic tufts verified
that flow reversals did occur at the premixer exit during flickering.
This leads one to conclude that flashback occurs as the result of a
local flow reversal caused by combustion Instability.
With these thoughts in mind several recommendations can be
made to further the understanding of flashback. first. an efficient
experimental technique should be developed to determine the velocity
profile in the premixing tube near the wall both before and during
flashback. The intent would be to determine the location. magni
tude and duration of flow reversals. Second. pressure gradients for
both the oscillatory and non-oscillatory states should be measured.
Third. the criterion for recording data should be such that random
ness is reduced. Instead of recording conditions for flame stabiliza
tion at the 1/4 in. step. which was a marginal stabilizer. data
should be taken when the flame extended a certain distance into the
premixer. The randomness of the data may also be reduced by
plotting different parameters such as pressure oscillation amplitude
and frequency. Fourth. the analysis of flow reversal should be ex
tended to turbulent flow. last. but not least. an understanding of
the mechanism of combustion instability is needed. Since combus-
42
lion oscillation and flame flashback are coupled in prevaporized
premixed conbustors. prevention of flashback will be difficult without
the elimination or the control of combustion Instability.
Premixed combustor development should include observation.
high-speed cine records. and high frequency pressure records to
identify conditions or geometries which tend to cause unstable burn
ing likely to lead to flashback.
43
REFERENCES
1. Acharya. M. and Reynolds. W. C.. 1975. "Measurements and Predictions of a Fully Developed Turbulent Channel Flow with Imposed Controlled Oscillations." Tech. Report No. TF-8. Dept. Mech. Engr.. Stanford University.
2. Andrew. G. E .. and Bradley. D .. 1972. "Burning Velocity of Methane-Air Mixture. It Combustion and Flame. 19: 275-288.
3. Anonymous. 1980. "Procedure for the Continuous Sampling and Measurement of Gaseous Emissions from Aircraft Turbino Engines." SAE ARP 1256A.
4. Coats. C. M .. 1980. Comment on "Review of Flashback Reported in Prevaporizingl premixing Combustion." Combustiof} .anQ Flame. 37: 331-338.
5. Ganji. A. R .. and Sawyer. R. F .• 1980. Blowout and Flashback in a Two Dimensional lean Premixed Combustor. Department of Mechanical Engineering. University of Califor-nia. NASA Grant NSG-3028.
6. Keller. J. 0.. et. al. 1981. Mechanism of Instabilities in 1 urbulent Combustion Leading to Flashback. AIAA Journal. Vol. 20. No.2.
7. Landau. l. D. and Lifshitz. E. M., 1959, fluid Mechanics, Pergamon Press, p. 95.
8. Lee, S. T., and T'ien. J. S., 1982. A Numerical Analysis of Flame Flashback In a Premixed Laminar System. 'pombustion and fliun~ 48:273-285.
9. lewis, B., and von Elbe. G.. 1961. Combustion, Flames and Explosions Qf ~~, pp. 220-224, New York. Academic Press. Inc.
10. Plee, S.l.. and Mellor. A. M., 1978. Review of Flashback Reported in Prevaporizing/Premixing Combustors. 'pombustion .and Flame, 32:193-203.

44
11. Plee. S. l., and Mellor. A. M.. 1980. Reply to Comments by C. M. Coats on "Review of flashback Reported in Prevaporizing/Premixing Combustors." Combustors S!.!lQ Flame. 3?: 335-336 ..
12. Proctor. M. P. , Thesis. Dept. University.
1984. "Combustor Flame Flashback." M. S. Mech. & Aero. Engr.. Case Western Reserve
13. Propulsion Chemistry Division, Barnett. H. C. and Hibbard. R. R. editors. 1959. "Basic Considerations in the Combus-tion of Hydrocarbon Fuels with Air." NACA Report 1300.
14. Putnam. A. A .. and Jensen. R. A.. 1949. Application of Dimensionless Numbers to Flash-Back and Other Combustion Phenomena. Jhird Symposium .Q!l Combustion. flame and Explosion Phenomeng. pp. 89-98. Baltimore. Maryland, The Williams and Wilkins Company.
15. Reshotko. E.. 1984. Private communication',
16. Tu. S.W. and Ramaprfan. B.R., 1983. "Quasi-steady Modeling of Periodic Turbulent Pipe Flows," IIHR-TC-1, Iowa Institute of Hydraulic Research. The University of Iowa.

TAANSITtON SECTION FROM PREHEA TER
IGNITEII\ CONICAL 1'1.7 PA£MIUA WAll \\ ~ HEATING AIR t
Figure la. Combustor test section.
WINDOW FRAME CO-84~I .. q7
~ \J1

Propane Injector
'\, \ \
~ ~o
t Combustion
Air
Wall heating air in Wall heating air out
Al • 01 +0 0 q 0 0 0 0 0 10
° 1'4 r4 :i--:;----------------------;-----;-~O LJ L _________ J l~ o ~-i------ - ------- --;--;
.J ______________ J.. _J
, t
1~"
-*- Combustor 4"
o
Premixer 1" /Backward facing step I k .,/ (dump plane)
o o
-~--------.--- -----!.."J .., o 0IT;----- -------:-~ ~ 10~Jf - - - - - 8- ~-r 25~"- n._ . - I! t I --1 C r--+-O --- ----:iiIot _____________________ _
1.-.--------01 0 0 0 0 0 0 0 0 c
I A-J
(see figure lc)
Figure lb. Sideview of combustor test section.
~ 0\

47
SECTION A-A
1/16 IN. GASKETS
QUARTZ WINDOW
1/4 IN. STEP
Figure Ie. Section view of test section. (looking downstream) See figure lb.

48
c: o
+-> u Q) If)
+-> If) Q)
+-> So
+-> If)
::::s ..0 E o u
4-o
...c: Cl. ItS SO')
o +-> o
...c: 0..
N
Q)
S::::s 0)
lL.

c:::t c:::t
0
c:::: ..... N o o
49
.,... Ll"J ttlM +-,0 VI •
• 0 C . ...
ow .Q . :;:,
c::::+-' .,...
s... 0 +-' U W
.f""')
c:::: ..... ,..... W :;:,
I..i...
M

50
Figure 4. Test section with 6in. round window.
t 3
i
-
0 0 0
-0-- -0
0 0 0
'--
~1.!.-"'1- ~ 1-1.!.- ~f-2 4 4 4
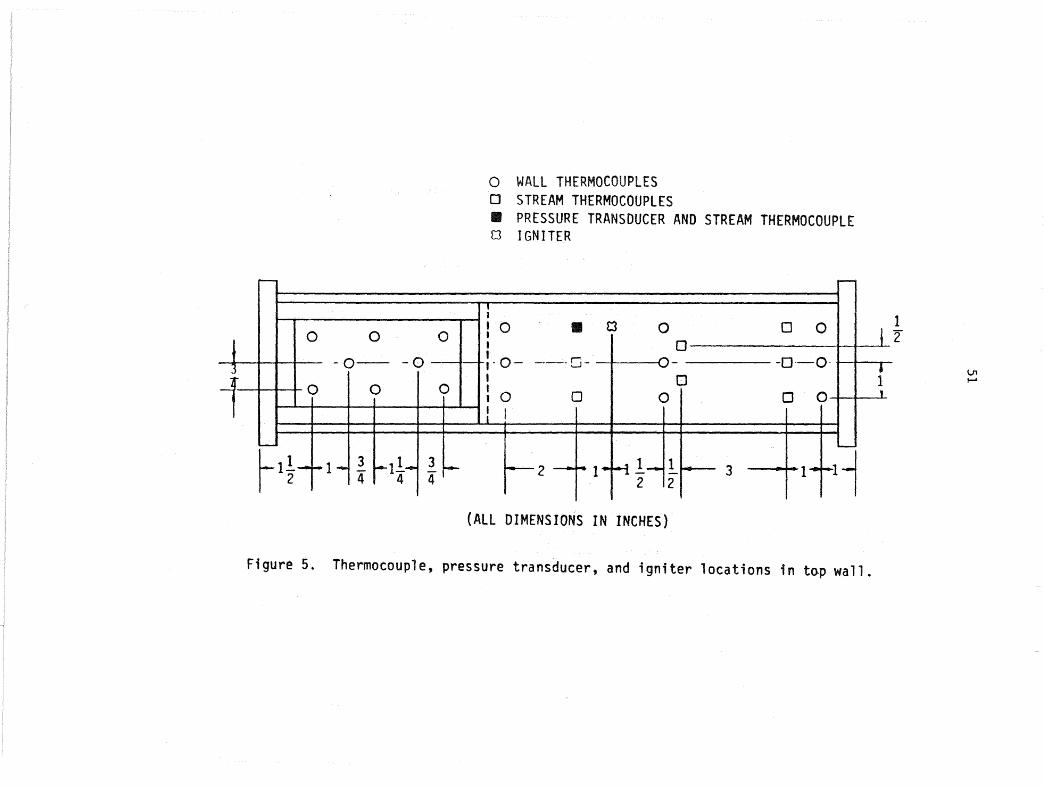
o WALL THERMOCOUPLES o STREAM THERMOCOUPLES • PRESSURE TRANSDUCER AND STREAM THERMOCOUPLE o IGNITER
~
: '0 , • 0 0 0 0 I 0 , ,- 0- -----0-----0- -0--0-
• 0 :0 0 0 0 0 : I
'--
r---2 - f4 1"'-11.- !.. ---- 3 I 2 2 1--1l
(ALL DIMENSIONS IN INCHES)
Figure 5. Thermocouple, pressure transducer, and igniter locations in to-P wall.
, , 1 ,
1 2"
\J1 ~

r--
"--
0 0
0
0 0
: 0 '0 I
I
0 :0 I
0 I ,0 !
o WALL THERMOCOUPLES o STREAM THERMOCOUPLES () GAS ANALYSIS PROBE
0
0
0
(OIMENSIONS SAME AS FIGURE 5.)
0
0
0
Figure 6. Thermocouple and gas analyzer locations in bottom wall.
0
0
0
r--
'"-
V1 N

AIR FLOW
1
pressure transducer
SECTION A
Fi gure 7. I et
INJECTOR
Cl
Ii II b"'l
oTHERMOCOUPLE BEAD PT-PRESSURE TAP
SECTION B-B
DIMENSIONS IN INCHES)
e and pressure tap locations in transition section.
V'I W

54
(a)
(b)
(c)
(d)
(e)
Figure 8. Different stages of burning. (a) and (b), lean flames, equivalence ratio, 0.41; (c) recirculation zones formed behind step, equivalence ratio, 0.44; (d) flame began flickering, equivalence ratio, 0.56; (e) maintained flashback, equivalence ratio, 0.60. Inlet air temperature, 850K; premixer wall temperature, 750K; average premixer velocity, 70 ft/s; fuel injector 8 in. upstream of step.

55
DUMP PLANE
___ I
~6in.~
1/4 in. STEP
Figure 9. Flame stabilized at 0.25 in. step in premixer. Inlet air temperature, 850K; premixer wall temperature, 800K; average premixer velocity, 111 ft/s; equivalence ratio, 0.56.

56
(a) (b)
(c) (d)
(e) (f)
Figure 10. Photographic sequence of flashback filmed through 6in. round window at dump plane. Flow is from right to left; time interval, 2.5 ms.

57
(g) (h)
(i ) (j)
(k) (1 )
Figure 10. Concluded. Inlet air temperature, 830 K; premixer wall temperature, 750 K; initial premixer velocity, 86 ft/s. Maintained flashback induced at premixer velocity, 76 ft/s; equivalence ratio, 0.48.

TOP 4.
T inlet Twall V • ~remlxer o 820 K 875 K 5 ft/s
3. Or \ I o 840 K 760 K 75 ft/s 0
\ I V) w :::t: U Z ~
.. 2.0 a: C> ~
I-~
V)
C> 0..
W \ I V1 CP
co l. C> ex: 0..
BOTTOM o.d ' IT C 0.8 0.9 1.0 1.1 1.2
EQUIVALENCE RATIO (C-BAL)/EQUIVAlENCE RATIO (FLOW)
Figure 11. Gas emissions profile; equivalence ratio, 0.36-0.38.

.8
.7
0 -...... e:( 0::
LIJ .6 u z: LIJ ...J c::c: :::--:::> 0-LIJ .5
59
Premixing tube velocity
o 40 ft/s
FLASHBACK o 50 ft/s o 60 ft/s
0
0 D
0 ~ 0 D
. 0 0 0 0
8 t 0
0 ,e
D
0 0 D cO 0 , @ D D
D D
0 0
0 0 0
.... ~ 00 NO FLASHBACK
~ 0
600 650 700 750 BOO B50
INLET AIR TEMPERATURE, K
Figure 12. Inlet air temperature effect on maintained flashback boundary. Premixer wall temperature, 700K; fuel injector Bin. upstream of step.

0 ..... .... c::( 0::
L&J U ::z: L&J ...J c::( > ..... => 0-L&J
60
Premi xer wa 11 temperature
0 450 K .9 0 500 K
¢ 550 K .6. 600 l< v 650 K
FLASHBACK C7 700 K
.B 0
• 4:t.
U 17 0 .to 0 4:t.D¢
.7 17~ 0 4:t. 0
17
"t:r 0 .to • "'CI' & 0 "'CI' 0
4:t. 0 17 t-~ "t:r 0 4:t.
~o ¢ 17
"t:r "t:r17
"t:r
.6 4:t.
NO FLASHBACK
.51 30 40 50 60 70
AVERAGE PREMIXER VELOCITY, FT/S
Figure 13. Effect of average premixer velocity and wall temperature on maintained flaskback boundary. Inlet air temperature, 600K; fuel injector Bin. upstream of step.

o -I-c::c: c:: LU u z: LU ..J c::c: > -:::> 0-LU
61
0 Flickering .8 0 Maintained
flashback
Maintained flashback
.7 f D
D c-
.6
Flickering 0
.S t 0
0 .4
• 3 l..l """'-_---l, ___ ..1..., __ --.,.;!L--__ ....l.-__ --L.. __ -.l
30 40 SO 60 70 80 90
AVERAGE PREMIXER VELOCITY, FT/S
Figure 14. The difference between flickering and maintained flashback. Fuel injector 2Siin. upstream of step; inlet air temperature, 7S0K; premixer wall temperature, 700K.

.8
.7
0 ..... t-<C 0:::
w .6 u z w -l ct: > ..... =:l 0' .5 w
0
::I 30 40
Figure 15.
62
0
o Flickering o Ma i nta ined
flashback
o
0 0
0 0 0
0 0
0 0
~ OD
0
I I I I I
50 60 70 80 90 AVERAGE PREMIXER VELOCITY, FT/S
The difference between flickering and main-tained flashback. Fuel injector 251in. up-stream of step; inlet air temperature, 700K; premix~r wall temperature, 700K.

.. L&J a::: :::> -V') V') V) 0.. LLI a::: 0.. o
FLAME IN
PREMIXER
~ ..
JUST BEFORE
FLASHBACK
T"1''Dl7li¥£1iJf¥EIill!._ - II,,1i ~3
~ >~ >4> >~ .. 3 2 1
4>. 2
AI ~
~1 TIME
O.ls
Figure 16. Typical effect of equiva·lence ratio on combustor pressure oscillations.
'" w

-V') 0.. .. LaJ C ::::> .... -...J 0.. :E: c(
z 0 -.... c( --J ...J -u V')
0
0.8
I FB I
0.6 1 /y~?
0.4
0.2
0.0
0 80 ft/s 0 70 ft/s 0 50 ft/s 6 40 ft/s FB Maintained Flashback Occurred
0.3 0.4 0.5
EQUIVALENCE RATIO
Figure 17. Effect of equivalence ratio on pressure oscillation amplitude at several premixer velocities. Inlet air temperature, 650 K; premixer wall temperature, 750 K; fuel injector 8 in. upstream of the step.
0.6
'" ~

:>.. (,)
~ <1) ;j. t:r <1)-~ (,) ~ <1)
Ul ~'-o <1)
-r-! .-I +J (,) ~ :>..
.-I (,)
.-I -r-! '-' (,) Ul
0
100
90
80
70 r- r- t- _/ 70
40 ft/s 60 ft/s
~ )o..J IV
60 60
/ 50 L 50
40 I r 40
.4 .5 .6 .3 .4 .5 .3 .4 .5 .4
Equivalence Ratio
Fig. 18. Effect of premixer velocity and equivalence ratio on combustor
pressure oscillation frequency while flame on step_ Inlet air
temperature, 650K; premixer wall temperature, 750K.
'" V1
.5 .6 .7

o
o
o
o
66
:1 Hffil!ru rnmmm 1111 :fJfl Ii I~ !I!l11mtWUd 1l-tl4Ii~t; l.nlOttHn Hi l~ I
INLET PRESSURE±Htl
COMBUSTOR PRESSURE It
i! f~ 0.4 psi ~ 15 ms
ItffRf
~ • (a) Equivalence ratio. 0.398; flame on step.
(behind dump plane)
E1 PRESSURE
COMBUSTOR PRESSURE
.4 psi 15 ms
tb) Equivalence ratio, 0.426; flame flickering.
Figure 19. Inlet and combustor pressure traces at inlet air temperature, 700K; premixer wall temperature, 720K; average premixer velocity, 45 ft/s; fuel injector 8;n. upstream of step; pressure taps 43.75;n. apart.

o
o
67
(c) Equivalence ratio, 0.506; flame flickering.
(d) Equivalence ratio t 0.74; flame stabilized in premixer.
figure 19. Concluded.

o
o
68
I; :: . ::jj':m~! :;~li!!II!m ;11 :t r!±!:fl I-t 11 ihl j I i ;'!ll: ill I ii i i II! 111: !: : ~I
: iiH i ' · [.trn i ill i i1i I iJ nt I fill
INLET PRESSURE t:i ~ !~
:
Ii ,:
Ii' I ~ ! r ii
;
COMBUSTOR PRESSURE I; . til !til! !l I: p~ n j:
.. . .
I:: ; It:!j'i :
i: I ~ [Iii Ii ~~ . ~ I ~ 11fT ,1-1
;
i: bi 15 ms !i ........
(a) Equivalence ratio, 0.373; lean flame in combustor, not at step.
(b) Equivalence ratio, 0.387; lean flame at step.
Figure 20. Inlet and combustor pressure traces at inlet air temperature, 715K; premixer wall temperature, 700K; average premixer velocity, 60 ft/s; fuel injector Sin. upstream of step; pressure taps 43.75in. apart.

o
o
69
(c) Equivalence ratio, 0.415; flame flickering.
(d) Equivalence ratio, 0.480; flame flickering.
figure 20. Continued.

o
o
o
o
70
(e) Equivalence ratio, 0.567; flame flickering.
(f) Equivalence ratio, 0.637; momentary flashback.
Figure 20. Continued

71
(g) Equivalence ratio, 0.695; momentary flashback.
Figure 20. Concluded.

72
( ! I I I I I I I I I It/UILI
U c::;> H/2
--. -+-y
L ~ H/2
717 7 )7 / I /=;r; I I ) X I I
v = Kinematic Viscosity of Air
~ = Oscillation Frequency in Radian/sec
Figure 21. Coordinates for the Per~odic Flow Analysis in the Premixing Channel

73
100r---------------------~--------~
10
1 .3 1 3 10 30
H/2S
Figure 22. Critical Pressure Gradients Ratio for Flow Reversal vs. Ratio of Channel Half-height to Oscillation Characteristic Depth

2.0
y
s
1.0
I
-.1 o
/ l
I
/ 'I
I
.1
/ /
74
/ wt = 1801'
/ /
I
/
/ /
I I
'/
/ /
/
/ /
/ /
/ 135 0
/
H/2 <5 = 17.3
.2 .3 .4
Figure 23. Near-Wall Velocity Profiles for rp = 50

/ 2700
/
/ I
I I ,
-.3 -.2
/ I
2250 1/
/ I
/
I 2.0
-.1
y/S
a
75
/ /
/ /
/
/
I /
/1800
/
.1 .2 .3 U/UM
I I
/ /
/
./ ./
/
/ /
1350
/ /
H/2S =17.3
.4 .5
Figure 24. Near-r!all Vefocity Profil es for r p = 100

76
225 0 9~o
2.0 / 180 0 135 0 v / 'I I
I I / I I / 360 0 I /
/ / 00 / /45 0
/ / / I / / / /
1.5 / I / I
/ / / I Y I / /
/ / 8 / / I '/
/ / Ii' r; / /
/ I 1.0 V
0.5
H/2~ = 17.3
o ~----~------~------------------~ o .1 .2 .3 .4 .5
Figure 25. Near-Wall Velocity Profiles for rp = 30

77
-.3 6 240 H/2b = 17.3
UREV 5 200
UM YREV UREV ~
--~
U:I -.2 4 160
/1 , (Ae) REV /' ~ DEGREE
3 /' 120 / I
/ /
-.1 2 I 80
I YREV I
-(5-
1 I 40 I
,
I 0 0 a
20 LiO 60 80 100 PRESSURE GRADIENTS RATIO Rp
Figure 26. Maximum Reversal Velocity (u e~/uw), Reversal Depth (y 10) and Duration of Flo~ ev rsal (~e ) as a FUht~ion of Pressure Ratio rp . rev

1. Report No. 2. Government Accession No. 3. Recipient's Catalog No.
NASA CR-174961 4. Title and Subtitle
Combustor Flame Flashback
7. Author(s)
Margaret P. Proctor and James S. T'ien
9. Performing Organization Name and Address
Case Western Reserve University Cleveland, Ohio
12. Sponsoring Agency Name and Address
U.S. Department of Energy Office of Vehicle and Engine R&D Washington, D.C. 20545
15. Supplementary Notes
5. Report Date
June 1985 6. Performing Organization Code
8. Performing Organization Report No.
10. Work Unit No.
11. Contract or Grant No.
NAG 3-290
13. Type of Report and Period Covered
Contractor Report
14. Sponsoring Agency sMteReport No.
DOE/NASA/0290-1
Final Report. Prepared under Interagency Agreement DE-AIOl-77CS51040. Project Manager, David Anderson, Altitude Wind Tunnel Project Office, NASA Lewis Research Center, Cleveland, Ohio 44135.
16. Abstract stainless steel, two-dlmenslonal (rectangular), center-dump, premlxed-prevaporlzed combustor with
quartz window sidewalls for vlsualaccess was designed, bui'lt, and used to study flashback. Test conditions were: inlet air temperature, 600 to 850 K; premixer wall temperature, 450 to 900 K; average premixer velocity, 40 to 80 ft/s; and equivalence ratio up to 0.8. A parametric study revealed that the flashback equivalence ratio decreased'slightly as the inlet air temperature increased. It also indicated that the average premixer velocity and premixer wall temperature were not governing parameters of flashback. The steady-state velocity balance concept as the flashback mechanism was not supported. From visual observation several stages of burning were identifled. High speed photography verified upstream flame propagation with the leading edge of the flame front near the premixer wall. Combustion instabilities (spontaneous pressure oscillations> were discovered during combustion at the dump plane and during flashback. The pressure oscillation fre-quency ranged from 40 to 80 Hz. The ;:.'""",,1_ .&. .... ~ ..... L amplitude (up to 1.4 psi) increased as the fuel/air equivalence ratlo was increased attaining a maximum value just before flashback. The amplitude suddenly decreased when the flame stabilized 1n the premlxer. The pressure oscillations were large enough to cause a local flow reversal. A s1rl'~l.e test using ceramic fiber tufts indicated flow reversals existed at the premixer exit during flickering. It is suspected that flashback occurs through the premixer wall boundary layer flow reversal caused by combustlon instability. A theoretical analysis of periodic flow in the premixing channel has been made. The theory supports the flow reversal mechanism. The question of why combustion instability occurs remains unclear. Until a more fundamental understanding is achieved on the mechanism of combustion oscillation, flame flashback is likely to be a potential problem with the premixed-prevaporized combustors.
17. Key Words (Suggested ,by Author(s))
Combustion; Premixed flames; Flashback
18. Distribution Statement
Unclassified - unlimited STAR Category 44 DOE Category UC-96
19. Security Classlf. (of this report)
Unclassified 20. Security Classif. (of this page)
Unclassified 21. No. of pages
80
*For sale by the National Technical Information Service, Springfield, Virginia 22161
22. Price"
A05

End of Document