comments on by judea pearl (ucla). notation 1990’s artificial intelligence hoover
TRANSCRIPT

COMMENTS ON
By Judea Pearl (UCLA)
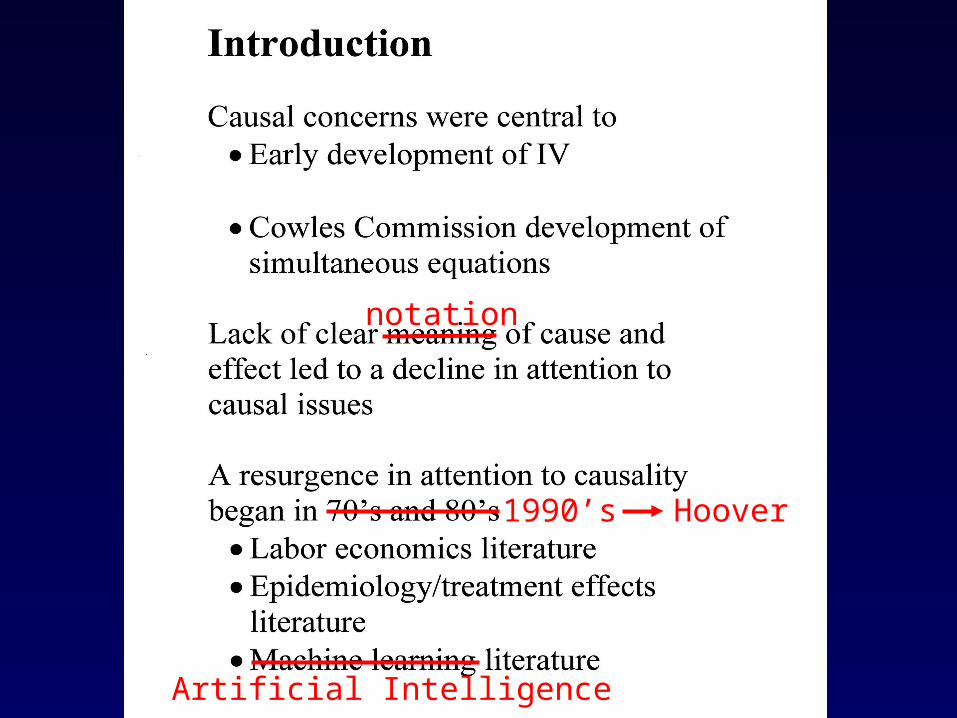
notation
1990’s
Artificial Intelligence
Hoover

Hoover slideHoover slide
From Hoover (2004) “Lost Causes”

notation
1990’s
Artificial Intelligence

additional?^
more?
^
Already unified

additional?^
additional?^
Already permitted
Commendable!
(Statistical)
P. 215


additional?^
additional?^
Already permitted
Commendable!
(Statistical)

WHITE & CHALAKPICTURE OF UNIFICATION
1950 - 2005
SEMNeyman-RubinDAGs
Settable System2006
MY PICTURE OF UNIFICATION1920 - 1990
Informal SEMNeyman-RubinInformal Diagrams
Formal SEM1990 - 2000 2006 (W&C)
Complete Neyman-Rubin
Graphs
DAGs
Multi-agent
extension


CAUSAL ANALYSIS WITHOUT TEARS

TRADITIONAL STATISTICALINFERENCE PARADIGM
Data
Inference
Q(P)(Aspects of P)
PJoint
Distribution
e.g.,Infer whether customers who bought product Awould also buy product B.Q = P(B|A)
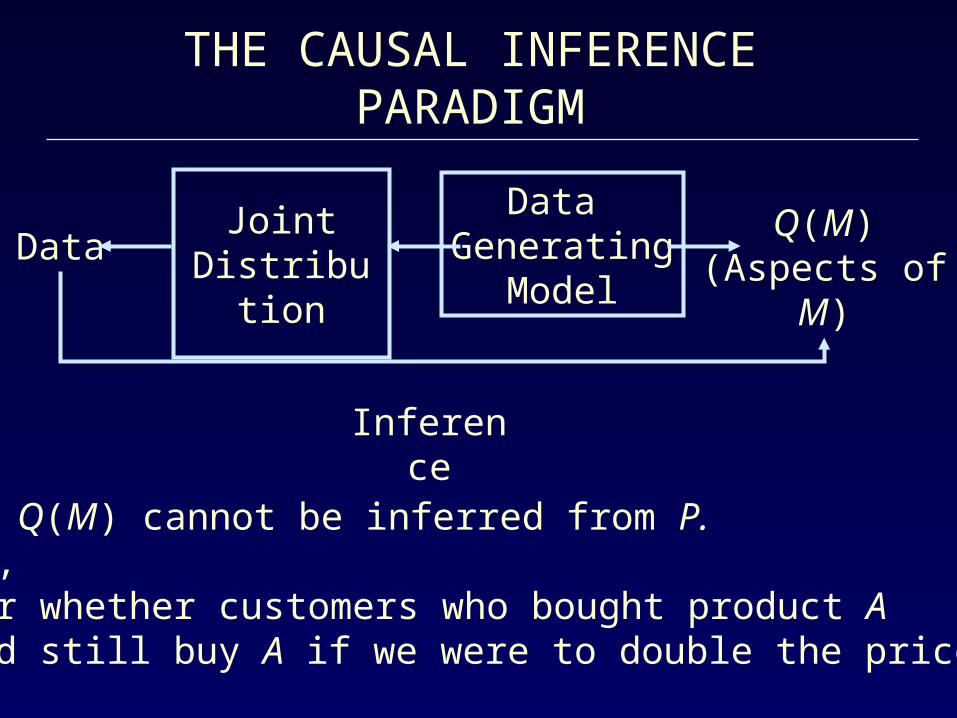
THE CAUSAL INFERENCEPARADIGM
Data
Inference
Q(M)(Aspects of M)
Data Generating
Model
Some Q(M) cannot be inferred from P.e.g.,Infer whether customers who bought product Awould still buy A if we were to double the price.
JointDistribution

FROM STATISTICAL TO CAUSAL ANALYSIS:1. THE DIFFERENCES
Datajoint
distribution
inferencesfrom passiveobservations
Probability and statistics deal with static relations
ProbabilityStatistics
CausalModel
Data
Causalassumptions
1. Effects of interventions
2. Causes of effects
3. Explanations
Causal analysis deals with changes (dynamics)
Experiments

Z
YX
INPUT OUTPUT
FAMILIAR CAUSAL MODELORACLE FOR MANIPILATION

WHY CAUSALITY NEEDS SPECIAL MATHEMATICS
Y = 2XX = 1
X = 1 Y = 2
Process information
Had X been 3, Y would be 6.If we raise X to 3, Y would be 6.Must “wipe out” X = 1.
Static information
SEM Equations are Non-algebraic:

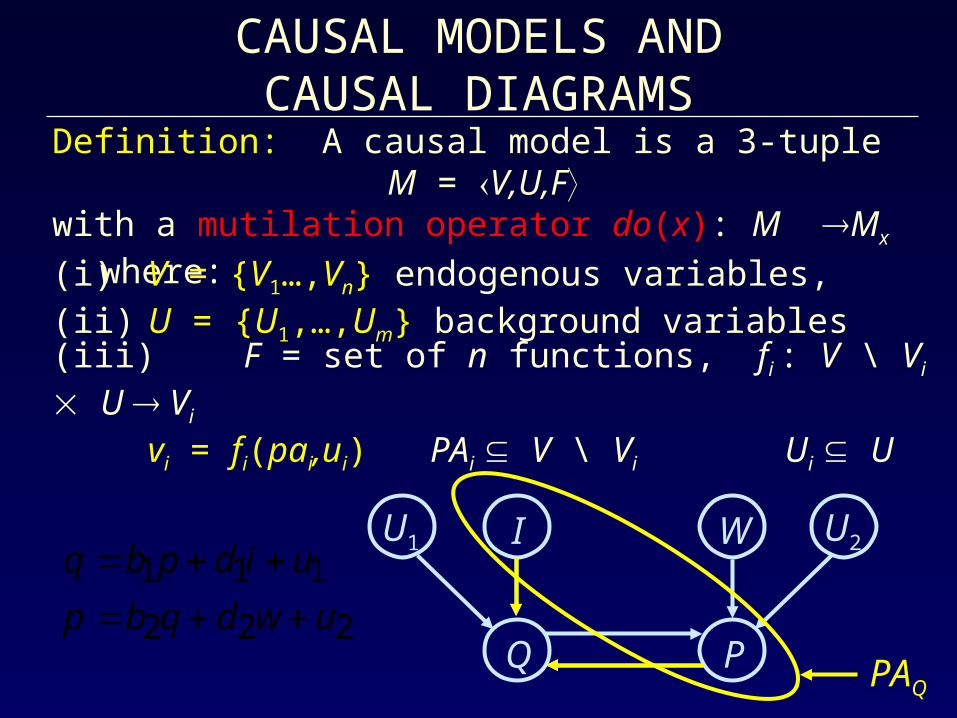
CAUSAL MODELS ANDCAUSAL DIAGRAMS
Definition: A causal model is a 3-tupleM = V,U,F
with a mutilation operator do(x): M Mx where:
(i) V = {V1…,Vn} endogenous variables,(ii) U = {U1,…,Um} background variables(iii) F = set of n functions, fi : V \ Vi U Vi
vi = fi(pai,ui) PAi V \ Vi Ui U•
CAUSAL MODELS ANDCAUSAL DIAGRAMS
Definition: A causal model is a 3-tupleM = V,U,F
with a mutilation operator do(x): M Mx where:
(i) V = {V1…,Vn} endogenous variables,(ii) U = {U1,…,Um} background variables(iii) F = set of n functions, fi : V \ Vi U Vi
vi = fi(pai,ui) PAi V \ Vi Ui U
U1 U2I W
Q P PAQ 222
111uwdqbp
uidpbq
++=++=

Definition: A causal model is a 3-tupleM = V,U,F
with a mutilation operator do(x): M Mx where:
(i) V = {V1…,Vn} endogenous variables,(ii) U = {U1,…,Um} background variables(iii) F = set of n functions, fi : V \ Vi U Vi
vi = fi(pai,ui) PAi V \ Vi Ui U(iv) Mx= U,V,Fx, X V, x X
where Fx = {fi: Vi X } {X = x}(Replace all functions fi corresponding to X with the
constant functions X=x)•
CAUSAL MODELS ANDMUTILATION

CAUSAL MODELS ANDMUTILATION
Definition: A causal model is a 3-tupleM = V,U,F
with a mutilation operator do(x): M Mx where:
(i) V = {V1…,Vn} endogenous variables,(ii) U = {U1,…,Um} background variables(iii) F = set of n functions, fi : V \ Vi U Vi
vi = fi(pai,ui) PAi V \ Vi Ui U
U1 U2I W
Q P 222
111uwdqbp
uidpbq
++=++=
(iv)
(attributes)

CAUSAL MODELS ANDMUTILATION
Definition: A causal model is a 3-tupleM = V,U,F
with a mutilation operator do(x): M Mx where:
(i) V = {V1…,Vn} endogenous variables,(ii) U = {U1,…,Um} background variables(iii) F = set of n functions, fi : V \ Vi U Vi
vi = fi(pai,ui) PAi V \ Vi Ui U(iv)
U1 U2I W
Q P P = p0
0
222
111
pp
uwdqbp
uidpbq
=++=
++=
Mp
(attributes)

Definition: A causal model is a 3-tupleM = V,U,F
with a mutilation operator do(x): M Mx where:
(i) V = {V1…,Vn} endogenous variables,(ii) U = {U1,…,Um} background variables(iii) F = set of n functions, fi : V \ Vi U Vi
vi = fi(pai,ui) PAi V \ Vi Ui U(iv) Mx= U,V,Fx, X V, x X
where Fx = {fi: Vi X } {X = x}(Replace all functions fi corresponding to X with the
constant functions X=x)Definition (Probabilistic Causal Model): M, P(u)P(u) is a probability assignment to the variables in U.
PROBABILISTIC CAUSAL MODELS
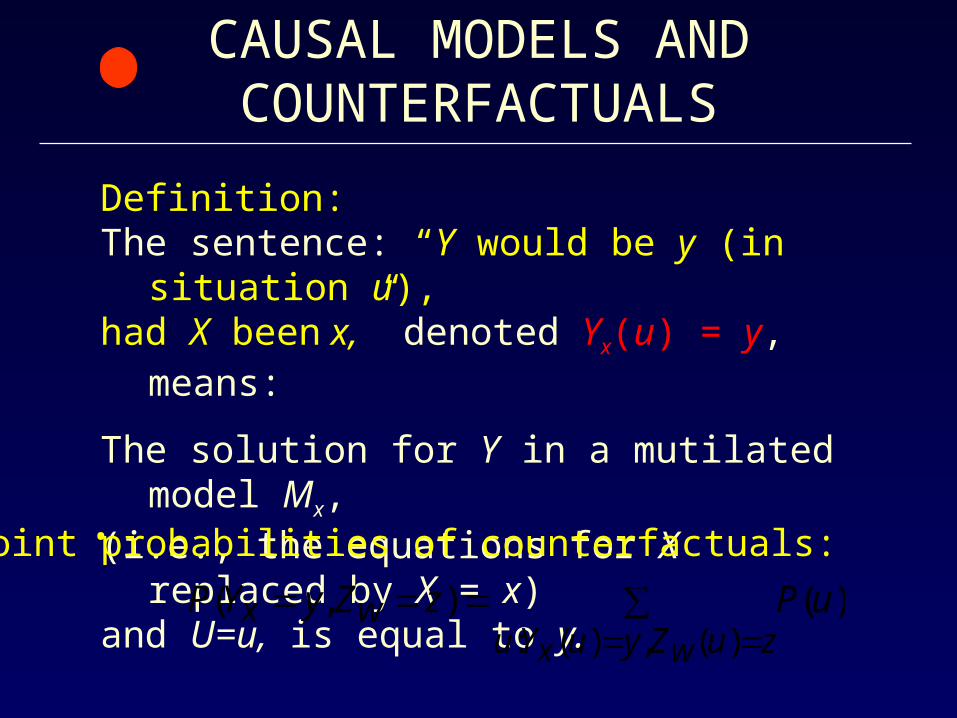
CAUSAL MODELS AND COUNTERFACTUALS
Definition: The sentence: “Y would be y (in situation u), had X been x,” denoted Yx(u) = y, means:
The solution for Y in a mutilated model Mx, (i.e., the equations for X replaced by X = x) and U=u, is equal to y.
)(),()(,)(:
uPzZyYPzuZyuYu
wxwx
∑=====
Joint probabilities of counterfactuals:•

GRAPHICAL – COUNTERFACTUALS SYMBIOSIS
Every causal model implies constraints on counterfactuals
e.g.,
XZY
uYuY
yx
xzx
|
)()(,
⊥⊥
=
consistent, and readable from the graph.
Every theorem in SEM is a theorem in N-R, and conversely.

GRAPHICAL TEST OF IDENTIFICATION
The causal effect of X on Y,
is identifiable in G if there is a set Z ofvariables such that Z d-separates X from Y in Gx.
Z6
Z3
Z2
Z5
Z1
X Y
Z4
Z6
Z3
Z2
Z5
Z1
X Y
Z4
Z
Moreover, P(y | do(x)) = P(y | x,z) P(z)(“adjusting” for Z) z
Gx G
))(())(do|( yuYPxyP x ==

RULES OF CAUSAL CALCULUSRULES OF CAUSAL CALCULUS
Rule 1: Ignoring observations P(y | do{x}, z, w) = P(y | do{x}, w)
Rule 2: Action/observation exchange P(y | do{x}, do{z}, w) = P(y | do{x},z,w)
Rule 3: Ignoring actions P(y | do{x}, do{z}, w) = P(y | do{x}, w)
XG Z|X,WY )( ⊥⊥ if
Z(W)XGZ|X,WY )⊥⊥( if
ZXGZ|X,WY )( if ⊥⊥

RECENT RESULTS ON IDENTIFICATION
Theorem (Tian 2002):
We can identify P(v | do{x}) (x a singleton)
if and only if there is no child Z of X connected
to X by a bi-directed path.
X
Z Z
Z
k
1

• do-calculus is complete• A complete graphical criterion available
for identifying causal effects of any set on any set
• References: Shpitser and Pearl 2006 (AAAI, UAI)
RECENT RESULTS ON IDENTIFICATION (Cont.)
CONCLUSIONS
Structural-model semantics enriched with
logic + graphs leads to formal interpretation
and practical assessments of wide variety
of (if not all) causal and counterfactual
relationships.
causal effects, responsibility,
direct and indirect effects
Multi-agent systems?
e.g.,

MULTI-AGENT GRAPHS
Agent 1 Agent 2
Y1 Z1
X1
ux1
uy1uz1
Y2 Z2
X2
ux2
uy2uz2

WHITE & CHALAKPICTURE OF UNIFICATION
1950 - 2005
SEMNeyman-RubinDAGs
Settable System2006
MY PICTURE OF UNIFICATION1920 - 1990
Informal SEMNeyman-RubinInformal Diagrams
Formal SEM1990 - 2000 2006 (W&C)
Complete Neyman-Rubin
Graphs
DAGs
Multi-agent
extension