comments on “price stability and japanese monetary policy”
TRANSCRIPT

IMES DISCUSSION PAPER SERIES
INSTITUTE FOR MONETARY AND ECONOMIC STUDIES
BANK OF JAPAN
C.P.O BOX 203 TOKYO
100-8630 JAPAN
You can download this and other papers at the IMES Web site:
http://www.imes.boj.or.jp
Do not reprint or reproduce without permission.
Comments on “Price Stability and Japanese Monetary Policy”
Hiroshi Fujiki, Kunio Okina, and Shigenori Shiratsuka
Discussion Paper No. 2004-E-7

NOTE: IMES Discussion Paper Series is circulated in
order to stimulate discussion and comments. Views
expressed in Discussion Paper Series are those of
authors and do not necessarily reflect those of
the Bank of Japan or the Institute for Monetary
and Economic Studies.

IMES Discussion Paper Series 2004-E-7June 2004
Comments on“Price Stability and Japanese Monetary Policy”
Hiroshi Fujiki,* Kunio Okina,** and Shigenori Shiratsuka***
AbstractThis commentary summarizes the authors’ main points of agreement anddisagreement with respect to the proposal written by Dr. Hetzel. The authorsagree with Dr. Hetzel’s proposal on four points: after a central bank has loweredthe interest rate to zero, (i) a central bank is not in fact powerless to stop deflation,(ii) it does not make sense to focus on the quantity of the monetary base per se,(iii) it is important to influence market expectations if monetary policy is to beeffective, and (iv) central bank solvency holds some importance. The authorsdisagree with Dr. Hetzel’s proposal on three points: (i) transmission channels ofquantitative easing, (ii) potential costs and benefits of his proposal, and (iii) thetiming of introduction of an explicit nominal anchor.
Key words: quantitative easing, deflation.JEL classification: E51, E58, E43
* Deputy Director and Senior Economist, Research Division I, Institute for Monetary andEconomic Studies, Bank of Japan (E-Mail: [email protected])** Director-General, Institute for Monetary and Economic Studies, Bank of Japan (E-Mail: [email protected])*** Deputy Director and Senior Economist, Research Division I, Institute for Monetary andEconomic Studies, Bank of Japan (E-mail: [email protected])
The authors thank Hiroyuki Oi for his research assistance. The views expressed in the paperare those of the authors and do not necessarily reflect those of the Bank of Japan or theInstitute for Monetary and Economic Studies.

1
I. Introduction
The Institute for Monetary and Economic Studies invited Dr. Hetzel as a visiting scholar
from September to November 2003. The purpose of this commentary is to confirm
points of agreement, as well as our reservations, with respect to the contents of Dr.
Hetzel’s proposal.
II. Points of Agreement
We will begin by summarizing some of the major points on which we agree with Dr.
Hetzel.
First, from the point of view of monetarism, Dr. Hetzel emphasizes that a central
bank is not powerless to stop deflation after the bank has lowered the interest rate to
zero. We agree. Indeed, the Bank of Japan (BOJ) has been making every effort to
stop deflation by providing ample liquidity and influencing market expectations.1 In
this sense, the BOJ’s view has nothing to do with what Dr. Hetzel calls the “liquidity
view,” that is, the view that “the central bank is impotent to end deflation after it has
lowered the interest rate to zero.”2
Second, we agree with Dr. Hetzel when he states that “at a near-zero call rate, for
banks, CABs and short-term liquid debt instruments like Treasury and Finance bills are
perfect substitutes.”3 Specifically, it does not make sense to focus on the quantity of
the monetary base per se apart from other financial assets that yield virtually zero
1 Governor Fukui argued that “even after short-term interest rates had reached the zero boundary,the Bank did not throw up its hands in defeat but rather continued to make efforts by providingample liquidity and ‘borrowing’ from the effects of future monetary easing.” See Fukui (2003).
2 See Hetzel (2004), p. 2.
3 See Hetzel (2004) p. 21.

2
interest rates.4
It should be noted, however, that the “meaninglessness of focusing on the quantity
of the monetary base itself under zero interest rates” does not necessarily mean that
“quantitative easing is meaningless.” Eggertsson and Woodford (2003), in their
suddenly classic work in the economics of monetary policy, argue that their famous
result, known as the “irrelevance proposition” applicable to open-market operations
involving a variety of assets that the central bank might acquire, holds under the
assumption that open-market operations do not change the expectations regarding the
future course of conduct of monetary or fiscal policy. Eggertsson and Woodford
(2003) then argue that open-market operations should be viewed as largely ineffective
to the extent that these operations fail to change expectations regarding future policy;
concluding that quantitative easing is not necessarily futile, and that the central bank’s
actions should be determined with a view to signaling the nature of its policy
commitments, and not for the purpose of creating some sort of “direct effects.”
Third, we share an understanding of the importance of credibility and expectations
in any effective monetary policy. In his concluding remarks, Dr. Hetzel refers to the
change in direction of U.S. monetary policy under the former FRB Chairman Paul
Volcker and emphasizes the importance of establishing the credibility of the central
bank. We fully agree with the importance of influencing market expectations,
especially under zero interest rates, as a central bank has no reliable policy instruments
other than its influence on market expectations. While Dr. Hetzel does not mention the
4 This also implies that it does not make sense to differentiate unsterilized intervention in foreignexchange markets from sterilized intervention under zero nominal interest rates. This is becauseunsterilized intervention simply corresponds to sterilized intervention coupled with the provision ofreserves through the purchase of short-term government securities, a move that in itself has noeffect.

3
irrelevance proposition of Eggertsson and Woodford (2003), we are sympathetic with
their argument.
Even when short-term interest rates have declined to virtually zero, a central bank
can produce further easing effects by a policy commitment.5 A central bank can
influence market expectations by making an explicit commitment to the length of time it
will hold short-term interest rates at virtually zero. If the bank succeeds in credibly
extending the duration of this commitment, it can then reduce long-term interest rates
and stabilize the yield curve as a whole.6
Fourth, to a certain extent we also share a common perception of the role of
central bank solvency. Dr. Hetzel argues that maintenance of solvency is an
institutional safeguard to protect the central bank’s independence, and that a central
bank needs this protection against political pressure to use its seigniorage revenues to
buy the debt of insolvent firms and banks. This argument echoes the view of board
member Ueda, who says “political-economic constraints in the real world may prevent
central banks from fulfilling their responsibility to maintain price stability, if the central
bank’s financial strength deteriorates substantially”7
5 See Reifschneider and Williams (2000), Jung, Teranishi, and Watanabe (2001), and Eggertssonand Woodford (2003) for detailed discussions on the policy commitment effect when a central bankfaces the zero bound of nominal interest rates.
6 We analyze the mechanism of the so-called “policy duration effect,” in Fujiki, Okina, andShiratsuka (2000), Fujiki and Shiratsuka (2002), and Okina and Shiratsuka (2004a).
7 See Ueda (2004). Ueda (2004) also sums up the experiences of insolvent central banks, andconcludes that the maintenance of a sound balance sheet is, in general, neither a necessary nor asufficient condition for the fulfillment of a central bank’s responsibilities, but that there have beencases in which an unhealthy balance sheet became a major obstacle to price stability. See alsoFukui (2003).

4
III. Some Reservations with Dr. Hetzel’s Arguments
Next we will discuss some reservations with Dr. Hetzel’s arguments. Based on the
quantity theory view, Dr. Hetzel proposes a quantitative strategy for stabilizing the price
level, a strategy that renders the monetary base dependent on nominal variables such as
money growth and nominal output. The Desk would exchange all short-term, liquid
assets in its portfolio for illiquid assets like 10-year JGBs. He further argues that only
then would open market purchases increase the ratio of liquid to illiquid assets in the
portfolio in the private sector. In line with this understanding, Dr. Hetzel interprets the
failure of a high number of CABs to stimulate money (M2+CDs) growth as a
consequence of policies that make the monetary base dependent on the demand for
excess reserves by banks, rather than on the behavior of a nominal variable such as
money supply growth, nominal output, or the price level. We believe that this is the
essence of his policy proposal. Our comments and reservations with respect to this
proposal are as follows.
A. Transmission channels of quantitative easing
First, our experience to date suggests that while such policy decisions might potentially
increase the size of the portfolios of economic agents, and might lead to a change in
their portfolios and ultimately stimulate economic activity, the possibility of such an
influence remains uncertain, and its stimulating effect on economic activity would be
quite modest, at best. Dr. Hetzel argues that the failure of a high number of CABs to
stimulate money (M2+CDs) growth is a consequence of policies that make the
monetary base dependent on the demand for excess reserves.
In contrast to Dr. Hetzel’s argument, we would conclude that the current
quantitative easing conducted by the BOJ should be understood mainly as a device to

5
signal the future course of monetary policy. Indeed, recent BOJ monetary policy has
been characterized by a heavy reliance on the policy duration effect. Under
quantitative monetary easing, the bank commits to providing ample liquidity, easily
exceeding the required reserve, until CPI inflation stabilizes at or above zero percent.
However, our experiences might suggest that the link between the increase in the
monetary base and general price levels under the quantitative easing framework might
not be as clear as many economists’ theoretical predictions before the introduction of
such a framework.8 In this context, we ought to try to gain a better understanding of
the transmission channels of the quantitative easing policy, based on data after 2001.
To examine the impact of policy changes on market expectations, we employ case
study analyses to detect the effect of changes in monetary policy in the short term,
following Okina and Shiratsuka (2004a). We focus on the short-term effects of four
increases in the target range of CABs beginning in the spring of 2003: April 30, May 20,
and October 10, 2003, as well as January 20, 2004.
Figure 1 plots four indicators, PD, R(PD), SL, and LFR, for the period from 20
days before to 40 days following each policy event.9 In each panel, a solid black line
8 For example, the increases in the target range of CABs on October 10, 2003 and January 20,2004, which were “apparently undertaken to emphasize the BOJ’s commitment to maintaining thepolicy of quantitative easing,” as Dr. Hetzel states in his paper. However, such increases seem tohave had no significant impact on market expectations regarding the future course of the economy.
9 The four indicators, which are derived from the estimation results for instantaneous forward ratecurves, extract market expectations for the duration of the policy commitment as well as the flatnessof the yield curve. PD, policy duration, corresponds to the length of the flattened shape in theshorter end of the forward rate curve, thus capturing the market expectation as to the length of timethe BOJ will continue to maintain a zero interest rate. R(PD), the estimated spot rate at PD, showsthe flatness of the forward rate curve in the shorter end, indicating the confidence of marketparticipants in the strength of BOJ’s commitment to a zero interest rate. SL is the maximum slopeof the forward rate curve in the second stage, upward-trending after PD, indicating marketexpectations as to how rapidly the economy will recover from zero interest rate conditions. LFR isthe long-term forward rate, and is viewed as a proxy for the sum of expected inflation and expected

6
shows the estimated parameters, while the solid grey lines show the upper and lower
boundaries of the respective confidence intervals, obtained by adding and subtracting
two times the standard errors of the estimated coefficients. The solid horizontal line
indicates estimates of each indicator on the date of the event. We can see little or no
evidence that policy changes produced any persistent impact on market expectations,
except for the event of May 20, 2003.
Figure 2 further plots four indicators over time since 1998, which includes the
periods of the above case studies. We see that the most significant changes in market
expectations since the spring of 2003 occurred in the summer between the second and
third cases in Figure 1. During this period, the forward rate curve shifts upward in the
medium-to-long term, as evidenced by increased SL and LFR, indicating brightening
market expectations for the long-term performance of the economy. At the same time,
PD shortens, partly because such positive expectations in turn shorten the expected
duration of the policy commitment to a zero rate or to quantitative monetary easing.
B. Cost-benefit comparison
Admittedly, Dr. Hetzel’s proposal to end deflation regardless of the magnitude of the
needed expansion in the monetary base should have a strong effect on market
expectations. However, in the current Japanese situation, which Dr. Hetzel describes
in footnote 1, noting that real GDP grew steadily in 2002 and 2003 at a rate of almost 3
percent, while the CPI remained basically stable in 2003, with a falling unemployment
rate, this kind of experiment ought to be compared closely with other policy options in
terms of feasibility and costs.
As for the costs, first we must address the significant issue of the decline in the
economic growth, or expected nominal economic growth. See the Appendix for details of theindicators of policy duration effects.

7
functioning of financial markets, especially the money market. The more the BOJ
proceeds with a policy of monetary easing to secure stability in the financial market, the
more demand for current account deposits will increase due to the impaired functioning
of the market. As a result, the BOJ will have to meet this demand for increased
liquidity in order to stabilize the market. This is the dilemma the BOJ currently
faces.10
In this context, it should be noted that the purchase of illiquid assets in an
environment of zero interest rates necessarily leads to fiscal consequences. Estimates
of potential costs and benefits of this option are required to maintain accountability to
taxpayers. Taxpayers should be able to compare various unorthodox policy options in
terms of the societal consequences, which are not addressed in Dr. Hetzel’s paper.11
C. Timing of introduction of explicit nominal anchor
Finally, as for the importance of a nominal anchor in monetary policy, Dr. Hetzel makes
an argument for price stability within his model of the quantity theory of money. A
simple model and a historical lesson drawn from the 1970s US FRB provide us with a
clear view of his position. We agree that the application of a nominal anchor to
achieve price stability is, in theory and in practice, a very important element of
monetary policy.
That being said, we must be very careful in the current environment in Japan. In
practice, the situation in this country is much more complicated than Dr. Hetzel argues.
10 See Fukui (2003).
11 In 2001, then Deputy Governor Yamaguchi argued that “The basic rule in a democratic societyis that fiscal policy using taxpayer’s money needs to be approved as part of a budget by a parliamentcomposed of members elected by the people. I am not worrying about inflation when deflation is aconcern, but claiming that a policy of purchasing various assets should be discussed publicly in thecontext of governance in a democratic society.” See Yamaguchi (2001).

8
For example, fluctuations in the GDP deflator (which Dr. Hetzel cites in his paper) and
in the CPI applied by many central banks (including the BOJ) display characteristics
unique to Japan (Figure 3), particularly since the mid-1990s.
More importantly, asset prices have continued to decline remarkably for a decade
after the bursting of the asset price bubble at the beginning of the 1990s, while
consumer prices have remained almost constant (Figure 4). Stock prices plunged in
the early 1990s and have since followed a downward trend, albeit with continual ups
and downs. Land prices started declining with a two-year lag relative to stock prices,
and have since continued to decline at an annual rate of around ten percent. Mild
deflation of less than one percent per annum, which naturally attracts public attention, is
deemed far less significant than asset price deflation. As a result, the relative price
system has dramatically changed in the context of extremely stable consumer prices
since the mid-1980s.12 Raising the rate of inflation of general prices by a couple of
percentage points would not mean much in terms of asset prices. In fact, it is the ratio
between asset and general prices that must be adjusted, as Ueda (2003) argues.
IV. Conclusion
We would like to conclude by emphasizing that we thoroughly enjoyed reading Dr.
Hetzel’s paper, and that we and the staff of the BOJ gained a great deal from our long
discussions with him during his stay in Japan. We hope that we will have the
opportunity for further discussions and even greater agreement in the future.
12 For details of the relative price change, see Okina and Shiratsuka (2004b).
9
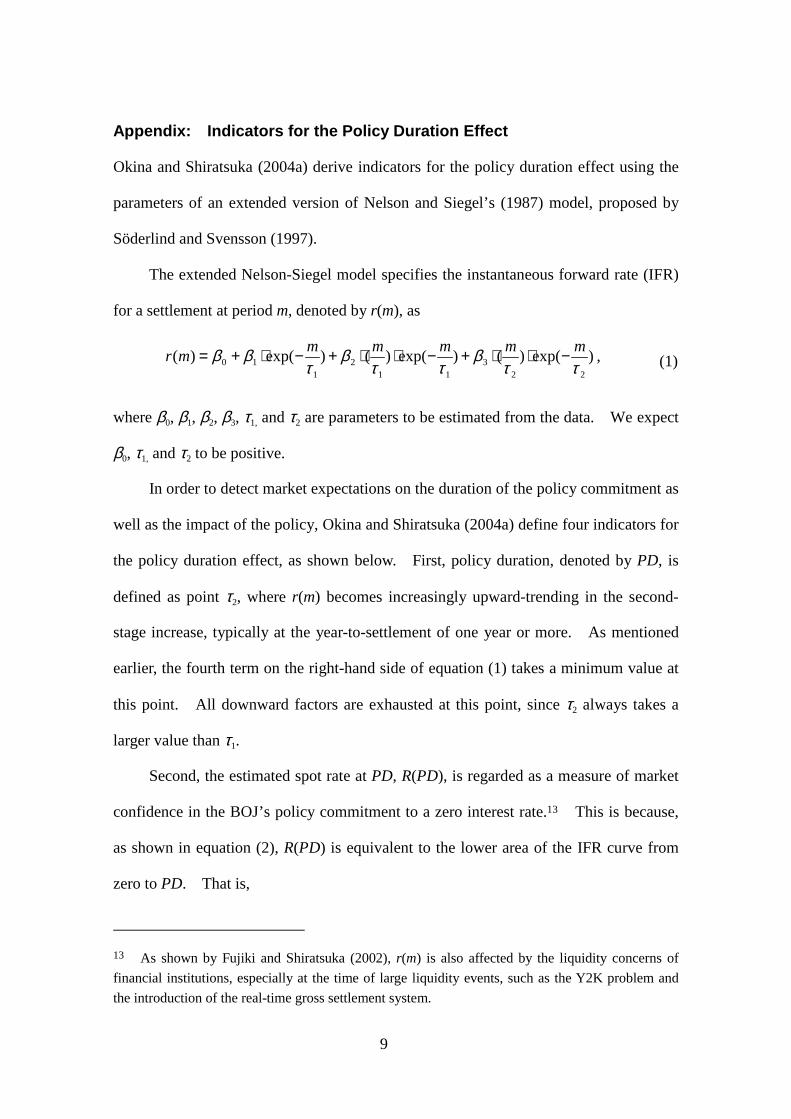
Appendix: Indicators for the Policy Duration Effect
Okina and Shiratsuka (2004a) derive indicators for the policy duration effect using the
parameters of an extended version of Nelson and Siegel’s (1987) model, proposed by
Söderlind and Svensson (1997).
The extended Nelson-Siegel model specifies the instantaneous forward rate (IFR)
for a settlement at period m, denoted by r(m), as
)exp()()exp()()exp()(22
311
21
10 ττβ
ττβ
τββ mmmmmmr −⋅⋅+−⋅⋅+−⋅+= , (1)
where β0, β1, β2, β3, τ1, and τ2 are parameters to be estimated from the data. We expect
β0, τ1, and τ2 to be positive.
In order to detect market expectations on the duration of the policy commitment as
well as the impact of the policy, Okina and Shiratsuka (2004a) define four indicators for
the policy duration effect, as shown below. First, policy duration, denoted by PD, is
defined as point τ2, where r(m) becomes increasingly upward-trending in the second-
stage increase, typically at the year-to-settlement of one year or more. As mentioned
earlier, the fourth term on the right-hand side of equation (1) takes a minimum value at
this point. All downward factors are exhausted at this point, since τ2 always takes a
larger value than τ1.
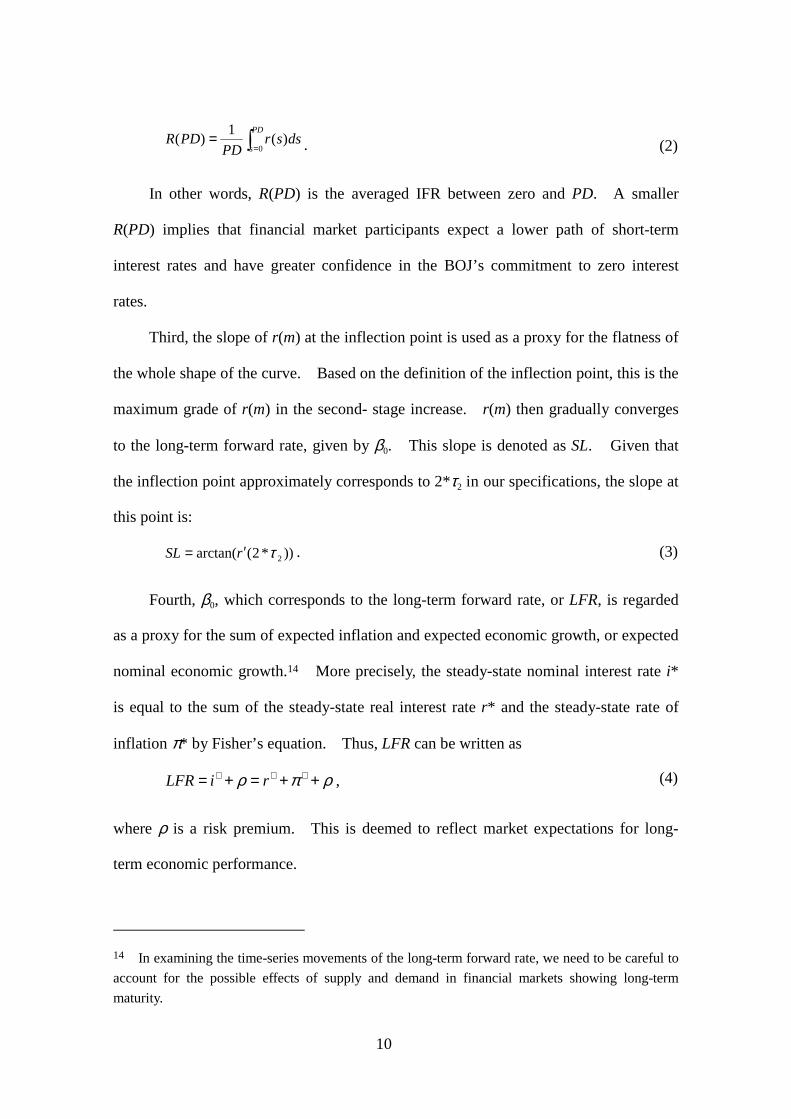
Second, the estimated spot rate at PD, R(PD), is regarded as a measure of market
confidence in the BOJ’s policy commitment to a zero interest rate.13 This is because,
as shown in equation (2), R(PD) is equivalent to the lower area of the IFR curve from
zero to PD. That is,
13 As shown by Fujiki and Shiratsuka (2002), r(m) is also affected by the liquidity concerns offinancial institutions, especially at the time of large liquidity events, such as the Y2K problem andthe introduction of the real-time gross settlement system.
10
� ==
PD
sdssr
PDPDR
0)(1)( . (2)
In other words, R(PD) is the averaged IFR between zero and PD. A smaller
R(PD) implies that financial market participants expect a lower path of short-term
interest rates and have greater confidence in the BOJ’s commitment to zero interest
rates.
Third, the slope of r(m) at the inflection point is used as a proxy for the flatness of
the whole shape of the curve. Based on the definition of the inflection point, this is the
maximum grade of r(m) in the second- stage increase. r(m) then gradually converges
to the long-term forward rate, given by β0. This slope is denoted as SL. Given that
the inflection point approximately corresponds to 2*τ2 in our specifications, the slope at
this point is:
))*2(arctan( 2τrSL ′= . (3)
Fourth, β0, which corresponds to the long-term forward rate, or LFR, is regarded
as a proxy for the sum of expected inflation and expected economic growth, or expected
nominal economic growth.14 More precisely, the steady-state nominal interest rate i*
is equal to the sum of the steady-state real interest rate r* and the steady-state rate of
inflation π* by Fisher’s equation. Thus, LFR can be written as
ρπρ ++=+= ∗∗∗ riLFR , (4)
where ρ is a risk premium. This is deemed to reflect market expectations for long-
term economic performance.
14 In examining the time-series movements of the long-term forward rate, we need to be careful toaccount for the possible effects of supply and demand in financial markets showing long-termmaturity.

11
References
Eggertsson, Gauti B., and Michael Woodford, “The Zero Interest-Rate Bound and
Optimal Monetary Policy,” Brookings Papers on Economic Activity, 1, 2003, pp.
139-211.
Fujiki, Hiroshi, Kunio Okina, and Shigenori Shiratsuka, “Monetary Policy under Zero
Interest Rate --- Viewpoints of Central Bank Economists ---,” Monetary and
Economic Studies, 19 (1), Institute for Monetary and Economic Studies, Bank of
Japan, 2001, pp. 89-130.
________, and Shigenori Shiratsuka, “Policy Duration Effect under the Zero Interest
Rate Policy in 1999-2000: Evidence from Japan’s Money Market Data,”
Monetary and Economic Studies, 20 (1), Institute for Monetary and Economic
Studies, Bank of Japan, 2002, pp. 1-31.
Fukui, Toshihiko, “Challenges for Monetary Policy in Japan”--Speech given at the
Spring Meeting of the Japan Society of Monetary Economics, on the occasion of
its 60th anniversary, on June 1, 2003.
Hetzel, Robert L., “Price Stability and Japanese Monetary Policy,” IMES Discussion
Paper No. 2004-E-6, Institute for Monetary and Economic Studies, Bank of Japan,
2004.
Jung, Taehum, Yuki Teranishi, and Tsutomu Watanabe, “Zero Interest Rate Policy as
Optimal Central Bank Commitment,” mimeo, 2001.
Nelson, Charles R., and Andrew F. Siegel, “Parsimonious Modeling of Yield Curves,”
Journal of Business, 60 (4), 1987, pp. 473–489.
Okina, Kunio, and Shigenori Shiratsuka, “Policy Commitment and Expectation
Formations: Japan’s Experience under Zero Interest Rates,” North American

12
Journal of Economics and Finance, 15(1), 2004a, pp. 75-100.
________, and ________, “Asset Price Fluctuations, Structural Adjustments, and
Sustained Economic Growth: Lessons from Japan’s Experience since the Late
1980s,” mimeo, 2004b.
Reifschneider, David, and John C. Williams, “Three Lessons for Monetary Policy in a
Low-Inflation Era,” Journal of Money, Credit and Banking, 32 (4), 2000, pp. 936-
966.
Söderlind, Paul, and Lars E. O. Svensson, “New Techniques to Extract Market
Expectations from Financial Instruments,” Journal of Monetary Economics, 1997
(40), pp. 383-429.
Ueda, Kazuo, “The Role of Capital for Central Banks,” English translation based on a
speech given by Kazuo Ueda, Member of the Policy Board, at the 2003 Fall
Meeting of the Japan Society of Monetary Economics, 2004 (http://www.boj.or.jp/
en/press/04/ko0402b.htm,).
Yamaguchi, Yutaka, “The Economic Situation and Monetary Policy in Japan,” Speech
given by Yutaka Yamaguchi, Deputy Governor of the Bank of Japan, at the
Economic Seminar of the Japan Research Institute, on November 26, 2001
(http://www.boj.or.jp/ en/press/01/ko0111a.htm).

13
Figure 1. Case Studies of Policy Events
[1] MPM on April 30, 2003: CAB target 17-22 trillion yen � 22-27 trillion yen
0.0
0.1
0.2
-20 -10 0 10 20 30 40
R (PD )( % )
8
9
10
11
12
13
-20 -10 0 10 20 30 40
(degree) SL
1.2
1.3
1.4
1.5
1.6
1.7
-20 -10 0 10 20 30 40
( % ) LFR
2.0
2.2
2.4
2.6
2.8
3.0
3.2
-20 -10 0 10 20 30 40
PD(year)
[2] MPM on May 20, 2003: CAB target 22-27 trillion yen � 27-30 trillion yen
0.0
0.1
0.2
0.3
-20 -10 0 10 20 30 40
R (PD )( % )
8
10
12
14
16
18
20
22
-20 -10 0 10 20 30 40
(degree) SL
1.2
1.4
1.6
1.8
2.0
-20 -10 0 10 20 30 40
( % ) LFR
1.4
1.6
1.8
2.0
2.2
2.4
2.6
2.8
3.0
3.2
-20 -10 0 10 20 30 40
PD(year)
[3] MPM on October 10, 2003: CAB target 27-30 trillion yen � 27-32 trillion yen
0.0
0.1
0.2
0.3
-20 -10 0 10 20 30 40
R (PD )( % )
20
22
24
26
28
30
32
34
-20 -10 0 10 20 30 40
(degree) SL
1.8
1.9
2.0
2.1
2.2
2.3
-20 -10 0 10 20 30 40
( % ) LFR
0.9
1.0
1.1
1.2
1.3
1.4
1.5
1.6
1.7
-20 -10 0 10 20 30 40
PD(year)
[4] MPM on January 20, 2004: CAB target 27-32 trillion yen � 30-35 trillion yen
0.0
0.1
0.2
-20 -10 0 10 20 30 40
R (PD )( % )
20
22
24
26
28
-20 -10 0 10 20 30 40
(degree) SL
1.8
1.9
2.0
2.1
2.2
2.3
-20 -10 0 10 20 30 40
( % ) LFR
1.1
1.2
1.3
1.4
1.5
1.6
1.7
1.8
-20 -10 0 10 20 30 40
PD(year)

14
Figure 2. Policy Duration Indicators
[1] Policy duration: PD
0.5
1.0
1.5
2.0
2.5
3.0
1998 1999 2000 2001 2002
( year )
2003 2004
[2] Estimated spot rate at PD: R(PD)
0.0
0.2
0.4
0.6
0.8
1.0
1998 1999 2000 2001 2002
( % )
2003 2004
[3] Slope of FR curve at inflection point: SL
0
10
20
30
40
50
60
1998 1999 2000 2001 2002
( degree ) Y2K
2003 2004
[4] Long-term FR: LFR
1.0
1.5
2.0
2.5
3.0
1998 1999 2000 2001 2002
( % )
2003
Y2K
2004

15
Figure 3. CPI and GDP deflator
-4
-2
0
2
4
6
8
81 82 83 84 85 86 87 88 89 90 91 92 93 94 95 96 97 98 99 00 01 02 03
Core CPI
GDP deflator
(Changes from a year earlier,

16
Figure 4. Asset Prices and General Prices
( 1989/IV = 100 )
0
20
40
60
80
100
120
89 90 91 92 93 94 95 96 97 98 99 00 01 02 03
Land pricesStock pricesCore CPI
Sources: Bank of Japan, Financial and Economic Statistics Monthly; Ministry of Public
Management, Home Affairs, Posts and Telecommunications, Consumer Price Index; Japan
Real Estate Institute, Urban Land Price Index.
Notes: CPI excluding fresh food is seasonally adjusted by X-12-ARIMA with options of (0 1 2)(0
1 1) ARIMA model and level shifts in April 1989 and April 1997, when the consumption
tax was introduced and subsequently increased, respectively.