comments on the provisional determination … · comments on the provisional determination...
TRANSCRIPT
COMMENTS ON THE PROVISIONAL DETERMINATION REGARDING CONTROLLED ACTION NO. 2007/3385
Joint private submission by
Dr Stuart Godfey, Chief Scientist (retired), oceanographer with 38 years professional experience and expertise in oceanography and modelling of interactions between saline and
fresh waters in estuarine environmentsDr Warwick Raverty, Member Australasian Pulp and Paper Technical Association (Appita), pulp and paper scientist, with 27 years experience in assessment of manufacturing processes
for manufacture of bleached kraft pulps and the treatment and control of discharges from these processes to the environment.
Dr Andrew Wadsley, Member of Society of Petroleum Engineers (SPE) and the Society for Industrial and Applied Mathematics (SIAM), petroleum engineer, with 32 years professional
experience and expertise in the numerical modelling of multi-phase and multi-component/contaminant transport and sedimentary processes.
EXECUTIVE SUMMARYThe three authors of these comments and recommendations are experienced scientists familiar with different aspects of the dispersion of pulp mill effluent – the chemistry and toxicity of the effluent material, plus the hydrodynamics of the receiving waters. It is our collective opinion that, both for the sake of Bass Strait fisheries and endangered species and also to avoid a truly awful precedent for environmental management throughout Australia, the Minister has no real option except to refuse a permit for the proposed Gunns Pulp Mill.
The Minister has proposed to set a “trigger” value for dioxin concentrations in the sediment of 850 pg TEQ/kg in Commonwealth marine waters. Present background values are 3.8 pg/kg, so the proposal is 224 times higher than background levels. Scandinavian experience, resulting from comparable increases in dioxins during 1960-1985, is of significant biological impoverishment of many areas of the Baltic Sea. Because dioxins take at least several decades to biodegrade, this impoverishment continues to this day. The 47 Swedish mills now generate only 20% more dioxin than Gunns mill alone would be permitted, under the Minister’s proposed allowance of 0.08 grams TEQ/year. While a similar limit still technically applies to these mills, it has been superseded by a reliance on observations of the health of “sentinel species” in order to determine the safe level of dioxins. This has forced mills to reduce their dioxin outflows by a factor of about 10 compared to their technical guideline. However, it is too late for Sweden to repair their earlier damage to the Baltic and to large lakes. Similar histories relate to San Francisco Bay, offshore British Columbia and the Great Lakes. The panel of experts the Minister plans to convene can quickly confirm these statements by consultation with the Swedish National EPA, the US EPA and Environment Canada.
COMMENTS ON THE PROVISIONAL DETERMINATION REGARDING CONTROLLED ACTION NO. 2007/3385 – WADSLEY, GODFREY, RAVERTY
1
The issue of where the dioxins will go is also unresolved, because one of us (Godfrey) has identified two major technical errors in Gunns’ hydrodynamic modelling. In Gunns’ model, the combined effect of these errors has been to indicate that pollutants are likely to stay offshore, near the depth contour at which they were released–that is, neither reaching the shore, nor reaching Commonwealth waters. Godfrey asserts that the pollution will in fact reach the beach and disperse into Commonwealth waters, and into the rich fish-breeding grounds of the Tamar Estuary. We understand that the Minister plans to test Godfrey’s assertions by repeating the modelling, using a consultant chosen by Australia’s Chief Scientist, Dr. Jim Peacock. Unfortunately, it is highly unlikely that even expert modellers will be able to complete this work before the date in mid-October on which the Minister has stated that he will announce his decision.
We wish to say that we believe that the Minister has so far acted with integrity in an exceedingly difficult situation, and that the Federal Department of Environment and Water Resources–unlike the Tasmanian Government, who have had years to explore all facets of this issue–could not have been expected to be aware of the technical details we are presenting now. Nevertheless, we reaffirm that if the Minister is to make his decision in October the only environmentally prudent course of action is to reject Gunns’ application to site the Mill at Bell Bay.
Dr Stuart GodfreyDr Warwick RavertyDr Andrew Wadsley
31 August 2007
COMMENTS ON THE PROVISIONAL DETERMINATION REGARDING CONTROLLED ACTION NO. 2007/3385 – WADSLEY, GODFREY, RAVERTY
2
TABLE OF CONTENTS
EXECUTIVE SUMMARY........................................................................................................1TABLE OF CONTENTS........................................................................................................... 3PRIMARY COMMENTS AND RECOMMENDATIONS CONCERNING THE PROVISIONAL DETERMINATION....................................................................................... 4APPENDIX I – Detailed discussion, reference material and further comments and recommendations on which the primary comments and recommendations relating to the determination of discharge limits for dioxins and furans have been based.APPENDIX II – Detailed discussion, reference material and further comments and recommendations on which the primary comments and recommendations relating to the hydrodynamic modelling have been based.
COMMENTS ON THE PROVISIONAL DETERMINATION REGARDING CONTROLLED ACTION NO. 2007/3385 – WADSLEY, GODFREY, RAVERTY
3
PRIMARY COMMENTS AND RECOMMENDATIONS CONCERNING THE PROVISIONAL DETERMINATION
Wording of Provisional Determination Comments and RecommendationsDRAFT Approval Decision – Gunns pulp mill (EPBC 2007/3385)
Page 1
COMMONWEALTH OF AUSTRALIAENVIRONMENT PROTECTION AND BIODIVERSITY CONSERVATION
ACT 1999
DECISION TO APPROVE THE TAKING OF AN ACTION
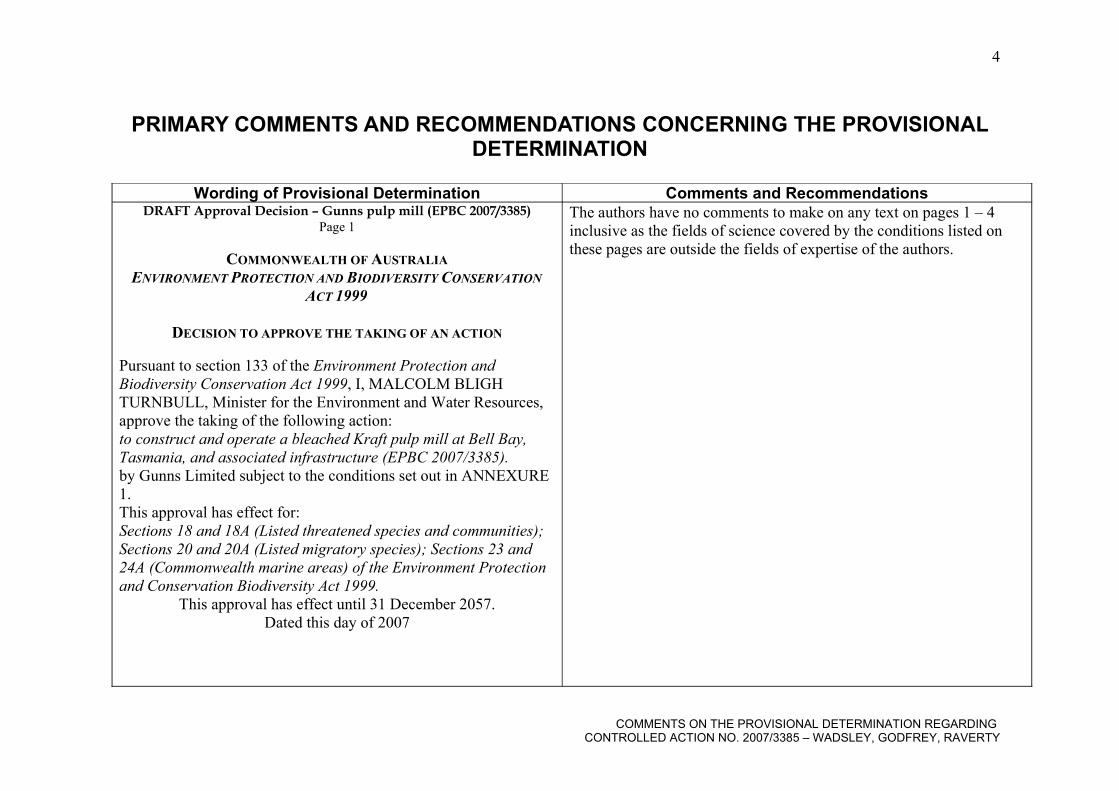
Pursuant to section 133 of the Environment Protection and Biodiversity Conservation Act 1999, I, MALCOLM BLIGH TURNBULL, Minister for the Environment and Water Resources, approve the taking of the following action:to construct and operate a bleached Kraft pulp mill at Bell Bay, Tasmania, and associated infrastructure (EPBC 2007/3385).by Gunns Limited subject to the conditions set out in ANNEXURE 1.This approval has effect for:Sections 18 and 18A (Listed threatened species and communities); Sections 20 and 20A (Listed migratory species); Sections 23 and 24A (Commonwealth marine areas) of the Environment Protection and Conservation Biodiversity Act 1999.
This approval has effect until 31 December 2057.Dated this day of 2007
The authors have no comments to make on any text on pages 1 – 4 inclusive as the fields of science covered by the conditions listed on these pages are outside the fields of expertise of the authors.
COMMENTS ON THE PROVISIONAL DETERMINATION REGARDING CONTROLLED ACTION NO. 2007/3385 – WADSLEY, GODFREY, RAVERTY
4
DRAFT Approval Decision – Gunns pulp mill (EPBC 2007/3385)Page 5
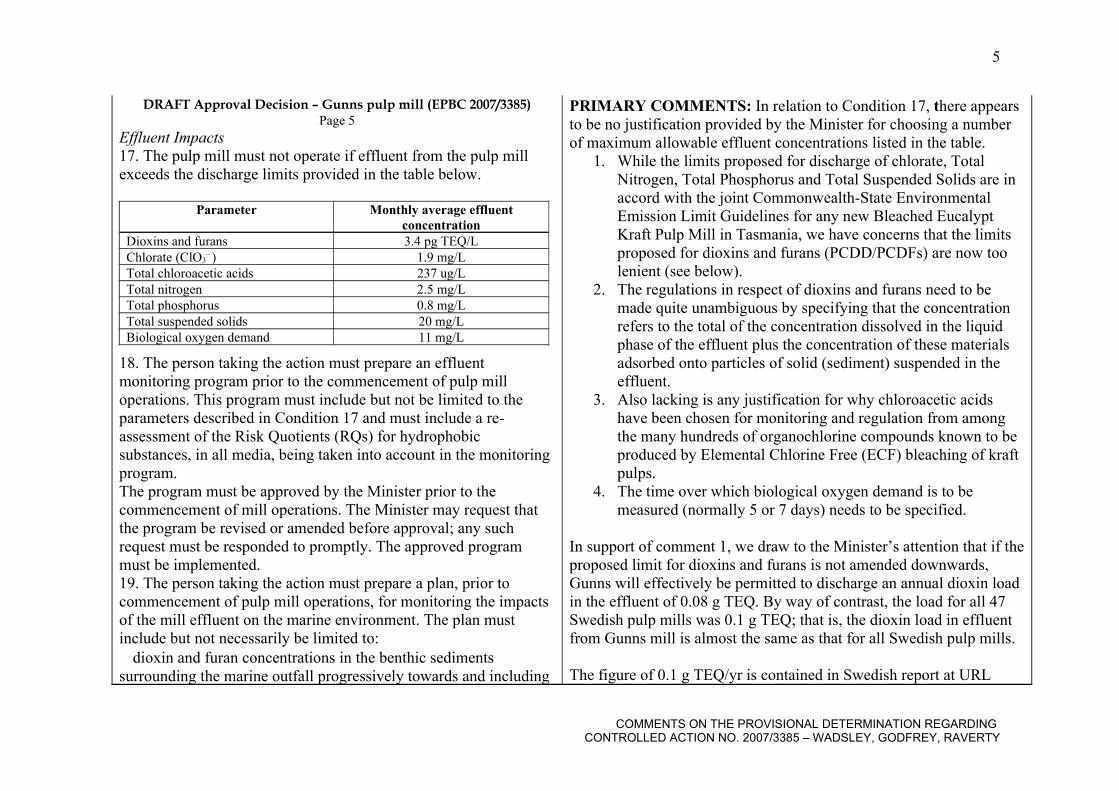
Effluent Impacts17. The pulp mill must not operate if effluent from the pulp mill exceeds the discharge limits provided in the table below.
Parameter Monthly average effluent concentration
Dioxins and furans 3.4 pg TEQ/LChlorate (ClO3
– ) 1.9 mg/LTotal chloroacetic acids 237 ug/LTotal nitrogen 2.5 mg/LTotal phosphorus 0.8 mg/LTotal suspended solids 20 mg/LBiological oxygen demand 11 mg/L
18. The person taking the action must prepare an effluent monitoring program prior to the commencement of pulp mill operations. This program must include but not be limited to the parameters described in Condition 17 and must include a re-assessment of the Risk Quotients (RQs) for hydrophobic substances, in all media, being taken into account in the monitoring program.The program must be approved by the Minister prior to the commencement of mill operations. The Minister may request that the program be revised or amended before approval; any such request must be responded to promptly. The approved program must be implemented.19. The person taking the action must prepare a plan, prior to commencement of pulp mill operations, for monitoring the impacts of the mill effluent on the marine environment. The plan must include but not necessarily be limited to:� dioxin and furan concentrations in the benthic sediments surrounding the marine outfall progressively towards and including
PRIMARY COMMENTS: In relation to Condition 17, there appears to be no justification provided by the Minister for choosing a number of maximum allowable effluent concentrations listed in the table.
1. While the limits proposed for discharge of chlorate, Total Nitrogen, Total Phosphorus and Total Suspended Solids are in accord with the joint Commonwealth-State Environmental Emission Limit Guidelines for any new Bleached Eucalypt Kraft Pulp Mill in Tasmania, we have concerns that the limits proposed for dioxins and furans (PCDD/PCDFs) are now too lenient (see below).
2. The regulations in respect of dioxins and furans need to be made quite unambiguous by specifying that the concentration refers to the total of the concentration dissolved in the liquid phase of the effluent plus the concentration of these materials adsorbed onto particles of solid (sediment) suspended in the effluent.
3. Also lacking is any justification for why chloroacetic acids have been chosen for monitoring and regulation from among the many hundreds of organochlorine compounds known to be produced by Elemental Chlorine Free (ECF) bleaching of kraft pulps.
4. The time over which biological oxygen demand is to be measured (normally 5 or 7 days) needs to be specified.
In support of comment 1, we draw to the Minister’s attention that if the proposed limit for dioxins and furans is not amended downwards, Gunns will effectively be permitted to discharge an annual dioxin load in the effluent of 0.08 g TEQ. By way of contrast, the load for all 47 Swedish pulp mills was 0.1 g TEQ; that is, the dioxin load in effluent from Gunns mill is almost the same as that for all Swedish pulp mills.
The figure of 0.1 g TEQ/yr is contained in Swedish report at URL
COMMENTS ON THE PROVISIONAL DETERMINATION REGARDING CONTROLLED ACTION NO. 2007/3385 – WADSLEY, GODFREY, RAVERTY
5
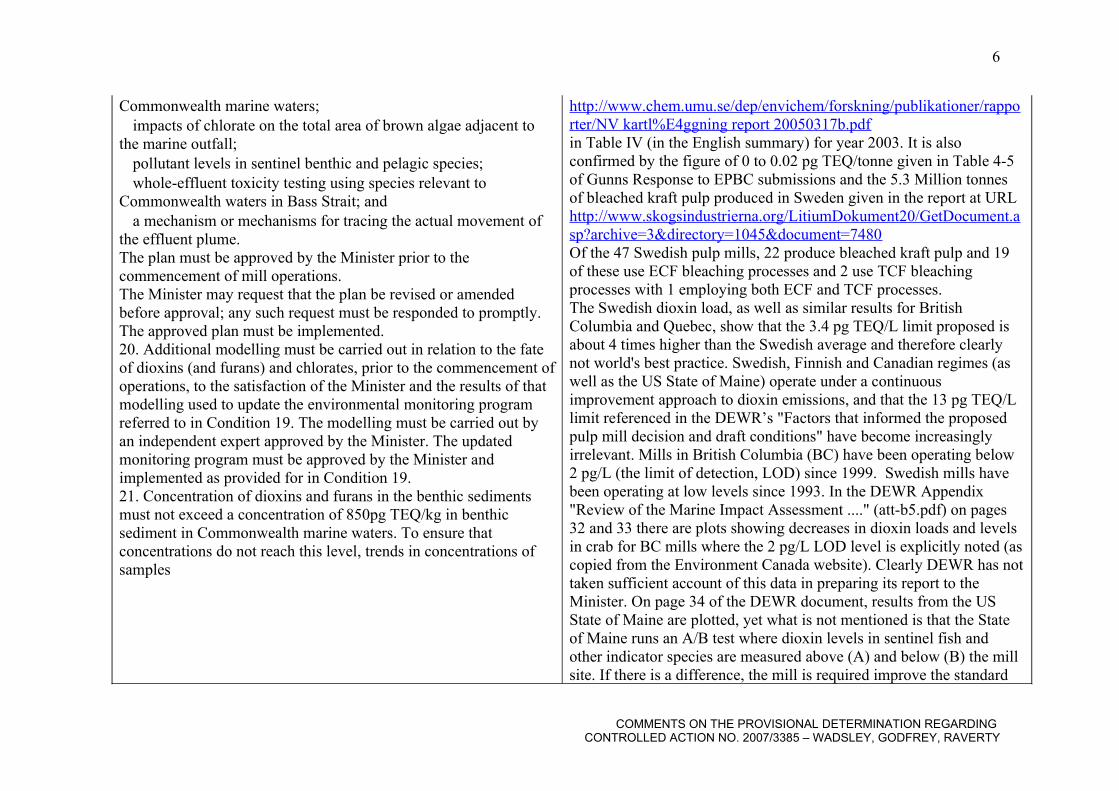
Commonwealth marine waters;� impacts of chlorate on the total area of brown algae adjacent to the marine outfall;� pollutant levels in sentinel benthic and pelagic species;� whole-effluent toxicity testing using species relevant to Commonwealth waters in Bass Strait; and� a mechanism or mechanisms for tracing the actual movement of the effluent plume.The plan must be approved by the Minister prior to the commencement of mill operations.The Minister may request that the plan be revised or amended before approval; any such request must be responded to promptly. The approved plan must be implemented.20. Additional modelling must be carried out in relation to the fate of dioxins (and furans) and chlorates, prior to the commencement of operations, to the satisfaction of the Minister and the results of that modelling used to update the environmental monitoring program referred to in Condition 19. The modelling must be carried out by an independent expert approved by the Minister. The updated monitoring program must be approved by the Minister and implemented as provided for in Condition 19.21. Concentration of dioxins and furans in the benthic sediments must not exceed a concentration of 850pg TEQ/kg in benthic sediment in Commonwealth marine waters. To ensure that concentrations do not reach this level, trends in concentrations of samples
http://www.chem.umu.se/dep/envichem/forskning/publikationer/rapporter/NV kartl%E4ggning report 20050317b.pdfin Table IV (in the English summary) for year 2003. It is also confirmed by the figure of 0 to 0.02 pg TEQ/tonne given in Table 4-5 of Gunns Response to EPBC submissions and the 5.3 Million tonnes of bleached kraft pulp produced in Sweden given in the report at URLhttp://www.skogsindustrierna.org/LitiumDokument20/GetDocument.asp?archive=3&directory=1045&document=7480Of the 47 Swedish pulp mills, 22 produce bleached kraft pulp and 19 of these use ECF bleaching processes and 2 use TCF bleaching processes with 1 employing both ECF and TCF processes. The Swedish dioxin load, as well as similar results for British Columbia and Quebec, show that the 3.4 pg TEQ/L limit proposed is about 4 times higher than the Swedish average and therefore clearly not world's best practice. Swedish, Finnish and Canadian regimes (as well as the US State of Maine) operate under a continuous improvement approach to dioxin emissions, and that the 13 pg TEQ/L limit referenced in the DEWR’s "Factors that informed the proposed pulp mill decision and draft conditions" have become increasingly irrelevant. Mills in British Columbia (BC) have been operating below 2 pg/L (the limit of detection, LOD) since 1999. Swedish mills have been operating at low levels since 1993. In the DEWR Appendix "Review of the Marine Impact Assessment ...." (att-b5.pdf) on pages 32 and 33 there are plots showing decreases in dioxin loads and levels in crab for BC mills where the 2 pg/L LOD level is explicitly noted (as copied from the Environment Canada website). Clearly DEWR has not taken sufficient account of this data in preparing its report to the Minister. On page 34 of the DEWR document, results from the US State of Maine are plotted, yet what is not mentioned is that the State of Maine runs an A/B test where dioxin levels in sentinel fish and other indicator species are measured above (A) and below (B) the mill site. If there is a difference, the mill is required improve the standard
COMMENTS ON THE PROVISIONAL DETERMINATION REGARDING CONTROLLED ACTION NO. 2007/3385 – WADSLEY, GODFREY, RAVERTY
6
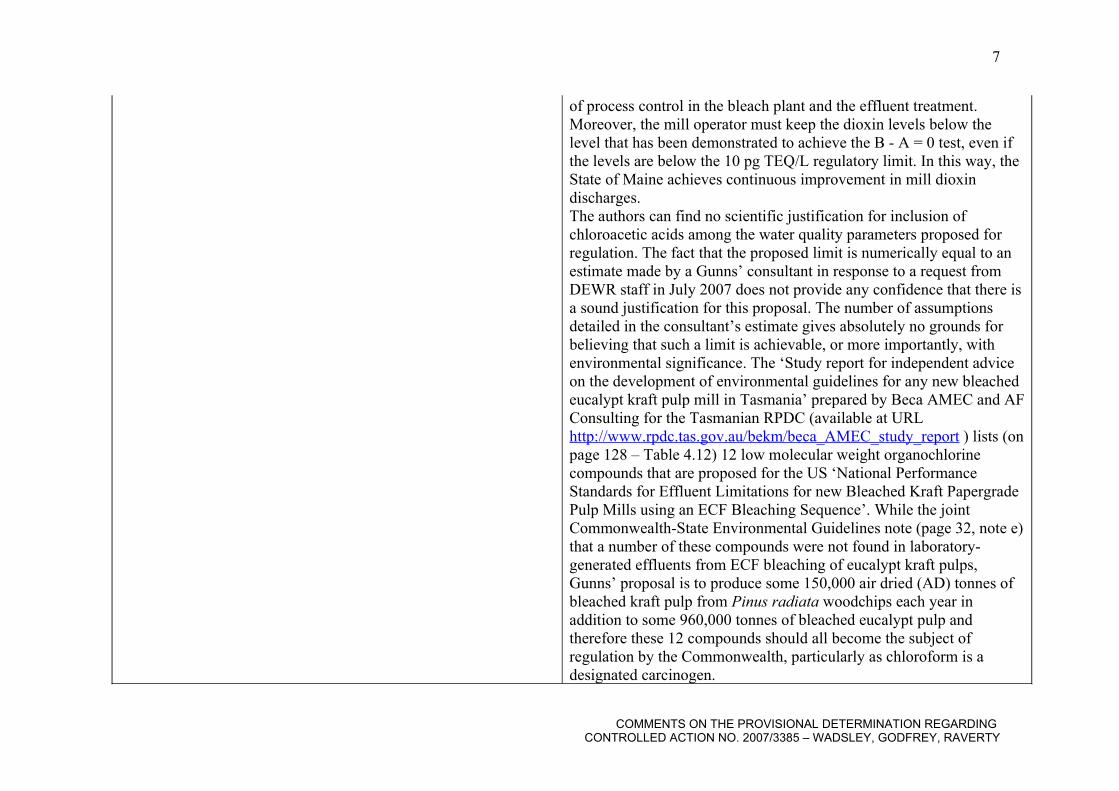
of process control in the bleach plant and the effluent treatment. Moreover, the mill operator must keep the dioxin levels below the level that has been demonstrated to achieve the B - A = 0 test, even if the levels are below the 10 pg TEQ/L regulatory limit. In this way, the State of Maine achieves continuous improvement in mill dioxin discharges.The authors can find no scientific justification for inclusion of chloroacetic acids among the water quality parameters proposed for regulation. The fact that the proposed limit is numerically equal to an estimate made by a Gunns’ consultant in response to a request from DEWR staff in July 2007 does not provide any confidence that there is a sound justification for this proposal. The number of assumptions detailed in the consultant’s estimate gives absolutely no grounds for believing that such a limit is achievable, or more importantly, with environmental significance. The ‘Study report for independent advice on the development of environmental guidelines for any new bleachedeucalypt kraft pulp mill in Tasmania’ prepared by Beca AMEC and AF Consulting for the Tasmanian RPDC (available at URL http://www.rpdc.tas.gov.au/bekm/beca_AMEC_study_report ) lists (on page 128 – Table 4.12) 12 low molecular weight organochlorine compounds that are proposed for the US ‘National Performance Standards for Effluent Limitations for new Bleached Kraft Papergrade Pulp Mills using an ECF Bleaching Sequence’. While the joint Commonwealth-State Environmental Guidelines note (page 32, note e) that a number of these compounds were not found in laboratory-generated effluents from ECF bleaching of eucalypt kraft pulps, Gunns’ proposal is to produce some 150,000 air dried (AD) tonnes of bleached kraft pulp from Pinus radiata woodchips each year in addition to some 960,000 tonnes of bleached eucalypt pulp and therefore these 12 compounds should all become the subject of regulation by the Commonwealth, particularly as chloroform is a designated carcinogen.
COMMENTS ON THE PROVISIONAL DETERMINATION REGARDING CONTROLLED ACTION NO. 2007/3385 – WADSLEY, GODFREY, RAVERTY
7
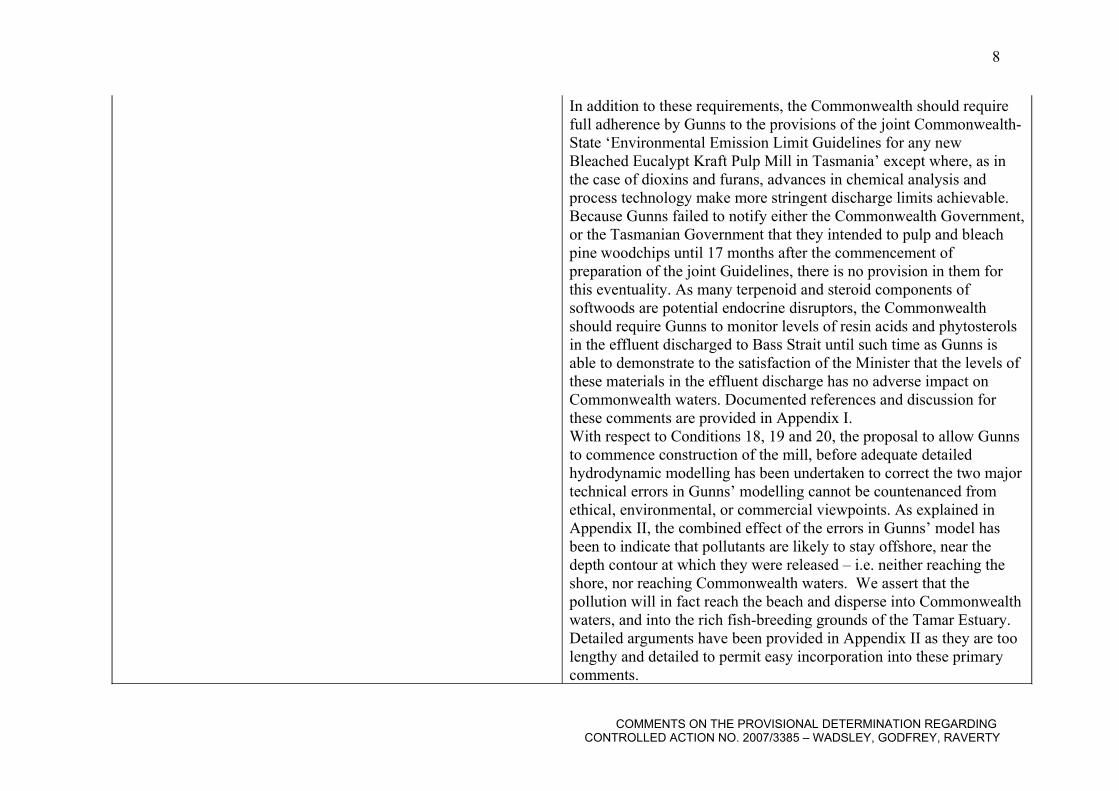
In addition to these requirements, the Commonwealth should require full adherence by Gunns to the provisions of the joint Commonwealth-State ‘Environmental Emission Limit Guidelines for any new Bleached Eucalypt Kraft Pulp Mill in Tasmania’ except where, as in the case of dioxins and furans, advances in chemical analysis and process technology make more stringent discharge limits achievable. Because Gunns failed to notify either the Commonwealth Government, or the Tasmanian Government that they intended to pulp and bleach pine woodchips until 17 months after the commencement of preparation of the joint Guidelines, there is no provision in them for this eventuality. As many terpenoid and steroid components of softwoods are potential endocrine disruptors, the Commonwealth should require Gunns to monitor levels of resin acids and phytosterols in the effluent discharged to Bass Strait until such time as Gunns is able to demonstrate to the satisfaction of the Minister that the levels of these materials in the effluent discharge has no adverse impact on Commonwealth waters. Documented references and discussion for these comments are provided in Appendix I.With respect to Conditions 18, 19 and 20, the proposal to allow Gunns to commence construction of the mill, before adequate detailed hydrodynamic modelling has been undertaken to correct the two major technical errors in Gunns’ modelling cannot be countenanced from ethical, environmental, or commercial viewpoints. As explained in Appendix II, the combined effect of the errors in Gunns’ model has been to indicate that pollutants are likely to stay offshore, near the depth contour at which they were released – i.e. neither reaching the shore, nor reaching Commonwealth waters. We assert that the pollution will in fact reach the beach and disperse into Commonwealth waters, and into the rich fish-breeding grounds of the Tamar Estuary. Detailed arguments have been provided in Appendix II as they are too lengthy and detailed to permit easy incorporation into these primary comments.
COMMENTS ON THE PROVISIONAL DETERMINATION REGARDING CONTROLLED ACTION NO. 2007/3385 – WADSLEY, GODFREY, RAVERTY
8
DRAFT Approval Decision – Gunns pulp mill (EPBC 2007/3385)Page 6
collected in State and Commonwealth waters (in accordance with the plan provided under Condition 19), must be analysed and independently reviewed on a 6-monthly basis. The results must be provided to the Department within one month of each 6-monthly period.Within 90 days of it being identified that the trends in the concentrations in benthic sediment indicate a level of 850 TEQ/kg is likely to be reached within a three-year period, at any time within the life of the mill, a response strategy must be provided to the Department for approval and implementation. The Department may request that the strategy be revised or amended before approval; any such request must be responded to promptly. The approved strategy must be implemented.General22. If the Minister believes that it is necessary or desirable for the better protection of relevant listed threatened species and ecological communities, listed migratory species or the marine environment, the Minister may request that the person taking the action make specified revisions to any of plan, program or strategy approved pursuant to Conditions 3, 4, 5, 10, 11, 13, 18, 19 and 20. The person taking the action must comply with any such request. If the Minister approves a revised plan, program or strategy pursuant to this condition, the person taking the action must implement that plan, program or strategy instead of the plan, program or strategy as previously approved.23. If, at any time after 5 years from the date of this approval, the Minister notifies the person taking the action in writing that the Minister is not satisfied that there has been commencement of construction of the pulp mill, then it must not thereafter be commenced.
With respect to Condition 21, the proposed establishment of limit for concentration of dioxins in sediments of 850 pg/kg (based on Canadian (freshwater) limits) cannot be justified on scientific, legal, or ethical bases. The proposed site of the effluent outfall at Five Mile bluff site is pristine with background levels of dioxins in the sediments that have been measured at 3.8 pg/kg. The proposed limit of 850 pg/kg is 224 times higher than background is clearly in contravention of Australia’s obligations under the Stockholm Convention. Reliable information on the impact on marine biota of Bass Strait arising from such a significant increase in dioxin levels is non-existent. Existing ECF mills are mainly located in environments that were highly polluted during the 1960 - 1985 period, and which suffered significant biological impoverishment as a result. Arguably the surviving species in these areas are those that are either tolerant to dioxins, furans and other industrial pollutants, or possibly uptake resistant to absorption of these materials. More sensitive species simply died out. Recommendations to address these deficiencies are provided below.
The authors have no comments to make on Conditions 22 - 24 inclusive as the fields of science covered by the conditions listed on these pages are outside the fields of expertise of the authors.
COMMENTS ON THE PROVISIONAL DETERMINATION REGARDING CONTROLLED ACTION NO. 2007/3385 – WADSLEY, GODFREY, RAVERTY
9

24. Upon the direction of the Department, the person taking the action must ensure that an independent audit of compliance with the conditions of approval is conducted and a report submitted to the Department. The independent auditor must be approved by the Department prior to the commencement of the audit. Audit criteria must be agreed to by the Department and the audit report must address the criteria to the satisfaction of the Department.
¹Refers to the ‘Forest Practices Authority (2006) Fauna Technical Note Series: Technical Note 1: Eagle Nest Searching, Activity Checking and Management, (Ed. W.E. Brown) DPIW & Forest Practices Authority, Hobart’.²’Formal reserve’ means State Reserves, National Parks, Coastal Reserves, Regional Reserves, Conservation Areas, or as determined by the Department.³NSW National Parks and Wildlife Service (2001). Hygiene protocol for the control of disease in frogs. Information Circular Number 6. NSW NPWS, Hurstville NSW.
DefinitionsConstruction includes any preparatory works required to be undertaken including clearing vegetation, the disturbance of any soil, the erection of any temporary or permanent building, and the use of construction or excavation equipment on site for the purpose of breaking the ground.
PRIMARY RECOMMENDATIONS:1. That detailed remedial hydrodynamic modelling be undertaken
to correct the two major technical errors in Gunns’ modelling before any final determination is made by the Minister concerning this matter in order to establish whether the pollutants in the mill effluent are likely to stay offshore, near the depth contour at which they were released, or whether in fact they are, under many meteorological conditions, quite likely to reach the shore at unacceptably high concentrations, as well as reaching Commonwealth waters and the rich fish-breeding grounds of the Tamar Estuary.
2. That while the remedial modelling is being conducted, the expert panel selected by the Chief Scientist should make a visit to the Swedish National EPA and to Environment Canada to discuss their views and data on the most practical ways in which to regulate discharges of bio-active pollutants, particularly dioxins and furans from bleached kraft pulp mills and that the final Commonwealth determination on this matter be based on sound scientific advice that has been informed by Swedish and Canadian experience.
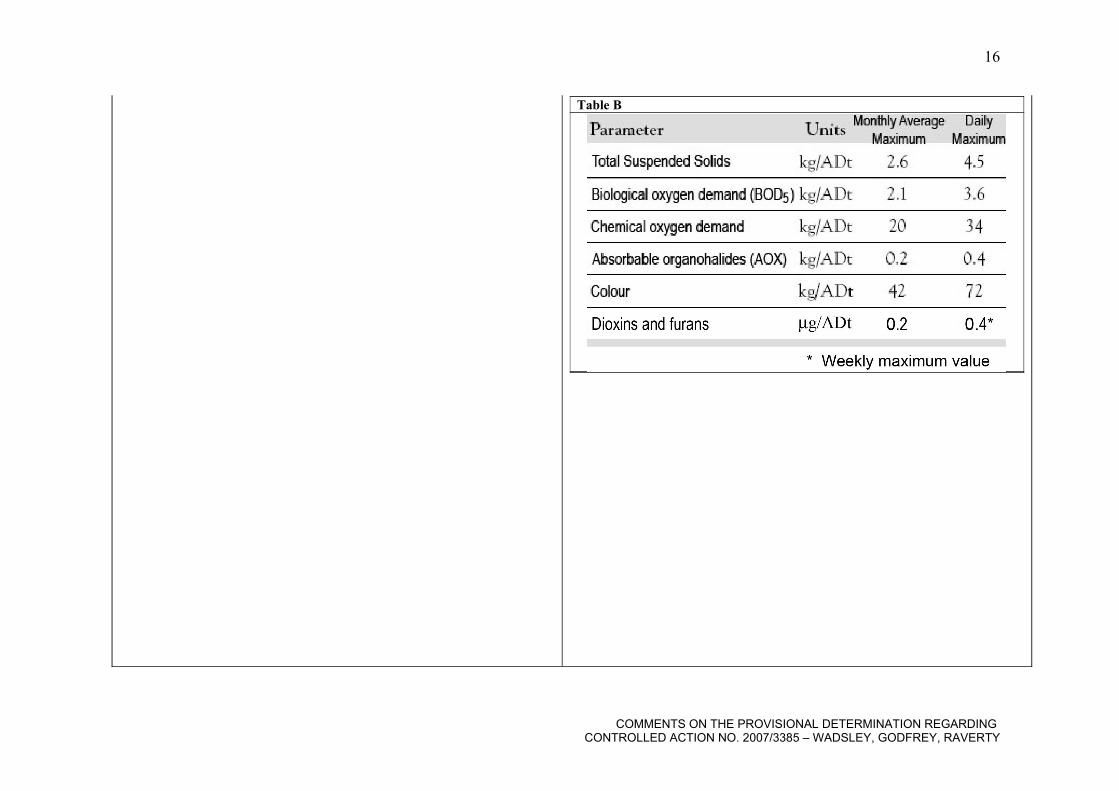
3. In the event that a visit to the Swedish National EPA and to Environment Canada is not possible, the Table provided under Condition 17, should be substituted with Table A, below, for maximum permitted monthly averages for pollutants contained in the effluent discharged to Bass Strait and in addition to the concentration limits specified in Table A, limits on total mass of material discharged per tonne of pulp should be set in accord with the joint Commonwealth-State Guidelines as specified in Table B in order to prevent the person taking the action from simply diluting effluent that is of outside the concentration
COMMENTS ON THE PROVISIONAL DETERMINATION REGARDING CONTROLLED ACTION NO. 2007/3385 – WADSLEY, GODFREY, RAVERTY
10
limits with fresh water in order to comply with the concentration limits. In addition to the data specified in Tables A and B, the person undertaking the action should be required to measure on a daily basis the volume to the nearest kilolitre of treated effluent discharged, the estimated residence time of the effluent in the treatment plant and the daily production rate and nature (whether eucalypt, pine, or mixed pine and eucalypt) of the bleached pulp. The resulting data should be provided to the Minister by the person undertaking the action within 7 calendar days of the end of each calendar month.
4. In order to gain detailed understanding of the operation of the most environmentally sensitive aspects of the action, namely the control of bleaching operations and efficient operation of the effluent treatment plant, the person undertaking the action should be required to measure on a daily basis for the first three years of the action, commencing on the first day of commissioning the pulp mill, the parameters specified in Table C and to report them to the Minister on or before the 30th day of June and the 10th day of January each year. These data should be provided for information purposes and to satisfy the Minister that the person taking the action is gaining experience and implementing continuous improvements in operation of the bleach plant and the effluent treatment plant according to best practice environmental management. The Minister should review the data at the end of the three year period and should then issue a determination as to whether or not a further period of monitoring of any of these materials will be required, and if so, under what conditions.
5. The person taking the action should prepare a plan, prior to commencement of pulp mill operations, for monitoring the
COMMENTS ON THE PROVISIONAL DETERMINATION REGARDING CONTROLLED ACTION NO. 2007/3385 – WADSLEY, GODFREY, RAVERTY
11

levels of resin acids, monoterpenes, sesquiterpenes and phytosterols in the effluent discharged to Bass Strait. The plan should be approved by the Minister prior to the commencement of mill operations.The Minister should have the power to request that the plan be revised or amended before approval; any such request should be responded to promptly. The approved plan should be implemented.
6. At such time as the person is able to demonstrate to the satisfaction of the Minister that the levels of resin acids, monoterpenes, sesquiterpenes and phytosterols in the effluent discharged to Bass Strait have no adverse impact on Commonwealth waters the Minister should have the power to remove the requirement that the person continue the monitoring program for these materials.
7. In order that the Minister may make the best possible determination in relation to the controlled action the Chief Scientist should engage the services of an Australian pulp and paper scientist who is expert in Accepted Modern Technologies for the kraft pulping industry and expert in Best Practice Environmental Management. In view of the complexity of the project it is essential that the person have been involved in the development of Commonwealth-State Environmental Emission Limit Guidelines for any new Bleached Eucalypt Kraft Pulp Mill in Tasmania. A person who fully satisfies these criteria is Mr Roberto Miotti, who acted as project manager for Beca AMEC when that company advised the RPDC on development of the Guidelines. Mr Miotti is now an independent consultant and Director of his own company, Miotti Consulting. He is given the highest possible recommendation by the one author
COMMENTS ON THE PROVISIONAL DETERMINATION REGARDING CONTROLLED ACTION NO. 2007/3385 – WADSLEY, GODFREY, RAVERTY
12
of this submission (Raverty) who served on the RPDC Advisory Panel for the development of the Guidelines. Mr Miotti would also be able to arrange contacts with people having internationally recognised expertise that will be highly relevant to the deliberations of the panel selected by the Chief Scientist.
Contact details for Mr Miotti are: Phone: 0400 228 429 E-mail: [email protected]
8. With respect to Conditions 18,19 and 20, these conditions should be amended by the Minister once the Chief Scientist and his panel have given consideration to the information presented in Appendix II.
9. With respect to Condition 21, the proposed establishment of limit for concentration of dioxins in sediments of 850 pg/kg should be replaced with a limit no higher than one standard deviation above the background levels of dioxins in the sediments at Five Mile Bluff that have been measured at 3.8 pg/kg, which equates to 6 pg TEQ/kg, at a backgroundorganic carbon content (OC) of 0.125% (as measured). This OC must be normalised to 1% OC as in ANZECC Table 3.5.1 (recommended sediment quality guidelines) which would give a justifiable maximum limit value of 48 pg TEQ/kg sediment, rather than 850 pg TEQ/kg. To ensure that concentrations do not reach 48 pg TEQ/kg (normalised), trends in concentrations of samples collected in State and Commonwealth waters (in accordance with the plan provided under Condition 19), should be analysed and independently reviewed on a 6-monthly basis. The results should be provided to the Department within one
COMMENTS ON THE PROVISIONAL DETERMINATION REGARDING CONTROLLED ACTION NO. 2007/3385 – WADSLEY, GODFREY, RAVERTY
13
month of each 6-monthly period.
10. Within 30 days of it being identified that the trends in the concentrations in benthic sediment indicate a level of 48 pg TEQ/kg (normalised) has more than a 50% probability of being reached within a three-year period, at any time within the life of the mill, a response strategy should be provided to the Department for approval and implementation. The Department should have the power to request that the strategy be revised or amended before approval; any such request must be responded to promptly. The approved strategy should be implemented.
11. Alternatively, if data provided by the Swedish National EPA and/or Environment Canada is significantly at variance with these recommendations, the limit for dioxins and furans in sediments adjacent to the proposed outfall should be set by the Minister following consideration of information received from the Swedish National EPA and from Environment Canada, and the Chief Scientist.
COMMENTS ON THE PROVISIONAL DETERMINATION REGARDING CONTROLLED ACTION NO. 2007/3385 – WADSLEY, GODFREY, RAVERTY
14
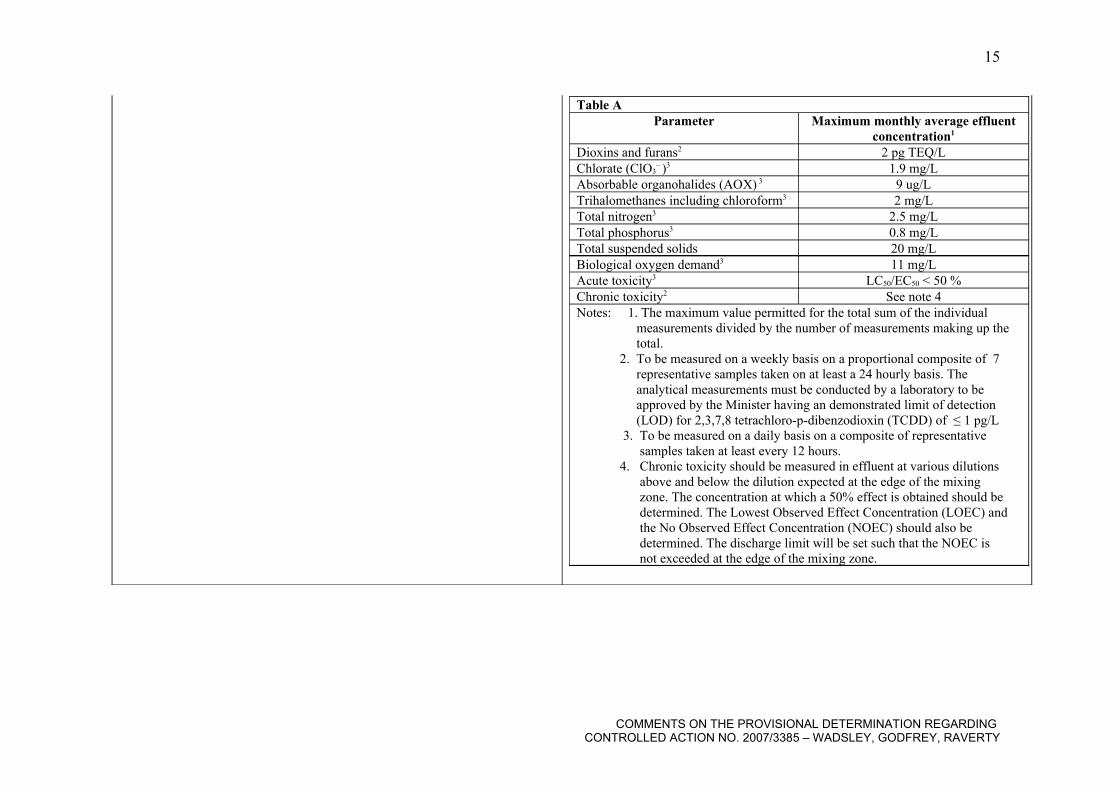
Table AParameter Maximum monthly average effluent
concentration1
Dioxins and furans2 2 pg TEQ/LChlorate (ClO3
– )3 1.9 mg/LAbsorbable organohalides (AOX) 3 9 ug/LTrihalomethanes including chloroform3 2 mg/LTotal nitrogen3 2.5 mg/LTotal phosphorus3 0.8 mg/LTotal suspended solids 20 mg/LBiological oxygen demand3 11 mg/LAcute toxicity3 LC50/EC50 < 50 %Chronic toxicity2 See note 4Notes: 1. The maximum value permitted for the total sum of the individual measurements divided by the number of measurements making up the total. 2. To be measured on a weekly basis on a proportional composite of 7 representative samples taken on at least a 24 hourly basis. The analytical measurements must be conducted by a laboratory to be approved by the Minister having an demonstrated limit of detection (LOD) for 2,3,7,8 tetrachloro-p-dibenzodioxin (TCDD) of ≤ 1 pg/L 3. To be measured on a daily basis on a composite of representative samples taken at least every 12 hours. 4. Chronic toxicity should be measured in effluent at various dilutions above and below the dilution expected at the edge of the mixing zone. The concentration at which a 50% effect is obtained should be determined. The Lowest Observed Effect Concentration (LOEC) and the No Observed Effect Concentration (NOEC) should also be determined. The discharge limit will be set such that the NOEC is not exceeded at the edge of the mixing zone.
COMMENTS ON THE PROVISIONAL DETERMINATION REGARDING CONTROLLED ACTION NO. 2007/3385 – WADSLEY, GODFREY, RAVERTY
15
COMMENTS ON THE PROVISIONAL DETERMINATION REGARDING CONTROLLED ACTION NO. 2007/3385 – WADSLEY, GODFREY, RAVERTY
16
Table B

COMMENTS ON THE PROVISIONAL DETERMINATION REGARDING CONTROLLED ACTION NO. 2007/3385 – WADSLEY, GODFREY, RAVERTY
17
Table C

This Page is Blank
COMMENTS ON THE PROVISIONAL DETERMINATION REGARDING CONTROLLED ACTION NO. 2007/3385 – WADSLEY, GODFREY, RAVERTY
18

APPENDIX I – Detailed discussion, reference material and further comments and recommendations on which the primary comments and recommendations relating to the determination
of discharge limits for dioxins and furans have been based.
Dioxin Concerns
Submission on Proposed Decision and Conditionsunder the EPBC Act 1999
Gunns Limited/Manufacturing/Bell Bay/TAS/Kraft Pulp Mill
Reference Number: 2007/3385
Dr Andrew W. WadsleyAustralian Risk Audit
31 August 2007
Abstract
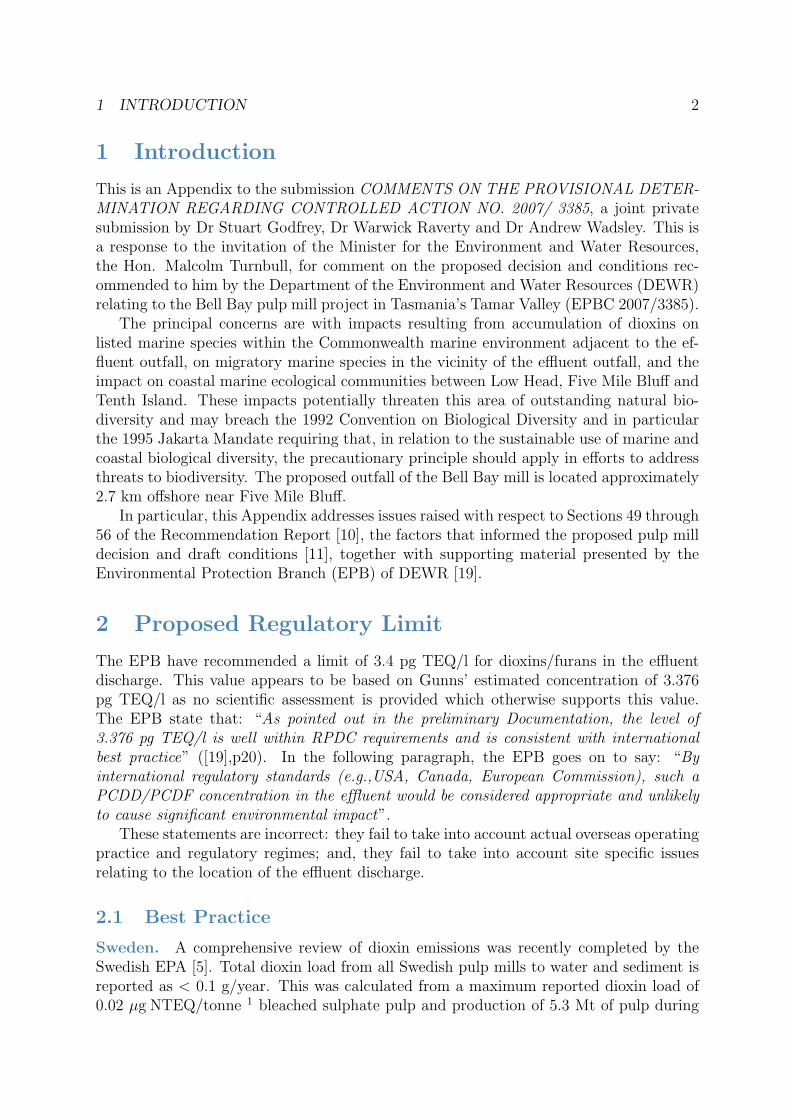
The dioxin/furan limit of 3.4 pg TEQ/l recommended for the Bell Bay pulp milleffluent is 3 to 5 times higher than ‘best practice’ achieved by Swedish and Cana-dian mills. Through environmental monitoring these mills have achieved, over time,a reduction in dioxin/furan emissions by a factor of 10 below nominal regulatorylimits. Despite this, environmental impacts are still observed through metabolicand reproductive disruption in sentinel fish species. While very high dioxin/furanloads released to the environment during the 1960s–1980s have been reduced signif-icantly, present day releases continue to raise observable dioxin levels above accept-able thresholds The effect on Bass Strait fish that have never before been exposedto pulp mill toxicants including dioxins is likely to be significant. Sediments nearthe Five Mile Bluff site of the mill discharge are 24 times poorer in organic car-bon than North American freshwater sediments on which the proposed sedimentquality guideline of 850 pg TEQ/kg is based. To be consistent with reducing bioac-cumulation of dioxins/furans to acceptable levels, this low organic carbon contentnecessitates a reduction in the proposed sediment quality guideline to below 35pg TEQ/kg, bringing it closer to—though still well above—the guideline of 6 pgTEQ/kg derived using the methodology as set out in the National Water QualityManagement Strategy 2000 for a high conservation ecosystem. Simple US EPAscreening studies, using appropriate ranges of measured environmental parametersand a dioxin/furan concentration of 3.4 pg TEQ/l in mill effluent, show that theUS EPA lower risk limit for mammalian wildlife for dioxin/furan concentration infish tissue will be exceeded for sentinel fish species such as Australian salmon andFive Mile Bluff flathead. The Australian advisory limit for the human consumptionof fish was exceeded in 20% of cases in a region of 110 km2 off Five Mile Bluffextending into Commonwealth waters. The same screening study shows that sedi-ment concentrations will exceed guideline values for both a pristine and a disturbedecosystem more than 95% of the time.
1
1 INTRODUCTION 2
1 Introduction
This is an Appendix to the submission COMMENTS ON THE PROVISIONAL DETER-MINATION REGARDING CONTROLLED ACTION NO. 2007/ 3385, a joint privatesubmission by Dr Stuart Godfrey, Dr Warwick Raverty and Dr Andrew Wadsley. This isa response to the invitation of the Minister for the Environment and Water Resources,the Hon. Malcolm Turnbull, for comment on the proposed decision and conditions rec-ommended to him by the Department of the Environment and Water Resources (DEWR)relating to the Bell Bay pulp mill project in Tasmania’s Tamar Valley (EPBC 2007/3385).
The principal concerns are with impacts resulting from accumulation of dioxins onlisted marine species within the Commonwealth marine environment adjacent to the ef-fluent outfall, on migratory marine species in the vicinity of the effluent outfall, and theimpact on coastal marine ecological communities between Low Head, Five Mile Bluff andTenth Island. These impacts potentially threaten this area of outstanding natural bio-diversity and may breach the 1992 Convention on Biological Diversity and in particularthe 1995 Jakarta Mandate requiring that, in relation to the sustainable use of marine andcoastal biological diversity, the precautionary principle should apply in efforts to addressthreats to biodiversity. The proposed outfall of the Bell Bay mill is located approximately2.7 km offshore near Five Mile Bluff.
In particular, this Appendix addresses issues raised with respect to Sections 49 through56 of the Recommendation Report [10], the factors that informed the proposed pulp milldecision and draft conditions [11], together with supporting material presented by theEnvironmental Protection Branch (EPB) of DEWR [19].
2 Proposed Regulatory Limit
The EPB have recommended a limit of 3.4 pg TEQ/l for dioxins/furans in the effluentdischarge. This value appears to be based on Gunns’ estimated concentration of 3.376pg TEQ/l as no scientific assessment is provided which otherwise supports this value.The EPB state that: “As pointed out in the preliminary Documentation, the level of3.376 pg TEQ/l is well within RPDC requirements and is consistent with internationalbest practice” ([19],p20). In the following paragraph, the EPB goes on to say: “Byinternational regulatory standards (e.g.,USA, Canada, European Commission), such aPCDD/PCDF concentration in the effluent would be considered appropriate and unlikelyto cause significant environmental impact”.
These statements are incorrect: they fail to take into account actual overseas operatingpractice and regulatory regimes; and, they fail to take into account site specific issuesrelating to the location of the effluent discharge.
2.1 Best Practice
Sweden. A comprehensive review of dioxin emissions was recently completed by theSwedish EPA [5]. Total dioxin load from all Swedish pulp mills to water and sediment isreported as < 0.1 g/year. This was calculated from a maximum reported dioxin load of0.02 µg NTEQ/tonne 1 bleached sulphate pulp and production of 5.3 Mt of pulp during
2 PROPOSED REGULATORY LIMIT 3
2003. The effluent discharge of the Bell Bay mill is estimated to be 23,000 l of waterper tonne pulp [21]. If the Swedish mills used the same amount of water, their emissionswould be < 1 pg TEQ/l; that is, approximately 0.83 pg TEQ/l prorated with respect tototal dioxin emissions.
British Columbia. Environment Canada, with respect to pulp mills in British Columbia,states: “In 1999, all mills reported non-detectable 2,3,7,8-TCDD in their effluent. For thatyear 1/2 the 2 pg/L detection limit was used and a total dioxin loading of 1.01 mg/d wasestimated. Similarly from 2000 to 2003 all mills reported non-detectable 2,3,7,8-TCDDin their effluent and a total dioxin loading of 1.00 mg/d was estimated.” [14] There arenine pulp and paper mills that discharge secondary-treated effluent to the marine wa-ters of British Columbia and 17 kraft mills altogether with a total effluent discharge of640 GL/year [39]. Average effluent dioxin concentration for these mills is 0.57 pg/l for2,3,7,8-TCDD. On a TEQ basis, dioxin concentrations are approximately 1 pg TEQ/l(the dioxin:furan ratio is 1:9 2 ).
Quebec. Hatfield Consultants report that all of the ECF mills in Quebec are normallyunable to detect 2,3,7,8-TCDD in their monthly effluent tests at detection levels of ap-proximately 1 pg/L [13].
Bell Bay. The dioxin concentration of the Bell Bay mill is estimated at 3.376 pg TEQ/l[25]. This is between 3 and 5 times higher than that achieved by Swedish and Canadianmills which set the benchmark for “international best practice”. The EPB is incorrect insuggesting that the Bell Bay mill meets this standard.
2.2 Best Regulatory Practice
A proactive approach is taken by the Dioxin Monitoring Program carried out by theDepartment of Environmental Protection of the US State of Maine [9]. Not only mustthe dioxin content of pulp mill effluent be below the regulatory limit but there must beno measurable difference in dioxin concentrations in fish sampled from above and belowthe mill outfall (A/B test), and emissions must be maintained at levels below those whenthe A/B test was satisfied. This is an ongoing regulatory requirement.
Canada takes a similar approach and has introduced science-based Environmental Ef-fects Monitoring (EEM) that can detect and measure changes in aquatic ecosystems (re-ceiving environments) potentially affected by human activity (effluent discharges). EEMprovides a nationally consistent approach, based on the ‘polluter pays’ principle, to de-termine if effluents are causing effects on ecosystems. EEM is currently a requirement forregulated mills and mines under the Canadian Regulations Amending the Pulp and PaperEffluent Regulations (RAPPER) and the Metal Mining Effluent Regulations (MMER),both under the authority of the Fisheries Act.[16]
1NTEQ = Norwegian PCDD/F toxic equivalent.2In the Yukon and Pacific Region, Environment Canada reports total dioxin discharge for all mills of
0.2 mg/day for 2,3,7,8-TCDD and 1.8 mg/day for 2,3,7,8-TCDF. [15]
2 PROPOSED REGULATORY LIMIT 4
These regulatory environments are such that pulp mills operate to continuously im-prove their dioxin emissions: actual emissions are significantly lower, by a factor of 10,than the nominal regulatory limits 3 . By implementing these monitoring programmes,regulatory authorities in Canada and Maine clearly do not consider fixed, or static, limitsfor dioxins and furans sufficient in themselves to produce good environmental outcomes.Moreover, without these monitoring programmes and actions taken based on the resultsof these, it is unlikely that mill operators by themselves would have achieved such lowdioxin levels.
There is no basis in fact to assert that “such a PCDD/PCDF concentration in theeffluent [3.376 pg TEQ/l] would be considered appropriate” under best internationalregulatory standards; moreover, the proposed guideline of 3.4 pg TEQ/l does not, ofitself, “represent world’s best practice for an ECF pulp mill”.
2.3 Current Environmental Impact
The EPB found there was no field data from a new “greenfields” ECF mill from whichto determine the impact of dioxins and furans. While “overseas experience demonstratesthat conversion from elemental chlorine to ECF pulp mills ... has resulted in dramaticallyreduced levels of dioxins and furans in sediment and biota” ([19] p23), there is little non-anecdotal support for their view that environmental or health problems are not beingcaused by dioxins in the effluent. On the contrary, there is a significant body of evi-dence suggesting that pulp mill effluents, and dioxins in particular, are still detrimentallyimpacting the environment.
Sweden. A recent study on concentrations of dioxins in fish outside Swedish pulp millswith various bleaching processes as well as different water treatment procedures foundincreased dioxin levels from ongoing pollution rather than leakage from previously de-posited sediments [35]. The study specifically notes that impacts may be due to the scaleof production:
• “The extremely large quantities of effluent water (almost 150 000 000 m3/year) andthe large quantities of timber processed imply certain dimensional problems since theconcentration causing the dioxin pollution of the fish is fairly low.”
Beca-AMEC, in their review of ECF and TCF bleaching, note that the study demonstratesa reduction in dioxin levels in perch by a factor of 20 over the past 15 years [4]. However,current levels (for perch) are up to 900 pg TEQ/kg, a level which exceeds the US EPAlower limit for risk to mammalian wildlife of 700 pg TEQ/kg ([41] Table 13.5).
Canada. Impacts of effluent and dioxin pollution are still observed due to the effluentdischarge of Canadian pulp mills, as reported by the Environmental Effects Monitoringprogram for the period 1992 to 2004 (Cycles 1 to 3):
3In Maine, the nominal regulatory limits are 10 pg/l for 2,3,7,8-PCDD and 31.9 pg/l 2,3,7,8-PCDF;in Canada these are 10 pg/l and 50 pg/l, respectively.

2 PROPOSED REGULATORY LIMIT 5
• “The national average response pattern measured for fish in both Cycles 2 and 3 wasone typically associated with nutrient enrichment overlaid by metabolic distruption.That is, exposed fish have consistently shown evidence of increased food availabilityor increased food absorption (fatter, faster growing, with larger livers) together withdisruption of allocation of resources to reproduction (smaller gonads), in comparisonto reference area fish. Further, at a national level, the reduction in fish gonad sizehas remained virtually unchanged over two cycles of data collection. This metabolicdisruption may include some aspect of endocrine disruption associated with prob-lems in producing sufficient sex steroid hormones, Other observed response patternsfor fish have included nutrient enrichment without metabolic disruption, nutrientlimitation, and chemical toxicity. Tainting was confirmed at one mill and dioxinsand furans exceeded fish tissue guideline levels at three mills.” [30]
Dioxin and furan contamination in sediments collected near coastal pulp mills in BritishColumbia dropped from an average of 252,000 pg/kg in 1990 to 36,800 pg/kg in 2003 [14].This level is still 43 times greater than the interim Canadian Sediment Quality Guideline(CSeQG) of 850 pg TEQ/kg [17].
British Columbia. The EPB refer to a paper by Macdonald et al. [31] which measureddioxin concentrations in a core taken from Kamloops Lake, British Columbia. The EPBstate that following conversion of a pulp mill to chlorine dioxide bleaching “levels inlake sediment cores were drastically reduced to pre-1960 levels”. This statement, whichimplies that the mill is nolonger contributing significant dioxin/furan loads to the lake, ismisleading.
The mill was built in 1965 some 8 kms upstream of the lake, and converted fromchlorine bleaching to 100% chlorine dioxide bleaching from 1988 through 1993. There wasa massive reduction in dioxin concentrations from a peak of 58,600 pg/kg 2,3,7,8-TCDDin 1983-85 to 900 pg/kg in 1993-94 (as noted by the EPB). Pre-industrial levels of 2,3,7,8-TCDD are recorded as 100 pg/kg from 1878 through 1941. Thereafter, there are increasesin concentrations prior to mill start up in 1965 with a major spike occurring afterwards inthe interval 1981 to 1985. While the dating of the sediments was based on isotope analysisand the sediments were varved (implying low levels of bioturbation and reworking) it islikely that pore-water and contaminant diffusion between sediments layers has resultedin (possibly colloidal) dispersion of contaminants within the sediment, which may haveresulted in higher dioxin/furan concentrations measured in sediments dated prior to 1965.
The study reports a high sedimentation input to the lake requiring a 2,3,7,8-TCDFflux of about 7.7 g/yr to maintain present concentrations (as of 1995). The mill loadingwas estimated at 7 ± 2 g/yr which is sufficient to supply most of the 2,3,7,8-TCDFaccumulating in the lake. This high load is consistent with the total sediment dioxin/furanconcentration of 4,280 pg TEQ/kg calculated for lake sediment in 1995; this level is 5 timeshigher than the CSeQG of 850 pg TEQ/kg.
The relevance of these results to the Bell Bay mill is questionable, particularly giventhe very high dioxin/furan loadings which have subsquently been reduced, the high sedi-mentation of the lake compared to negligible sedimentation at the Bell Bay outfall location(Five Mile Bluff), and the very high dioxin/furan concentration of the sediment compared

2 PROPOSED REGULATORY LIMIT 6
to an average background level for Five Mile Bluff of 3.8 pg TEQ/kg ([42] Table 1).
USA. A review of current US effluent limitations guidelines and standards by the USEPA is presented in [48]. One objective of this study was “to determine how the revisionsof the categorical ELGs [effluent limitations guidelines] that were promulgated in 1998have been implemented, their effect on mill discharges, and whether they should be furtherrevised to provide additional control of pollutants originating from bleaching operations”.With respect to dioxin, the main finding was:
• “Dioxin levels in fish tissue samples have declined in all but 1 of the 17 water bodieslisted in the 1997 Economic Analysis. These declines appear to have occurred fol-lowing the shift away from chlorine bleaching processes at the pulp and paper millslocated on these rivers and lakes. However, dioxin concentrations remain abovestates’ acceptable levels in 10 of the 17 water bodies, preventing over half of the 19advisories from being fully rescinded. Elevated dioxin levels in these water bodiesmay be due to the legacy of the long history of dioxin discharges as well as to otherdioxin sources such as industrial and urban runoff” ([48] p9-14).
Although, as the US EPA says, these elevated dioxin levels may be a legacy of highhistoric dioxin loads, in view of the experience from Canada and the Baltic, it is likelythat dioxin discharges from US pulp mills are still impacting the environment. Note that2,3,7,8-TCDD was claimed to be below the detection limit 4 of 10 pg/l in bleach planteffluent for all of the 51 mills for which the US Environmental Protection Agency (USEPA) has data for the period 2002 to 2004 ([48] p5-4), yet unacceptable impacts of dioxincontamination persist.
Denmark. A recent Danish survey looked at the role of deposition of atmospheric diox-ins to the western part of the Baltic Sea ([52] 5.8). They calculated a total deposition of1.3 mg I-TEQ/km2/yr of sea surface 5 . The Danish survey compared the atmosphericdeposition of dioxins/furans of 1.3 mg I-TEQ with a calculated pelagic fish accumulationof 5.3 µg/km2/yr; they found that the pelagic fish biomass production amounts to ap-proximately 0.4% of the flux to the sea surface. They concluded that: “a large surplus ofPCDD/Fs is available in the sea for bio-uptake from atmospheric deposition on the seasurface alone. This makes it likely that most of the PCDD/Fs in fish originate from thissource, even if some may be taken up from sediment or originate from rivers. Only aminor part of the deposition flux to the sea ends up in the biomass near the top of the foodweb. The major part is precipitated to the sediments, where in the case of the WesternBaltic Sea concentrations found in the Danish Dioxin Monitoring Programme are in therange of 4–36 ng/kg I-TEQ.” That is, 4,000 to 36,000 pg TEQ/kg; equivalently, 5 to 42times greater than the CSeQG.
4When US dioxin reporting protocols were applied in Europe, Method 1613B—recommended by theUS EPA for dioxins/furans—could not be used due to quality control issues, not detection issues [38].Since non-detected analyses are reported as zero values in the US, many American laboratories reporterroneous results. All non-detects are reported as zero and no correction for detection is made to Method1613B data for environmental reporting. This has led to the mistaken belief that dioxin levels in pulpmill effluent are ‘negligible’, ‘not measurable’, or ‘undetectable’.

3 SEDIMENT QUALITY GUIDELINES 7
In their review of Gunns’ hydrodynamic modelling, Patterson Britton used an areaof 49 km2 in which they showed that the trigger level for chlorate could be exceededby a factor of 2 [37]. In our submissions ([54],[55] 6 ) we defined an area of 110 km2
in which dioxins are likely to be a contaminant of particular concern. At steady-stateconditions, the annual dioxin load to these areas from the Bell Bay mill is 80 mg TEQ,corresponding to a dioxin loading of between 0.72 and 1.6 mg TEQ/km2/yr. This loadingis similar to that of atmospheric precipitation to the Western Baltic Sea. This benchmarkwould suggest that the proposed regulatory limit could result in unacceptable dioxin/furanconcentrations in sediments extending into the Commonwealth marine area.
Summary. These results demonstrate that there is an ongoing impact with respect todioxins released from pulp mills. While very high dioxin/furan loads released to the en-vironment during the 1960s–1980s have been reduced significantly, present day releasescontinue to raise observable dioxin levels above acceptable thresholds. There is no pub-lished data which shows that dioxin/furan levels have been reduced to levels similar tothose pre-industrialisation. The proposed site of the effluent discharge at Five Mile Bluffis pristine with a very low background level of dioxin and, most likely, very low levelsof other potential toxicants. Any release of dioxins, even at levels consistent with bestavailable technology (eg 0.83 pg TEQ/l), will have a measurable impact on the receivingenvironment extending into Commonwealth waters.
3 Sediment Quality Guidelines
The EPB has proposed a sediment quality guideline of 850 pg TEQ/kg for dioxin/furanswhich is the interim Canadian Sediment Quality Guideline (CSeQG). This value was usedin the absence of an appropriate Australian guideline. As the EPB notes, the CSeQG wasderived for freshwater environments only and, as Environment Canada states, “insufficienttoxicity data were available for marine sediments, so the interim CSeQG ... for freshwatersediments [has] been adopted for marine sediments” [17].
The link between Canadian freshwater environments and the coastal marine environ-ment offshore northern Tasmania is tenuous. There is no scientific basis for using theCSeQG until relevant biotoxicological studies have been carried out.
In order to test the applicability of the CSeQG of 850 pg TEQ/kg, we calculateddioxin concentrations in Five Mile Bluff flathead—using a site specific biota-sediment ac-cumulation factor (BSAF) of 1.67 (calculated from measured data using the methodologyof the National Dioxin Survey [20], see also [54]) and measured average lipid fraction of0.5%—for the range 0.089% to 0.22% organic carbon in sediment. This calculation gives adioxin concentration in flathead of 7,970 pg TEQ/kg and 3,230 pg TEQ/kg, respectively.The value of 7,970 pg TEQ/kg exceeds the Australian action limit of 6,000 pg TEQ/kg forhuman consumption (recommended by the Port Jackson Expert Panel [34]); at this level
5I-TEQ international PCDD/F toxicity equivalent.6The EPB references our submission on the Referral (13 April 2007) but does not reference our
submission of 5 June 2007 under the invitation for Public Comment. Our reply to Gunns’ response tosubmissions (which was forwarded to the Minister on 23 July 2007) is similarly not referenced.
3 SEDIMENT QUALITY GUIDELINES 8
of contamination it is likely that flathead fishing in the area would need to be restricted.
3.1 Organic Carbon Normalisation
The CSeQG has been derived only for Canadian freshwater sediments. Within sedi-ment, because of their strongly hydrophobic and lipophilic nature, most dioxins/furansare sorbed to organic carbon (OC). Values for organic carbon can vary significantly be-tween freshwater and marine sediments. Typical values lie in the range 3% to 5% fornorth American freshwater sediments [49]: total organic carbon (TOC) was measuredbetween 2% and 3% for Niagara River suspended sediments [32], and from 2.5% to 3.3%for the Saanich Inlet, British Columbia [46]. Average Baltic Sea sediment OC fraction is3% ([12] Table 2).
Table 3.5.1 of the Australia and New Zealand Guidelines for Fresh and Marine WaterQuality (ANZECC) [2] provides recommended sediment quality guidelines for contami-nants 7 normalised to 1% organic carbon. For the Five Mile Bluff site, recent measure-ments gave an OC range of 0.089% to 0.22% with an average of 0.125% ([42] Table 1).The Canadian guidelines do not specify a reference level of organic carbon although this isgiven as 1% for nonylphenol and its ethoxylates [18] and was assumed for dioxins/furansin a study of Fraser River sediments carried out by Environment Canada [6]. Withoutspecific assessment of potential impacts taking into account organic carbon and benthicorganisms, it cannot be considered an acceptable benchmark for the proposed receivingenvironment at Five Mile Bluff.
If the CSeQG of 850 pg TEQ/kg is normalised with respect to 1% organic carbon,then the equivalent limit for Five Mile Bluff, using average OC, is 106 pg TEQ/kg, 1/8thof the CSeQG. If the US EPA default value of 3% OC is used to normalise the CSeQG,then the equivalent limit for Five Mile Bluff conditions is 35 pg TEQ/kg. The US EPAlimit for the protection of mammalian wildlife is 700 pg TEQ/kg fish. A site specificsediment concentration consistent with this limit is 75 pg TEQ/kg sediment.
3.2 ANZECC Approach
Section 3.5.4.3 of the ANZECC guidelines provides a protocol for the setting of a triggervalue in the absence of a specifed guideline value. This is preferable to the approach takenby the EPB (using the CSeQG value) which is flawed because it is neither science-basednor appropriate to values representative of the coastal marine environment near Five MileBluff. The ANZECC approach is to derive values based on natural background contami-nant levels. For aquatic ecosystems of high conservation/ecological value, a precautionaryapproach is recommended and that “chemicals originating from human activities shouldbe undetectable, and naturally occuring toxicants (eg metals) should not exceed backgroundvalues”. For slightly disturbed ecosystems they recommend that a factor of 2 can be used.Because of airborne deposition from forest fires [8] dioxins/furans are naturally occuringtoxicants in Australia. The background levels in the receiving environment at Five MileBluff, however, are very low at 3.8 pg TEQ/kg, indicative of a pristine environment.
7No guideline value is provided for dioxins/furans.

3 SEDIMENT QUALITY GUIDELINES 9
We argued strongly in our previous submissions that the marine ecological communityfrom Tenth Island to the Tamar Estuary is of high conservation value [55]. The areadefines an ecological community of National Significance, including the rich biodiversityof the Tamar Estuary, a penguin breeding colony, a seal breeding ground, breeding groundsfor listed bird species, a habitat for listed invertebrates, fish and other marine species, aresting place for migratory birds, feeding grounds for whales, dolphins and sharks, and adiverse range of marine flora and fauna including seagrass and unique sponge beds.
The ANZECC guidelines (2000) say:
• “The recommended trigger-based approach for physical-chemical stressors may bestated as follows: A trigger for further investigation will be deemed to have occurredwhen the median concentration of n independent samples taken at a test site exceedsthe eightieth percentile of the same indicator at a suitably chosen reference site.Where suitable reference site data do not exist, the comparison should be with therelevant guideline value published in this document.” ([2] Vol 1, 7.4.4.1).
A detailed assessment of the determination of locally derived trigger values was providedas part of the Preliminary Documentation [29], although a value for dioxins/furans wasnot given. Taking the 80% percentile of the measured background concentration of dioxin/furans in sediment gives a value of 6 pg TEQ/kg. If it is assumed that the ecosystemis slightly disturbed (for example by commercial fishing and tourism, or by efflux fromthe more polluted industrial areas of the Tamar Estuary) then a trigger value of 12 pgTEQ/kg may be appropriate.
Table 3.1: Sediment Quality Guideline Reference Values for Dioxins/Furans
Source Site Specific Guideline
pg TEQ/kg
EPB Proposed 850
Canadian SeQG 850
CSeQG 1% OC normalised 106
US EPA low mammalian risk level 75
CSeQG 3% OC normalised 35
ANZECC slightly disturbed ecosystem 12
ANZECC high conservation ecosystem 6
Summary. Sediment quality reference values for dioxins/furans are summarised in Ta-ble 3.1. It can be seen clearly that the EPB proposed guideline of 850 pg TEQ/kg isinappropriate for the receiving environment. Normalisation for organic carbon wouldreduce the limit by a factor between 8 and 24 times. This would bring the limit intoconsistency with the US EPA low mammalian risk level of 75 pg TEQ/kg. Applying the
4 CALCULATION OF IMPACT 10
precautionary principle and the ANZECC guidelines the appropriate limit is between 6and 12 pg TEQ/kg for Five Mile Bluff.
4 Calculation of Impact
4.1 Models of Fate and Transport
Both the Preliminary Documentation ([41],[43],[44],[45]), the Proponent’s response [42]and our submissions ([55],[54]) used equations from the US EPA to calculate dioxinconcentrations in sediment near the proposed outfall at Five Mile Bluff [50]. In oursubmissions we demonstrated that the Proponent had made an error in applying theseequations—the EPB agrees that their use of the Cwtot equation was ‘inappropriate’.
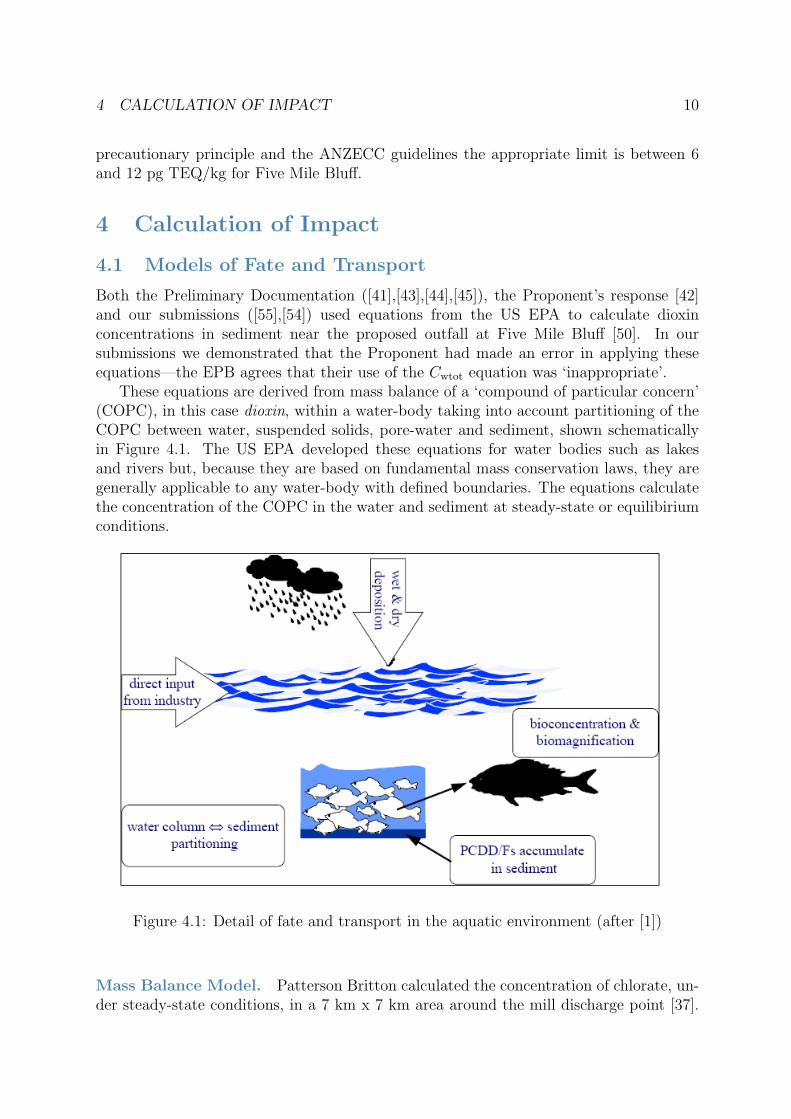
These equations are derived from mass balance of a ‘compound of particular concern’(COPC), in this case dioxin, within a water-body taking into account partitioning of theCOPC between water, suspended solids, pore-water and sediment, shown schematicallyin Figure 4.1. The US EPA developed these equations for water bodies such as lakesand rivers but, because they are based on fundamental mass conservation laws, they aregenerally applicable to any water-body with defined boundaries. The equations calculatethe concentration of the COPC in the water and sediment at steady-state or equilibiriumconditions.
Figure 4.1: Detail of fate and transport in the aquatic environment (after [1])
Mass Balance Model. Patterson Britton calculated the concentration of chlorate, un-der steady-state conditions, in a 7 km x 7 km area around the mill discharge point [37].
4 CALCULATION OF IMPACT 11
This calculation implements a special case of the US EPA equations when partioning tosediment and suspended solids is assumed to be zero. In this tidally-dominated environ-ment, flux across the boundary is calculated from the flushing time of the area: PattersonBritton used daily flushing of 1% of the water-body volume, equivalent to a flushing timeof 100 days. In our calculation we used a flushing time of 180 days as calculated bySandery [40] which is supported by recent work of GHD presented in Gunns’ response([21] Figure R2) who calculated a flushing time of 190 days.
Dilution Model. A simple dilution model which partitions dioxins between water andsuspended solids (but does not include partitioning to sediment) was used by the US EPAto study the impact of pulp and paper mill effluent discharges on fish tissue concentrations([51] Chapter 7) using data from a 104 pulp and paper mill study [47].
Box Model. The US EPA equations are similar to those used in ‘box models’ at steady-state conditions. An example of such a model was recently used to study dioxin fate andtransport in San Francisco Bay [7]. This model was used to investigate the possible im-pairment by dioxins on commercial and sport fishing, preservation of rare and endangeredspecies, fish spawning, wildlife and estuarine habitat. All of these categories are relevant tothe ecosystem at Five Mile Bluff. The model also included direct atmospheric depositionof dioxins, watershed loading, erosion of buried sediment, dissolved solid partitioning, air-water and air-solid partitioning, degradation, bioaccumulation, and tidal exchange intothe Bay.
Integrated Hydrodynamic Model. The models described above do not integratehydrodynamic modelling with transport of dioxins. A more sophisticated model whichincludes such integration recently assessed the ecological risk posed by dioxins in the TokyoBay estuary [27]. The study used a 3-D chemical fate prediction model (FATE3D—whichtakes into account partitioning of dioxins between water, suspended solids and sediment,and can simulate the diffusion and settling processes) to predict the hydrodynamic trans-port of dioxins within the estuary.
Dispersion of Suspended Solids. Concerns have been raised over the settling time ofsuspended solids. Dioxins/furans are sorbed to the organic carbon fraction of these andtheir dispersion may have a significant impact on the distribution of dioxins in the vicinityof the effluent outfall. Little data is available on the dispersion of suspended solids frompulp mill effluent although there is some evidence, albeit for freshwater environments,that such solids can promote flocculation of natural suspended solids thereby decreasingsettling times ([28],[56]).
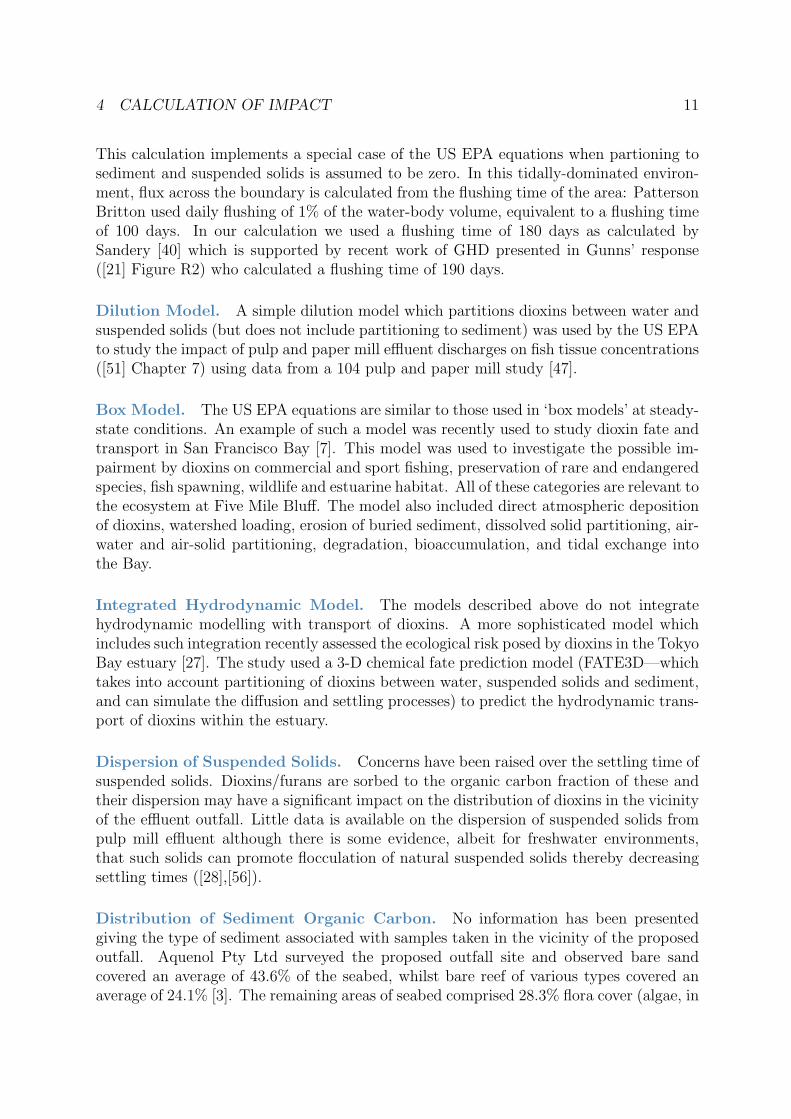
Distribution of Sediment Organic Carbon. No information has been presentedgiving the type of sediment associated with samples taken in the vicinity of the proposedoutfall. Aquenol Pty Ltd surveyed the proposed outfall site and observed bare sandcovered an average of 43.6% of the seabed, whilst bare reef of various types covered anaverage of 24.1% [3]. The remaining areas of seabed comprised 28.3% flora cover (algae, in

4 CALCULATION OF IMPACT 12
addition to the seagrass Zostera tasmanica) and 4.1% faunal cover. These environmentsare expected to have different OC contents and samples should be taken to ensure adequatecoverage of the seabed between Five Mile Bluff and the Tamar Estuary. It is importantthat site coverage is comprehensive: for example, of two sediment samples with sandcontent greater than 96% taken from St Joe Bay, Florida, one had an OC content of 0.6%and the other 5.3%, a factor of 9 different, demonstrating the variability of OC contentwithin the one depositional environment [24].
If a box model is used to calculate dioxin levels, then it would be appropriate to usea multi-compartment model with separate compartments for each seabed/sediment type.
4.2 Screening Studies
The US EPA equations define a steady-state box model for the partitioning of dioxin be-tween the water-column and sediment. This is a simple, screening level model which cal-culates the long-term average exposure concentration in sediment. As the US EPA states:“most multi-media exposure modelling [includes] similar screening level approaches” ([51]Chapter 4). The reliability of such models to predict realistic outcomes increases if MonteCarlo simulation is used to investigate the uncertainty of the prediction with respect tofate and transport parameters. This approach was used in our previous submissions wherewe carried out Monte Carlo simulation of the concentration of dioxin in sediment and fishbased on relevant biota-sediment accumulation factors (BSAFs) and other data providedin publications of the National Dioxins Program ([20],[33]) and, where available, site spe-cific data. No default values based on either USA conditions or freshwater were used, andall parameter ranges were directly related to measured or experimental data [54] and allmeasured data were included in the analysis.
There appears to be a misapprehension that, because our analysis was predicting asignificant impact on fish, particularly for Five Mile Bluff flathead and Australian salmon(Arripus trutta), that our methodology was unreliable ([10] p21). Without clear evidenceas to flaws in the methodology such a conclusion must be considered prejudicial. In anyevent the objective of screening studies is to motivate further investigation.
We demonstrated above in Section 2.3 that there is a large body of evidence suggestingthat pulp mill effluents are still impacting the environment. Existing ECF mills are mainlylocated in areas that were highly polluted during the 1960s to 1980s and which sufferedsignificant biological impoverishment as a result. Arguably the surviving species in theseareas are those that are either tolerant to dioxins, furans and other industrial pollutants, orpossibly uptake resistant to absorption of these materials. More sensitive species simplydied out. Our screening analysis, using local parameters taken from the pristine FiveMile Bluff habitat, demonstrates that there will be a likely impact in the case of dioxincontamination. This is consistent with observed impacts near other pulp mills.
In submissions [53] and [54] we described the inputs to our Monte Carlo analysis.Using the same assumptions, based on recent measured data from the Five Mill Bluffarea, we repeated this analysis using the proposed dioxin concentration limit of 3.4 pgTEQ/l in the mill effluent (which is equal to the estimated actual concentration in themill effluent).
4 CALCULATION OF IMPACT 13
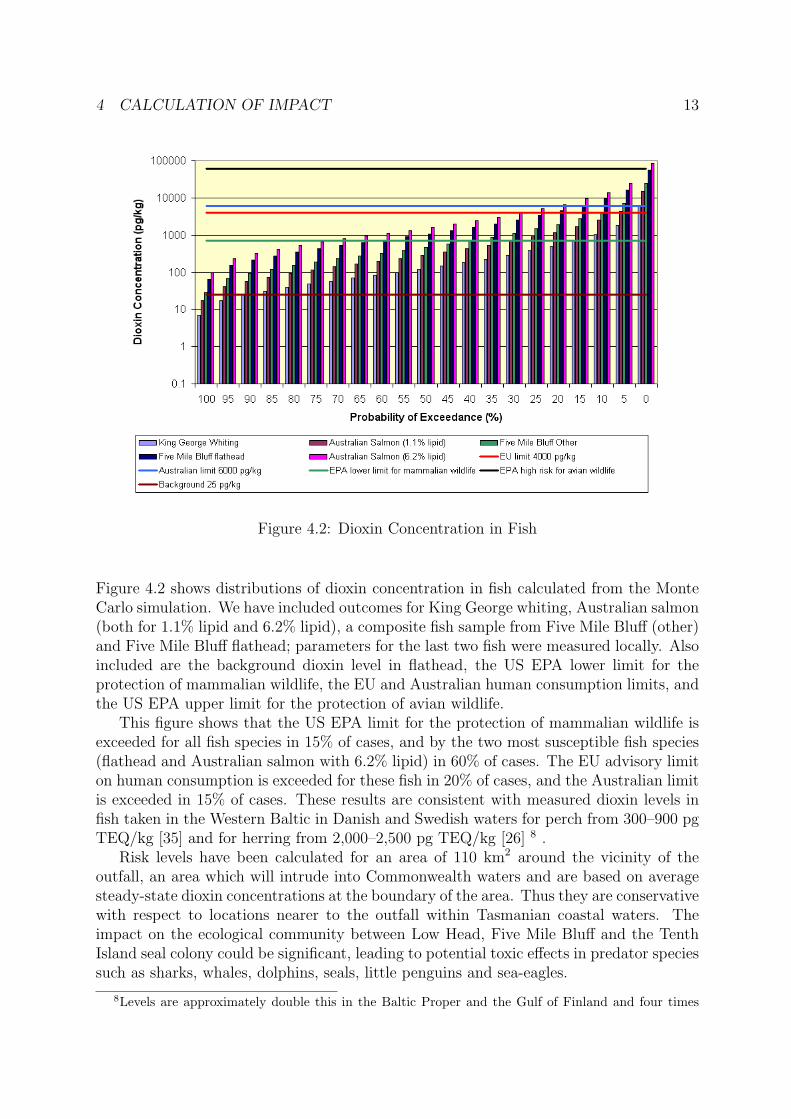
Figure 4.2: Dioxin Concentration in Fish
Figure 4.2 shows distributions of dioxin concentration in fish calculated from the MonteCarlo simulation. We have included outcomes for King George whiting, Australian salmon(both for 1.1% lipid and 6.2% lipid), a composite fish sample from Five Mile Bluff (other)and Five Mile Bluff flathead; parameters for the last two fish were measured locally. Alsoincluded are the background dioxin level in flathead, the US EPA lower limit for theprotection of mammalian wildlife, the EU and Australian human consumption limits, andthe US EPA upper limit for the protection of avian wildlife.
This figure shows that the US EPA limit for the protection of mammalian wildlife isexceeded for all fish species in 15% of cases, and by the two most susceptible fish species(flathead and Australian salmon with 6.2% lipid) in 60% of cases. The EU advisory limiton human consumption is exceeded for these fish in 20% of cases, and the Australian limitis exceeded in 15% of cases. These results are consistent with measured dioxin levels infish taken in the Western Baltic in Danish and Swedish waters for perch from 300–900 pgTEQ/kg [35] and for herring from 2,000–2,500 pg TEQ/kg [26] 8 .
Risk levels have been calculated for an area of 110 km2 around the vicinity of theoutfall, an area which will intrude into Commonwealth waters and are based on averagesteady-state dioxin concentrations at the boundary of the area. Thus they are conservativewith respect to locations nearer to the outfall within Tasmanian coastal waters. Theimpact on the ecological community between Low Head, Five Mile Bluff and the TenthIsland seal colony could be significant, leading to potential toxic effects in predator speciessuch as sharks, whales, dolphins, seals, little penguins and sea-eagles.
8Levels are approximately double this in the Baltic Proper and the Gulf of Finland and four times
4 CALCULATION OF IMPACT 14
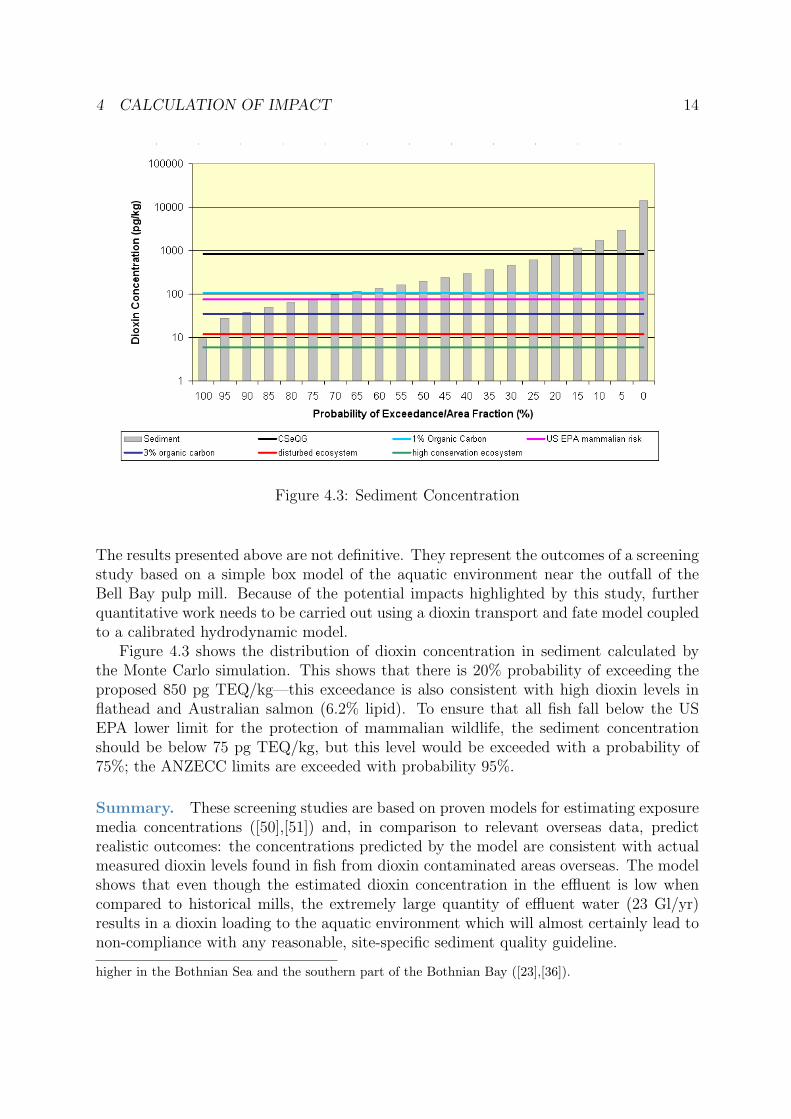
Figure 4.3: Sediment Concentration
The results presented above are not definitive. They represent the outcomes of a screeningstudy based on a simple box model of the aquatic environment near the outfall of theBell Bay pulp mill. Because of the potential impacts highlighted by this study, furtherquantitative work needs to be carried out using a dioxin transport and fate model coupledto a calibrated hydrodynamic model.
Figure 4.3 shows the distribution of dioxin concentration in sediment calculated bythe Monte Carlo simulation. This shows that there is 20% probability of exceeding theproposed 850 pg TEQ/kg—this exceedance is also consistent with high dioxin levels inflathead and Australian salmon (6.2% lipid). To ensure that all fish fall below the USEPA lower limit for the protection of mammalian wildlife, the sediment concentrationshould be below 75 pg TEQ/kg, but this level would be exceeded with a probability of75%; the ANZECC limits are exceeded with probability 95%.
Summary. These screening studies are based on proven models for estimating exposuremedia concentrations ([50],[51]) and, in comparison to relevant overseas data, predictrealistic outcomes: the concentrations predicted by the model are consistent with actualmeasured dioxin levels found in fish from dioxin contaminated areas overseas. The modelshows that even though the estimated dioxin concentration in the effluent is low whencompared to historical mills, the extremely large quantity of effluent water (23 Gl/yr)results in a dioxin loading to the aquatic environment which will almost certainly lead tonon-compliance with any reasonable, site-specific sediment quality guideline.
higher in the Bothnian Sea and the southern part of the Bothnian Bay ([23],[36]).
5 CONCLUSIONS 15
5 Conclusions
The recommendations by the Department with respect to dioxins/furans are not science-based and are not supported by a detailed examination of current regulatory and operatingpractices for ECF mills. Based on the screening studies presented in this submission (andprevious submissions with respect to this project), we find:
1. The recommended limit of 3.4 pg TEQ/l in the mill effluent is too high and is likelyto result in contamination of the coastal environment extending into the Common-wealth marine area.
2. The determination of the recommended effluent limit for dioxins/furans was notbased on relevant scientific principles, did not take into account proper ecotoxico-logical analyses of potential impacts on marine organisms, and relied on an improperunderstanding of current operating practice and regulatory regimes for overseas pulpmills.
3. The recommended limit represents neither ‘world’s best practice’ nor ‘best environ-ment practice’, and is likely to be inconsistent with the principles of the StockholmConvention on Persistent Organic Pollutants.
4. Swedish ECF mills operate at an average dioxin emission of approximately 0.83 pgTEQ/l which could be achieved by the Bell Bay mill using tertiary treatment toremove particulates from the effluent.
5. There is no scientific basis for the proposed SeQG. It is not based on ecotoxicologicalstudies relevant to the marine habitat in the vicinity of the effluent outfall at FiveMile Bluff.
6. The proposed sediment quality guideline of 850 pg TEQ/kg is too high and, ifimplemented, would permit contamination of fish (and, most likely, other benthicorganisms) to the extent that their consumption would pose a risk to mammalianwildlife and humans prior to the guideline (trigger) value being reached.
7. The Department has not properly followed the published methodology for derivingsediment quality guidelines as set out in the National Water Quality ManagementStrategy 2000. The use of Canadian guidelines is inappropriate for local conditions.
5.1 Recommendations
The Preliminary Documentation presented inappropriate and unreliable ecotoxicologicalassessments. In order to overcome these deficiencies we recommend:
1. A fully calibrated hydrodynamic model be built which can be used to predict effluentdispersion over the lifetime of the mill;
6 QUALIFICATION 16
2. A dioxin/furan transport and fate model be integrated with the hydrodynamicmodel in order to accurately predict the concentration of dioxins/furans in thewater column, suspended solids and benthic sediment, in the vicinity of the outfalland into Commonwealth marine waters;
3. Calculated dioxin concentrations be used with an appropriate bioaccumulation model,using site specific parameters, in order to calculate the impact of dioxins/furans onbenthic organisms, fish, mammalian wildlife, avian wildlife and humans;
4. A comprehensive field study be undertaken in order to populate the dioxin/furantransport and bioaccumulation model with appropriate site-specific parameters in-cluding, but not limited to:
• distribution of sediment type and organic carbon;
• tranport of suspended solids including potential for flocculation;
• sediment transport, dispersion and reworking;
• toxic impact of pulp mill effluent on benthic organisms including bivalves,molluscs and other benthic flora and fauna;
• biota-sediment accumulation and bio-accumulation factors at each trophic level.
6 Qualification
Professor Andrew Wadsley PhD, MSc, Bsc(Hons). Professor Wadsley received a BSc(Hons) and University Medal in Mathematics from the Australian National University in1970, an MSc from the University of Warwick (UK) in 1972, and a PhD (Mathematics)from the University of Warwick (UK) in 1974. He has more that thirty years in thepetroleum and steel industries, starting as a well-site petroleum engineer with Shell Inter-national in 1975. Professor Wadsley is a Principal of Australian Risk Audit, Director ofExploration and Production Consultants (Australia) Pty Ltd which he founded in 1988,Chairman of Optimiser Pty Ltd, a Western Australia based Digital Management Com-pany, and adjunct associate Professor in Petroleum Engineering at the Curtin Universityof Technology. He is a member of the Society of Petroleum Engineers and the Society forIndustrial and Applied Mathematics.
Professor Wadsley has extensive experience in the auditing of major resource projectsincluding two recent carbon-dioxide sequestration projects in Australia, numerous oil andgas field developments both locally and internationally, and is also an expert in the mer-cury contamination of natural gas. He has been Umpire and Expert Witness for disputeresolution within the oil and gas industry. He is an expert in the numerical modellingof multi-phase transport processes and is the author of six commercially available soft-ware programs. A recent submission by Australian Risk Audit on Gunns’ referral underthe EPBC Act was undertaken independently; a previous submission to the RPDC wascommissioned by the Tasmanian Greens.
7 REFERENCES 17
7 References
[1] AEA Technology, Environmental Transport and Fate of Dioxins and the Modellingof these Processes, Report produced for European Commission DG EnvironmentUK Department of the Environment, Transport and the Regions, October 1999.
[2] ANZECC, Australia and New Zealand Guidelines for Fresh and Marine Water Qual-ity, Australian and New Zealand Environment and Conservation Council, 2000.
[3] Aquenal Pty Ltd, Marine Biological and Pollutant Survey at the Proposed Mill Site,June 2005. Volume 11, Appendix 24, of Draft IIS.
http://www.gunnspulpmill.com.au/iis/V11/V11 A24.pdf
[4] Beca-AMEC, Review of ECF and TCF bleaching processes and specific issues raisedin the WWF report on Arauco, Valdivia, Prepared at the request of Resource Plan-ning and Development Commission, Tasmania, Ref. 2531950.200, May 2006.
http://www.rpdc.tas.gov.au/ data/assets/word doc/0009/66294/Beca Study Report ECF TCF.doc
[5] Bergqvist, P-A., Tysklind, M., Marklund, S., Aberg, A., Sundqvist, K., Naslund,M., Rosen, I., Tsytsik, P., Malmstrom, H. and Cato., I., Kartlaggning avutslappskallor for oavsiktligt bildade amnen: PCDD/F,PCB och HCB. Instutionenfor Miljokemi, Umea Universitet, 2005.
http://www.chem.umu.se/dep/envichem/forskning/publikationer/rapporter/NV%20kartl%E4ggning%20report%2020050317b.pdf
[6] Brewer, R., Sylvestre, S., Sekela, M. and Tuominen, T., Sediment Quality inthe Fraser River Basin, Aquatic and Atmospheric Sciences Division, EnvironmentCanada, Vancouver, B.C., (undated).
[7] Connor, M., Yee, D., Davis, J. and Werme, C., Dioxins in San Francisco Bay, SanFrancisco Bay Institute, November 2004.
[8] DEH, Inventory of Dioxin Emissions in Australia, National Dioxins Program, Tech-nical Report No. 3, Department of Environment and Heritage, Commonwealth ofAustralia, 2004.
[9] Department of Environmental Protection, Dioxin Monitoring Program,DEPLW0754-2006, State of Maine, April 2006.
[10] DEWR, Recommendation Report prepared for EPBC Project 2007/3385 under Sec-tion 95C of the Environment Protection and Conservation Biodiversity Act 1999,Gunns Pulp Paper Mill, Department of the Environment and Water Resources,August 2007.
[11] DEWR, Factors that Informed the Proposed Pulp Mill Decision and Draft Condi-tions, Department of the Environment and Water Resources, August 2007.
7 REFERENCES 18
[12] Duplisea, D.E., Benthic organism biomass size-spectra in the Baltic Sea in relationto the sediment environment, Limnology and Oceanography, Vol 45, No 3, 2000.
[13] Dwernychuk, W.. and McCubbin, N., Re: Final Cumulative Impact Study for theUruguay Pulp Mills, Evaluation of the Expert Panel, Hatfield Consultants, preparedfor International Finance Corporation, October 2006
[14] Environment Canada, Dioxin/Furan Levels an indicator of toxic contaminants incoastal BC, accessed August 2007.
http://www.ecoinfo.org/env ind/region/dioxinfuran/dioxin e.cfm
[15] Environment Canada, 2001 Annual Compliance Report Summary Highlights Pacificand Yukon Region, accessed August 2007.
http://www.pyr.ec.gc.ca/enforcement/01sumhigh e.htm
[16] Environment Canada, The National Environmental Effects Monitoring Office.
http://www.ec.gc.ca/eem/english/default.cfm
[17] Environment Canada, Canadian Sediment Quality Guidelines, Dioxins and Furans,March 2005.
http://www.ec.gc.ca/ceqg-rcqe/English/Html/GAAG DioxinsFuransSediment e.cfm
[18] Environment Canada, Canadian Sediment Quality Guidelines, Nonylphenol and itsEthoxylates, March 2005.
http://www.ec.gc.ca/ceqg-rcqe/English/Html/GAAG NPE SEQG.cfm
[19] EPB, Review of the Marine Impact Assessment of effluent from the proposed BellBay Pulp Mill, Environment Protection Branch, Department of the Environmentand Water Resources, 2007.
http://www.environment.gov.au/epbc/notices/assessments/2007/3385/pubs/att-b5.pdf
[20] Gatehouse, R., Ecological Risk Assessment of Dioxins in Australia, Technical ReportNo. 11, National Dioxins Program, Department of the Environment and Heritage,Commonwealth of Australia, May 2004.
[21] GHD, Hydrodynamic Modelling, Gunns Pulp Mill EIS, Report, 41/14443/324372,GHD, March, 2006. (Vol 18 App 63 Draft IIS)
[22] Gunns Limited, Bell Bay Pulp Mill Project, Response to Submissions under theEnvironment Protection and Biodiversity Act 1999, July 2007. Appendix B.
[23] Helsinki Commission, Dioxins in the Baltic Sea, Baltic Marine Environment Pro-tection Commission, 2004.
[24] Hemming, J.M., Brim, M.S. and Jarvis, R.B., Survey of Dioxin and Furan Com-pounds in Sediments of Florida Panhandle Bay Systems, U.S. Fish and WildlifeService, 2002.
7 REFERENCES 19
[25] Jaakko Poyry Pty Ltd, “Roger NSI.Emissions.November.05.New.” Referenced byToxikos Consulting as prepared by Jaakko Poyry Oy and sent by Gunns Ltd 18November 2005. ([41] Table A1.4)
[26] Jensen, A.A., Kortlægning af dioxinforurening samt kilder til dioxinforurening iØstersøen, Miljøprojekt Nr. 796, Miljøstyrelsen, 2003.
[27] Kobayashi, N., Nakata,K., Eriguchi, T., Horiguchi, F., Nakanishi, J. and Masunaga,S., Application of a mathermatical model to predict dioxin concentrations in theTokyo Bay estuary, Organohalogen Compounds, Vol 66, 2004.
[28] Krishnappan, B.G. and Lawrence, G., The Interaction of Pulp Mill Discharges withthe Fraser River and its Sediments, National Water Research Institute, EnvironmentCanada, (not dated).
[29] Levy, V., Water Quality Assessment Report for Bell Bay Pulp Mill Draft IIS, Jan-uary 2007.
http://www.gunnspulpmill.com.au/iis/supp/veronique levy ews.pdf
[30] Lowell, R.B, Ring, B., Pastershank, G., Walker, S., Trudel, L. and Hedley, K.,National Assessment of Pulp and Paper Environmental Effects Monitoring Data:Findings from Cycles 1 through 3, NWRI Scientific Assessment Report Series No.5, Environment Canada, 2005.
[31] Macdonald, R.W., Ikonomou, M.G. and Paton, D.W., Historical Inputs of PCDDs,PCDFs, and PCBs to a British Columbia Interior Lake: The Effect of Environmen-tal Controls on Pulp Mill Emissions, Environmental Science and Technology, Vol32, 1998.
[32] Marvin, C., Williams, D., Kuntz, K., Klawunn, P., Backus, S., Kolic, T., Lucaciu,C., MacPherson, K. and Reiner, E., Temporal trends in polychlorinated dibenzo-p-dioxins and dibenzofurans, dioxin-like PCBs, and polybrominated diphenyl ethers inNiagara river suspended sediments, Chemosphere, Vol 67, Issue 9, April 2007.
[33] Muller J., Muller R., Goudkamp K. and Mortimer, M., Dioxins in Aquatic Environ-ments in Australia, Technical Report No. 6, National Dioxins Program, Departmentof the Environment and Heritage, Commonwealth of Australia, May 2004.
[34] NSWFA, Dioxins in Seafood in Port Jackson and its Tributaries, Report of theExpert Panel, NSW Food Authority, February 2006.
[35] Olsson, M., Asplund, L., Bignert, A., De Wit, C. and Haglund, P., High Concen-trations of Dioxins and other Contaminants outside Swedish Cellulose IndustriesIndicate Ongoing Pollution, Organohalogen Compounds, Vol 67, 2005.
[36] Pandelova, M., Henkelmann, B., Roots, O., Simm, M., Benfenati, E. and Schramm,K-W., Levels of PCDD/F in Baltic Fish in Different Age Groups, OrganohalogenCompounds Vol 68 (2006)
7 REFERENCES 20
[37] Patterson Britton and Partners Pty Ltd, Review of Documents Re: HydrodynamicModelling of Effluent from Proposed Offshore Effluent Outfall for Gunns Pulp Mill,Tasmania, 30 March 2007.
http://www.justice.tas.gov.au/ data/assets/pdf file/0018/82251/RFI 30 - Paterson.pdf
[38] Peer Review Comments on “Technical Support Document of Detection and Quan-titation Regulations under the Clean Water Act”, September 2002.
www.acil-mdl.org/documents/OW-2003-0003-0024.pdf
[39] RFU, Pulp Info Centre, Reach for Unbleached Foundation, accessed August 2007.
http://www.rfu.org/cacw/basic.html
[40] Sandery P.A., Towards an understanding of the flushing of Bass Strait, 2005.
http://aipcongress2005.anu.edu.au/Sandery PA AIP AMOS CD1.pdf
[41] Toxicos Pty Ltd, Marine Impact Assessment - Bell Bay Pulp Mill Effluent, ReportTR101006-RJF, 23 January 2007.
http://www.gunnspulpmill.com.au/iis/supp/roger drew att 2.pdf
[42] Toxikos Consultants, Response on submission citing dioxin calculation concerns,TR170607-RJF, 4 July 2007.
http://www.gunnspulpmill.com.au/epbc/Appendix%20A.pdf
[43] Toxicos Pty Ltd, Comment on Bell Bay effluent and potential impact on nearby sealcolonies, Report TC300106-JF, 7 July 2006. Volume 10, Appendix 23 of Draft IIS.
http://www.gunnspulpmill.com.au/iis/V10/V10 A23.pdf
[44] Toxicos Pty Ltd, Erratum 15th September 2006, Toxicos Human Health Risk As-sessment, Report TE250806-RJF1, 15 September 2006.
http://www.gunnspulpmill.com.au/iis/Erratum%203rd%20August%202006.pdf
[45] Toxicos Pty Ltd, Expert witness statement of Dr Roger Drew, Expert of GunnsLimited, 30 January 2007.
http://www.gunnspulpmill.com.au/iis/supp/roger drew ews inc att 1 for marine section.pdf
[46] Tunnicliffe, V., A Fine-Scale Record of 130 Years of Organic Carbon Deposition inan Anoxic Fjord, Saanich Inlet, British Columbia, Limnology and Oceanography,Vol 45, No. 6 2000.
[47] US EPA, USEPA/Paper Industry Cooperative Dioxin Study ”The 104 Mill Study”Summary Report and USEPA/Paper Industry Cooperative Dioxin Study ”The 104Mill Study” Statistical Findings and Analyses, Office of Water Regulations andStandards, July 1990.
[48] US EPA, Final Report: Pulp, Paper, and Paperboard Detailed Study, U.S. Environ-mental Protection Agency, EPA-821-R-06-016, November 2006.
7 REFERENCES 21
[49] US EPA, Update to EPA/600/6-90/003, 7-44, EPA/600/R-98/137, 1998.
[50] US EPA, Estimating Media Concentrations, Chapter 5, Health Risk AssessmentProtocol, Office of Solid Waste, September 2005.
http://www.epa.gov/epaoswer/hazwaste/combust/finalmact/ssra/05hhrap5.pdf
[51] US EPA, Exposure and Human Health Reassessment of 2,3,6,7-Tetrachlorodibenzo-p-Dioxin (TCDD) and Related Compounds, preliminary draft document, December2003.
[52] Vikelsøe, J., Hovmand, M.F., Andersen, H.V., Bossi1, R., Johansen, E. and Chrille-sen, M-A., Dioxin in the Atmosphere of Denmark, The Danish Dioxin MonitoringProgramme II, NERI Technical Report No. 565, March 2006.
[53] Wadsley, A.W., A Review of the Impact of Dioxin Accumulation: Gunns’ DraftIntegrated Impact Statement, Australian Risk Audit, June 2007.
http://tasmaniantimes.com/images/uploads/Review Impact of Dioxin Accumulation.pdf
[54] Wadsley, A.W., A Reply to Gunns Limited: Response to Submissions, Appendix A—Response on submission citing dioxin calculation concerns, Australian Risk Audit,July 2007.
[55] Wadsley, A.W., Submission Gunns Limited Bell Bay Pulp Mill Proposal, ReferralNotice No. 2007/3385, 5 June 2007.
[56] Yang, X. and Smith, D.W., Pulp Mill Effluent Induced Coagulation and Flocculationin Receiving Waters, Western Student Workshop, University of Alberta, Ocotber1998.

APPENDIX II – Detailed discussion, reference material and further comments in relation to the hydrodynamic modelling
An electronic version of this appendix can be found at http://www.cleantamar.com.au/pulp_mill_analysis.html
COMMENTS ON THE PROVISIONAL DETERMINATION REGARDING CONTROLLED ACTION NO. 2007/3385 – APPENDIX II
J. Stuart Godfrey, 31 August 2007
Most readers will be aware that on 16th August 2007 I sent a letter to Mr. Turnbull, Federal Minister for the Environment, detailing various inadequacies in the hydrodynamic work carried out by Gunns, in support of their proposal to build a Pulp Mill. The main document I sent to Mr. Turnbull follows; it is also found on www.cleantamar.com.au.
The events of the past few weeks regarding Gunns Pulp Mill have caused Dr. Warwick Raverty, Professor Andrew Wadsley and myself to come together to share our different perspectives on the likely environmental impacts, should the Mill be approved. In light of what I have learned from Raverty and Wadsley, I would like to briefly add to my previous document.
Wadsley’s “screening” model provides information on likely environmental impacts on a nominal box, 110 km2 in size, exposed to the proposed dioxin inflows from the Pulp Mill. I believe it will be a fairly straightforward matter to combine the insights of Raverty and Wadsley with my own, by “coupling” a simple model of the bottom sediments to the hydrodynamic model that is developed to test the hypotheses I raised. This is very desirable, because Wadsley needs to make an arbitrary choice of his region of interest. In principle, this modelling could allow one to provide a moderately accurate estimate of how the region of water contaminated by dioxin-laden sediments increases in size and changes in location, over the lifetime of the Mill. In particular, it should allow useful answers to such questions as: Will dioxins enter the Tamar, or Commonwealth waters? If so, how fast will their concentrations increase with time?
Wadsley (Appendix I of this submission) refers to a hydrodynamic modelling study of toxicants in Tokyo Bay. Similar coupled sediment-water column work has been performed by Australian researchers, in a study of nutrient loading in Port Philip Bay (Modelling of nutrient impacts in Port Phillip Bay — a semi-enclosed marine Australian ecosystem; A.G. Murray and J. S. Parslow, 1999; Marine and Freshwater Research, 50(6) 597 - 612). Similar studies have been performed for Australia’s Northwest Shelf.
For present purposes, I will assume that Dr. Jim Peacock, Australia’s Chief Scientist, will commission a competent group of hydrodynamic modellers to perform a much more thorough study than the one performed by Gunns. The following notes are written under pressure of time, and can only form a “first guess” into the nature of the modelling problem. I also note that in the few weeks before Mr. Turnbull must make his decision, it is most unlikely that a satisfyingly thorough modelling job can be done. Nevertheless, it worth outlining the task that should be done, to optimise use of the time that is available.
If this hydrodynamic model were run using forcing data for (say) one year, and if the ocean currents, temperatures and salinities it generated were saved every two hours to resolve tidal as well as wind-driven currents, then this data set can be used to perform

quite realistic estimates of how dioxins will move in time and space, by repeating the sequence of currents year after year for (say) fifty years and advecting dioxin-laden carbon particles with it.
Most of the dioxin-laden carbon particles settle slowly to the bottom (though some float to the surface, to participate in the oil-spill-like movements of the “logarithmic layer”, see below). The settling of particles will gradually build intense dioxin concentrations near the bottom. As in the US EPA “screening” model that Wadsley used, a small fraction of this dioxin – governed by a “partition coefficient” -- can redissolve into the water and be advected by the currents in the same way that the direct output from the diffuser is advected. In due course, this secondary source will become at least as important as the direct input from the diffuser. It will also settle back again, but since it has already moved from the diffuser it can now move further afield; so the polluted area will increase with time. Qualitatively the fact that the Bass Strait “flushing time” is quite long -- about 180 days (e.g. Sandery P.A., Towards an understanding of the flushing of Bass Strait, 2005.
http://aipcongress2005.anu.edu.au/Sandery PA AIP AMOS CD1.pdf ) – suggests that much of the dioxin may initially settle in a quite small area surrounding the outfall, and thus build to dangerous levels in only a few years. However, such issues are best left to be determined by a well-designed model.
The details of how polluted regions develop will be critically dependent on the choice of settling velocities. Gunns have a small amount of information on this issue: see section 6.11, page 24, of "Expert witness statement of Ross Macallister Fryar Expert of Gunns Limited" where the settling rate in 25m of water is estimated as “between 5 and 80 days”. Such information would need checking, and if possible replacement by more precise values.
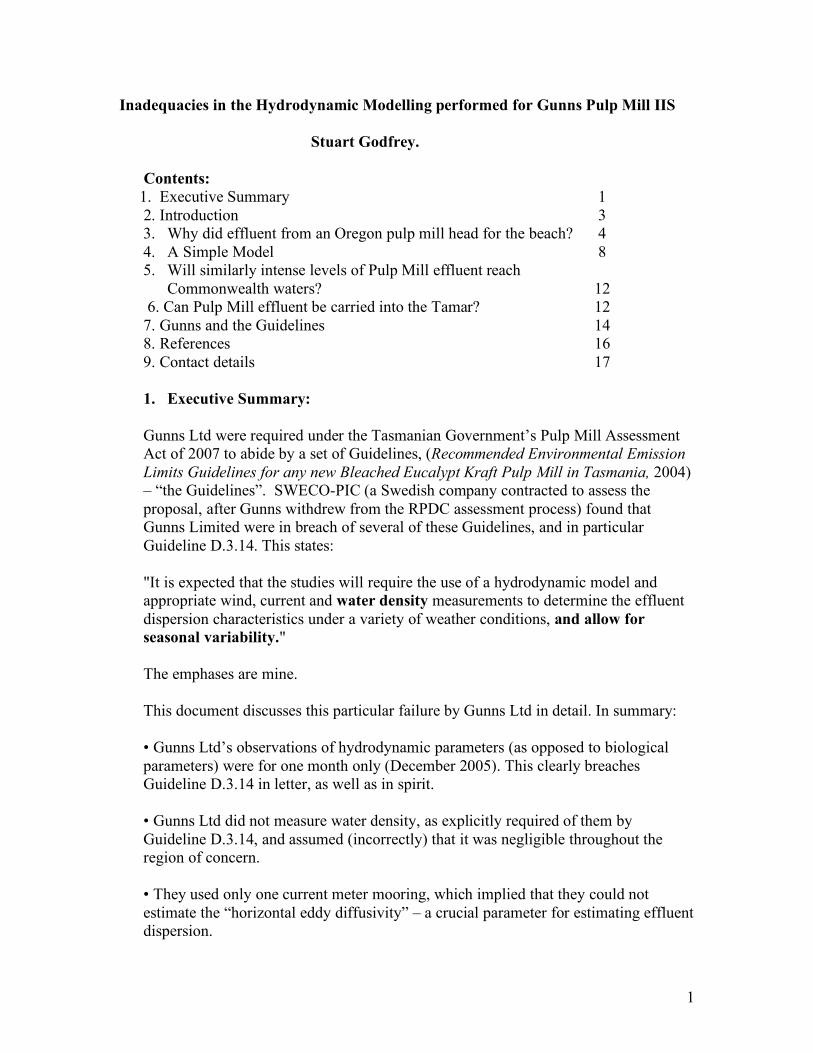
1
Inadequacies in the Hydrodynamic Modelling performed for Gunns Pulp Mill IIS
Stuart Godfrey. Contents: 1. Executive Summary 1 2. Introduction 3
3. Why did effluent from an Oregon pulp mill head for the beach? 4 4. A Simple Model 8 5. Will similarly intense levels of Pulp Mill effluent reach
Commonwealth waters? 12 6. Can Pulp Mill effluent be carried into the Tamar? 12 7. Gunns and the Guidelines 14 8. References 16 9. Contact details 17
1. Executive Summary: Gunns Ltd were required under the Tasmanian Government’s Pulp Mill Assessment Act of 2007 to abide by a set of Guidelines, (Recommended Environmental Emission Limits Guidelines for any new Bleached Eucalypt Kraft Pulp Mill in Tasmania, 2004) – “the Guidelines”. SWECO-PIC (a Swedish company contracted to assess the proposal, after Gunns withdrew from the RPDC assessment process) found that Gunns Limited were in breach of several of these Guidelines, and in particular Guideline D.3.14. This states: "It is expected that the studies will require the use of a hydrodynamic model and appropriate wind, current and water density measurements to determine the effluent dispersion characteristics under a variety of weather conditions, and allow for seasonal variability." The emphases are mine. This document discusses this particular failure by Gunns Ltd in detail. In summary: • Gunns Ltd’s observations of hydrodynamic parameters (as opposed to biological parameters) were for one month only (December 2005). This clearly breaches Guideline D.3.14 in letter, as well as in spirit. • Gunns Ltd did not measure water density, as explicitly required of them by Guideline D.3.14, and assumed (incorrectly) that it was negligible throughout the region of concern. • They used only one current meter mooring, which implied that they could not estimate the “horizontal eddy diffusivity” – a crucial parameter for estimating effluent dispersion.
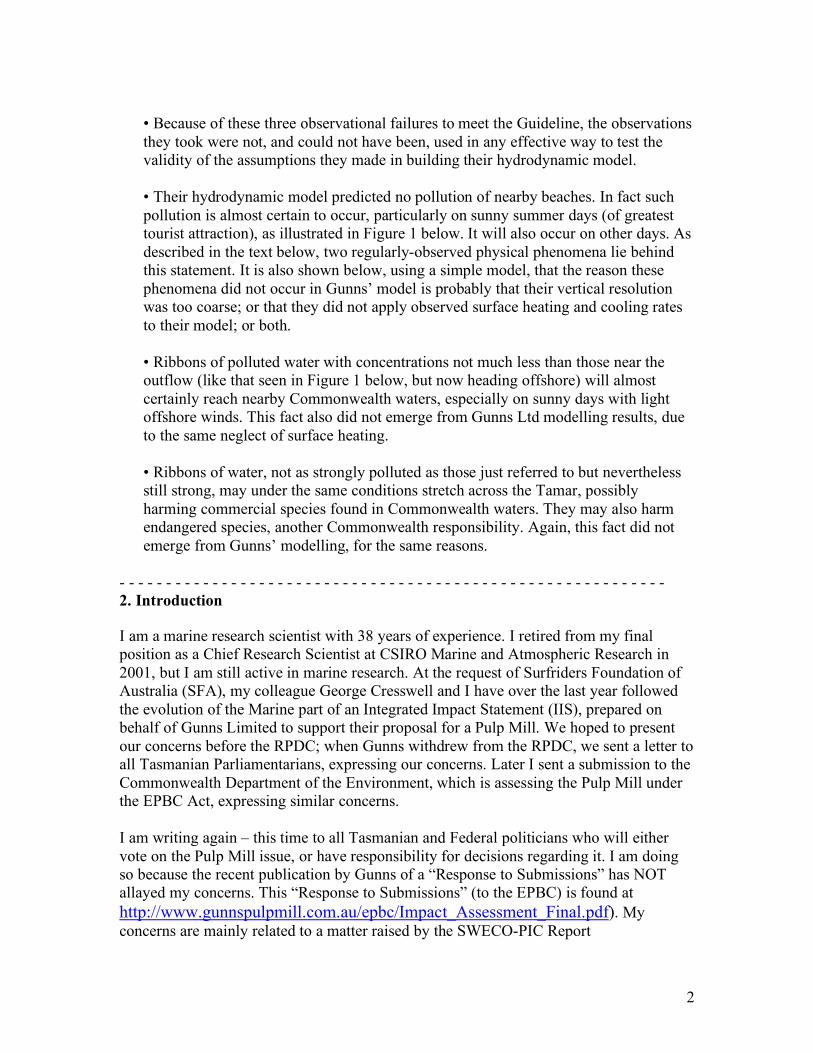
2
• Because of these three observational failures to meet the Guideline, the observations they took were not, and could not have been, used in any effective way to test the validity of the assumptions they made in building their hydrodynamic model. • Their hydrodynamic model predicted no pollution of nearby beaches. In fact such pollution is almost certain to occur, particularly on sunny summer days (of greatest tourist attraction), as illustrated in Figure 1 below. It will also occur on other days. As described in the text below, two regularly-observed physical phenomena lie behind this statement. It is also shown below, using a simple model, that the reason these phenomena did not occur in Gunns’ model is probably that their vertical resolution was too coarse; or that they did not apply observed surface heating and cooling rates to their model; or both. • Ribbons of polluted water with concentrations not much less than those near the outflow (like that seen in Figure 1 below, but now heading offshore) will almost certainly reach nearby Commonwealth waters, especially on sunny days with light offshore winds. This fact also did not emerge from Gunns Ltd modelling results, due to the same neglect of surface heating. • Ribbons of water, not as strongly polluted as those just referred to but nevertheless still strong, may under the same conditions stretch across the Tamar, possibly harming commercial species found in Commonwealth waters. They may also harm endangered species, another Commonwealth responsibility. Again, this fact did not emerge from Gunns’ modelling, for the same reasons.
- - - - - - - - - - - - - - - - - - - - - - - - - - - - - - - - - - - - - - - - - - - - - - - - - - - - - - - - - - - 2. Introduction I am a marine research scientist with 38 years of experience. I retired from my final position as a Chief Research Scientist at CSIRO Marine and Atmospheric Research in 2001, but I am still active in marine research. At the request of Surfriders Foundation of Australia (SFA), my colleague George Cresswell and I have over the last year followed the evolution of the Marine part of an Integrated Impact Statement (IIS), prepared on behalf of Gunns Limited to support their proposal for a Pulp Mill. We hoped to present our concerns before the RPDC; when Gunns withdrew from the RPDC, we sent a letter to all Tasmanian Parliamentarians, expressing our concerns. Later I sent a submission to the Commonwealth Department of the Environment, which is assessing the Pulp Mill under the EPBC Act, expressing similar concerns. I am writing again – this time to all Tasmanian and Federal politicians who will either vote on the Pulp Mill issue, or have responsibility for decisions regarding it. I am doing so because the recent publication by Gunns of a “Response to Submissions” has NOT allayed my concerns. This “Response to Submissions” (to the EPBC) is found at http://www.gunnspulpmill.com.au/epbc/Impact_Assessment_Final.pdf). My concerns are mainly related to a matter raised by the SWECO-PIC Report
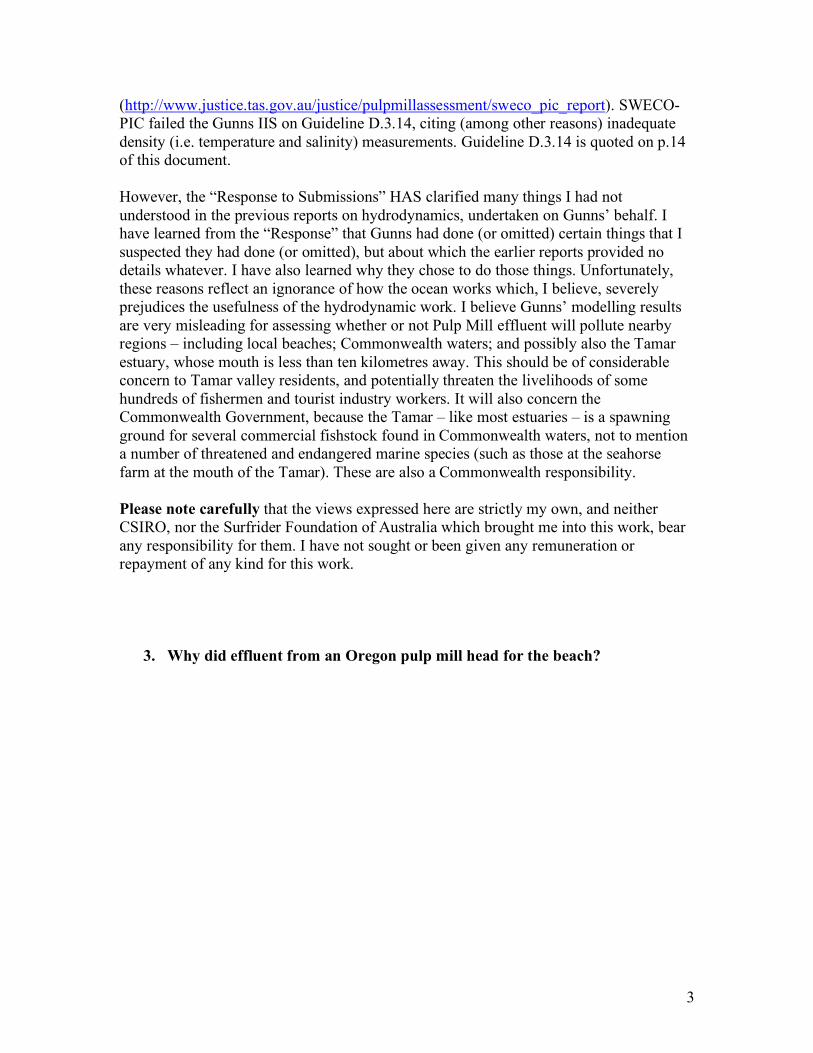
3
(http://www.justice.tas.gov.au/justice/pulpmillassessment/sweco_pic_report). SWECO-PIC failed the Gunns IIS on Guideline D.3.14, citing (among other reasons) inadequate density (i.e. temperature and salinity) measurements. Guideline D.3.14 is quoted on p.14 of this document. However, the “Response to Submissions” HAS clarified many things I had not understood in the previous reports on hydrodynamics, undertaken on Gunns’ behalf. I have learned from the “Response” that Gunns had done (or omitted) certain things that I suspected they had done (or omitted), but about which the earlier reports provided no details whatever. I have also learned why they chose to do those things. Unfortunately, these reasons reflect an ignorance of how the ocean works which, I believe, severely prejudices the usefulness of the hydrodynamic work. I believe Gunns’ modelling results are very misleading for assessing whether or not Pulp Mill effluent will pollute nearby regions – including local beaches; Commonwealth waters; and possibly also the Tamar estuary, whose mouth is less than ten kilometres away. This should be of considerable concern to Tamar valley residents, and potentially threaten the livelihoods of some hundreds of fishermen and tourist industry workers. It will also concern the Commonwealth Government, because the Tamar – like most estuaries – is a spawning ground for several commercial fishstock found in Commonwealth waters, not to mention a number of threatened and endangered marine species (such as those at the seahorse farm at the mouth of the Tamar). These are also a Commonwealth responsibility. Please note carefully that the views expressed here are strictly my own, and neither CSIRO, nor the Surfrider Foundation of Australia which brought me into this work, bear any responsibility for them. I have not sought or been given any remuneration or repayment of any kind for this work.
3. Why did effluent from an Oregon pulp mill head for the beach?
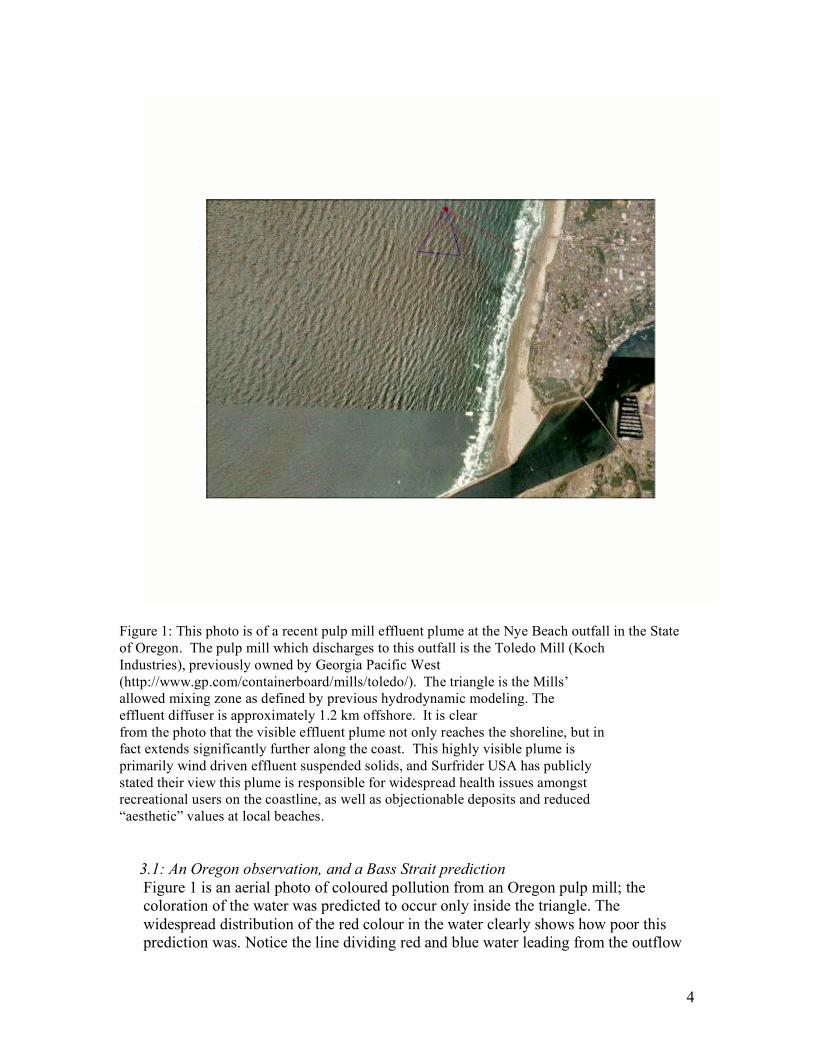
4
Figure 1: This photo is of a recent pulp mill effluent plume at the Nye Beach outfall in the State of Oregon. The pulp mill which discharges to this outfall is the Toledo Mill (Koch Industries), previously owned by Georgia Pacific West (http://www.gp.com/containerboard/mills/toledo/). The triangle is the Mills’ allowed mixing zone as defined by previous hydrodynamic modeling. The effluent diffuser is approximately 1.2 km offshore. It is clear from the photo that the visible effluent plume not only reaches the shoreline, but in fact extends significantly further along the coast. This highly visible plume is primarily wind driven effluent suspended solids, and Surfrider USA has publicly stated their view this plume is responsible for widespread health issues amongst recreational users on the coastline, as well as objectionable deposits and reduced “aesthetic” values at local beaches. 3.1: An Oregon observation, and a Bass Strait prediction
Figure 1 is an aerial photo of coloured pollution from an Oregon pulp mill; the coloration of the water was predicted to occur only inside the triangle. The widespread distribution of the red colour in the water clearly shows how poor this prediction was. Notice the line dividing red and blue water leading from the outflow
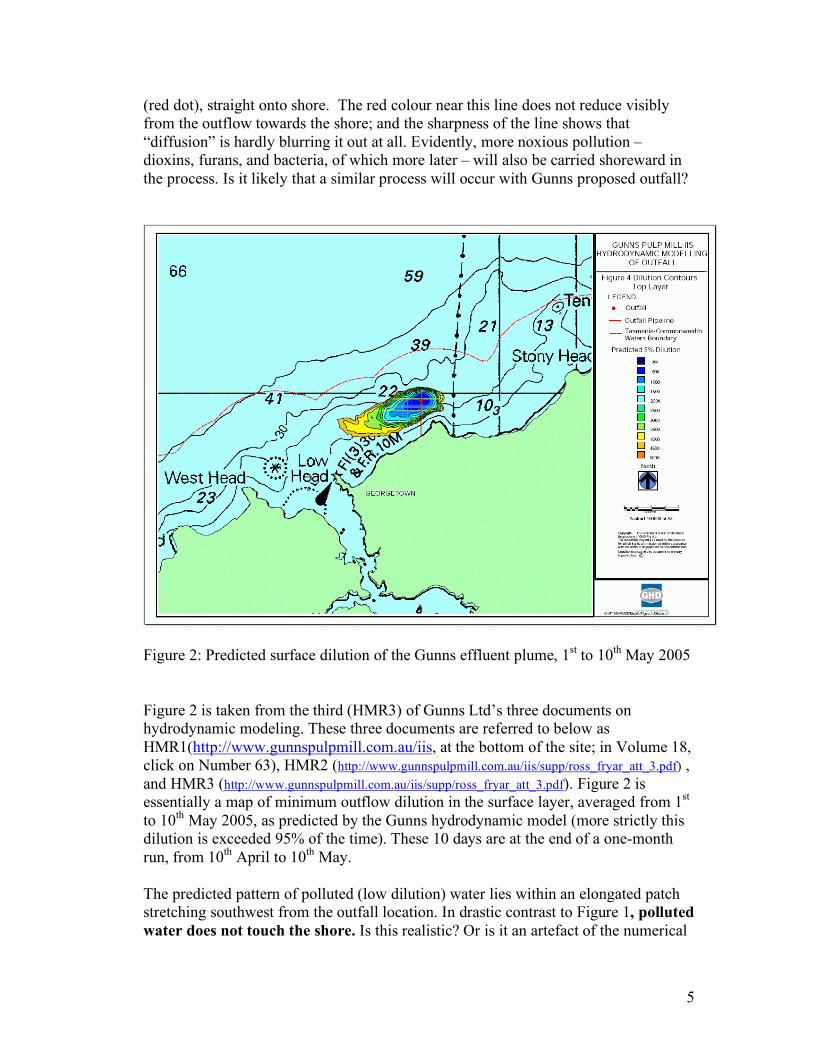
5
(red dot), straight onto shore. The red colour near this line does not reduce visibly from the outflow towards the shore; and the sharpness of the line shows that “diffusion” is hardly blurring it out at all. Evidently, more noxious pollution – dioxins, furans, and bacteria, of which more later – will also be carried shoreward in the process. Is it likely that a similar process will occur with Gunns proposed outfall?
Figure 2: Predicted surface dilution of the Gunns effluent plume, 1st to 10th May 2005
Figure 2 is taken from the third (HMR3) of Gunns Ltd’s three documents on hydrodynamic modeling. These three documents are referred to below as HMR1(http://www.gunnspulpmill.com.au/iis, at the bottom of the site; in Volume 18, click on Number 63), HMR2 (http://www.gunnspulpmill.com.au/iis/supp/ross_fryar_att_3.pdf) , and HMR3 (http://www.gunnspulpmill.com.au/iis/supp/ross_fryar_att_3.pdf). Figure 2 is essentially a map of minimum outflow dilution in the surface layer, averaged from 1st to 10th May 2005, as predicted by the Gunns hydrodynamic model (more strictly this dilution is exceeded 95% of the time). These 10 days are at the end of a one-month run, from 10th April to 10th May. The predicted pattern of polluted (low dilution) water lies within an elongated patch stretching southwest from the outfall location. In drastic contrast to Figure 1, polluted water does not touch the shore. Is this realistic? Or is it an artefact of the numerical
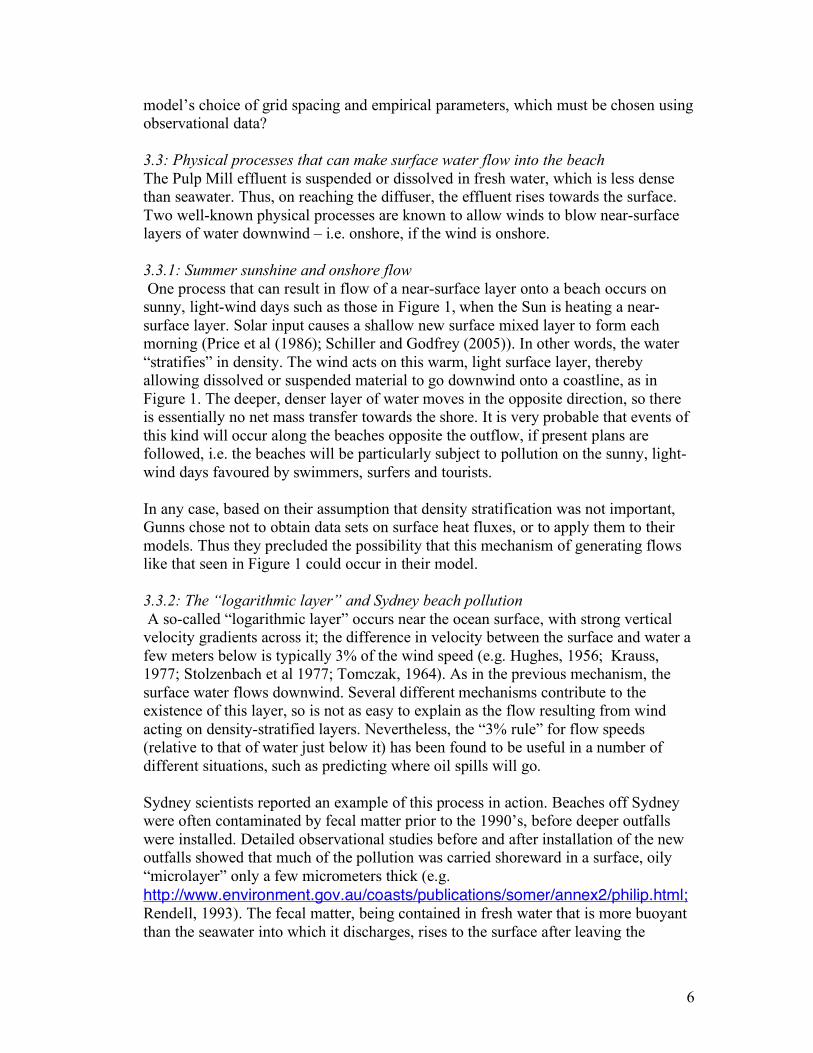
6
model’s choice of grid spacing and empirical parameters, which must be chosen using observational data?
3.3: Physical processes that can make surface water flow into the beach The Pulp Mill effluent is suspended or dissolved in fresh water, which is less dense than seawater. Thus, on reaching the diffuser, the effluent rises towards the surface. Two well-known physical processes are known to allow winds to blow near-surface layers of water downwind – i.e. onshore, if the wind is onshore. 3.3.1: Summer sunshine and onshore flow One process that can result in flow of a near-surface layer onto a beach occurs on sunny, light-wind days such as those in Figure 1, when the Sun is heating a near-surface layer. Solar input causes a shallow new surface mixed layer to form each morning (Price et al (1986); Schiller and Godfrey (2005)). In other words, the water “stratifies” in density. The wind acts on this warm, light surface layer, thereby allowing dissolved or suspended material to go downwind onto a coastline, as in Figure 1. The deeper, denser layer of water moves in the opposite direction, so there is essentially no net mass transfer towards the shore. It is very probable that events of this kind will occur along the beaches opposite the outflow, if present plans are followed, i.e. the beaches will be particularly subject to pollution on the sunny, light-wind days favoured by swimmers, surfers and tourists. In any case, based on their assumption that density stratification was not important, Gunns chose not to obtain data sets on surface heat fluxes, or to apply them to their models. Thus they precluded the possibility that this mechanism of generating flows like that seen in Figure 1 could occur in their model. 3.3.2: The “logarithmic layer” and Sydney beach pollution A so-called “logarithmic layer” occurs near the ocean surface, with strong vertical velocity gradients across it; the difference in velocity between the surface and water a few meters below is typically 3% of the wind speed (e.g. Hughes, 1956; Krauss, 1977; Stolzenbach et al 1977; Tomczak, 1964). As in the previous mechanism, the surface water flows downwind. Several different mechanisms contribute to the existence of this layer, so is not as easy to explain as the flow resulting from wind acting on density-stratified layers. Nevertheless, the “3% rule” for flow speeds (relative to that of water just below it) has been found to be useful in a number of different situations, such as predicting where oil spills will go. Sydney scientists reported an example of this process in action. Beaches off Sydney were often contaminated by fecal matter prior to the 1990’s, before deeper outfalls were installed. Detailed observational studies before and after installation of the new outfalls showed that much of the pollution was carried shoreward in a surface, oily “microlayer” only a few micrometers thick (e.g. http://www.environment.gov.au/coasts/publications/somer/annex2/philip.html; Rendell, 1993). The fecal matter, being contained in fresh water that is more buoyant than the seawater into which it discharges, rises to the surface after leaving the

7
outfall. There is nearly always a thin layer of oil on the ocean surface, which they called the “microlayer”; the fecal matter attaches itself to it (if it has not already attached itself to oil as it flows down the outfall pipe). The Sydney scientists found that the “3% of the wind speed” rule described the movement of this material quite well. For example, a gentle, 3m/sec wind can move such a layer at 10 cm/sec, or nearly 10 kilometers per day. Depending on the wind direction, simple calculations based on Figure 2 shows that for Gunns proposed outfall, this will bring it onto the beach, or into Commonwealth waters (seaward of the dashed red line), in hours. Easterly winds can move an effluent plume into the Tamar mouth in less than a day. In stronger winds, the same phenomenon occurs, but now the “microlayer” is concentrated in thin foam lines, aligned parallel to the wind direction – the “windrows” (or “Langmuir circulation”) familiar to any observer of an estuary on windy days. In light or strong winds, this foamy material accumulates on the beach, where (if it is toxic) it will harm intertidal biota – and humans. Figure 1 may also be an example of this process in action. 3.4: What Gunns say on these issues in their “Response to Submissions” In the “Response”, (p. 156) Gunns note that the effluent diffuser in Figure 1 is 1.2 km offshore, compared to 2 km from the nearest land in the case of Gunn’s proposed diffuser; but they do not comment on the statement that the “effluent flow rate used by the company… was half that of the proposed flow rate of the Gunns Pulp Mill” (Surfrider Foundation proposal to RPDC; #302 of public submissions, on www.rpdc.tas.gov.au, under “Gunns Pulp Mill”). “Response” also blames the coloration on “the presence of the City of Portland’s sewage outfall near the same location”; yet it is quite clear that the front between blue and red water in Figure 1 emanates exactly from the outfall location, the red dot in the picture. Gunns “Response to Submissions” says: “the discharged effluent plume is frequently trapped due to stratification (off Portland), the latter is generally absent from the Five Mile Bluff diffuser site”. They quote no reference to support this statement. This is equivalent to saying Five Mile Bluff is somehow exempt from the sunny days found elsewhere in the world!
The only comment within “Response to Submissions” on the “oily microlayer” issue raised above is to say (p. 129): “In GHD’s experience, the assessment of Langmuir circulation and Stokes Drift is not standard practice, and is not part of the capability of any commercially available, validated model software.” One can ask: if Gunns Ltd consultants believed this, why did they not simply say in their report that these effects could be important, but had been neglected? However, as will be discussed in the next section, it is in fact possible to model this effect moderately well simply by using a higher vertical resolution than was used by Gunns, especially close to the surface.
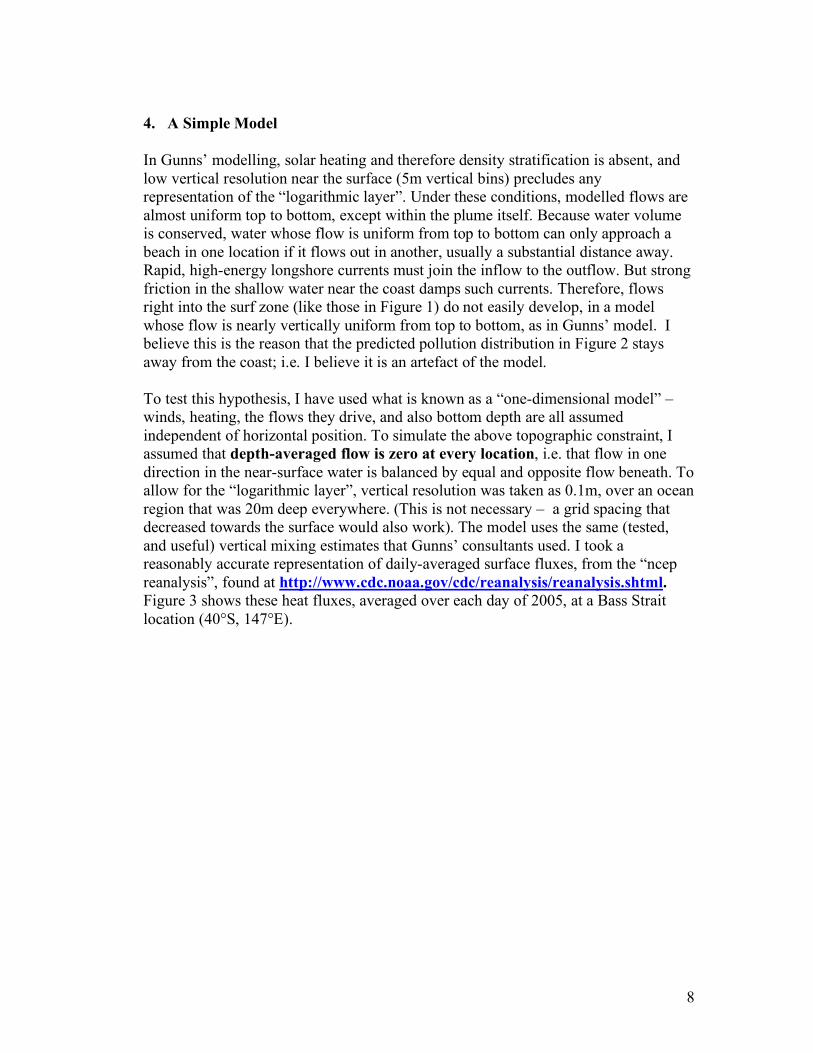
8
4. A Simple Model
In Gunns’ modelling, solar heating and therefore density stratification is absent, and low vertical resolution near the surface (5m vertical bins) precludes any representation of the “logarithmic layer”. Under these conditions, modelled flows are almost uniform top to bottom, except within the plume itself. Because water volume is conserved, water whose flow is uniform from top to bottom can only approach a beach in one location if it flows out in another, usually a substantial distance away. Rapid, high-energy longshore currents must join the inflow to the outflow. But strong friction in the shallow water near the coast damps such currents. Therefore, flows right into the surf zone (like those in Figure 1) do not easily develop, in a model whose flow is nearly vertically uniform from top to bottom, as in Gunns’ model. I believe this is the reason that the predicted pollution distribution in Figure 2 stays away from the coast; i.e. I believe it is an artefact of the model. To test this hypothesis, I have used what is known as a “one-dimensional model” – winds, heating, the flows they drive, and also bottom depth are all assumed independent of horizontal position. To simulate the above topographic constraint, I assumed that depth-averaged flow is zero at every location, i.e. that flow in one direction in the near-surface water is balanced by equal and opposite flow beneath. To allow for the “logarithmic layer”, vertical resolution was taken as 0.1m, over an ocean region that was 20m deep everywhere. (This is not necessary – a grid spacing that decreased towards the surface would also work). The model uses the same (tested, and useful) vertical mixing estimates that Gunns’ consultants used. I took a reasonably accurate representation of daily-averaged surface fluxes, from the “ncep reanalysis”, found at http://www.cdc.noaa.gov/cdc/reanalysis/reanalysis.shtml. Figure 3 shows these heat fluxes, averaged over each day of 2005, at a Bass Strait location (40°S, 147°E).

9
Figure 3: Daily mean heat losses from the water, for 2005, in Watts per square meter of water near 40°S, 147°E . Details of the lines are in the text. The lines in Figure 3 show daily mean heat loss from the water. The Sun adds heat to the water, which is why heat loss from the Sun (black line) is shown as negative. The other three contributions to the net heat loss are net thermal radiation out of Bass Strait (red line); evaporative heat loss (green); and “sensible” heat loss (blue). The sum of all four shows a net heat input to Bass Strait of roughly 100 watts/m2 (about half the solar input) in midsummer, and heat loss of 100 watts/m2 in midwinter, with large day-to-day variations – the greatest heat losses occur on windy days (mainly by the evaporative heat loss that cools you rapidly, if you stand in a wind when your body is wet). Hourly heat exchanges were estimated from Figure 3 as follows: to roughly represent the hourly sunshine, cloudiness is assumed constant through a given day. Sunshine is then zero except between dawn and dusk, and follows a curve of known smooth shape through the day; the magnitude of this curve is adjusted so that the daily average of the result equals the value for that day from Figure 3. Other heat flux components are held constant at their daily average through the day.
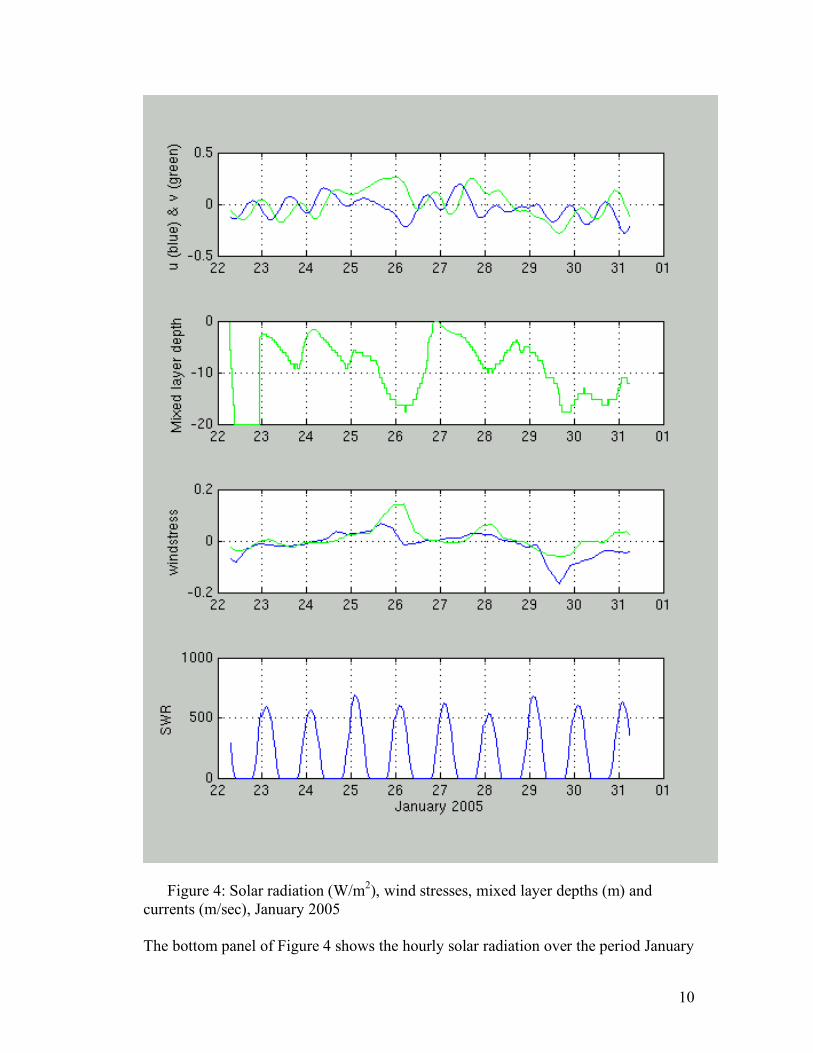
10
Figure 4: Solar radiation (W/m2), wind stresses, mixed layer depths (m) and currents (m/sec), January 2005 The bottom panel of Figure 4 shows the hourly solar radiation over the period January
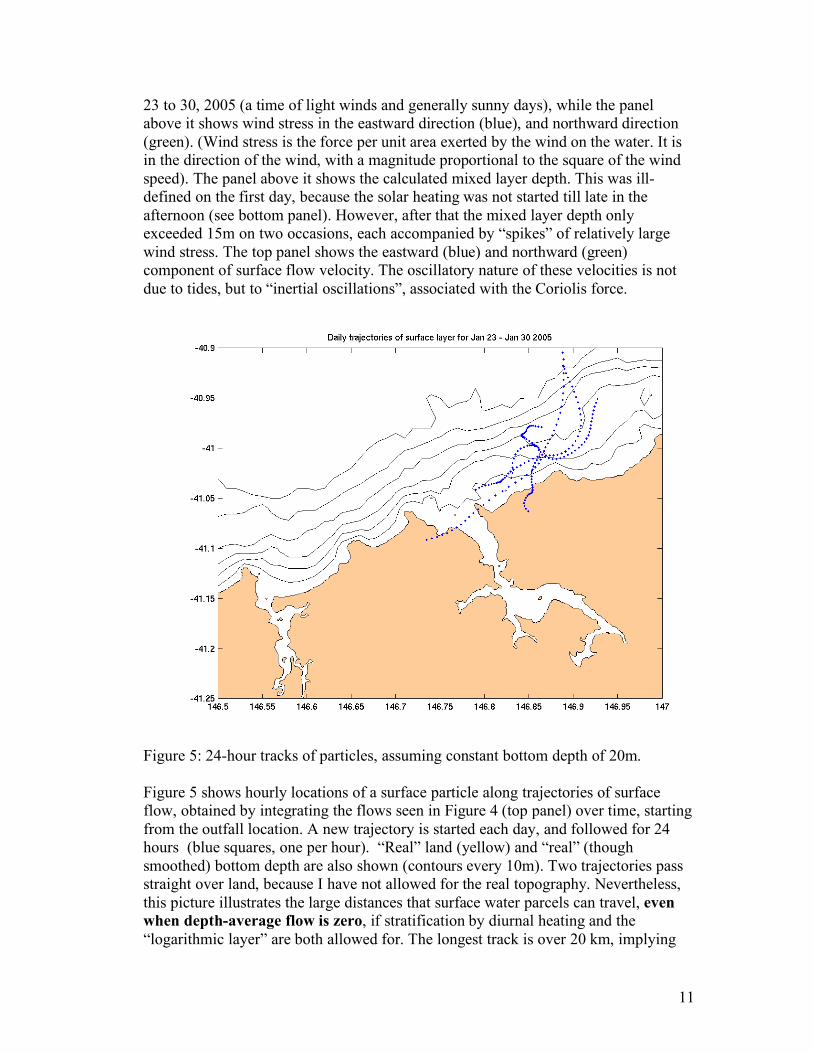
11
23 to 30, 2005 (a time of light winds and generally sunny days), while the panel above it shows wind stress in the eastward direction (blue), and northward direction (green). (Wind stress is the force per unit area exerted by the wind on the water. It is in the direction of the wind, with a magnitude proportional to the square of the wind speed). The panel above it shows the calculated mixed layer depth. This was ill-defined on the first day, because the solar heating was not started till late in the afternoon (see bottom panel). However, after that the mixed layer depth only exceeded 15m on two occasions, each accompanied by “spikes” of relatively large wind stress. The top panel shows the eastward (blue) and northward (green) component of surface flow velocity. The oscillatory nature of these velocities is not due to tides, but to “inertial oscillations”, associated with the Coriolis force.
Figure 5: 24-hour tracks of particles, assuming constant bottom depth of 20m. Figure 5 shows hourly locations of a surface particle along trajectories of surface flow, obtained by integrating the flows seen in Figure 4 (top panel) over time, starting from the outfall location. A new trajectory is started each day, and followed for 24 hours (blue squares, one per hour). “Real” land (yellow) and “real” (though smoothed) bottom depth are also shown (contours every 10m). Two trajectories pass straight over land, because I have not allowed for the real topography. Nevertheless, this picture illustrates the large distances that surface water parcels can travel, even when depth-average flow is zero, if stratification by diurnal heating and the “logarithmic layer” are both allowed for. The longest track is over 20 km, implying
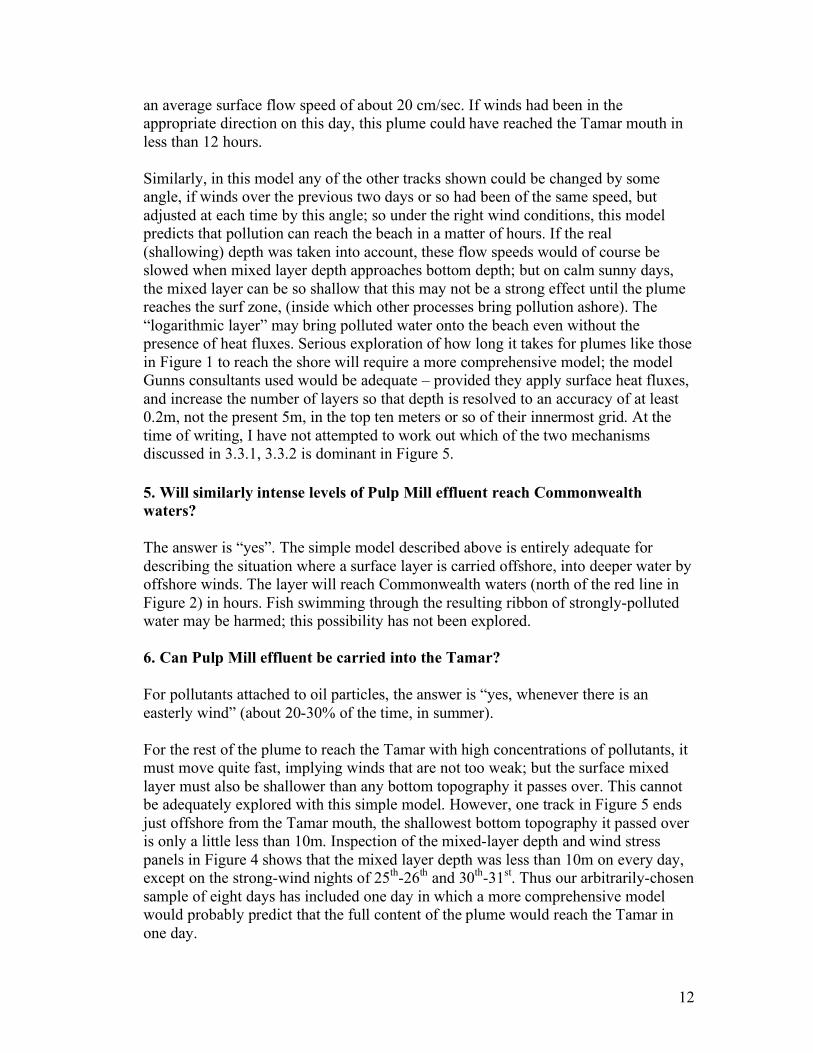
12
an average surface flow speed of about 20 cm/sec. If winds had been in the appropriate direction on this day, this plume could have reached the Tamar mouth in less than 12 hours. Similarly, in this model any of the other tracks shown could be changed by some angle, if winds over the previous two days or so had been of the same speed, but adjusted at each time by this angle; so under the right wind conditions, this model predicts that pollution can reach the beach in a matter of hours. If the real (shallowing) depth was taken into account, these flow speeds would of course be slowed when mixed layer depth approaches bottom depth; but on calm sunny days, the mixed layer can be so shallow that this may not be a strong effect until the plume reaches the surf zone, (inside which other processes bring pollution ashore). The “logarithmic layer” may bring polluted water onto the beach even without the presence of heat fluxes. Serious exploration of how long it takes for plumes like those in Figure 1 to reach the shore will require a more comprehensive model; the model Gunns consultants used would be adequate – provided they apply surface heat fluxes, and increase the number of layers so that depth is resolved to an accuracy of at least 0.2m, not the present 5m, in the top ten meters or so of their innermost grid. At the time of writing, I have not attempted to work out which of the two mechanisms discussed in 3.3.1, 3.3.2 is dominant in Figure 5.
5. Will similarly intense levels of Pulp Mill effluent reach Commonwealth waters? The answer is “yes”. The simple model described above is entirely adequate for describing the situation where a surface layer is carried offshore, into deeper water by offshore winds. The layer will reach Commonwealth waters (north of the red line in Figure 2) in hours. Fish swimming through the resulting ribbon of strongly-polluted water may be harmed; this possibility has not been explored. 6. Can Pulp Mill effluent be carried into the Tamar? For pollutants attached to oil particles, the answer is “yes, whenever there is an easterly wind” (about 20-30% of the time, in summer). For the rest of the plume to reach the Tamar with high concentrations of pollutants, it must move quite fast, implying winds that are not too weak; but the surface mixed layer must also be shallower than any bottom topography it passes over. This cannot be adequately explored with this simple model. However, one track in Figure 5 ends just offshore from the Tamar mouth, the shallowest bottom topography it passed over is only a little less than 10m. Inspection of the mixed-layer depth and wind stress panels in Figure 4 shows that the mixed layer depth was less than 10m on every day, except on the strong-wind nights of 25th-26th and 30th-31st. Thus our arbitrarily-chosen sample of eight days has included one day in which a more comprehensive model would probably predict that the full content of the plume would reach the Tamar in one day.
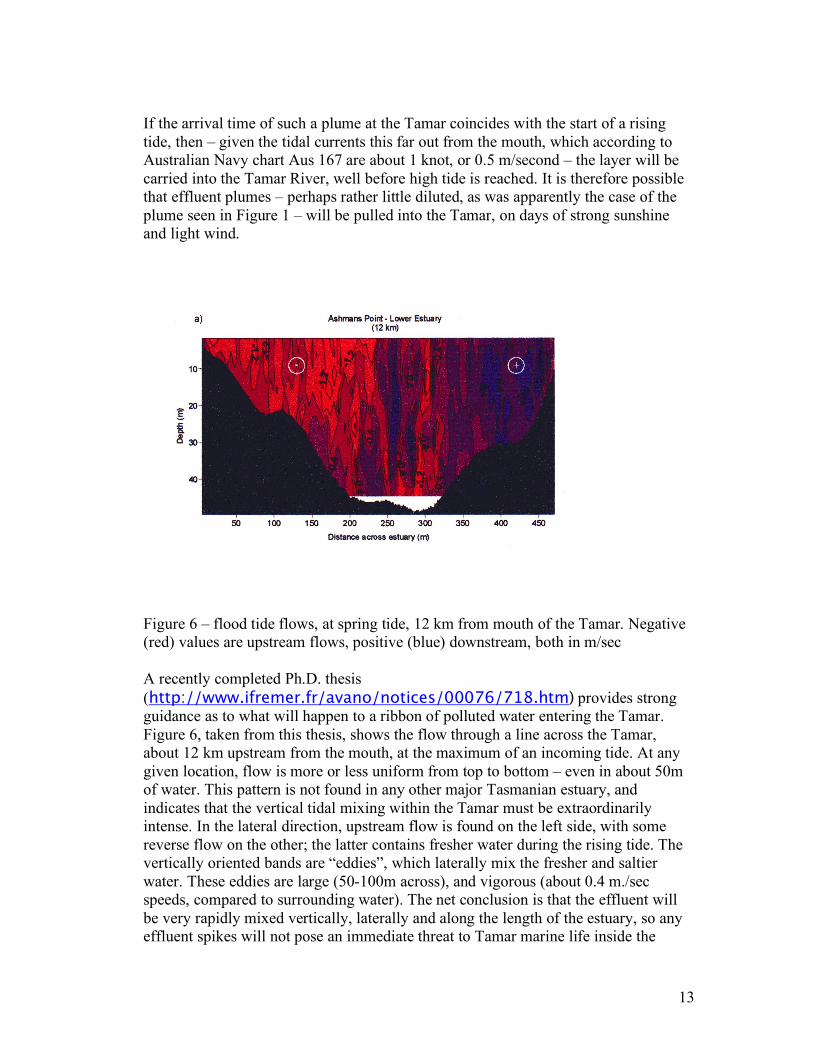
13
If the arrival time of such a plume at the Tamar coincides with the start of a rising tide, then – given the tidal currents this far out from the mouth, which according to Australian Navy chart Aus 167 are about 1 knot, or 0.5 m/second – the layer will be carried into the Tamar River, well before high tide is reached. It is therefore possible that effluent plumes – perhaps rather little diluted, as was apparently the case of the plume seen in Figure 1 – will be pulled into the Tamar, on days of strong sunshine and light wind.
Figure 6 – flood tide flows, at spring tide, 12 km from mouth of the Tamar. Negative (red) values are upstream flows, positive (blue) downstream, both in m/sec A recently completed Ph.D. thesis (http://www.ifremer.fr/avano/notices/00076/718.htm) provides strong guidance as to what will happen to a ribbon of polluted water entering the Tamar. Figure 6, taken from this thesis, shows the flow through a line across the Tamar, about 12 km upstream from the mouth, at the maximum of an incoming tide. At any given location, flow is more or less uniform from top to bottom – even in about 50m of water. This pattern is not found in any other major Tasmanian estuary, and indicates that the vertical tidal mixing within the Tamar must be extraordinarily intense. In the lateral direction, upstream flow is found on the left side, with some reverse flow on the other; the latter contains fresher water during the rising tide. The vertically oriented bands are “eddies”, which laterally mix the fresher and saltier water. These eddies are large (50-100m across), and vigorous (about 0.4 m./sec speeds, compared to surrounding water). The net conclusion is that the effluent will be very rapidly mixed vertically, laterally and along the length of the estuary, so any effluent spikes will not pose an immediate threat to Tamar marine life inside the

14
estuary. However, there are two matters of concern here, which were not addressed in the RPDC or EPBC processes: •It is a well-established rule that for conservative, dissolved pollutants, the pollution of water at a location inside an estuary by a source at its mouth will (on average over the estuary’s flushing time, about a week in the case of the Tamar) equal the pollutant concentration at its mouth, times the ratio of salinity at the location of interest to the salinity at the mouth (Dyer 1977, p. 115). Thus a week of exposure to high concentrations of effluents in the mouth of the Tamar will result in similar concentrations inside the estuary, for a substantial distance upstream. • The cumulative character of pollution by dioxins is well-known: the possibility needs to be assessed that the level of pollution can accumulate to damaging values in Tamar bottom sediments, over the multi-decade lifetime of the proposed Mill. • Fish or larvae entering or leaving the estuary on such days may pass through polluted waters, and be exposed to quite high effluent levels for several hours at a time.
7. Gunns and the Guidelines
It is clear from the foregoing that density stratification and the near-surface “logarithmic layer” can both make a major differences to flow behaviour, and therefore to the fate of pollutants. Seasonality is also important, because density stratification occurs only in the warmer months.
In preparing for their assessment by the RPDC, Gunns Ltd was required to follow a set of Guidelines compiled by Tasmanian Government public servants. SWECO-PIC found that they had breached three guidelines, relating to their hydrodynamic work. Only one of these is relevant to the discussion here, namely Guideline D.3.14, which states:
"It is expected that the studies will require the use of a hydrodynamic model and appropriate wind, current and water density measurements to determine the effluent dispersion characteristics under a variety of weather conditions, and allow for seasonal variability."
The emphasis on density observations, and allowance for seasonality, are mine.
In presenting their work, the appropriate approach for Gunns would have been to start by stating the relevant Guidelines. This would have required them to give a qualitative description of what factors they thought would influence the dispersal of their effluent, and to formulate a plan of observation and modelling – and to justify that plan in terms of the Guidelines.
15
Gunns Ltd did not do this in any of the 3 volumes of their Hydrodynamic Modelling Report. What they did do was: •They confined observations near the outfall site to one period only, (December 2005; p.21-22, HMR1). There were no observations of temperature and salinity, which control water density. They admit that stratification can occur in light wind conditions, but they assume it to be minimal, "in line with the conservative conceptual approach adopted for the study" (as we have seen, their neglect of stratification is in fact the exact opposite of a conservative assumption). Therefore they did not apply surface heat fluxes. • Their single current measuring instrument could not take measurements in the near-surface, or “logarithmic” layer. Thus they could not test for the existence of rapid downwind velocities within this layer. (The existence of this layer is not mentioned in the Hydrodynamic Reports, because it is “not usual commercial practice”). As already noted, their coarse vertical resolution implies an assumption that this layer is unimportant.
• They performed modelling runs for April 2005 and for 15th November –1st January 2006. They describe how well the model simulates observed tides (simple models can do this well, but this is only marginally relevant to the issue of effluent dispersion); but make they made no effort to use their observations of currents to validate their choice of mixing parameters such as “eddy diffusivity” (the hard, and relevant, part). The work that should have been done is illustrated by using Figure 6 (flow in the Tamar) as an example. The vertically-oriented bands of stronger or weaker flows, compared to neighbouring water are “eddies”; at ebb/flood tide water at the sides is fresher/saltier than that in the middle, and these eddies control the strength of the mixing process. The key parameter is the “eddy diffusivity”, which is the product of the width across the eddy and the flow velocity within it, relative to neighbouring fluid. Inspection of the figure suggests an eddy diameter of about 50m, and a velocity relative to neighbouring fluid of 0.4 m/sec, giving the very large diffusivity value of 20 m2/sec (at this location, and time). The value of “lateral eddy diffusivity” near the effluent outfall site has been a matter of major contention in the RPDC and EPBC processes. For example, Patterson and Britton, (http://www.justice.tas.gov.au/justice/pulpmillassessment/sweco_pic_report, under Hydrodynamic Review Memo) find that the value of the “lateral diffusivity” used in Gunns modelling is probably much too high, resulting in faster mixing and dilution of the effluent than will actually occur. It will certainly be very much smaller in the quiet waters near Gunns proposed outfall (typical tidal flows 0.1m/sec) than in the Tamar at spring tide (1.2 m/sec); its amplitude depends on tidal flow speeds (which are known), and the effect of local bottom topographic details in creating inhomogeneities in the tidal flows (which is not). Gunns used a value of 10 m2/sec in their first modelling report, and they compare results obtained with values of 5 m2/sec and 10 m2/sec in their “Response to Submissions”.

16
The observations in Figure 6 were obtained by towing an instrument called an “Acoustic Doppler Current Profiler” across the Tamar; such tows across the neighbourhood of the outfall site would have been the most efficient way to measure the eddy diffusivity. Gunns’ Limited current observations were also made with an ADCP. However, they only deployed it at a fixed location, rather than towing it to measure eddies; so their data were completely inadequate to validate their chosen value of eddy diffusivity. Thus for the intended practical purpose of predicting dispersal of pollution, Gunns’ Ltd entire Hydrodynamic Modelling Report – all three volumes of it – is a pure modelling exercise, completely unsubstantiated by observation. Gunns Limited may say, as they did of Langmuir circulation, that measuring eddy diffusivities “is not standard (commercial) practice”. I do not know if this is so, but I doubt very much that most commercial firms lag so far behind current “world’s best practice” among research institutions as Gunns’ consultants have done.
8. References:
Dyer, K.R., 1973. Estuaries: A Physical Introduction. John Wiley and Sons, 140 pp. Hughes, P., 1956. A determination of the relation between wind and sea-surface drift, Q. J. Roy. Met. Soc., Vol. 82, 494-502. Krauss, E.B., 1977. Ocean surface drift velocities, J. Phys. Ocean., Vol. 7, 606-609. Price J.F., R.A. Weller and R. Pinkel, (1986). Diurnal cycling: Observations and models of the upper ocean response to diurnal heating, cooling and wind mixing. J. Geophysical Research, 91, pp 8411-8427. Rendell, P. (1993). Sydney Deepwater Outfalls Environmental Monitoring Program Pre-Commissioning Phase: Volume 8-Microlayer, EPA, Sydney. SWECO PIC Report: http://www.justice.tas.gov.au/justice/pulpmillassessment/sweco_pic_report Schiller, A. and J. S. Godfrey, (2005). A diagnostic model of the diurnal cycle of sea surface temperature for use in coupled ocean-atmosphere models. J. Geophys Res. 110, C11014, doi:10.1029/2005JC002975 Stolzenbach, K.D., Madsen, O.S., Adams, E.E., Pollack, A.M. and Cooper, C.K., 1977. A review and evaluation of basic techniques for predicting the behaviour of surface oil slicks, Ralph M. Parson Laboratory, Dept. of Civil Engineering,

17
Massachusetts Institute of Technology, Report No. 222. Tomczak, G. 1964. Investigations with drift cards to determine the influence of the wind on surface currents, Ozeanographie, Vol. 10, 129-139. 9. Contact details: email [email protected]