commerce spectrum management advisory committee (csmac ... · commerce spectrum management advisory...
TRANSCRIPT
1
Commerce Spectrum Management Advisory Committee (CSMAC) Working Group 5 (WG 5)
1755-1850 MHz Airborne Operations Sub-Working Group Report
(Small Unmanned Aircraft Systems)
Final Report
1. Introduction
The Commerce Spectrum Management Advisory Committee (CSMAC) Working Group structure was created to “explore ways to lower the repurposing1 costs and/or improve or facilitate industry access while protecting federal operations from adverse impact.” Working Group 5 (WG-5) was specifically tasked with studying issues related to airborne operations in the 1755-1850 MHz band. Within WG-5, Sub-Working Group Small Unmanned Aircraft Systems (SWG-5 SUAS) was created to focus on issues related to Small Unmanned Aircraft Systems operating in the band. Pursuant to the working group structure provided by NTIA the expected focus of work for WG-5 would be the (1) determination of protection requirements for federal operations, and (2) understanding of the periodic nature and the potential impact (e.g., interference) to commercial wireless of government airborne operations.
Based on this guidance, SWG SUAS met on a biweekly basis, or as necessary, to develop a common understanding between government and industry regarding the operations and protection requirements for SUAS and to agree and execute on an approach for analyzing the potential for interference both to and from SUAS and commercial Long Term Evolution (LTE) operations. It was expected that the results of this analysis will form the basis for a recommendation on the feasibility of sharing the use of this band (i.e., spectrum sharing) and on additional steps that should be taken, or areas for further analysis, to facilitate or enhance sharing if it is determined that sharing appears feasible.
Work was initiated based on information in the NTIA’s “Assessment of the Viability of Accommodating Wireless Broadband in the 1755-1850 MHz Band” (March 2012) report. Significant additional work was accomplished by Government representatives to review the government operations and ensure that the areas of operation and channel assignments are accurate. The SUAS SWG also used information developed in a Technical Working Group (TWG) created as part of WG-1 to provide accurate information on LTE parameters. Finally, SWG SUAS was also assisted by WG-5 TWG to consider technical issues related to interference analysis. SWG SUAS enjoyed broad participation from a range of government and industry representatives and the work provides a foundation to evaluate the potential for band sharing between SUAS and LTE Systems.
1 Repurposing the 1755-1850 MHz band from US government to commercial allocation.
2
1.1 Executive Summary of Findings
During the initial meetings between industry and the Department of Defense (DOD), industry representatives requested the following information about each SUAS system: (1) the frequency assignment; and (2) the location of the assignment. Because of security regulations, DOD could not publicly release this information and make it available to industry members (Paragraph 2.3 infra). As a result, SWG SUAS cannot make any finding on the feasibility of spectrum sharing between Federal and commercial wireless systems.
Because DOD could not publicly release information to industry members, SWG SUAS conducted an analysis of co-channel operations to explore separation distances between SUAS and commercial wireless operations. SWG SUAS initiated analysis on two specific work plans. These focused on identifying the required protection distances for: (1) LTE user equipment2 (UEs) to SUAS and (2) SUAS to LTE Base Stations. The analysis modeled the LTE network infrastructure using a randomized real aggregation network provided by commercial wireless industry. This approach enabled the aggregation of UE impacts to SUAS and the overall protection distances were determined to extend beyond 300 km for the UE to SUAS case. For the protection distances from the SUAS to LTE Base Stations, those distances were slightly less but extended from at least 285 km depending on the orientation of the base station antenna. It should be noted that variations in base station antenna heights above ground level had small effects on the predicted required separation distances.
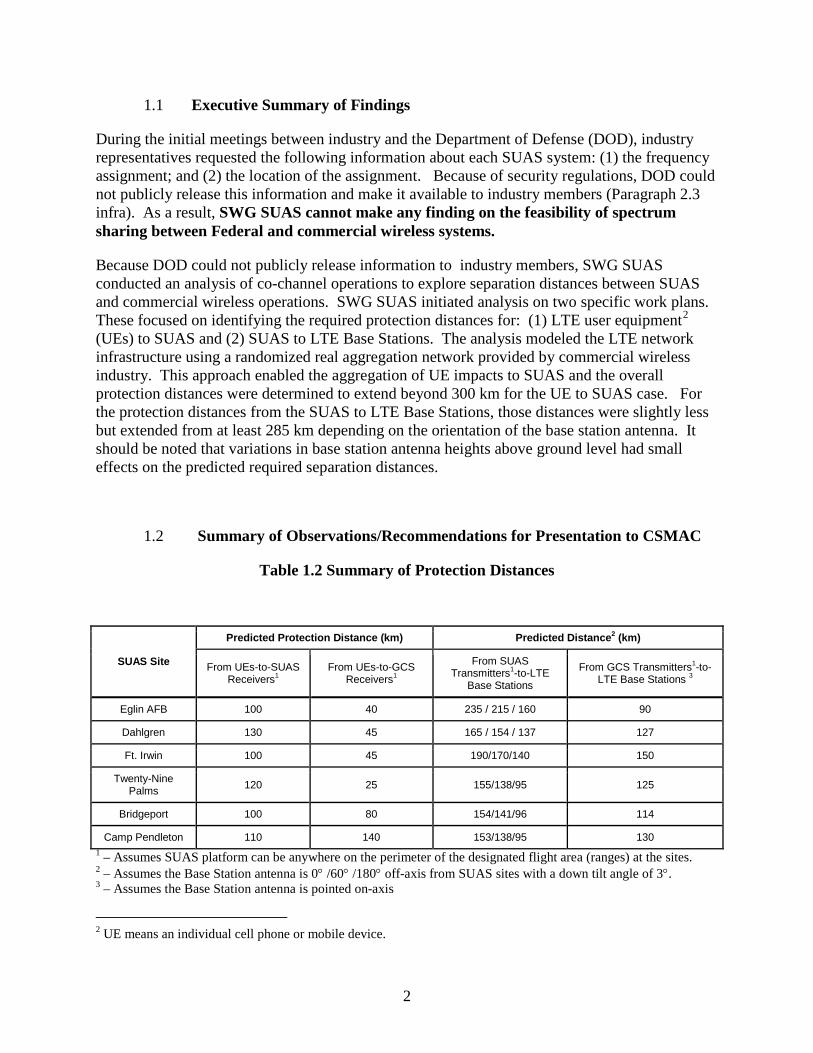
1.2 Summary of Observations/Recommendations for Presentation to CSMAC
Table 1.2 Summary of Protection Distances
1 – Assumes SUAS platform can be anywhere on the perimeter of the designated flight area (ranges) at the sites. 2 – Assumes the Base Station antenna is 0° /60° /180° off-axis from SUAS sites with a down tilt angle of 3°. 3 – Assumes the Base Station antenna is pointed on-axis
2 UE means an individual cell phone or mobile device.
SUAS Site
Predicted Protection Distance (km) Predicted Distance2 (km)
From UEs-to-SUAS Receivers1
From UEs-to-GCS Receivers1
From SUAS Transmitters1-to-LTE
Base Stations
From GCS Transmitters1-to-LTE Base Stations 3
Eglin AFB 100 40 235 / 215 / 160 90
Dahlgren 130 45 165 / 154 / 137 127
Ft. Irwin 100 45 190/170/140 150
Twenty-Nine Palms 120 25 155/138/95 125
Bridgeport 100 80 154/141/96 114
Camp Pendleton 110 140 153/138/95 130
3
1.3 Next Steps/Path Forward
Additional study efforts may be required to address the outstanding issues that are noted in paragraph 1.4 below. However, at this time, the conduct of further studies would be dependent on associated funding being provided as well as a final decision by the commercial wireless industry, NTIA and DOD.
1.4 Outstanding Issues
The SWG SUAS determined there are other possible areas of consideration that could be studied for additional “Observations” related to the SUAS analysis. Those possible areas that may warrant additional study include:
a. Effects of off-tuning of the LTE base station from the SUAS Frequency of Operations (FO);
b. Implementation of notching specific LTE channels within a wireless licensee’s frequency band at selected locations;
c. Consideration of alternate interference threshold based on desired signal level desired;
d. Possible effects of clutter; and
e. Geographic-based sharing scenarios.
2. Organization and Functioning of the SUAS Sub-Working Group
2.1 Organization and Participation of SUAS Sub-Working Group
2.1.1 The SWG - SUAS was created under the auspices of WG-5, taking overall direction from the WG-5 Co-chairs.
CO-CHAIRS David Milburn, Army PM UAS Contract Support Patrick Welsh, Verizon Communications, Inc
NTIA LIASON Renae Carter, NTIA Federal Representatives
Mike Apodaca, ATEC/WSMR Arthur Deleon, USMC Dru Pontius, NMSC Dave Reed, AFSMO Gary Sheer, FBI Alden Smith, DSO Eric Thomas, PM UAS SUAS Bryan Wright, DOI James Hollansworth, NASA
4
Tom Sullivan, ASRCRTS Vishnu Sahay, ASRCRTS
Analysis Jason Greene, Alion Bob Martin, Alion Doug Wolff, Alion
Members at large
Earl Cox, Aerovironment Wayne Maynard, Lockheed Martin
2.2 Participation
The SWG was open to broad participation by government and industry representatives. Most of the analysis was conducted by Government elements due to the fact that the data utilized contained For Official Use Only (FOUO) data and could not be publicly released to industry.
2.3 Work Plan
The work plan included the elements as described below:
1) Overview of SUAS operation and LTE system operation – Government participants provided an overview of the SUAS mission, operations and technical requirements. Commercial wireless industry participants provided an overview of LTE technology and operation.
2) Review of Government Assignments and Operations – Government participants undertook a review to update and validate frequency assignments reflected in the Government Master File (GMF). Updated records could not be made available for industry review, because assignment data is either classified or national security sensitive when presented in the aggregate.
3) The SWG agreed to conduct interference analysis for seven locations: Fort Irwin (National Training Center (NTC)) CA; Twenty-nine Palms, CA; Eglin AFB, FL; Dahlgren, VA; Charleston, SC; Bridgeport, CA; and Camp Pendleton, CA. Analysis at a sample of locations is meant to provide insight into the extent of any potential interference and to provide a basis for further discussions of possible mitigation techniques or other approaches to sharing. Alion Science and Technology (Alion) conducted the analysis using Transfinite Visualyse software. The analysis is based on LTE parameters developed in the Technical Committee formed under WG-1, the SUAS parameters provided in the White Paper provided to the SWG by Government, and the overall analysis approach agreed to by the Technical Committee formed under WG-5.
2.4 Functioning of Sub-Working Group
Meetings were held on a bi-weekly basis with participation by government and industry representatives. The majority of meetings were conducted via conference call; however, the SWG took advantage of opportunities for face-to-face meetings that coincided with face-to-face meetings of WG-5.
2.5 Abstract of Sub-Working Group Report
5
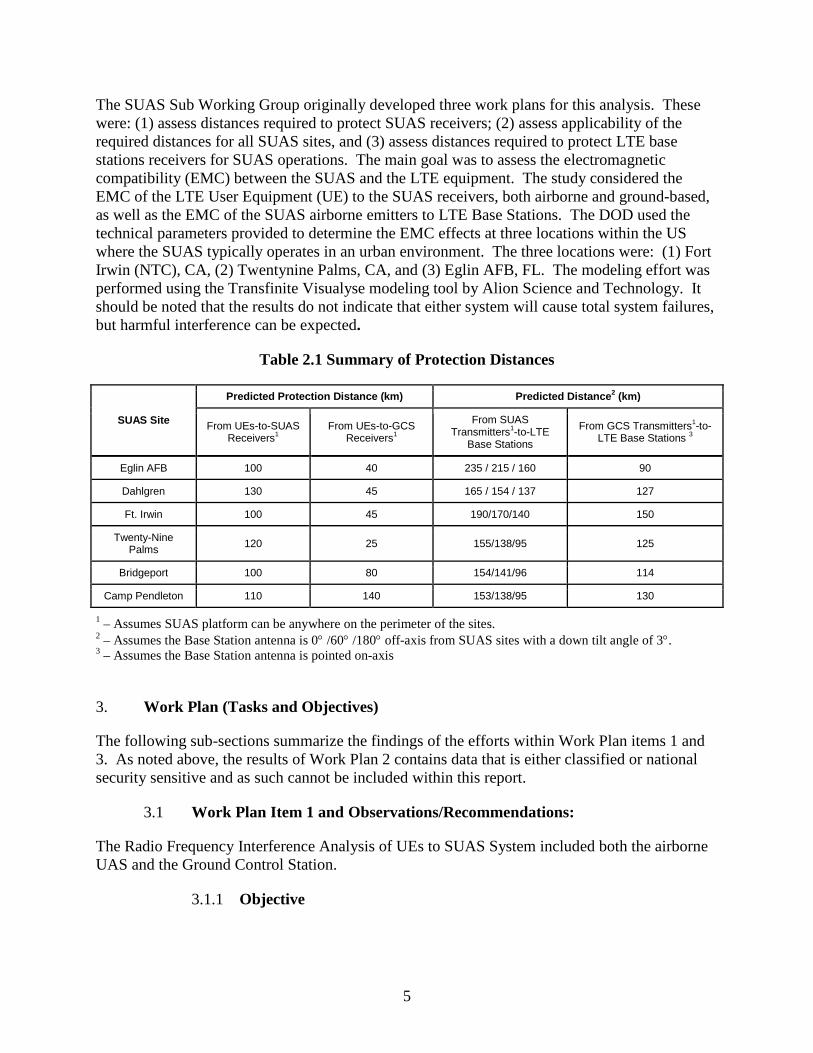
The SUAS Sub Working Group originally developed three work plans for this analysis. These were: (1) assess distances required to protect SUAS receivers; (2) assess applicability of the required distances for all SUAS sites, and (3) assess distances required to protect LTE base stations receivers for SUAS operations. The main goal was to assess the electromagnetic compatibility (EMC) between the SUAS and the LTE equipment. The study considered the EMC of the LTE User Equipment (UE) to the SUAS receivers, both airborne and ground-based, as well as the EMC of the SUAS airborne emitters to LTE Base Stations. The DOD used the technical parameters provided to determine the EMC effects at three locations within the US where the SUAS typically operates in an urban environment. The three locations were: (1) Fort Irwin (NTC), CA, (2) Twentynine Palms, CA, and (3) Eglin AFB, FL. The modeling effort was performed using the Transfinite Visualyse modeling tool by Alion Science and Technology. It should be noted that the results do not indicate that either system will cause total system failures, but harmful interference can be expected.
Table 2.1 Summary of Protection Distances
SUAS Site
Predicted Protection Distance (km) Predicted Distance2 (km)
From UEs-to-SUAS Receivers1
From UEs-to-GCS Receivers1
From SUAS Transmitters1-to-LTE
Base Stations
From GCS Transmitters1-to-LTE Base Stations 3
Eglin AFB 100 40 235 / 215 / 160 90
Dahlgren 130 45 165 / 154 / 137 127
Ft. Irwin 100 45 190/170/140 150
Twenty-Nine Palms 120 25 155/138/95 125
Bridgeport 100 80 154/141/96 114
Camp Pendleton 110 140 153/138/95 130
1 – Assumes SUAS platform can be anywhere on the perimeter of the sites. 2 – Assumes the Base Station antenna is 0° /60° /180° off-axis from SUAS sites with a down tilt angle of 3°. 3 – Assumes the Base Station antenna is pointed on-axis
3. Work Plan (Tasks and Objectives)
The following sub-sections summarize the findings of the efforts within Work Plan items 1 and 3. As noted above, the results of Work Plan 2 contains data that is either classified or national security sensitive and as such cannot be included within this report.
3.1 Work Plan Item 1 and Observations/Recommendations:
The Radio Frequency Interference Analysis of UEs to SUAS System included both the airborne UAS and the Ground Control Station.
3.1.1 Objective
6
The overall objective of this Work Plan Item was to assess the electromagnetic compatibility of the LTE UE handset environment to the SUAS receivers, whether airborne or ground-based. This effort would provide observations as to the typical distances required to protect SUAS receivers. ITo assess these distances, we selected seven SUAS operating sites that are typical urban sites to best obtain the needed information for an overall analysis. The technical information of the SUAS is noted in separate attachment and the LTE information is noted on page 12. The main scope of this work plan was to provide an observation as to the initial estimated protection distance required between UEs and SUAS at each of the seven selected sites; (1) Ft. Irwin (NTC) CA, (2) Twenty-nine Palms, CA, (3) Eglin AFB, FL, (4)Dahlgren, (5) Charleston, SC, (6)Bridgeport, and (7) Camp Pendleton.
3.1.2 Technical Approach
The technical approach for this work plan item is to consider the effects of the SUAS receiver as an interference victim. In performing this analysis, the following assumptions were made:
The SUAS technical data would be derived for the SUAS white paper and JF-12(DD-1494) Equipment and Spectrum certification document. The LTE and UE technical information would be the data provided to us by Working Group 1 (WG-1).
1. Assess seven designated SUAS ranges noted as being typical training sites
2. UEs modeled as being physically located at base of urban/rural base station (3 per UE carrier frequency at each base station)
3. UE geographic distribution according to “randomized” real world LTE network
4. UE interference modeled as a single 1.67 MHz UE emitter per base station sector
In addition to the parameters, we used a standard interference power calculation formula for determining the interference power at the victim receiver antenna output which was modeled into Visualyse automated software tool. The interference power calculations were calculated by the Visualyse automated software tool with the following technical parameters:
1. UE power was set not exceed 20 dBm
2. Propagation loss was calculated using ITU-R P.528 for air to ground interactions
3. Clutter was not considered
4. Longley-Rice and terrain data used for ground/ground interactions
5. Additional SUAS receiver system loss of approximately 2 dB for cable loss
6. Ground control station cable, insertion, and other receiver losses assumed at 2 dB
7. Only on-tuned cases were considered
7
Once the analysis was completed for each site, results were reviewed for the calculated interference power and compared to the receive system interference threshold of the SUAS. The interference power calculated for positions of simulated flight paths around operational area boundaries and locations of the RRUs were reviewed to develop the protection areas based on the interference to noise ratio (I/N) of -6 dB required threshold for the SUAS. This data is noted below in section 3.1.3.
3.1.3 Observations/Recommendations
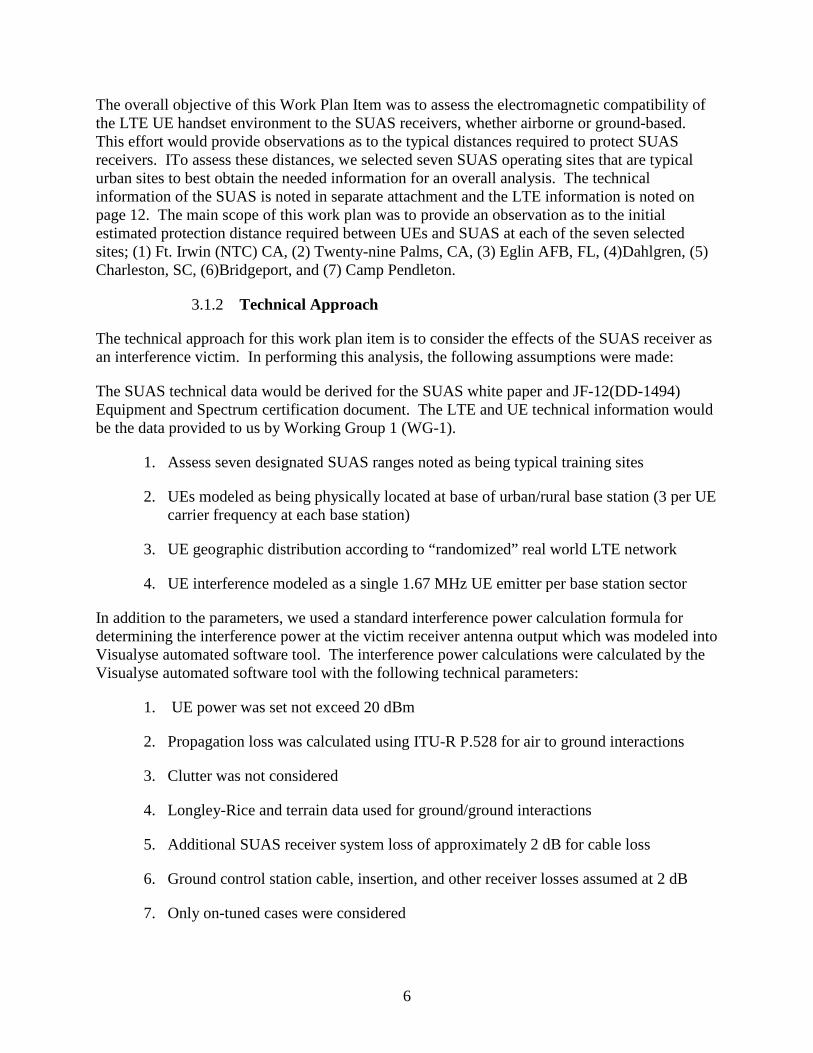
The SUAS Sub Working Group was tasked to provide observations based on the results of the modeled calculations. These observations are noted in Table 3.1 below:
Table 3.1 Summary of Initial Distance Assessment from UEs to SUAS
1---- Assumes SUAS platform can be anywhere on perimeter of range. 2 – Assumes the Base Station antenna is 0° /60° /180° off-axis from SUAS sites with a down tilt angle of 3°. 3 – Assumes the Base Station antenna is pointed on-axis
3.1.4 Outstanding Issues
SUAS Site
Predicted Protection Distance (km) Predicted Distance2 (km)
From UEs-to-SUAS Receivers1 From UEs-to-GCS Receivers1 From SUAS Transmitters1-to-LTE Base Stations
From GCS Transmitters1-to-LTE Base Stations
Eglin AFB 100
40 235 / 215 / 160 90
Dahlgren 130 45 165 / 154 / 137 127
Ft. Irwin 100 45 190/170/140 150
Twenty-Nine Palms
120 25 155/138/95 125
Bridgeport 100 80 154/141/96 114
Camp Pendleton
110 140 153/138/95 130
8
The SUAS SWG determined there are other possible areas of consideration that could be studied for SUAS. The following is a list of possible study topics determined by the Sub Working Group that may warrant additional investigation:
1. Effects of off-tuning of the LTE base station to the SUAS Frequency of 0peration (FO); 2. Implementation of notching specific LTE channels within a wireless licensee’s frequency
band at selected locations; 3. Consideration of alternate interference threshold based on desired signal level desired; 4. Possible effects of clutter; and 5. Geographic-based sharing scenarios.
3.2 Work Plan Item 3 and Observations/Recommendations: [RF Interference Analysis of SUAS to LTE base Stations]
3.2.1 Objective
The overall objective of this Work Plan item was to assess the EMC of the SUAS airborne emitters to the LTE base station. This effort would provide observations as to the typical distances required to protect LTE base station receivers. To assess these distances, we selected seven SUAS operating sites that are typical urban sites to best obtain the needed information for an overall analysis. The technical information of the SUAS is noted in a separate attachment and the LTE information is noted on page 12. The main scope of this work plan was to provide an observation as to the initial estimated Protection Distance assessment of UEs to the SUAS at each of the three selected sites; (1) Seymour Johnson AFB, NC, (2) NAS Key West, Key West, FL, and (3) Nellis AFB, Las Vegas, NV.
3.2.2 Technical Approach
The technical approach for this work plan item is to consider the effects of the SUAS airborne emitter as an interference source to the LTE base station. The following assumptions were used to conduct the analyses:
1. The SUAS technical data would be derived from the SUAS white paper and J-12 certification document
2. The LTE technical information would be the data provided to us by Working Group 1 (WG-1)
3. Assess seven designated SUAS ranges noted as being typical training sites 4. Base station antenna height at 30 meters 5. Interference assessed for on-azimuth 6. Addressed mitigation of 60 degree off axis and 180 degree off axis interference source
In addition to the parameters, we used a standard interference power calculation formula for determining the interference power at the victim receiver antenna output which was modeled into the program. The interference power calculations were calculated by the Visualyse automated software tool with the following parameters:
9
1. SUAS transmitters simulated at multiple boundary locations 2. Visualyse was used to determine distances beyond which the base stations not expected
to receive interference 3. Clutter was not considered
Once the analysis was completed for each site the results were reviewed for the calculated interference power and compared to the receive system interface threshold of the LTE base stations. The interference power calculated for positions of simulated flight paths around area boundaries and locations of the LTEs were reviewed to develop the protection areas. This data is noted below.
3.2.3 Observations/Recommendations
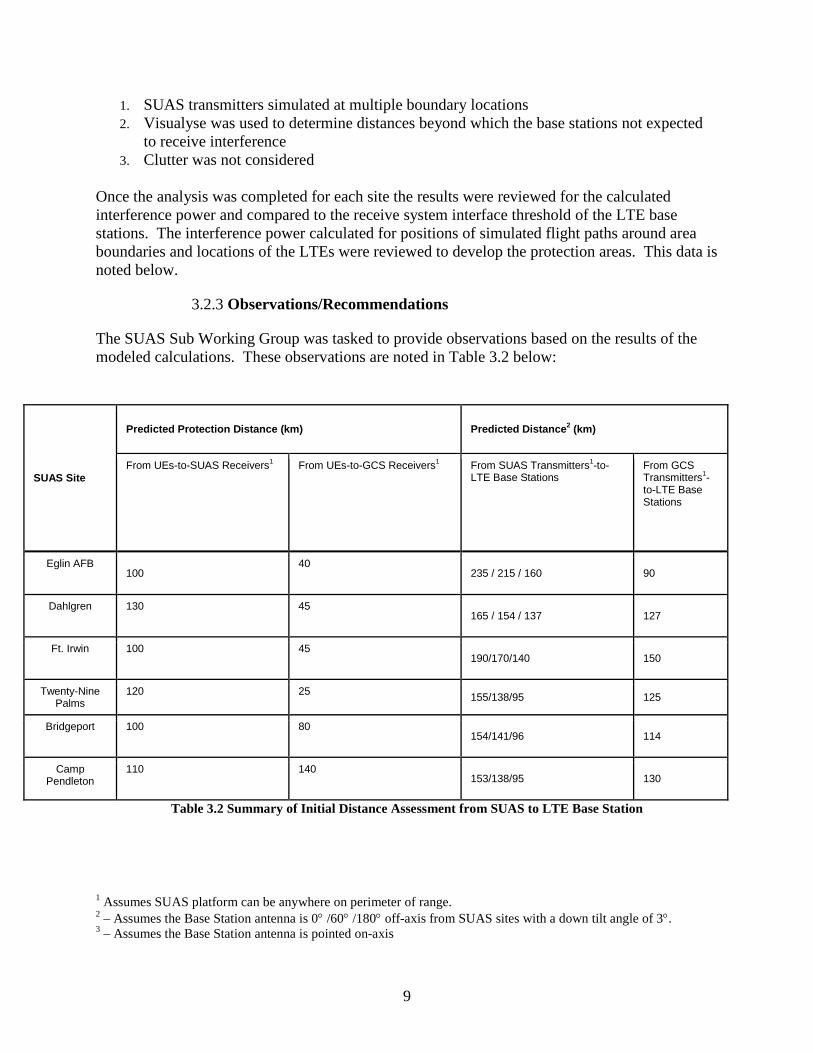
The SUAS Sub Working Group was tasked to provide observations based on the results of the modeled calculations. These observations are noted in Table 3.2 below:
Table 3.2 Summary of Initial Distance Assessment from SUAS to LTE Base Station
1 Assumes SUAS platform can be anywhere on perimeter of range. 2 – Assumes the Base Station antenna is 0° /60° /180° off-axis from SUAS sites with a down tilt angle of 3°. 3 – Assumes the Base Station antenna is pointed on-axis
SUAS Site
Predicted Protection Distance (km) Predicted Distance2 (km)
From UEs-to-SUAS Receivers1 From UEs-to-GCS Receivers1 From SUAS Transmitters1-to-LTE Base Stations
From GCS Transmitters1-to-LTE Base Stations
Eglin AFB 100
40 235 / 215 / 160 90
Dahlgren 130 45 165 / 154 / 137 127
Ft. Irwin 100 45 190/170/140 150
Twenty-Nine Palms
120 25 155/138/95 125
Bridgeport 100 80 154/141/96 114
Camp Pendleton
110 140 153/138/95 130
10
4. Detailed Technical Information
Below is the technical information associated with the SUAS analysis.
4.1 Detailed Technical.
The approach was to determine the interference power at the victim receiver from the SUAS to the LTE base station and to determine the interference power at the victim receiver from the UEs to the SUAS receivers, from both on the ground as well as its airborne component. As agreed by CSMAC WG5, the interference power calculations would be performed using the Visualyse automated software tool to perform the multi-function calculations with the SUAS and LTE/UE characteristics as reference. One key point was that the effects of clutter were not considered as there was no consensus method available to model the characteristics of clutter.. In this analysis, only on-tuned cases were considered. The calculated interference power results were compared to the receiver system interference threshold as provided by the SUAS Program Office and by the LTE Baseline document provided by the WG 1 TWG.
4.1.1 Approach Analysis Assumptions
The analysis assumptions for the SUAS were evaluated and agreed upon by the CSMAC WG5 and are documented below.
4.1.1.1 SUAS as interference victim
An analysis was conducted using Visualyse where signal levels from the UEs to the aircraft and ground control station (GCS) were conducted at seven different locations which had high usage of SUAS and close to the commercial wireless operators’s top 100 locations for use of the 1755-1850 MHz band(see figures in paragraph A.3 for those areas).
4.1.1.2 SUAS as interference source
An analysis was conducted using Visualyse where signal levels from the GCS and aircraft were calculated at the receiver of the LTE base stations at seven different locations which had high usage of SUAS and close to the commercial wireless oeprators’ top 100 locations for use of the 1755-1850 MHz band (see figures in paragraph A.3 for those areas).
4.1.2 Model Description - Visualyse
Visualyse Professional is commercial off-the-shelf software that can be used to build simple or complex simulations of radio frequency interactions between multiple units in an electromagnetic environment. The software uses models of simple objects such as antennas, stations, carriers, and links to build the simulation scenarios. Objects contain data either entered by the user or parameters derived from the input data. Once input data and derived parameters are available as objects, multiple simple objects are combined to form complex simulations. For
11
simulations with a large number of objects such as those developed for this effort, objects with certain similar attributes can be managed as a group. Once a simulation is fully defined, it is executed by starting a series of simulation steps. The simulation steps are typically defined by time increments of a specific duration and the simulation will run for a designated number of steps. During the simulation, data can be both displayed and collected for post processing. For the simulations associated with this effort, a particular set of the basic inputs are of interest. First, several different types of antennas were modeled. Visualyse has over ninety different antenna patterns available as default choices as antenna objects. Most of these patterns are defined in ITU documents and are available, with several user-defined parameters such as frequency of operation, height, feeder loss, efficiency and other parameters. Users can also fully define an antenna by entering specific measured or calculated data points. For the ACTS analysis, the Visualyse omnidirectional antenna pattern with 0 dBi of gain used for the UEs and ACTS receivers. An individual pattern was developed for the RRU antenna and ITU-R Recommendations F.1336-3 was used to develop patterns for the base stations.
Antennas are associated with individual stations and in the Visualyse simulations several distinct station types were used. UEs, ACTS-equipped aircraft, an RRU, and base stations were modeled as station types with associated antennas, locations, heights above terrain or sea level, and feeder losses. For each type, multiple individual stations were developed and deployed in an environment according to the parent simulation.
Stations are then grouped into links to allow for the RF calculations. Typically, UEs were grouped into transmit links, i.e., were treated only as transmitting sources. A traffic module was used to associate the urban and rural transmit EIRP values with individual UEs in a transmit link and to vary these values for every simulation step for every transmitting station according to the appropriate urban or rural cumulative distribution function (CDF). The ITU-R Recommendation P.528-3 propagation model for the air/ground/air interactions is assigned as a transmit link parameter. A version of the Longley-Rice propagation model was used to model ground-to-ground interactions. A transmit frequency, emission bandwidth, and baseline transmit power is also defined in a transmit link. Victim receivers are defined in receive links or receive link groups depending on the number of stations to be considered. In receive links, receiver frequency, bandwidth, and noise parameters are defined. In general, transmit and receive links are used to more completely define the various system and environmental parameters needed to complete an interference analysis.
A final step in Visualyse is to define the interference path. This step establishes the receive links to be addressed in a simulation and the transmit link, or links in most cases, to be used as the interference sources. Additional issues such as polarization loss may be established in this last step although that was not used in this effort. For all of the simulations performed in this effort, the values for various parameters of the simulations were recorded for all simulation steps. Recording of this data allowed for the development of I/N plots and the plotting of the number of interferers associated with each protection distance considered.
4.2 Publicly releasable Federal systems general description and characteristics of operations
12
4.2.1 SUAS Data Link Transceiver (DLT) Operational Characteristics.
See separate PDF attachment; a completed DD-1494 for the SUAS DDL.
4.2.2 SUAS Operating locations and geographic areas of operation
See Appendix A.
4.3 SUAS Operational Profiles for the Model Analysis
The following are the key profiles used in the analysis.
• Identical air and ground transceiver
• 1755-1850 MHz using 4.8 MHz channels (DDL)
• 1.5 watt Transmit power
• Omni-directional antenna on aircraft, 2 dBi omni
• Ground stations have medium-gain antenna, 9 dBi omni in horizontal plane, 30° beamwidth in vertical plane
4.4 LTE systems description, characteristics, and parameters (See page 14) .
The LTE information was taken from the LTE parameters documentation that came out of the WG-1 Technical Working Group. That TWG identified LTE characteristics and identified any deviations or additional LTE characteristics and parameters to be considered by this Sub-Working Group. See Appendix B for a summary of the characteristics used in these analyses.
This is already in Section 2.
13
Appendix A SUAS Operating locations and geographic areas of operation
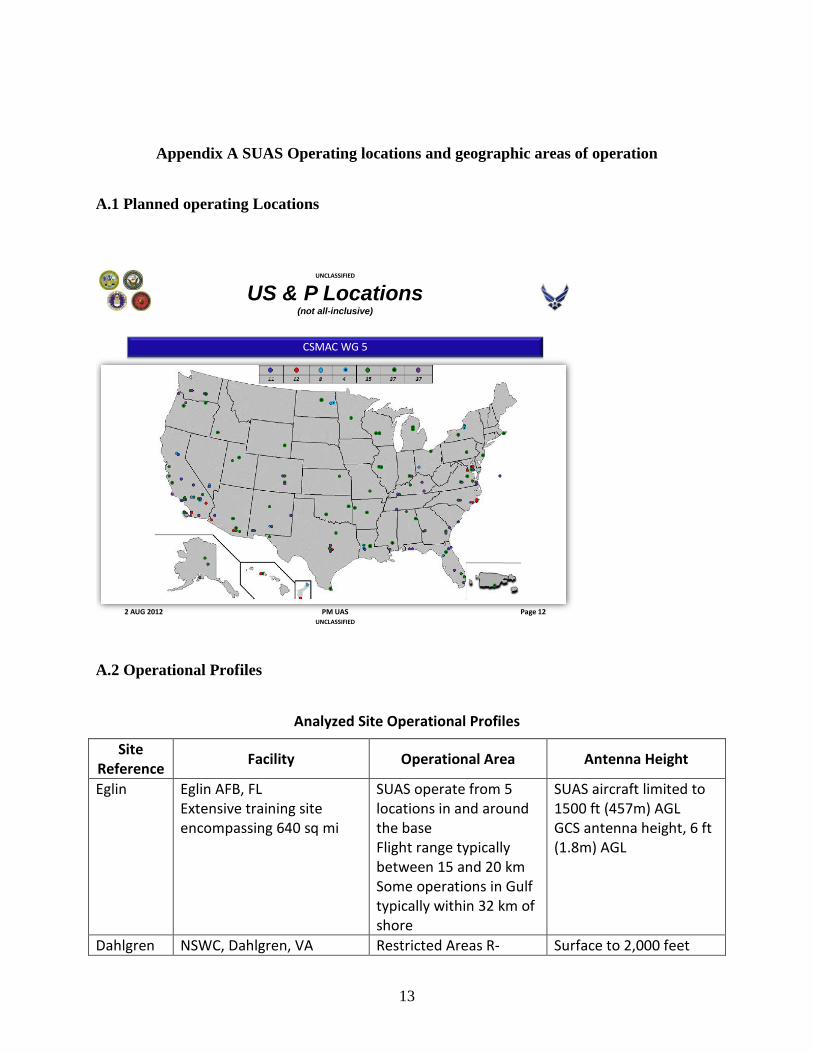
A.1 Planned operating Locations
A.2 Operational Profiles
Analyzed Site Operational Profiles
Site Reference Facility Operational Area Antenna Height
Eglin Eglin AFB, FL Extensive training site encompassing 640 sq mi
SUAS operate from 5 locations in and around the base Flight range typically between 15 and 20 km Some operations in Gulf typically within 32 km of shore
SUAS aircraft limited to 1500 ft (457m) AGL GCS antenna height, 6 ft (1.8m) AGL
Dahlgren NSWC, Dahlgren, VA Restricted Areas R- Surface to 2,000 feet
CSMAC WG 5
UNCLASSIFIED
UNCLASSIFIED2 AUG 2012 PM UAS Page 12
US & P Locations(not all-inclusive)
14
Primary training area: Washington Center
6611A, R-6612, R-6613A (610m); SUAS modeled at 1,500 feet (457m)
Ft Irwin Fort Irwin and National Training Center, CA
Restricted Areas R-2052 modeled at 1,000 feet (305m) AGL
Twentnine Palms
Twentynine Palms, CA Major USMC facility with large training area in the Mojave Desert Area of approximately 1000 square miles
SUAS operate within R-2501 designated airspace
SUAS limited to 1000 ft (305m) AGL GCS antenna height, 6 ft (1.8m) AGL
Bridgeport USMC Mountain Warfare Training Center (MWTC) in Sierra Nevada mountains of CA Used for mountainous, high-altitude, cold weather training
SUAS modeled as operating within 40 km of center of base
SUAS limited to 1000 ft (305m) AGL GCS antenna height, 6 ft (1.8m) AGL
Camp Pendleton
USMC Mountain Warfare Training Center in Sierra Nevada mountains CA Used for mountainous, high-altitude, cold weather training
modeled as operating within 40 km of center of base
SUAS limited to 1000 ft (305m) AGL GCS antenna height, 6 ft (1.8m) AGL
Charleston Charleston SC Naval Weapons Station
SUAS modeled as operating with area defined by NWS
SUAS limited to 1000 ft (305m) AGL GCS antenna height, 6 ft (1.8m) AGL
A.3 Descriptions of Operating Locations
15
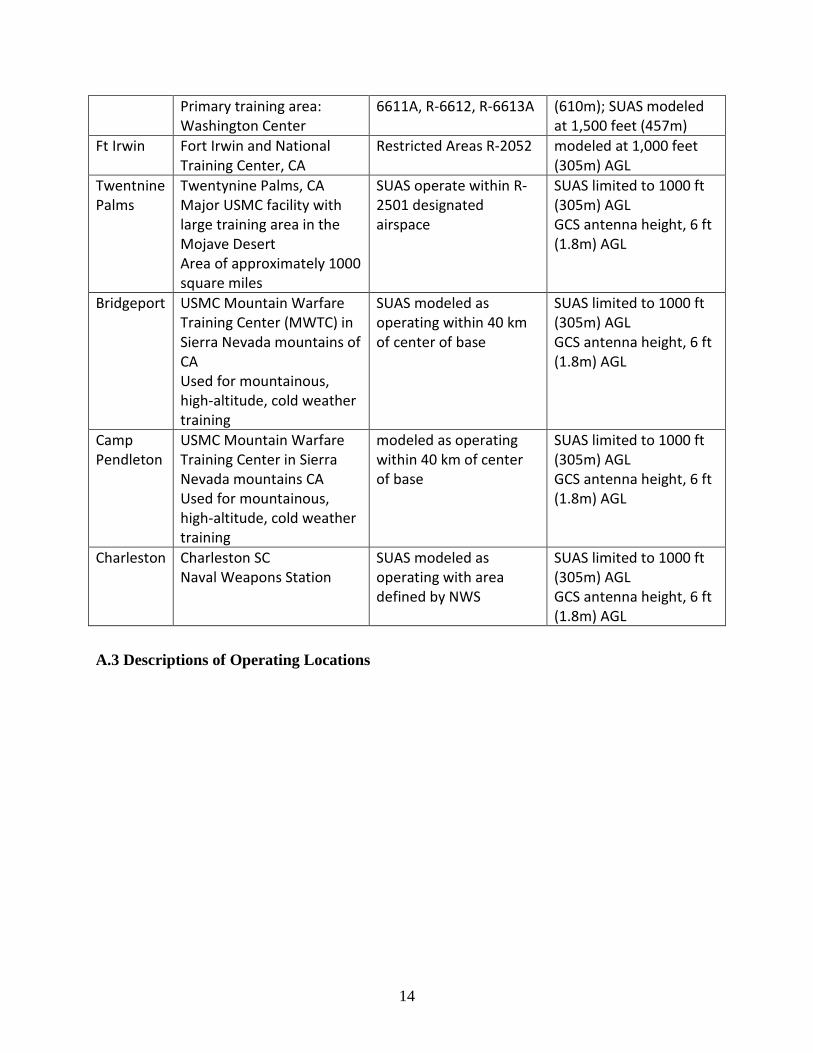
Figure A.1 – Eglin AFB SUAS Operational Area showing SUAS airborne locations used for analyses
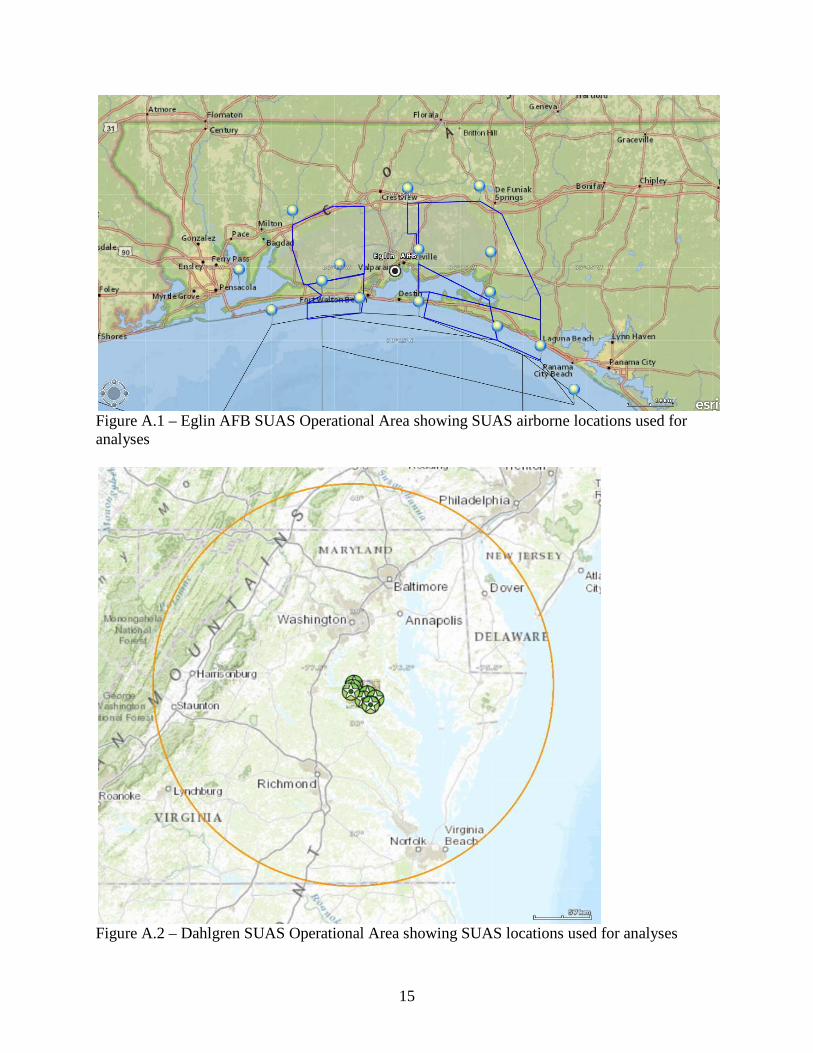
Figure A.2 – Dahlgren SUAS Operational Area showing SUAS locations used for analyses
16
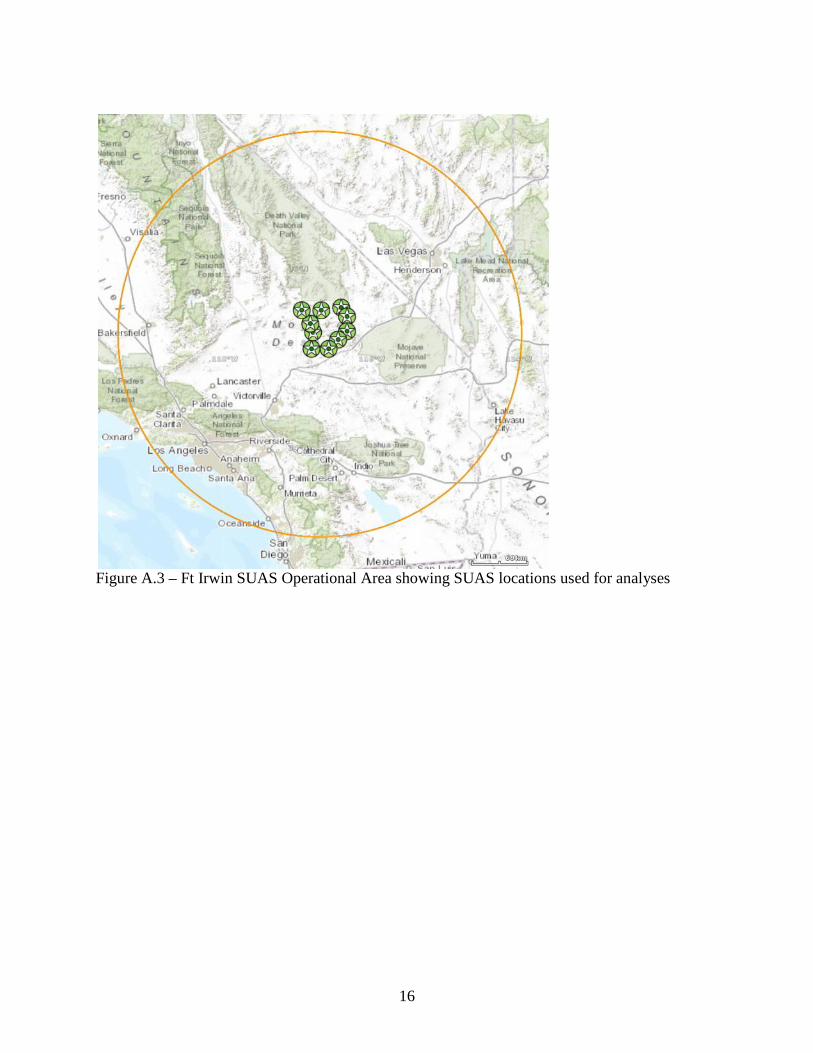
Figure A.3 – Ft Irwin SUAS Operational Area showing SUAS locations used for analyses
17
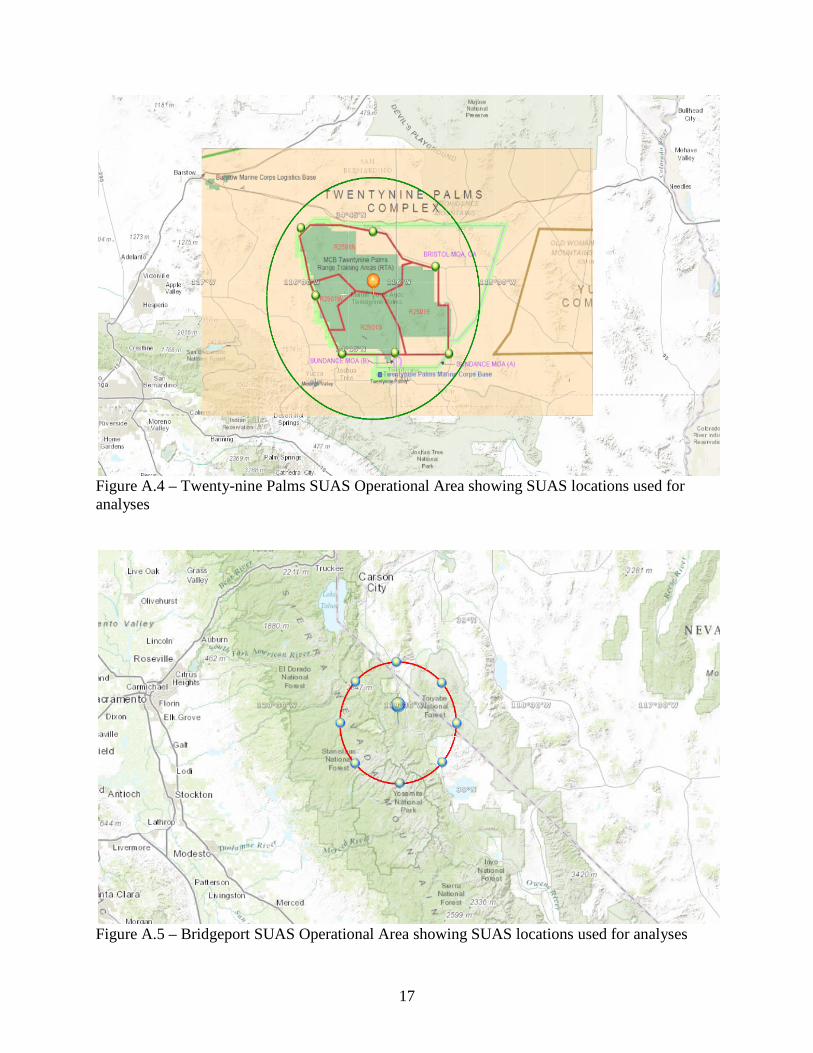
Figure A.4 – Twenty-nine Palms SUAS Operational Area showing SUAS locations used for analyses
Figure A.5 – Bridgeport SUAS Operational Area showing SUAS locations used for analyses
18
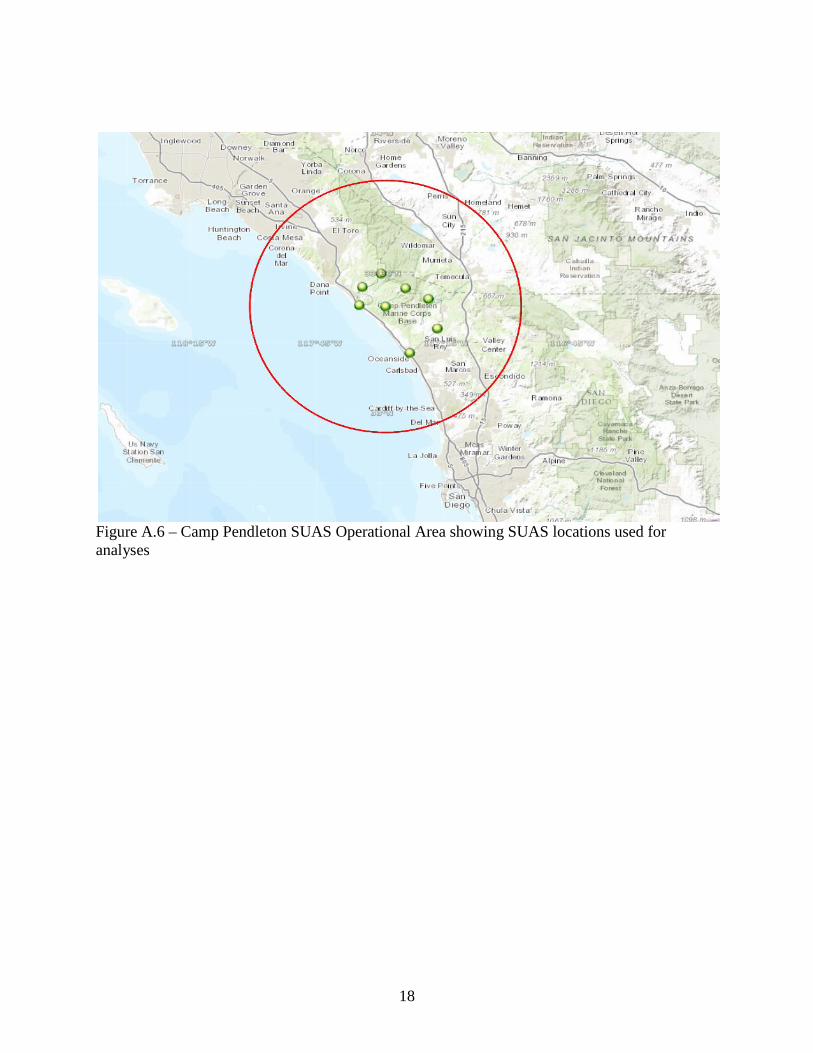
Figure A.6 – Camp Pendleton SUAS Operational Area showing SUAS locations used for analyses
19
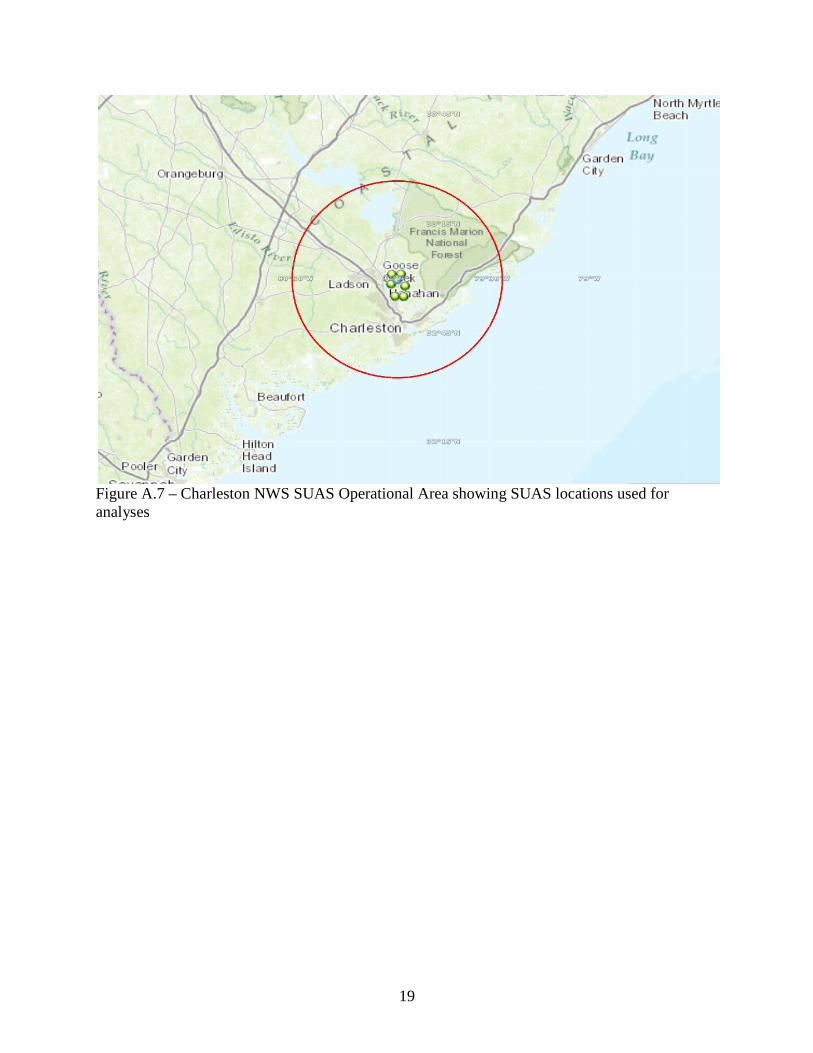
Figure A.7 – Charleston NWS SUAS Operational Area showing SUAS locations used for analyses
20
Appendix B. Baseline LTE Uplink Characteristics These characteristics were developed for use in Interference Analysis for Protection of Federal Operations in the 1695-1710 and 1755-1850 MHz Bands, including adjacent bands. This material was developed based on wireless industry standards and agreed to within the technical working group established in WG1 to be utilized for LTE characteristics for all working groups.
B.1 Introduction
The information regarding LTE Uplink Characteristics is intended for use in general analysis of the potential for interference between commercial LTE operations and Federal Government operations in the 1755-1850 MHz band. The information represents a collaborative effort between industry and government representative experts to agree on LTE parameters that are closer to realistic operational parameters than have been used in past analysis. However, because these parameters will be used in general analysis, it is not possible to fully capture the parameters that will be observed in an actual deployment, which will vary by carrier implementation and site specific geography. To provide a uniform set of information to apply in a wide variety of analysis, a number of simplifying assumptions have been made that may continue to result in analysis showing a greater level of interference that would actually occur. These include, but are not limited to, the assumptions being based on 100% loading rather than a more realistic loading level and use of propagation curves that may result in higher calculated power. In addition, because the transmit power and interference potential of a UE device is highly dependent on the UE distance to a base station, developing and applying UE information that is uncorrelated to interfering path is likely to overestimate the amount of interference. Nonetheless, given the difficulty of developing and running a fully correlated model, the Technical Group participants agreed that it is reasonable to proceed with uncorrelated values in order to develop a general understanding of the interference potential given limited time and resources. Analysis based on this information will serve as useful guidance in understanding the potential for systems to coexist and the potential for interference. However, site specific coordination will be necessary to maximize efficient use of the spectrum.
B.2 User Equipment (UE) Transmit Characteristics
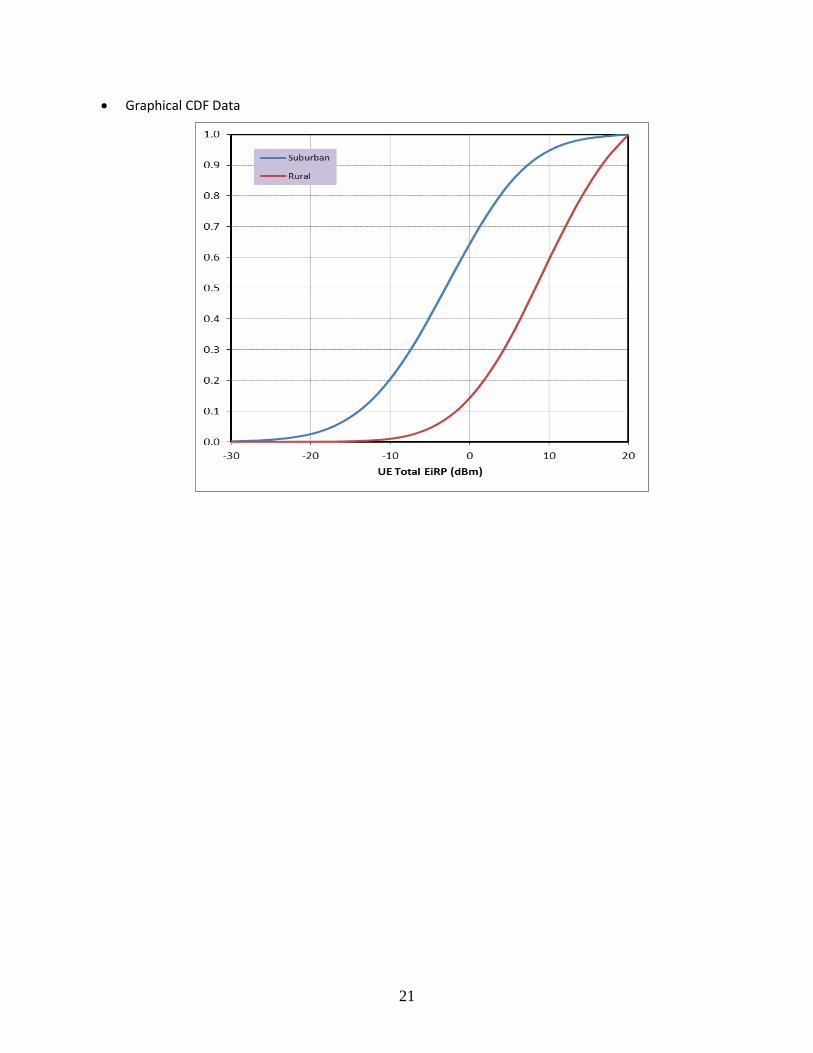
B.2.1 Cumulative Distribution Function (CDF) of Total EIRP per Scheduled User Equipment The following are the key assumptions: • Assumptions for generation of CDF data:
o LTE Frequency Division Duplex (FDD) system o 10 MHz LTE Bandwidth o 100% system loading at LTE Base Station (eNodeB) All Physical Resource Blocks (PRB) are occupied at all times
o 100% outdoor UE distribution o P0 = -90 dBm and alpha = 0.8 for UL Power Control (urban/suburban/rural) o Proportional fair algorithm for LTE Scheduler o Full-buffer traffic model (i.e. All UEs have data in their Radio Link Control (RLC) layer buffer at
all times)
21
• Graphical CDF Data
22
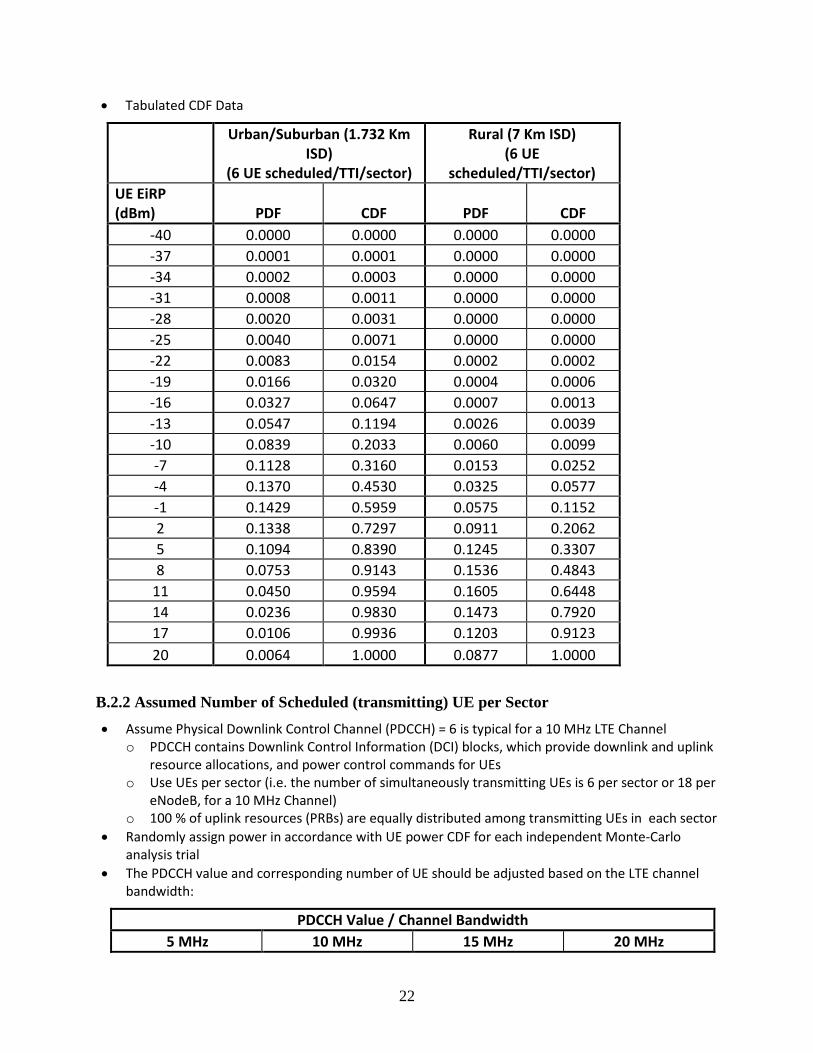
• Tabulated CDF Data
Urban/Suburban (1.732 Km ISD)
(6 UE scheduled/TTI/sector)
Rural (7 Km ISD) (6 UE
scheduled/TTI/sector) UE EiRP (dBm) PDF CDF PDF CDF
-40 0.0000 0.0000 0.0000 0.0000 -37 0.0001 0.0001 0.0000 0.0000 -34 0.0002 0.0003 0.0000 0.0000 -31 0.0008 0.0011 0.0000 0.0000 -28 0.0020 0.0031 0.0000 0.0000 -25 0.0040 0.0071 0.0000 0.0000 -22 0.0083 0.0154 0.0002 0.0002 -19 0.0166 0.0320 0.0004 0.0006 -16 0.0327 0.0647 0.0007 0.0013 -13 0.0547 0.1194 0.0026 0.0039 -10 0.0839 0.2033 0.0060 0.0099 -7 0.1128 0.3160 0.0153 0.0252 -4 0.1370 0.4530 0.0325 0.0577 -1 0.1429 0.5959 0.0575 0.1152 2 0.1338 0.7297 0.0911 0.2062 5 0.1094 0.8390 0.1245 0.3307 8 0.0753 0.9143 0.1536 0.4843
11 0.0450 0.9594 0.1605 0.6448 14 0.0236 0.9830 0.1473 0.7920 17 0.0106 0.9936 0.1203 0.9123 20 0.0064 1.0000 0.0877 1.0000
B.2.2 Assumed Number of Scheduled (transmitting) UE per Sector • Assume Physical Downlink Control Channel (PDCCH) = 6 is typical for a 10 MHz LTE Channel
o PDCCH contains Downlink Control Information (DCI) blocks, which provide downlink and uplink resource allocations, and power control commands for UEs
o Use UEs per sector (i.e. the number of simultaneously transmitting UEs is 6 per sector or 18 per eNodeB, for a 10 MHz Channel)
o 100 % of uplink resources (PRBs) are equally distributed among transmitting UEs in each sector • Randomly assign power in accordance with UE power CDF for each independent Monte-Carlo
analysis trial • The PDCCH value and corresponding number of UE should be adjusted based on the LTE channel
bandwidth:
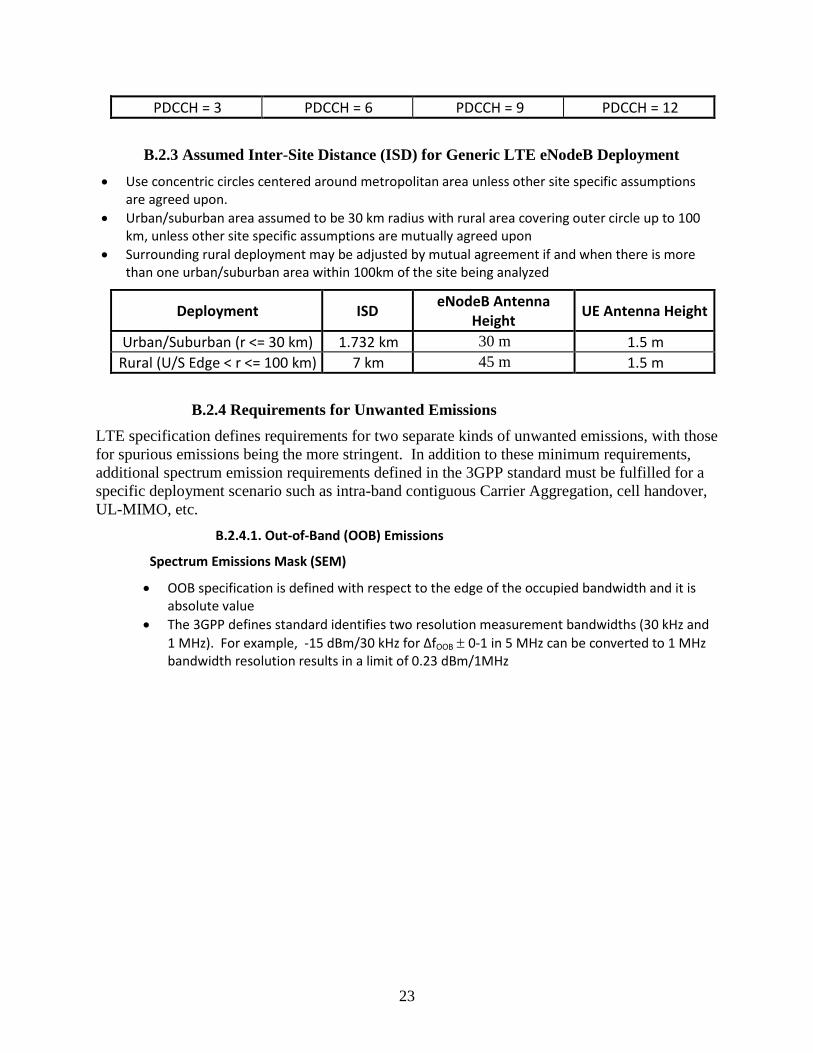
PDCCH Value / Channel Bandwidth 5 MHz 10 MHz 15 MHz 20 MHz
23
PDCCH = 3 PDCCH = 6 PDCCH = 9 PDCCH = 12
B.2.3 Assumed Inter-Site Distance (ISD) for Generic LTE eNodeB Deployment • Use concentric circles centered around metropolitan area unless other site specific assumptions
are agreed upon. • Urban/suburban area assumed to be 30 km radius with rural area covering outer circle up to 100
km, unless other site specific assumptions are mutually agreed upon • Surrounding rural deployment may be adjusted by mutual agreement if and when there is more
than one urban/suburban area within 100km of the site being analyzed
Deployment ISD eNodeB Antenna Height UE Antenna Height
Urban/Suburban (r <= 30 km) 1.732 km 30 m 1.5 m Rural (U/S Edge < r <= 100 km) 7 km 45 m 1.5 m
B.2.4 Requirements for Unwanted Emissions LTE specification defines requirements for two separate kinds of unwanted emissions, with those for spurious emissions being the more stringent. In addition to these minimum requirements, additional spectrum emission requirements defined in the 3GPP standard must be fulfilled for a specific deployment scenario such as intra-band contiguous Carrier Aggregation, cell handover, UL-MIMO, etc.
B.2.4.1. Out-of-Band (OOB) Emissions
Spectrum Emissions Mask (SEM)
• OOB specification is defined with respect to the edge of the occupied bandwidth and it is absolute value
• The 3GPP defines standard identifies two resolution measurement bandwidths (30 kHz and 1 MHz). For example, -15 dBm/30 kHz for ΔfOOB ± 0-1 in 5 MHz can be converted to 1 MHz bandwidth resolution results in a limit of 0.23 dBm/1MHz
24
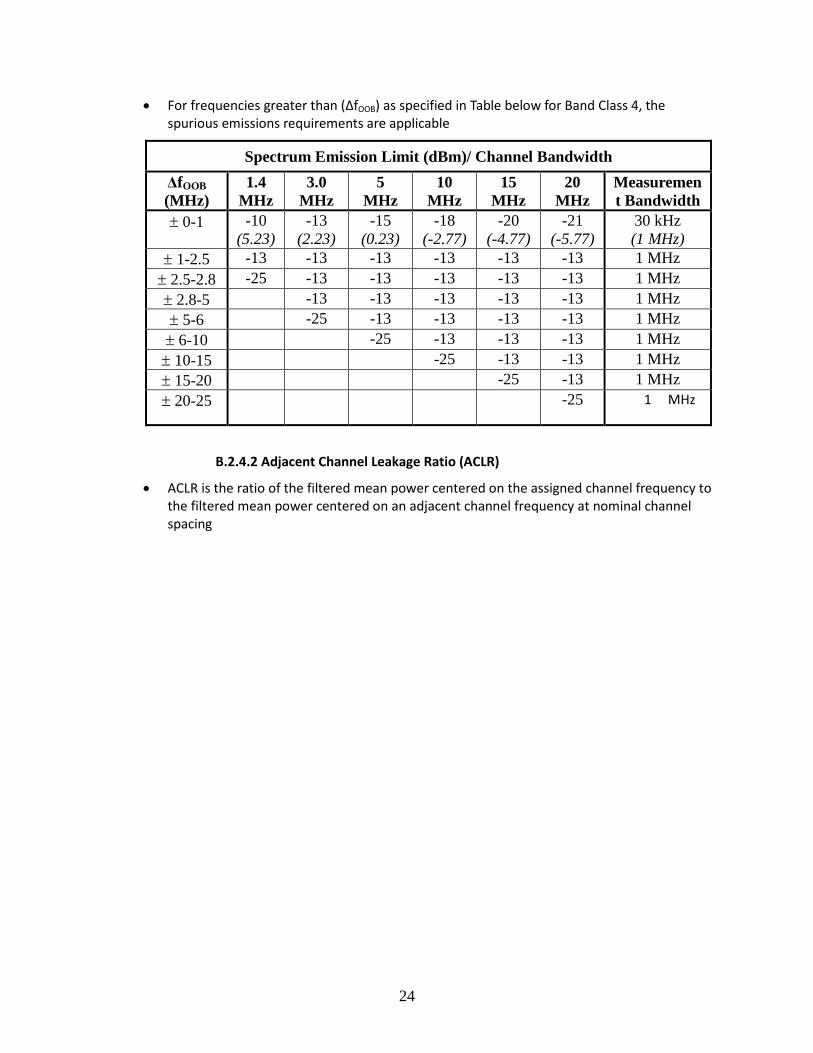
• For frequencies greater than (ΔfOOB) as specified in Table below for Band Class 4, the spurious emissions requirements are applicable
Spectrum Emission Limit (dBm)/ Channel Bandwidth ΔfOOB (MHz)
1.4 MHz
3.0 MHz
5 MHz
10 MHz
15 MHz
20 MHz
Measurement Bandwidth
± 0-1 -10 (5.23)
-13 (2.23)
-15 (0.23)
-18 (-2.77)
-20 (-4.77)
-21 (-5.77)
30 kHz (1 MHz)
± 1-2.5 -13 -13 -13 -13 -13 -13 1 MHz ± 2.5-2.8 -25 -13 -13 -13 -13 -13 1 MHz ± 2.8-5 -13 -13 -13 -13 -13 1 MHz ± 5-6 -25 -13 -13 -13 -13 1 MHz ± 6-10 -25 -13 -13 -13 1 MHz ± 10-15 -25 -13 -13 1 MHz ± 15-20 -25 -13 1 MHz ± 20-25 -25 1 MHz
B.2.4.2 Adjacent Channel Leakage Ratio (ACLR)
• ACLR is the ratio of the filtered mean power centered on the assigned channel frequency to the filtered mean power centered on an adjacent channel frequency at nominal channel spacing
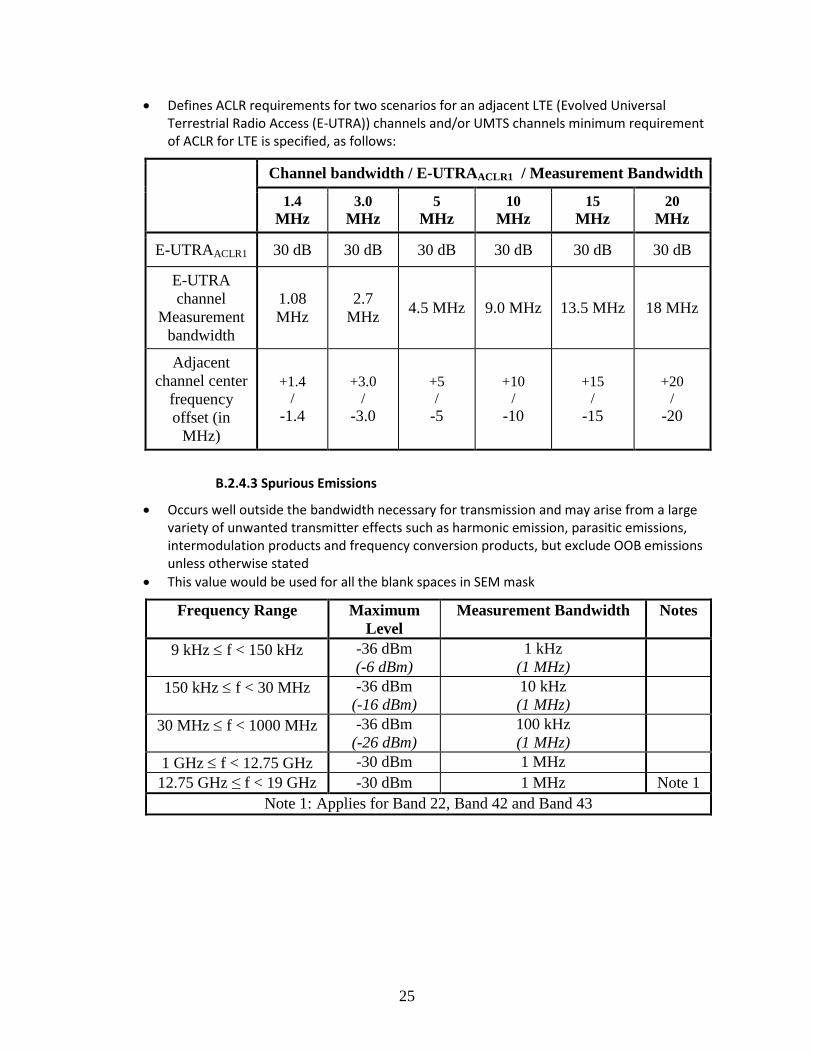
25
• Defines ACLR requirements for two scenarios for an adjacent LTE (Evolved Universal Terrestrial Radio Access (E-UTRA)) channels and/or UMTS channels minimum requirement of ACLR for LTE is specified, as follows:
Channel bandwidth / E-UTRAACLR1 / Measurement Bandwidth
1.4 MHz
3.0 MHz
5 MHz
10 MHz
15 MHz
20 MHz
E-UTRAACLR1 30 dB 30 dB 30 dB 30 dB 30 dB 30 dB
E-UTRA channel
Measurement bandwidth
1.08 MHz
2.7 MHz 4.5 MHz 9.0 MHz 13.5 MHz 18 MHz
Adjacent channel center
frequency offset (in
MHz)
+1.4 /
-1.4
+3.0 /
-3.0
+5 /
-5
+10 /
-10
+15 /
-15
+20 /
-20
B.2.4.3 Spurious Emissions
• Occurs well outside the bandwidth necessary for transmission and may arise from a large variety of unwanted transmitter effects such as harmonic emission, parasitic emissions, intermodulation products and frequency conversion products, but exclude OOB emissions unless otherwise stated
• This value would be used for all the blank spaces in SEM mask
Frequency Range Maximum Level
Measurement Bandwidth Notes
9 kHz ≤ f < 150 kHz -36 dBm (-6 dBm)
1 kHz (1 MHz)
150 kHz ≤ f < 30 MHz -36 dBm (-16 dBm)
10 kHz (1 MHz)
30 MHz ≤ f < 1000 MHz -36 dBm (-26 dBm)
100 kHz (1 MHz)
1 GHz ≤ f < 12.75 GHz -30 dBm 1 MHz 12.75 GHz ≤ f < 19 GHz -30 dBm 1 MHz Note 1
Note 1: Applies for Band 22, Band 42 and Band 43
26
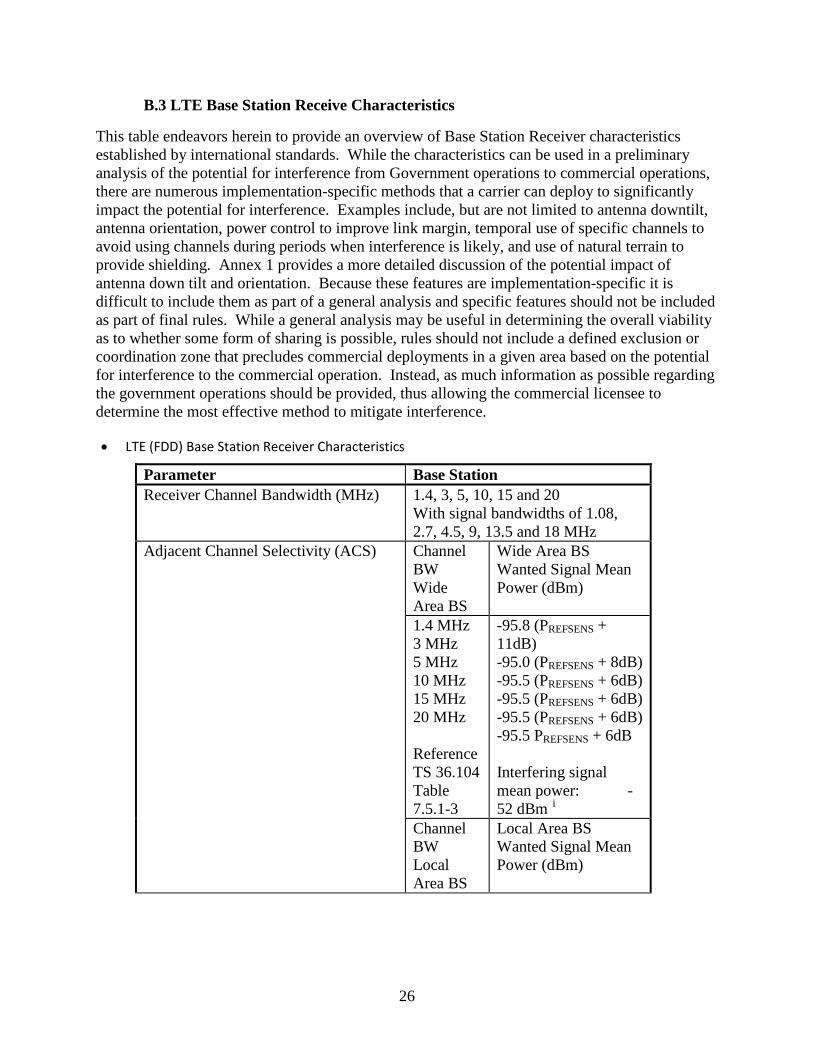
B.3 LTE Base Station Receive Characteristics
This table endeavors herein to provide an overview of Base Station Receiver characteristics established by international standards. While the characteristics can be used in a preliminary analysis of the potential for interference from Government operations to commercial operations, there are numerous implementation-specific methods that a carrier can deploy to significantly impact the potential for interference. Examples include, but are not limited to antenna downtilt, antenna orientation, power control to improve link margin, temporal use of specific channels to avoid using channels during periods when interference is likely, and use of natural terrain to provide shielding. Annex 1 provides a more detailed discussion of the potential impact of antenna down tilt and orientation. Because these features are implementation-specific it is difficult to include them as part of a general analysis and specific features should not be included as part of final rules. While a general analysis may be useful in determining the overall viability as to whether some form of sharing is possible, rules should not include a defined exclusion or coordination zone that precludes commercial deployments in a given area based on the potential for interference to the commercial operation. Instead, as much information as possible regarding the government operations should be provided, thus allowing the commercial licensee to determine the most effective method to mitigate interference.
• LTE (FDD) Base Station Receiver Characteristics
Parameter Base Station Receiver Channel Bandwidth (MHz) 1.4, 3, 5, 10, 15 and 20
With signal bandwidths of 1.08, 2.7, 4.5, 9, 13.5 and 18 MHz
Adjacent Channel Selectivity (ACS) Channel BW Wide Area BS
Wide Area BS Wanted Signal Mean Power (dBm)
1.4 MHz 3 MHz 5 MHz 10 MHz 15 MHz 20 MHz Reference TS 36.104 Table 7.5.1-3
-95.8 (PREFSENS + 11dB) -95.0 (PREFSENS + 8dB) -95.5 (PREFSENS + 6dB) -95.5 (PREFSENS + 6dB) -95.5 (PREFSENS + 6dB) -95.5 PREFSENS + 6dB Interfering signal mean power: -52 dBm i
Channel BW Local Area BS
Local Area BS Wanted Signal Mean Power (dBm)
27
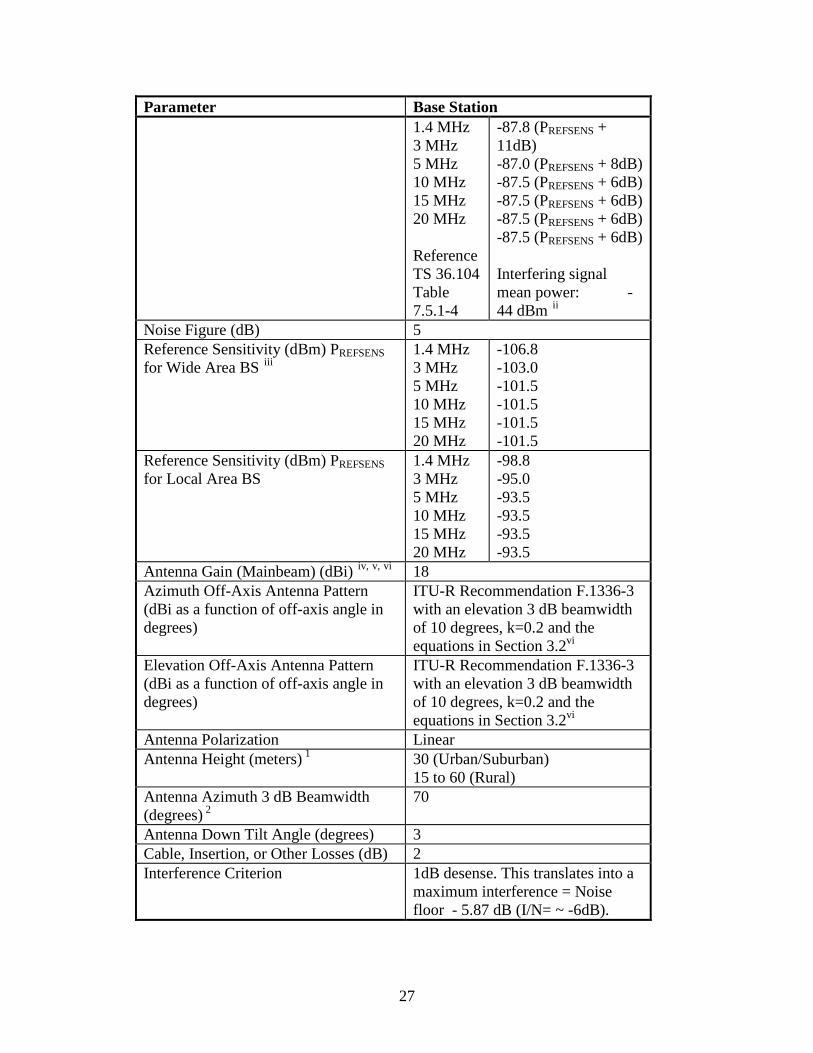
Parameter Base Station 1.4 MHz 3 MHz 5 MHz 10 MHz 15 MHz 20 MHz Reference TS 36.104 Table 7.5.1-4
-87.8 (PREFSENS + 11dB) -87.0 (PREFSENS + 8dB) -87.5 (PREFSENS + 6dB) -87.5 (PREFSENS + 6dB) -87.5 (PREFSENS + 6dB) -87.5 (PREFSENS + 6dB) Interfering signal mean power: -44 dBm ii
Noise Figure (dB) 5 Reference Sensitivity (dBm) PREFSENS for Wide Area BS iii
1.4 MHz 3 MHz 5 MHz 10 MHz 15 MHz 20 MHz
-106.8 -103.0 -101.5 -101.5 -101.5 -101.5
Reference Sensitivity (dBm) PREFSENS for Local Area BS
1.4 MHz 3 MHz 5 MHz 10 MHz 15 MHz 20 MHz
-98.8 -95.0 -93.5 -93.5 -93.5 -93.5
Antenna Gain (Mainbeam) (dBi) iv, v, vi 18 Azimuth Off-Axis Antenna Pattern (dBi as a function of off-axis angle in degrees)
ITU-R Recommendation F.1336-3 with an elevation 3 dB beamwidth of 10 degrees, k=0.2 and the equations in Section 3.2vi
Elevation Off-Axis Antenna Pattern (dBi as a function of off-axis angle in degrees)
ITU-R Recommendation F.1336-3 with an elevation 3 dB beamwidth of 10 degrees, k=0.2 and the equations in Section 3.2vi
Antenna Polarization Linear Antenna Height (meters) 1 30 (Urban/Suburban)
15 to 60 (Rural) Antenna Azimuth 3 dB Beamwidth (degrees) 2
70
Antenna Down Tilt Angle (degrees) 3 Cable, Insertion, or Other Losses (dB) 2 Interference Criterion 1dB desense. This translates into a
maximum interference = Noise floor - 5.87 dB (I/N= ~ -6dB).
28
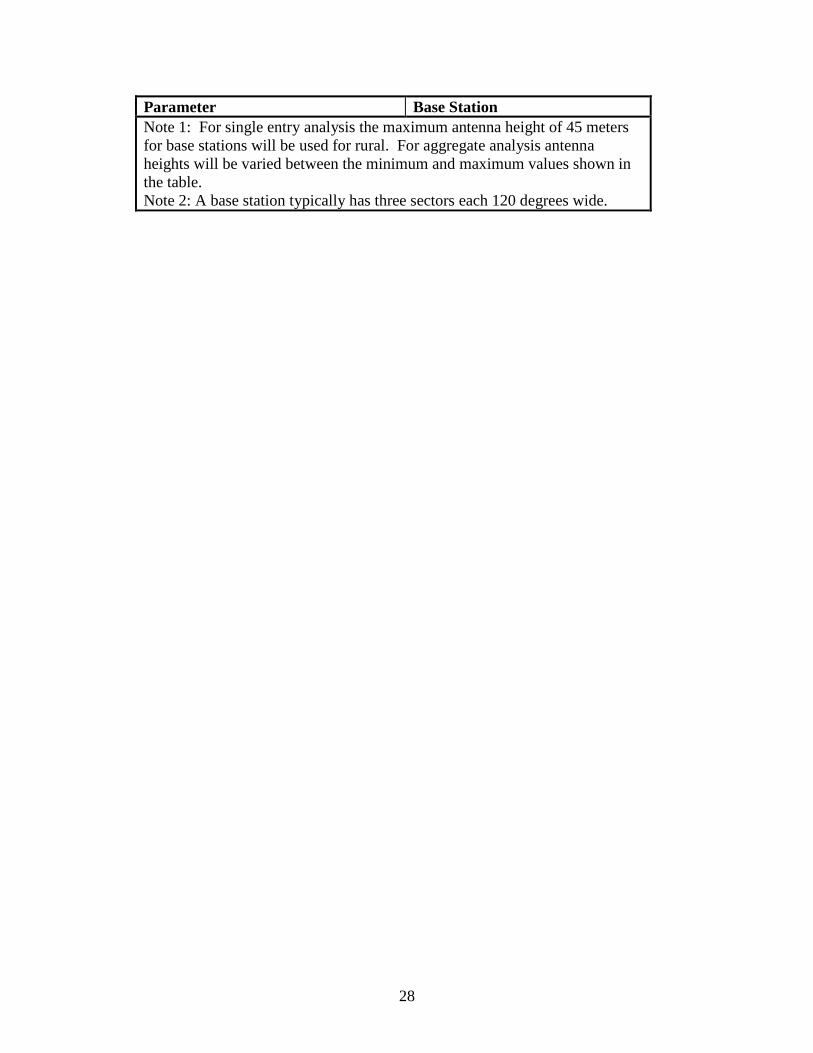
Parameter Base Station Note 1: For single entry analysis the maximum antenna height of 45 meters for base stations will be used for rural. For aggregate analysis antenna heights will be varied between the minimum and maximum values shown in the table. Note 2: A base station typically has three sectors each 120 degrees wide.
29
Notes: i This interfering signal mean power is for a wanted signal mean power at P_REFSENS + xdB (where x=6dB for 3-
20MHz channels and 11dB for 1.4MHz channel). One way to interpret this spec is that this is the maximum interference level for xdB desense criterion. For instance, if 1dB desense is used in the coexistence studies, a conversion can be done to adjust for the lower desense criterion. For example, if adjacent channel selectivity is specified as -52dBm and wanted signal mean power is P_REFSENS + 6dB, the level can be adjusted by 11dB for the smaller sensitivity degradation allowed giving -52-11= -63dBm:
• 1 dB desense: maximum interference = Noise floor - 5.87 dB ii Same as in footnote i, interfering signal mean power can be adjusted for 1dB desense if this criterion is used in
the coexistence studies. For example, in the case of wanted signal mean power at P_REFSENS + 6dB, the level can be adjusted by 11dB for the smaller sensitivity degradation allowed giving -44-11=-55dBm.
iii See 3GPP TS 36.104, §7.2. PREFSENS is the power level of a single instance of the reference measurement channel. This requirement shall be met for each consecutive application of a single instance of FRC A1-3 mapped to disjoint frequency ranges with a width of 25 resource blocks each.
iv Base station antennas, both receive and transmit, typically have strongly angle-dependent gain characteristics characterized by a horizontal and vertical beamwidth. The gain value listed here corresponds to the maximum gain corresponding to the main lobe of the antenna.
v Assuming full bore-sight gain of the LTE BS receive antenna (18dBi) may not reflect interference mitigation techniques as would be naturally deployed. Significant interference mitigation can be achieved via several factors, which are standard in the industry: e.g., antenna downtilts (point below the horizon, achieved by either mechanical and/or electrical means), antenna azimuth orientation (orient away from the interferer), and use of available terrain (where it exists) for additional refraction loss, etc. This needs to be taken into account when doing interference studies. The antenna techniques are further discussed in the Annex.
6 See Annex 8 of ITU-R Recommendation F.1336-3, which observes that the recommended equations for antenna gains often do not accurately reflect the gains of actual antennas – particularly with regard to the side lobes, as indicated in Figs 24 to 27 in Annex 8. This should be taken account when considering interference in directions far from the main antenna lobe.
30
ANNEX to Appendix B
Example: Interference Mitigation via Antenna Downtilting and Antenna Azimuth Orientation
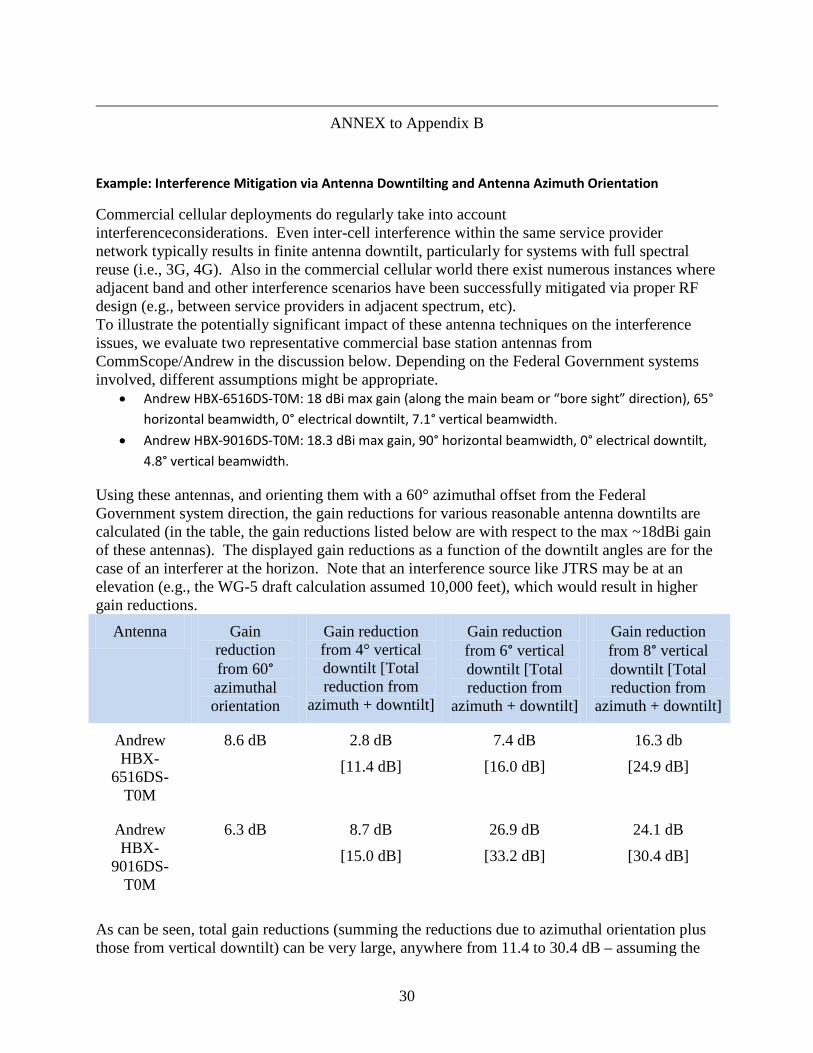
Commercial cellular deployments do regularly take into account interferenceconsiderations. Even inter-cell interference within the same service provider network typically results in finite antenna downtilt, particularly for systems with full spectral reuse (i.e., 3G, 4G). Also in the commercial cellular world there exist numerous instances where adjacent band and other interference scenarios have been successfully mitigated via proper RF design (e.g., between service providers in adjacent spectrum, etc). To illustrate the potentially significant impact of these antenna techniques on the interference issues, we evaluate two representative commercial base station antennas from CommScope/Andrew in the discussion below. Depending on the Federal Government systems involved, different assumptions might be appropriate.
• Andrew HBX-6516DS-T0M: 18 dBi max gain (along the main beam or “bore sight” direction), 65° horizontal beamwidth, 0° electrical downtilt, 7.1° vertical beamwidth.
• Andrew HBX-9016DS-T0M: 18.3 dBi max gain, 90° horizontal beamwidth, 0° electrical downtilt, 4.8° vertical beamwidth.
Using these antennas, and orienting them with a 60° azimuthal offset from the Federal Government system direction, the gain reductions for various reasonable antenna downtilts are calculated (in the table, the gain reductions listed below are with respect to the max ~18dBi gain of these antennas). The displayed gain reductions as a function of the downtilt angles are for the case of an interferer at the horizon. Note that an interference source like JTRS may be at an elevation (e.g., the WG-5 draft calculation assumed 10,000 feet), which would result in higher gain reductions.
Antenna Gain reduction from 60° azimuthal orientation
Gain reduction from 4° vertical downtilt [Total reduction from
azimuth + downtilt]
Gain reduction from 6° vertical downtilt [Total reduction from
azimuth + downtilt]
Gain reduction from 8° vertical downtilt [Total reduction from
azimuth + downtilt]
Andrew HBX-
6516DS-T0M
8.6 dB 2.8 dB
[11.4 dB]
7.4 dB
[16.0 dB]
16.3 db
[24.9 dB]
Andrew HBX-
9016DS-T0M
6.3 dB 8.7 dB
[15.0 dB]
26.9 dB
[33.2 dB]
24.1 dB
[30.4 dB]
As can be seen, total gain reductions (summing the reductions due to azimuthal orientation plus those from vertical downtilt) can be very large, anywhere from 11.4 to 30.4 dB – assuming the
31
Federal Government interfering transmitter is at the horizon in our example.