commercial - blominvestbank.com invest... · 2 commercial banking in the mena region chairman’s...
TRANSCRIPT

2
Commercial Banking in the MENA Region
Chairman’s letter
Dear Clients,
It is with pleasure that I present to you the first in a series of new research products BLOMINVEST Bank will publish as we continue our expansion inthe Middle East.
Our region is poised for an increasingly relevant, impactful, and exciting role on the world stage. Further, growing interdependence between MENAnations calls for a better understanding of both our existing similarities and differences. In this context, BLOMINVEST Bank is launching a series ofresearch papers that comprehensively detail economic and financial issues in the MENA region. In parallel, we shall work to provide both countryspecific reports and other focused studies.
At BLOMINVEST, we have a strong commitment to providing our clients with the context to derive a complete and timely understanding of marketevents. Our existing research portfolio, which shall now be supplemented by these research products on a monthly basis, is a demonstration of thiscommitment. As you know, BLOMINVEST has undertaken a significant expansion and now serves clients across Egypt, Jordan, Dubai, Abu Dhabi,Sharjah, Saudi Arabia, Syria, and Qatar. As we continue to broaden this presence, we shall augment our efforts with additional research and support.
In the midst of the current global financial turmoil, we have chosen to launch this report on commercial banking. As a critical sector that is drivinggrowth in economies across the MENA region, and one which is being buffeted by an international crisis, commercial banking is highly relevant to theimmediate and near term future of MENA countries.
I look forward to sharing additional reports in the future and trust that you will find this paper insightful. I encourage you to contact the researchdepartment for additional information and to assist you with any queries that you may have.
Best Regards,
Saad Azhari

3
Commercial Banking in the MENA Region
For your queries
Research Department
Marwan Mikhael Head of Research [email protected] Tel: +961 1 737 247 Fax: +961 1 737 414
Alexandre Mouradian Deputy Head of Research [email protected] Tel: +961 1 743 300 Ext: 1414 Fax: +961 1 737 414
Cynthia Zeilah Analyst [email protected] Tel: +961 1 743 300 Ext: 1413 Fax: +961 1 737 414
Rebecca Nakhoul Analyst [email protected] Tel: +961 1 743 300 Ext: 1418 Fax: +961 1 737 414
Yasmina Merhi [email protected]: +961 1 743 300 Ext: 1410
Fax: +961 1 737 414
Jean Claude Cherfane Analyst [email protected]
Tel: +961 1 743 300 Ext: 1416 Fax: +961 1 737 414
Research Department [email protected] Tel: +961 1 747 802 +961 1 747 812 Fax: +961 1 737414

4
Commercial Banking in the MENA Region
Table of Contents
Chairman’s letter .......................................................................................................................................................... 2
For your queries ........................................................................................................................................................... 3
Table of Contents ......................................................................................................................................................... 4
Executive Summary ...................................................................................................................................................... 6
1 Global Commercial Banking Overview..................................................................................................................... 8
1.1 Recent Central Bank and Government actions .............................................................................................................. 92 Regional Overview – Middle East and North Africa ................................................................................................11
2.1 Economic Overview..................................................................................................................................................... 112.1.1 Comparative Economic Landscape ....................................................................................................................... 13
2.2 Banking Industry Overview ......................................................................................................................................... 142.2.1 Banking Industry Drivers....................................................................................................................................... 142.2.2 Performance Indicators......................................................................................................................................... 15
2.3 Market Dynamics and Industry Structure.................................................................................................................... 182.4 Competitive landscape................................................................................................................................................ 20
2.4.1 Metrics for listed banks in the region ................................................................................................................... 202.4.2 Multiples Comparison ........................................................................................................................................... 22
2.5 Recent Developments in the region ............................................................................................................................ 222.5.1 Impact of the Economic crisis in the MENA region ............................................................................................... 242.5.2 Recent projects hit by the crisis............................................................................................................................. 242.5.3 Direct Impact – Write downs in the region ........................................................................................................... 242.5.4 Government moves to face the credit crunch....................................................................................................... 24
3 Country wise Commercial Banking Overview .........................................................................................................26
3.1 Bahrain ....................................................................................................................................................................... 263.1.1 Economic Overview............................................................................................................................................... 263.1.2 Industry Overview ................................................................................................................................................. 26
3.2 Egypt ........................................................................................................................................................................... 283.2.1 Economic Overview............................................................................................................................................... 283.2.2 Industry Overview ................................................................................................................................................. 29
3.3 Jordan ......................................................................................................................................................................... 293.3.1 Economic Overview............................................................................................................................................... 293.3.2 Industry Overview ................................................................................................................................................. 30
3.4 Kuwait......................................................................................................................................................................... 323.4.1 Economic Overview............................................................................................................................................... 323.4.2 Industry Overview ................................................................................................................................................. 32
3.5 Lebanon ...................................................................................................................................................................... 343.5.1 Economic Overview............................................................................................................................................... 343.5.2 Industry Overview ................................................................................................................................................. 34
3.6 Oman .......................................................................................................................................................................... 353.6.1 Economic Overview............................................................................................................................................... 353.6.2 Industry Overview ................................................................................................................................................. 36
3.7 Qatar........................................................................................................................................................................... 373.7.1 Economic Overview............................................................................................................................................... 373.7.2 Industry Overview ................................................................................................................................................. 38
3.8 Saudi Arabia................................................................................................................................................................ 403.8.1 Economic Overview............................................................................................................................................... 40
5
Commercial Banking in the MENA Region
3.8.2 Industry Overview ................................................................................................................................................. 403.9 United Arab Emirates .................................................................................................................................................. 42
3.9.1 Economic Overview............................................................................................................................................... 423.9.2 Industry Overview ................................................................................................................................................. 43
4 Banking Sector vs. Capital Markets ........................................................................................................................45
5 Opportunities and Challenges ................................................................................................................................46
5.1 Penetration of Insurance............................................................................................................................................. 465.2 Microfinance ............................................................................................................................................................... 465.3 Remittances ................................................................................................................................................................ 475.4 Small and Medium Enterprises.................................................................................................................................... 475.5 Internet based banking services .................................................................................................................................. 485.6 Continuation of the reform process ............................................................................................................................ 495.7 Political and economic uncertainties........................................................................................................................... 495.8 Islamic Banking ........................................................................................................................................................... 495.9 Banking infrastructure and Risk Management ............................................................................................................ 50
6 Future Outlook ......................................................................................................................................................51
7 Appendix ...............................................................................................................................................................54
7.1 Appendix 1 Major Banking players in the region ....................................................................................................... 547.1.1 Bank Muscat ......................................................................................................................................................... 547.1.2 Bank of Sharjah..................................................................................................................................................... 557.1.3 Banque Saudi Fransi.............................................................................................................................................. 567.1.4 National Bank of Bahrain...................................................................................................................................... 577.1.5 Ahli United Bank ................................................................................................................................................... 587.1.6 Commercial International Bank (Egypt)................................................................................................................ 597.1.7 Societe Arabe Internationale De Banque .............................................................................................................. 607.1.8 Arab Bank ............................................................................................................................................................. 617.1.9 Jordan Kuwait Bank .............................................................................................................................................. 627.1.10 National Bank of Kuwait ..................................................................................................................................... 637.1.11 Commercial Bank of Kuwait................................................................................................................................ 647.1.12 Bank Audi SAL ..................................................................................................................................................... 657.1.13 BLOM Bank ......................................................................................................................................................... 667.1.14 Commercial Bank of Qatar.................................................................................................................................. 677.1.15 National Bank of Fujairah ................................................................................................................................... 687.1.16 National Bank of Oman....................................................................................................................................... 697.1.17 Qatar National Bank ........................................................................................................................................... 707.1.18 Riyad Bank .......................................................................................................................................................... 71
7.2 Appendix 2 – Acronyms............................................................................................................................................... 727.3 ............................................................................................................................................................................................ 737.4 ............................................................................................................................................................................................ 73
6
Commercial Banking in the MENA Region
Executive Summary
The Middle East and North Africa (MENA) region accommodates a diversity of people, economies and resources. Religion is the most common of themany threads that connect the region, but from an economic standpoint, the area can be broadly categorized into two main subgroups. On one handare the OPEC member countries like Saudi Arabia, UAE, and Kuwait which together hold a major chunk of the total world’s oil reserves. On the otherhand, nations such as Lebanon and Jordan are relatively scarce in oil or gas, making services and real estate the major contributors to GDP. Betweenthe two is Egypt, where the largest share of GDP comes from gas, and yet is not sufficient to join the category of resource rich nations. Giveneconomic and commodity cycles, there are times of plenty in the region and times of relative hardship. GDP growth for the region is forecastedbetween 5 6% and is expected to remain healthy despite the dampening effect of recent lower oil prices and the global economic slowdown.
Another clear result that emerges from the distribution of natural resources across the region is the linkage and interdependence between differentgroups of countries. The availability of oil driven cash flows acts as a strong intra regional development and investment opportunity. This is supportedby large populations in some countries and lesser populations in others. This diversity also forms the basis of people moving across the region andultimately resulting in a redistribution of wealth across the region.
The strong cash flows into the region provide opportunities for long term growth and trade development within the region. These are the majordrivers of a thriving commercial banking industry coupled with strong banking regulation. The commercial banking industry as in most other regions iscentrally regulated by the country’s central banks and/or the monetary authorities. Certain steps have been taken to arrest the impact of the crisisand continue the momentum built till mid 2008. Apart from the regulator’s role, some other factors as follows, have helped mitigate the impact ofthe global crisis on the banking system:(i) a not very expansive focus of the commercial banks in the region,(ii) high growth forecasts and therefore vast banking opportunities in the region,(iii) the industry as a whole still in evolving stage with minimal presence of sophisticated instruments like derivatives,(iv) the Islamic banking structure not yet comfortable with derivatives and similar products.
Religion plays an important role in the region and in fact has helped develop two different banking methodologies, the conventional system and theIslamic system. The latter however is still relatively new and continues to evolve further. It remains to be seen though how the two coexist in themarket as independent commercial systems geared towards economic profit and growth. The region is clearly aware of the need for world classbanking supervision, whether it covers Conventional or Islamic banking, and Bahrain is a good example of such thought and practice. The duality ofConventional and Islamic banking can only in the long run complement each other and be beneficial to the region.
High global oil prices during the first half of 2008 have helped the oil rich countries shore up handsome surplus which is being channeled into largescale developmental projects initiated by the governments. Extensive reforms undertaken by the regional governments and a strategy of activelydiversifying the economies away from oil is pumping capital to develop other sectors like manufacturing and financial services. The region has seentrade tariffs coming down from 20% in 2000 to 13% in 2007. With many countries now joining the World Trade Organization, it is only a matter oftime that non trade barriers and logistics will move favorably.
The industry should remain resilient to the global crisis due to the relatively strong assets compared to other developed countries. The oil richcountries withstand the global slowdown with relative ease, though at the cost of slowing down development activities. However, the region has seenhigh levels of construction activity fuelled by easy borrowing, and these ventures are likely to feel the impact. This in turn will lead to a trickle downeffect on the financiers, service providers and employees related to this business.
The banking system will benefit from the economic slowdown in many ways. There will be a period to look back, consolidate and learn many lessonsfrom this current crisis for bankers, regulators and borrowers alike.
The banking industry in the region has much to look forward to, despite the global turmoil. The primary factors that should spur future growth arefavorable demographics and low banking penetration. Most countries have large populations in the employable age of 15 to 60 years. Creation ofspecial economic zones like the six cities in Saudi Arabia, the finance centers in Qatar and Bahrain are expected to create opportunities foremployment. Moreover, the movement of expatriates will also further demand and credit growth. The penetration of banking still remains low in theregion. While part of this is due to the industry’s stage of evolution, part of it is because of an inclination towards branch based banking. Penetrationof internet based services is low as well, with most local banks only following initiatives taken by international players.
As the industry matures and the financial sector develops, need for insurance is likely to rise, helping banks increase their share of fee based incomeas against interest related income. Banks with ample infrastructure and distribution mechanisms are likely to do well in capturing the up sell/crosssell opportunity. Large intra regional movement of capital and people between oil exporting and importing countries has always kept the remittancemarket strong. The conventional money transfer bureaus are likely to face difficult times owing to high fees and emergence of internet and phone

7
Commercial Banking in the MENA Region
based channels. Banks can play a vital role in providing the last mile linkage to the transfer process and add yet another significant fee based revenuestream.
Most oil based economies have been traditionally run by large monopolistic giants, with most support services outsourced to specialized vendors.Diversification of the economy is expected to bring about the emergence of many small and medium enterprises engaged in support activities andspill into basic manufacturing and other service sectors. The ability to provide credit and business banking solutions to this space will help banksexpand portfolios away from the large wholesale and plain retail segments, as well as being a more active part of the diversification success story.
The ongoing global crisis has brought banking in most countries under scrutiny. In times of sophisticated financial instruments, cross border linkagesand economic and financial interdependence; it is unreasonable to believe that the region would remain immune. The extent of damage however issomething that only time will tell. Given the fundamentals of the regional economies, and the positioning of the industry, it is plausible to expectshort term shock waves, but the long term outlook remains optimistic and geared for growth.
8
Commercial Banking in the MENA Region
1 Global Commercial Banking Overview
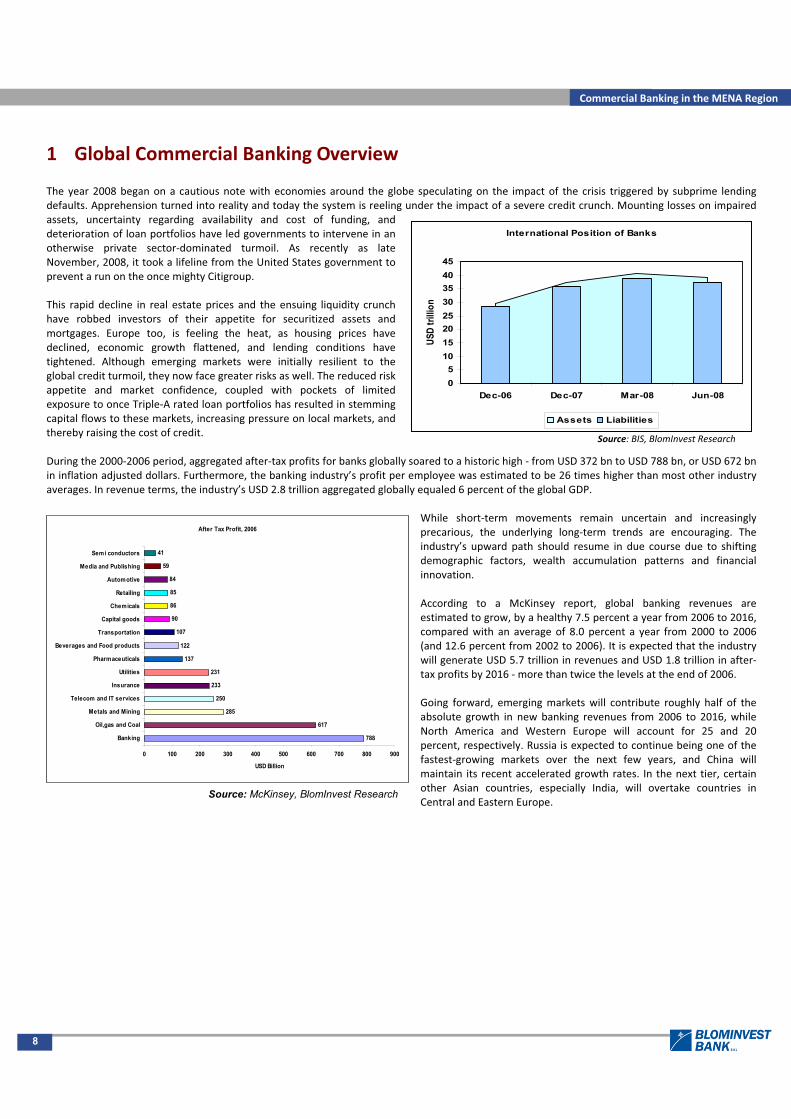
The year 2008 began on a cautious note with economies around the globe speculating on the impact of the crisis triggered by subprime lendingdefaults. Apprehension turned into reality and today the system is reeling under the impact of a severe credit crunch. Mounting losses on impairedassets, uncertainty regarding availability and cost of funding, anddeterioration of loan portfolios have led governments to intervene in anotherwise private sector dominated turmoil. As recently as lateNovember, 2008, it took a lifeline from the United States government toprevent a run on the once mighty Citigroup.
This rapid decline in real estate prices and the ensuing liquidity crunchhave robbed investors of their appetite for securitized assets andmortgages. Europe too, is feeling the heat, as housing prices havedeclined, economic growth flattened, and lending conditions havetightened. Although emerging markets were initially resilient to theglobal credit turmoil, they now face greater risks as well. The reduced riskappetite and market confidence, coupled with pockets of limitedexposure to once Triple A rated loan portfolios has resulted in stemmingcapital flows to these markets, increasing pressure on local markets, andthereby raising the cost of credit.
During the 2000 2006 period, aggregated after tax profits for banks globally soared to a historic high from USD 372 bn to USD 788 bn, or USD 672 bnin inflation adjusted dollars. Furthermore, the banking industry’s profit per employee was estimated to be 26 times higher than most other industryaverages. In revenue terms, the industry’s USD 2.8 trillion aggregated globally equaled 6 percent of the global GDP.
While short term movements remain uncertain and increasinglyprecarious, the underlying long term trends are encouraging. Theindustry’s upward path should resume in due course due to shiftingdemographic factors, wealth accumulation patterns and financialinnovation.
According to a McKinsey report, global banking revenues areestimated to grow, by a healthy 7.5 percent a year from 2006 to 2016,compared with an average of 8.0 percent a year from 2000 to 2006(and 12.6 percent from 2002 to 2006). It is expected that the industrywill generate USD 5.7 trillion in revenues and USD 1.8 trillion in aftertax profits by 2016 more than twice the levels at the end of 2006.
Going forward, emerging markets will contribute roughly half of theabsolute growth in new banking revenues from 2006 to 2016, whileNorth America and Western Europe will account for 25 and 20percent, respectively. Russia is expected to continue being one of thefastest growing markets over the next few years, and China willmaintain its recent accelerated growth rates. In the next tier, certainother Asian countries, especially India, will overtake countries inCentral and Eastern Europe.
Source: BIS, BlomInvest Research
International Position of Banks
05
1015202530354045
Dec-06 Dec-07 Mar-08 Jun-08
USD
trilli
onAssets Liabilities
Source: McKinsey, BlomInvest Research
After Tax Profit, 2006
788
617
285
250
233
231
137
122
107
90
86
85
84
59
41
0 100 200 300 400 500 600 700 800 900
Banking
Oil,gas and Coal
Metals and Mining
Telecom and IT services
Insurance
Utilities
Pharmaceuticals
Beverages and Food products
Transportation
Capital goods
Chemicals
Retailing
Automotive
Media and Publishing
Semi conductors
USD Billion
9
Commercial Banking in the MENA Region
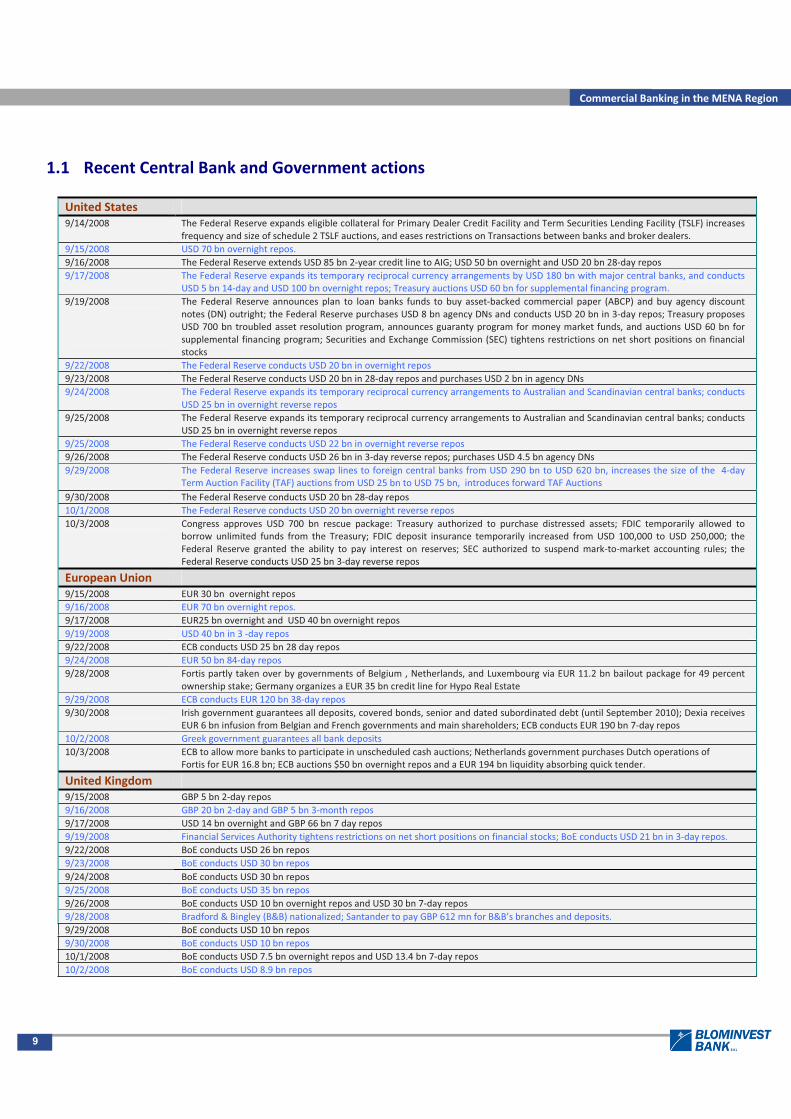
1.1 Recent Central Bank and Government actions
United States9/14/2008 The Federal Reserve expands eligible collateral for Primary Dealer Credit Facility and Term Securities Lending Facility (TSLF) increases
frequency and size of schedule 2 TSLF auctions, and eases restrictions on Transactions between banks and broker dealers.9/15/2008 USD 70 bn overnight repos.9/16/2008 The Federal Reserve extends USD 85 bn 2 year credit line to AIG; USD 50 bn overnight and USD 20 bn 28 day repos9/17/2008 The Federal Reserve expands its temporary reciprocal currency arrangements by USD 180 bn with major central banks, and conducts
USD 5 bn 14 day and USD 100 bn overnight repos; Treasury auctions USD 60 bn for supplemental financing program.9/19/2008 The Federal Reserve announces plan to loan banks funds to buy asset backed commercial paper (ABCP) and buy agency discount
notes (DN) outright; the Federal Reserve purchases USD 8 bn agency DNs and conducts USD 20 bn in 3 day repos; Treasury proposesUSD 700 bn troubled asset resolution program, announces guaranty program for money market funds, and auctions USD 60 bn forsupplemental financing program; Securities and Exchange Commission (SEC) tightens restrictions on net short positions on financialstocks
9/22/2008 The Federal Reserve conducts USD 20 bn in overnight repos9/23/2008 The Federal Reserve conducts USD 20 bn in 28 day repos and purchases USD 2 bn in agency DNs9/24/2008 The Federal Reserve expands its temporary reciprocal currency arrangements to Australian and Scandinavian central banks; conducts
USD 25 bn in overnight reverse repos9/25/2008 The Federal Reserve expands its temporary reciprocal currency arrangements to Australian and Scandinavian central banks; conducts
USD 25 bn in overnight reverse repos9/25/2008 The Federal Reserve conducts USD 22 bn in overnight reverse repos9/26/2008 The Federal Reserve conducts USD 26 bn in 3 day reverse repos; purchases USD 4.5 bn agency DNs9/29/2008 The Federal Reserve increases swap lines to foreign central banks from USD 290 bn to USD 620 bn, increases the size of the 4 day
Term Auction Facility (TAF) auctions from USD 25 bn to USD 75 bn, introduces forward TAF Auctions9/30/2008 The Federal Reserve conducts USD 20 bn 28 day repos10/1/2008 The Federal Reserve conducts USD 20 bn overnight reverse repos10/3/2008 Congress approves USD 700 bn rescue package: Treasury authorized to purchase distressed assets; FDIC temporarily allowed to
borrow unlimited funds from the Treasury; FDIC deposit insurance temporarily increased from USD 100,000 to USD 250,000; theFederal Reserve granted the ability to pay interest on reserves; SEC authorized to suspend mark to market accounting rules; theFederal Reserve conducts USD 25 bn 3 day reverse repos
European Union9/15/2008 EUR 30 bn overnight repos9/16/2008 EUR 70 bn overnight repos.9/17/2008 EUR25 bn overnight and USD 40 bn overnight repos9/19/2008 USD 40 bn in 3 day repos9/22/2008 ECB conducts USD 25 bn 28 day repos9/24/2008 EUR 50 bn 84 day repos9/28/2008 Fortis partly taken over by governments of Belgium , Netherlands, and Luxembourg via EUR 11.2 bn bailout package for 49 percent
ownership stake; Germany organizes a EUR 35 bn credit line for Hypo Real Estate9/29/2008 ECB conducts EUR 120 bn 38 day repos9/30/2008 Irish government guarantees all deposits, covered bonds, senior and dated subordinated debt (until September 2010); Dexia receives
EUR 6 bn infusion from Belgian and French governments and main shareholders; ECB conducts EUR 190 bn 7 day repos10/2/2008 Greek government guarantees all bank deposits10/3/2008 ECB to allow more banks to participate in unscheduled cash auctions; Netherlands government purchases Dutch operations of
Fortis for EUR 16.8 bn; ECB auctions $50 bn overnight repos and a EUR 194 bn liquidity absorbing quick tender.
United Kingdom9/15/2008 GBP 5 bn 2 day repos9/16/2008 GBP 20 bn 2 day and GBP 5 bn 3 month repos9/17/2008 USD 14 bn overnight and GBP 66 bn 7 day repos9/19/2008 Financial Services Authority tightens restrictions on net short positions on financial stocks; BoE conducts USD 21 bn in 3 day repos.9/22/2008 BoE conducts USD 26 bn repos9/23/2008 BoE conducts USD 30 bn repos9/24/2008 BoE conducts USD 30 bn repos9/25/2008 BoE conducts USD 35 bn repos9/26/2008 BoE conducts USD 10 bn overnight repos and USD 30 bn 7 day repos9/28/2008 Bradford & Bingley (B&B) nationalized; Santander to pay GBP 612 mn for B&B’s branches and deposits.9/29/2008 BoE conducts USD 10 bn repos9/30/2008 BoE conducts USD 10 bn repos10/1/2008 BoE conducts USD 7.5 bn overnight repos and USD 13.4 bn 7 day repos10/2/2008 BoE conducts USD 8.9 bn repos

10
Commercial Banking in the MENA Region
10/3/2008 BoE extends eligible collateral for its weekly long term repo operations to include AAA rated ABS and highly rated ABCP; conductsUSD 8.2 bn overnight repos and USD 30 bn 7 day repos.
Others9/15/2008 Other central banks provide liquidity, including Japan (YEN 1.5 tril.) and Australia (AUD 2.1 bn, among others.9/16/2008 Other central banks provide liquidity, including Japan (YEN 2.5 tril.), Switzerland (SF726.4 mn) and Australia (AUD1.7 bn), among
others
9/17/2008 Other central banks provide liquidity, including Japan (YEN 2.5 tril.), and Australia (AUD2.8 bn), among others.
9/19/2008 Other central banks provide liquidity, including Japan (YEN 3 tril.), Switzerland (USD 10 bn), and Australia (AUD1.9 bn), among others;several regulatory institutions impose restrictions on equity short sales
9/29/2008 Iceland’s government takes 75 percent stake in Glitnir Bank10/2/2008 Brazilian central bank eases reserve requirements10/3/2008 Russian central bank extends unsecured loans to qualified banks for up to six months and introduces other measures
11
Commercial Banking in the MENA Region
2 Regional Overview – Middle East and North Africa
2.1 Economic OverviewThe global financial crisis has come to the shores of theMENA region through two primary channels. Medium toLong term oil price weakness is the first and themost serious. WTI crude’s slide down to aroundUSD 55/barrel in mid November from a peak of USD147/barrel in mid July 2008 has sent terror wavesacross the oil rich economies in this region.Secondly, the exit of foreign capital including awithdrawal from equities has been the other factorbehind a fall in bank reserves across mostcountries.
However, the banking system should remainresilient over the coming quarters due to relativelystronger assets vis à vis many westerncounterparts.
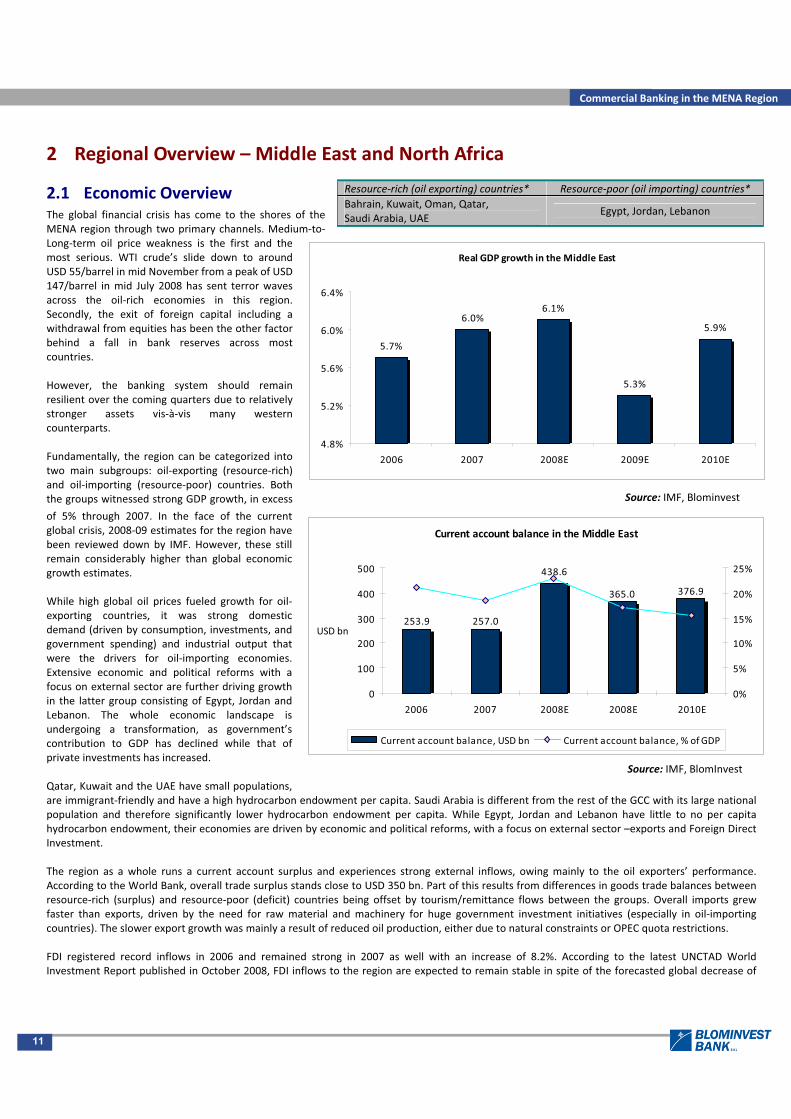
Fundamentally, the region can be categorized intotwo main subgroups: oil exporting (resource rich)and oil importing (resource poor) countries. Boththe groups witnessed strong GDP growth, in excess
of 5% through 2007. In the face of the currentglobal crisis, 2008 09 estimates for the region havebeen reviewed down by IMF. However, these stillremain considerably higher than global economicgrowth estimates.
While high global oil prices fueled growth for oilexporting countries, it was strong domesticdemand (driven by consumption, investments, andgovernment spending) and industrial output thatwere the drivers for oil importing economies.Extensive economic and political reforms with afocus on external sector are further driving growthin the latter group consisting of Egypt, Jordan andLebanon. The whole economic landscape isundergoing a transformation, as government’scontribution to GDP has declined while that ofprivate investments has increased.
Qatar, Kuwait and the UAE have small populations,are immigrant friendly and have a high hydrocarbon endowment per capita. Saudi Arabia is different from the rest of the GCC with its large nationalpopulation and therefore significantly lower hydrocarbon endowment per capita. While Egypt, Jordan and Lebanon have little to no per capitahydrocarbon endowment, their economies are driven by economic and political reforms, with a focus on external sector –exports and Foreign DirectInvestment.
The region as a whole runs a current account surplus and experiences strong external inflows, owing mainly to the oil exporters’ performance.According to the World Bank, overall trade surplus stands close to USD 350 bn. Part of this results from differences in goods trade balances betweenresource rich (surplus) and resource poor (deficit) countries being offset by tourism/remittance flows between the groups. Overall imports grewfaster than exports, driven by the need for raw material and machinery for huge government investment initiatives (especially in oil importingcountries). The slower export growth was mainly a result of reduced oil production, either due to natural constraints or OPEC quota restrictions.
FDI registered record inflows in 2006 and remained strong in 2007 as well with an increase of 8.2%. According to the latest UNCTAD WorldInvestment Report published in October 2008, FDI inflows to the region are expected to remain stable in spite of the forecasted global decrease of
Resource rich (oil exporting) countries* Resource poor (oil importing) countries*Bahrain, Kuwait, Oman, Qatar,Saudi Arabia, UAE
Egypt, Jordan, Lebanon
Real GDP growth in the Middle East
5.7%
6.0%6.1%
5.3%
5.9%
4.8%
5.2%
5.6%
6.0%
6.4%
2006 2007 2008E 2009E 2010E
Source: IMF, Blominvest
Current account balance in the Middle East
438.6
253.9 257.0
365.0 376.9
0
100
200
300
400
500
2006 2007 2008E 2008E 2010E
USD bn
0%
5%
10%
15%
20%
25%
Current account balance, USD bn Current account balance, % ofGDP
Source: IMF, BlomInvest
12
Commercial Banking in the MENA Region
10%. The intra regional capital flows have witnessed two major trends. On the demand side, public sectors have opened up and announced a seriesof structural reforms, including progress on Basel II implementation in most countries; whereas on the supply side, booming oil prices till mid 2008have brought in ample liquidity.
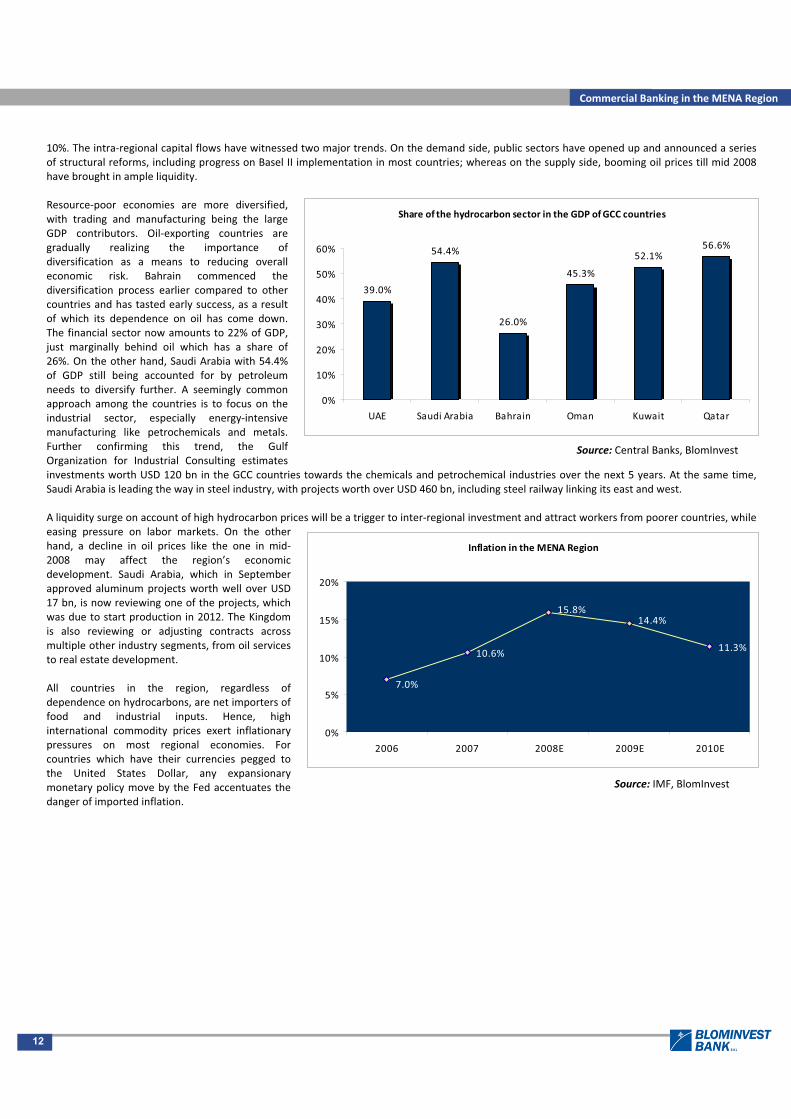
Resource poor economies are more diversified,with trading and manufacturing being the largeGDP contributors. Oil exporting countries aregradually realizing the importance ofdiversification as a means to reducing overalleconomic risk. Bahrain commenced thediversification process earlier compared to othercountries and has tasted early success, as a resultof which its dependence on oil has come down.The financial sector now amounts to 22% of GDP,just marginally behind oil which has a share of26%. On the other hand, Saudi Arabia with 54.4%of GDP still being accounted for by petroleumneeds to diversify further. A seemingly commonapproach among the countries is to focus on theindustrial sector, especially energy intensivemanufacturing like petrochemicals and metals.Further confirming this trend, the GulfOrganization for Industrial Consulting estimatesinvestments worth USD 120 bn in the GCC countries towards the chemicals and petrochemical industries over the next 5 years. At the same time,Saudi Arabia is leading the way in steel industry, with projects worth over USD 460 bn, including steel railway linking its east and west.
A liquidity surge on account of high hydrocarbon prices will be a trigger to inter regional investment and attract workers from poorer countries, whileeasing pressure on labor markets. On the otherhand, a decline in oil prices like the one in mid2008 may affect the region’s economicdevelopment. Saudi Arabia, which in Septemberapproved aluminum projects worth well over USD17 bn, is now reviewing one of the projects, whichwas due to start production in 2012. The Kingdomis also reviewing or adjusting contracts acrossmultiple other industry segments, from oil servicesto real estate development.
All countries in the region, regardless ofdependence on hydrocarbons, are net importers offood and industrial inputs. Hence, highinternational commodity prices exert inflationarypressures on most regional economies. Forcountries which have their currencies pegged tothe United States Dollar, any expansionarymonetary policy move by the Fed accentuates thedanger of imported inflation.
Inflation in the MENA Region
10.6% 11.3%
15.8%
7.0%
14.4%
0%
5%
10%
15%
20%
2006 2007 2008E 2009E 2010E
Source: IMF, BlomInvest
Share of the hydrocarbon sector in the GDP ofGCC countries
39.0%
54.4%
26.0%
45.3%
52.1%56.6%
0%
10%
20%
30%
40%
50%
60%
UAE Saudi Arabia Bahrain Oman Kuwait Qatar
Source: Central Banks, BlomInvest

13
Commercial Banking in the MENA Region
2.1.1 Comparative Economic Landscape
All figures as per latest releases viz. 2006 07* Assuming 100 for the year 2000, except Egypt where 2001/2002=100** For Egypt, data given is for fiscal year 2007 2008*** Oil and gas sector combined
Sources: IMF World Economic Outlook Report 10/2008, CIA World Factbook, The Economist Intelligence Unit, Bank Audi, The Gulf Times, Central Bank of the UnitedArab Emirates, United Arab Emirates Ministry of Economy, Saudi Arabian Monetary Agency, Central Bank of Bahrain, Bahrain Ministry of Finance, Central Bank of Oman,Central Bank of Kuwait, Qatar Central Bank, Central Bank of Jordan, Jordan Department of Statistics, Banque du Liban, Central Bank of Egypt
Rank GDP growth Investments/GDP Current account/GDP Money supply/GDP Fiscal balance/GDP Employment
1 Qatar Qatar Kuwait Egypt Kuwait Qatar
2 UAE Jordan Saudi Arabia UAE UAE Kuwait
3 Egypt Lebanon UAE Bahrain Qatar UAE
4 Bahrain Saudi Arabia Bahrain Lebanon Saudi Arabia Saudi Arabia
5 Jordan Egypt Qatar Kuwait Bahrain Egypt
6 Oman UAE Oman Saudi Arabia Oman Jordan
7 Kuwait Oman Egypt Qatar Jordan Oman
8 Saudi Arabia Kuwait Lebanon Oman Egypt Bahrain / Lebanon
9 Lebanon Bahrain Jordan Jordan Lebanon
UAE KSA Bahrain Oman Kuwait Qatar Jordan Lebanon Egypt**
GDP (USD bn)* 117.99 247.86 13.37 28.32 67.57 31.20 13.27 21.31 96.13
GDP per capita(current prices, USD ‘000)
42.501 15.724 22.771 15.714 33.687 78.754 2.766 6.569 1.739
Inflation (%) 11.1% 4.11% 3.4% 5.50% 4.98% 13.76% 5.4% 9.3% 8.81%
Investment (USD bn) 40.44 83.28 3.48 8.13 22.05 29.34 4.47 5.42 33.12
Current a/c balance (USD bn) 37.01 95.12 2.90 4.0 47.47 10.45 2.98 2.63 0.9
Money supply(USD bn)
154.04 177.97 14.92 15.88 66.80 32.32 2.11 16.44 141.60
Interest rate (%) 4.25 5.5 5.3 6.02 6.25 5.55 7 12 10
Velocity of money circulation 1.02 2.11 1.32 2.52 1.65 2.10 7.58 1.50 1.12
Fiscal balance(USD bn)
30.21 47.15 0.11 104.45 32.81 10.46 0.87 2.56 12.04
Fiscal balance to GDP ratio (%) 15.69 12.3 0.6 0.14 29.83 14.7 5.25 10.39 7.5
Population (mn) 4.49 24.24 0.76 2.7 3.40 1.2 5.72 3.75 75.05
Unemployment rate (%) 2.4 5.63 20 15 1.5 0.5 13.5 20 9.1
Contribution of oil to economy (%) 38.6 54.4 26.0 45.3 52.1*** 56.6*** n/a n/a n/a

14
Commercial Banking in the MENA Region
2.2 Banking Industry OverviewAt a time when global growth is under pressure, the time is ripe to look at banks in the emerging markets of the MENA region. These have escapedthe ongoing crisis primarily due to limited global exposure and absence of sophisticated derivatives with underlying toxic assets. Economicfundamentals have remained strong across the region and are likely to remain so for the coming few years. Banks have been among the majorbeneficiaries of the strong nominal GDP growth, which has translated into annual asset growth exceeding 20% for most MENA countries.
Boosted by the huge fiscal surplus buildup through mid 2008, governments in the region are actively looking toward diversification, in turn investingin multiple large scale development projects. The banking sector has been a key beneficiary and facilitator of this investment spree, and creditdemand on account of this is likely to be a key growth driver in short term. For Egypt, Lebanon and Jordan however the nascent consumer financesegment is expected to drive growth owing to an underserved potential target market. Despite strong loan growth over the last 3 years, bankingsector penetration is still low, and is supportive of strong and sustained loan growth over the next few years.
Banks are gradually moving toward balance sheet driven fee income as against non recurring investment returns. This is furthered by an increasingimpetus to penetrate the retail consumer and SME segments.
2.2.1 Banking Industry Drivers
Strong economic fundamentals and reform driven growthReal GDP is expected to grow in the range of 5 6% during 2008 (Source: IMF) and remain in mid single digit range during 2009.
The year’s high global oil prices enabled countries to build significant cash reserves that are now being channeled toward large investments acrossmultiple sectors. Previous high prices have also helped increase capital flows and remittances into countries like Jordan, Lebanon and Egypt.
With the exception of Kuwait, the pegging of local currencies to the US Dollar has pushed interest rates down facilitating credit expansion implyingample liquidity in the system.
Bahrain’s success in developing non oil sectors like manufacturing and finance make it less prone to oil price fluctuations. Proven oil and gas reservesstood at 125 mn barrels and 3.25 trillion cubic feet respectively as of January 2008 (Source: Energy Information Administration).
The authorities recognize the importance of effective regulation in their ability to attract investment toward the development of financial servicesand have taken strong steps to bring rules and supervision close to leading international standards. The GCC also expects to streamline licensingregulations and creation of a single regulatory regime for the financial services sector.
Favorable demographicsA large part of the population in most countries is in the age group of 15 64years with the majority being under 35 years of age. The population beingclose to or at a working age implies high consumer spending and in turndemand for retail banking services, both on the deposits and credit sides.Qatar seems to be the most favorably placed followed by Bahrain and Kuwait.
The creation of huge employment pockets like the six economic cities in SaudiArabia and the financial centers in Qatar and Bahrain is attracting hugeexpatriate population. While it directly pushes up banking requirements, italso indirectly facilitates capital flow through remittances to countries likeEgypt, Jordan and Lebanon. Such demographic factors are a strong enabler fortighter economic integration among regional countries.
The GCC population has accumulated USD 1.5 trillion in personal wealth.Clients increasingly prefer wealth and asset management services providedlocally rather than offshore, by regionally respected and trusted institutions,leading to strong growth in these sectors.
Government’s focus on diversificationOver recent years, MENA countries have become increasingly aware of the importance of building a diversified and sustainable economy. This isparticularly true in case of the Gulf States that have hydrocarbon based economies. Part of the diversification strategy is also to support the SMEsector, and for the broader private sector which is still relatively underdeveloped in many MENA countries. The Omani government, with its recent
Source: CIA, EIU & BlomInvest Research
Demographic Profile 2008
Bahrain
Oman
Kuwait
Qat ar
SaudiU.A.E
Egypt LebanonJordan
Egypt
0.00%
5.00%
10.00%
15.00%
15 18 21 24 27 30 33 36
Median Age
Working
agepo
pulation
grow
th(200
812
)

15
Commercial Banking in the MENA Region
aggressive incentive program to encourage small businesses to employ itscitizenry is a good case example of a program that is expected to deliver goodreturns.
With USD 2.76 trillion worth of developments either under way or in thepipeline, the GCC is now the world’s largest project finance market. Theinvestments span leisure, residential, infrastructure and industrialdevelopments as the governments seek to forge stronger and more diversifiedeconomic future. Many news outlets have remarked on the presence ofbetween 15 and 20% of the world’s cranes in Dubai alone.
Simultaneously, most of the countries are pursuing liberalization. Trade tariffshave been reduced from a simple average of 20% in 2000 to 13% by 2007,which was the fastest reduction across the world. All the countries in thisstudy, excluding Lebanon (currently in negotiation stage), are now members ofthe World Trade Organization. Many are members of regional or bilateral trade agreements (including with EU or the United States). This success ishowever balanced by hidden trade barriers and poor trade logistics. A few countries have started reducing non tariff barriers like the complexity ofdocumentation needed (mainly Egypt, Lebanon and Jordan). However, a lot still needs to be done.
Low banking penetrationOverall, banking penetration is relatively low in the MENA region incomparison with its Western counterpart specially in countries likeEgypt, Saudi Arabia, Kuwait, and Jordan, with each branch servicing anaverage of roughly 24,000, 18,000, 11,000 and 10,000 customersrespectively. This compares with double to triple that number inWestern economies.
Cross border coordinationAccording to a recent World Bank study, the region offers avenues forintegration, which could definitely enhance its overall competitiveness.However, the opportunity has not been fully exploited, even thoughthere have been a number of attempts at cross border coordination, thelatest one being Pan Arab Free Trade Agreement. The region as a whole,however, is still more integrated through labor mobility than throughtrade or capital flows, and the infrastructural coordination is still in itsinitial stages.
Intra regional trade is at single digit levels, which is low by global standards. For most countries, its ratio to overall trade has increased over the pasttwo decades; only in Syria and Jordan the ratio exceeds 15%. Trade in the region is rendered difficult due to a lack of coordinated tariffs and existenceof non trade barriers. Trade in services has not been included in most of the existing free trade agreements, and is thus rather constrained within theregion. Nevertheless, Kuwait is an exception having followed an export strategy for telecommunication services and has become one of the world’slargest providers, connecting 27 mn mobile subscribers in the ME and Sub Saharan Africa.
Despite investors’ willingness to invest in other countries of the region, there are barriers to capital flows. The situation is better in countries likeEgypt, where the sector is relative more liberalized. Lebanese banks are opening or acquiring branches across the region. In Jordan, a large part ofprivate banks is owned by GCC investors. At the moment, there are stock markets in almost every MENA country, and increasing numbers of investorsare trading in stock markets (for example, Gulf investors are particularly active on Egyptian and Jordanian stock markets). Still, there are a lot ofhidden or legal restrictions on capital inflows and outflows, which restrict intra regional stock trading. However, the situation is gradually changingdue to the region’s willingness to ensure access to the high liquidity in the Gulf States. Regional capital flows are also helped by increasingdevelopment investments and improving business environment in most of the countries.
2.2.2 Performance Indicators
Credit growthLoans to GDP ratio is a key metric indicating the penetration level of the banking sector. In the MENA region, lower banking penetration impliessustained loan demand. However, the current loan to GDP ratio in the GCC states provides a somewhat distorted picture of the banking sector
Source: Zawya, EIU, Central Bank & BlomInvest Research
Bra nch Se rvi ce Ra ti o 2007
1970
11,150
6040 6549 7725
17,960
10,529
23,789
5431
05000
10000150002000025000
Bahrain
Kuwait
Qatar
Oman
U.A.E
Saudi Arabia
Jordan
Egypt
Lebanon
Peop
leserved
perbranch
Gulf P rojec ts B y S ec to rs
59.90%
21.20%
6.7 0%
6 .60%
2.00%
3.6 0%
Constru ction O i l & G as P e troc hemica l P ower W a te r & Wa stewa ter O the r
Source:Meed
16
Commercial Banking in the MENA Region
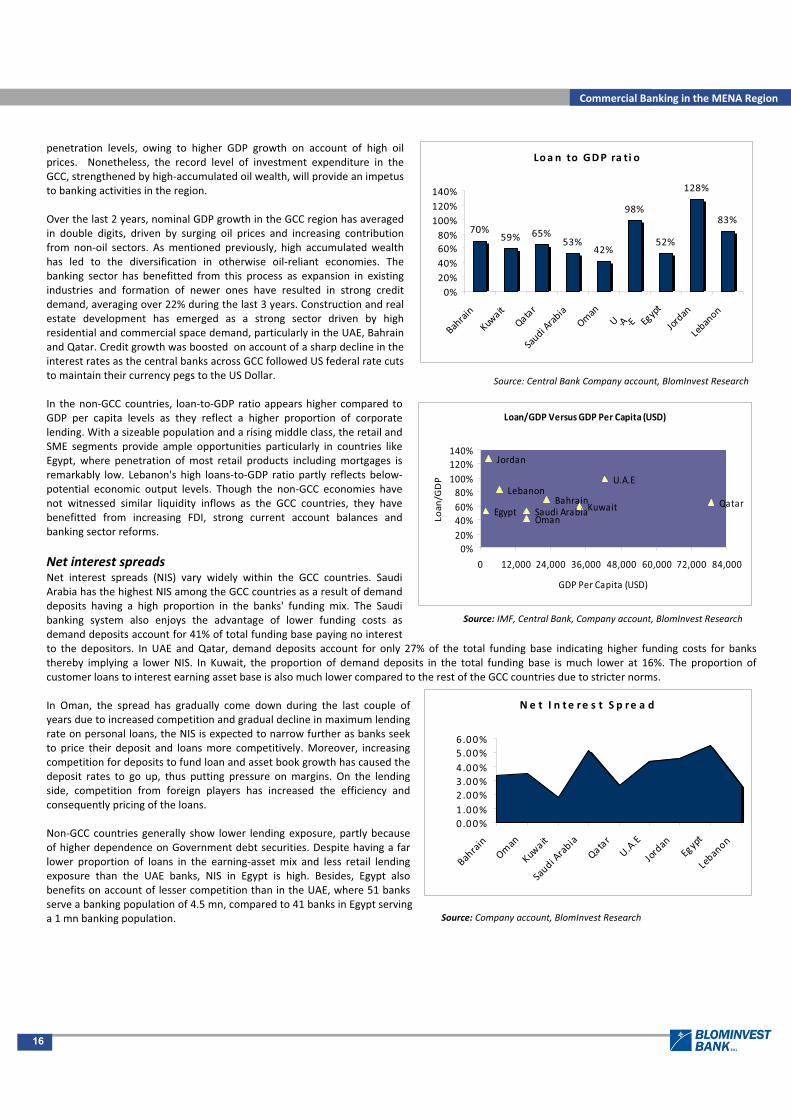
N e t I n te re s t S p re a d
0.00%1.00%2.00%3.00%4.00%5.00%6.00%
Bahrain
Oman
Kuwait
Saudi Arabia
Qatar
U.A.E
Jordan
Egypt
Lebanon
Source: Company account, BlomInvest Research
penetration levels, owing to higher GDP growth on account of high oilprices. Nonetheless, the record level of investment expenditure in theGCC, strengthened by high accumulated oil wealth, will provide an impetusto banking activities in the region.
Over the last 2 years, nominal GDP growth in the GCC region has averagedin double digits, driven by surging oil prices and increasing contributionfrom non oil sectors. As mentioned previously, high accumulated wealthhas led to the diversification in otherwise oil reliant economies. Thebanking sector has benefitted from this process as expansion in existingindustries and formation of newer ones have resulted in strong creditdemand, averaging over 22% during the last 3 years. Construction and realestate development has emerged as a strong sector driven by highresidential and commercial space demand, particularly in the UAE, Bahrainand Qatar. Credit growth was boosted on account of a sharp decline in theinterest rates as the central banks across GCC followed US federal rate cutsto maintain their currency pegs to the US Dollar.
In the non GCC countries, loan to GDP ratio appears higher compared toGDP per capita levels as they reflect a higher proportion of corporatelending. With a sizeable population and a rising middle class, the retail andSME segments provide ample opportunities particularly in countries likeEgypt, where penetration of most retail products including mortgages isremarkably low. Lebanon's high loans to GDP ratio partly reflects belowpotential economic output levels. Though the non GCC economies havenot witnessed similar liquidity inflows as the GCC countries, they havebenefitted from increasing FDI, strong current account balances andbanking sector reforms.
Net interest spreadsNet interest spreads (NIS) vary widely within the GCC countries. SaudiArabia has the highest NIS among the GCC countries as a result of demanddeposits having a high proportion in the banks' funding mix. The Saudibanking system also enjoys the advantage of lower funding costs asdemand deposits account for 41% of total funding base paying no interestto the depositors. In UAE and Qatar, demand deposits account for only 27% of the total funding base indicating higher funding costs for banksthereby implying a lower NIS. In Kuwait, the proportion of demand deposits in the total funding base is much lower at 16%. The proportion ofcustomer loans to interest earning asset base is also much lower compared to the rest of the GCC countries due to stricter norms.
In Oman, the spread has gradually come down during the last couple ofyears due to increased competition and gradual decline in maximum lendingrate on personal loans, the NIS is expected to narrow further as banks seekto price their deposit and loans more competitively. Moreover, increasingcompetition for deposits to fund loan and asset book growth has caused thedeposit rates to go up, thus putting pressure on margins. On the lendingside, competition from foreign players has increased the efficiency andconsequently pricing of the loans.
Non GCC countries generally show lower lending exposure, partly becauseof higher dependence on Government debt securities. Despite having a farlower proportion of loans in the earning asset mix and less retail lendingexposure than the UAE banks, NIS in Egypt is high. Besides, Egypt alsobenefits on account of lesser competition than in the UAE, where 51 banksserve a banking population of 4.5 mn, compared to 41 banks in Egypt servinga 1 mn banking population.
Source: IMF, Central Bank, Company account, BlomInvest Research
Loan/GDP VersusGDP Per Capita (USD)
BahrainKuwait Qatar
Saudi ArabiaOman
U.A.E
Egypt
Jordan
Lebanon
0%20%40%60%80%
100%120%140%
0 12,000 24,000 36,000 48,000 60,000 72,000 84,000
GDP Per Capita (USD)
Loan/GDP
Loa n to GDP ra ti o
70%59% 65%
53%42%
98%
52%
128%
83%
0%20%40%60%80%
100%120%140%
Bahrain
Kuwait
Qatar
Saudi Arabia
Oman
U .A . E Egypt
Jordan
Lebanon
Source: Central Bank Company account, BlomInvest Research
17
Commercial Banking in the MENA Region
Non Interest Income/ Total Operating Income
49%
29%
48%
33%
41% 42%
35%
52%
33%
0%
10%
20%
30%
40%
50%
60%
Bahrain
Oman
Kuwait
Saudi Arabia
Qatar
U .A .E Jordan
Egypt
Lebanon
Source: Company account, Blominvest Bank
Provisons/Total loan
0.59%
0.42%
0.34%0.32%
0.08%
0.22%0.29%
0.38%0.39%
0.10%
0.04%
0.18%
0.32%
0.46%
0.60%
Bahrain
Oman
Kuwait
Saudi Arabia
Qatar
U .A . E Jordan
Egypt
Lebanon
Source: Company account, BlomInvest Research
Source: Company account, Blominvest Bank
Cos t to I n come
50% 49%42% 41% 42%
33%45%
57%
69%
0%10%20%30%40%50%60%70%80%
Bahrain
Oman
Kuwait
Saudi Arabia
Qatar
U.A.E
Jordan
Egypt
Lebanon
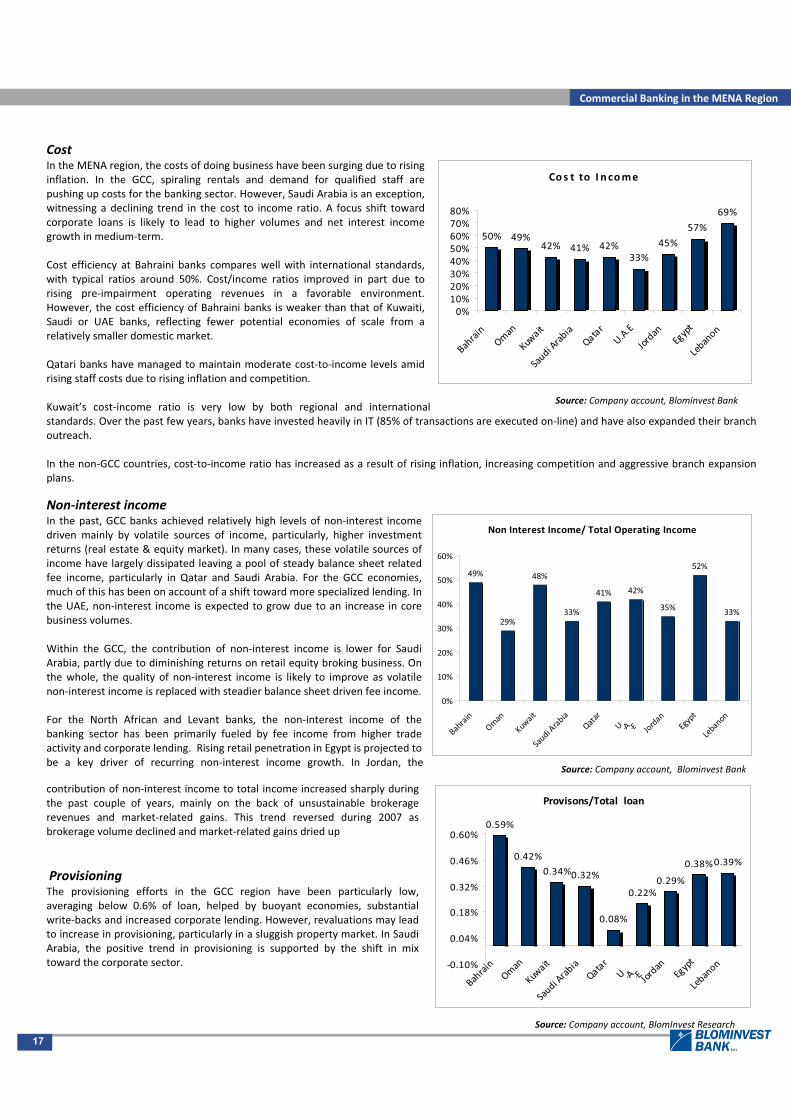
CostIn the MENA region, the costs of doing business have been surging due to risinginflation. In the GCC, spiraling rentals and demand for qualified staff arepushing up costs for the banking sector. However, Saudi Arabia is an exception,witnessing a declining trend in the cost to income ratio. A focus shift towardcorporate loans is likely to lead to higher volumes and net interest incomegrowth in medium term.
Cost efficiency at Bahraini banks compares well with international standards,with typical ratios around 50%. Cost/income ratios improved in part due torising pre impairment operating revenues in a favorable environment.However, the cost efficiency of Bahraini banks is weaker than that of Kuwaiti,Saudi or UAE banks, reflecting fewer potential economies of scale from arelatively smaller domestic market.
Qatari banks have managed to maintain moderate cost to income levels amidrising staff costs due to rising inflation and competition.
Kuwait’s cost income ratio is very low by both regional and internationalstandards. Over the past few years, banks have invested heavily in IT (85% of transactions are executed on line) and have also expanded their branchoutreach.
In the non GCC countries, cost to income ratio has increased as a result of rising inflation, increasing competition and aggressive branch expansionplans.
Non interest incomeIn the past, GCC banks achieved relatively high levels of non interest incomedriven mainly by volatile sources of income, particularly, higher investmentreturns (real estate & equity market). In many cases, these volatile sources ofincome have largely dissipated leaving a pool of steady balance sheet relatedfee income, particularly in Qatar and Saudi Arabia. For the GCC economies,much of this has been on account of a shift toward more specialized lending. Inthe UAE, non interest income is expected to grow due to an increase in corebusiness volumes.
Within the GCC, the contribution of non interest income is lower for SaudiArabia, partly due to diminishing returns on retail equity broking business. Onthe whole, the quality of non interest income is likely to improve as volatilenon interest income is replaced with steadier balance sheet driven fee income.
For the North African and Levant banks, the non interest income of thebanking sector has been primarily fueled by fee income from higher tradeactivity and corporate lending. Rising retail penetration in Egypt is projected tobe a key driver of recurring non interest income growth. In Jordan, the
contribution of non interest income to total income increased sharply duringthe past couple of years, mainly on the back of unsustainable brokeragerevenues and market related gains. This trend reversed during 2007 asbrokerage volume declined and market related gains dried up
ProvisioningThe provisioning efforts in the GCC region have been particularly low,averaging below 0.6% of loan, helped by buoyant economies, substantialwrite backs and increased corporate lending. However, revaluations may leadto increase in provisioning, particularly in a sluggish property market. In SaudiArabia, the positive trend in provisioning is supported by the shift in mixtoward the corporate sector.

18
Commercial Banking in the MENA Region
ROE Vs Capital Adequacy ratio
0.00%
14.00%
28.00%
42.00%
Bahrain
Oman
Kuwait
Saudi Arabia
Qatar
U .A .E Jordan
Egypt
Lebanon
ROE CAR
Source: Company account, BlomInvest Research
In Kuwait, provisioning for loan losses has been declining as a result of denominator effect, given strong loan growth. Meanwhile, this would befurther propelled by a decline in general provisioning requirement.
Provisioning for loan losses in North Africa remain normal, averaging below0.4% of total loans. However, NPL coverage is relatively low compared to theGCC, with the exception of Egypt where provisioning costs are increasing dueto amplified retail activities and general economic slowdown.
Return on equity and capital adequacyThe return on equity (ROE) for a majority of MENA banks, except in Bahrainand Lebanon, is in excess of 13%. Lebanese banks have a significant exposureto government debt and inter bank assets, which earn lower spreads, therebyimplying a reduced ROE. Whereas for Bahraini bank, ROE were impacted by itsinvestment in structured investment vehicles (SIV) exposure and also impactedby impairment charges.
Banks in the MENA region are well capitalized by international standards, withsector wide capital adequacy ratio (CAR) of 18.1% in 2007 vs. a CARrequirement of 10% by major monetary authorities in the region. This is dueto strong internal capital generation, providing capital for future growth aswell as strong shareholder support and increasing access to international capital markets
High ROE in Qatar, Saudi Arabia and UAE is because of high net interest spreads due to high percentage of non interest bearings deposits, low cost /income ratio as well as low provisioning levels in 2007
The higher CARs in the GCC region demonstrate the banks' ability to earn exceptionally high returns from excess equity, primarily from investmentand capital gains. Moreover, in the absence of the tax shield advantage, debt capital becomes more expensive than equity, which implies that MENAbanks have a marginal debt related Tier II capital. Moreover, the banking sector is aiming at Basel II compliance.
2.3 Market Dynamics and Industry StructureThe banking sector is one of the main beneficiaries of the improving investment climate and strong investment pickup in the GCC region, pegged bysome estimates at USD 2.76 trillion. The global credit crisis has had limited impact on the region’s credit growth as its exposure was less than USD 3bn primarily due to ongoing reforms and investment plans within various countries. The consumer finance segment in Egypt and Lebanon is in itsinitial phase of growth and is expected to retain the momentum even in the slowing global economic scenario.
The MENA market is highly concentrated compared to other regions implying healthy net interest spread. The outlook remains positive but a slightdrop is not ruled out.
The move toward relatively more stable and recurring revenue streams is prompting banks to increase focus on fee based activities. During 2007, thecombined fee based income for the banks under study stood at 13.5% of total income (gross interest + non interest income).
Entry of global players continues to fuel competition and the ensuing consolidation activity.
Retail lending in the region compared with other regions remains low. During 2007, Egypt recorded retail lending at 17.0% of total loans; lowest in theregion. The same stood at 39.9%, 35.7%, 29.3% and 27.7% in Oman, Bahrain, Qatar and UAE, respectively. One key focus area during 2008 09 will beIT spending, which is estimated to be around USD 2 bn. It is estimated that the region's institutions will continue to spend a large portion of their ITbudgets (up to 30%) toward new initiatives.
Non GCC countries have generally been slow in adopting new banking technologies in the past. However, the trend is now changing and the rush tosecure market share is prompting financial institutions to invest in state of the art systems. Furthermore, retail banking technology will attract thehighest investments over the coming years, as banks look to move beyond branch centric distribution models and improve penetration. ExtendingATMs networks, investing in online and phone banking channels, and rationalizing branch infrastructure are all on the cards. Core bankingupgrades and anti money laundering practices will also attract significant investments during 2008 2009.The banking industry in almost all thecountries in the region, with the exception of Egypt, follows the structure given below. In Egypt, the overall structure is similar except for theintervening power of the President over the monetary authority.
19
Commercial Banking in the MENA Region
According to an IMF study, the Middle East still lags behind Western standards in terms of real political and economic independence of its centralbanks. Their role usually involves not only ensuring monetary stability and financial sector confidence, but also cooperating with governments toachieve their economic goals and providing them with financial services. At the same time, the role of significant financial centers played or aspired toby an increasing number of countries in the region (like Bahrain, UAE or Qatar) is pushing them towards adapting more solid and conservativemonetary regimes.
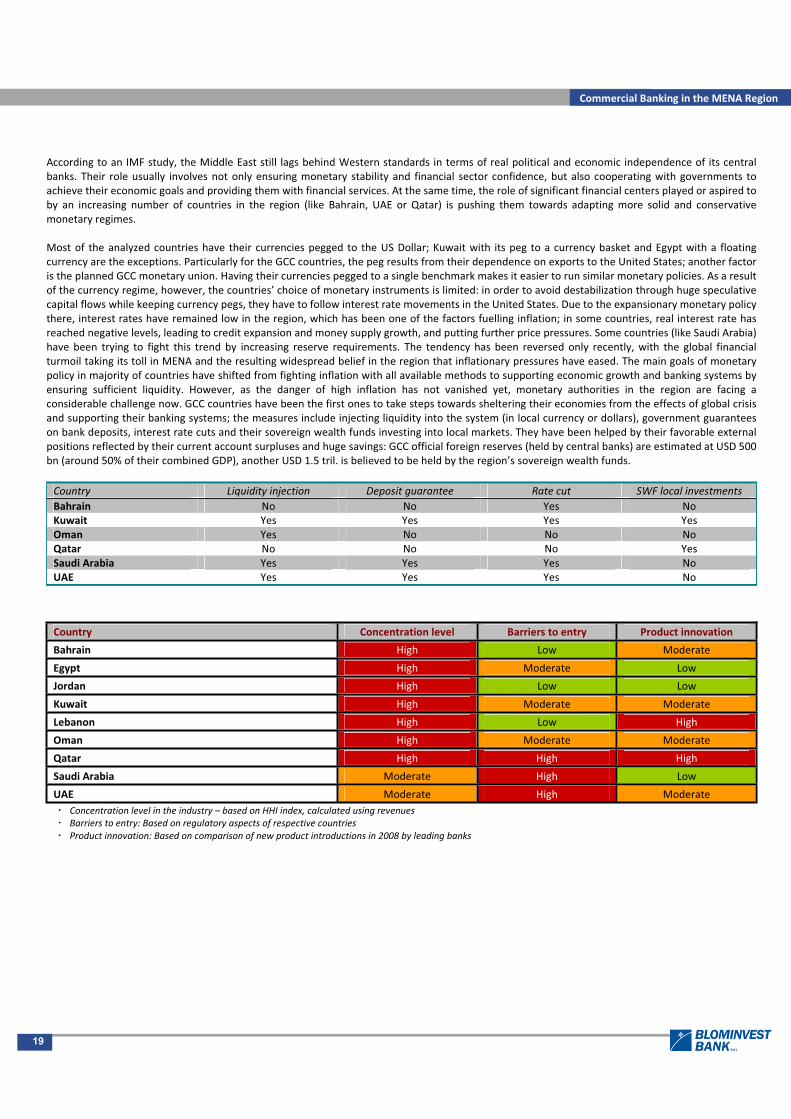
Most of the analyzed countries have their currencies pegged to the US Dollar; Kuwait with its peg to a currency basket and Egypt with a floatingcurrency are the exceptions. Particularly for the GCC countries, the peg results from their dependence on exports to the United States; another factoris the planned GCC monetary union. Having their currencies pegged to a single benchmark makes it easier to run similar monetary policies. As a resultof the currency regime, however, the countries’ choice of monetary instruments is limited: in order to avoid destabilization through huge speculativecapital flows while keeping currency pegs, they have to follow interest rate movements in the United States. Due to the expansionary monetary policythere, interest rates have remained low in the region, which has been one of the factors fuelling inflation; in some countries, real interest rate hasreached negative levels, leading to credit expansion and money supply growth, and putting further price pressures. Some countries (like Saudi Arabia)have been trying to fight this trend by increasing reserve requirements. The tendency has been reversed only recently, with the global financialturmoil taking its toll in MENA and the resulting widespread belief in the region that inflationary pressures have eased. The main goals of monetarypolicy in majority of countries have shifted from fighting inflation with all available methods to supporting economic growth and banking systems byensuring sufficient liquidity. However, as the danger of high inflation has not vanished yet, monetary authorities in the region are facing aconsiderable challenge now. GCC countries have been the first ones to take steps towards sheltering their economies from the effects of global crisisand supporting their banking systems; the measures include injecting liquidity into the system (in local currency or dollars), government guaranteeson bank deposits, interest rate cuts and their sovereign wealth funds investing into local markets. They have been helped by their favorable externalpositions reflected by their current account surpluses and huge savings: GCC official foreign reserves (held by central banks) are estimated at USD 500bn (around 50% of their combined GDP), another USD 1.5 tril. is believed to be held by the region’s sovereign wealth funds.
Country Liquidity injection Deposit guarantee Rate cut SWF local investmentsBahrain No No Yes NoKuwait Yes Yes Yes YesOman Yes No No NoQatar No No No YesSaudi Arabia Yes Yes Yes NoUAE Yes Yes Yes No
Country Concentration level Barriers to entry Product innovation
Bahrain High Low Moderate
Egypt High Moderate Low
Jordan High Low Low
Kuwait High Moderate Moderate
Lebanon High Low High
Oman High Moderate Moderate
Qatar High High High
Saudi Arabia Moderate High Low
UAE Moderate High ModerateConcentration level in the industry – based on HHI index, calculated using revenuesBarriers to entry: Based on regulatory aspects of respective countriesProduct innovation: Based on comparison of new product introductions in 2008 by leading banks
20
Commercial Banking in the MENA Region
2.4 Competitive landscape
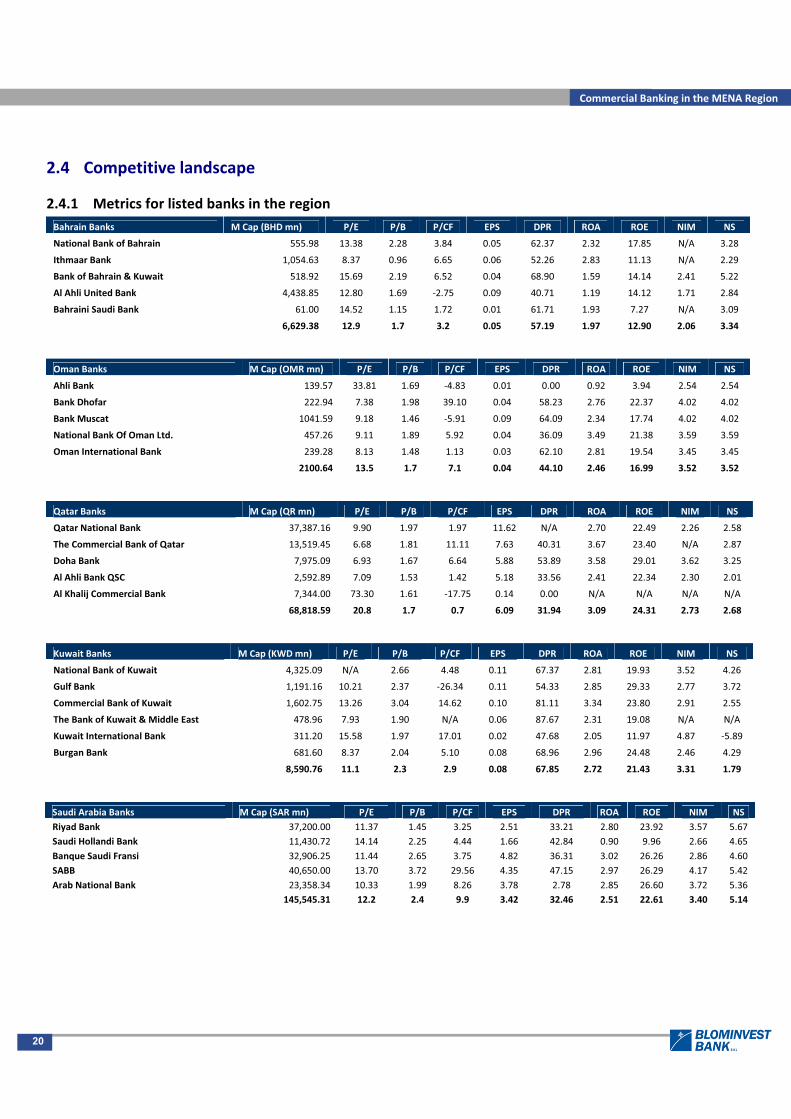
2.4.1 Metrics for listed banks in the regionBahrain Banks M Cap (BHD mn) P/E P/B P/CF EPS DPR ROA ROE NIM NS
National Bank of Bahrain 555.98 13.38 2.28 3.84 0.05 62.37 2.32 17.85 N/A 3.28
Ithmaar Bank 1,054.63 8.37 0.96 6.65 0.06 52.26 2.83 11.13 N/A 2.29
Bank of Bahrain & Kuwait 518.92 15.69 2.19 6.52 0.04 68.90 1.59 14.14 2.41 5.22
Al Ahli United Bank 4,438.85 12.80 1.69 2.75 0.09 40.71 1.19 14.12 1.71 2.84
Bahraini Saudi Bank 61.00 14.52 1.15 1.72 0.01 61.71 1.93 7.27 N/A 3.09
6,629.38 12.9 1.7 3.2 0.05 57.19 1.97 12.90 2.06 3.34
Oman Banks M Cap (OMR mn) P/E P/B P/CF EPS DPR ROA ROE NIM NS
Ahli Bank 139.57 33.81 1.69 4.83 0.01 0.00 0.92 3.94 2.54 2.54
Bank Dhofar 222.94 7.38 1.98 39.10 0.04 58.23 2.76 22.37 4.02 4.02
Bank Muscat 1041.59 9.18 1.46 5.91 0.09 64.09 2.34 17.74 4.02 4.02
National Bank Of Oman Ltd. 457.26 9.11 1.89 5.92 0.04 36.09 3.49 21.38 3.59 3.59
Oman International Bank 239.28 8.13 1.48 1.13 0.03 62.10 2.81 19.54 3.45 3.45
2100.64 13.5 1.7 7.1 0.04 44.10 2.46 16.99 3.52 3.52
Qatar Banks M Cap (QR mn) P/E P/B P/CF EPS DPR ROA ROE NIM NS
Qatar National Bank 37,387.16 9.90 1.97 1.97 11.62 N/A 2.70 22.49 2.26 2.58
The Commercial Bank of Qatar 13,519.45 6.68 1.81 11.11 7.63 40.31 3.67 23.40 N/A 2.87
Doha Bank 7,975.09 6.93 1.67 6.64 5.88 53.89 3.58 29.01 3.62 3.25
Al Ahli Bank QSC 2,592.89 7.09 1.53 1.42 5.18 33.56 2.41 22.34 2.30 2.01
Al Khalij Commercial Bank 7,344.00 73.30 1.61 17.75 0.14 0.00 N/A N/A N/A N/A
68,818.59 20.8 1.7 0.7 6.09 31.94 3.09 24.31 2.73 2.68
Kuwait Banks M Cap (KWDmn) P/E P/B P/CF EPS DPR ROA ROE NIM NS
National Bank of Kuwait 4,325.09 N/A 2.66 4.48 0.11 67.37 2.81 19.93 3.52 4.26
Gulf Bank 1,191.16 10.21 2.37 26.34 0.11 54.33 2.85 29.33 2.77 3.72
Commercial Bank of Kuwait 1,602.75 13.26 3.04 14.62 0.10 81.11 3.34 23.80 2.91 2.55
The Bank of Kuwait & Middle East 478.96 7.93 1.90 N/A 0.06 87.67 2.31 19.08 N/A N/A
Kuwait International Bank 311.20 15.58 1.97 17.01 0.02 47.68 2.05 11.97 4.87 5.89
Burgan Bank 681.60 8.37 2.04 5.10 0.08 68.96 2.96 24.48 2.46 4.29
8,590.76 11.1 2.3 2.9 0.08 67.85 2.72 21.43 3.31 1.79
Saudi Arabia Banks M Cap (SAR mn) P/E P/B P/CF EPS DPR ROA ROE NIM NSRiyad Bank 37,200.00 11.37 1.45 3.25 2.51 33.21 2.80 23.92 3.57 5.67Saudi Hollandi Bank 11,430.72 14.14 2.25 4.44 1.66 42.84 0.90 9.96 2.66 4.65Banque Saudi Fransi 32,906.25 11.44 2.65 3.75 4.82 36.31 3.02 26.26 2.86 4.60SABB 40,650.00 13.70 3.72 29.56 4.35 47.15 2.97 26.29 4.17 5.42Arab National Bank 23,358.34 10.33 1.99 8.26 3.78 2.78 2.85 26.60 3.72 5.36
145,545.31 12.2 2.4 9.9 3.42 32.46 2.51 22.61 3.40 5.14

21
Commercial Banking in the MENA Region
Egypt Banks M Cap (EGP mn) P/E P/B P/CF EPS DPR ROA ROE NIM NS
Al Watany Bank of Egypt 3,940.00 16.17 3.69 12.44 2.44 19.82 0.97 11.39 3.14 6.84
Crédit Agricole Egypt 2,870.00 5.48 1.50 7.51 1.83 0.00 2.81 31.59 3.20 8.10
Piraeus Bank Egypt 655.65 62.20 0.99 2.10 0.18 N/A 0.17 1.60 1.72 4.84
Commercial International Bank (Egypt) 8,555.63 6.65 1.95 3.08 4.40 15.17 3.00 33.07 3.38 6.34
BLOM Bank Egypt 1,875.00 14.79 2.34 n/a 1.69 N/A 1.43 9.75 2.30 0.61
Ahli United Bank of Egypt 1,260.00 8.59 1.88 12.28 2.45 N/A 0.01 0.04 3.38 6.75
Export Development Bank of Egypt 1,100.00 3.54 0.80 5.78 3.11 N/A 3.04 28.36 2.37 4.97
20,256.28 16.8 1.9 3.1 2.30 11.66 1.63 16.54 2.78 5.49
Jordan Banks M Cap (JOD mn) P/E P/B P/CF EPS DPR ROA ROE NIM NS
Bank of Jordan 237.00 9.72 1.47 1.47 0.24 61.51 1.72 16.17 N/A 6.40
Jordan Commercial Bank 171.85 13.84 2.11 2.11 0.18 25.47 2.34 15.84 4.35 4.44
Arab Banking Corporation 9,078.00 15.14 1.78 1.78 1.43 14.00 2.15 12.11 N/A N/A
Arab Jordan Investment Bank 191.00 22.89 1.62 1.62 0.08 73.14 1.15 7.31 2.17 N/A
Jordan Kuwait Bank 627.00 N/A 3.87 3.87 0.44 33.80 2.42 21.94 N/A 4.21
Union Bank Limited 295.45 N/A 1.35 1.35 0.15 68.96 1.41 8.69 N/A 3.21
10,600.30 15.4 2.0 2.0 0.42 46.15 1.87 13.68 3.26 4.57
Lebanon Banks M Cap (LP mn) P/E P/B P/CF EPS DPR ROA ROE NIM NSBLC Bank 77.37 5.11 4.6 N/A 446.25 0 0.38 N/A N/A N/A
BLOM Bank 3,070,031.58 N/A N/A 1.68 1,266.16 434.38 1.31 15.71 3.05 3.05
Bank Audi 2,573.64 11.88 1.31 N/A 7,994.00 34.24 1.22 11.39 3.19 3.19
Bank of Beirut 1,140.37 16.13 2.45 N/A 1,637.73 31.57 0.81 12.67 2.43 2.43
Banque Bemo 64.64 N/A N/A N/A 750.87 N/A 0.79 11.32 1.79 1.79
Byblos Bank 752.24 7.98 1.08 1.16 340.63 46.36 1.05 13.61 2.76 2.76
3,074,639.84 10.3 2.4 1.4 2,072.61 109.31 0.93 12.94 2.64 2.64
UAE Banks M Cap (AED mn) P/E P/B P/CF EPS DPR ROA ROE NIM NS
Commercial Bank of Dubai 10,334.71 8.82 2.13 8.50 0.67 36.20 3.81 21.84 4.65 4.41
Mashreq Bank 39,524.50 19.12 3.76 2.38 12.98 0.00 2.63 22.37 2.76 4.94
Abu Dhabi Commercial Bank 13,323.70 6.65 1.12 1.79 0.42 60.38 2.12 18.10 2.80 3.12
Bank of Sharjah 5,142.92 9.07 1.36 7.81 0.32 77.35 4.39 18.39 6.31 5.14
Commercial Bank International 2,943.02 8.93 1.76 13.64 0.27 17.22 3.45 23.74 3.24 3.07
First Gulf Bank 16,775.00 5.79 1.07 301.52 1.46 12.45 3.32 21.02 N/A N/A
Invest Bank 3740.00 13.20 2.21 6.22 0.26 34.44 3.89 18.03 3.82 4.52
National Bank of Abu Dhabi 24,015.85 7.21 1.70 8.50 1.31 25.41 2.08 24.78 2.62 4.41
National Bank of Fujairah 8,250.00 25.41 4.62 14.05 0.29 50.95 3.10 19.19 4.24 4.54
National Bank of Umm Al Qaiwain 7,682.40 18.83 2.77 2.98 0.34 0.00 5.00 21.28 7.77 6.02
National Bank Of Ras Al Khaima 5,143.17 8.72 2.60 N/A 0.54 N/A 4.05 28.43 6.80 N/A
United Arab Bank 6,823.36 28.16 5.11 9.96 0.27 37.04 3.85 17.79 5.14 4.84
Union National Bank 7,968.75 4.75 1.06 4.86 0.62 26.75 2.41 18.70 2.99 3.49
151,667.38 12.7 2.4 30.8 1.52 31.52 3.39 21.05 4.43 4.41
Sources: Zawya, Bloomberg and BlomInvest Research

22
Commercial Banking in the MENA Region
2.4.2 Multiples ComparisonKuwaiti banks offer the maximum value in the region. Listed Kuwaiti banks are currently trading at 11.1x earnings and 2.3x book value multiples – aclear discount to other regional peers.
Saudi and UAE banks follow next given the prevailing numbers. While Saudi banks are trading at 12.2x and 2.4x book value, UAE banks are trading at12.7x earnings and 2.4x book value multiples, respectively.
The Omani banking sector, despite years of strong growth, remains rather under penetrated. Similar to Bahrain, however, the sector suffers fromsmall market capitalizations and low trading volumes. In this respect, the Kuwaiti banks fare better, with three stocks trading above USD 10 mn a dayand seven trading USD 5 mn or more a day. Qatar is a preferred banking sector in terms of economic fundamentals and banking asset growth, Qataribanks are trading at a significant PE premium to most MENA banks for a given earnings growth rate.
Bahrain is likely to be less attractive from a long term growth perspective, given high sector penetration, limited oil and gas reserves and a smallpopulation. Furthermore, the banking stocks have relatively small market capitalizations and are rather illiquid from a volume and value tradedperspective.
Among the non GCC countries, Lebanese banks are the most attractive, while the Egyptian and Jordanian counterparts are the most unattractivegiven their expensive valuation and lower earnings growth relative to most MENA banking stocks. Banks in Lebanon are trading at 10.3x earnings and2.4x book value multiples, a clear discount to Egypt and Jordan. This can be primarily attributed to lower banking penetration indicated by the lowerloan to GDP ratio. Structural reforms in Lebanon and the impact of the global crisis on the region are likely to be the critical factors to watch out for.
2.5 Recent Developments in the regionSaudi Arabia12 Oct 08
17 Oct 08
21 Oct 08
30 Oct 08
23 Nov 08
Saudi Arabia Monetary Agency (SAMA) cuts its Repo Rate by 50 bps, to 5.00% from 5.50%. Deposit rate on hold at2.00%SAMA lowers the reserve requirement, to 10% from 13%
The Kingdom of Saudi Arabia guarantees all bank deposits
SAMA injects USD2 3 bn into the banking system in the form of US Dollar deposits.
SAMA cuts its repo rate cut by 100 bps, to 4.00% from 5.00%, leaving the reverse repo unchanged at 2.00%.
The Central Bank cuts benchmark lending rate by 100 bps.SAMA reduces repo rate to 3% from 4% and cut the cash reserve requirement for local banks from 10% to 7%.
UAE22 to 25 Sep 08
8 Oct 08
12 Oct 08
The Central Bank of the UAE (CBUAE) sets up an AED 50 bn emergency facility for banks operating in the UAE.Banks can borrow funds against certificates of deposits (CDs) as collateral. CDs used as collateral are required tohave a remaining life of at least 14 days. The facility is not to be used in funding existing commitments, banks areto refrain from lending to non residents and fresh credit is only to be based on incremental increases in deposits.These other conditions are strict and seem designed to restrict credit growth rather than ease it.The CBUAE allows borrowing against bank reserves held with it, and against approved debt. Banks can borrow anamount equivalent to their required reserves at repo rate + 3.00%. Banks borrowing more than their reserve levelneed to pay repo rate +5.00%.The CBUAE abolishes the 6 day limit on settling current account overdraft. These were positive initiatives taken bythe UAE at the time. The CBUAE was trying to balance between providing liquidity and limiting credit growth byindicating to commercial banks that funds were there if really needed, but they would have to pay for it throughhigher borrowing costs. As the credit crisis deepened, however, the CBUAE on 8 October lowered the interest rateon the facility to 3.00% from 5.00%. One month after it was set up, the CBUAE governor announced that only 15%of the facility had been utilized, due, we believe, to the restrictions placed upon it.
CBUAE lowers its repo rate by 50 basis points, to 2.00% from 1.50%
UAE guarantees bank deposits of local banks and of foreign banks with core operations in UAE.
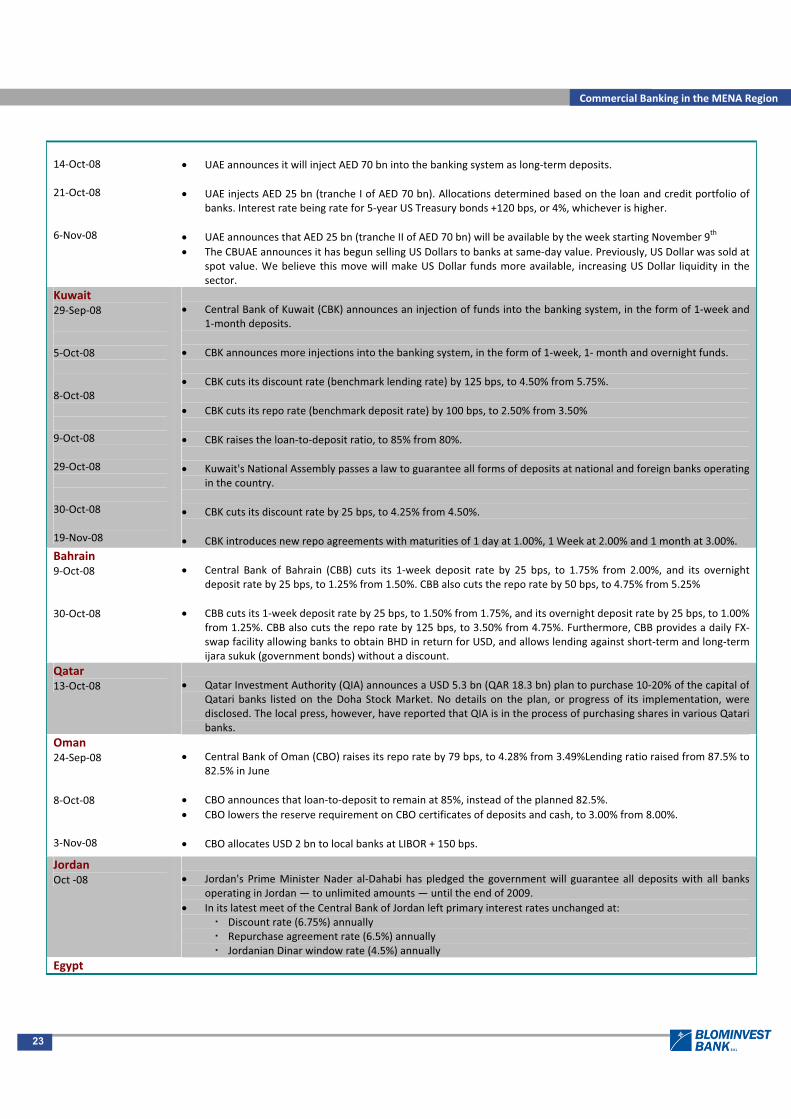
23
Commercial Banking in the MENA Region
14 Oct 08
21 Oct 08
6 Nov 08
UAE announces it will inject AED 70 bn into the banking system as long term deposits.
UAE injects AED 25 bn (tranche I of AED 70 bn). Allocations determined based on the loan and credit portfolio ofbanks. Interest rate being rate for 5 year US Treasury bonds +120 bps, or 4%, whichever is higher.
UAE announces that AED 25 bn (tranche II of AED 70 bn) will be available by the week starting November 9th
The CBUAE announces it has begun selling US Dollars to banks at same day value. Previously, US Dollar was sold atspot value. We believe this move will make US Dollar funds more available, increasing US Dollar liquidity in thesector.
Kuwait29 Sep 08
5 Oct 08
8 Oct 08
9 Oct 08
29 Oct 08
30 Oct 08
19 Nov 08
Central Bank of Kuwait (CBK) announces an injection of funds into the banking system, in the form of 1 week and1 month deposits.
CBK announces more injections into the banking system, in the form of 1 week, 1 month and overnight funds.
CBK cuts its discount rate (benchmark lending rate) by 125 bps, to 4.50% from 5.75%.
CBK cuts its repo rate (benchmark deposit rate) by 100 bps, to 2.50% from 3.50%
CBK raises the loan to deposit ratio, to 85% from 80%.
Kuwait's National Assembly passes a law to guarantee all forms of deposits at national and foreign banks operatingin the country.
CBK cuts its discount rate by 25 bps, to 4.25% from 4.50%.
CBK introduces new repo agreements with maturities of 1 day at 1.00%, 1 Week at 2.00% and 1 month at 3.00%.Bahrain9 Oct 08
30 Oct 08
Central Bank of Bahrain (CBB) cuts its 1 week deposit rate by 25 bps, to 1.75% from 2.00%, and its overnightdeposit rate by 25 bps, to 1.25% from 1.50%. CBB also cuts the repo rate by 50 bps, to 4.75% from 5.25%
CBB cuts its 1 week deposit rate by 25 bps, to 1.50% from 1.75%, and its overnight deposit rate by 25 bps, to 1.00%from 1.25%. CBB also cuts the repo rate by 125 bps, to 3.50% from 4.75%. Furthermore, CBB provides a daily FXswap facility allowing banks to obtain BHD in return for USD, and allows lending against short term and long termijara sukuk (government bonds) without a discount.
Qatar13 Oct 08 Qatar Investment Authority (QIA) announces a USD 5.3 bn (QAR 18.3 bn) plan to purchase 10 20% of the capital of
Qatari banks listed on the Doha Stock Market. No details on the plan, or progress of its implementation, weredisclosed. The local press, however, have reported that QIA is in the process of purchasing shares in various Qataribanks.
Oman24 Sep 08
8 Oct 08
3 Nov 08
Central Bank of Oman (CBO) raises its repo rate by 79 bps, to 4.28% from 3.49%Lending ratio raised from 87.5% to82.5% in June
CBO announces that loan to deposit to remain at 85%, instead of the planned 82.5%.CBO lowers the reserve requirement on CBO certificates of deposits and cash, to 3.00% from 8.00%.
CBO allocates USD 2 bn to local banks at LIBOR + 150 bps.
JordanOct 08 Jordan's Prime Minister Nader al Dahabi has pledged the government will guarantee all deposits with all banks
operating in Jordan — to unlimited amounts — until the end of 2009.In its latest meet of the Central Bank of Jordan left primary interest rates unchanged at:
Discount rate (6.75%) annuallyRepurchase agreement rate (6.5%) annuallyJordanian Dinar window rate (4.5%) annually
Egypt

24
Commercial Banking in the MENA Region
Sep 08 The discount rate was also raised by 50 bps to 11.5% per annum.The Monetary Policy Committee (MPC) decided to raise the overnight deposit and lending rates by 50 bps to 11.5%and 13.5%, respectively.
2.5.1 Impact of the Economic crisis in the MENA region
2.5.2 Recent projects hit by the crisisCountry Loan Taker Loan Amount Action/ForecastQatar Qatar Investment Authority (QIA) USD 3 bn Repaid instead of securing refinancing loanKuwait Global Investment House USD 410 mn Increase of margin by 35 bps to 210bps over LIBORUAE Dubai Bourse USD 3.8 bn Refinancing problems of loan facilityUAE Port & Free Zone World (Dubai World) USD 1.0 bn Reduction from USD 1.25bnUAE DIFC Investments USD 1.5 bn USD 1.5bn., 5 year loan under discussion since June
2008, is now in doubt as Barclays bank and others showwithdrawal of support
UAE Dubai Aerospace Enterprise USD 1 bn Negotiations since July, uncertain futureUAE Investment Corp. of Dubai (IDC) USD 6 bn Complete drawdown of existing loan facility that had
been arranged prior to the crisisUAE Nakheel USD 3.5 bn Worries about Nakheel’s sukuk maturing in December
2009 push CDS of the company to 2000UAE Shuweyhat 2 Water and Power Plant, Abu
Dhabi plus sewage projectUSD 1.3 bn Calyon contemplates withdrawing its underwritten share
of the USD 3.7 bn projects using exit clausesSources: Zawya, Reuters, Bloomberg
2.5.3 Direct Impact – Write downs in the regionBank Write downs in USD mnAbu Dhabi Commercial Bank 272Gulf Investment Corp. 246 (another 200 expected)
Gulf International Bank 966
Arab Banking Corporation 1,200Source: Zawya
2.5.4 Government moves to face the credit crunch
Saudi ArabiaOct 08 King Abdullah promises SAR 10 bn (USD 2.76 bn) for interest free loans to low income families.
Finance Minister states that the Kingdom can draw on its ‘huge’ reserves if necessary to “support the
GCC have acknowledged less than USD 3 bn in direct subprime exposure, which is dramatically smaller than the more than USD 500 bn inEurope and the US. Many reports have put the undisclosed figure at a higher number, but this still pales in comparison to Westerncounterparts. Presumably, the exposure of the region’s Sovereign Wealth Funds (SWFs) has been higher as they have been more sophisticatedin their asset allocation, although data is not available due to the relative opacity of such funds. As they have enjoyed large inflows and havediversified portfolios, the impact is probably manageable.
Indirect effects of the global credit crisis are more critical in the GCC countries amid scarce finances and soaring prices. Corporate spreads inthe GCC have widened dramatically, and a couple of companies have already witnessed problems in refinancing existing bonds and loanfacilities. The region’s large scale project finance and real estate markets will be particularly affected by this credit crunch. Possible mitigationmeasures on part of the GCC countries could include liquidity easing policies by the central banks without encouraging further credit growth. Ifpush comes to shove, cash injections and strategic domestic investments by the region’s SWFs could also be contemplated, most notably inGCC companies like SABIC or Emaar that have positioned themselves internationally and are key for further diversification of the region’seconomies. As the financial crisis is expected to cause a global recession, demand for important GCC export products like crude oil,petrochemicals and aluminum will be affected.

25
Commercial Banking in the MENA Region
banking sector or any other (sector).SAMA states that it is having problems managing liquidity and keeping tabs on high inflation in theKingdom and states that as a result it is more likely to act through repo and reverse repo rates ratherthan direct injection of cash.
UAEOct 08 & Nov 08 Central bank announces that it has started selling dollars to banks at the same day value instead of
the usual spot value (which settles in 2 days) to ease the interbank market.Market stabilization measures include reducing circuit breaker for Dubai Financial Market from 15%to 10% and restrictions on share buybacks eased. The Dubai International Financial Exchange hasintroduced dirham trading to attract investors – companies traded in dollars will have option toconvert into dirham later in the year.UAE banks and lenders such as Tamweel and Amlak, Emirates NBD, have announced reductions inloan to value ratios.Government guarantees deposits and savings in national banks and interbank lending. The guaranteeis extended to include foreign banks (excluding regional banks) with 'significant operations' in thecountry for 3 years.Tamweel and Amlak to be brought under the Real Estate Bank, which in turn is to be merged withEmirates Industrial Bank. The Tamweel Amlak merger under Real Estate Bank is the first sign offederal government intervention in Dubai's troubled property sector.
KuwaitOct & Nov 08
Government announces it is considering buying into Gulf Bank in case shareholders are unable toraise funds while Fitch cuts the bank’s rating to D from B/C, placing it on a negative rating watch.Government guarantees all deposits as Central Bank intervenes to save Gulf Bank following largetrading losses from FX derivatives. According to the bill, any loss will be absorbed by the KuwaitiInvestment Agency.Central Bank announces that the priority of the bank has shifted from fighting inflation to “enhanceconfidence and safety in the banking sector.”Central Bank announces that it will halt deposits to any bank if it attempts to sell mortgaged sharesfor loan and credit facilities to clients and investment firms.Local banks and Central Bank agree on a mechanism to help investment firms. Banks are to supportinvestment firms and the KIA is to provide those banks with long term deposits. Local investmentfirms were also given access to funds from state institutions but had argued this alone wasinadequate.Local banks are instructed to raise maximum limit for loan to deposit ratio to 85% from 80%. Increasethe growth rate of credit portfolios for each bank by 5%; accept real estate as collateral in thecalculation of capital adequacy ratios.
BahrainOct 08 Central Bank issues statement that the banking system is “sound and strong capitalized” adding that
liquidity flows remain normal.QatarOct 08
Central Bank sees no need to adjust its interest rates following the Fed but states that it is willing toprovide liquidity if need arises to support the banking sector.
OmanOct 08 Central Bank makes available USD2bn to lend to local banks at a cost of 150bps plus LIBOR in a bid to
ease USD liquidity.Source: Regional central banks, Bloomberg, Reuters, and BlomInvest
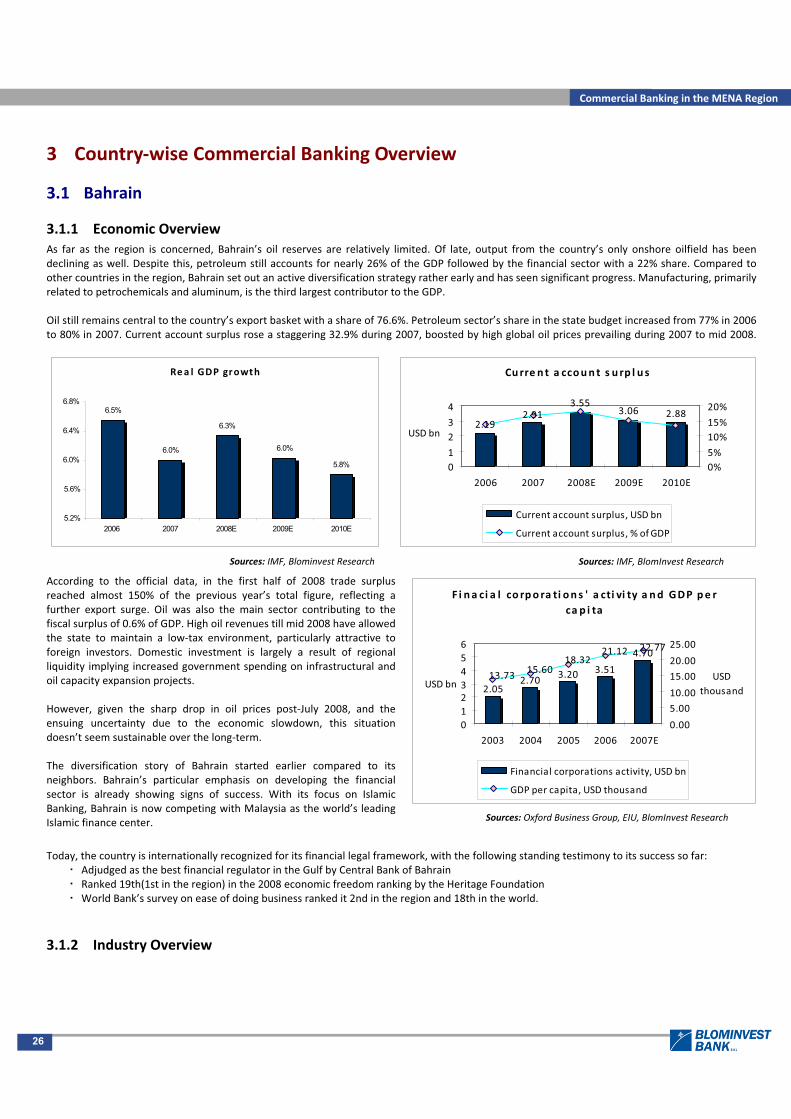
26
Commercial Banking in the MENA Region
3 Country wise Commercial Banking Overview
3.1 Bahrain
3.1.1 Economic OverviewAs far as the region is concerned, Bahrain’s oil reserves are relatively limited. Of late, output from the country’s only onshore oilfield has beendeclining as well. Despite this, petroleum still accounts for nearly 26% of the GDP followed by the financial sector with a 22% share. Compared toother countries in the region, Bahrain set out an active diversification strategy rather early and has seen significant progress. Manufacturing, primarilyrelated to petrochemicals and aluminum, is the third largest contributor to the GDP.
Oil still remains central to the country’s export basket with a share of 76.6%. Petroleum sector’s share in the state budget increased from 77% in 2006to 80% in 2007. Current account surplus rose a staggering 32.9% during 2007, boosted by high global oil prices prevailing during 2007 to mid 2008.
According to the official data, in the first half of 2008 trade surplusreached almost 150% of the previous year’s total figure, reflecting afurther export surge. Oil was also the main sector contributing to thefiscal surplus of 0.6% of GDP. High oil revenues till mid 2008 have allowedthe state to maintain a low tax environment, particularly attractive toforeign investors. Domestic investment is largely a result of regionalliquidity implying increased government spending on infrastructural andoil capacity expansion projects.
However, given the sharp drop in oil prices post July 2008, and theensuing uncertainty due to the economic slowdown, this situationdoesn’t seem sustainable over the long term.
The diversification story of Bahrain started earlier compared to itsneighbors. Bahrain’s particular emphasis on developing the financialsector is already showing signs of success. With its focus on IslamicBanking, Bahrain is now competing with Malaysia as the world’s leadingIslamic finance center.
Today, the country is internationally recognized for its financial legal framework, with the following standing testimony to its success so far:Adjudged as the best financial regulator in the Gulf by Central Bank of BahrainRanked 19th(1st in the region) in the 2008 economic freedom ranking by the Heritage FoundationWorld Bank’s survey on ease of doing business ranked it 2nd in the region and 18th in the world.
3.1.2 Industry Overview
Rea l GDP growth
6.5%
6.0%
6.3%
6.0%
5.8%
5.2%
5.6%
6.0%
6.4%
6.8%
2006 2007 2008E 2009E 2010E
Sources: IMF, Blominvest Research
Curre n t a ccount s u rp l u s
2.192.91
3.553.06 2.88
01
23
4
2006 2007 2008E 2009E 2010E
USD bn
0%5%
10%15%
20%
Current account surplus, USD bn
Current account surplus, % ofGDP
Sources: IMF, BlomInvest Research
F i na ci a l co rpo ra ti on s ' a cti vi ty a nd GDP pe rca p i ta
2.052.70 3.20 3.51
4.70
15.6013.73
18.3221.12 22.77
0123456
2003 2004 2005 2006 2007E
USD bn
0.00
5.00
10.00
15.00
20.00
25.00
USDthousand
Financial corporations activity, USD bn
GDP per capita, USD thousand
Sources: Oxford Business Group, EIU, BlomInvest Research

27
Commercial Banking in the MENA Region
At the end of 2007, there were over 400 licensed financial institutions in the country. Apart from banking, insurance and capital markets form theother key components of the financial sector. During the 12 months to June 2008, banking sector’s balance sheets expanded 26.6% to USD 268.5 bn.The cumulative assets of the banking system have grown at a CAGR of 22.9% during the period 2003 2007. At the end of 2007, total assets (retail andwholesale) stood at BD 92.2 bn (USD 245.8 bn) as compared to BD 70.43 bn (USD 187.35 bn) in 2006. Wholesale banks represented 79.9% of the totalbalance sheet, while retail banks constituted the remaining. During 2003 2007, total domestic credit grew at a CAGR of 23.4% to reach BD 4.18 bn. In2007, total domestic credit as a percentage of total assets increased 4.5% as compared to 4.3% in 2006.
On the liabilities side, domestic deposits registered an increase of 30.0% to reach BD16.6 bn (USD 44.2 bn) in 2007 as compared to USD 34.0 bn in2006. Total foreign liabilities registered an increase of 31.5% to reach BD75.7 bn (USD 201.6 bn) as against USD 153.3 bn at the end of 2006. Duringthe period 2003 2007, total deposits grew at a CAGR of 22.9%.
The ratio of total domestic credit to GDP increased from 49.1% in 2003 to 70.3% in 2007. Ratio of total deposits to GDP increased from 88.1% in 2003to 123.8% in 2007. Total loans and advances grew from BD1619.1 mn in 2006 to BD2432 mn in 2007, registering an increase of 50.2%. Lending tobusiness sector accounted for 58.1% of the total credit, while personal and government sectors accounted for 35.6% and 6.3%, respectively.
Sectoral Distribution ofCommercial Credit10%
18%
17%4%7%
2%
1%
6%
35%
ManufacturingConstruction and Real EstateTradeNon Bank FinancialOther Sectors, ofwhich:Transportation & Communication
The banking sector in Bahrain is not seriously affected by the ongoing global credit crisis due to its conservative policies and close supervisionby the central bank. During the 12 months to June 2008, the combined assets of the Bahraini banks (Wholesale and Retail) increased 26.6% toreach USD268.5 bn. During the same period combined deposits and total credit of Bahraini banks also grew at a healthy pace, recording a YoYincrease of 48% and 47% respectively to reach BD 9,733 mn and BD 5,077 mn.
During the crisis, the liquidity position of the Bahraini banks remained sound and the banking sector managed to fund various projects. Webelieve that the overall economic growth will slowdown due to lesser foreign inflows into the country, but at the same time it is better placedthan most countries in the region because of economic diversification and lesser dependency on the oil sector. Going forward we believe thatthe outlook for commercial banking sector remains positive but it is expected to grow at a slower pace as compared to recent past.
Commercial Banks Credit
0.00
2,000.00
4,000.00
6,000.00
2003 2004 2005 2006 2007
(inBD
millions
)
0.0010.0020.0030.0040.00
Total Domestic Credit (BDMillions) Growth
Source: Central Bank, BlomInvest Research
Commercial Banks Credit
0.00
2,000.00
4,000.00
6,000.00
2003 2004 2005 2006 2007
(inBDmillions)
0.0010.0020.0030.0040.00
Total Domestic Credit (BDMillions) Growth
Source: Central Bank, BlomInvest Research
Banking Indicators
0
50
100
150
2003 2004 2005 2006 2007
(in%)
Total Credit as % GDP Total Deposits as % GDP
Source: Central Bank, BlomInvest Research Source: Central Bank, BlomInvest Research

28
Commercial Banking in the MENA Region
3.2 Egypt
3.2.1 Economic OverviewEgypt’s young population, estimated at over 75 mn in 2007, is the largest in the Arab world; its nominal GDP, however, is lesser than that of SaudiArabia, UAE, and Algeria. Economic growth has been robust at almost 7% in 2007, although in the second quarter of 2008 (fourth quarter of Egyptianfiscal year 2007 08), growth rate declined slightly to 6.8%. Services (related to public administration, tourism and the Suez Canal) make up around halfof the GDP.
During 2007, natural gas, with a share of 16.4%, was the major contributor to the GDP followed by manufacturing, with a share of 16.3%. The publicsector remains strong; it is estimated at around 38% of the economy.
The growth is expected to be healthy in coming years, with gross fixed capital formation supported by strong business confidence, driven mainly byprivate investment, encouraged by the government’s reforms toward creating a more business friendly environment. Public debt, accumulated dueto past budget deficits, reached almost 95% of GDP in June 2008, with interest expense at 18.2% of total spending. The main expenditure drivers in2007 08 were various subsidies, grants and social benefits accounting for 33.1% of the total.
The state managed to reduce the fiscal deficit’s share in GDP marginally in real terms during the last fiscal year, even though in nominal terms itincreased by almost 16%. The government aims at improving public finance management by reducing fuel subsidies or increasing gas prices forenergy intensive industries. However, the budget for 2008 09 is likely to accommodate increased expenditure for additional subsidies. With ongoingeconomic reforms and rapid growth, inflation declined from double digit rates in 2004 to around 5% in 2005.
Consumer demand, rise in consumer liquidity, and higher commodity prices have been the key contributors to inflation recently. Interest rate hikesinitiated by the government to control surging inflation (21.5% in the year to September 2008) are likely to be supported by a stronger currencyagainst the US Dollar.
F i s ca l ba l a nce a nd pub l i c de b t
6.447.81
9.87 9.9612.04-14
-12-10-8-6-4-20
2003
/04
2004
/05
2005
/06
2006
/07
2007
/08
pre.actual
USD bn
0%20%40%60%80%100%120%
Fiscal balance, USD bn Domestic debt, % ofGDP
Source: Central Bank & BlomInvest Research
Ave ra ge annua l consumer pri ce infla t ion
4.5%
11.3%
5.8%
17.1%
4.9%
7.3%
0%
4%
8%
12%
16%
20%
2003 2004 2005 2006 2007 2008E
Source: EIU & BlomInvest Research

29
Commercial Banking in the MENA Region
3.2.2 Industry Overview
Combined assets of banks operating in Egypt reached LE 1,083.31 bn, denoting a rise of 15.5% during FY08, against 23.2% during FY06. The totalnumber of banks operating in Egypt stood at 41 by the end of FY08. The total assets of the banks operating in the Egypt grew at a CAGR of 14.4%during the period FY04 FY08. Total credit in the banking system registered an increase of 14.96% to reach LE 401.42 bn in FY08 as compared to LE353.74 bn in FY07. During the period the ratio of total credit to total assets stood at 37.0% which was marginally lower than 37.7% in FY07 and thetotal credit to deposits ratio stood at 53.7% in FY08.
In 2007 the highest credit was extended to the manufacturing sector which stood at 37.3% of total credit, after that the second highest credit wasextended to the Services sector which stood at 28.5% of the total credit, followed by Agriculture and Trade Sector which stood at 20.2% and 13.9%respectively as a percentage of total credit.
3.3 Jordan
3.3.1 Economic OverviewUnlike most of its neighboring countries, Jordan lacks the naturalresources to base its economy upon. Finance, insurance, real estateand business services contribute 17.49% to GDP; followed by publicservices with 16.36%, and manufacturing (mainly phosphatesproduction) contributing 15.71%.
Economic growth is driven mainly by strong domestic and foreigninvestment, especially by the Gulf countries experiencing excessliquidity, furthermore Jordan’s involvement in reconstruction of Iraq.The major commodities exported are phosphates and potash;however in terms of export value, they are outpaced by miscellaneousand chemical exports, which together accounted for over 50% of totalexports.
The global financial crisis had a limited impact on the Egyptian Banks. The banking sector in the country was positively impacted by the ongoingmomentum in structural macroeconomic reforms which helped the country attract more FDI inflow along with strong domestic investments.During the first two months of FY09 (July August) the total assets of the Egyptian banks reached LE 1,088.13 bn. During the same period thetotal deposits and Total credit reached LE 759.44 bn and LE 414.04 bn respectively.
So far the global financial crisis had a limited impact on the Egyptian economy but the world recession can result in slower economic growth ofthe country. Any such change may delay the completion of certain aspects of the banking sector reform program which remained favorable forthe Egyptian banking in the recent past. Going forward we believe that the operating environment will be challenging because of high inflation,unemployment and relatively low per capita GDP.
Commercial Banks Deposits
0
200
400
600
800
FY04 FY05 FY06 FY07 FY08
(inLE
billions)
0
5
10
15
20
Total Deposits Growth %
Source: Central Bank, BlomInvest Research
Distribution of Loansby Economic Activity
17%
32%12%
24%
15%
Agriculture Manufacturing Trade Services Unclassified Sectors
Source: Central Bank, BlomInvest Research
Rea l GDP growth
6.3% 6.0%5.5% 5.3%
5.7%
0%
2%
4%
6%
8%
2006 2007 2008E 2009E 2010E
Source: IMF & BlomInvest Research

30
Commercial Banking in the MENA Region
On the whole, Jordan’s import growth was faster in 2007 than export growth; leading to a negative trade balance which was reflected by the sharprise in the current account deficit (86.2%). These trends in external sector have continued in 2008, with trade deficit in the first eight months of 2008higher by 37.8 than in the same period of 2007
Fiscal deficit rose 38.8% in 2007, and would be higher if foreign grants were to be excluded. Increased fiscal revenues across all sub groups have beenoffset by a higher rise in fiscal expenditure. Similarly in the first eight months of 2008 public deficit was rising, to reach as much as USD 337.71 mnagainst a surplus of USD 96.56 mn in the same period last year, which was mainly due to rising oil and food subsidies prior to accepting the BudgetSupplementary Law in August.
Defense spending forms a major part of public expenditures (25.09% in 2007) on account of a hostile neighborhood. Public financing is furtherpressurized by large scale inward immigration owing to its geography. In order to reduce public spending the government is seeking enhanced privateparticipation. As many as 19 companies have been privatized during 2008.
Contrary to the overall regional trend, inflation rate inched down 0.9% in 2007. However, it surged to 19.4% in July 2008. The government’s decisionto replace fuel subsidies with a price adjustment mechanism added to the already existing external inflationary pressures. However with the financialturmoil and global recession that are hitting the world, inflationary pressures will to be subdued.
3.3.2 Industry Overview
The ongoing macro reforms and rapid growth of non oil sectors like real estate, construction and tourism have opened newer avenues of growth andextension for the banking industry. There were 23 operational banks in Jordan by the end of 2007, including two Islamic banks and eight branches offoreign banks with a network of 558 branches and 79 representative offices across the Kingdom.
Annua l a ve ra ge consumer pri ce infla t ion
5.4%6.2%
3.5%3.4%
1.6%
14.8%
0%
4%
8%
12%
16%
2003 2004 2005 2006 2007 2008E
Source: EIU & BlomInvest ResearchSource: The World Bank & BlomInvest Research
F i s ca l de f i ci t
0.9
0.10.2
0.60.6
1
0.8
0.6
0.4
0.2
0
1996 99 2000 04 2005 2006 2007
USD bn
6%
5%
4%
3%
2%
1%
0%
Fiscal balance, USD bn Fiscal balance, % ofGDP
Jordanian commercial banking sector has not witnessed any direct impact due to its relative isolation from the international sphere, howeverthe world recession would have negative effects on certain Jordanian sectors like exports, tourism and the money transfers of Jordanianexpatriates. The combined assets of Jordanian banks increased by 10.56% during 9M08 to reach JD 29,914.1 mn over the same period last year.During the 9M08 the combined deposits and total credit of Jordanian banks recorded a YoY increase of 14.0% and 22.0% respectively to reachJD 15,188.7 mn and JD 17,105.6 mn.

31
Commercial Banking in the MENA Region
During 2003 2005, total commercial banking assets grew at a CAGR of 14.3%. In 2007, total bank credit (public and private sector) rose 18.3% to reachJD 14372.3 mn from JD 12154.1 mn in the previous year. Domestic assets grew by 12.6% accounting for 87.9% of the overall increase in total assetsduring 2007 compared to 14.7% in 2006. Claims on private (resident) sector increased 15.3%, to JD 1,456.7 mn accounting for 64.3% of overallincrease in domestic assets. Public sector claims increased 33.1% to JD 765.0 mn, with a 33.8% of the total increase.
Total deposits (public and private sector) grew at a CAGR of 14.2% during the period 2003 2007. Private sector (resident) deposits were up by 10.9%to reach JD 12,499 mn. The public deposits at licensed banks grew by JD 72.6 mn to reach JD 772.3 mn.
In 2007, the ratio of total assets to GDP was 238.9% as compared to 242.4% in the previous year. Credit penetration in the country increasedsignificantly. The ratio of total credit to GDP increased from 89.3% in 2003 to 128.1% in 2007. Ratio of total deposits to GDP grew from 107.9% in2003 to 118.3% in 2007. During 2007, credit facilities extended to the financial services sector witnessed the strongest growth of 61.2% to reach JD390.1 mn from JD 242.1 mn in 2006.
Commercial Banks Credit
0
5000
10000
15000
20000
2003 2004 2005 2006 2007
(inJD
millions)
0
5
10
15
20
25
30
Total Credit Growth %
Source: Central Bank, BlomInvest Research
Commercial Banks Deposits
02000400060008000
100001200014000
2003 2004 2005 2006 2007
(inJD
millions)
0
5
10
15
20
Total Deposits Growth %
Source: Central Bank, BlomInvest Research
Sectoral Distribution ofBanksCredit
2%
12%
22%3%
2%
6%
3% 33%
17%
Agriculture & Mining Industry
General Trade Construction
Transportation Servies Tourism, Hotels and Resturants
Public Services Financial Services
Others
Source: Central Bank, BlomInvest Research
Banking Indicator
60
80
100
120
140
2003 2004 2005 2006 2007
(in%)
Total Credit as % ofGDP Total Deposits as % ofGDP
Source: Central Bank, BlomInvest
Going forward if the world slips into a deeper recession then the banking sector growth in the country will slow down, but the current situationsuggests that the banking system in the country is not experiencing any liquidity shortage or any credit crisis. The central bank recently saidthat the banking system has a liquidity surplus of USD 7.8 bn which will help the banks withstand the credit crisis. The government of Jordanalso guaranteed all the deposits in the country until the end of 2009.

32
Commercial Banking in the MENA Region
3.4 Kuwait
3.4.1 Economic OverviewBudget surplus was over USD 30.5 bn in 2007, implying that actualbudget revenues exceeded estimates. This was primarily on account ofactual oil prices being much higher than budgeted. Kuwait’s fiscal incomecomes either directly from oil exports, or through sovereign wealthfunds. Oil prices were also the reason for the fiscal performance in 2008;already in the first three quarters surplus reached USD 45.01 bn.
The downside of such favorable fiscal result is that high revenues arelikely to discourage unpopular reforms assumed for 2008 2009 aiming ateconomy diversification and including increased privatization.
During 2007, the oil and gas sector remained the biggest contributor toGDP with a 52.14% share.
The fast growing services sector has thrown up a number of diversification opportunities. Community, social and personal services account for 12.4%of the GDP, while financial institutions contribute 11.8%. Average growth of these two groups was 19%, and they were the biggest GDP contributorswithin the non oil sectors.
As natural resources other than oil are scarce, Kuwait is highly reliant on imports. The foreign trade/GDP ratio is around 75%. Despite high revenuesfrom oil exports in 2007 (94.9% of the total exports), trade surplus rose a marginal 3.8%. However, in 2008 it experienced a rapid surge, reaching in6M08 193% of the figure for the same period in 2007. Consumer demand for finished products continues to be very high, leading to rapid growth inimports.
Inflation was 5% in 2007 and reached 10% during Q1 2008, primarily due to external reasons. Kuwait maintained unchanged interest rates during2007 as it de pegged its currency from the dollar. However, interest rates had to be increased to 5.75%, to maintain the competitiveness of KuwaitiDinar, in January 2008.
3.4.2 Industry Overview
Rea l GDP growth
6.3%
4.6%
5.9% 5.8% 5.8%
0%
2%
4%
6%
8%
2006 2007 2008E 2009E 2010E
Source: IMF, BlomInvest
Current account surplus
51.57 48.04
71.23 64.0874.77
0
20
40
60
80
2006 2007 2008E 2009E 2010E
USD bn
0%
20%
40%
60%
Current account surplus, USD bn
Current account surplus, % ofGDP
Source: IMF, BlomInvest
Ove ra l l f i s ca l s u rp l u s
4.1
41.7
11.2
30.837
0
10
20
30
40
50
1996 99 2000 04 2005 2006 2007
USD bn
0%
10%
20%
30%
40%
50%
Fiscal balance, USD bn Fiscal balance, % ofGDP
Source:World Bank, BlomInvest
The Kuwaiti commercial banking sector performed well in 2008. The combined assets of Kuwaiti banks increased by 34.16% during 9M08 toreach KD 33.26 bn over the same period last year. The combined deposits and total credit of Kuwaiti banks also grew at a healthy pace,recording a YoY increase of 18.38% and 21.24% respectively to reach KD 22.97 bn and KD 26.88 bn.

33
Commercial Banking in the MENA Region
The Kuwaiti banking sector witnessed excellent growth over last couple of years led by high oil prices. Kuwait has 11 commercial, 2 specialized and 2Islamic banks.
The aggregate assets of local banks surged 28% to reach KD 37.2 bn, at end of 2007 08 from KD 29.1 bn in 2006 07. Total credit grew at a CAGR of18% during 2003 2007 to reach KD25.17 bn.
During 2007, the ratio of private sector credit to total credit grew to 92.8%, up from 89.7% in 2006. The rise was mainly due to an increase in thebalances of both the utilized portion of cash and credit facilities extended by local banks to the domestic economic sectors by 35% to KD 21.35 bn atend of the fiscal year 2007 2008, from KD 15.82 bn at end of the previous year. The balances of other domestic investments grew 54.2% to KD 2.02 bnat the end of fiscal year 2007, against KD 1.31 bn in 2006.
Total deposits increased from KD 11.33 bn in 2003 to KD 21.65 bn in2007, registering a CAGR of 17.5%. On a y o y basis, total depositsgrew 19.9% in 2007, which was somewhat less than 20.8% in 2006.
The resident private sector deposits with local banks grew by KD 3.23bn or 19.6% to KD 19.72 bn in 2007 against KD 16.49 bn in 2006. Thecontribution of private sector deposits to total deposits decreasedfrom 94.15% in 2003 to 91.1% in 2006.
During 2007, credit facilities to the industrial sector registered thehighest growth to reach KD 1071 mn in 2007 against KD 606 mn in2006. Credit facilities to non banking institutions also witnessed animpressive growth of 68.10% to reach KD2398.9 mn from KD 1427 mnin 2006. However, agriculture and fishing declined 59.4% to KD14.6 mnfrom KD36 mn in 2006.
Following the credit crisis, Kuwait's Gulf Bank said that it lost KD 375 mn (USD 1.4 bn) as a result of trading in derivatives and otherfinancial instruments. However we expect the Kuwaiti banking sector to perform well in the near future because of positive operatingenvironment (i.e recent oil boom) in local and regional economies. Besides that, healthy net interest margins and excellent cost efficiency willalso help Kuwaiti banks to increase their profitability. However, Kuwaiti banks which derive a substantial portion of their profits from capitalgains on investment securities bore the brunt of the inescapable situation, due to free fall of local stock markets. The stock exchange was shutfor trading in the month of November after a court ordered closure until November 17 to protect investors from further losses.
However, the overall economic growth of the county is expected to slow as it remains relatively undiversified, with half of its GDP beinggenerated from oil related activities, which in turn will result in slower banking sector growth. The local banks’ exposure to commercial realestate and construction sectors is also a matter of concern.
Commercial Banks Credit
05
1015202530
2003 2004 2005 2006 2007
(inKD
billion
s)
0
10
20
30
40
Total Credit Growth
Source: Central Bank, BlomInvest Research
Commercial Banks Deposits
0
5
10
15
20
25
2003 2004 2005 2006 2007
(inKD
millions)
0
5
10
15
20
25
Total Deposits Grow th
Source: Central Bank, BlomInvest Research
Sectoral Distribution Commercial Credit to Various Sectors
9% 5%
7%
12%
36%
25%
6%
Trade IndustryConstruction Non bank Financial Inst
Personal Real EstateOther
Source: Central Bank, BlomInvest Research

34
Commercial Banking in the MENA Region
3.5 Lebanon
3.5.1 Economic OverviewDespite a challenging political environment, GDP growth rate stood at 4%in 2007 and is expected to reach 6% in 2008. The military conflict in 2006had a large impact on overall economic activity.
Services accounts for almost 75% of GDP. Another major contributor istourism whose share is expected to grow as the political situationimproves. Manufacturing, dominated by small scale industries,contributes about 12% to the economy and employs about 3% ofpopulation.
Private sector consumption is on the rise, resulting partly from increasedvisits by Gulf citizens as well as Lebanese expatriate workers; alsoinvestors are attracted to the country, reviving the real estate andconstruction sector.
Fiscal deficit declined by almost 16% in 2007, which for an otherwise debt ridden country (2007 end estimate of USD 38 bn) was a huge relief. In thefirst six months of 2008, fiscla deficit registered USD 1.32 bn or 5.3% of GDP compared to USD 1.23 bn or 5.2% of GDP during the same period of2007. The reduced interest burden is likely to facilitate fiscal sustainability. Adding to this positive outlook, primary surplus was recorded in 2007,
compared to level close to zero in the previous year. This was achieved on account of 20% higher revenues, without any additional taxes, but with animprovement in tax collection efficiency. Expenditure rose a marginal 6%, despite a higher energy bill.
A significant number of Lebanese nationals live outside the country, forming a diaspora which is around three times the country’s population. Thisdiaspora is a source of large capital inflows into the country. According to the World Bank, remittances from expatriate workers in 2007 reached USD5.5. bn and are driving economic growth. Simultaneously, huge number of people working abroad ease pressure on the country’s labour market, withestimated unemployment rate of 20%.
3.5.2 Industry OverviewThere has been no direct impact of the global financial crisis on Lebanon because of good supervision by the CB, which prevented Lebanese banksfrom being exposed to the global financial crisis. As a result the banking sector performed well in first half of 2008. The banking activity, measured bythe consolidated assets of banks in Lebanon increased 7.5% as compared to the same period of the last year. During 6M08, the total credit extendedby Lebanese banks to private sector stood at USD 23.6 bn. Total private sector deposits increased by 6.8% to reach USD 72.1 bn as compared to theyear end of previous year. However, inflation in Lebanon and the rest of the region remains high.
Curre n t a ccount Ba l a nce
1.26
3.133.92
4.25 4.195
4
3
2
1
02006 2007 2008E 2009E 2010E
USD bn
15%
12%
9%
6%
3%
0%
Current account balance, USD bn
Current account balance, % ofGDP
Source: IMF & BlomInvest Research
F i s ca l ba l a nce
2.9 2.9
2
32.6
4
3
2
1
0
1996 99 2000 04 2005 2006 2007
USD bn
20%
15%
10%
5%
0%
Fiscal balance, USD bn Fiscal balance, % ofGDP
Source: World Bank, Central bank & Blom
Rea l GDP growth
0.0%
4.0%
6.0%
5.0%4.5%
0%
1%
2%
3%
4%
5%
6%
7%
2006 2007 2008E 2009E 2010E
Source: IMF & BlomInvest Research

35
Commercial Banking in the MENA Region
During the period 2004 2007, total private sector deposits and private sector credit grew at a CAGR of 7% and 9% respectively to reach USD 67.5billion and USD 23.6 Billion. At the end of 2007, private sector credit as a percentage of GDP stood at 100%, however the private sector deposits as apercentage of GDP stood at 282%.
3.6 Oman
3.6.1 Economic OverviewOil contributes 45.3% to Oman’s GDP, but declining production since2000 is encouraging the government to diversify the economy towardother sectors. The government’s attempt to diversify to a gas basedindustrial sector is unlikely to be viable, given the country’s limitedreserves.
During 2007, services contributed 40.55% in nominal and 66.2% in realterms to the GDP, reflecting a growth of 31.8%. Wholesale and retailtrades were the most significant among services, also in 2008. Industry(mainly oil production) is the third largest contributor, with a share of14.4% of GDP as of 2007. High oil revenues, increase in non oil exports(up 58.9%) and continued government spending led to a real GDP growthof 6.4% in 2007. In the first half of 2008, nominal GDP grew by 46.4% YoY,with non oil sector contributing to the majority of value added.The Vision 2020 initiative launched in 1996 is aimed at diversifying the
The Lebanese banks have more liquid balance sheets than otherbanks in the region evidenced by the fact that banks have relativelylow loan to deposit ratios. Going forward we believe that theLebanese banks will perform well and the immediate risks from theglobal financial crisis on the Lebanese banking sector remainlimited. However, the spillover from the global economic slowdownis likely to have an indirect impact on the local tourism, real estateand construction which in turn can negatively affect the financialsector performance.
Rea l GDP growth
6.8%6.4%
7.4%
6.0% 5.9%
0%
2%
4%
6%
8%
2006 2007 2008E 2009E 2010E
Source: IMF & BlomInvest Research
Commercial Banks Credit
0.05.0
10.015.020.025.030.0
2004 2005 2006 2007
(inUSD
billion
s)
0.0
5.0
10.0
15.0
Private Sector Credit Growth %
Source: Central Bank, BlomInvest Research
Commercial Bank Deposits
0.0
20.0
40.0
60.0
80.0
2004 2005 2006 2007
(inUSD
billion
s)
0.0
2.0
4.0
6.0
8.0
10.0
12.0
Private Sector Deposits Growth %
Source: Central Bank, BlomInvest Research
Banking Indicators
0%
50%
100%
150%
200%
250%
300%
2004 2005 2006 2007
(in%)
Total Private Sector Credit as % of GDP Total Private Sector Deposits as % of GDP
Source: Central Bank, BlomInvest Research
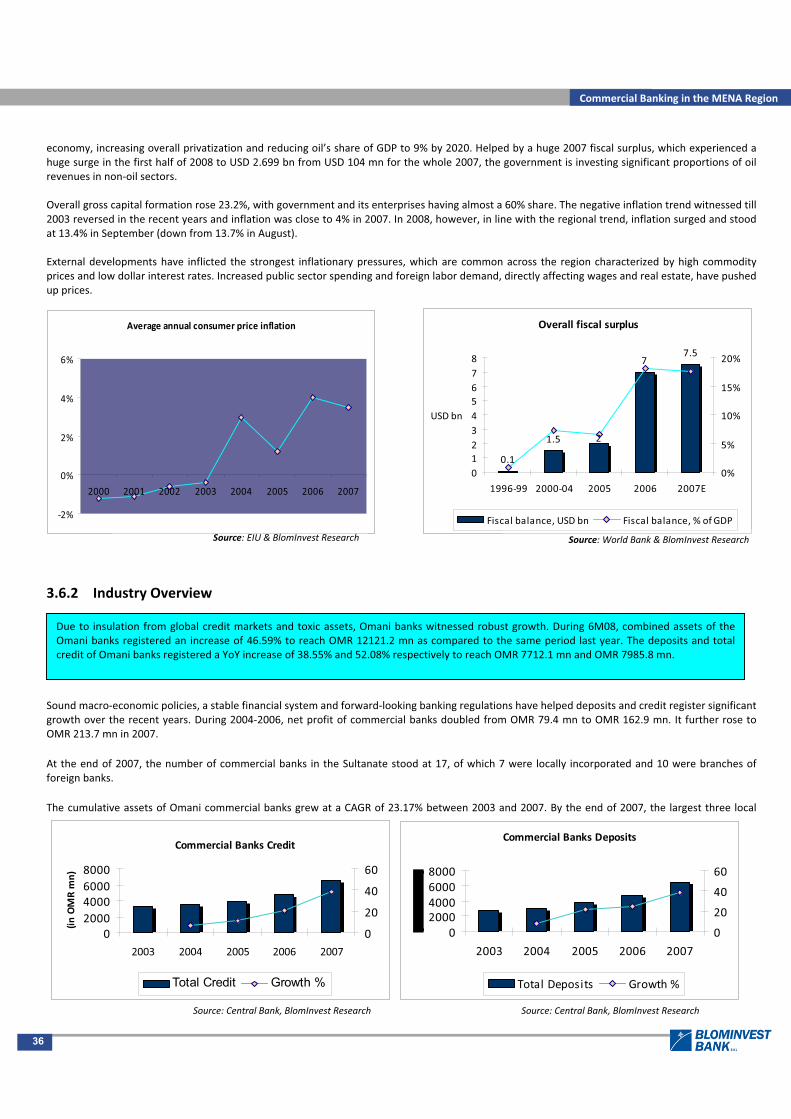
36
Commercial Banking in the MENA Region
economy, increasing overall privatization and reducing oil’s share of GDP to 9% by 2020. Helped by a huge 2007 fiscal surplus, which experienced ahuge surge in the first half of 2008 to USD 2.699 bn from USD 104 mn for the whole 2007, the government is investing significant proportions of oilrevenues in non oil sectors.
Overall gross capital formation rose 23.2%, with government and its enterprises having almost a 60% share. The negative inflation trend witnessed till2003 reversed in the recent years and inflation was close to 4% in 2007. In 2008, however, in line with the regional trend, inflation surged and stoodat 13.4% in September (down from 13.7% in August).
External developments have inflicted the strongest inflationary pressures, which are common across the region characterized by high commodityprices and low dollar interest rates. Increased public sector spending and foreign labor demand, directly affecting wages and real estate, have pushedup prices.
3.6.2 Industry Overview
Sound macro economic policies, a stable financial system and forward looking banking regulations have helped deposits and credit register significantgrowth over the recent years. During 2004 2006, net profit of commercial banks doubled from OMR 79.4 mn to OMR 162.9 mn. It further rose toOMR 213.7 mn in 2007.
At the end of 2007, the number of commercial banks in the Sultanate stood at 17, of which 7 were locally incorporated and 10 were branches offoreign banks.
The cumulative assets of Omani commercial banks grew at a CAGR of 23.17% between 2003 and 2007. By the end of 2007, the largest three local
Average annual consumer price inflation
2%
0%
2%
4%
6%
2000 2001 2002 2003 2004 2005 2006 2007
Source: EIU & BlomInvest Research
Overall fiscal surplus
0.1
1.5
77.5
2
012345678
1996 99 2000 04 2005 2006 2007E
USD bn
0%
5%
10%
15%
20%
Fiscal balance, USD bn Fiscal balance, % ofGDP
Source: World Bank & BlomInvest Research
Due to insulation from global credit markets and toxic assets, Omani banks witnessed robust growth. During 6M08, combined assets of theOmani banks registered an increase of 46.59% to reach OMR 12121.2 mn as compared to the same period last year. The deposits and totalcredit of Omani banks registered a YoY increase of 38.55% and 52.08% respectively to reach OMR 7712.1 mn and OMR 7985.8 mn.
Commercial Banks Credit
02000400060008000
2003 2004 2005 2006 2007
(inOMRmn)
0
20
40
60
Total Credit Growth %
Source: Central Bank, BlomInvest Research
Commercial Banks Deposits
02000400060008000
2003 2004 2005 2006 2007
0
20
40
60
Total Deposits Growth %
Source: Central Bank, BlomInvest Research

37
Commercial Banking in the MENA Region
banks accounted for 65% of total assets and 66% of total credit. A majority of assets were concentrated in credit to the private sector constituting59.03% of the total in 2007, growing at a CAGR of 18.41% during the period. Increased lending to the private sector reflects active participation of theprivate sector and the government’s commitment to open up the economy for privatization.
Liabilities continue to be dominated by deposits. The largest three local banks account for 60% of the total deposits. On the back of strong liquidityand higher interest rates, total deposits expanded 38.56% in 2006, to reach OMR 6491.40 mn. Deposits grew at a CAGR of 20.50% from 2003 to 2007.At the end of 2007, deposits accounted for 63% of total liabilities followed by core capital and reserves at 14%. Total non performing loans of listedbanks amounted to OMR 300 mn in 2007, which represented 5.2% of the banks’ aggregate loan portfolio by the end of 2007.
In 2007, the ratio of assets to GDP at current prices increased significantly to 66.60% from 52.80% in 2006, implying rapid banking growth withrespect to the real economy. Total credit accounted for 63% of the total, which was equivalent to 42% of GDP and 75% of non oil GDP in 2007. Duringthis period, total credit increased 38.30% compared to an increase of 20.70% in the previous year. While credit to the government declined 64.15%,credit to the private sector grew 38.8% and to public enterprises by 86.30%.
3.7 Qatar
3.7.1 Economic OverviewWith an exceptional 14.23% GDP growth in 2007, Qatar has clearly emerged as the region’s outperformer. In the current scenario, it will beinteresting to see how far Qatar will be able to retain this enviable position. For the time being, preliminary official estimates for the second quarter2008 are showing 60.8% rise over the same period in 2007.
The hydrocarbon sector contributed 63.5% to the GDP in the first half of 2008, which was a higher ratio than the 56.64% for the whole 2007 or itssimilar performance over the decade, which reflected its rapid growth of 85.3% in 6M08. With the third largest gas reserves in the world, thegovernment is eyeing a shift from oil to a gas based economy. Future stability is partly assured by the already concluded sale and purchaseagreements on future liquefied natural gas (LNG) for next 20 years.
Sectoral Distribution of Commercial Bank Credit
40%
25%
10%
8%6%
6% 4% 1%
Personal Loans OthersManufacturing Import TradeConstruction ServicesWholesale and Retail Trade Government
Source: Central Bank, BlomInvest Research
Banking Indicators
20
25
30
35
40
45
2003 2004 2005 2006 2007
(in %
)
Bank credit to GDP (%) Bank deposits to GDP (%)
Source: Central Bank, BlomInvest Research
According to the central bank of Oman, the country’s banking system has no direct exposure to any of the toxic financial products or thedistressed international institutions, and in that sense, it is insulated from the direct adverse ramifications of the global financial crisis.However we believe that country’s oil and gas development projects may be delayed due to liquidity crunch.
Going forward we believe that the commercial banks in Oman will perform well but are expected to grow at slower pace. The Capital MarketAuthority recently said that it is considering establishing a Market Maker Fund which will have the ability to maintain the market's rhythm incase of fluctuating performance. The Ministry of Commerce and Industry also said that the government spending on the current projects willcontinue and will not be reduced in the backdrop of the recent slump of oil prices. In order to ease liquidity, the CBO has relaxed thecompliance to the lending ratio requirement (w.e.f 01st Nov’08) of the banks by indefinitely deferring its earlier decision to implement astricter lending ratio of 82.5% from 85.0% imposed in June this year. It also allowed banks to hold 3.0% as CDs and cash portfolio of banks ofthe 8.0% reserve requirement.
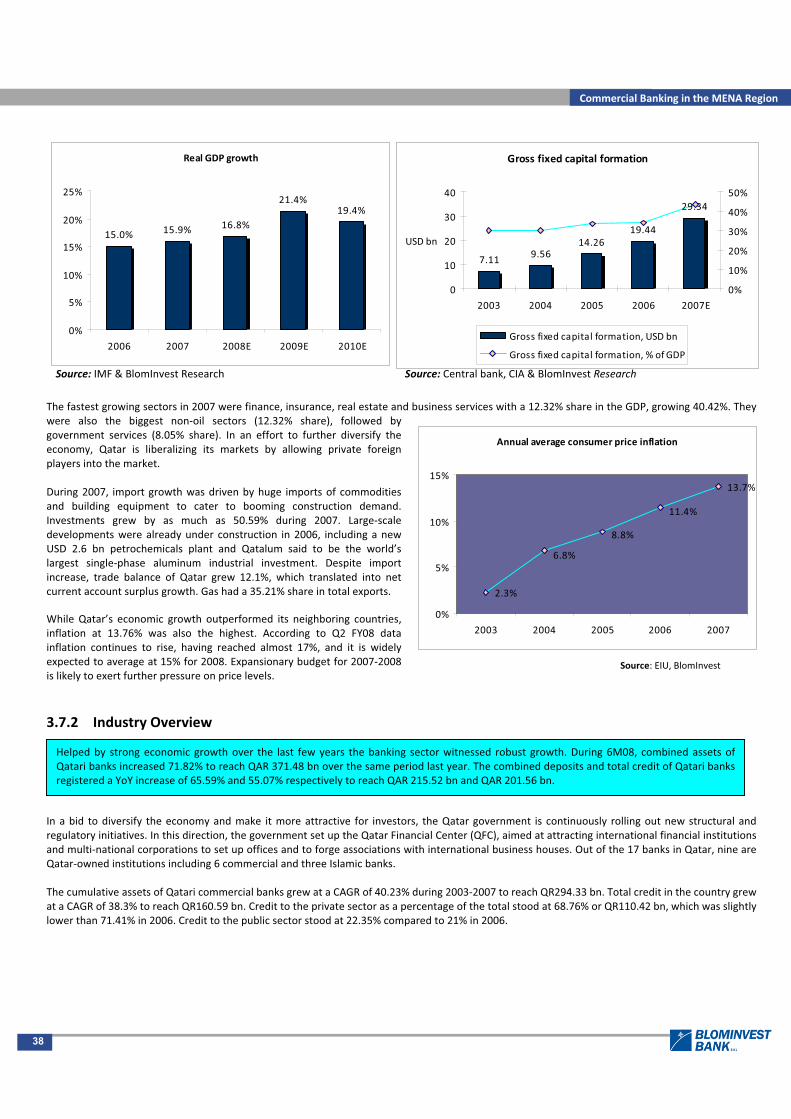
38
Commercial Banking in the MENA Region
The fastest growing sectors in 2007 were finance, insurance, real estate and business services with a 12.32% share in the GDP, growing 40.42%. Theywere also the biggest non oil sectors (12.32% share), followed bygovernment services (8.05% share). In an effort to further diversify theeconomy, Qatar is liberalizing its markets by allowing private foreignplayers into the market.
During 2007, import growth was driven by huge imports of commoditiesand building equipment to cater to booming construction demand.Investments grew by as much as 50.59% during 2007. Large scaledevelopments were already under construction in 2006, including a newUSD 2.6 bn petrochemicals plant and Qatalum said to be the world’slargest single phase aluminum industrial investment. Despite importincrease, trade balance of Qatar grew 12.1%, which translated into netcurrent account surplus growth. Gas had a 35.21% share in total exports.
While Qatar’s economic growth outperformed its neighboring countries,inflation at 13.76% was also the highest. According to Q2 FY08 datainflation continues to rise, having reached almost 17%, and it is widelyexpected to average at 15% for 2008. Expansionary budget for 2007 2008is likely to exert further pressure on price levels.
3.7.2 Industry Overview
In a bid to diversify the economy and make it more attractive for investors, the Qatar government is continuously rolling out new structural andregulatory initiatives. In this direction, the government set up the Qatar Financial Center (QFC), aimed at attracting international financial institutionsand multi national corporations to set up offices and to forge associations with international business houses. Out of the 17 banks in Qatar, nine areQatar owned institutions including 6 commercial and three Islamic banks.
The cumulative assets of Qatari commercial banks grew at a CAGR of 40.23% during 2003 2007 to reach QR294.33 bn. Total credit in the country grewat a CAGR of 38.3% to reach QR160.59 bn. Credit to the private sector as a percentage of the total stood at 68.76% or QR110.42 bn, which was slightlylower than 71.41% in 2006. Credit to the public sector stood at 22.35% compared to 21% in 2006.
Annual average consumer price inflation
2.3%
13.7%
6.8%
8.8%
11.4%
0%
5%
10%
15%
2003 2004 2005 2006 2007
Source: EIU, BlomInvest
Helped by strong economic growth over the last few years the banking sector witnessed robust growth. During 6M08, combined assets ofQatari banks increased 71.82% to reach QAR 371.48 bn over the same period last year. The combined deposits and total credit of Qatari banksregistered a YoY increase of 65.59% and 55.07% respectively to reach QAR 215.52 bn and QAR 201.56 bn.
Real GDP growth
15.0% 15.9% 16.8%
21.4%19.4%
0%
5%
10%
15%
20%
25%
2006 2007 2008E 2009E 2010E
Source: IMF & BlomInvest Research
Gross fixed capital formation
9.5614.26
19.44
29.34
7.11
0
10
20
30
40
2003 2004 2005 2006 2007E
USD bn
0%
10%
20%
30%
40%
50%
Gross fixed capital formation, USD bn
Gross fixed capital formation, % ofGDP
Source: Central bank, CIA & BlomInvest Research

39
Commercial Banking in the MENA Region
Liabilities continue to be dominated by deposits which grew 38.80% or QAR 46.75 bn to reach QAR 167.21 bn in 2007 over the previous year. Duringthe period 2003 2007, total deposits grew at a CAGR of 33.29%.
Banking penetration has been increasing over the last few years. In 2007, the ratio of assets to GDP at current prices increased significantly to113.82% from 91.69% in 2006. The ratio of credit deployment to GDP has grown to 62.10% at the end of 2007 from 49.62% at end 2006. In 2007, totalNPL’s of listed banks amounted to QAR1.83 bn, representing 1.2% of the banks’ aggregate loan portfolio at the end of 2007. During the same year,credit facilities to the real estate sector grew 86.4% to QAR 10.62 bn. The public and industrial sectors also witnessed strong credit growth of 66.7%and 66.5%, respectively.
Commercial Banks Credit
0.0050.00
100.00150.00200.00
2003 2004 2005 2006 2007
(inQRbn
)
0
20
40
60
Total Credit Growth %
z
Source: Central Bank, BlomInvest Research
Banking Indicators
40.00%
50.00%
60.00%
70.00%
80.00%
2004 2005 2006 2007
Total Credit as % ofGDP Total Deposits as % ofGDP
Source: Central Bank, BlomInvest Research
Commercial Banks Deposits
0.0050.00
100.00150.00200.00
2003 2004 2005 2006 2007
(inQRbn
)
0
20
40
60
Total Deposits Growth %
Source: Central Bank, BlomInvest Research
Sectoral Distribution ofCommercial Credit
30%
22%
12% 11% 9%
7%
5%
2%
2%Consumpt ion Public Sector Real Estate General Trade Outside QatarServices Contractors Industry Others
Source: Central Bank, BlomInvest Research
Going forward, we believe that Qatari banks will be one of the main beneficiaries from massive investment programs by the government aimedtoward diversifying the economy. The quality of assets of Qatari banks have improved in the last couple of years and expected to remainsound, however any steep growth in loan book needs to be watched with caution. Reiterating the soundness of Qatari banks, on October 29,2008 Qatar's central bank governor, Sheikh Abdullah Mohammed Al Thani, announced that no intervention was needed in the country'sfinancial sector as banks are highly capitalized and liquid. He also said that country’s banks are very solid and the central bank has lots ofinstruments in the open market that can be utilized when needed.
Following the recent financial crisis, Qatar is one of the few countries in the region planning to pick up stakes in global financial firms as a partof its long term investment strategy. Qatar Investment Authority is among investors from which Credit Suisse Group was raising CHF 10 bn(USD 8.64 bn) or about 12% of its outstanding equity. Qatar is also planning boost its investment in British bank Barclays as part of a GBP 2 bnrescue package. QIA has also agreed to contribute between 10% and 20% to the capital of local banks in order to boost their capacity to financedevelopmental projects.

40
Commercial Banking in the MENA Region
3.8 Saudi Arabia
3.8.1 Economic OverviewWith the largest oil reserves in the world, Saudi Arabia stands second in oil production and export. Oil accounts for 54.4% of the country’s economy,88% of total export incomes, and 87% of fiscal revenues. During 2007, the economy grew at 4.1%, on the back of rising oil prices. Another criticalgrowth driver is public spending, which focuses on diversification and further oil production capacity increment.
Consequent to becoming a WTO member in 2005, FDI inflows in 2006 and2007 reached record levels, making it the biggest FDI receiver in theregion. These inflows have translated into high domestic investment,supported by government projects in infrastructure, utilities and resourcebased industries like petrochemicals. The government continues to seekfurther FDI inflows to finance its projects and bring technical expertise,especially in the six “economic cities” slated to be ready by 2020.
Inflation, which at the end of 2007 was 4.1%, accelerated in 2008 and isforecasted to average 7.5% for the year. Housing and utilities’ costs werethe fastest growing components of inflation, with an increase of 16.7%.Fuel, water and food prices also contributed to the rise. Due to hugegovernment spending, money supply was on the rise in 2007, furtheraugmenting inflation.
However, the global financial crisis and the September 2008 plunge inSaudi stock market have led to inflation easing out slightly to 10.4% from10.9% in August and a record 11.1% in July in a tightened creditenvironment.
3.8.2 Industry Overview
Sources: IMF, BlomInvest Research
Rea l GDP growth
3.0%3.5%
5.9%
4.3% 4.6%
0%
2%
4%
6%
8%
2006 2007 2008E 2009E 2010E
Annua l a ve ra ge consumer pri ce infla t ion
0.6%
2.3%
4.1%
0.6% 0.4%
0%
1%
2%
3%
4%
5%
2003 2004 2005 2006 2007
Sources: SAMA, BlomInvest Research
FDI i n f l ows a nd gros s f i xe d i nve s tment
24.32
12.10
18.29
0
5
10
15
20
25
30
2005 2006 2007
USD bn
0%
5%
10%
15%
20%
25%
FDI, USD bn Gross fixed investment, % ofGDP
Sources: UNCTAD, EIU, & BlomInvest Research
Due to its limited exposure in the global financial markets, Saudi Arabia’s commercial banking sector managed to escape the severeimplications of the global financial distress. Combined assets of Saudi banks increased 27.29% during 9M08 to reach SAR 1269.89 bn over thesame period last year. Combined bank deposits and total credit also grew at a healthy pace, recording a YoY increase of 19.12% and 36.10%respectively to reach SAR 804.12 bn and SAR 962.39 bn.

41
Commercial Banking in the MENA Region
Most commercial banks in Saudi Arabia during 2007 witnessed strong financial results. This increase was supported by rise in domestic economicactivity (particularly in the private sector), improvement in the constituents of national economy and efficient resource management by commercialbanks.
Total assets grew at a CAGR of 18.5% during 2003 2005; however, profits declined 12.7%. The capital and reserves of commercial banks rose 32.6%.They also witnessed a notable expansion in uptake of modern banking technology, including phone and internet services, in 2007. Their total assetsrose 24.9% or SAR 214.1 bn to reach SAR 1,075.2 bn during 2007 from 13.4% or SAR 102.0 bn in the preceding year.
Total bank credit rose 19.8% to reach SAR 760.9 bn in 2007 compared to an increase of 6.6% or SAR 39.1 bn in the preceding year. Bank credit as ashare of total deposits declined marginally to 106.0% in 2007 from 107.4% in the preceding year. On the assets side, private sector credit accountedfor bulk of the expansion in bank credit. Total private sector credit rose 21.4% to reach SAR 577.9 bn as compared to a rise of 9.2% in 2006. Theseclaims represented 80.5% of total bank deposits at the end of 2007. The credit extended to public sector increased 14.8% to reach SAR 181.6 bn in2007, constituting 25.3% of total bank deposits compared to 26.8% in the preceding year.
On the back of increased net domestic government expenditure and expansion in bank credit to the private sector, total bank deposits increased21.4% to reach SAR 717.6 bn. The private sector deposits increased 20.8 % to SAR 573.6 bn in 2007 compared to a growth of 16.2% in the precedingyear. During the period, the share of private sector deposits to total deposits was 79.9%. At the same time the deposits of the public sector increased23.7% to reach SAR 143.9 bn.
During 2007, ratio of assets to GDP at current prices surged to 75.2% from 67.7% in 2003, which shows active participation of the banking sector inthe economy. Total credit accounted for 70.6% of total assets, which was equivalent to 53.1% of GDP at current prices in 2007.
Comme rci a l Ba nks Cre d i t
0
200
400
600
800
2003 2004 2005 2006 2007
(in
SARbillions)
05
1015
2025
Total Credit Growth %
Source: Central Bank, BlomInvest Research
Commercial Banks Deposits
0
200
400
600
800
2003 2004 2005 2006 2007
(inSA
Rbillion
s)
0510152025
Total Bank Deposits Growth %
Source: Central Bank, BlomInvest Research
Banking Indica tors
30
35
40
45
50
55
2003 2004 2005 2006 2007
Tot al Credit as % of GDP Tot al Deposit s as % of GDP
Source: Central Bank, BlomInvest Research
Distribution ofCredit to Private Sector by Economic Activity
2% 8%1%
8%
23%
4%11%5%
38%
Agriculture and Fishing M anufacturing and ProcessingElectricity Water and Other Utilities Building and ConstructionCommerce Transport & CommunicationFinance ServicesM iscellaneous
Source: Central Bank, BlomInvest Research

42
Commercial Banking in the MENA Region
3.9 United Arab Emirates
3.9.1 Economic Overview
Real GDP growth reached 10.79% in 2007, one of the best performances in the region. The government’s diversification efforts have reaped benefits.Despite public finance being heavily dependent on oil and gas, it accounts for only 39% of GDP. Non oil sector is expected to witness sturdy growthduring 2008, supported mainly by industrial development (manufacturing and heavy, energy intensive industries like metals and petrochemicals).Manufacturing (mainly gas and petroleum products) along with wholesale, retail trade and maintenance were the biggest non oil contributors to theGDP with respective shares of 12% and 10%.
Both domestic and foreign investments should continue at their currentlevels, while maintaining the capital spending on real estate andinfrastructure projects. Within the country, there are still hugedisparities. Abu Dhabi (the biggest oil producer) and Dubai have thelion’s share in the country’s overall GDP – a staggering 88.4%.
Bucking the regional trend, the current account surplus kept growingthrough 2007. Share of re exports in total exports was only 5% lowerthan that of the oil sector. Non hydrocarbon sector matchedhydrocarbons growth rate of around 20%. While oil and gas exports rosemainly due to price increases, growth in non oil sectors was on accountof higher volumes. Despite stronger import growth (as against exportgrowth) the UAE recorded a trade surplus in 2007. For the thirdconsecutive year, FDI inflow remained robust, reaching over USD 13 bnin 2007.
Being a critical player in the global markets, Saudi Arabia will have some dampening effects on the overall economic growth which will directlyor indirectly impact the Kingdom’s banking sector performance. But these effects are not believed to be as detrimental as witnessed by somedeveloped economies. However, SAMA (the Kingdom's central bank) has been closely following the market developments and remains readyto provide liquidity if needed. According to the central bank, Saudi banks are well funded and can cover all of their financial obligations.
Going forward, we believe that Saudi Arabia’s positive macroeconomic outlook, favorable demographics, increased mega infrastructureinvestments and the ongoing sectoral reforms will provide enormous future business opportunities to the banking sector in the Kingdom. Theincreased economic activity will enhance both the financing appetite and customer deposit base in the Kingdom.
Sources: IMF, BlomInvest Research
Rea l GDP growth
9.4%
7.4%7.0%
6.0%5.6%
0%
2%
4%
6%
8%
10%
2006 2007 2008E 2009E 2010E
Curre n t a ccount s u rp l u s
37.11 39.11
60.9155.26 55.86
0102030
40506070
2006 2007 2008E 2009E 2010E
USD bn
0%
5%
10%
15%
20%
25%
Current account surplus, USD bn
Current account surplus, % ofGDP
Sources: IMF & BlomInvest Research
Centra l Bank repo ra te s in 2008
3.50%
3.00%
1.50%2.00%
2.25%
0%
1%
2%
3%
4%
23 Jan 31 Jan 19 Mar 1 May 8 Oct
Sources: Central Bank & BlomInvest Research

43
Commercial Banking in the MENA Region
UAE, as a member of GCC, has its currency pegged to dollar. In the face of an expansionary monetary policy in the US, UAE’s Central Bank has beencutting its interest rates in line with the Fed’s cuts, as a result of which real interest rates were negative facilitating easier credit. This monetary policyhas also put pressure on inflation, which was over 11% in 2007 and is forecast to remain at similar levels (12%) through 2008. Other inflationaryfactors include global commodity price shock and second round wage effect (initiated by the 70% rise in federal wages at the end of 2007).
3.9.2 Industry Overview
During 2007, the banking sector witnessed strong credit and deposit growth on the back of relatively low interest rates, high oil prices and aflourishing economy. Both local and foreign players operate in the market; however, the latter’s operation is restricted to eight branches. Currently,there are 46 banks operating in UAE, which include branches and offices of foreign banks. After Bahrain, this is the second highest number among theGCC countries.
The combined balance sheet of banks operating in the UAE grew 42.3% to reach AED 1223.07 bn at the end of 2007, against AED 859.57 bn at the endof 2006. Credit extended increased 33.6% to reach AED 718.09 bn, down from 36.01% in 2006. This was on account of 36.6% to AED 647.48 bngrowth in credit extended to residents and 11.6% to reach AED 70.60 bn to non residents.
Bank Credit to Residents by Sectors7% 2% 11%
16%
3%
6%
9%
46%
Mining and Industry Electricity and Water
Construction Trade
Transportation, Storage and Communication Other Financial Institutions
Government Others
By the end of 2007, total deposits amounted to AED716.02 bn, recording an increase of 38.0% over 2006. The increase was mainly due to a rise inresident deposits which grew AED182.02 bn or 38.8%, while non residents deposits grew to AED 15.20 bn or 30.71% over the previous year.
Banking penetration in the country continued to advance in 2007. The ratio of credit deployment to GDP stood at 95.44% at the end of 2007 from80.52% in 2006, while deposits to GDP ratio stood at 98.12% in 2007 as compared to 83.05% in 2006.
During 6M08, combined assets of UAE banks increased 41.95% to reach AED 1423.20 bn as compared to the same period last year. During thesame period combined deposits and total credit of UAE banks also grew at a healthy pace, recording a YoY increase of 35.68% and 48.66%respectively to reach AED 837.66 bn and AED 889.25 bn, respectively. However the turbulence in the global financial markets has startedshowing its impact on the UAE’s credit markets, which is evident by the fact that interbank rate (AEIBOR) have been on the rise since June 08.
Source: Central Bank, BlomInvest Research
Commercial Banks Credit
0.00200.00400.00600.00800.00
2003 2004 2005 2006 2007
(inAED
billion
s)
0
20
40
60
Total Bank Credit Growth %
Source: Central Bank, BlomInvest Research
Commercial Banks Deposits
0.00200.00400.00600.00800.00
2003 2004 2005 2006 2007
(inAED
billion
s)
0
20
40
60
Total Deposits Growth %
Source: Central Bank, BlomInvest Research
Banking Indicators
5060708090
100
2003 2004 2005 2006 2007
(in%)
Bank Credit to GDP % Bank Deposit to GDP%
Source: Central Bank, BlomInvest Research

44
Commercial Banking in the MENA Region
The turbulence of the global credit crisis has resulted in sharp tightening in the domestic liquidity and the international capital markets. Fallingreal estate prices also raised concerns over the performance of banking sector, given its importance in the UAE’s economy. However, webelieve that UAE’s huge fiscal reserves will help the authorities to ease liquidity conditions in the country and support growth. In October, thefinance ministry of the United Arab Emirates injected nearly USD 7 bn into the banking sector to ensure liquidity and shore up bank assets inthe country.
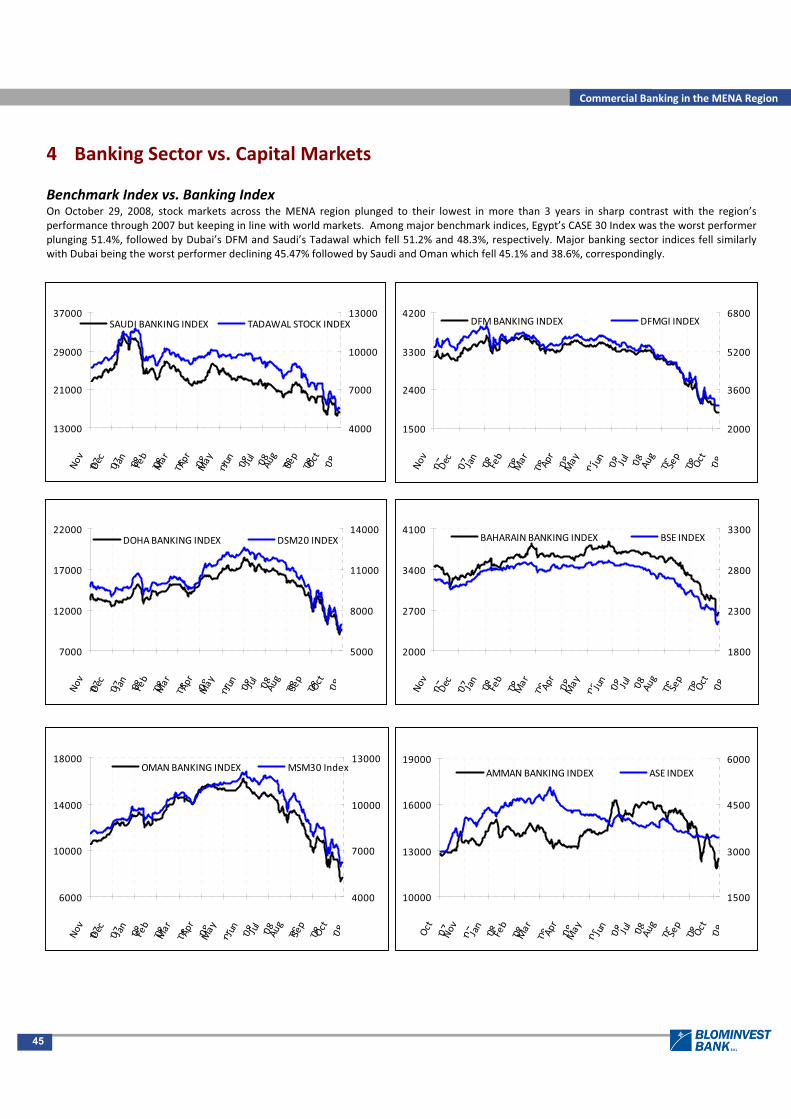
45
Commercial Banking in the MENA Region
10000
13000
16000
19000
Oct
07Nov
07Jan
08 Feb
08Mar
08Apr 08May
08Jun 08 Jul
08 Aug
08Sep
08 Oct 08
1500
3000
4500
6000AMMANBANKING INDEX ASE INDEX
4 Banking Sector vs. Capital Markets
Benchmark Index vs. Banking IndexOn October 29, 2008, stock markets across the MENA region plunged to their lowest in more than 3 years in sharp contrast with the region’sperformance through 2007 but keeping in line with world markets. Among major benchmark indices, Egypt’s CASE 30 Index was the worst performerplunging 51.4%, followed by Dubai’s DFM and Saudi’s Tadawal which fell 51.2% and 48.3%, respectively. Major banking sector indices fell similarlywith Dubai being the worst performer declining 45.47% followed by Saudi and Oman which fell 45.1% and 38.6%, correspondingly.
13000
21000
29000
37000
Nov
07Dec
07Jan
08Feb
08Mar
08Apr 08May
08Jun 08Jul
08Aug
08Sep
08Oct 08
4000
7000
10000
13000SAUDI BANKING INDEX TADAWAL STOCK INDEX
1500
2400
3300
4200
Nov
07Dec
07 Jan
08 Feb
08Mar
08Apr 08May
08Jun 08 Jul
08 Aug
08Sep
08 Oct 08
2000
3600
5200
6800DFMBANKING INDEX DFMGI INDEX
7000
12000
17000
22000
Nov
07Dec
07Jan
08Feb
08Mar
08Apr 08May
08Jun 08Jul
08Aug
08Sep
08Oct 08
5000
8000
11000
14000DOHABANKING INDEX DSM20 INDEX
2000
2700
3400
4100
Nov
07Dec
07 Jan
08 Feb
08Mar
08Apr 08May
08Jun 08 Jul
08 Aug
08Sep
08 Oct 08
1800
2300
2800
3300BAHARAIN BANKING INDEX BSE INDEX
6000
10000
14000
18000
Nov
07Dec
07Jan
08Feb
08Mar
08Apr 08May
08Jun 08Jul
08Aug
08Sep
08Oct 08
4000
7000
10000
13000OMANBANKING INDEX MSM30 Index
46
Commercial Banking in the MENA Region
5 Opportunities and Challenges
While largely cushioned from the impact of the global economic crisis, the MENA region holds a number of opportunities particularly for the bankingsector. Needless to say, the players response to these opportunities will define the future growth story of the sector as a whole. There are certaincommon threads which run across countries that owe their economic strength to large oil reserves. On the other hand, countries in the Levant regionhave patterns defined by large scale migration and the spill over effect of prosperous neighbors.
5.1 Penetration of InsuranceInsurance services in the MENA region are a relatively less developed segment of the financial services sector. Penetration rates are low (under 10%for general insurance and under 1% for life insurance), supply under capitalized and the regulatory framework not really adequate. Among the MENAcountries, Gulf States have the lowest penetration levels. Insurance gross premium potential is estimated at over USD 20 bn; and the largest share iscontributed by property and casualty premiums. However, the market is expected to take off, growing at a compounded rate of 18 20% in the nearfuture. Despite low penetration, growing awareness, health consciousness and government initiatives support the estimated growth numbers. Otherdrivers include the region’s demographic structure high proportion of young workforce in the middle income group, as well as increasing accidentsand death rate in the region. Banks can tap this growth potential through bancassurance, an increasingly popular service which has been witnessingsteady growth in Egypt and Lebanon.
Banks are better placed than the insurance companies in the region. Firstly, the difficulty of establishing a distribution network in the region forcesinsurance companies to collaborate with banks and use their branch infrastructure to reach more customers. This collaboration is expected tosucceed given the popularity of universal banking in the region. Another advantage with this approach is a relatively lower cost per sale owing to anexisting customer base. Furthermore, their marketing capabilities and experience are usually wide, on account of extensive transaction processingand customer service experience supported by appropriate technology. This has indeed been the case in most countries around the world wheresales of insurance products through established bank branches and staff typically outnumbers all other sales channels. A particularly relevantincentive is the fact that bancassurance can enable banks to diversify their income sources from fund based to fee based income.
Bancassurance products in most MENA countries can be divided into credit related (consumer credit insurance products) and non credit related(mostly in the life sector, including investment linked policies). Majority of the products are simple with single premiums, leaving space fordevelopment of more complex bancassurance services (educational, traditional whole life and medical policies).
5.2 MicrofinanceThe micro finance sector in the MENA region is a nascent industry, highly focused on the poor, and relatively underdeveloped. Existence ofunemployment pockets coupled with uneven distribution of wealth provides sufficient scope for future growth. The outreach of a typical MENAmicrofinance institution (MFI) has been growing over the past years, to reach a relatively high figure of 13,000 clients per institution. There are still anestimated 5 mn potential micro entrepreneurs in the region who lack access to financial services. While the overall sector recorded a 0.5% loss,resulting from loan management inefficiency within small and medium institutions; large scale Arab MFIs were highly profitable, with a 3.2% ROA.Microfinance is particularly relevant for resource poor countries like Egypt, Jordan and Lebanon where demand is high. Unemployment in these threecountries is the highest and per capital GDP the lowest in the region. As expected, the microfinance sector in Egypt and Jordan is developingsignificantly, while Lebanon with a relatively higher GDP per capita of USD 6,569 lags behind.
EgyptMicro and small enterprises, the main beneficiaries of microfinance, are integral to Egypt’s economy. There are at least 2.6 mn of these employingabout 40% of the total workforce. According to Microfinance Information Exchange, market penetration in Egypt (measured by the ratio of number ofborrowers to the number of people living on USD 2 or less a day) is 2.1%. However, with the region’s highest poverty ratio, Egypt can be one of thelargest potential markets in the future.
The players in the Egyptian microfinance market include 8 specialized NGOs, 3 state owned banks (Banque du Caire, Bank Misr, PBDAC), 2 privatebanks (National Bank for Development and Bank of Alexandria), as well as a number of Community Development NGOs and Community DevelopmentAssociations acting locally. Furthermore, National Postal Authority is the only institution offering savings/deposit services (whose outreach is limiteddue to micro entrepreneurs’ reluctance to use the banking system). They are regulated either by the Central Bank of Egypt (in case of banks) or theMinistry of Social Solidarity (in case of NGOs).
JordanJordan’s microfinance market penetration is estimated at 18.76 and the market has seen strong growth in the last few years. According to the latestavailable figures (2006), the number of MFIs increased 30% and loan portfolios grew 48%. There are approximately 17 national MFIs, of which five arestrongly commercially oriented with microfinance as their main focus; and the rest provide the service as part of other development activities. They

47
Commercial Banking in the MENA Region
are regulated by three bodies: Central Bank, Ministry of Commerce and Trade and Ministry of Planning. There is no general restriction concerning thelegal entity of institutions that would like to engage in micro lending (the ones existing currently include non profit and profit organizations withlimited liability as well as NGOs).
LebanonAccording to a recent report by the International Finance Corporation, the potential microfinance market in Lebanon can be worth over USD 286 mn,with only 11.5% of the demand for financing met by existing sources. According to the survey, growth is slow in comparison primarily owing topolitical instability and inflation. Lack of funding has ceased to be the main problem. High competition contrasted with low market penetrationreflects the low development and organization of existing institutions, most of which are NGOs with portfolio values spanning from over USD 2 mn(including two most important MFIs, AMEEN and Al Majmoua) to less than USD 500,000.
5.3 RemittancesAccording to an assessment by Western Union, the MENA region contributes USD 78 bn to the total global remittances of USD 370 bn. The countriescan be divided into two main groups: labor importers (mainly the GCC states) and labor exporters. For both, remittances form a significant share ofcash transfers. Large cash flows take place within the region as well, reflecting massive labor migration between the countries. The share of intraregional emigration in the total is estimated between 15 to 20%. The major cross border movement happens from the non GCC countries into theGulf states primarily to leverage opportunities thrown open by a thriving oil sector. In addition, there is significant outward movement to countries inEurope, while South East Asia and the Indian subcontinent contribute significantly to immigration.
Due to an increasing number of development projects requiring huge workforce, the region has witnessed rapid and increased migration. The regionleads in terms of money transfer and remittance growth which stands at 15% annually. New schemes providing money transfer facility on mobiletelecommunication are being tested and introduced. Due to the banks’ minimal involvement in the remittance industry and money transfer bureaus’relatively higher fees, the mobile channel is likely to witness increased uptake. However, logistical and technological shortfalls are a deterrent toachieving the expected success. This renders opportunity for banks to enter, either on their own or in conjunction with money transfer bureaushaving global networks.
Bahrain, Kuwait, Oman, Qatar, Saudi Arabia and the United Arab Emirates are all labor importing countries, implying outbound remittances. Egypt,Jordan and Lebanon on the other hand export labor, thereby experiencing remittance inflows. In the region, Egypt recorded the highest remittancetransfers value in 2007, having received an estimated USD 5.9 bn; Lebanon received USD 5.5 bn (and at the same time had 23% share of remittancesin GDP, highest in the region), and Jordan accounted for USD 2.9 bn.
5.4 Small and Medium EnterprisesIn employment terms, small and medium enterprises form the majority of the private sector in the MENA region. However, their share of the GDP isrelatively small, reflecting the systemic obstacles they encounter. One of the main problems is lack of specialized services aimed at their specificneeds. Banks often lack credit skills, the know how and the capabilities to design a pricing system that would be attractive for the SME. As a result,sufficient funding is not available to this class of enterprises which can potentially be the backbone of sustainable economic development. Recently,initiatives like mezzanine funds, loans for medium sized services based businesses, have been undertaken by a joint venture between NBK Capital andGSC Group. Further facilitation is supposed to be the creation of credit bureaus network in the region, planned by the International FinanceCorporation, the World Bank and the Arab Monetary Fund.
BahrainSMEs form 76% of the total workforce according to estimates from the Ministry of Industry and Commerce. The ministry recognizes the sector’sproblems related to availability of funds and, in its Statement of Policy regarding SMEs, has included plans to facilitate development of innovativefinancial services and encourage growth of the venture fund industry. The first initiative of offering such low profit finance scheme to SMEs in thecountry was the 2007 launch of 4% p.a. loans by the Labour Fund and the Shamil Bank of Bahrain. The total sum set aside for the initiative was BD12.5 mn. The Bahrain Development Bank regularly runs projects aimed at financing SMEs in the country.
EgyptIn Egypt, SMEs are estimated to constitute over 90% of private non agriculture sector companies. Limited access to capital is one of the mainconstraints hindering the growth of the sector. There are several sources providing finance to the sector, most of which are private informal sources.Institutions engaged in offering loans to SMEs are mainly the European Investment Bank and the Social Fund for Development in cooperation with theEuropean Commission. A study in 2005 concluded that the needs of the sector can be estimated at USD 400 mn per year; existing loan initiativescovered around 10% of enterprises. Because of high risk and low returns resulting from the lack of appropriate capacity, commercial banks arereluctant to provide such services. It is only recently that they are starting to target the sector: Ahli United Bank Egypt has recently introducedMyBusiness designed for SMEs, and Egyptian Gulf Bank is conducting a feasibility study for setting up a new company to finance these enterprises.
Jordan

48
Commercial Banking in the MENA Region
SMEs form a majority of industrial enterprises in Jordan; companies employing less than 20 people are estimated to account for more than 98% of thetotal number of enterprises and to contribute 50% of GDP. However, further business development is impeded by the lack of opportunities in thebusiness environment and the lack of appropriate financing system. The commercial banks are only starting to see it as an opportunity for the future.
KuwaitIn Kuwait, SMEs account for an estimated.6% of the total number of companies. Similar to the region, these also face funding constraints and oftenresort to informal financing channels. The Gulf Bank is the only commercial bank offering comprehensive banking solutions for SMEs, in Kuwait. It hasalso recently added SME directed website to its offer.
LebanonAlmost 90% of total enterprises are small enterprises, and 8% are categorized as medium enterprises. They experience similar difficulties in accessingfunding. After the military conflict of 2006, the satiation has deteriorated further in Lebanon. NGOs are the prime lenders to SMEs financing;however, the government also tries to facilitate funding by a joint program with the EU. The commercial sector does not offer much support forSMEs, with some exceptions including Byblos Bank and Blom Bank.
Saudi ArabiaSMEs constitute 70 80% of the trading, services and industrial sectors in the country, and employs over 50% of the labor force. The Saudi governmenthas recognized their role in the diversification and growth of the economy. Although banks offer services to the SME sector (Riyad Bank hasdeveloped a SME banking strategy), complicated procedures like guarantees render it difficult for these companies to utilize them. SME loanregulations are too stringent when compared to those for larger companies in the country.
United Arab EmiratesUAE is recognizing the vitality SMEs in the economic growth and diversification and thus appreciating the need to supporting them. As a result,according to a 2007 ranking, the country improved its position significantly in terms of encouraging start up businesses and entrepreneurship. Recentgovernment initiatives include plans to establish business incubators for SMEs and exemption of bank guarantees for SMEs fulfilling certainconditions. Commercial sector is also catching up; banks like Doha Bank or Union National Bank are increasingly offering loan products for the sector.
5.5 Internet based banking servicesIn 2001, only 18 out of the top 100 Arab banks had the required infrastructure to provide internet based banking services. Although a lot haschanged, the region still lags behind the rest of the world in terms of internet and e banking usage. The contrast is due to lower average internetusage, a still developing telecom infrastructure, and banks’ reluctance to pump in the required investments in this area. The preference of regionalpopulation to engage in branch based services and in person interactions is also a critical factor behind the slow growth of such facilities. It is usuallythe international banks that lead the introduction of electronic services and are gradually followed by their domestic counterparts. E banking securityhas been a concern due to some recent cases of ATM frauds particularly in the UAE. The GCC states are considered to be the regional leaders in termsof adopting e banking technologies.
BahrainBahrain is the most developed among the GCC countries when it comes to popularity and usage of e banking. It ranks third among the GCC countrieson payment card density, estimated at 51.4 cards per 100 inhabitants. Almost all major banks offer both phone and mobile services on a 24 hourbasis. Most banks have active websites offering both corporate and retail banking services. They provide online payment facility through debit andcredit cards, with no service fee for payments related to government services.
EgyptCurrently 13 out of the total 41 banks in Egypt have been licensed by the Central Bank to offer electronic banking services. However, only 3 banks,incidentally all international, have been granted the license to run both internet and phone banking operations.
JordanElectronic banking in Jordan was started in 2000 by Arab Bank and Citi Bank. Most banks have websites now, though not all of them offer internetbanking services. According to banks, poor regulatory framework providing insufficient electronic security standards is the primary obstacle to ebanking development.
LebanonWhile over 70% Lebanese banks offer electronic services, only 7.5% banks (all international) have been successful in inspiring customers to use thischannel. This clearly indicates that the segment remains underdeveloped, despite benefits to banks and the government’s efforts to encourage eservices since 2002.
Kuwait
49
Commercial Banking in the MENA Region
The use of e banking in Kuwait is among the highest in the region, with its banks showing the highest adoption rate among Arab countries. During2004, internet banking accounts formed around 20% of total banking accounts, and the share has been growing since then. According to a report,there is no bank independent e banking standard in the country, with every bank using its own system. Internet banking is increasingly being used byretail customers and small companies, while mid and large corporate still prefers the traditional channels.
OmanMost transactions are still conducted through conventional channels, and the adoption of electronic solutions remains slow. A major obstacle is theslow technology adoption in the society primarily owing to socio cultural factors.
QatarInternet banking, initially as a retail banking service, was introduced in Qatar during 2000. Corporate internet banking, introduced later, is still in itsnascent stages. The government has included e banking in its campaign to promote e commerce. One of the main hindrances, especially for domesticbanks, is the lack of appropriate platforms to provide e solutions to businesses. Unless domestic banks develop such a platform, they will be unable tocompete successfully with international banks.
Saudi ArabiaSaudi Arabia boasts of one of the most developed e banking infrastructures in the region, strongly encouraged by the Saudi Arabian MonetaryAgency. Since 2004, all Saudi banks have been linked to the technology platform developed by SAMA in cooperation with Trust Centre. As a result, asearly as in 2003, almost all banks in the country offered retail as well as corporate e banking services. Electronic bill payment facility is fast catchingup with almost three quarters of the population using e payment modes.
United Arab EmiratesE banking was introduced in UAE in 1996 but it could not pick up as initially expected. At the end of 2003, only 28% banks were offering e services,and the ratio has increased since then. There is still potential to expand the reach of this channel with only 15 out of the 40 existing banks offeringinternet banking services. E banking security is the main concern at the moment, and is of vital importance in the country as Dubai emerges as thenext financial center of the region. However, experts believe that conversion to a new high tech payment system is imperative. Currently, it isestimated that 40% of UAE’s population use credit cards, one of the highest penetration in the region.
5.6 Continuation of the reform processThe banking sector in the region is the main beneficiary of the ongoing reforms. On one hand it is helping local players gear up for internationalcompetitors coming into the region. On the other, the reforms are bringing in healthy competition and greater efficiency by allowing more players tocompete on a level playing field.
Basel II is a set of new rules for banks, aimed at adjusting the banking industry to the new financial environment. While under Basel I, banks neededto back loans with a specific amount, Basel II assumes more complex reserve amount calculation depending on loan quality. This requires banks toaccommodate a number of procedures, particularly on the risk management front.
Across the MENA region, while big international banks have well structured programs in place, smaller regional institutions find it more difficult tocomply. Middle Eastern banks were not part of the Basel Committee members, which agreed to implement the accord by 2007. However, due tostrong international pressures, they are aiming to be compliant with Basel II in 2008 2009.
5.7 Political and economic uncertaintiesMost countries in the MENA region are yet to embrace democracy. Theoretically, only 7 countries are republics (including Iran, which is a theocraticrepublic). This influences the region’s political conditions, resulting in numerous political tensions. Within the last two decades, the region haswitnessed several major military conflicts, including two Lebanon wars, the Gulf War (Kuwait’s invasion by Iraq), and the Iraq war. Episodes ofinstability pose a serious challenge to the banking sector in the region as these have an adverse impact on capital flows.
MENA economies are strongly dependent on oil in one way or the other, implying strong correlation to the volatility of global oil prices. This waswitnessed in the 1980s, when global oil price decline had triggered a slowdown in most MENA countries leading to widespread unemployment. In abid to tackle this, the governments are trying to diversify into other areas and bring in more private participation with liberalized policies. Recently,inflation has been a concern as well.
5.8 Islamic BankingOver the past few years, Islamic banking has been the fastest growing baking sector globally, witnessing particular strength in the MENA region,where Muslim community forms the majority of population. With rising awareness and banking accessibility, a growing number of Arab customers

50
Commercial Banking in the MENA Region
are demanding Shariah compliant services. The demand is further augmented by the fast growth of the region’s population. As penetration of Islamicbanking is low, it is estimated to grow between 10% and 15% over the next couple of years. According to analysts, increasing competition fromIslamic banks will prompt regional commercial banks to venture in to Islamic banking as well.
Lack of a common view on Shariah principles between countries, and sometimes even within a country, creates regulatory issues. Internationalstandards need to be developed since risk measurement and asset quality assessment are also insufficient. These challenges make it difficult forbanks aiming to operate internationally, as they need to adjust their processes and offerings to particular market requirements. Another challenge,common for all industry players, is the inability to design innovative products to meet varied customer needs primarily due to a lack of Shariahexperts. Currently, three types of entities offer Islamic finance services pure Islamic banks fully compliant with Shariah, Islamic divisions ofcommercial banks, and so called Islamic windows run by commercial banks. While some customers are satisfied with Islamic products, regardless ofwhere they are bought, stricter Muslims prefer to choose a bank which they believe, is purely Islamic. This gives local banks an advantage over foreignbanks that enter the Islamic finance market.
5.9 Banking infrastructure and Risk ManagementMENA countries still lag behind western standards in terms of banking regulation and risk management. With the exceptions of Bahrain and theUnited Arab Emirates, which are the regional financial centers with relatively developed banking sectors, most still need to introduce significantreforms.
BahrainIn June 2006, the Central Bank of Bahrain (CBB) replaced the Bahrain Monetary Agency (BMA) to monitor and enhance banking regulations. In orderto create a transparent and modern sector licensing scheme, BMA announced details of a regulatory reform package in 2006. A report by IMF onBahrain’s financial system stated that the country’s banking supervision is primarily risk based, and therefore considered efficient, especially in thedomestic banking sector. However, the need to modernize the banks’ liquidity regulations was stressed, as they did not take into account all assetsand liabilities. Overall, the financial sector was recognized as sound, and considered sophisticated in comparison with the other countries in theregion.
KuwaitThe authorities have made some progress in bringing banking regulation closer to international standards. The Central Bank of Kuwait enforcesprudential safety and soundness requirements. However, issues such as information sharing, international cooperation, and operations of foreignbanks, still persist. Also, there are concerns about the central bank’s independence, as the Ministry of Finance and Economics is involved in some ofthe bank’s decisions.
Saudi ArabiaSaudi Arabian bank portfolios are characterized by a high ratio of low cost demand deposits, low domestic risk diversification (due to the oil basedeconomy). This leads to high levels of capital and provisioning and various lending limits imposed by Saudi Arabia Monetary Agency (SAMA). Bankingregulation and supervision, according to IMF, do have the essential elements necessary for effectiveness. However, certain regulations are stillmissing, especially in credit risk management.
United Arab EmiratesAccording to the IMF, the UAE banking system is well developed. In 2007, banks were relatively highly exposed to the real estate sector, despite limitsimposed on such exposure (which are however inadequate to the evolving markets). The need for a better information sharing and cooperationbetween regulatory authorities, such as the Central Bank of the UAE, Emirates Securities and Commodities Authority, and Dubai Financial ServicesAuthority, has been identified as the main challenge.

51
Commercial Banking in the MENA Region
6 Future OutlookThe global credit crunch has had a mixed impact on regional financial markets. Most equity markets are down from their record levels of late 2007and early 2008. Sovereign spreads have widened across Middle East, but domestic bond markets have stayed generally steady in most countries. Thebanking sector in the region is by and large sound with continued improvements in prudential indicators and strengthened banking supervision,although a few countries face liquidity pressures.
In spite of the positive macro view, inflation is critical to the Middle East economies with the banking sector being no exception. Consistent highinflation can further increase the cost of living and doing business in the Gulf economies, which can potentially render them relatively unattractive asinvestment destinations. High inflation can also accelerate natural credit cycle downturn, which is typically characterized by higher default rates.
BahrainThe banking sector outlook remains positive, with pre impairment profitability expected to be maintained in 2008, a steep oil price decline being amajor threat though. Regional political instability can potentially impede growth. However, in the past, local banks have benefitted as foreigncompetitors reduced exposure in such situations. Rapid loan growth in recent times also raises concerns as impairment charges are expected to risein the medium term, particularly if current loan growth levels are sustained.
Most banks have also started to participate in syndication facilities and IPO financing, which has boosted non interest income and has furtheredbanking activity. Core banking operations are likely to remain the key focus area in the years to come. In an attempt to further increase non interestincome, banks are introducing new products such as online trading. Besides, significant growth is also expected for the corporate finance advisorybusiness in 2008 resulting from the strong deal pipeline taken into 2008, and through increased emphasis on leveraging extensive regional network ofcorporate clients.
EgyptThe banking sector in Egypt has registered healthy performance in line with strong aggregate economic environment. A positive GDP growthenvironment will attract investors to explore prospects representing potential lending opportunities for banks. Expansion in several business sectorslike tourism, real estate, telecommunication and financial services, will add to financing needs, thus providing growth opportunities to banks,especially with the current extremely low loans/deposits ratio.
With a young population, the demand for retail services is also likely to increase. This demand is anticipated to be subsequently absorbed by thesector in the form of retail lending and mortgage financing. In a bid to make financing facilities more accessible for the private sector, the cabinet isimplementing consolidation in the banking sector, and has begun to overhaul commercial legislations. Reform is expected to continue along similarlines, although at a measured pace, as the government is aware of the risk of social dislocation by rapid liberalization. Strikes and protests againstprivatization and rising prices may force the government to proceed with controlled divestments, especially in the labor intensive manufacturingsector.
JordanThe banking sector continued to register double digit growth rates in practically all major aggregates, with the asset size growing at 10% year overyear. The outlook for Jordanian banks appears promising. The macro level reform programs and increased activity in sectors such as real estate,construction and tourism will amplify lending opportunities. However, due to their concentrated nature, the smaller banks will find it hard tocompete with expanding giants, which could result in new alliances.
The government’s initiatives to switch to domestic credit instead of external credit will also support industry growth. Increased competition with thepresence of foreign players will coerce local banks to provide enhanced services. Banking fundamentals remain strong, with banks being wellcapitalized, having low non performing loan ratios, and strict loan classification and provisioning rules ensuring adequate loan loss provisions.
KuwaitDespite healthy financial fundamentals, the exposure to a globally weak real estate sector is likely to raise earnings’ quality concerns. Healthy netinterest margins and high cost efficiency will be the key to enhanced profitability. With oil related activities accounting for almost 50% of the GDP, theeconomy remains relatively undiversified. The modest size of non oil and private sectors implies that superior lending opportunities are scarce, andmainly concentrated in commercial real estate and construction sectors. However, the recent spike in real estate prices has fuelled apprehensions ofa possible asset bubble.
Most Kuwaiti banks still have modest risk profiles, as open positions in different currencies or direct exposures to market risk are limited due toregulatory reasons. Nonetheless, recent announcements of sizeable losses by the Gulf Bank have rendered its control and risk management practicesvulnerable, particularly the banks' capacity to identify and manage risks.
52
Commercial Banking in the MENA Region
LebanonLebanon appears to be insulated from the global financial turmoil, thus far. This is partly on account of the central bank’s prudential strategy ofminimum exposure to high risk financial products and constraining private banks from buying in the US subprime market. Lebanese banks are wellplaced to benefit from large cross border expansions, bridging the existing gaps with those neighboring markets that are embarking upon seriousfinancial and banking reforms. Banks have succeeded in upgrading and expanding infrastructure, diversifying products & services and reinforcingfinancial flexibility. This has enabled them to bolster activity and establish the basis for a strong fee earning franchise, thus reducing their vulnerabilityto adverse interest rate trend.
The increase in non interest income to more than 33% of net financial income in 2007 from below 20% in the mid 1990s is fostered by the banks’business line diversification over the past few years. The IMF financial development index, which gave Lebanon’s banking sector development aleading score in the Middle East and North African region, is a further proof of successful diversification. After successful diversification of servicesand market activities, Lebanese markets are now eying opportunities in other lucrative regional markets to expand geographically. Such expansionwill support the local banking industry, providing insulation from domestic economic and market conditions, and will reinforce Lebanon’s competitiveedge in a rapidly evolving Middle East environment.
OmanOmani banks continue to enjoy well established domestic franchises, strong earning generating capability despite pressured interest rate margins andadequate capital levels, according to Moody's Investors Service. The stable outlook on the bank financial strength ratings (BFSRs) of these institutionscaptures not only their excellent franchise development over the recent years, but also the challenging and increasingly competitive operatingenvironment in Oman. It also recognizes that the improved financial performance of recent years has been partly driven by the positive economiccycle.
Oman heavily relies on hydrocarbon exports, adding to its cyclical operational environment, which in turn affects the banks’ performance.Meanwhile, the government's ongoing strategy to diversify has created growth opportunities for the banking sector in the country. Major Omanicommercial banks have achieved a balanced franchise development across segments, which have entailed both strong growth in personal lending andcontinued growth in corporate and commercial banking. Moreover, banks continue to generate strong earnings, aided by their low cost structuresand healthy, albeit declining, interest margins on their growing business volumes. However, intensifying competition is further pushing banks tostrengthen their non interest income in order to offset margin pressure and sustain current profitability.
QatarThe outlook for the Qatari economy is bright even though the country's performance and revenues continue to depend heavily on the oil and gassector. Over the past few years, Qatar has witnessed strong economic growth. Buoyed by this, non oil sectors are flourishing, and banking sectorwould be one of the major beneficiaries. Over the last few years, banks in Qatar have extensively focused on improving their asset quality, which hassubstantially improved their loan portfolio. Simultaneously, loan portfolio of certain banks requires diversification as it is concentrated, primarily intwo sectors Personal and Real Estate. In certain cases these two sectors account for more than 50% of total loan book.
Multi billion dollar projects are in the pipeline or in various stages of development across various sectors. Qatar has launched an impressive domesticinvestment program with the aim of diversifying its hydrocarbon based economy, for which it is likely to spend about USD 203 bn on various projectsover the next 5 to 6 years. The banking sector would be one of the major beneficiaries. Besides, banks have already started to expand geographicallyin order to counter the increasing local competition. In fact, all major banking players have announced expansion plans in the neighboring GCCcountries. Qatari banks are also focusing on expanding their capital base by announcing rights issues in 2008 and 2009. This will help them shore upCAR and to leverage their balance sheets to tap profitable lending opportunities in the coming years.
Saudi ArabiaOver the last one year or so, projects amounting to USD 598bn have been announced. These include expansions and establishment of new companiesin various sectors like fertilizers, petrochemicals, aluminum, electricity generation, as well as establishment of new economic cities. Planned privatesector investment in major projects should generate robust volumes in private sector corporate lending, which is likely to offset a slow consumerlending growth and margin pressures. Corporate credit is likely to be the key driver for banks in mid term, with much of it being utilized byinfrastructure spending and industrial expansion. Asset quality will remain critical to the sector, especially with rising consumer NPLs. Surging creditcard usage and real estate lending is a potential risk.
UAEDuring 2008, the profitability and growth in the banking industry is likely to witness similar growth levels as in 2007, given the benign operatingenvironment. In recent years, profitability is more sustainable as it is more dependent on recurring business.
Net interest income is likely to continue to grow, fuelled by an increase in lending in both corporate and retail sectors. Corporate lending is driven byhigh oil and gas receipts, which are in turn augmenting infrastructure spending. The larger UAE banks, which can effectively compete for the largedeals, will continue to benefit from this and will also expand their project finance teams accordingly. Many UAE banks benefit from substantial

53
Commercial Banking in the MENA Region
government ownership, which aids access to these deals. However, competition for such large deals is strong and likely to put pressure on margin.Growth in the retail sector will be supported by the increasing mortgages and credit card lending.
Fee and commission income is also expected to grow due to a rise in core business volumes. Several IPOs are also expected during 2008, which willboost brokerage revenue. Fees from investment banking activities and services provided to corporate customers will also increase as the local capitalmarket grows. Sharp decline in oil prices, severe correction in the property market and high inflation are the major risks faced by the banking sector.

54
Commercial Banking in the MENA Region
7 Appendix
7.1 Appendix 1 Major Banking players in the region
7.1.1 Bank Muscat
Established in 1982, Bank Muscat is the largest financial services provider inOman, with assets worth over OMR 4.20 billion as of December 2007.Operates through a network of 116 branches and 300 ATMs, along with 76 cashdeposit machines (CDMs) in Oman, a branch in Riyadh, Saudi Arabia, and arepresentative office in Dubai (UAE).Holds the rare distinction of being voted the ‘Best Bank in Oman’ five times in arow by The Banker, FT London; six times continuously by Euromoney; andseven times by Global Finance Inc.Currently active in retail and private banking, corporate banking, investmentbanking and asset management, and holds a dominant leadership position inthe Omani mutual fund industry, with an 87.0% share of Assets underManagement (AUMs).
Key Ratios FY05 FY06 FY07Revenues Growth (%) 9.27 36.42 40.19
Earnings Growth (%) 33.25 32.98 39.42
Net Interest Margin (%) 4.12 3.69 3.65
Return on Assets (%) 2.36 2.44 2.35
Return on Equity (%) 18.92 19.94 17.78
Loans to Deposits 1.11 1.06 1.20
Net Spread (%) 3.72 3.73 3.34
Peer Group Analysis Bank Muscat National Bank of Oman Bank DhofarPrice/Earning 13.49 11.05 12.37
Price/Book 1.81 2.12 2.55
Assets turnover ratio 0.04 0.07 0.05
NPL's as a % of Gross Loans 3.90 7.73 4.88
Market Capitalization(OMR in million)
1,064.21 482.13 265.41
Sources: Company’s website, Zawya.com, Bloomberg
BKMB at a GlanceNo of Employees 2300
Corporate Headquarters Ruwi, Sultanate Of Oman
Revenue 266379
Network116 branches and about300 ATMs
Ownership Public
Date founded 1982
Bloomberg Code BKMB:OM
Reuters Code BMAO.OM
Zawya Code BKMB:MSM
Senior Management
ChairmanSheikh Abdulmalek Abdullah AlKhalili
ViceChairman
Sheikh Khaled Bin Mustahail AlMashani
CEO Abdulrazak Ali Issa
Major Shareholders Holding (%)Royal Court Affairs 24.84%
Dubai Financial Group 15.00%
Muscat Overseas Group 5.97%
Public 54.19%
I n te re s t Vs Non I n te re s tRe ve nue
82%
18%
Gross Interest Income Non Interest Income
Key FinancialsOMR '000 FY05 FY06 FY07
Total Revenue 139,288 190014 266379Operating Profit 50282 65,812 92208Net Profit 45444 60,432 84257Earnings PerShare (units)
0.64 0.07 0.09
Total Assets 1,993,817 2,954,858 4,217,725Total Liabilities 1,668,089 2,634,773 3,590,155Shareholders'Equity
286,107 320,085 627,570
Company Overview
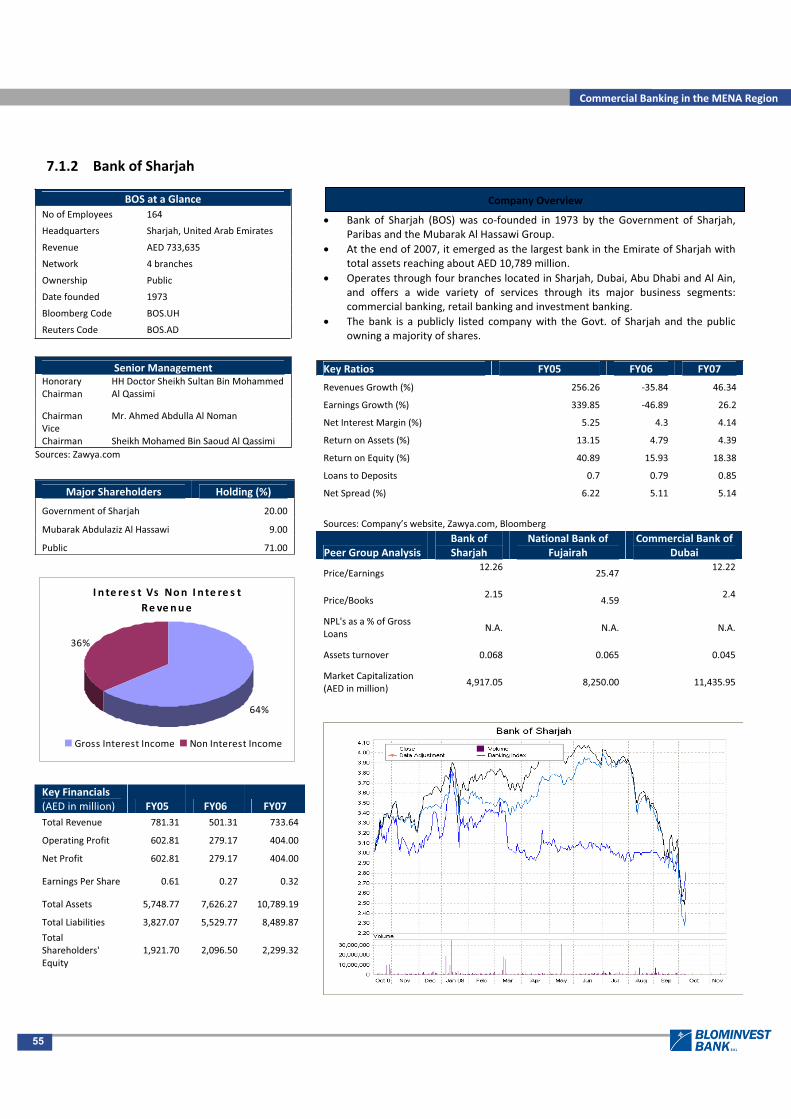
55
Commercial Banking in the MENA Region
7.1.2 Bank of Sharjah
Wed Sep 20 2006 Daily GCC* Market Review
Bank of Sharjah (BOS) was co founded in 1973 by the Government of Sharjah,Paribas and the Mubarak Al Hassawi Group.At the end of 2007, it emerged as the largest bank in the Emirate of Sharjah withtotal assets reaching about AED 10,789 million.Operates through four branches located in Sharjah, Dubai, Abu Dhabi and Al Ain,and offers a wide variety of services through its major business segments:commercial banking, retail banking and investment banking.The bank is a publicly listed company with the Govt. of Sharjah and the publicowning a majority of shares.
Key Ratios FY05 FY06 FY07
Revenues Growth (%) 256.26 35.84 46.34
Earnings Growth (%) 339.85 46.89 26.2
Net Interest Margin (%) 5.25 4.3 4.14
Return on Assets (%) 13.15 4.79 4.39
Return on Equity (%) 40.89 15.93 18.38
Loans to Deposits 0.7 0.79 0.85
Net Spread (%) 6.22 5.11 5.14
Sources: Company’s website, Zawya.com, Bloomberg
Peer Group AnalysisBank ofSharjah
National Bank ofFujairah
Commercial Bank ofDubai
Price/Earnings12.26
25.4712.22
Price/Books2.15
4.592.4
NPL's as a % of GrossLoans
N.A. N.A. N.A.
Assets turnover 0.068 0.065 0.045
Market Capitalization(AED in million)
4,917.05 8,250.00 11,435.95
BOS at a GlanceNo of Employees 164
Headquarters Sharjah, United Arab Emirates
Revenue AED 733,635
Network 4 branches
Ownership Public
Date founded 1973
Bloomberg Code BOS.UH
Reuters Code BOS.AD
Senior ManagementHonoraryChairman
HH Doctor Sheikh Sultan Bin MohammedAl Qassimi
Chairman Mr. Ahmed Abdulla Al NomanViceChairman Sheikh Mohamed Bin Saoud Al Qassimi
Sources: Zawya.com
Major Shareholders Holding (%)
Government of Sharjah 20.00
Mubarak Abdulaziz Al Hassawi 9.00
Public 71.00
I n te re s t Vs Non I n te re s tRe ve nue
64%
36%
Gross Interest Income Non Interest Income
Key Financials(AED in million) FY05 FY06 FY07Total Revenue 781.31 501.31 733.64
Operating Profit 602.81 279.17 404.00
Net Profit 602.81 279.17 404.00
Earnings Per Share 0.61 0.27 0.32
Total Assets 5,748.77 7,626.27 10,789.19
Total Liabilities 3,827.07 5,529.77 8,489.87
TotalShareholders'Equity
1,921.70 2,096.50 2,299.32
Company Overview

56
Commercial Banking in the MENA Region
7.1.3 Banque Saudi Fransi
BSF at a Glance
No of Employees 2,266 Headquarters Riyadh, Saudi Arabia Revenue SAR 6,345.86 million Network 74 branches and 321 ATMs Ownership Public Date founded 1977 Bloomberg Code BSFR.AB Reuters Code N/A
Senior ManagementChairman Ibrahim Abdulaziz Al Touq
Managing Director Jean Marion
Chief Financial Officer Phillip Touchard
Sources: Zawya.com
Major Shareholders Holdings (%)
Groupe Crédit Agricole 31.11General Organization for Social Insurance 12.84Rashed Abdul Rahman Al Rashed 9.83Mohammed Ibrahim Al Issa 5.34Public 40.88
Sources: Zawya.com
I n te re s t Vs Non I n te re s t Re ve nue
78%
22%
Gross Interest Income Non Interest Income
Key Financials(SAR in million) FY05 FY06 FY07Total Revenue 4,399.51 6,179.10 6,345.86
Operating Profit 2,222.46 3,011.92 2,716.12
Net Profit 2,215.60 3,006.95 2,711.11
Earnings Per Share 49.24 8.91 4.82
Total Assets 67,501.38 79,581.01 99,808.11
Total Liabilities 60,316.48 70,176.23 88,567.48
TotalShareholders'Equity
7,184.90 9,404.78 11,240.64
Sources: Zawya.com
Banque Saudi Fransi (BSF) is a Saudi based financial institution that wasestablished in 1977 by way of a royal decree.Provides full service commercial and retail banking services through anationwide network of 74 branches, 321 ATMs and 3,827 point of sale(POS) machines.The bank’s activities comprise three business segments: Personal Bankingservices, which include Islamic banking, financing, investment andfinancial planning; Investment services, including local and internationalbrokerage; and Corporate Banking services, which consist of trade,contract and structured finance, Islamic finance and treasury.The bank’s shares are traded on the Tadawul Stock Exchange.
Key Ratios FY05 FY06 FY07
Earnings Growth (%) 44.25 35.72 (9.84)
Revenues Growth (%) 58.12 40.45 2.7
Net Spread (%) 4.28 4.01 4.6
Net Interest Margin (%) 3.56 3.39 3.43
Return on Assets (%) 3.48 4.09 3.02
Return on Equity (%) 33.42 36.25 26.26
Gross Loans / Customer Deposits 0.86 0.84 0.82
Peer Group AnalysisBank Saudi
FransiRiyadBank
Arab NationalBank
Price/Earnings 11.83 14.05 11.83
Price/Book 2.85 3.21 2.77
NPL's as a % of Gross Loans 0.73% 1.61% 0.51%
Assets turnover 0.064 0.067 0.069
Market Capitalization(SAR in million)
30,796.88 39,000.00 25,245.22
Sources: Company’s website, Zawya.com, Bloomberg
Company Overview

57
Commercial Banking in the MENA Region
7.1.4 National Bank of Bahrain
NBB at a Glance
No of Employees 591
Headquarters Manama, Bahrain
Revenue BHD 122.10 Million
Network 25 branches and 42 ATMs
Ownership Public
Year founded 1957
Bloomberg Code NBB BI
Reuters Code NATB.BH
Senior Management
Chairman Abdulla Ali Kanoo
Chief Executive Officer Abdul Razak A. Hassan Al Qassim
Deputy General Manager Abdul Rahman A. Mohamed
Sources: Company’s website
Major Shareholders Holdings (%)
Government of Bahrain 49.00General Organization for Social InsuranceBahrain
5.00
Public 46.00Sources: Zawya.com
I n te re s t Vs Non I n te re s t Re ve nue
81%
19%
Gross Interest Income Non Interest Income
Key Financials(BHD in million) FY05 FY06 FY07Revenue 74.85 102.34 122.10
Operating Profit 30.55 36.86 41.56
Net Profit After Taxes 30.55 36.86 41.56
Earnings Per Share 0.057 0.068 0.064
Total Assets 1,498.10 1,676.38 1,903.71
Total Liabilities 1,279.97 1,454.24 1,660.08
Total Shareholders'Equity
218.13 222.14 243.63
Sources: Zawya.com
The National Bank of Bahrain (NBB) is a Bahrain based financialinstitution established in 1957.NBB provides commercial and retail banking services through anationwide network of 25 branches and 42 automatic tellermachines (ATMs).The bank is provides retail and wholesale commercial bankingservices, treasury and capital market activities, and investmentadvisory services.It serves retail and corporate customers, financial institutions, andgovernment organizations in Bahrain and the Gulf region with anemployee base of 591, of which over 94% are Bahraini nationals.NBB’s shares are traded on the Bahrain Stock Exchange.
Key Ratios FY05 FY06 FY07
Earnings Growth (%) 8.09 20.66 12.76
Revenues Growth (%) 33.35 36.73 19.31
Net Spread (%) 3.41 4.1 3.28
Net Interest Margin (%) 2.96 3.19 2.85
Return on Assets (%) 2.14 2.32 2.32
Return on Equity (%) 14.83 16.74 17.85
Gross Loans / Customer Deposits 0.7 0.67 0.73Sources: Zawya.com
Peer Group AnalysisNational Bankof Bahrain
Ahli UnitedBank
BahrainiSaudi Bank
Price/Earning 14.78 17.27 16.29
Price/Book 2.52 2.22 1.16
Assets Turnover 0.06 0.07 0.07
NPL's as a % of Grossloans
0.9 1.2 1.6
Market Capitalization(in million)
BHD 575.42USD
4,642.93BHD 66.00
Sources: Company’s website, Zawya.com, Bloomberg
Company Overview

58
Commercial Banking in the MENA Region
7.1.5 Ahli United Bank
AUB at a Glance
No of Employees Over 3000 (Group)
Headquarters Manama, Bahrain
Revenue BHD 620.13 Million
Network 93 branches
Ownership Public
Year founded 2000
Bloomberg Code AUB BI
Reuters Code AUBB.BH
Sources: Company’s website, Zawya.com
Senior Management
Chairman Fahad Al Rajaan
Deputy Chairman Hamad A. Al Marzouq
Chief Executive Officer Adel A. El Labban
Sources: Company’s website
Major Shareholders Holdings (%)
Public Institution for Social Security 19.48 The Pension Fund Commission 10.48 Tamdeen Investment Company 9.97 Public 50.39
Sources: Zawya.com
I n te re s t Vs Non I n te re s t Re ve nue
79%
21%
Gross Interest Income Non Interest Income
Key Financials(BHD in million) FY05 FY06 FY07
Revenue 250.36 445.21 620.13
Operating Profit 79.09 98.42 139.94
Net Profit After Taxes 62.15 78.22 111.42
Earnings Per Share 0.022 0.026 0.034
Total Assets 5,229.83 7,841.19 8,666.74
Total Liabilities 4,452.38 7,152.53 7,671.05Total Shareholders'Equity 515.59 581.76 868.46
Sources: Zawya.com
In April 2000, United Bank of Kuwait and Bahrain based AhliCommercial Bank established Ahli United Bank (AUB) and became itswholly owned subsidiaries.The group has operations in Bahrain, the United Kingdom, Kuwait,Qatar, Oman, Egypt and Iraq.It functions in three main business segments, namely retail banking,private banking & wealth management, and corporate banking &treasury.The AUB Group, including its subsidiaries and associates, conducts itsactivities through a network of 93 branch offices and employs over3,000 people.The bank’s ordinary shares are traded on the Bahrain Stock Exchangeand the Kuwait Stock Exchange.
Key Ratios FY05 FY06 FY07
Earnings Growth (%) 54.74 25.85 42.82 Revenues Growth (%) 78.42 77.83 39.66 Net Spread (%) 2.59 2.59 2.84 Net Interest Margin (%) 1.66 1.74 1.9 Operating Margin (%) 31.59 22.11 22.57 Return on Assets (%) 1.5 1.2 1.35 Return on Equity (%) 13.93 14.26 15.38 Gross Loans / Customer Deposits 0.91 0.95 1.12 Sources: Zawya.com
Peer Group AnalysisAhli United
BankNational Bank of
BahrainBahraini
Saudi BankPrice/Earning 17.27 14.78 16.29
Price/Book 2.22 2.52 1.16
Assets Turnover 0.07 0.06 0.07
NPL's as a % of Grossloans
1.2 0.9 1.6
Market Capitalization(in million)
US$ 4,642.93 BHD 575.42 BHD 66.00
Sources: Company’s website, Zawya.com, Bloomberg
Company Overview

59
Commercial Banking in the MENA Region
7.1.6 Commercial International Bank (Egypt)
CIB at a Glance
No of Employees 2,750
Headquarters Cairo, Egypt
Revenue EGP 4134.61 Million
Network 101 branches and 443 ATMs
Ownership Public
Date founded 1975
Bloomberg Code COMI EY
Reuters Code COMI.CA
Senior ManagementChairman &MD Hisham Ezz Al Arab
Vice Chairman & MD Sahar Al Sallab
CEO of Institutional Banking Essam El Wakil
CEO of Consumer Banking Humayun Rashid
Sources: Company’s website
Major Shareholders Holdings (%)
Bank of New York [through GDR] 24.00American Consortium[led by Ripplewood Holdings] 18.70
Dubai Capital Group 5.24
Public 52.06Sources: Zawya.com
I n te re s t Vs Non I n te re s t Re ve nue
73%
27%
Gross Interest Income Non Interest Income
Key Financials(EGP in million) FY05 FY06 FY07
Revenue 2582.26 3187.90 4134.61
Operating Profit 610.65 935.14 1310.25Net Profit AfterTaxes 610.14 851.58 1137.38
Earnings Per Share 2.77 3.86 5.84
Total Assets 30,389.54 37,552.96 47,763.25
Total Liabilities 27,862.28 34,170.48 43,405.19TotalShareholders'Equity 2,527.26 3,376.65 4,352.79
Commercial International Bank (CIB) is an Egyptian financial institutionestablished in 1975 as a joint venture between the National Bank ofEgypt and the Chase Manhattan Bank, under its formal name “ChaseNational Bank of Egypt”.The bank’s market capitalization of EGP 11 billion is the largest in thedomestic banking sector.CIB offers a wide range of banking services to institutional clients, small& medium enterprises and retail consumers, through a network of 101branches and 443 automatic teller machines.CIB also provides brokerage services including equities trading, globaldepository receipt trading, fixed income securities trading, daily marketcommentary, technical analysis and other related services.The bank’s shares trade on the Cairo, Abu Dhabi and the Kuwait stockexchanges.
Key Ratios FY05 FY06 FY07
Earnings Growth (%) 20.64 39.57 50.99
Revenues Growth (%) 18.4 23.45 29.7
Net Spread (%) 6.51 5.34 6.34
Net Interest Margin (%) 3.87 3.22 3.79
Return on Assets (%) 2.09 2.51 3.01
Return on Equity (%) 24.72 28.85 33.27
Gross Loans / Customer Deposits 0.61 0.59 0.55
Peer Group Analysis
CommercialInternational
Bank
Societe ArabeInternationale De
Banque
CréditAgricoleEgypt
Price/Earning 5.43 3.54 6.99
Price/Book 1.60 0.39 1.92
Assets Turnover 0.09 0.08 0.08NPL's as a % of Grossloans 3.0 N.A. 9.0Market Capitalization(EGP in million) 9,523.80 359.88 3,202.92Sources: Company’s website, Zawya.com, Bloomberg
Comparative PerformanceOct 07 Sep 08
70
80
90
100
110
120
130
Oct
-07
Nov
-07
Dec
-07
Jan-
08
Feb-
08
Mar
-08
Apr-
08
May
-08
Jun-
08
Jul-0
8
Aug-
08
Sep-
08
Inde
x
CIB Cairo SE
Company Overview
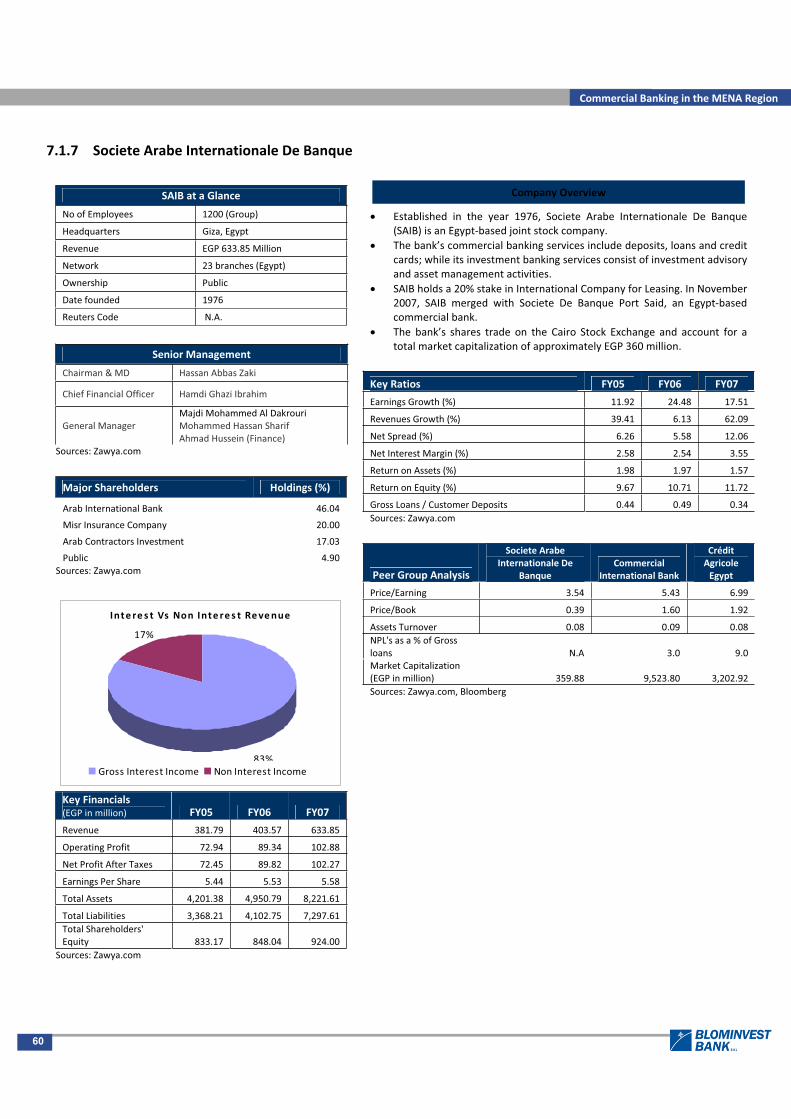
60
Commercial Banking in the MENA Region
7.1.7 Societe Arabe Internationale De Banque
SAIB at a Glance
No of Employees 1200 (Group)
Headquarters Giza, Egypt
Revenue EGP 633.85 Million
Network 23 branches (Egypt)
Ownership Public
Date founded 1976
Reuters Code N.A.
Senior Management
Chairman &MD Hassan Abbas Zaki
Chief Financial Officer Hamdi Ghazi Ibrahim
General ManagerMajdi Mohammed Al DakrouriMohammed Hassan SharifAhmad Hussein (Finance)
Sources: Zawya.com
Major Shareholders Holdings (%)
Arab International Bank 46.04
Misr Insurance Company 20.00
Arab Contractors Investment 17.03
Public 4.90Sources: Zawya.com
Inte re s t Vs Non Inte re s t Revenue
83%
17%
Gross Interest Income Non Interest Income
Key Financials(EGP in million) FY05 FY06 FY07
Revenue 381.79 403.57 633.85
Operating Profit 72.94 89.34 102.88
Net Profit After Taxes 72.45 89.82 102.27
Earnings Per Share 5.44 5.53 5.58
Total Assets 4,201.38 4,950.79 8,221.61
Total Liabilities 3,368.21 4,102.75 7,297.61Total Shareholders'Equity 833.17 848.04 924.00
Sources: Zawya.com
Established in the year 1976, Societe Arabe Internationale De Banque(SAIB) is an Egypt based joint stock company.The bank’s commercial banking services include deposits, loans and creditcards; while its investment banking services consist of investment advisoryand asset management activities.SAIB holds a 20% stake in International Company for Leasing. In November2007, SAIB merged with Societe De Banque Port Said, an Egypt basedcommercial bank.The bank’s shares trade on the Cairo Stock Exchange and account for atotal market capitalization of approximately EGP 360 million.
Key Ratios FY05 FY06 FY07
Earnings Growth (%) 11.92 24.48 17.51
Revenues Growth (%) 39.41 6.13 62.09
Net Spread (%) 6.26 5.58 12.06
Net Interest Margin (%) 2.58 2.54 3.55
Return on Assets (%) 1.98 1.97 1.57
Return on Equity (%) 9.67 10.71 11.72
Gross Loans / Customer Deposits 0.44 0.49 0.34Sources: Zawya.com
Peer Group Analysis
Societe ArabeInternationale De
BanqueCommercial
International Bank
CréditAgricoleEgypt
Price/Earning 3.54 5.43 6.99
Price/Book 0.39 1.60 1.92
Assets Turnover 0.08 0.09 0.08NPL's as a % of Grossloans N.A 3.0 9.0Market Capitalization(EGP in million) 359.88 9,523.80 3,202.92Sources: Zawya.com, Bloomberg
Company Overview

61
Commercial Banking in the MENA Region
7.1.8 Arab Bank
Arab Bank at a Glance
No of Employees 6500 (Group)
Headquarters Amman, Jordan
Revenue JOD 1,401.07 Million
Network 500 branches in 30 countries
Ownership Public
Date founded 1930
Reuters Code ARBK.AM
Senior Management
Chairman & CEO Abdel Hamid Shoman
Deputy Chairman Sabih Taher Masri
Assistant CEO Michel Accad
Sources: Company’s website
Major Shareholders Holdings (%)
Social Security Investment Unit 14.87
Saudi Oger 8.99
Oger Middle East Holding 7.01
Public 63.49
I n te re s t Vs Non I n te re s t Re ve nue
84%
16%
Gross Interest Income Non Interest Income
Key Financials(JOD in million) FY05 FY06 FY07
Revenue 949.73 1126.51 1401.07OperatingProfit 390.04 479.63 572.46Net Profit AfterTaxes 200.09 263.28 334.66Earnings PerShare 1.14 0.74 0.94
Total Assets 16,815.80 18,440.14 21,220.03
Total Liabilities 14,956.17 15,346.19 17,672.04TotalShareholders'Equity 1,859.63 3,093.95 3,547.99
Sources: Zawya.com
The late Abdel Hameed Shoman founded Arab Bank in May 1930 with astartup capital of 15,000 Palestinian pounds.At present, the Arab Bank group has a branch network of around 500branches spanning 30 countries, across five continents. Recently, thebank opened a new branch in Qatar that offers Islamic banking services.Apart from providing personal and corporate banking services, the bankis also involved in investment banking, wealth management andtreasury activities.Arab Bank was the first public shareholding company listed on theAmman Stock Exchange in 1978 and represented 36% of the exchanges'total market capitalization at year end 2006.
Key Ratios FY05 FY06 FY07
Earnings Growth (%) 34.89 31.58 27.11
Revenues Growth (%) 27.62 18.61 24.37
Net Spread (%) 4.02 3.93 4.51
Net Interest Margin (%) 3.07 3.47 3.65
Return on Assets (%) 1.19 1.49 1.69
Return on Equity (%) 11.43 10.63 10.08
Gross Loans / Customer Deposits 0.61 0.74 0.81Sources: Zawya.com
Peer Group AnalysisArabBank
JordanKuwait Bank
The Housing Bank forTrade and Finance
Price/Earning 27.37 14.04 22.07
Price/Book 2.58 2.87 2.80
Assets Turnover 0.07 0.08 0.07NPL's as a % of Grossloans 3.0 0.3 N.A.Market Capitalization(JOD in million) 9,505.20 640.00 2,300.00Sources: Company’s website, Zawya.com, Bloomberg
Company Overview

62
Commercial Banking in the MENA Region
7.1.9 Jordan Kuwait Bank
JKB at a Glance
No of Employees 786 (Group)
Headquarters Amman, Jordan
Revenue JOD 164.39 Million
Network 52 branches and 57 ATMs
Ownership Public
Date founded 1976
Reuters Code JOKB.AM
Sources: Company’s website, Zawya.com
Senior ManagementChairman Abdel Karim Kabariti
Deputy Chairman Faisal H. Al Ayyar
General Manager Mohammed Yasser Al Asmar
Major ShareholdersHoldings
(%)
Burgan Bank 51.10
Social Security Investment Unit 21.11
Horizon Investment and Development Co. 2.67
Public 21.78Sources: Zawya.com
I n te re s t Vs Non I n te re s t Re ve nue
66%
34%
Gross Interest Income Gross Interest Expense
Key Financials(JOD in million) FY05 FY06 FY07
Revenue 83.03 125.14 164.39
Operating Profit 39.30 55.94 63.87
Net Profit After Taxes 25.51 39.14 44.38
Earnings Per Share 0.64 0.52 0.59
Total Assets 1,409.47 1,649.76 2,016.73
Total Liabilities 1,301.06 1,453.91 1,790.96Total Shareholders'Equity 102.88 187.67 216.95
Sources: Zawya.com
Jordan based financial institution, Jordan Kuwait Bank (JKB) was founded bya in the year 1976 by a group of Jordanian and Kuwaiti investors.JKB provides a range of financial and banking products and services toindividual and corporate customers through 49 domestic and threeinternational branches.The bank offers individual and corporate banking services, along withelectronic banking and Bancassurance. Under the Bancassurance segment, itprovides a package of insurance products jointly with its subsidiary ArabOrient Insurance Co.JKB holds 65.7% capital shares in Arab Orient Insurance Company and a50.0% stake in the United Financial Investments Company.Jordan Kuwait Bank’s shares trade on the Amman Stock Exchange under thesymbol JOKB.
Key Ratios FY05 FY06 FY07
Earnings Growth (%) 37.41 53.4 13.4
Revenues Growth (%) 43.78 50.71 31.36
Net Spread (%) 3.84 4.37 4.21
Net Interest Margin (%) 3.69 4.71 4.36
Return on Assets (%) 2.22 2.56 2.42
Return on Equity (%) 27.31 26.94 21.94
Gross Loans / Customer Deposits 0.89 1.1 1.04
Peer Group Analysis Jordan
Kuwait BankArab Bank
The Housing Bank for Trade and Finance
Price/Earning 14.04 27.37 22.07 Price/Book 2.87 2.58 2.80 Assets Turnover 0.08 0.07 0.07 NPL's as a % of Gross loans 0.3 3.0 N.A. Market Capitalization (JOD in million) 640.00 9,505.20 2,300.00 Sources: Company’s website, Zawya.com, Bloomberg
Company Overview
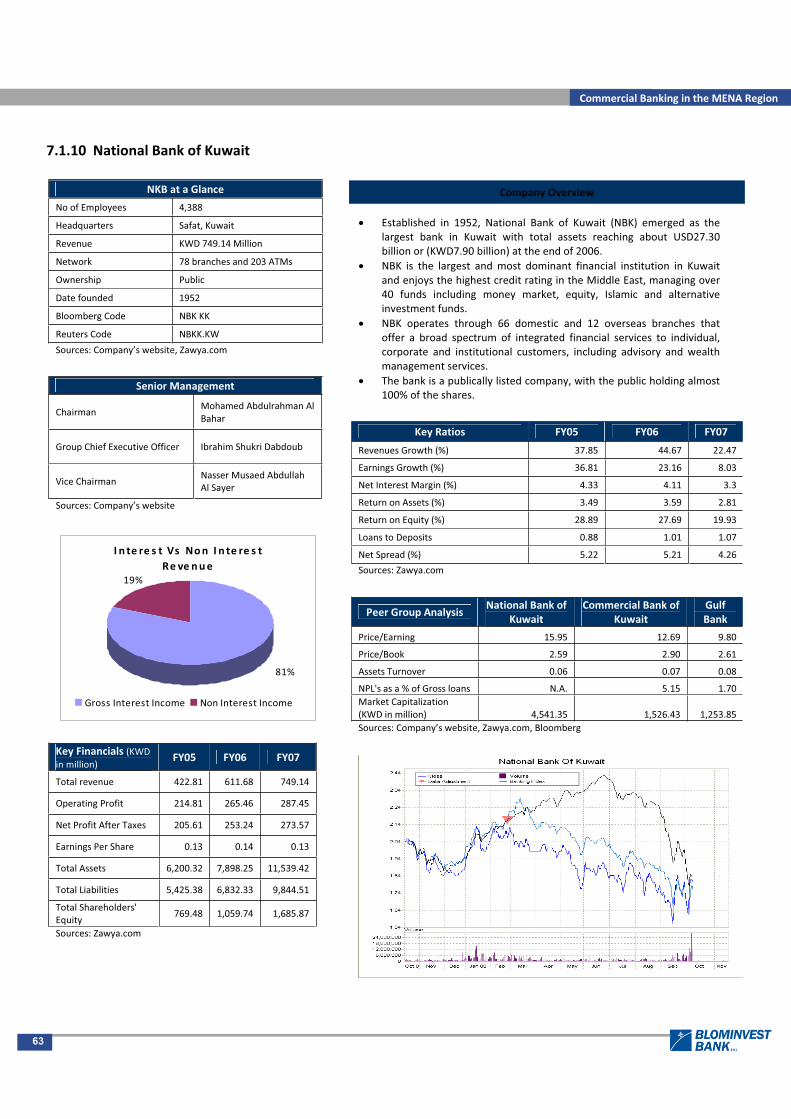
63
Commercial Banking in the MENA Region
7.1.10 National Bank of Kuwait
Wed Sep 20 2006 Daily GCC* Market Review
Established in 1952, National Bank of Kuwait (NBK) emerged as thelargest bank in Kuwait with total assets reaching about USD27.30billion or (KWD7.90 billion) at the end of 2006.NBK is the largest and most dominant financial institution in Kuwaitand enjoys the highest credit rating in the Middle East, managing over40 funds including money market, equity, Islamic and alternativeinvestment funds.NBK operates through 66 domestic and 12 overseas branches thatoffer a broad spectrum of integrated financial services to individual,corporate and institutional customers, including advisory and wealthmanagement services.The bank is a publically listed company, with the public holding almost100% of the shares.
Key Ratios FY05 FY06 FY07
Revenues Growth (%) 37.85 44.67 22.47
Earnings Growth (%) 36.81 23.16 8.03
Net Interest Margin (%) 4.33 4.11 3.3
Return on Assets (%) 3.49 3.59 2.81
Return on Equity (%) 28.89 27.69 19.93
Loans to Deposits 0.88 1.01 1.07
Net Spread (%) 5.22 5.21 4.26
Sources: Zawya.com
Peer Group AnalysisNational Bank of
KuwaitCommercial Bank of
KuwaitGulfBank
Price/Earning 15.95 12.69 9.80
Price/Book 2.59 2.90 2.61
Assets Turnover 0.06 0.07 0.08
NPL's as a % of Gross loans N.A. 5.15 1.70Market Capitalization(KWD in million) 4,541.35 1,526.43 1,253.85Sources: Company’s website, Zawya.com, Bloomberg
NKB at a Glance
No of Employees 4,388
Headquarters Safat, Kuwait
Revenue KWD 749.14 Million
Network 78 branches and 203 ATMs
Ownership Public
Date founded 1952
Bloomberg Code NBK KK
Reuters Code NBKK.KW
Sources: Company’s website, Zawya.com
Senior Management
ChairmanMohamed Abdulrahman AlBahar
Group Chief Executive Officer Ibrahim Shukri Dabdoub
Vice ChairmanNasser Musaed AbdullahAl Sayer
Sources: Company’s website
I n te re s t Vs Non I n te re s tRe ve nue
81%
19%
Gross Interest Income Non Interest Income
Key Financials (KWDin million)
FY05 FY06 FY07
Total revenue 422.81 611.68 749.14
Operating Profit 214.81 265.46 287.45
Net Profit After Taxes 205.61 253.24 273.57
Earnings Per Share 0.13 0.14 0.13
Total Assets 6,200.32 7,898.25 11,539.42
Total Liabilities 5,425.38 6,832.33 9,844.51
Total Shareholders'Equity
769.48 1,059.74 1,685.87
Sources: Zawya.com
Company Overview

64
Commercial Banking in the MENA Region
7.1.11 Commercial Bank of Kuwait
Established in 1960, the Commercial Bank of Kuwait (CBK) operatesthe second largest domestic branch network in Kuwait with assetsworth over KWD 4.25 billion as of December 2007.The Bank boasts of over 1,100 employees and operates through anetwork of 51 branches spread across Kuwait and Iraq. It offers awide variety of services through its major business segments:personal banking, corporate banking, and investment services.CBK’s rating is second highest in the country; rated by Moody’s, S&PFitch and Capital intelligence. It has made remarkable progress in thelocal banking industry through initiating sound corporate governanceand strategic planning.The bank is a publically listed company, with Al Sharq Holding and thepublic owning the majority of shares.
Key Ratios FY05 FY06 FY07Revenues Growth (%) 30.94 37.13 33.05
Earnings Growth (%) 30.28 23.22 20.35
Net Interest Margin (%) 3.81 3.75 2.35
Return on Assets (%) 3.89 3.80 3.34
Return on Equity (%) 24.63 23.24 23.80
Loans to Deposits 1.03 1.01 0.90
Net Spread (%) 5.05 4.07 2.55Sources: Zawya.com
Peer Group AnalysisCommercial Bank
of KuwaitNational Bankof Kuwait
GulfBank
Price/Earning 12.69 15.95 9.80
Price/Book 2.90 2.59 2.61
Assets Turnover 0.07 0.06 0.08NPL's as a % of Grossloans 5.15 N.A. 1.70Market Capitalization(KWD in million) 1,526.43 4,541.35 1,253.85Sources: Company’s website, Zawya.com, Bloomberg
CBK at a GlanceNo of Employees 1,111
Corporate Headquarters Safat, Kuwait
Revenue KWD 161.94 Million
Network 52 branches
Ownership Public
Date founded 1960
Bloomberg Code CBK KK
Reuters Code CBKK.KW
Senior ManagementChairman &MD
Mr.Abdulmajeed Haji Al Shatti
DeputyChairman
Mr.Abdul Razzak Khaled Al Wazzan
CEO Mr. Jamal Abdul Hameed Al Mutawa
Sources: Company’s website
Major Shareholders Holding (%)
Al Sharq Holding 23.11%
Public 76.89%
Sources: Zawya.com
I n te re s t Vs Non I n te re s tRe ve nue
75%
25%
Gross Interest Income Non Interest Income
Key Financials(KWD in million) FY05 FY06 FY07
Total Income 161.94 222.06 295.45
Operating Profit 84.08 103.51 124.62
Net Profit AfterTaxes
81.16 100.01 120.36
Earnings Per Share 0.08 0.09 0.10
Total Assets 2,342.74 2,917.23 4,289.29
Total Liabilities 1,966.65 2,432.64 3,762.28
Total Shareholders'Equity
376.09 484.59 527.02
Sources: Zawya.com
Company Overview
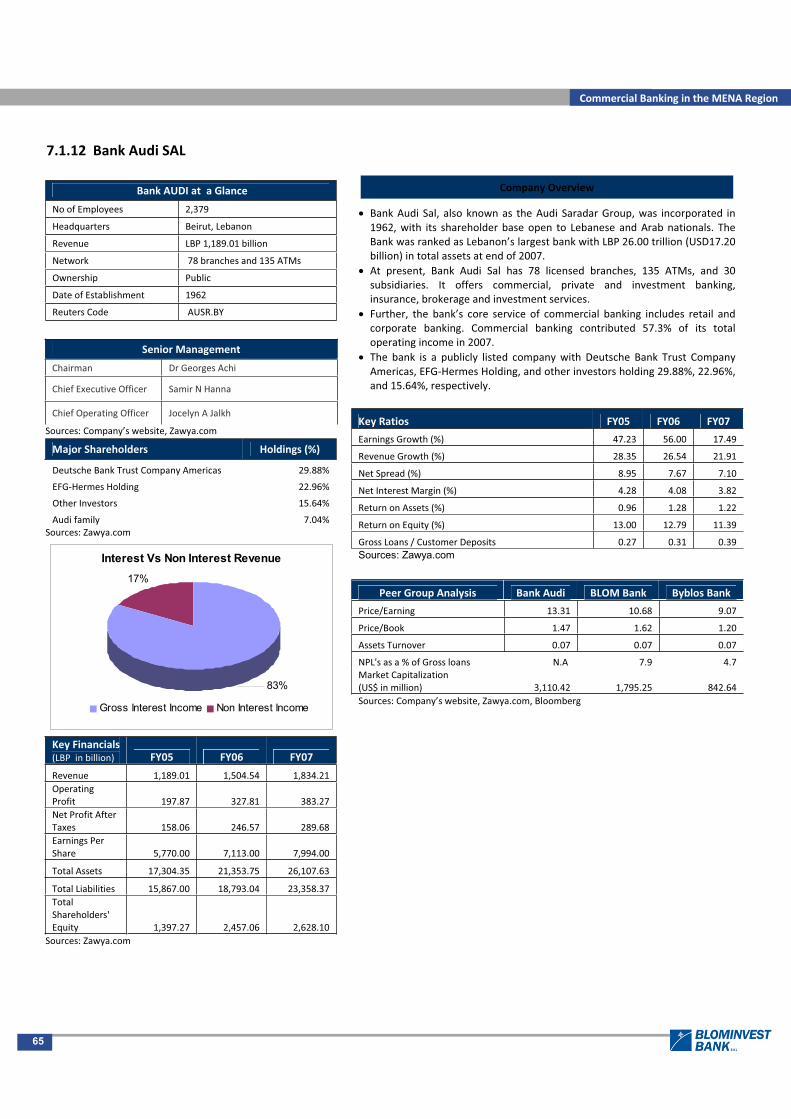
65
Commercial Banking in the MENA Region
7.1.12 Bank Audi SAL
Bank AUDI at a Glance
No of Employees 2,379
Headquarters Beirut, Lebanon
Revenue LBP 1,189.01 billion
Network 78 branches and 135 ATMs
Ownership Public
Date of Establishment 1962
Reuters Code AUSR.BY
Senior Management
Chairman Dr Georges Achi
Chief Executive Officer Samir N Hanna
Chief Operating Officer Jocelyn A Jalkh
Sources: Company’s website, Zawya.com
Major Shareholders Holdings (%)
Deutsche Bank Trust Company Americas 29.88%
EFG Hermes Holding 22.96%
Other Investors 15.64%
Audi family 7.04%Sources: Zawya.com
Interest Vs Non Interest Revenue
83%
17%
Gross Interest Income Non Interest Income
Key Financials(LBP in billion) FY05 FY06 FY07
Revenue 1,189.01 1,504.54 1,834.21OperatingProfit 197.87 327.81 383.27Net Profit AfterTaxes 158.06 246.57 289.68Earnings PerShare 5,770.00 7,113.00 7,994.00
Total Assets 17,304.35 21,353.75 26,107.63
Total Liabilities 15,867.00 18,793.04 23,358.37TotalShareholders'Equity 1,397.27 2,457.06 2,628.10
Sources: Zawya.com
Bank Audi Sal, also known as the Audi Saradar Group, was incorporated in1962, with its shareholder base open to Lebanese and Arab nationals. TheBank was ranked as Lebanon’s largest bank with LBP 26.00 trillion (USD17.20billion) in total assets at end of 2007.At present, Bank Audi Sal has 78 licensed branches, 135 ATMs, and 30subsidiaries. It offers commercial, private and investment banking,insurance, brokerage and investment services.Further, the bank’s core service of commercial banking includes retail andcorporate banking. Commercial banking contributed 57.3% of its totaloperating income in 2007.The bank is a publicly listed company with Deutsche Bank Trust CompanyAmericas, EFG Hermes Holding, and other investors holding 29.88%, 22.96%,and 15.64%, respectively.
Key Ratios FY05 FY06 FY07
Earnings Growth (%) 47.23 56.00 17.49
Revenue Growth (%) 28.35 26.54 21.91
Net Spread (%) 8.95 7.67 7.10
Net Interest Margin (%) 4.28 4.08 3.82
Return on Assets (%) 0.96 1.28 1.22
Return on Equity (%) 13.00 12.79 11.39
Gross Loans / Customer Deposits 0.27 0.31 0.39Sources: Zawya.com
Peer Group Analysis Bank Audi BLOM Bank Byblos Bank
Price/Earning 13.31 10.68 9.07
Price/Book 1.47 1.62 1.20
Assets Turnover 0.07 0.07 0.07
NPL's as a % of Gross loans N.A 7.9 4.7Market Capitalization(US$ in million) 3,110.42 1,795.25 842.64Sources: Company’s website, Zawya.com, Bloomberg
Company Overview

66
Commercial Banking in the MENA Region
7.1.13 BLOM Bank
BLOM Bank at a Glance
No of Employees 1,375
Headquarters Beirut, Lebanon
Revenue LBP 1,645.38 billion
Network 56 branches and 51 ATMs
Ownership Public
Date founded 1951
Reuters Code BLBD.BY
Senior ManagementChairman andGeneral Manager
Saad Azhari
General Manager Habib Rahhal
Sources: Zawya.com
Major Shareholders Holdings (%)
Bank of New York 34.37
Banorabe Holdings 11.40
AZA Holding 9.33
Chaker family 5.39
Other investors 22.53Sources: Zawya.com
I n te re s t Vs Non I n te re s t Re ve nue
9%
91%
Gross Interest Income Non Interest Income
Key Financials(LBP in billion)
FY05 FY06 FY07
Revenue 1,053.60 1,392.13 1,645.38
Operating Profit 242.23 324.11 368.22
Net Profit AfterTaxes
202.19 269.60 303.47
Earnings PerShare
9,187.00 11,431.00 12,808.00
Total Assets 17,966.73 21,424.61 25,067.01
Total Liabilities 16,522.85 19,508.07 22,974.61
TotalShareholders'Equity
1,383.72 1,837.37 2,004.34
Sources: Zawya.com
Established in 1951, BLOM Bank (BLOM) was ranked as the largest bank inLebanon with assets worth over LBP 25.00 trillion as of December 2007.BLOM enjoys a considerable reputation in Lebanon. It was conferred the raredistinction of the “Best Bank in Lebanon” by Global Finance; “Highest FinancialStrength Rating at BBB” from Capital Intelligence; “Highest National Rating atAa1.lb” from Moody’s; and “Best Deal of the Year” from the Banker.The Bank currently employs 1,375 employees and operates through a network of56 branches offering a wide variety of services through its major businesssegments: retail, private and investment banking and insurance services.The bank is a publically listed company. Its shares are traded on the Beirut StockExchange under the symbol BLBD.
Key Ratios FY05 FY06 FY07
Earnings Growth (%) 33.25 32.98 39.42
Revenues Growth (%) 18.19 15.46 17.00
Net Spread (%) 7.34 7.25 9.00
Net Interest Margin (%) 3.67 3.97 4.63
Return on Assets (%) 1.31 1.37 1.55
Return on Equity (%) 15.8 16.5 20.19
Gross Loans / Customer Deposits 0.20 0.21 0.23Sources: Zawya.com
Peer Group Analysis BLOM Bank Bank Audi Byblos BankPrice/Earning 10.68 13.31 9.07
Price/Book 1.62 1.47 1.20
Assets Turnover 0.07 0.07 0.07
NPL's as a % of Gross loans 7.92 N/A 4.7
Market Capitalization(US$ in million) 1,795.25 3,110.42 842.64Sources: Company’s website, Zawya.com, Bloomberg
Company Overview

67
Commercial Banking in the MENA Region
7.1.14 Commercial Bank of Qatar
Wed Sep 20 2006 Daily GCC* Market Review
The Commercial Bank of Qatar (CBQ) was established in 1975 with an initialcapital of QAR 10.00 million. The bank was ranked as the second largest inQatar with a market capitalization of QAR 26.18 billion in 2007.CBQ operates 27 branches and 26 deposit machines in Qatar offeringcorporate, retail, and investment banking services.With total assets worth QAR 45.4 billion at the end of 2007, the bank acts asa holding company for its subsidiaries and offers credit card services.The bank is a publicly listed company, with foreign shareholders holding15.46% and the public holding 60.30%. Citibank NA and Hussein Ibrahim AlFardan and family also hold shares in the bank.
Key Ratios FY05 FY06 FY07
Revenues Growth (%) 105.49 61.02 60.70
Earnings Growth (%) 129.42 18.93 56.02
Net Interest Margin (%) 2.68 2.95 2.39
Return on Assets (%) 4.27 3.39 3.67
Return on Equity (%) 18.18 15.72 23.40
Loans to Deposits 0.86 1.04 1.02
Net Spread (%) 2.94 3.05 2.87
Peer Group AnalysisCommercialBank ofQatar
Qatar National Bank Ahli Bank
Price/Earnings 13.92 15.39 10.09
Price/Book 3.11 2.79 2.00
NPL's as a % of Gross Loans 0.84 0.70 1.51
Assets turnover 0.077 0.057 0.063
Market Capitalization(QAR in million)
15,979.24 38,832.54 2,919.92
Sources: Company’s website, Zawya.com, Bloomberg
CBQ at a Glance
No of Employees 1,007
Headquarters Doha, Qatar
Revenue QAR 3,474.81 million
Network 23 branches and 104 ATMs
Ownership Public
Date founded 1975
Reuters Code COMB.QA
Senior Management
ChairmanHE Abdullah Bin Hamad BinKhalifa Al Attiyah
Group CEO Andrew C Stevens
Vice ChairmanHH Sheikh Abdullah Bin Ali BinJabor Al Thani
Sources: Zawya.com
Shareholding PatternHolding
(%)Hussein Ibrahim Al Fardan and family 10.00
Citibank NA as Global Depositary for GDRs 8.94
Qatar National Bank 2.78
Public 60.30
Sources: Zawya.com
I n te re s t Vs Non I n te re s t Re ve nue
65%
35%
Gross Interest Income Non Interest Income
Key Financials(QAR in million)
FY05 FY06 FY07
Total Revenue 1,342.91 2,162.34 3,474.81
Operating Profit 704.52 912.31 1,421.34
Net Profit 749.52 891.37 1,390.72
Earnings Per Share 8.77 6.36 9.92
Total Assets 22,181.54 30,359.47 45,397.28
Total Liabilities 16,504.44 24,699.39 34,169.46TotalShareholders’Equity 5,677.10 5,660.09 6,227.82
Sources: Zawya.com
Company Overview
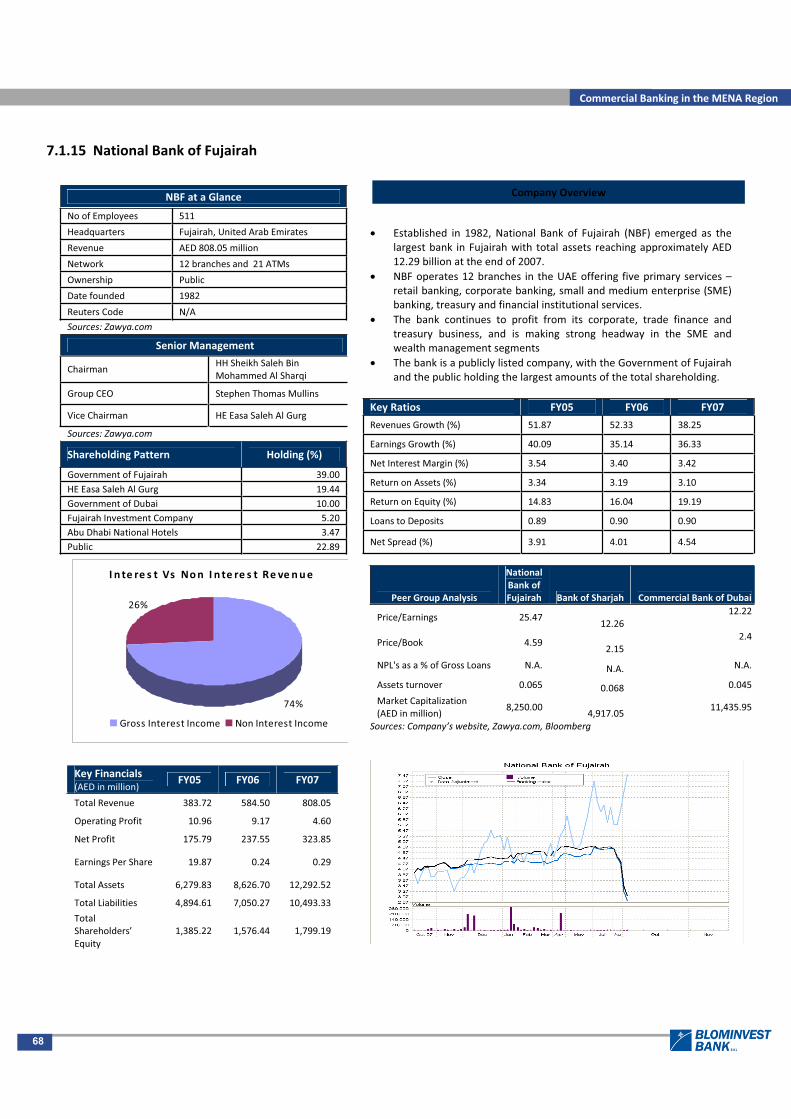
68
Commercial Banking in the MENA Region
7.1.15 National Bank of Fujairah
Wed Sep 20 2006 Daily GCC* Market Review
Established in 1982, National Bank of Fujairah (NBF) emerged as thelargest bank in Fujairah with total assets reaching approximately AED12.29 billion at the end of 2007.NBF operates 12 branches in the UAE offering five primary services –retail banking, corporate banking, small and medium enterprise (SME)banking, treasury and financial institutional services.The bank continues to profit from its corporate, trade finance andtreasury business, and is making strong headway in the SME andwealth management segmentsThe bank is a publicly listed company, with the Government of Fujairahand the public holding the largest amounts of the total shareholding.
Key Ratios FY05 FY06 FY07
Revenues Growth (%) 51.87 52.33 38.25
Earnings Growth (%) 40.09 35.14 36.33
Net Interest Margin (%) 3.54 3.40 3.42
Return on Assets (%) 3.34 3.19 3.10
Return on Equity (%) 14.83 16.04 19.19
Loans to Deposits 0.89 0.90 0.90
Net Spread (%) 3.91 4.01 4.54
Peer Group Analysis
NationalBank ofFujairah Bank of Sharjah Commercial Bank of Dubai
Price/Earnings 25.4712.26
12.22
Price/Book 4.592.15
2.4
NPL's as a % of Gross Loans N.A. N.A. N.A.
Assets turnover 0.065 0.068 0.045
Market Capitalization(AED in million)
8,250.004,917.05
11,435.95
Sources: Company’s website, Zawya.com, Bloomberg
NBF at a Glance
No of Employees 511
Headquarters Fujairah, United Arab Emirates
Revenue AED 808.05 million
Network 12 branches and 21 ATMs
Ownership Public
Date founded 1982
Reuters Code N/A
Sources: Zawya.com
Senior Management
ChairmanHH Sheikh Saleh BinMohammed Al Sharqi
Group CEO Stephen Thomas Mullins
Vice Chairman HE Easa Saleh Al Gurg
Sources: Zawya.com
Shareholding Pattern Holding (%)
Government of Fujairah 39.00HE Easa Saleh Al Gurg 19.44Government of Dubai 10.00Fujairah Investment Company 5.20Abu Dhabi National Hotels 3.47Public 22.89
I n te re s t Vs Non I n te re s t Re ve nue
74%
26%
Gross Interest Income Non Interest Income
Key Financials(AED in million)
FY05 FY06 FY07
Total Revenue 383.72 584.50 808.05
Operating Profit 10.96 9.17 4.60
Net Profit 175.79 237.55 323.85
Earnings Per Share 19.87 0.24 0.29
Total Assets 6,279.83 8,626.70 12,292.52
Total Liabilities 4,894.61 7,050.27 10,493.33
TotalShareholders’Equity
1,385.22 1,576.44 1,799.19
Company Overview

69
Commercial Banking in the MENA Region
7.1.16 National Bank of Oman
NBO at a Glance
No of Employees 1,098
Headquarters Muscat, Oman
Revenue OMR 101.32 million
Network 58 branches and 112 ATMs
Ownership Public
Date founded 1973
Reuters Code NBO.OM
Sources: Zawya.com
Senior Management
Chairman Suhail Salem Abdullah Bahwan
Chief Executive Officer David Murray Sim
Deputy Chief ExecutiveOfficer
Paul Trowbridge
Sources: Zawya.com
Major Shareholders Holdings (%)
The Commercial Bank of Qatar 34.85
Suhail Bahwan Group Holding 14.74
Pension Funds & Others 32.75
Public 17.66Sources: Zawya.com
I n te re s t Vs Non I n te re s t Re ve nue
74%
26%
Gross Interest Income Non Interest Income
Key Financials(OMR in million)
FY05 FY06 FY07
Total Revenue 58.39 76.67 101.32
Operating Profit 23.99 34.70 50.41
Net Profit 20.33 30.43 44.62
Earnings Per Share 0.272 0.380 0.485
Total Assets 869.87 1,082.44 1,476.63
Total Liabilities 680.53 897.89 1,243.84
Total Shareholders'Equity
168.00 184.58 232.79
Sources: Zawya.com
National Bank of Oman (NBO), the first local bank of Oman, wasestablished in 1973. Presently, it is the second largest bank in Omanwith a paid up capital of Omani Riyals (RO) 92.00 million (US$ 239.00million) and a net worth of RO 220.50 million, as on December 31, 2007.The Bank serves its customers in Oman through 58 branches and 112ATMs, as well as five branches in Egypt and one in the UAE.The Bank is engaged in providing consumer, corporate, investment, andinternational banking services.
Key Ratios FY05 FY06 FY07 Earnings Growth (%) 289.32 49.67 46.64
Revenues Growth (%) 3.01 31.1 32.16
Net Spread (%) 3.19 3.2 3.25
Net Interest Margin (%) 3.69 3.55 3.30
Return on Assets (%) 2.56 3.12 3.49
Return on Equity (%) 15.03 17.26 21.38
Gross Loans / Customer Deposits 1.03 0.96 1.04Sources: Zawya.com
Peer Group Analysis National Bank of Oman Bank Muscat Bank Dhofar
Price/Earnings 11.05 13.49 12.37
Price/Book2.12 1.81 2.55
NPL's as a % of Gross Loans7.73 3.9
4.88
Assets turnover0.07 0.04
0.05
Market Capitalization(OMR in million) 482.13 1,064.21
265.41
Sources: Company’s website, Zawya.com, Bloomberg
Company Overview

70
Commercial Banking in the MENA Region
7.1.17 Qatar National Bank
QNB at a Glance
No of Employees 1,581
Headquarters Doha, Qatar
Revenue QAR 3.66 Billion
Network 64 branches and 130 ATMs
Ownership Public
Date founded 1964
Reuters Code QNBK.QA
Sources: Zawya.com
Senior Management
Chairman HE Youssef Hussein Kamal
Vice ChairmanHE Sheikh Hamad Bin Faisal AlThani
Group Chief ExecutiveOfficer
Ali Sharif Al Emadi
Sources: Zawya.com
Major Shareholders Holdings (%)
Qatar Investment Authority 50.0%
Public 50.0%Sources: Zawya.com
I n te re s t Vs Non I n te re s t Re ve nue
71%
29%
Gross Interest Income Non Interest Income
Key Financials(QAR in billion)
FY05 FY06 FY07
Total Revenue 3.09 4.62 6.52
Operating Profit 1.54 2.20 2.78
Net Profit 1.54 2.01 2.53
Earnings Per Share 0.272 0.380 0.485
Total Assets 50.06 71.66 114.36
Total Liabilities 41.35 63.21 100.50
Total Shareholders' Equity 8.71 8.46 13.86Sources: Zawya.com
Qatar National Bank (QNB) was established in 1964 as the country’s firstQatari owned commercial bank, with an ownership structure splitbetween Qatar Investment Authority (50%) and the private sector(50%).The bank has a market share of nearly 40% of the sector’s total assets.QNB also has the largest distribution network of 64 branches and morethan 130 Automated Teller Machines (ATMs).It offers a range of retail, corporate, investment, treasury, wealthmanagement, and Islamic banking products and services to individuals,corporate institutions and government entities. QNB was the firstconventional bank in Qatar to offer Islamic Banking through QNB AlIslami.
Key Ratios FY05 FY06 FY07
Earnings Growth (%) 88.57 30 25.51
Revenues Growth (%) 81.8 49.84 40.93
Net Spread (%) 3.28 3.02 2.58
Net Interest Margin (%) 3.05 2.6 2.02
Return on Assets (%) 3.44 3.28 2.7
Return on Equity (%) 20.16 23.28 22.47
Gross Loans / Customer Deposits 0.86 0.80 0.78Sources: Zawya.com
Peer Group Analysis
QatarNationalBank
Commercial Bankof Qatar Ahli Bank
Price/Earnings15.39 13.92 12.37
Price/Book2.79 3.11 2.46
NPL's as a % of Gross Loans 0.70 0.84 1.51
Assets turnover 0.057 0.077 0.064
Market Capitalization(QAR in million)
38,832.54 15,979.24 2,919.92
Sources: Company’s website, Zawya.com, Bloomberg
Company Overview
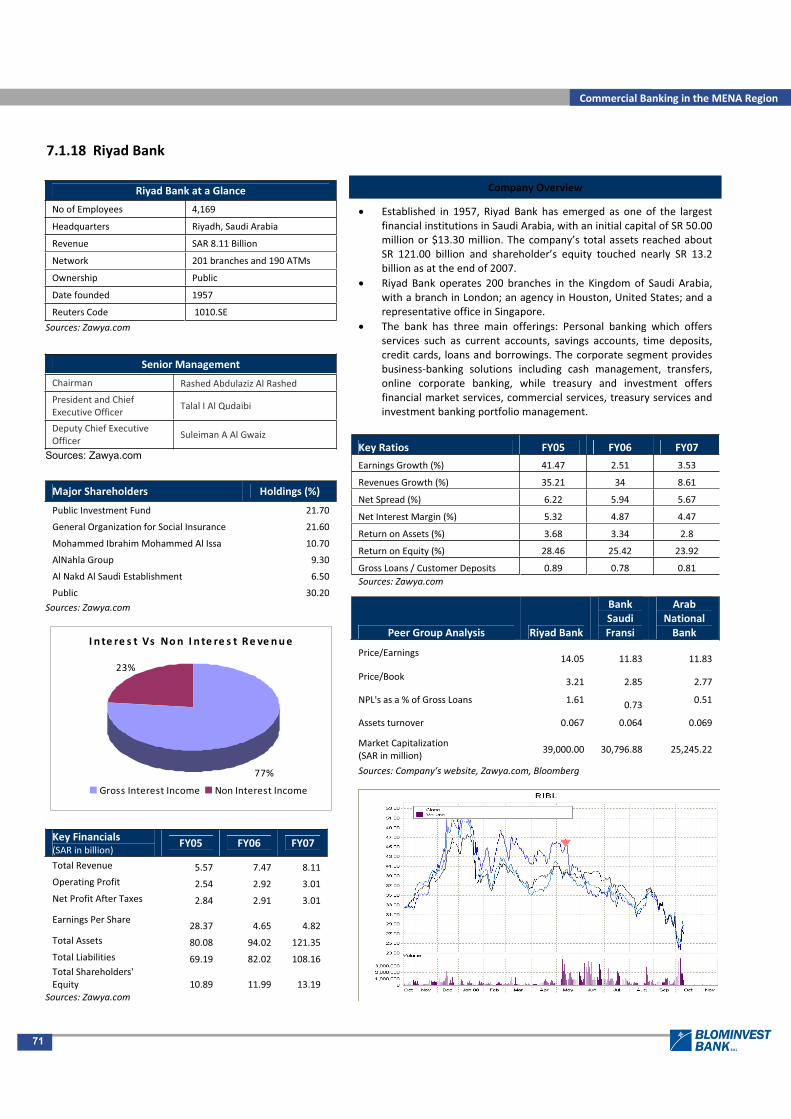
71
Commercial Banking in the MENA Region
7.1.18 Riyad Bank
Riyad Bank at a Glance
No of Employees 4,169
Headquarters Riyadh, Saudi Arabia
Revenue SAR 8.11 Billion
Network 201 branches and 190 ATMs
Ownership Public
Date founded 1957
Reuters Code 1010.SE
Sources: Zawya.com
Senior Management
Chairman Rashed Abdulaziz Al Rashed
President and ChiefExecutive Officer
Talal I Al Qudaibi
Deputy Chief ExecutiveOfficer
Suleiman A Al Gwaiz
Sources: Zawya.com
Major Shareholders Holdings (%)
Public Investment Fund 21.70
General Organization for Social Insurance 21.60
Mohammed Ibrahim Mohammed Al Issa 10.70
AlNahla Group 9.30
Al Nakd Al Saudi Establishment 6.50
Public 30.20Sources: Zawya.com
I n te re s t Vs Non I n te re s t Re ve nue
77%
23%
Gross Interest Income Non Interest Income
Key Financials(SAR in billion)
FY05 FY06 FY07
Total Revenue 5.57 7.47 8.11Operating Profit 2.54 2.92 3.01Net Profit After Taxes 2.84 2.91 3.01
Earnings Per Share28.37 4.65 4.82
Total Assets 80.08 94.02 121.35Total Liabilities 69.19 82.02 108.16Total Shareholders'Equity 10.89 11.99 13.19
Sources: Zawya.com
Established in 1957, Riyad Bank has emerged as one of the largestfinancial institutions in Saudi Arabia, with an initial capital of SR 50.00million or $13.30 million. The company’s total assets reached aboutSR 121.00 billion and shareholder’s equity touched nearly SR 13.2billion as at the end of 2007.Riyad Bank operates 200 branches in the Kingdom of Saudi Arabia,with a branch in London; an agency in Houston, United States; and arepresentative office in Singapore.The bank has three main offerings: Personal banking which offersservices such as current accounts, savings accounts, time deposits,credit cards, loans and borrowings. The corporate segment providesbusiness banking solutions including cash management, transfers,online corporate banking, while treasury and investment offersfinancial market services, commercial services, treasury services andinvestment banking portfolio management.
Key Ratios FY05 FY06 FY07
Earnings Growth (%) 41.47 2.51 3.53
Revenues Growth (%) 35.21 34 8.61
Net Spread (%) 6.22 5.94 5.67
Net Interest Margin (%) 5.32 4.87 4.47
Return on Assets (%) 3.68 3.34 2.8
Return on Equity (%) 28.46 25.42 23.92
Gross Loans / Customer Deposits 0.89 0.78 0.81Sources: Zawya.com
Peer Group Analysis Riyad Bank
BankSaudiFransi
ArabNationalBank
Price/Earnings14.05 11.83 11.83
Price/Book 3.21 2.85 2.77
NPL's as a % of Gross Loans 1.61 0.73 0.51
Assets turnover 0.067 0.064 0.069
Market Capitalization(SAR in million)
39,000.00 30,796.88 25,245.22
Sources: Company’s website, Zawya.com, Bloomberg
Company Overview

72
Commercial Banking in the MENA Region
7.2 Appendix 2 – AcronymsABCP Asset backed commercial paperABS Central Bank of BahrainAED Emirati DirhamAEIBOR Emirates interbank offered rateASE Amman Stock ExchangeATM Automated Teller MachineAUB Ahli United BankAUD Australian DollarAUM Assets under ManagementB&B Bradford & BingleyBFSR Bank financial strength ratingsBKMB Bank MuscatBMA Bahrain Monetary AgencyBoE Bank of EnglandBOS Bank of SharjahBps Basis pointsBSE Bahrain Stock ExchangeBSF Banque Saudi FransiCAGR Compound annual growth rateCAR Capital adequacy ratioCBB Central Bank of BahrainCBK Commercial Bank of KuwaitCBQ Commercial Bank of QatarCBO Central Bank of OmanCDM Cash deposit machineCEO Chief Executive OfficerCIB Commercial International BankDFM Dubai Financial MarketDFMGI Dubai Financial Market General IndexDIFC Dubai International Financial CenterDN Discount noteDPR Dividend per shareECB European Central BankEGP Egyptian PoundEIU Economist Intelligence UnitEPS Earnings per shareEU European UnionFDI Foreign Direct InvestmentFDIC Federal Deposit Insurance CorporationFT Financial TimesGCC Gulf Cooperation CouncilGDP Gross domestic productGDR Global Depository ReceiptIDC Investment Corporation of DubaiIMF International Monetary FundIPO Initial public offeringIT Information technologyJKB Jordan Kuwait BankJOD/JD Jordanian DinarKSA Kingdom of Saudi ArabiaKWD Kuwaiti DinarLE Egyptian PoundLibor London interbank offered rateLNG Liquefied natural gas

73
Commercial Banking in the MENA Region
LP Lebanese PoundME Middle EastMENA Middle East and North AfricaMFI Microfinance institutionMPC Monetary Policy CommitteeMSM30 Muscat Securities Market IndexNBB National Bank of BahrainNBF National Bank of FujairahNBK National Bank of KuwaitNBO National Bank of OmanNGO Non governmental organizationNIM Net interest marginNIS Net interest spreadNPL Non Performing LoanNS Net spreadOMR Omani RialOPEC Organization of Petroleum Exporting CountriesPBDAC Principal Bank for Development and Agriculture CreditPOS Point of saleQAR Qatari RiyalQFC Qatar Financial CenterQIA Qatar Investment AuthorityQNB Qatar National BankQR Qatari RiyalSAIB Societe Arabe Internationale De BanqueSAMA Saudi Arabian Monetary AgencySAR Saudi RiyalSEC Securities and Exchange CommissionSME Small and medium enterprisesSWF Sovereign Wealth FundTAF Term Auction FacilityTSLF Term Securities Lending FacilityUNCTAD United Nations Conference on Trade and DevelopmentUSD United States DollarWTI West Texas Intermediate