commercial lending report -
TRANSCRIPT
2019 COMMERCIAL LENDING REPORT

2
Commercial Lending Report 2019
©2019 | NATIONAL ASSOCIATION OF REALTORS®
All Rights Reserved.
May not be reprinted in whole or in part without permission of the National Association of REALTORS®. For reprint information, contact [email protected].
Although the information presented in this survey has been obtained from reliable sources, NAR does not guarantee its accuracy, and such information may be incomplete. This report is for information purposes only.
Cover photo: Joel Filipe

3
NATIONAL ASSOCIATION OF REALTORS®
2019 LEADERSHIP TEAM
PresidentJohn Smaby
President-ElectVince Malta
First Vice PresidentCharlie Oppler
TreasurerJohn Flor
Vice President of Association AffairsBrian Copeland
Vice President of AdvocacyTracy Kasper
Immediate Past President Elizabeth Mendenhall
Chief Executive OfficerBob Goldberg
COMMERCIAL LENDING REPORT 2019
NATIONAL ASSOCIATION of REALTORS®
RESEARCH GROUP
Lawrence Yun, PhDChief Economist and Senior Vice President
George RatiuDirector, Housing and Commercial Research
Gay CororatonResearch Economist

1 | Introduction……………………………………………………………………
2 | Survey Highlights….…………………………………………………………
3 | Survey Results…………………………………………………………………
About the Survey……………………………………………
4
5
7
9
21
NATIONAL ASSOCIATION of REALTORS®
CONTENTS
COMMERCIAL LENDING REPORT 2019

5
INTRODUCTION1
Photo by Joe Beck

ECONOMIC ENVIRONMENT
The U.S. economy continued to expand at a strong pace of 2.9 percent in 2018 from 2.2 percent in 2017 as private consumption, investment spending, net exports, and government spending all rose at a faster pace.
The unemployment rate continued to trend down to 3.9 percent, while inflation mildly rose to 2.4 percent.
Amid the solid economic growth and job creation and the slight uptick in inflation, the U.S. Federal Operations Market Committee raised the benchmark federal funds rate target four times in 2018 by a total of 1 percentage point, to a range of 2.25 to 2.5 percent at the end of 2018. The average bank prime loan rate rose to 4.9 percent in 2018, from 4.1 percent in 2017.
The 2019 survey on commercial lending takes place in this economic environment marked by slightly higher interest rates and a lower level of bank reserves held by depository institutions that underpin the level of lending.
6NATIONAL ASSOCIATION of REALTORS®
COMMERCIAL LENDING REPORT 2019
GEORGE [email protected]
4.90
0.001.002.003.004.005.006.007.008.009.00
10.00
20
00
20
01
20
02
20
03
20
04
20
05
20
06
20
07
20
08
20
09
20
10
20
11
20
12
20
13
20
14
20
15
20
16
20
17
20
18
AVERAGE BAN K PRIME LOAN RATE
3.92.44
-2.0
0.0
2.0
4.0
6.0
8.0
10.0
12.02
00
0
20
02
20
04
20
06
20
08
20
10
20
12
20
14
20
16
20
18
U N EMPLOY MEN T AN D IN F LATION RATES
Unemployment Rate Inflation Rate
2.9
-3.0
-2.0
-1.0
0.0
1.0
2.0
3.0
4.0
5.0
20
00
20
01
20
02
20
03
20
04
20
05
20
06
20
07
20
08
20
09
20
10
20
11
20
12
20
13
20
14
20
15
20
16
20
17
20
18
GDP GROWTH

7
SURVEY HIGHLIGHTS2
Photo by Verne Ho

8
• 56% of respondents reported an increase in net operating income in 2018, a decrease from 65 percent in the previous year’s survey.
• 38% of respondents reported tighter lending conditions in 2018, up from 35 percent in 2017, with a higher fraction for retail stores.
• 65% of respondents reported the client used debt financing to purchase a property, with higher reliance on debt financing for suburban offices and retail malls.
• 5% to 7% was the average interest rate on loans.
• 10years was the median loan term, except for loans by life insurance companies, at 15 years, and the Small Business Administration, at 20 years.
• 75 to 80 loan-to-value ratios were common, especially for suburban offices, multi-family properties, and industrial properties.
• 1.25 was the median debt service coverage ratio, with higher DSCR for retail malls.
• 54% of respondents cited local/community banks and regional banks as the most active sources of financing in commercial deals.
NATIONAL ASSOCIATION of REALTORS®
COMMERCIAL LENDING REPORT 2019
Photo by Jesse Orico

9
3 SURVEY RESULTS
Photo by Joe Beck

10
• 55 percent of respondents reported a decrease in their for sale or for lease inventory in 2018 compared to 2017.
• Land made up 20 percent of properties clients bought or sold, followed by multi-family (14 percent), suburban offices (13 percent) and industrial warehouses (13 percent). Hotels and retail malls made up the lowest share at two percent each.
NATIONAL ASSOCIATION of REALTORS®
COMMERCIAL LENDING REPORT 2019
Sales in the Past 12 Months
Up 45%Down
55%
FOR SALE OR FOR LEASE INVENTORY IN 2018 COMPARED WITH 2017
9%
12% 15
%
8%
13%
12%
2%
19%
2%
7%8%
14%
15%
7%
14%
11%
0%
21%
2%
8%9%
13%
13%
9%
14%
11%
2%
20%
3%
8%
COMMERCIAL PROPERTY TYPES CLIENTS BOUGHT OR SOLD
2017 Survey 2018 Survey 2019 Survey

11
• 56 percent of respondents reported an increase in net operating income (NOI) in 2018 from the level in 2017, a decrease from 65 percent of respondents who reported an increase in NOI in 2017 compared to 2016.
• By type of property, industrial properties had the highest fraction of respondents who reported an increase in NOI, while hotel and retail mall transactions had the lowest fraction of respondents who reported an increase in NOI.
NATIONAL ASSOCIATION of REALTORS®
COMMERCIAL LENDING REPORT 2019
Net Operating Income
67%
25%
8%
65%
28%
7%
56%
32%
13%
I N C R E A S E D S A M E D E C R E A S E D
CHANGE IN NET OPERATING INCOME
2017 Survey 2018 Survey 2019 Survey
62%
62%
58%
58%
57%
57%
56%
49%
38%
49%
PERCENT OF RESPONDENTS REPORTING AN INCREASE IN NET OPERATING INCOME

12
• 38 percent of respondents reported tighter lending conditions in 2018, up from 35 percent in 2017.
• 58 percent of respondents reported that lending conditions tightened for retail stores (34 percent for retail strip centers; 24 percent for retail malls). Industrial property had the smallest share of respondents that reported tighter lending conditions, at 13 percent (8 percent, warehouse; 5, percent flex). The survey findings are indicative of the challenges faced by the retail sector and the strong demand for industrial properties on account of the robust expansion of e-commerce sales.
NATIONAL ASSOCIATION of REALTORS®
COMMERCIAL LENDING REPORT 2019
Lending Conditions
37% 40
%
23%
35%
36%
29%
39% 41%
20%
T I G H T E N E D N O C H A N G E E A S E D
LENDING CONDITIONS IN PAST 12 MONTHS
2017 Survey 2018 Survey 2019 Survey
34%
31%
24%
20%
18%
18%
11%
8% 5% 6%
WHAT PROPERTY TYPES (IF ANY) DID YOU SEE LENDERS TREAD SLOWER ?

13
• 33 percent of respondents reported they had a failed transaction due to lack of financing.• 54 percent of those who reported a failed sale transaction reported retail mall transactions,
and 44 percent reported retail strip center transactions. The smallest fraction of reported failed sales transactions were CBD offices, at 29 percent. Multiple responses are allowed so the shares won’t sum up to 100 percent.
• Loan/underwriting requirements was cited by 54 percent of the respondents as the reason for the failure, followed by financing availability (18 percent), appraisal (15 percent), and other reasons (10 percent).
NATIONAL ASSOCIATION of REALTORS®
COMMERCIAL LENDING REPORT 2019
Lending Conditions
54%
44%
43%
37%
37%
35%
34%
32%
29% 36
%
PERCENT OF RESPONDENTS WHO REPORTED A FAILED SALE TRANSACTION
DUE TO LACK OF FINANCING
35%
36%
33%
2 0 1 7 S U R V E Y 2 0 1 8 S U R V E Y 2 0 1 9 S U R V E Y
PERCENT OF RESPONDENTS WITH A FAILED SALES TRANSACTION DUE TO
LACK OF FINANCING
14
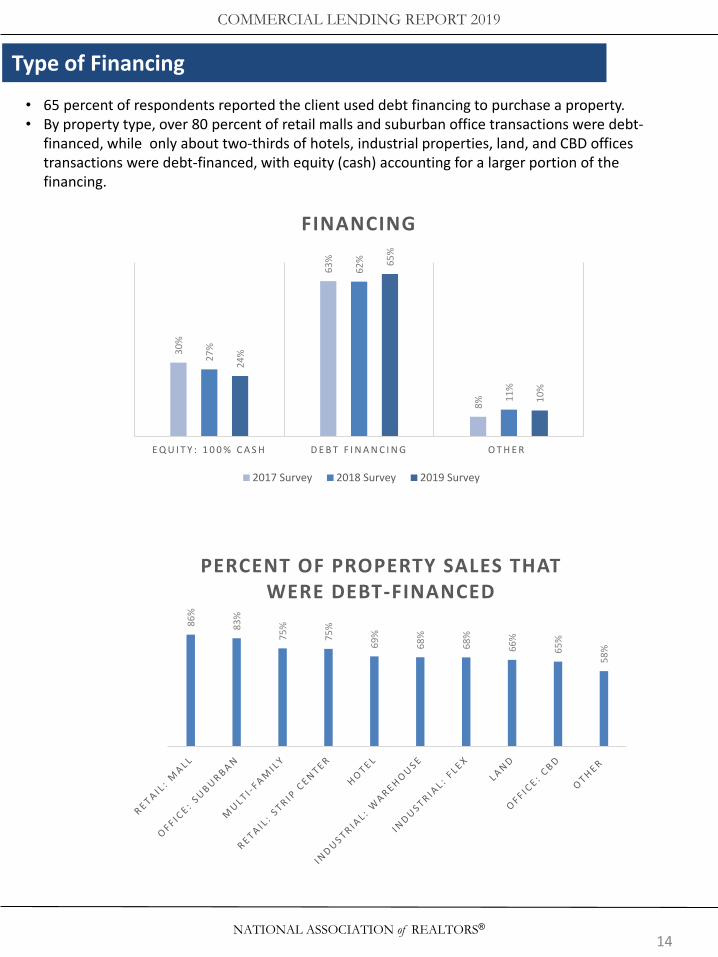
• 65 percent of respondents reported the client used debt financing to purchase a property.• By property type, over 80 percent of retail malls and suburban office transactions were debt-
financed, while only about two-thirds of hotels, industrial properties, land, and CBD offices transactions were debt-financed, with equity (cash) accounting for a larger portion of the financing.
NATIONAL ASSOCIATION of REALTORS®
COMMERCIAL LENDING REPORT 2019
Type of Financing
30%
63%
8%
27%
62%
11%
24%
65%
10%
E Q U I T Y : 1 0 0 % C A S H D E B T F I N A N C I N G O T H E R
FINANCING
2017 Survey 2018 Survey 2019 Survey
86%
83%
75%
75%
69%
68%
68%
66%
65%
58%
PERCENT OF PROPERTY SALES THAT WERE DEBT-FINANCED

15
• 50 percent of debt-financed sales in 2018 had an average interest rate of five to seven percent, up from 33 percent in 2017. This result is consistent with the rising interest rate environment in 2018.
• Respondents reported that the median loan term among lenders was 10 years, except for life insurance companies, 15 years, and the Small Business Administration, 20 years.
NATIONAL ASSOCIATION of REALTORS®
COMMERCIAL LENDING REPORT 2019
Interest Rate and Loan Term In Years
69%
29%
2%
65%
33%
2%
47% 50
%
2%
U P T O 5 % H I G H E R T H A N 5 % T O 7 % H I G H E R T H A N 7 %
AVERAGE INTEREST RATES CHARGED FOR DEBT FINANCING
2017 Survey 2018 Survey 2019 Survey
10 10 10 10 10
15
20
5.25
MEDIAN LOAN TERMS IN YEARS

16
• 60 percent of respondents reported that lenders used the loan-to-value (LTV) ratio as the criteria for determining the loan amount; the rest used the debt service coverage (DSC) ratio or the smaller of the loan amount using the DSCR or the LTV
• By property type, a higher fraction of loan amounts for industrial warehouses, land, and offices were determined using the LTV criteria compared to other property types
NATIONAL ASSOCIATION of REALTORS®
COMMERCIAL LENDING REPORT 2019
Loan-to-Value Ratio
62%
16% 23
%
59%
14%
27%
60%
16% 24
%
L O A N - T O - V A L U E ( L T V ) D E B T S E R V I C E C O V E R A G E R A T I O ( D S C R )
T H E L O W E R L O A N A M O U N T B E T W E E N L T V
O R D S C R
LENDERS’ LOAN CRITERIA USED TO DETERMINE LOAN AMOUNT
2017 Survey 2018 Survey 2019 Survey
64%
63%
61%
59%
58%
57%
55%
54%
45%
58%
SHARE OF LOANS THAT USED LTV CRITERIA TO DETERMINE LOAN
AMOUNT BY PROPERTY TYPE

17
• Of the reported transactions where the loan amounts were determined using the LTV ratio, 62 percent had LTV ratios of 75 percent or 80 percent.
• By property type, suburban office, multi-family, and industrial properties had the highest fraction of loans with LTV ratio of 75 or higher, while at most half of retail stores and hotel loan amounts had an LTV ratio of 75 or higher.
NATIONAL ASSOCIATION of REALTORS®
COMMERCIAL LENDING REPORT 2019
Loan-to-Value Ratio
6% 5%
33%
29%
16%
6%
2% 1%
3%
0%
5%
10%
15%
20%
25%
30%
35%
40%
9 0 % 8 5 % 8 0 % 7 5 % 7 0 % 6 5 % 6 0 % 5 5 % 5 0 %
LOAN-TO-VALUE
2017 Survey 2018 Survey 2019 Survey
79%
69%
65%
63%
62%
62%
54%
50%
45%
62%
PERCENT OF LOANS WITH LOAN-TO-VALUE RATIO 75 OR HIGHER

18
• The median debt service coverage ratio was 1.25. • By property type, retail malls appeared to have a slightly higher debt service coverage ratio
compared to other properties, while land transactions had the lowest debt service coverage ratio.
NATIONAL ASSOCIATION of REALTORS®
COMMERCIAL LENDING REPORT 2019
Debt Service Coverage Ratio
1.15
0.80
1.25
2 0 1 7 S U R V E Y 2 0 1 8 S U R V E Y 2 0 1 9 S U R V E Y
MEDIAN DEBT SERVICE COVERAGE RATIO
1.28
1.25
1.25
1.25
1.25
1.25
1.23
1.23
1.20
1.23
MEDIAN DEBT SERVICE COVERAGE RATIOS

19
• Local/community banks comprised the biggest source of lending, at 30 percent, followed by regional banks, at 24 percent in the 2019 survey (2018 reference year).
• National banks accounted for 12 percent, although the share increased from six percent in the 2018 survey (2017 reference year).
• Private investors made up 10 percent, and credit unions eight percent.• The Small Business Administration accounted for six percent of reported transactions.
NATIONAL ASSOCIATION of REALTORS®
COMMERCIAL LENDING REPORT 2019
Lenders
12%
24%
30%
1%
8%
4%
2%
10%
1%
6%
0% 1% 1%
0%5%
10%15%20%25%30%35%
SOURCES OF FINANCING
2017 Survey 2018 Survey 2019 Survey

20
• 19 percent of respondents reported a client who had used an SBA lending program in 2018: 18 percent, 7(A); 9 percent CDC/504; and 1 percent, microloan
• Among those who reported they did not have a client who used an SBA lending program, 66 percent reported that the client had other sources of financing. Three percent reported the client did not know the SBA program existed.
NATIONAL ASSOCIATION of REALTORS®
COMMERCIAL LENDING REPORT 2019
SBA Lending
16%
15%
1% *
68%
22%
13%
* 1%
63%
18%
9%
1% 2%
71%
Y E S - 7 ( A ) Y E S - C D C / 5 0 4 Y E S -M I C R O L O A N
Y E S - D I S A S T E R L O A N
N O
DISTRIBUTION OF CLIENTS WHO USED SBA LENDING PROGRAMS
2017 Survey
*less than one percent
3%
22%
6%
56%
13%
4%
18%
4%
61%
13%
3%
15%
5%
66%
11%
D I D N O T K N O W T H E P R O G R A M
E X I S T E D
B U R D E N S O M E A P P L I C A T I O N
A N D R E P O R T I N G
R E Q U I R E M E N T S
D U E T O P A S T S B A
E X P E R I E N C E S
C L I E N T H A D O T H E R
S O U R C E ( S ) O F F I N A N C I N G
O T H E R
REASONS CLIENT DID NOT USE SBA LENDING PROGRAMS
2017 Survey 2018 Survey 2019 Survey

21
In March of 2019, NAR sent out the online survey to nearly 70,000 REALTORS® with an interest in commercial real estate. The objective of the survey was to gather information about their commercial transactions with international clients during the period January –December 2018. A total of 1,009 responses were received for an overall response rate of 1.4 percent.
Of the 1,009 respondents, 573 or 57 percent had a sale and were asked questions about their transactions. Respondents had a median of four transactions during the year. The average sales transactions value was less than $ 1 million.
Based on the 573 respondents, the margin of error for estimating proportions (using 50 percent sample estimate) at the 95 percent level of confidence is 4 percent. The margin of error for sub-groups estimates (property types) will be higher.
NATIONAL ASSOCIATION of REALTORS®
COMMERCIAL LENDING REPORT 2019
ABOUT THE SURVEY
65%
18%
9%
3% 5%
64%
18%
10%
4% 4%
64%
20%
10%
4% 2%
U N D E R $ 1 , 0 0 0 , 0 0 0
$ 1 , 0 0 0 , 0 0 0 -$ 1 , 9 9 9 , 9 9 9
$ 2 , 0 0 0 , 0 0 0 -$ 4 , 9 9 9 , 9 9 9
$ 5 , 0 0 0 , 0 0 0 -$ 1 0 , 0 0 0 , 0 0 0
O V E R $ 1 0 , 0 0 0 , 0 0 0
DISTRIBUTION OF AVERAGE VALUE OF SALES TRANSACTION
2017 Survey 2018 Survey 2019 Survey
ALC, 2%CCIM, 13%
CPM®, 4%CRE™, 2%SIOR, 3%Other
designations, 78%
DESIGNATIONS OF RESPONDENTS IN THE 2019
COMMERCIAL LENDING SURVEY
22
COMMERCIAL LENDING REPORT 2019
The National Association of REALTORS® is America’s largest trade association, representing more than 1.3 million members, including NAR’s institutes, societies and councils, involved in all aspects of the real estate industry. NAR membership includes brokers, salespeople, property managers, appraisers, counselors and others engaged in both residential and commercial
real estate.
The term REALTOR® is a registered collective membership mark that identifies areal estate professional who is a member of the National Association of REALTORS®and subscribes to its strict Code of Ethics.
Working for America’s property owners, the National Association provides a facility forprofessional development, research and exchange of information among its membersand to the public and government for the purpose of preserving the free enterprisesystem and the right to own real property.
NATIONAL ASSOCIATION OF REALTORS®RESEARCH GROUPThe Mission of the NATIONAL ASSOCIATION OF REALTORS® Research Group is to produce timely, data-driven market analysis and authoritative business intelligence to serve members, and inform consumers, policymakers and the media in a professional and accessible manner.
To find out about other products from NAR’s Research Group, visitnar.realtor/research-and-statistics
NATIONAL ASSOCIATION OF REALTORS®Research Group500 New Jersey Avenue, NWWashington, DC [email protected]

2019 COMMERCIAL LENDING REPORT