commercial mortgages: an underutilized channel for … · commercial mortgages: an underutilized...
TRANSCRIPT
Commercial mortgages: An underutilized channel for scaling energy efficiency investments?
Paul Mathew, Lawrence Berkeley National Laboratory Nancy Wallace, University of California Berkeley
Elena Alschuler, U.S. Department of Energy Leonard Kolstad, Institute for Market Transformation
ABSTRACT
Commercial mortgages currently do not fully account for energy factors in underwriting and valuation, particularly as it relates to the impact of energy costs and volatility on an owner’s net operating income. As a consequence, energy efficiency is not properly valued and energy risks are not properly assessed and mitigated. Commercial mortgages are a large lever and could be a significant channel for scaling energy efficiency investments. A pilot analysis of loans with different mortgage contract structures and locations showed that when energy cost volatility was included in mortgage valuation, a 20% reduction in energy use resulted in a 1.3% average increase in mortgage value. This suggests that the explicit inclusion of energy use and volatility in mortgage valuation can send a strong price signal that financially rewards and values energy efficiency in commercial properties.
This paper presents findings from a scoping study addressing energy factors in commercial mortgages. First, we present a review of current practices as it relates to incorporating energy factors into commercial mortgage underwriting and valuation. Next, we detail the impacts of energy factors on property values, net operating income and mortgage valuation. Building operational practices alone can result in energy use variations from -17% to 87%. Finally, we present a set of proposed interventions to properly address energy factors in commercial mortgages, based on extensive discussions with stakeholders including mortgage originators, underwriters, building owners and regulators.
Introduction
It is axiomatic that there is no silver bullet for scaling up high-performance buildings. Over the past three decades there has been a wide range of technical and financing offerings to increase energy efficiency investments in buildings. A host of energy efficiency financing approaches have been developed, from green bonds to energy performance contracts, capital leases, on-bill financing, etc. In general, less attention has been paid to the potential of commercial mortgages as a channel for promoting energy efficiency investments. Commercial mortgages currently do not fully account for energy factors in underwriting and valuation, particularly as it relates to the impact of energy costs and volatility on an owner’s net operating income. As a consequence, energy efficiency is not properly valued and energy risks are not properly assessed and mitigated. Commercial mortgages are a large lever and could be a significant channel for scaling energy efficiency investments.
This paper presents findings from two efforts sponsored by the U.S. Department of Energy: 1. An exploratory analysis of the impact of energy use and price volatility on net operating income (NOI) and mortgage valuation; and 2. A scoping study to assess the current state of the market and potential interventions to incorporate energy factors into commercial
mortgage valuation. The paper is organized in three parts as follows: We first present a review of current practices as it relates to incorporating energy factors into commercial mortgage underwriting and valuation. Next, we detail the impacts of energy factors on property values, net operating income and mortgage valuation. Finally, we present a set of proposed interventions to properly address energy factors in commercial mortgages, based on extensive discussions with stakeholders including mortgage originators, underwriters, building owners and regulators.
Current Practice
The commercial mortgage underwriting process with respect to underwriting energy performance is currently characterized by a) very limited benchmarking to identify energy efficient buildings (usually limited to Energy Star Ratings and LEED certification); b) limited transparency concerning energy performance in the primary underwriting information such as NOI, ARGUS reporting structures on leases,1 appraisals, and/or building specific engineering reports that are required for larger mortgages; c) the split incentive problems between building owners and their tenants or building owners and their lenders. Overall, the total effect of these issues is that although lenders may be aware of potentially higher default risks associated with approving mortgages for very energy inefficient buildings, because they cannot identify the offending buildings they instead globally require inefficiently higher debt service coverage ratios as buffers against commercial mortgage default risk exposure.
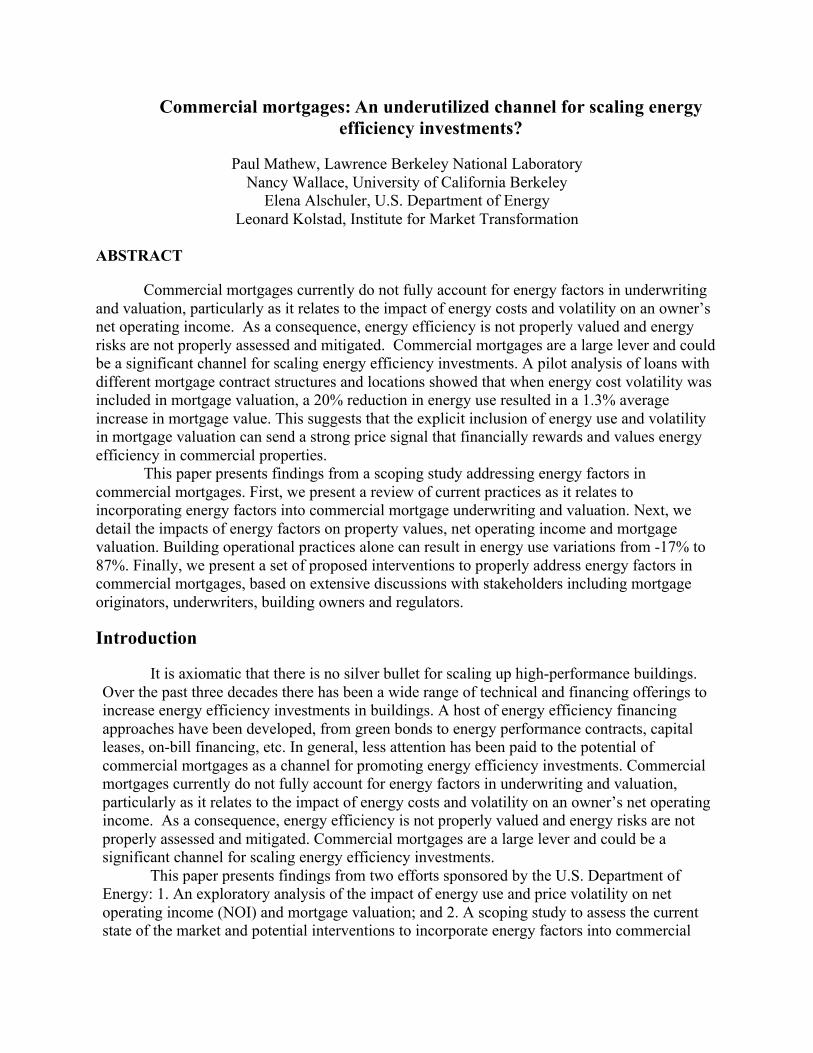
As shown in Figure 1, the total stock of commercial mortgage investment in the U.S. is dominated by commercial banks, insurance companies, and the commercial mortgage backed securities (CMBS) market. These companies are also the largest commercial mortgage originators. The ‘other’ category includes real estate investment trusts (REITs), finance companies, private pension funds, and the government sponsored enterprises (GSEs): Freddie Mac and Fannie Mae. The mortgage investment holdings of the GSEs are exclusively multifamily residential mortgages. The total GSE issuances increased from about $10.6 billion in 2010 to about $51.5 billion in 20152. The financial crisis had very significant effects on the volume of commercial mortgage origination leading to a trough in mortgage origination in 2009 of only $82 billion and a gradual expansion of the market through 2015 to a total new origination level of $463 billion annually.
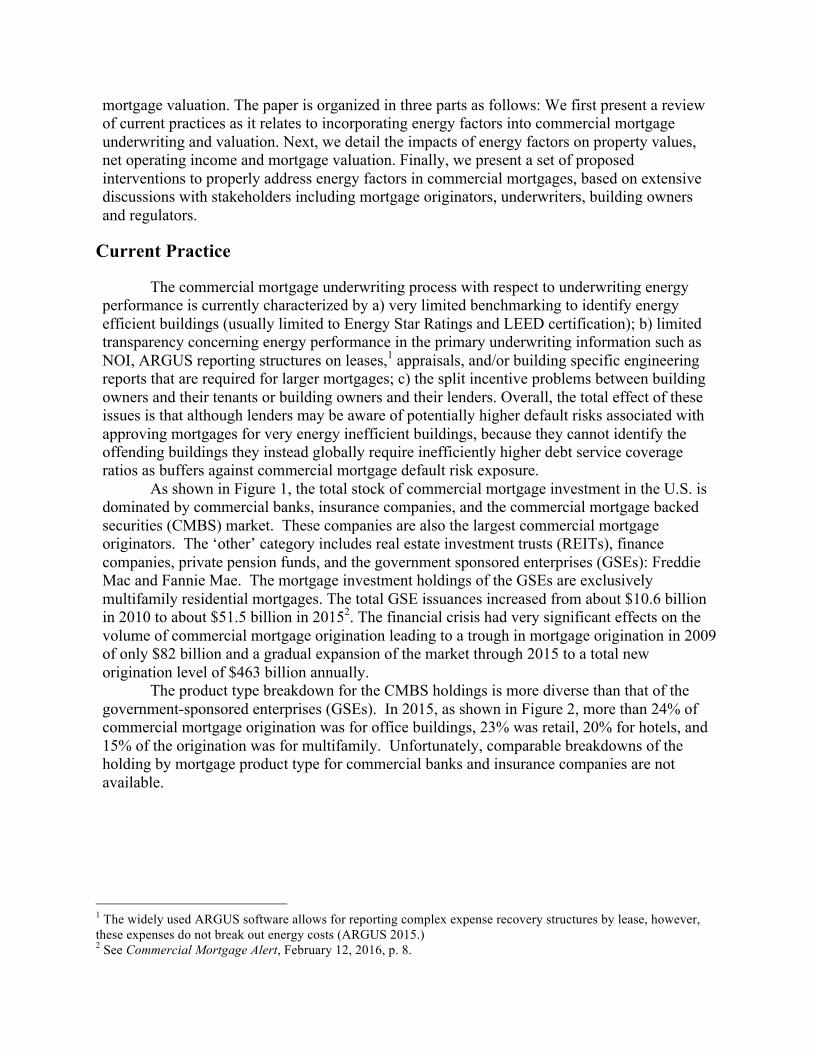
The product type breakdown for the CMBS holdings is more diverse than that of the government-sponsored enterprises (GSEs). In 2015, as shown in Figure 2, more than 24% of commercial mortgage origination was for office buildings, 23% was retail, 20% for hotels, and 15% of the origination was for multifamily. Unfortunately, comparable breakdowns of the holding by mortgage product type for commercial banks and insurance companies are not available.
1 The widely used ARGUS software allows for reporting complex expense recovery structures by lease, however, these expenses do not break out energy costs (ARGUS 2015.) 2 See Commercial Mortgage Alert, February 12, 2016, p. 8.
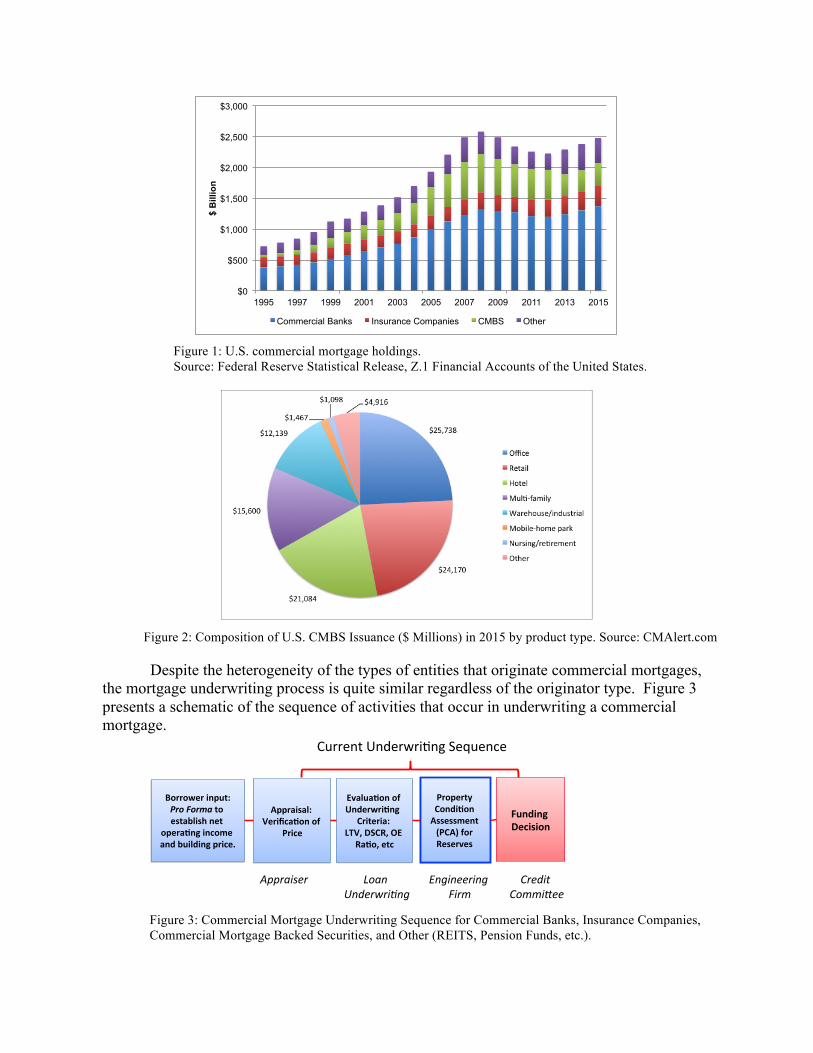
Figure 1: U.S. commercial mortgage holdings. Source: Federal Reserve Statistical Release, Z.1 Financial Accounts of the United States.
Figure 2: Composition of U.S. CMBS Issuance ($ Millions) in 2015 by product type. Source: CMAlert.com
Despite the heterogeneity of the types of entities that originate commercial mortgages, the mortgage underwriting process is quite similar regardless of the originator type. Figure 3 presents a schematic of the sequence of activities that occur in underwriting a commercial mortgage.
Figure 3: Commercial Mortgage Underwriting Sequence for Commercial Banks, Insurance Companies, Commercial Mortgage Backed Securities, and Other (REITS, Pension Funds, etc.).
$0
$500
$1,000
$1,500
$2,000
$2,500
$3,000
1995 1997 1999 2001 2003 2005 2007 2009 2011 2013 2015
$ B
illio
n
Commercial Banks Insurance Companies CMBS Other
Evalua&onofUnderwri&ng
Criteria:LTV,DSCR,OE
Ra&o,etc
Appraisal:Verifica&onof
Price
Borrowerinput:ProFormatoestablishnet
opera&ngincomeandbuildingprice.
PropertyCondi&onAssessment(PCA)forReserves
FundingDecision
CurrentUnderwri,ngSequence
Appraiser LoanUnderwri/ng
EngineeringFirm
CreditCommi6ee
In the first stage, the borrower produces a loan application packet that would include a pro forma representation of all the acquisition costs and disposition proceeds, the operating expenses and lease revenues of the building along with all of the assumptions about vacancy, cost and rent growth rates. The key underwriting variable from the pro forma is the net operating income (NOI) for the property. The borrower also provides a large number of supporting documents including the larger lease contracts, the janitorial and utility contracts, often gas and electricity bills, an appraisal to establish building value, and other documents. Commonly, the pro forma information would be summarized by applying standardized templates produced by ARGUS software in which utility related expenses are entered as aggregate costs per rentable area per month (ARGUS 2015). The second stage of the underwriting sequence typically includes an appraisal (usually undertaken by an appraiser hired by the lender) that provides the lender with a verification of the market price of the building using a reconciliation of the cost, income capitalization, and comparable sales approaches to market valuation.
Currently, the appraisal includes very little information concerning the impact of the relative energy performance of the building on its most probable market value. The appraisal may give “credit” to Energy Star ratings or LEED certification in its evaluation of the quality of the property and adjust its capitalization rate accordingly. Energy costs ostensibly affect the NOI through their effect on utility costs, but many appraisers just choose industry standard assumptions for utility costs going forward even if the building has been performing better.. Energy factors may also affect the property’s expected income via enhanced “rentability” or leasehold stability (although this does not appear to be happening much in practice).
Using the verified building price and the borrower pro forma, the lenders evaluate the underwriting criteria such as the loan-to-value (LTV) ratio, the debt service coverage ratio (DSCR), and the operating expense (OE) ratio to determine the actuarially fair contract terms such as the amortization period, the maturity period, the interest on the mortgage, the mortgage balance and the allowable debt service payment structure. For larger loans, once the mortgage is essentially approved, the lender will require a Property Condition Assessment (PCA), or engineering report, be prepared for the building (all CMBS loans have this requirement). PCAs are undertaken by engineering companies and they evaluate the remaining useful life and quality of the heavy equipment in the building such as chillers, air circulation equipment, electrical conduits, security systems, and the roof among other building components. These reports are primarily used to determine the reserves that the lender will require to assure the property quality and value through scheduled maintenance and replacement of capital equipment. The final step is the decision by the institution’s credit committee as to whether or not the loan will be funded.
There appear to be a number of significant limitations in the suitability of the underwriting processes for determining the relative energy performance of a given commercial real estate property. First, the key underwriting variables, the loan to value ratio and the debt service coverage ratio are based on the NOI of the building. Unfortunately, energy costs are not transparently represented in the NOI since in many leases, tenants pay their own electricity and natural gas bills. Secondly, the commonly used ARGUS software does not break down the energy costs of the property. Thirdly, most utilities do not produce benchmarked utility bills that allow a lender to determine the relative performance of the building compared to similar buildings controlling for the data collection period, the building occupancy, the operating hour statistics, the weather conditions during the measurement period, and the effects of building
renovations or commissioning of the heavy equipment.3 Overall, current commercial mortgage underwriting practices do not fully account for
the risks that may be associated with the energy-use inefficiencies of buildings. Possible solutions to these limitations might include accessing the engineering reports earlier in the underwriting process (at the same time as the appraisal), augmenting the engineering reports with benchmarks and standards, and possibly providing lenders with actuarially determined thresholds for energy costs and volatility of costs below which lending would be inadvisable.
Impacts of Energy Factors
Growing evidence of the relationship between energy efficiency and property value
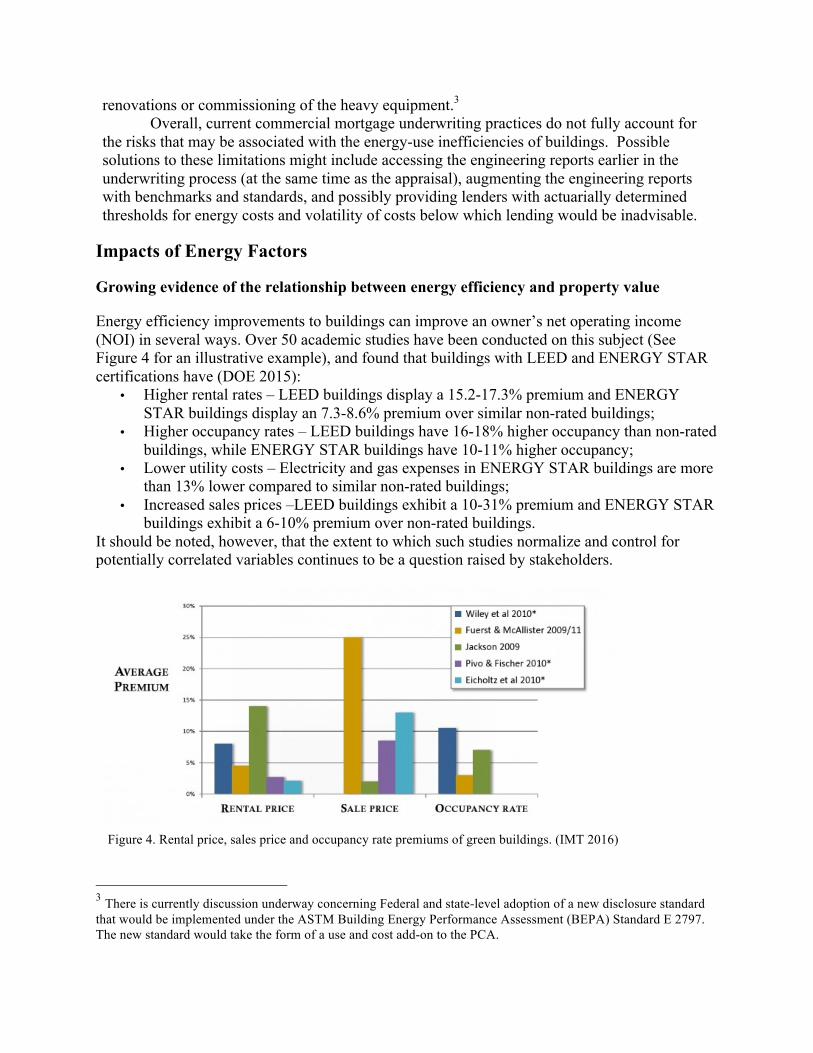
Energy efficiency improvements to buildings can improve an owner’s net operating income (NOI) in several ways. Over 50 academic studies have been conducted on this subject (See Figure 4 for an illustrative example), and found that buildings with LEED and ENERGY STAR certifications have (DOE 2015):
• Higher rental rates – LEED buildings display a 15.2-17.3% premium and ENERGY STAR buildings display an 7.3-8.6% premium over similar non-rated buildings;
• Higher occupancy rates – LEED buildings have 16-18% higher occupancy than non-rated buildings, while ENERGY STAR buildings have 10-11% higher occupancy;
• Lower utility costs – Electricity and gas expenses in ENERGY STAR buildings are more than 13% lower compared to similar non-rated buildings;
• Increased sales prices –LEED buildings exhibit a 10-31% premium and ENERGY STAR buildings exhibit a 6-10% premium over non-rated buildings.
It should be noted, however, that the extent to which such studies normalize and control for potentially correlated variables continues to be a question raised by stakeholders.
Figure 4. Rental price, sales price and occupancy rate premiums of green buildings. (IMT 2016)
3 There is currently discussion underway concerning Federal and state-level adoption of a new disclosure standard that would be implemented under the ASTM Building Energy Performance Assessment (BEPA) Standard E 2797. The new standard would take the form of a use and cost add-on to the PCA.
Impact of energy use and price volatility on NOI and mortgage valuation
Out of the potential NOI impacts above, utility cost is the most straightforward to measure. The NOI is calculated as the gross revenues (e.g., from rents) minus the operating expenses, which includes energy costs. Energy costs are important for mortgage valuation because energy costs are, on average, about 12% of base rents, and in many regions of the country as much as 30% of total ownership costs. Energy costs are a function of energy use and price. Accordingly, energy-related impacts for NOI can be broken into two components:
• Energy use and its volatility over the course of the mortgage term • Energy price and it volatility over the course of the mortgage term
Energy use volatility To varying degrees, current practice nominally accounts for average energy use in the
NOI calculation via total energy cost. However, there is limited, if any, consideration of the volatility of use—that is, unintended or unexpected changes in use. Furthermore, there is a range of rigor in how the average energy use is determined. From a risk management perspective, volatility is often of greater interest than the average use because volatility can be used to evaluate the impact of extreme events and default risk. Volatility in use generally results from three factors:
• Weather: Year-to-year weather variations will naturally cause changes in energy use, which will be exacerbated with climate change impacts.
• Operational practices: Similar buildings can have very different levels of energy use, depending on how they are operated. Some operational practices are controlled by facilities personnel (e.g., HVAC controls) while others are controlled by occupants (e.g., turning off lights and computers when not in use). This explains why sometimes a change in facilities staff or occupants can impact energy use significantly.
• Vacancy levels: Higher vacancy levels should cause a decrease in energy use, although the degree to which this happens is a function of the thermal and lighting control in vacant spaces, so utility costs may not go down proportionally with lease income. The volatility for any given building will depend on its specific context and features.
Mathew et al. (2011) and Wang et al. (2012) analyzed the potential range of volatility due to each of the factors identified above for office buildings, using energy simulation to model prototypical office buildings of three different sizes (small, medium, and large) in four locations with different climates. Illustrative results are presented below.
The year-to-year variation in site energy consumption caused by weather over a 10-15 year period was generally within ±4%, except in the cool and mixed-humid climates, where the site energy variation for small offices is in the range of -8% to 6%. The warm-marine climate represented by San Francisco showed the least variation, with a range of -1% to 3%.
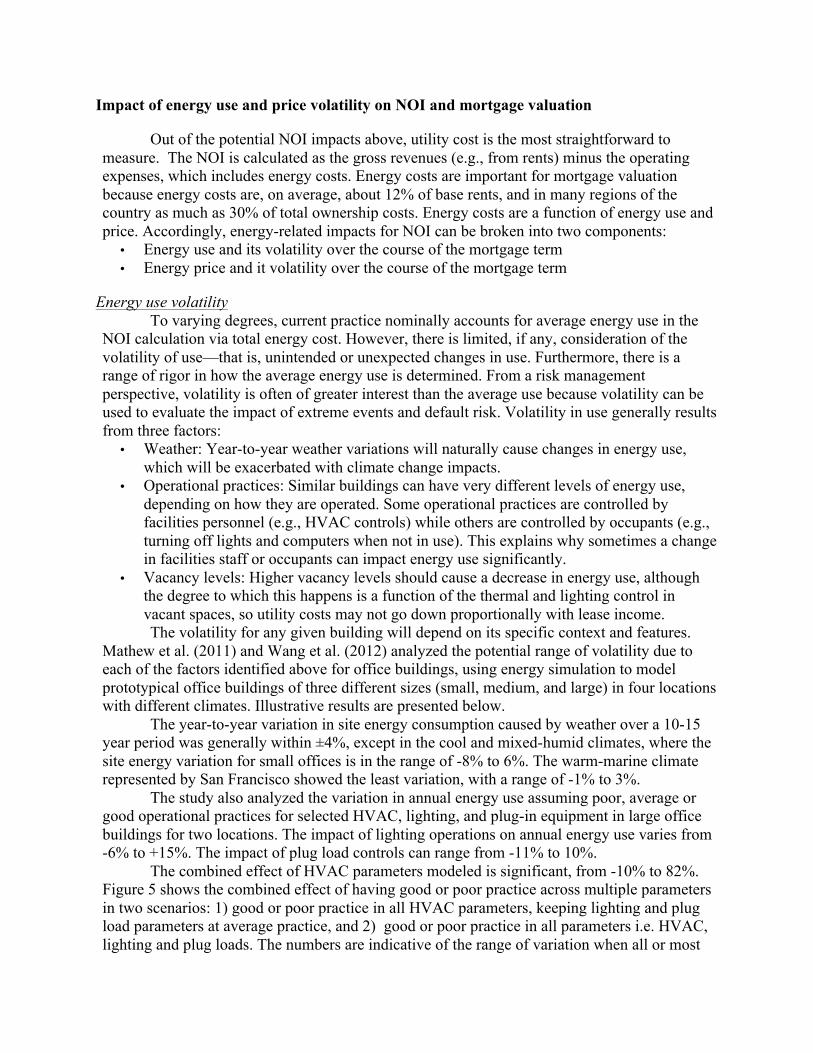
The study also analyzed the variation in annual energy use assuming poor, average or good operational practices for selected HVAC, lighting, and plug-in equipment in large office buildings for two locations. The impact of lighting operations on annual energy use varies from -6% to +15%. The impact of plug load controls can range from -11% to 10%.
The combined effect of HVAC parameters modeled is significant, from -10% to 82%. Figure 5 shows the combined effect of having good or poor practice across multiple parameters in two scenarios: 1) good or poor practice in all HVAC parameters, keeping lighting and plug load parameters at average practice, and 2) good or poor practice in all parameters i.e. HVAC, lighting and plug loads. The numbers are indicative of the range of variation when all or most
parameters are in good or poor practice. Again, note that these variations are just the effect of operational practices, and not differences in fixed asset characteristics. That is, two identical buildings with the same building construction and equipment can show wide variation in energy use just due to their operational practices.
To analyze the variation of good and poor practice in how vacant spaces are managed, two vacancy rates (10% and 20%) were modeled. Good practice assumes that all HVAC and lighting in vacant spaces is turned off or turned down. Poor practice assumes that HVAC and lighting are operated similarly in both vacant and occupied spaces. Good practice results in approximately 3%-10% of annual energy savings compared to poor practice, with no significant differences across the four climates.
These findings are largely corroborated by a similar study by Heller et al. (2011) which compared the impact of design operation and tenant behavior on energy performance. The energy impact of good vs. poor operations and maintenance was from around -20% to +40% relative to average practice.
Thus, there is significant volatility in energy use attributable to operational practices that could vary during the course of a mortgage term, suggesting that it is important to consider this impact in the mortgage valuation process.
Figure 5. Annual site energy variation due to the combined effects of operational practices for large (L), medium (M) and small (S) offices in two climate zones. ‘HVAC Combined’ implies good or poor practice across all HVAC parameters. ‘All combined’ implies good or poor practice across all parameters (HVAC, lighting and plug loads)
Energy Price Volatility United States wholesale energy prices for electricity and natural gas vary significantly
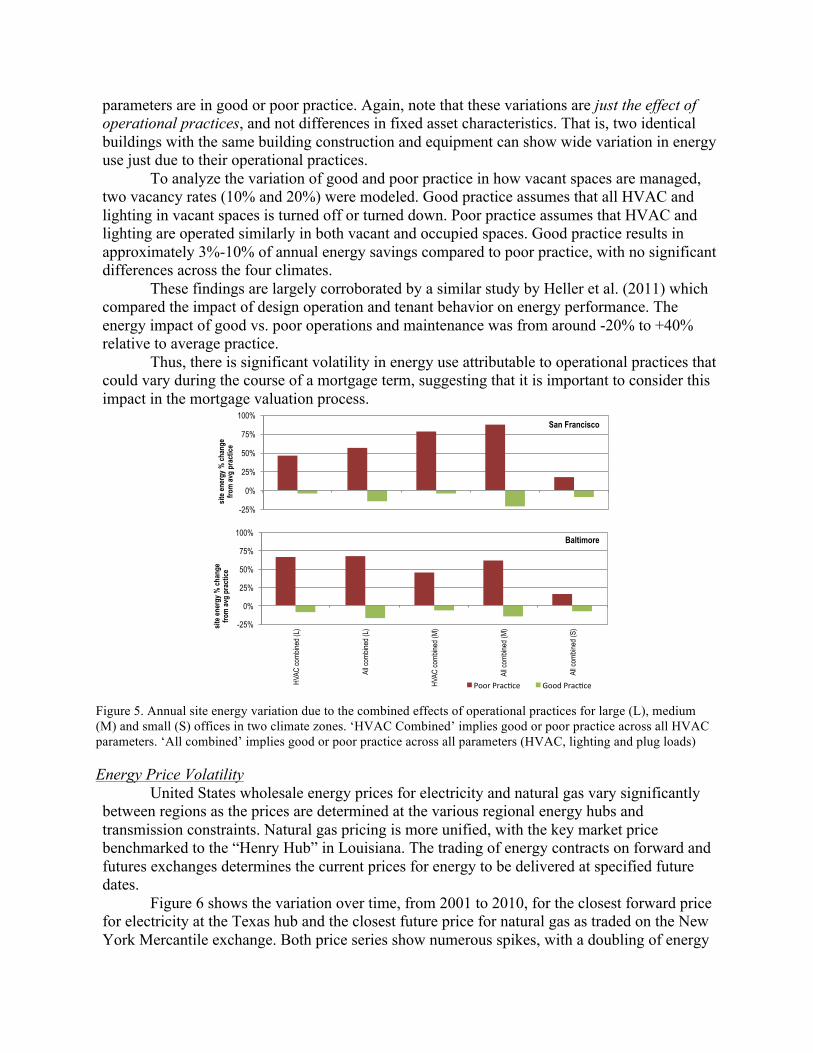
between regions as the prices are determined at the various regional energy hubs and transmission constraints. Natural gas pricing is more unified, with the key market price benchmarked to the “Henry Hub” in Louisiana. The trading of energy contracts on forward and futures exchanges determines the current prices for energy to be delivered at specified future dates.
Figure 6 shows the variation over time, from 2001 to 2010, for the closest forward price for electricity at the Texas hub and the closest future price for natural gas as traded on the New York Mercantile exchange. Both price series show numerous spikes, with a doubling of energy
-25%
0%
25%
50%
75%
100%
site
ene
rgy
% c
hang
e fr
om a
vg p
ract
ice
San Francisco
-25%
0%
25%
50%
75%
100%
HVAC
com
bined
(L)
All c
ombin
ed (L
)
HVAC
com
bined
(M)
All c
ombin
ed (M
)
All c
ombin
ed (S
) site
ene
rgy
% c
hang
e fr
om a
vg p
ract
ice
Baltimore
PoorPrac'ce GoodPrac'ce
costs over relatively short periods quite common and increases of 400 percent over the previous trough not unprecedented. Energy prices for both electricity and natural gas have been highly volatile, and there is every reason to expect this volatility to continue in the future.
Even though energy markets are regulated and most buildings do not pay the wholesale prices for power and natural gas, the wholesale markets reflect the true resource costs of energy consumption. These cost are incorporated, in time, into the retail rate schedules offered by regulated utility companies. In addition, many real estate operating companies are now purchasing their electricity from the wholesale market, as do some counties.
Because market dynamics will impact commercial office building costs, the resource signals from these markets should be of concern to mortgage lenders who bear the residual default risk associated with the energy cost exposure of borrowers. Surprisingly, traditional commercial underwriting processes do not account for the mortgage default risk that is created by highly volatile energy prices. Similarly, it is uncommon for lenders to vary the mortgage contract terms based on the energy efficiency of each specific building. Less efficient buildings are at higher risk because their higher consumption amplifies the price impact.
Figure 6. Nearest Contract Price for the ERCOT Electricity Forward Contracts and Henry Hub National Gas Futures Contracts. Source: http://www.ercot.com/
Impact on Valuation Jaffee et al. (2011) conducted a simulation in order to determine the range of basis
points (bps) that lenders might adjust as a result of energy price risk, holding other loan factors constant. Incorporating energy risks into commercial mortgage valuations requires four distinct steps: (1) a method to link the level and volatility of electricity and gas prices to the NOI dynamics of buildings, (2) estimation of property values, (3) estimation of the mortgage default hazard function as a function of NOI and property price dynamics, and (4) Monte Carlo simulations to determine mortgage value (Issler, et al. 2015), as summarized below:
Specification of dynamic stochastic equations The model that incorporates energy risks into commercial mortgage valuations requires
three sets of dynamic stochastic equations: 1. Fitting forecasting models for the forward and future prices for natural gas and electricity
from market data. An alternative methodology could use data obtained from the appropriate utility district tariffs for electricity and natural gas.
2. Fitting a term structure model for forecasting interest rates.
3. Fitting a forecast model for the net operating income of properties as a function of rents and total operating costs (including natural gas costs, electricity costs, and other costs). The interest rate process was estimated by applying a Hull-White process, a standard
Geometric Brownian Motion (G.B.M.) process was applied to fit the dynamic process determining property rents, and standard industry models for forecasting the electricity futures and natural gas forwards were applied (Clewland and Strickland 1999; 2000; Schwartz, 1997). The rental income, however, is unique for each property, and thus the initial value of the rental income and the ensuing trend must be calibrated for each property. This is achieved by calibrating the parameters of the rental income process such that property’s initial simulated value matches the actual initial value.
Estimation of mortgage default hazard Following standard mortgage-valuation practice, the default hazard for a mortgage is
estimated using a time-varying-covariate hazard model with a log-logistic baseline hazard. The estimated hazard rate is the conditional probability that a mortgage will terminate at a specific time given that it has survived until that time. Mortgage termination was defined as equivalent to 90 days delinquent in payments. The proportional hazard model was estimated using a sample of 8,497 loans on commercial office buildings that were originated between 2004 and 2007, obtained from Trepp LLC loan-level performance data. The key determinants of default are (a) the spread between the mortgage rate and the 10-year Treasury rate, and (b) the property value relative to the mortgage balance.
Estimation of property values A property valuation is required at each possible future date because, as just noted, the
property valuation relative to the mortgage balance is a key determinant of mortgage default. In principle, this could be incorporated within the Monte Carlo simulation, but this is computationally infeasible. Instead, following Boudoukh et al. (1997) a property value equation was applied based principally on the property’s net operating income, the current level of interest rates, and the level of energy costs. The estimation was carried out using a data set that merged the CoStar data on building attributes with the Trepp LLC mortgage data.
Monte Carlo Simulations to determine the mortgage value The final stage is to carry out Monte Carlo simulations in which each simulated path is
based on stochastic draws from the distributions for electricity and natural gas prices, the interest rate, the rental income outcome, and mortgage default based on the estimated hazard equation. For each simulated path, the mortgage value at the initial date is the present value of all payments made on the mortgage. The final mortgage valuation is then computed as the probability weighted average of the mortgage valuations across the simulated paths.
The Impact: A Loan Value Application A full application of the methodology was carried out by computing mortgage
valuations for all the loans that were originated in September 2004 and were included in the Trepp LLC data set. The inclusion of the energy channels generates mortgage values that are on average about 8.9% below the value of the mortgages using the traditional modeling approach (which ignores the energy channel in valuing the embedded default options).
On average, the lenders would have had to charge about 18.8 basis points to assure that the market price of the loan with the embedded default options was valued at the same amount that was dispersed to the borrower in principal. In other words, if the energy price volatility was properly valued, the interest rate should have been higher by 18.8 basis points. Of course, this conclusion assumes that the loan contract terms would remain the same. A more likely outcome
would be that lenders, once they account for the dynamics of interest rates, rents, and energy using a full valuation framework, would instead alter the original loan terms, particularly the loan-to-value ratio, such that the loan would price to par.
Recent research has shown that it is not unusual to see 10-20% savings in energy consumption in some buildings just from building commissioning (Mills 2009). Accordingly, the study analyzed the impact of reducing the benchmarked electricity and natural gas consumption of each building by 20% and then re-estimating the value of the mortgage on the more efficient, but otherwise, equivalent building. The value of the mortgages on these buildings is now, on average, about 1.3% higher. The size of these elasticities varies importantly across buildings, mortgage contract structures, and regions. Overall, the reductions in energy consumption appear to benefit more the higher loan-to-value ratio mortgages and larger buildings. This result, admittedly based on a very small sample, suggests that energy efficiency should affect the mortgage cost of capital.
Looking Ahead: Potential Interventions
The exploratory analyses presented above suggest that energy factors can, at least in certain contexts, have a notable impact on mortgage valuation. This is corroborated by other studies that have examined the relationship between energy and sustainability features and asset value, as noted earlier (DOE 2015). For example, An and Pivo (2015) showed that Energy Star-labeled and LEED-certified properties have a lower default rate. Eicholtz et al. (2015) show that the mortgage spread for LEED-certified properties is 35-36 bps lower than that of non-certified properties and that the spread increases as certification levels increase.
The explicit and carefully considered inclusion of energy factors in mortgage valuation can have two benefits: it improves risk management for lenders while also providing a more accurate price signal for energy efficiency in commercial properties. A recent scoping effort sponsored by the U.S. DOE sought to characterize the opportunity, barriers and potential interventions. The scoping effort included a literature review and extensive stakeholder discussions with 40 lenders, owners, service providers, advocacy organizations and others (Mathew et al. 2016). While a full description of the findings is beyond the scope of this paper, highlights are presented below.
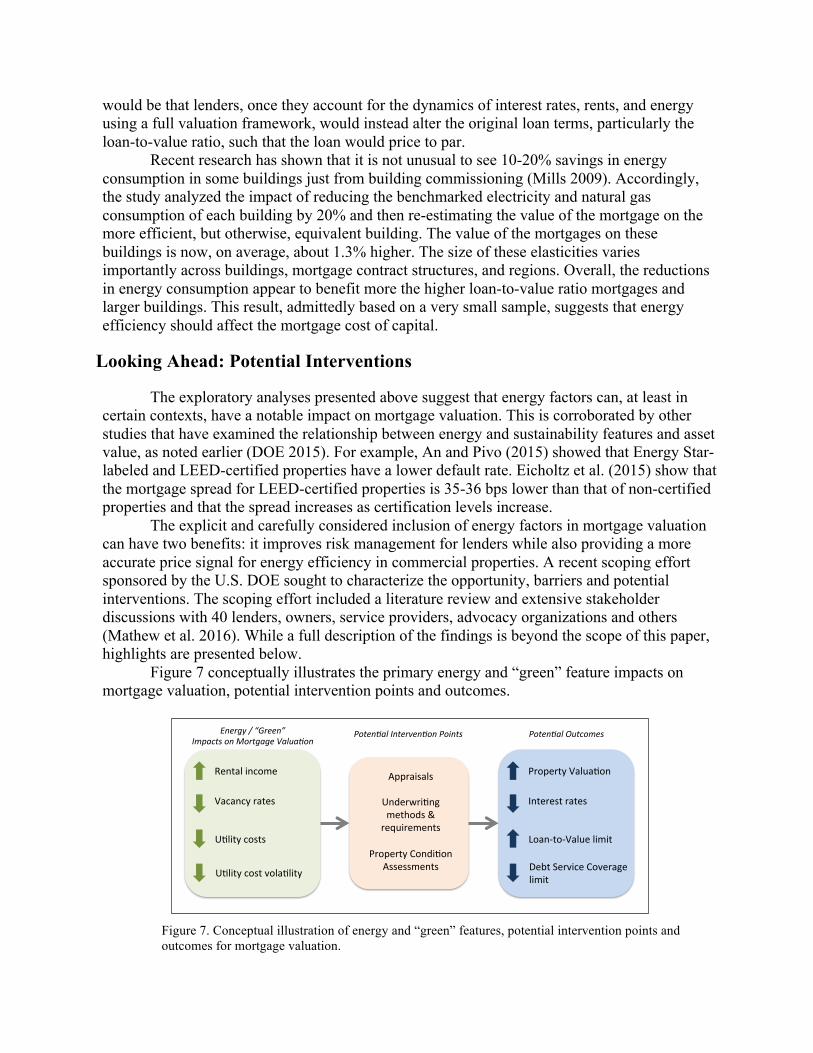
Figure 7 conceptually illustrates the primary energy and “green” feature impacts on mortgage valuation, potential intervention points and outcomes.
Figure 7. Conceptual illustration of energy and “green” features, potential intervention points and outcomes for mortgage valuation.
Rentalincome
Vacancyrates
U1litycostvola1lity
U1litycosts
Energy/“Green”ImpactsonMortgageValua8on
Appraisals
Underwri1ngmethods&requirements
PropertyCondi1on
Assessments
Poten8alInterven8onPoints
PropertyValua1on
Interestrates
DebtServiceCoveragelimit
Loan-to-Valuelimit
Poten8alOutcomes
Appraisals. There have already been some efforts to get appraisers to consider energy factors in the mortgage valuation process. For example, the Appraisal Institute has developed a “green addendum” form to characterize energy efficiency and sustainability features in an appraisal report. There are also awareness and training efforts underway. All these are still fairly incipient efforts and it is too early to assess their impact. Two significant limitations are the lack of empirical data linking specific energy-related features to asset value, and the lack of demand from customers for qualified appraisers. Mills (2015) documents a range of barriers and opportunities pertaining to energy and appraisals.
Underwriting. It appears that there have been few if any efforts to address the underwriting process. While the underwriting process may implicitly consider energy factors via the NOI term, stakeholder discussions showed that underwriters have very little appreciation of the range and magnitude of energy impacts on NOI and risk management. There are two potential interventions to address this:
• Show underwriters how energy factors “move the needle” on NOI, how this varies for different market segments, and where current methods for calculating the energy term in NOI fall short.
• Develop simple and replicable underwriting requirements and methods for energy factors. For example, the use of Value-at-Risk (VAR) to characterize energy-related risks (Jackson 2010). Since energy factors are not currently a primary consideration for lenders, these methods and requirements should integrate into existing processes with minimal disruption. Property Condition Assessment (PCA). Lenders routinely require a PCA for a mortgage
loan. The PCA is usually conducted by an engineering firm and is essentially a technical assessment of the building. It is used primarily for two purposes: a) to determine requirements for a reserve fund for the property e.g. for a boiler replacement; and b) to identify any critical issues that would negate the mortgage application, e.g. structural issues. The PCA rarely if ever includes an assessment of the energy efficiency and sustainability attributes of a property. However, if PCAs included investment-grade information on these aspects, they could be used to fund energy efficiency improvements through the mortgage loan. One current limitation is that PCAs are typically conducted later in the process, only after the basic mortgage terms (size, interest rate, term, etc.) have already been set. In order for this intervention to be truly effective, PCAs would need to be conducted earlier in the underwriting process.
These interventions presented above are technically feasible, could have significant impact as illustrated in the earlier sections, with benefits to lenders and owners. However, it is also true that the nature of the mortgage lending process – with multiple stakeholders, high stakes and risk aversion – does not lend itself easily to changes. Therefore, these interventions will need to be piloted carefully and modestly with highly motivated early adopters. Wider deployment will likely require aggressive education/awareness efforts and stakeholder engagement and support through organizations such as the Mortgage Bankers Association and the American Bankers Association.
References
Akerlof, George. 1970. “The Market for "Lemons: Quality Uncertainty and the Market Mechanism,” The Quarterly Journal of Economics, Vol. 84, No. 3, 1970, pp. 488-500.
An, X., Pivo, G. 2015. Default Risk of Securitized Commercial Mortgages: Do Sustainability Property Features Matter? 2015 Real Estate Research Institute (RERI) Research Conference,
April 30, 2015. ARGUS 2015. ARGUS Enterprise 11, Certification Training Manual. 2015. Boudoukh, J., M. Richardson, R. Stanton, R. F. Whitelaw. 1997. Pricing mortgage-backed
securities in a multifactor interest rate environment: A multifactor density estimation approach, Review of Financial Studies 10, 405-446.
Clewlow, L., C. Strickland. 1999. Valuing energy options in a one factor model fitted to forward prices, Working paper 10, Quantitative Finance Research Center, University of Technology, Sydney.
Clewlow, L., . C. Strickland. 2000. Energy Derivatives: Pricing and Risk Management (Lacima Group, London, England).
DOE 2015. Energy Efficiency and Financial Performance: A review of Studies in the Market. U.S. Department of Energy. http://betterbuildingssolutioncenter.energy.gov/. Accessed March 2016.
Devine, N. Kok. Green Certification and Building Performance: Implications for Tangibles and Intangibles. Journal of Portfolio Management, Special Real Estate Issue, 2015.
Eichholtz, P., N. Kok, R. Holtermans, E. Yonder. 2015. “Environmental Performance and the Cost of Capital: Evidence from Commercial Mortgages and REIT Bonds.” Working paper.
Heller, J., Heater, M., Frankel, M. 2001. Sensitivity Analysis: Comparing the Impact of Design, Operation, and Tenant Behavior on Building Energy Performance. White Paper. New Buildings Institute. July 2011.
IMT 2016. Green Building and Property Value. Institute for Market Transformation. http://www.imt.org/finance-and-real-estate/green-building-and-value. Accessed March 2016.
Issler, P., J. Daffee, R. Stanton, .N. Wallace. 2015. “Energy Efficiency and Commercial-Mortgage Valuation,” Working paper the Haas School of Business, 2015.
Jackson, J. 2010. Promoting energy efficiency investments with risk management decision tools. Energy Policy 38 (2010) 3865–3873
Jaffee, D., Stanton, R., Wallace, N. 2011. Energy Efficiency and Commercial-Mortgage Valuation. University of California Berkeley.
Mathew P., P. Coleman, N. Wallace, P. Issler, L. Kolstad, R. Sahadi. 2016. Energy Factors in Commercial Mortgages: Gaps and Opportunities. Technical Report. Lawrence Berkeley National Laboratory. May 2016.
Mathew, P., X. Pang, L. 2012. Wang, Determining Energy Use Volatility for Commercial Mortgage Valuation, 2012. Lawrence Berkeley National Laboratory.
Mills, E. 2015. Looking For Value in All The Wrong Places. Toward Expanded Consideration of Green and Higher Performance Attributes in Non-residential Property Appraisals in the United States. Lawrence Berkeley National Laboratory. LBNL-1003828.
Mills, E. 2009. "Building Commissioning: A Golden Opportunity for Reducing Energy Costs and Greenhouse-gas Emissions". Lawrence Berkeley National Laboratory. http://cx.lbl.gov/2009-assessment.html. Accessed March 2016.
Schwartz, E. S., 1997. The stochastic behavior of commodity prices: Implications for valuation and hedging, Journal of Finance 52, 923-973.
Schwartz, E. S., . W. N. Torous. 1989. Prepayment and the valuation of mortgage-backed securities, Journal of Finance 44, 375-392.
Wang, L., Mathew, P., Pang, X. 2012. “Uncertainties in Energy Consumption Introduced by Building Operations and Weather for a Medium-Size Office Building.” Energy and Buildings 53 (2012) 152–158.