commercial scale slurry bubble column reactor optimization€¦ · commercial scale slurry bubble...
TRANSCRIPT
Commercial scale slurry bubble column reactor optimization
W. Strasser & A. Wonders Eastman Chemical Company, USA
Abstract
An in-depth numerical study has been carried out to investigate a high-pressure commercial scale (2–8 meter diameter) slurry bubble column reactor (SBCR). Typical superficial gas velocities are in the range of 0.5–3 m/s, and overall vapor hold-ups are in the range of 0.45–0.85. The study revealed that steady compartmental reaction models do not match plant data when reaction time constants are very fast. Also, off-the-shelf commercial CFD codes do not produce useful information about a reactive column of this scale and aeration without tuning to reconcile with vapor hold-up and reactant operating data “anchors” from in-plant units. Important measures include both transient and time-averaged profiles, integrals, and extrema of vapor hold-up and reactants. The present study proposes reactor designs that improve productivity and product quality. Keywords: oxidation, staging, chaos, turbulence, pX, TPA.
1 Introduction
The liquid-phase partial oxidation of para-xylene (pX) to terephthalic acid (TPA) is conducted on a very large commercial scale (agitated vessels and bubble columns), principally for providing raw material for polyester fiber and packaging products. Huge oxidation reactors provide individual capacities presently ranging from 1,500 to 3,000 metric tons per day (TPD) of TPA for new construction. Although the partial oxidation of pX to TPA proceeds at very high yields and purities, further small improvements have a significant impact due to scale. The overall stoichiometry of TPA production is deceptively simple, as shown in equation (1).
OHTPAOpX 22 23 +=+ (1)
© 2008 WIT PressWIT Transactions on Engineering Sciences, Vol 59, www.witpress.com, ISSN 1743-3533 (on-line)
Advances in Fluid Mechanics VII 275
doi:10.2495/AFM080271
Behind the seemingly simple overall reaction equation, there are at least four principle reaction steps; and each of those steps typically involves several elementary reaction sub-steps. In fact, the principal intermediates can even be reached by competing, alternative reaction pathways. In addition, there are literally hundreds of impurities formed at low to extremely low rates. Some of these impurities relate to impurities in the pX feedstock, and some derive from pX itself. The various impurities affect the TPA product’s fitness for use differently, but some impurities are important at concentrations as low as 1 PPM by weight. Some of the particularly noxious impurities involve two or more aromatic rings coupled together. Broadly speaking these undesirable reactions are suppressed by higher concentrations of dissolved oxygen and are promoted by higher concentrations of dissolved aromatic species. To elevate the concentration of dissolved oxygen, it is desirable to maximize aeration of the reaction medium, promoting mass transfer from gas to liquid phase. Notably, the reaction proceeds with such intensity that the average survival time of an oxygen molecule after dissolving is a very few seconds. Thus, the local concentration of oxygen in the gas phase varies greatly depending upon the agitation and location of gas feeding; and the concentration of dissolved oxygen involves a competition between dissolution rate and chemical demand. Similarly, the local concentration of pX will vary according to agitation and the location of pX addition. To lower the peak concentration of dissolved aromatics it is desirable to mix off the feed plume of pX quickly. However, the interplay of dissolved oxygen and dissolved aromatic is very complex. Different aromatic intermediate species react at different rates and with different stability while “searching” for an oxygen molecule. Important interactions exist when optimizing local oxygen and local aromatic concentrations. As a result, one of the goals in improving upon this rich, well-established method of making TPA is to optimize methods of gas and liquid feeding. A disclosure of the current invention can be found in US Patent Application # 20060116531. Although the experimental and computational work for bubble columns has historically been fruitful, nothing exists for the conditions of the present work: • High pressure (0.2 – 3 megapascal gauge), and • High superficial gas velocity and holdup (0.5 – 3 m/s, 0.45 to 0.85), and • High solids content (8% – 45% of the total slurry weight), and • Strong evaporation (>30% of the gas fed by mass at operating temperatures
as high as 250°C), and • Large diameter (2 – 8 meters), and • Fast reaction kinetics (pseudo half-lives of some species under 10 seconds). The most recent work that comes near the conditions in the present work is that of Nottenkamper et al. [1] with superficial velocities approaching 1.5 m/s in a 1.0 meter diameter column at atmospheric pressure. They showed liquid centreline velocities near 2.0 m/s, with centreline hold-ups approaching 0.8. They found near-linear positively-sloped axial hold-up profiles, with the slope staying about the same (excluding the bottom transition region) with increasing superficial velocity. A near-linear hydrostatic pressure profile resulted from all
© 2008 WIT PressWIT Transactions on Engineering Sciences, Vol 59, www.witpress.com, ISSN 1743-3533 (on-line)
276 Advances in Fluid Mechanics VII
the column chaos. Since it is known that pressure strongly affects bubble size population (Letzel et al. [2] and many others), and since the other evaporative, chemical, and solids issues are removed, the results of this study can only be used as a guide. Other works will be discussed where pertinent in the upcoming discussions.
2 Method
2.1 Physics
Numerical methods for investing bubble columns have been a subject of intense study for years. An axial dispersion approach is employed by Xie and Li [3] to study pX oxidation. A 151-page review of various numerical approaches was given by Rafique et al. [4] in 2004. It was found through internal evaluations at Eastman Chemical Company that axial dispersion and compartmental approaches do not produce chemical species profiles for pX oxidation like those actually measured in a commercial scale unit. The results of a steady compartmental model (with the average of local fluctuations superimposed onto the mean) are superior to an axial dispersion model but still apparently distort the transient effects of correlated hydrodynamics and chemistry. As a result, a fully transient 3-D hydro-kinetic Eulerian-Eulerian three-phase CFD approach is sought. Each phase is allowed separate velocity, turbulence, thermal, and chemical fields, but share a common pressure. The liquid is assumed to be everywhere continuous, while the compressible gas and solid phases are assumed to be everywhere dispersed. Every computational cell is given some amount of all three phases. Continuity for phase α
0=∂
∂+
∂∂
j
j
xur
tr ααααα ρρ (2)
The Reynolds averaged linear momentum balance in Cartesian coordinates for a compressible phase α is shown in equation (3) after invoking the Stokes assumption.
=∂
∂+
∂∂
j
jii
xuur
tur ααααααα ρρ
−
∂∂
−∂
∂+
∂∂
∂∂ ''
32
jik
kij
i
j
j
i
j
uuxu
xu
xur
x αααααα
αα ρδµ (3)
( ) iiirefi
MSgrxpr ααααα ρρ ++−+
∂∂
−
© 2008 WIT PressWIT Transactions on Engineering Sciences, Vol 59, www.witpress.com, ISSN 1743-3533 (on-line)
Advances in Fluid Mechanics VII 277
Of course the liquid phase and solid phases are incompressible, so the div (normal stress) term drops out of the right hand side of equation (3) for these. Sαi involves momentum sources due to evaporation and condensation, while Mαi includes interfacial forces (drag and non-drag). The shear stress transport (SST) two-equation linear eddy viscosity model of Menter [5] is used for computing the Reynolds stress terms for the continuous phase. This model involves a smooth blend between the standard k-ε model of Launder and Spalding [6] in the freestream and the k-ω model of Wilcox [7] near the wall. In the SST model, additional consideration is given to the transport of the principal turbulent shear stress via 1) an eddy viscosity limiting function and 2) a cross diffusion term in the transport equation for ω. Also, there is a turbulence production limiter, as discussed in [8], preventing the artificial build-up of fluctuating velocity in regions of irrotational strain. The local eddy viscosities of the dispersed phases are functions of the eddy viscosity of the continuous phase. “Scalable” wall functions, discussed in [8], are an alternative to standard wall functions of Launder and Spalding [6]. They have the advantage of being less sensitive to variation in near-wall grid resolution throughout the domain. The distance from the wall is computed via a Poisson equation with a uniform source value of -1. Additional compressibility effects and buoyancy-driven turbulence have been neglected in the present work. As with most Reynolds averaged turbulence models, the boundary layers are considered everywhere turbulent. The profiles in the near-wall region are topics of current debate. For example, Vitankar et al. [9] discusses boundary layer thinning by increased turbulence in two-phase flow, so there is not an obvious answer to the near-wall approach that is best. More complete discussions of turbulence models, advantages, and caveats are available in Pope [10]. It is well-known that eddy-viscosity turbulence computations are limited. For the purposes of industrial bubble column design optimization, it was decided that the use of a linear two-equation model for the liquid phase and a zero-equation model for the dispersed phases was an adequate starting point. As will be discussed in an upcoming section, the momentum balance (obviously includes phasic turbulence) is a result of many forces. It is the tuning of these to match experimental information that is the key. The results shown here represent a very small subset of the actual design work; time did not permit the use of a Reynolds stress model and certainly not a large eddy simulation approach. The phasic chemical species balance is shown in equation (4):
φα
α
α
αφααα
ααααααα φµρ
φρφρ RxSc
Drxx
urt
r
jt
t
jj
j +
∂∂
+
∂∂
=∂
∂+
∂∂
,
, (4)
The gradient diffusion hypothesis has already been involved to separate out the molecular and turbulent diffusive effects on the right-hand-side. Rα
Φ is simply the reactive species volumetric source terms for species Φ in phase α. The basis for Rα
Φ is equation (1) plus enough competing, parallel reactions and species to account for the preponderance of oxidant consumption. When viscous heating
© 2008 WIT PressWIT Transactions on Engineering Sciences, Vol 59, www.witpress.com, ISSN 1743-3533 (on-line)
278 Advances in Fluid Mechanics VII
and compression work are ignored, the phasic energy equation looks very similar to equation (4) with the appropriate substitutions. Extremely large bulk evaporation rates are handled through appropriate sources and sinks shown above.
2.2 Drag, bubble size, and other forces
The momentum balance (holdup, backmixing, and velocity profiles) is directly related to a joint effect of drag coefficient (including swarm effects), bubble size distribution, bubble induced turbulence, turbulent dispersion, turbulence stress closure, and other non-drag forces such as lift and virtual mass. A given balance can be achieved from various combinations of these. Some of the most recent bubble swarm drag relationship work is given by Simonnet et al. [11], but deals with a situation unlike that of the current work. It is valid for atmospheric pressure, air/water, a maximum bubble diameter of 10 mm, and local void fractions less than 30%. A recent study of turbulence closure and interfacial forces is carried out by Zhang et al. [12]. They propose combinations of methods that produce more realistic validations, but all for homogenous flow. A new interfacial area transport equation has recently proposed by Ishii [13]. Interactions between the phases typically include bubble induced turbulence (Sato and Sekoguchi [16]) and turbulent dispersion (Lopez de Bertodano [17]). For further reference, Strasser [18] offers a study of turbulence interactions between continuous and dispersed phases. Commercial implementations of bubble population balance models for CFX and FLUENT are discussed in Olmos et al [14] and Chen et al. [15], respectively; however, application to pX oxidation proved ineffective at matching experimental hold-up and velocity distributions and pressure fluctuations. Therefore, the authors have developed a novel population balance method for realistic industrial pX oxidation conditions. Without matching experimental hydrodynamic information, there is little hope of ascertaining the overall operating quality of various design configurations. The particular choices of models and coefficients have not been disclosed for the present work due to the proprietary and unique nature of the liquid-phase oxidization at these conditions.
2.3 Solver
The ANSYS CFX Release 10 solver (details and individual references found in [8]) discretizes equations (2)–(4) using a vertex-based finite volume method. Each term is converted to mesh element volume integrals and element surface integrals. Advection terms are discretized using a high resolution algorithm similar to that of Barth and Jesperson. Time derivatives are discretized using a second-order transient scheme. Mass flows are discretized using a Rhie-Chow approach, modified by Majumdar, to avoid pressure decoupling on the co-located grid. The mass flow discretization also involves a Newton-Raphson linearization to handle compressibility effects. Viscous stresses, diffusion terms, and the pressure gradient are discretized using finite element shape functions, whose construction depends on the mesh element type. The solution algorithm is
© 2008 WIT PressWIT Transactions on Engineering Sciences, Vol 59, www.witpress.com, ISSN 1743-3533 (on-line)
Advances in Fluid Mechanics VII 279
fully implicit, with velocity and pressure coupled together in the same matrix. The resulting system of equations is solved using a coupled ILU algebraic multigrid technique.
2.4 Mesh
The computational mesh, involving prisms, tetrahedra, hexahedra, and pyramids, was built in Gambit and TGRID from Fluent, Inc. with the intent to balance computational load and accuracy. The smallest grid lengths scales were near the various feeds, such as the gas sparger holes. The expansion (in all three dimensions) of cells away from the feeds to areas with lesser gradients was carried out in such a way as to minimize cell aspect ratios, centroid shifts, and skewness. A “superblock” technique is used to ensure the cells at block boundaries (including boundary layer blocks) meet each other with nearly uniform mesh spacing. More on these concepts can be found in the transonic gas turbine blade passage research of Strasser et al. [19]. Also, the effects of gridding methods on the computational results are explored in Strasser [20]. Typical total cell counts ranged from 100,000 to 1,000,000 cells, depending on the complexity of the feeds. The particular cell length scales chosen for this work were arrived at through successive meshing numerical tests. The first grid built was referred to as 1X, and tests were performed to compare 1X, 2X, 4X, and 8X grids. It was found that increased resolution beyond 4X did not change the time-averaged radial velocity and gas hold-up profiles, so the 4X approach was employed for the model results shown in this work.
2.5 Convergence
The final mesh is partitioned to run on 8 to 16 CPUs. After months of tuning the model to match reality anchors for a particular geometry and set of operational conditions, a quasi-steady solution is sought. The model is then run typically 100 seconds of bubble column churn time, requiring two to four weeks of CPU time. The timestep and number of inner loops is chosen such that mass, energy, and chemical species mass imbalances are far less than 1%.
3 Results
3.1 Hydrodynamics
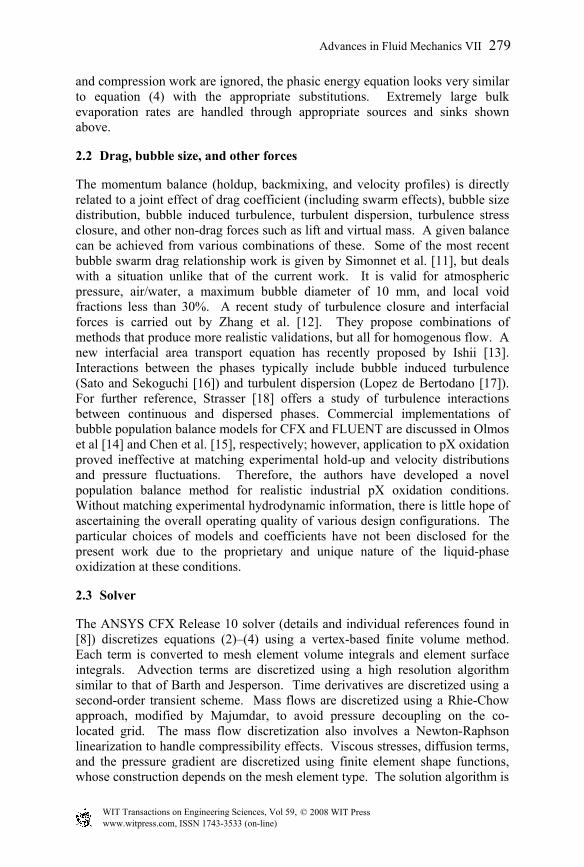
With superficial velocities in the range of 0.5 to 3 m/s, this column operates in well into the heterogeneous flow regime. At this high of a superficial velocity, Nedeltchev et al. [21] proposes a “coalesced bubble regime (3-region flow)”. These 3 regions are central plume, vortical region, and descending region. The structures meander laterally and circumferentially, in both space and time. Figure 1 shows some un-related instantaneous views on a column mid-plane from one design of the present work. These are “partial” renderings in that they do not represent the entire height of the column. The colour represents low gas volume fraction (blue) to high gas volume fractions (red), while the black arrows
© 2008 WIT PressWIT Transactions on Engineering Sciences, Vol 59, www.witpress.com, ISSN 1743-3533 (on-line)
280 Advances in Fluid Mechanics VII
are liquid velocity vectors on that cutting plane. The ranges are purposely not disclosed, but it can be said that the gas volume fraction far exceeds 0.5, while the liquid velocity far exceeds 1m/s. The locations that show no vectors imply that the flow is aimed into the page and the likelihood of helical motion. It can be seen that, on average, there is no time-averaged flow present.
Figure 1: Instantaneous mid-plane volume fraction and liquid velocity vectors.
The flow is violent, sometimes moving up/down, radially inward/outward, and into/out of the page. The phase distribution gets slightly more uniform moving up the column, but, in general, a transition height is difficult to detect. The most unique aspect of the present work is not just the presentation of colourful pictures, but the fact that the radial and axial gas hold-up profiles have been compared and matched to experimental data from the same column in full, heated operation. Along with radial and axial hold-up profiles, CFD pressure pulses at the lower tangent line have been matched to experimental values in terms of both magnitude and frequency.
3.2 Hydro-kinetics
Key reactant concentration samples from various elevations in the numerical column have been compared to plant operating values. There was acceptable agreement for both the average concentration and temporal variation. Local
© 2008 WIT PressWIT Transactions on Engineering Sciences, Vol 59, www.witpress.com, ISSN 1743-3533 (on-line)
Advances in Fluid Mechanics VII 281
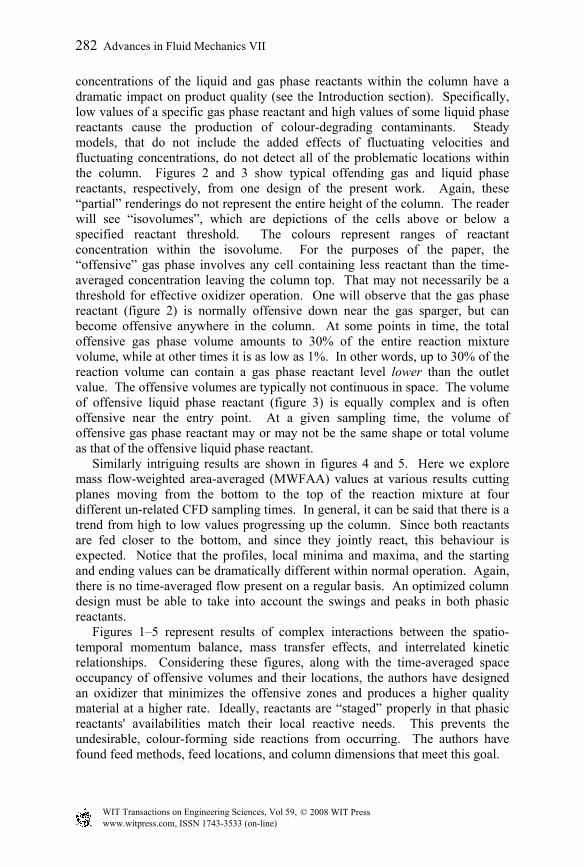
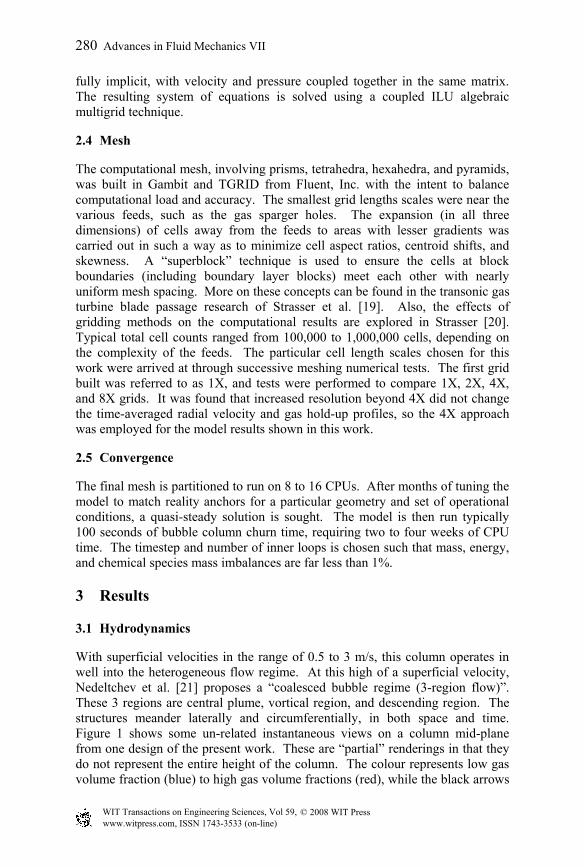
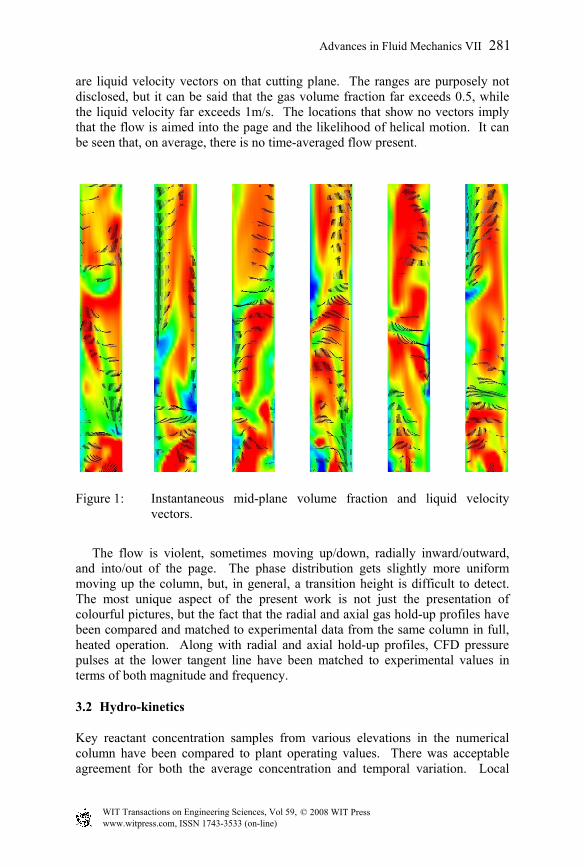
concentrations of the liquid and gas phase reactants within the column have a dramatic impact on product quality (see the Introduction section). Specifically, low values of a specific gas phase reactant and high values of some liquid phase reactants cause the production of colour-degrading contaminants. Steady models, that do not include the added effects of fluctuating velocities and fluctuating concentrations, do not detect all of the problematic locations within the column. Figures 2 and 3 show typical offending gas and liquid phase reactants, respectively, from one design of the present work. Again, these “partial” renderings do not represent the entire height of the column. The reader will see “isovolumes”, which are depictions of the cells above or below a specified reactant threshold. The colours represent ranges of reactant concentration within the isovolume. For the purposes of the paper, the “offensive” gas phase involves any cell containing less reactant than the time-averaged concentration leaving the column top. That may not necessarily be a threshold for effective oxidizer operation. One will observe that the gas phase reactant (figure 2) is normally offensive down near the gas sparger, but can become offensive anywhere in the column. At some points in time, the total offensive gas phase volume amounts to 30% of the entire reaction mixture volume, while at other times it is as low as 1%. In other words, up to 30% of the reaction volume can contain a gas phase reactant level lower than the outlet value. The offensive volumes are typically not continuous in space. The volume of offensive liquid phase reactant (figure 3) is equally complex and is often offensive near the entry point. At a given sampling time, the volume of offensive gas phase reactant may or may not be the same shape or total volume as that of the offensive liquid phase reactant. Similarly intriguing results are shown in figures 4 and 5. Here we explore mass flow-weighted area-averaged (MWFAA) values at various results cutting planes moving from the bottom to the top of the reaction mixture at four different un-related CFD sampling times. In general, it can be said that there is a trend from high to low values progressing up the column. Since both reactants are fed closer to the bottom, and since they jointly react, this behaviour is expected. Notice that the profiles, local minima and maxima, and the starting and ending values can be dramatically different within normal operation. Again, there is no time-averaged flow present on a regular basis. An optimized column design must be able to take into account the swings and peaks in both phasic reactants. Figures 1–5 represent results of complex interactions between the spatio-temporal momentum balance, mass transfer effects, and interrelated kinetic relationships. Considering these figures, along with the time-averaged space occupancy of offensive volumes and their locations, the authors have designed an oxidizer that minimizes the offensive zones and produces a higher quality material at a higher rate. Ideally, reactants are “staged” properly in that phasic reactants' availabilities match their local reactive needs. This prevents the undesirable, colour-forming side reactions from occurring. The authors have found feed methods, feed locations, and column dimensions that meet this goal.
© 2008 WIT PressWIT Transactions on Engineering Sciences, Vol 59, www.witpress.com, ISSN 1743-3533 (on-line)
282 Advances in Fluid Mechanics VII

Figure 2: Partial renderings of instantaneous 3-D isovolumes of material having a gas phase reactant concentration less than the time-averaged outlet value.
Figure 3: Partial renderings of instantaneous 3-D isovolumes of material having a liquid phase reactant above a critical value.
© 2008 WIT PressWIT Transactions on Engineering Sciences, Vol 59, www.witpress.com, ISSN 1743-3533 (on-line)
Advances in Fluid Mechanics VII 283

-0.5
0.5
1.5
2.5
3.5
4.5
0.0 0.1 0.2 0.3 0.4 0.5 0.6 0.7 0.8 0.9 1.0Height
Liqu
id R
eact
ant C
once
ntra
tion
t1 t2 t3 t4
Figure 4: Planar MFWAA liquid reactant concentration versus normalized reaction mixture height for four random CFD time samplings.
-0.1
0.1
0.3
0.5
0.7
0.9
0.0 0.1 0.2 0.3 0.4 0.5 0.6 0.7 0.8 0.9 1.0Height
Gas
Rea
ctan
t Con
cent
ratio
n
t1 t2 t3 t4
Figure 5: Planar MFWAA gas reactant concentration versus normalized reaction mixture height for four random CFD time samplings.
© 2008 WIT PressWIT Transactions on Engineering Sciences, Vol 59, www.witpress.com, ISSN 1743-3533 (on-line)
284 Advances in Fluid Mechanics VII

4 Conclusions
It was desired to study complex, coupled hydro-kinetics within a slurry bubble column at highly aerated, high pressure conditions. Steady 3-D compartmental models were shown in internal evaluations to miss the experimental results; therefore, a transient 3-D Eulerian-Eulerian Reynolds averaged approach was utilized. The various choices of models and bubble population approach were tuned with grid-independent solutions to match transient and time-averaged experimental information (hold-up, pressure fluctuation, and reactant concentrations). After tuning, various designs were considered in order to study methods of improved reactant feeding. The goal is to pair chemical availability with chemical reactivity for various species in each phase, locally throughout the column. Sample results were displayed for a particular design. Reactant concentrations that were above or below pre-determined thresholds were shown; these are responsible for off-quality material or the lowering of production rates. The shape and total volume of the offensive phase material were extremely variable (cumulative volume ranging from 1% to 30% of the total reaction volume) and were typically not continuous in space. Axial profiles of reactants were also shown, and proved that there was no apparent normal profile. The local maxima and minima shifted substantially in time. While time-averages are useful for making hydrodynamic CFD-experimental comparisons, fluctuating values of the chemical species in each phase are also considered in any optimized design.
Nomenclature
D Diffusivity g Gravity k Turbulence kinetic energy i-l Tensor summation indices M Momentum source term p Pressure r Volume fraction R Reaction source term S Source through mass exchange Sct Turbulence Schmidt number t Time u' Fluctuating velocity component x Spatial coordinate α Phase designation δ Kronecker Delta ε Turbulence dissipation rate Φ Chemical species ω Specific dissipation rate ρ Density µt Turbulent (or eddy) viscosity
© 2008 WIT PressWIT Transactions on Engineering Sciences, Vol 59, www.witpress.com, ISSN 1743-3533 (on-line)
Advances in Fluid Mechanics VII 285
References
[1] Nottenkamper, R., Steiff, A., and Weinspach, P., “Experimental investigation of hydrodynamics of bubble columns,” Ger. Chem. Eng., 6, pp. 147–155, 1983.
[2] Letzel, M., Schouten, J., van den Bleek, C. and Krishna, R., “Effect of gas density on large-bubble holdup in bubble column reactors,” AIChE Journal, 44, pp. 2333–2336, 1998.
[3] Xie, G. and Li, X., “An axial dispersion model for evaporating bubble column reactor,” Chinese J. Chem. Eng., 12, pp. 214–220, 2004.
[4] Rafique, M., Chen, P., and Dudukovic, M., “Computational Modeling of Gas-Liquid Flow in Bubble Columns,” 20, pp. 225–375, 2004.
[5] Menter, F.R., “Two-equation eddy-viscosity turbulence models for engineering applications”, AIAA-Journal, 32(8), pp. 1598–1605, 1994.
[6] Launder, B. E. and Spalding, D. B., Mathematical Models of Turbulence, Academic Press, 1972.
[7] Wilcox, D.C., “Multiscale model for turbulent flows”, In AIAA 24th Aerospace Sciences Meeting. American Institute of Aeronautics and Astronautics, 1986.
[8] ANSYS CFX Solver Documentation [9] Vitankar, V., Dhotre, M., and Joshi, J., “A Low Reynolds Number k-ε
Model For the Prediction of Flow Pattern and Pressure Drop in Bubble Column Reactors,” Chemical Engineering Science, 57, pp. 3235–3250, 2002.
[10] Pope, S., Turbulent Flows, Cambridge University Press, 2000. [11] Simonnet, M., Gentric, C., Olmos, E., and Midoux, N., “Experimental
Determination of the Drag Coefficient in a Swarm of Bubbles,” Chemical Engineering Science, 62, pp. 858–866, 2007.
[12] Zhang, D., Deen, N., and Kuipers, J., “Numerical Simulation of the Dynamic Flow Behavior in a Bubble Column: A Study of Closures for Turbulence and Interface Forces,” Chemical Engineering Science, 61, pp. 7593–7608, 2006.
[13] Ishii, M., “Two-fluid model based on interfacial area transport equation,” 5th International Conference on Multiphase Flow, Paper No. PL4, 2004
[14] Olmos, E., Gentric, C., Vial, C., Wild, G., and Midoux, N., “Numerical simulation of multiphase flow in bubble column reactors. Influence of bubble coalescence and break-up,” Chemical Engineering Science, 56, pp. 6359–6365, 2001.
[15] Chen, P., Sanyal, J., and Dudukovic, M., “Three dimensional simulation of bubble column flows with bubble coalescence and breakup,” AIChE Journal, 51, pp. 696–712, 2005.
[16] Sato, Y. and Sekoguchi, K., “Liquid Velocity Distribution in Two-Phase Bubbly Flow”, Int. J. Multiphase Flow, 2, p.79, 1975.
[17] Lopez de Bertodano, M., “Turbulent Bubbly Flow in a Triangular Duct”, Ph. D. Thesis, Rensselaer Polytechnic Institute, Troy New York, 1991.
© 2008 WIT PressWIT Transactions on Engineering Sciences, Vol 59, www.witpress.com, ISSN 1743-3533 (on-line)
286 Advances in Fluid Mechanics VII

[18] Strasser, W., “Discrete Particle Study of Turbulence Coupling in a Confined Jet Gas-Liquid Separator,” Journal of Fluids Engineering, Review in progress.
[19] Strasser, W., Feldman, G., Wilkins, C., and Leylek, J., “Transonic Passage Turbine Blade Tip Clearance with Scalloped Shroud: Part II – Losses with and without Scrubbing Effects in Engine Configuration,” ASME Paper No. IMECE2004-59116.
[20] Strasser, W., “CFD Investigation of Gear Pump Mixing Using Deforming/ Agglomerating Mesh,” Journal of Fluids Engineering, 129, pp. 476–484, 2007.
[21] Nedeltchev, S., Shaikh, A, and Al-Dahhan, M., “Flow regime identification in a bubble column base on both statistical and chaotic parameters applied to computed tomography data,” Chem. Eng. Technol., 29, pp. 1054–1060, 2006.
© 2008 WIT PressWIT Transactions on Engineering Sciences, Vol 59, www.witpress.com, ISSN 1743-3533 (on-line)
Advances in Fluid Mechanics VII 287