commercialization of food consumption in rural china
TRANSCRIPT

Economic Research Report Number 8
United States Department of Agriculture
Economic Research Service
Fred Gale, Ping Tang, Xianhong Bai, and Huijun Xu
ElectronicReport
Commercialization of Food Consumption in Rural China
ww
w.er
s.usda.gov
Want to learn more about China? Visit our website at www.ers.usda.gov.
You can also find additional information about ERS publications, databases, and other products at our website.
Visit Our Website To Learn More!
National Agricultural LibraryCataloging Record:
The U.S. Department of Agriculture (USDA) prohibits discrimination in all its programs and activities on the basis of race, color, national origin, sex, religion, age, disability, political beliefs, sexual orientation, or marital or family status. (Not all prohibited bases apply to all programs.) Persons with disabilities who require alternative means for communication of program information (Braille, large print, audiotape, etc.) should contact USDA's TARGET Center at (202) 720-2600 (voice and TDD).
To file a complaint of discrimination, write USDA, Director, Office of Civil Rights, Room 326-W, Whitten Building, 14th and Independence Ave., SW, Washington, DC 20250-9410, or call (202) 720-5964 (voice and TDD). USDA is an equal opportunity provider and employer.
Commercialization of food consumption in rural China.
(Economic research report (United States. Dept. of Agriculture. Economic Research Service); no. 8)
1. Food consumption—China. 2. Consumer behavior—China. 3. Rural population—China. 4. Diet—China. 5. Grocery shopping—China. I. Gale, Fred. II. United States. Dept. of Agriculture. Economic Research Service. III. Title.
TX360.C6
United StatesDepartmentof Agriculture
www.ers.usda.gov
Electronic Report from the Economic Research Service
Economic
Research
Report
Number 8Commercialization of FoodConsumption in Rural China
Fred Gale, Ping Tang, Xianhong Bai, and Huijun Xu
July 2005
Abstract
Rural households in China have traditionally consumed food mostly grown on their ownfarms. While they continue to rely on self-produced grains, vegetables, meats, and eggs fora large portion of their diet, rural households are now purchasing more of their food as theyenter the mainstream of the Chinese economy. Cash purchases of food by rural Chinesehouseholds increased 7.4 percent per year from 1994 to 2003. Consumption has shiftedfrom self-produced to purchased food at a rate faster than can be explained by incomegrowth or changes in other household characteristics. The move away from self-producedfood is associated with lower consumption of staple grains, the most important self-produced food in rural Chinese diets. Food consumed away from home is one of the fastestgrowing categories of rural household expenditures, doubling in budget share from 1995 to2001. Commercialization of food consumption is diversifying Chinese diets, broadeningfood markets, and creating new opportunities for retailers and product distributors.
Keywords: China, food, consumption, expenditures, rural, commercialization, subsis-tence agriculture, Engel analysis.
Acknowledgments
This report is a collaborative project between the U.S. Department of Agriculture (USDA)and China National Bureau of Statistics, funded in part by USDA’s Emerging MarketsProgram. The authors wish to acknowledge the guidance and contributions of Zude Xian,Zhiquan Xu, Laiyun Sheng, Junxiong Yang, and Liquan Peng of China National Bureau ofStatistics and Praveen Dixit and Francis Tuan of USDA’s Economic Research Service(ERS). Collaborators Wen S. Chern and Wenye Yan of the Ohio State University also madeimportant contributions to this project. The authors received helpful comments on themanuscript from Wen Chern, Frank Fuller, Mike Goettl, Bryan Lohmar, Anita Regmi, andFrancis Tuan. Finally, we appreciate the editorial assistance of John Weber and the designand layout skills of Wynnice Pointer-Napper, both of ERS.

Summary . . . . . . . . . . . . . . . . . . . . . . . . . . . . . . . . . . . . . . . . . . . . . . . . . . .iii
Introduction . . . . . . . . . . . . . . . . . . . . . . . . . . . . . . . . . . . . . . . . . . . . . . . . .1
Chapter 1Self-Produced Food Minimizes Expenditure . . . . . . . . . . . . . . . . . . . . . .3
Most Grain and Vegetables Consumed Are Self-Produced . . . . . . . . . . . .4Even High-Income Households Rely on Self-Produced Food . . . . . . . . .5Eastern Provinces Are Most Commercialized . . . . . . . . . . . . . . . . . . . . . .6Self-Produced Food Meets Basic Nutritional Needs at Low Cost . . . . . .7
Chapter 2Commercialization of Rural Food Consumption . . . . . . . . . . . . . . . . . .12
Cash Expenditures Rising . . . . . . . . . . . . . . . . . . . . . . . . . . . . . . . . . . . .12More Purchased Food, Less Self-Produced Grain . . . . . . . . . . . . . . . . .12Low-Income Households Commercialized Fastest . . . . . . . . . . . . . . . . .13
Chapter 3Household Expenditure Analysis . . . . . . . . . . . . . . . . . . . . . . . . . . . . . . .16
Model . . . . . . . . . . . . . . . . . . . . . . . . . . . . . . . . . . . . . . . . . . . . . . . . . . . .17Cash/Noncash Food Expenditure . . . . . . . . . . . . . . . . . . . . . . . . . . . . . .18Cash Expenditure Elasticities . . . . . . . . . . . . . . . . . . . . . . . . . . . . . . . . .20Summary of Household Expenditure Analysis . . . . . . . . . . . . . . . . . . . .24
Chapter 4Implications of Rural Food Commercialization . . . . . . . . . . . . . . . . . . .26
Emergence of the Rural Market . . . . . . . . . . . . . . . . . . . . . . . . . . . . . . . .26Adjustment in Crop Plantings . . . . . . . . . . . . . . . . . . . . . . . . . . . . . . . . .27More Food Enters Markets . . . . . . . . . . . . . . . . . . . . . . . . . . . . . . . . . . .27Rising Calorie and Fat Intake . . . . . . . . . . . . . . . . . . . . . . . . . . . . . . . . .28
Conclusions . . . . . . . . . . . . . . . . . . . . . . . . . . . . . . . . . . . . . . . . . . . . . . . . .29
References . . . . . . . . . . . . . . . . . . . . . . . . . . . . . . . . . . . . . . . . . . . . . . . . . .30
Appendix—China Rural Household Survey . . . . . . . . . . . . . . . . . . . . . .32
Appendix Tables . . . . . . . . . . . . . . . . . . . . . . . . . . . . . . . . . . . . . . . . . . . . .34
iiCommercialization of Food Consumption in Rural China / ERR-8
Economic Research Service/USDA
Contents
Many analysts anticipate that China’s changing food consumption patternswill affect world agricultural trade and create new export opportunities forfarmers in the United States and other countries. Much of the attention isfocused on the emerging consumer class in China’s cities, but a carefulassessment of China’s food and agricultural markets requires an under-standing of rural food consumption patterns as well. The rural population—historically about 80 percent of the total but now just over 60 percent—hashistorically been isolated from the urban economy, mostly engaged in semi-subsistence farming with relatively little cash income available.
What Is the Issue?
Much of the food in China is consumed on the farms of households whoproduce it. Consumption of self-produced food is a key difference betweenrural and urban food consumption and is a factor often ignored in studies ofChina’s food markets. Though China’s rural households carry on the traditionof growing most of their own food, as they enter the mainstream of thecountry’s economy, they are purchasing more of their food than ever before.With its vast size, China’s rural population is thus emerging as a huge viablemarket capturing the attention of food and agricultural industries in the UnitedStates and other countries. The addition of tens of millions of consumers intoChina’s food system will likely have an effect on world markets.
What Did the Project Find?
Rural households minimize their expenditure on food by relying on self-produced grain and other foods to meet most of their basic energy andprotein requirements. The cost of self-produced grain is just a fraction of thecost of purchased food, so consuming self-produced food frees up limitedcash to spend on nonfood items, such as housing and school fees. China’srural households consume an estimated 2,600 calories per day with annualfood expenditures of just $107.
While rural households in China show a persistent reliance on consumption ofself-produced food, trends show a rise of 7.4 percent per year in commercial-ization, or cash purchases, of food from 1994 to 2003. Over the period,consumption of self-produced grain and vegetables declined and cashpurchases of food rose at rates faster than can be explained by income growth.
Commercialization is most advanced among households with relatively highincomes and households in the more developed eastern provinces. However,even households with relatively high incomes self-produce most of the grainand vegetables they consume.
Food’s share of rural household budgets in China is shrinking as rural residentsspend proportionally more on school fees, housing, heath care, transportation,communications, and household goods. However, expenditures on food
iiiCommercialization of Food Consumption in Rural China / ERR-8
Economic Research Service/USDA
Summary
consumed away from home in restaurants and cafeterias are one of the fastestgrowing items in rural budgets, doubling in share between 1995 and 2001.
Analysis of household expenditures also reveals that the shift from self-produced to purchased food cannot be explained by income growth orchanges in other household characteristics. The commercialization of ruralfood markets may be attributable to factors that are difficult to measure,including improved communications, transportation, increased interchangebetween rural and urban populations, increased numbers of rural food storesand restaurants, and a shift from subsistence agriculture to cash cropproduction. The commercialization trend is integrating rural areas into largerregional and national markets, and food retailers and distributors are begin-ning to include the rural population in their marketing plans.
How Was the Project Conducted?
This study analyzes patterns of food consumption and expenditure usingdata from an annual rural household survey conducted by China NationalBureau of Statistics. The analysis uses both published and unpublished datato provide a glimpse of China’s rural households not previously docu-mented. Trends analyzed include rural food expenditure and consumptionpatterns from the early 1990s to 2003, a period of rapid change and devel-opment of markets in China’s rural economy. Econometric analysis ofhousehold survey records from three Chinese provinces for the years 1995and 2001 helped show how expenditures vary across households at differentincome levels.
ivCommercialization of Food Consumption in Rural China / ERR-8
Economic Research Service/USDA

Many analysts anticipate that changing food consumption patterns in Chinawill create new export opportunities for U.S. food and agricultural products(Hsu, Chern, and Gale). Much of the attention is focused on changes stem-ming from the emerging consumer class in China’s cities, but a carefulassessment of China’s food and agricultural markets requires an under-standing of changes in rural food consumption patterns.
Rural residents make up the majority of China’s population, and their foodconsumption patterns differ sharply from those of urban residents. The ruralpopulation—historically about 80 percent of the country’s total but now justover 60 percent—has historically been isolated from the urban economy,mostly engaged in semi-subsistence farming. With relatively little cashincome available, rural families traditionally have consumed mostly foodthey have grown themselves. Consumption of self-produced food is adistinctive characteristic of rural food consumption and is often overlookedin analyses of China’s food markets. Many analyses assume that all house-holds purchase food with cash, when, in fact, much of the food in China isconsumed on the farms by households who produce it.
Consumption of self-produced food remains prevalent in rural areas, butrural consumers are now purchasing more of their food. Since the 1980s,China has liberalized its agricultural economy, promoted interregional trade,and improved transportation, communication and market infrastructure,making it easier for rural residents to sell and purchase food (Gale; Gilmourand Gale). Increased rural-urban migration and income growth associatedwith off-farm work have given rural consumers increased purchasing power.China’s rural population is now emerging as a vast potential market that iscapturing the attention of retail businesses and product distributors.
This study investigates how food consumption and expenditure patterns ofChina’s vast rural population are evolving in response to changes in theChinese economy. A focus of the report is analysis of consumption of self-produced food by rural households, in particular, the degree to which ruralconsumers are shifting from reliance on self-produced food to purchasedfood as their cash incomes and expenditures rise. The report also examinesrural household expenditure allocations among different food and nonfoodcategories and the household characteristics that influence such expendi-ture patterns.
This study analyzes patterns of food consumption and expenditure using datafrom the annual rural household survey conducted by China’s NationalBureau of Statistics (see appendix). The analysis uses both published andunpublished data to provide a glimpse of rural households that has not been
1Commercialization of Food Consumption in Rural China / ERR-8
Economic Research Service/USDA
Commercialization of FoodConsumption in Rural China
Introduction

previously available. Rural food expenditure and consumption trends analyzedin this report cover the early 1990s to 2003, a period of rapid change anddevelopment of markets in the rural Chinese economy. Econometric analysisof household survey records from three Chinese provinces captures variationsin expenditures across households at different income levels.
2Commercialization of Food Consumption in Rural China / ERR-8
Economic Research Service/USDA
China’s rural population spends remarkably little on food, yet it is reason-ably well-fed. Food spending by households in rural China averaged just886 yuan ($107) per person in 2003, the equivalent of just 2.5 yuan (30cents) per day. By comparison, per capita food expenditures in urban Chinawere more than double the rural average, at 2,417 yuan ($292), and U.S. percapita expenditures were far higher ($5,465 for urban households and$4,739 for rural households in 2002).
Such low levels of food expenditure suggest extreme poverty, yet ruralpeople in China are generally not malnourished. The average caloric intakefor rural Chinese persons was estimated at about 2,600 calories per day in2003 (China National Bureau of Statistics, 2004b), above the minimumdaily requirement.
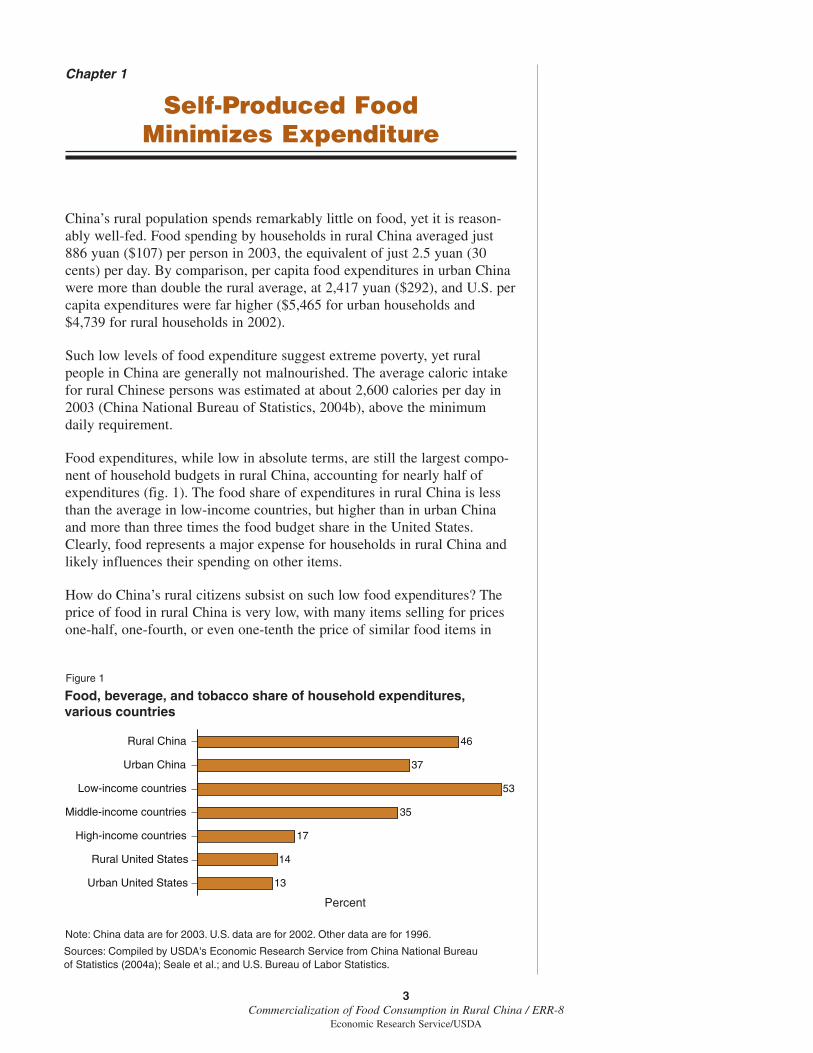
Food expenditures, while low in absolute terms, are still the largest compo-nent of household budgets in rural China, accounting for nearly half ofexpenditures (fig. 1). The food share of expenditures in rural China is lessthan the average in low-income countries, but higher than in urban Chinaand more than three times the food budget share in the United States.Clearly, food represents a major expense for households in rural China andlikely influences their spending on other items.
How do China’s rural citizens subsist on such low food expenditures? Theprice of food in rural China is very low, with many items selling for pricesone-half, one-fourth, or even one-tenth the price of similar food items in
3Commercialization of Food Consumption in Rural China / ERR-8
Economic Research Service/USDA
Chapter 1
Self-Produced Food Minimizes Expenditure
Figure 1
Food, beverage, and tobacco share of household expenditures, various countries
Percent
Sources: Compiled by USDA's Economic Research Service from China National Bureau of Statistics (2004a); Seale et al.; and U.S. Bureau of Labor Statistics.
Note: China data are for 2003. U.S. data are for 2002. Other data are for 1996.
Urban United States
Rural United States
High-income countries
Middle-income countries
Low-income countries
Urban China
Rural China
13
14
17
35
53
37
46

developed countries. Also, the typical diet in rural China consists largely ofinexpensive food grains and vegetables, with relatively little meat, packagedfood, or restaurant meals.
Household food self-sufficiency is another major strategy for minimizingrural household food expenditures in China. Nearly all rural Chinese house-holds produce basic food grains, and most also produce vegetables and raisehogs or poultry, a large portion of which they consume on-farm.1 Consump-tion of self-produced food frees up limited cash income for nonfoodpurchases. In 2003, cash accounted for only 62 percent, or 552 yuan ($67),of average rural food expenditures. The remaining 38 percent were noncash“expenditures”: the imputed value of food grown by the farm family itselfplus the value of food obtained through informal exchange or other nonpur-chased sources (fig. 2).
The value of noncash expenditures is imputed by China National Bureau ofStatistics statisticians using estimated farm-gate producer prices. These pricesare lower than retail purchase prices, so the noncash share of expenditures mayactually understate the degree of reliance on self-produced food.
Food self-sufficiency allows China’s rural households to meet their basicnutritional needs without having to rely on nonexistent or risky markets(Von Braun). Huang and Rozelle suggest that lack of market developmentconstrained the consumption choices of Chinese rural households. In remoterural areas, transportation costs may discourage participation in markets bydriving a wedge between effective purchase prices and sale prices (Yan).Lack of off-farm cash-generating employment opportunities also can forcehouseholds to rely on self-produced food.
Most Grain and Vegetables Consumed Are Self-Produced
ERS estimated the self-produced (noncash) quantity of major food itemsconsumed by rural households in China using data on per capita consump-tion and purchases reported by China’s Rural Household Survey. The surveyreports the quantity consumed and the quantity purchased for each major
1 ERS analyzed data from China’s1996 agricultural census and foundthat 93 percent of rural householdsproduced grain, over 60 percent grewvegetables, and most also raised hogsor poultry. Most farms grow vegeta-bles and raise hogs and chickens on avery small scale.
4Commercialization of Food Consumption in Rural China / ERR-8
Economic Research Service/USDA
Figure 2
Rural food expenditures, cash and noncash, 2003
Cash–62%
Source: Compiled by USDA's Economic Research Service from China National Bureau of Statistics (2004b).
Noncash–38%
food item. Assuming that the quantity consumed is the sum of the quantitypurchased and the quantity self-produced, ERS calculated the self-producedquantity as:
Self-produced = Consumed – Purchased. (1)
The degree of reliance on self-produced food is estimated by expressing thequantity of self-produced food as a percentage of the quantity consumed.The result of this calculation using rural household data for 2003 is shownin table 1.2
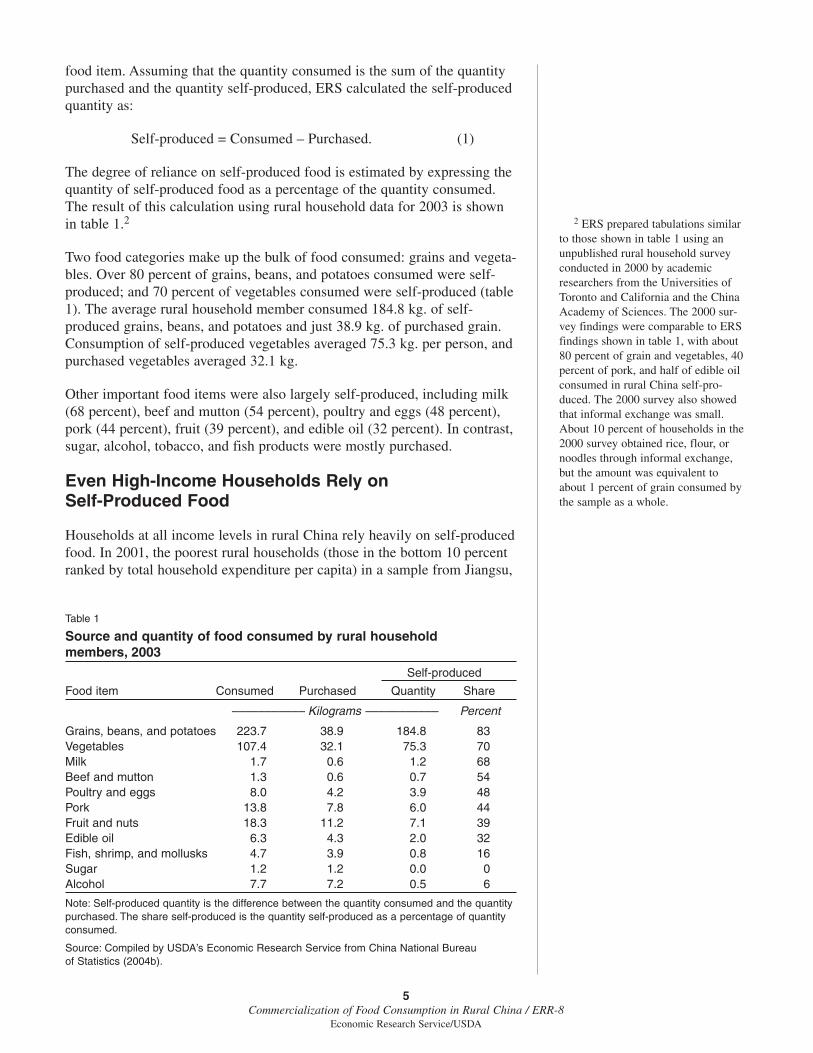
Two food categories make up the bulk of food consumed: grains and vegeta-bles. Over 80 percent of grains, beans, and potatoes consumed were self-produced; and 70 percent of vegetables consumed were self-produced (table1). The average rural household member consumed 184.8 kg. of self-produced grains, beans, and potatoes and just 38.9 kg. of purchased grain.Consumption of self-produced vegetables averaged 75.3 kg. per person, andpurchased vegetables averaged 32.1 kg.
Other important food items were also largely self-produced, including milk(68 percent), beef and mutton (54 percent), poultry and eggs (48 percent),pork (44 percent), fruit (39 percent), and edible oil (32 percent). In contrast,sugar, alcohol, tobacco, and fish products were mostly purchased.
Even High-Income Households Rely onSelf-Produced Food
Households at all income levels in rural China rely heavily on self-producedfood. In 2001, the poorest rural households (those in the bottom 10 percentranked by total household expenditure per capita) in a sample from Jiangsu,
2 ERS prepared tabulations similarto those shown in table 1 using anunpublished rural household surveyconducted in 2000 by academicresearchers from the Universities ofToronto and California and the ChinaAcademy of Sciences. The 2000 sur-vey findings were comparable to ERSfindings shown in table 1, with about80 percent of grain and vegetables, 40percent of pork, and half of edible oilconsumed in rural China self-pro-duced. The 2000 survey also showedthat informal exchange was small.About 10 percent of households in the2000 survey obtained rice, flour, ornoodles through informal exchange,but the amount was equivalent toabout 1 percent of grain consumed bythe sample as a whole.
5Commercialization of Food Consumption in Rural China / ERR-8
Economic Research Service/USDA
Table 1
Source and quantity of food consumed by rural household members, 2003
Self-produced
Food item Consumed Purchased Quantity Share
––––––––––– Kilograms ––––––––––– Percent
Grains, beans, and potatoes 223.7 38.9 184.8 83Vegetables 107.4 32.1 75.3 70Milk 1.7 0.6 1.2 68Beef and mutton 1.3 0.6 0.7 54Poultry and eggs 8.0 4.2 3.9 48Pork 13.8 7.8 6.0 44Fruit and nuts 18.3 11.2 7.1 39Edible oil 6.3 4.3 2.0 32Fish, shrimp, and mollusks 4.7 3.9 0.8 16Sugar 1.2 1.2 0.0 0Alcohol 7.7 7.2 0.5 6
Note: Self-produced quantity is the difference between the quantity consumed and the quantitypurchased. The share self-produced is the quantity self-produced as a percentage of quantityconsumed.
Source: Compiled by USDA’s Economic Research Service from China National Bureau of Statistics (2004b).
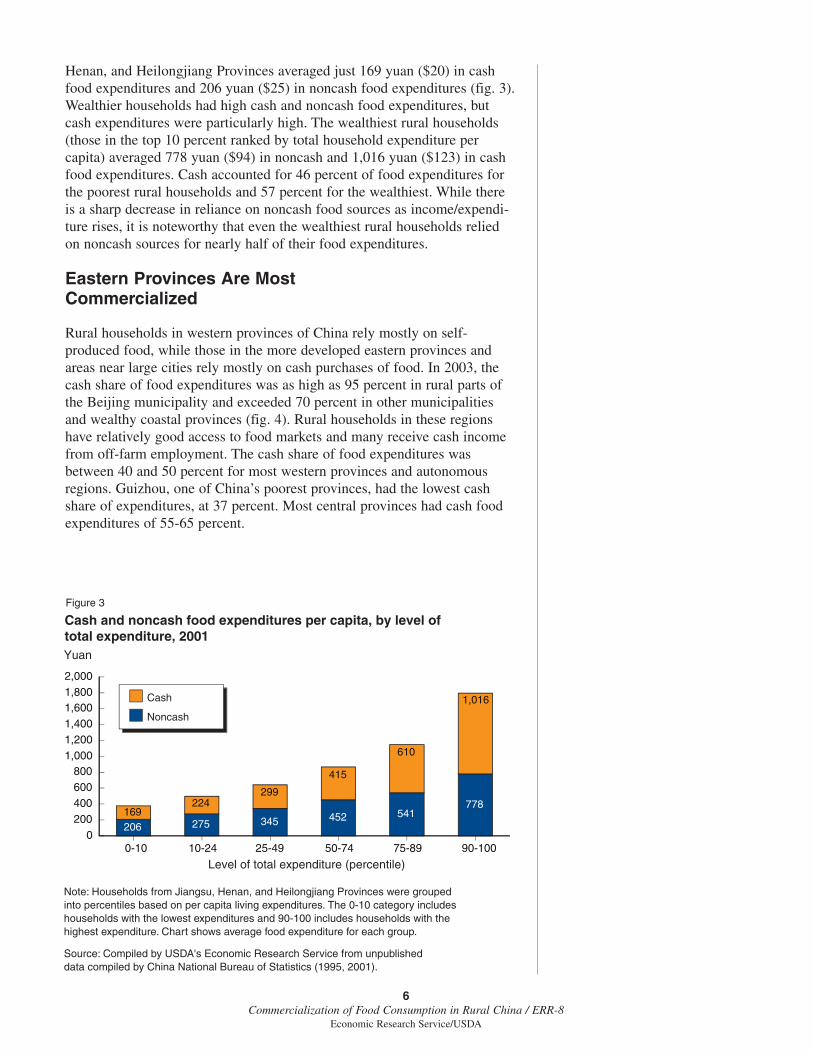
Henan, and Heilongjiang Provinces averaged just 169 yuan ($20) in cashfood expenditures and 206 yuan ($25) in noncash food expenditures (fig. 3).Wealthier households had high cash and noncash food expenditures, butcash expenditures were particularly high. The wealthiest rural households(those in the top 10 percent ranked by total household expenditure percapita) averaged 778 yuan ($94) in noncash and 1,016 yuan ($123) in cashfood expenditures. Cash accounted for 46 percent of food expenditures forthe poorest rural households and 57 percent for the wealthiest. While thereis a sharp decrease in reliance on noncash food sources as income/expendi-ture rises, it is noteworthy that even the wealthiest rural households reliedon noncash sources for nearly half of their food expenditures.
Eastern Provinces Are MostCommercialized
Rural households in western provinces of China rely mostly on self-produced food, while those in the more developed eastern provinces andareas near large cities rely mostly on cash purchases of food. In 2003, thecash share of food expenditures was as high as 95 percent in rural parts ofthe Beijing municipality and exceeded 70 percent in other municipalitiesand wealthy coastal provinces (fig. 4). Rural households in these regionshave relatively good access to food markets and many receive cash incomefrom off-farm employment. The cash share of food expenditures wasbetween 40 and 50 percent for most western provinces and autonomousregions. Guizhou, one of China’s poorest provinces, had the lowest cashshare of expenditures, at 37 percent. Most central provinces had cash foodexpenditures of 55-65 percent.
6Commercialization of Food Consumption in Rural China / ERR-8
Economic Research Service/USDA
Figure 3
Cash and noncash food expenditures per capita, by level of total expenditure, 2001
Source: Compiled by USDA's Economic Research Service from unpublished data compiled by China National Bureau of Statistics (1995, 2001).
Note: Households from Jiangsu, Henan, and Heilongjiang Provinces were grouped into percentiles based on per capita living expenditures. The 0-10 category includes households with the lowest expenditures and 90-100 includes households with the highest expenditure. Chart shows average food expenditure for each group.
Yuan
0-10 10-24 25-49 50-74 75-89 90-1000
200400600800
1,0001,2001,4001,6001,8002,000
206169
275
224
345
299
452
415
541
610
778
1,016Cash
Noncash
Level of total expenditure (percentile)

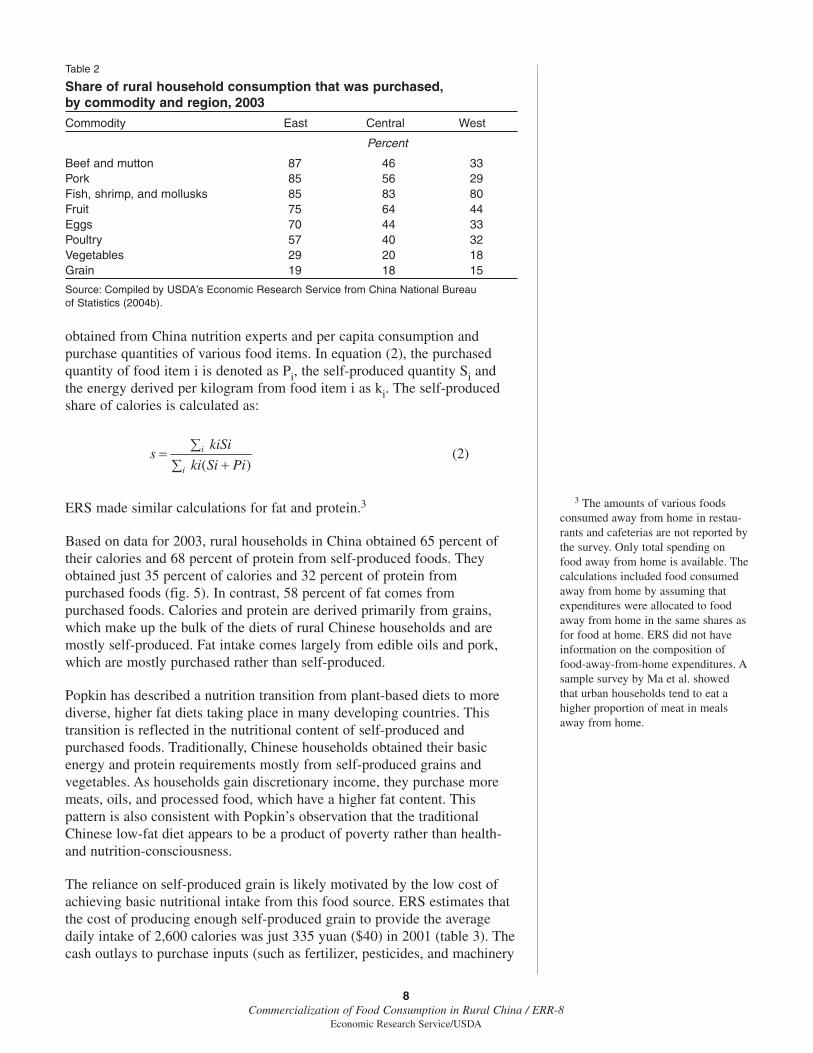
The regional difference in commercialization is most striking for meats(table 2). Rural households in eastern provinces purchased 85 percent of thepork they consumed in 2003, while central households purchased 56 percentand western households purchased just 29 percent. Eastern households alsopurchased a much higher share of their beef, mutton, poultry, and eggconsumption. Consumption of fish products is highly commercialized ineach region.
While rural household consumption of most nonstaple foods is highlycommercialized in the eastern region, consumption of grains and vegetablesis still reliant on self-production. Households in the eastern regionpurchased only 19 percent of their grain consumption in 2003, only slightlyhigher than the purchased shares in central and western regions. Easternhouseholds purchased 29 percent of their vegetable consumption, and thatwas also higher than the shares in the central (20 percent) and western (18percent) regions.
Self-Produced Food Meets BasicNutritional Needs at Low Cost
ERS estimated rural household energy, protein, and fat intake derived frompurchased and self-produced food items using per kilogram coefficients
7Commercialization of Food Consumption in Rural China / ERR-8
Economic Research Service/USDA
Figure 4
Cash share of food expenditures, by province, 2003
Cash share(percent)
82 to 95
64 to 75
55 to 61
37 to 50
Sources: Compiled by USDA's Economic Research Service from China National Bureau of Statistics (2004b).
Note: Figure shows cash food expenditures as a percentage of total food expenditures.
Xinjiang(50)
Tibet(40)
Qinghai(40)
Ningxia(48)
Beijing (95)
Gansu(47)
Sichuan(47)
Chongqing(45)
Shaanxi(66)
Shanxi(64)
Hebei(67)
Henan(55)
Hubei (46)
Yunnan(46)
Guizhou(37)
Guangxi(61)
Hunan(60)
Hainan(58)
Guangdong (75)
Jiangxi(56)
Anhui(60)
Fujian (82)
Zhejiang (84)
Shanghai (86)
Jiangsu (65)
Shandong (67)
Liaoning (65)
Jilin (69)
Inner Mongolia(58)
Heilongjiang(74)
Tianjin (89)
obtained from China nutrition experts and per capita consumption andpurchase quantities of various food items. In equation (2), the purchasedquantity of food item i is denoted as Pi, the self-produced quantity Si andthe energy derived per kilogram from food item i as ki. The self-producedshare of calories is calculated as:
ERS made similar calculations for fat and protein.3
Based on data for 2003, rural households in China obtained 65 percent oftheir calories and 68 percent of protein from self-produced foods. Theyobtained just 35 percent of calories and 32 percent of protein frompurchased foods (fig. 5). In contrast, 58 percent of fat comes frompurchased foods. Calories and protein are derived primarily from grains,which make up the bulk of the diets of rural Chinese households and aremostly self-produced. Fat intake comes largely from edible oils and pork,which are mostly purchased rather than self-produced.
Popkin has described a nutrition transition from plant-based diets to morediverse, higher fat diets taking place in many developing countries. Thistransition is reflected in the nutritional content of self-produced andpurchased foods. Traditionally, Chinese households obtained their basicenergy and protein requirements mostly from self-produced grains andvegetables. As households gain discretionary income, they purchase moremeats, oils, and processed food, which have a higher fat content. Thispattern is also consistent with Popkin’s observation that the traditionalChinese low-fat diet appears to be a product of poverty rather than health-and nutrition-consciousness.
The reliance on self-produced grain is likely motivated by the low cost ofachieving basic nutritional intake from this food source. ERS estimates thatthe cost of producing enough self-produced grain to provide the averagedaily intake of 2,600 calories was just 335 yuan ($40) in 2001 (table 3). Thecash outlays to purchase inputs (such as fertilizer, pesticides, and machinery
3 The amounts of various foodsconsumed away from home in restau-rants and cafeterias are not reported bythe survey. Only total spending onfood away from home is available. Thecalculations included food consumedaway from home by assuming thatexpenditures were allocated to foodaway from home in the same shares asfor food at home. ERS did not haveinformation on the composition offood-away-from-home expenditures. Asample survey by Ma et al. showedthat urban households tend to eat ahigher proportion of meat in mealsaway from home.
8Commercialization of Food Consumption in Rural China / ERR-8
Economic Research Service/USDA
Table 2
Share of rural household consumption that was purchased,by commodity and region, 2003
Commodity East Central West
Percent
Beef and mutton 87 46 33Pork 85 56 29Fish, shrimp, and mollusks 85 83 80Fruit 75 64 44Eggs 70 44 33Poultry 57 40 32Vegetables 29 20 18Grain 19 18 15
Source: Compiled by USDA’s Economic Research Service from China National Bureau of Statistics (2004b).
(2) )(
∑ +∑=
i
i
PiSiki
kiSis

9Commercialization of Food Consumption in Rural China / ERR-8
Economic Research Service/USDA
Figure 5
Source of energy, protein, and fat intake, rural Chinese households, 2003
Source: Estimated by USDA's Economic Research Service from China National Bureau of Statistics (2004b) and unpublished data.
Note: Estimated by multiplying coefficients developed by China nutrition experts by per capita quantities of purchased and self-produced foods.
Percent
Self-produced food
Purchased food
Calories Protein Fat0
20
40
60
80
100
Table 3
Estimated cost of caloric intake from different food sources, 2001
Annual cost ofPrice per Energy 2,600 calories
Food item kilogram1 yield2 per day3
Yuan Calories per kg. Yuan
Self-produced grain 0.89 2,540 335Cash outlays4 .53 2,540 200Labor cost5 .36 2,540 135
Purchased:Grain 1.60 2,540 600Pork 9.30 3,950 2,230Poultry 7.70 2,240 3,260Eggs 4.30 1,300 3,140Fish 5.70 660 8,200
1Average calculated using 2001 rural household survey data from Jiangsu, Henan, andHeilongjiang Provinces.2 China nutrition department unpublished estimates.3 Cost = (Price ÷ Energy yield) x 2,600 x 365.4 Input costs and taxes per kilogram of output of grain calculated from National Developmentand Reform Commission data.5 Labor cost per kilogram of grain output calculated from National Development and ReformCommission data.
Sources: Estimated by USDA’s Economic Research Service from unpublished data compiledby China National Bureau of Statistics (2001); National Development and Reform Commission;and unpublished data.
services) and pay taxes constituted just 200 yuan ($24), while the labor costwas another 135 yuan ($16). However, most labor requires little or no cashoutlay since it is provided mainly by family members. Family labor haslittle opportunity cost since off-farm work opportunities are limited andwork occurs for only a few days at planting and harvest. Thus, rural house-holds may consider only the cash costs of 200 yuan ($24) as the cost ofproducing grain for their own consumption.
An intake of 2,600 calories obtained entirely from purchased grain would cost600 yuan ($73), three times the cost of obtaining the same number of caloriesfrom self-produced grain. Calories from purchased pork cost over 10 times asmuch as those from self-produced grain, and the cost of calories from poultry,eggs, and fish is even higher. Thus, rural families can obtain their basic caloricintake from self-produced grain with minimal cash expenditure and a modestlabor input. The scarcity of cash income and the abundance of underemployedrural labor probably encourage this cash-saving strategy.
ERS estimates average per capita consumption of self-produced grains inrural China of 185 kg. (see table 1), equivalent to about 1,300 calories perday, about half of the average caloric intake of rural Chinese people.Production of 185 kg. of grain requires 89 yuan ($11) in cash outlays forinputs, 6 days of labor, and just 0.5 mu of cropland (mu equals about one-sixth acre). The minimal labor requirements of grain production leave plentyof labor free for off-farm work or other activities. The average householdcropland holding of 2 mu per person is also adequate to provide householdfood grain needs with 1.5 mu available for cash crop, livestock feed produc-tion, or other uses (see box, “Household Economics in Rural China”).
Because rural households meet most of their basic nutrition requirements byconsuming self-produced grain, they are able to devote most of their scarcecash income to expenditures on housing, schooling, transportation, andother nonfood goods and services. Even households with membersemployed off-farm and those with small land holdings can grow grain fortheir own consumption.
10Commercialization of Food Consumption in Rural China / ERR-8
Economic Research Service/USDA
11Commercialization of Food Consumption in Rural China / ERR-8
Economic Research Service/USDA
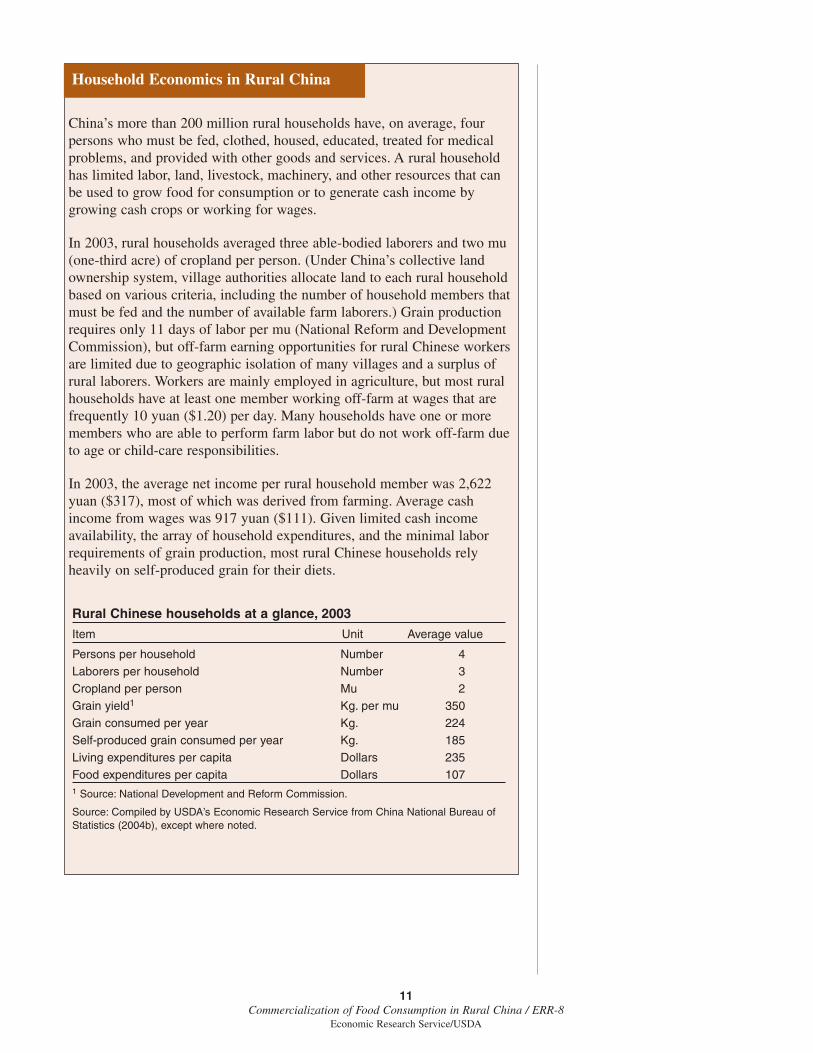
China’s more than 200 million rural households have, on average, fourpersons who must be fed, clothed, housed, educated, treated for medicalproblems, and provided with other goods and services. A rural householdhas limited labor, land, livestock, machinery, and other resources that canbe used to grow food for consumption or to generate cash income bygrowing cash crops or working for wages.
In 2003, rural households averaged three able-bodied laborers and two mu(one-third acre) of cropland per person. (Under China’s collective landownership system, village authorities allocate land to each rural householdbased on various criteria, including the number of household members thatmust be fed and the number of available farm laborers.) Grain productionrequires only 11 days of labor per mu (National Reform and DevelopmentCommission), but off-farm earning opportunities for rural Chinese workersare limited due to geographic isolation of many villages and a surplus ofrural laborers. Workers are mainly employed in agriculture, but most ruralhouseholds have at least one member working off-farm at wages that arefrequently 10 yuan ($1.20) per day. Many households have one or moremembers who are able to perform farm labor but do not work off-farm dueto age or child-care responsibilities.
In 2003, the average net income per rural household member was 2,622yuan ($317), most of which was derived from farming. Average cashincome from wages was 917 yuan ($111). Given limited cash incomeavailability, the array of household expenditures, and the minimal laborrequirements of grain production, most rural Chinese households relyheavily on self-produced grain for their diets.
Household Economics in Rural China
Rural Chinese households at a glance, 2003
Item Unit Average value
Persons per household Number 4Laborers per household Number 3Cropland per person Mu 2Grain yield1 Kg. per mu 350Grain consumed per year Kg. 224Self-produced grain consumed per year Kg. 185Living expenditures per capita Dollars 235Food expenditures per capita Dollars 1071 Source: National Development and Reform Commission.
Source: Compiled by USDA’s Economic Research Service from China National Bureau ofStatistics (2004b), except where noted.
While the rate of food self-sufficiency remains high in rural China, it isfalling rapidly as rural consumers gain more income and become inte-grated into the larger economy. Expanding off-farm employment, rural-urban migration, and the geographic spread of cities are giving ruralpeople access to cash income and food markets. The share of ruralincome received in cash rose from 49 percent in 1980 to 82 percent in2003, and rural retail sales per capita rose from 127 yuan ($44) in 1980to 1,400 yuan ($170) in 2003.1 Refrigerator ownership per 100 house-holds rose from just 1.2 to 16 over the period, an indicator of growingaffluence and a sign that rural households are diversifying their diets toinclude perishable food.
Cash Expenditures Rising
In 1980, China’s rural households made just 30 percent of their food expen-ditures in cash. Strong growth in the rural economy during the 1980s led toan early period of commercialization of rural food expenditures (Huang andRozelle; Wu). The cash share of food expenditures was about 45 percentduring the early 1990s and grew to over 60 percent in 2003.
Since the mid-1990s, rural food consumption has been in the midst of adecade-long period of commercialization. After adjusting food expendituresfor inflation using the retail food price index, ERS finds that cash foodexpenditures in rural China grew at an annual average rate of 7.4 percentfrom 1994 to 2003 (fig. 6). In contrast, inflation-adjusted noncash foodexpenditures declined during the same period. These data suggest that ruralconsumers are purchasing more food with cash while consuming less self-produced food.
More Purchased Food,Less Self-Produced Grain
Between 1995 and 2003, per capita purchases by China’s rural householdsincreased for all food items except staple grains (table 4). Increases inpurchases ranged from 30 percent for pork to nearly 300 percent for milk.Decreases in grain purchases are probably attributed to the general declinein grain consumption in China. Households also reduced their consumptionof self-produced grain, vegetables, edible oil, and fish products. Householdsincreased their consumption of self-produced pork, beef, mutton, poultry,eggs, milk, fruit, and nuts, a trend that likely reflects the increased overallconsumption of these items. Overall, consumption of each of these itemsgrew 17 percent or more.
1 Retail sales below county leveldivided by rural population, notadjusted for inflation. Values convertedto dollars using official exchange ratesfor corresponding years.
12Commercialization of Food Consumption in Rural China / ERR-8
Economic Research Service/USDA
Chapter 2
Commercialization of Rural Food Consumption

Low-Income Households Commercialized Fastest
Between 1995 and 2001, the cash share of food expenditures rose for ruralhouseholds at all income levels, but the increase was especially fast for low-income rural households. The cash share of food expenditures made by thepoorest households (those in the lowest 10 percent of households ranked bytotal per capita household expenditure) rose from 30 percent in 1995 to 46percent in 2001, a gain of 16 percentage points (fig. 7). Over the sameperiod, the average cash share for the wealthiest households rose just 4percentage points, to 57 percent. The difference in cash share of food expen-ditures between households at different total expenditure levels clearlydiminished by 2001. The rising cash share of food expenditures results from
13Commercialization of Food Consumption in Rural China / ERR-8
Economic Research Service/USDA
Figure 6
Real food expenditures: cash and noncash, rural China, 1990-2003
Source: Compiled by USDA's Economic Research Service from China National Bureau of Statistics (2004b).
Note: Noncash expenditures calculated by subtracting cash expenditures from total living expenditures. Deflated using retail food price index.
Yuan
Cash
Noncash
1990 92 94 96 98 2000 020
100
200
300
400
500
600
Table 4
Change in per capita consumption, purchases, and self-production offood by rural China households, 1995-2003
Change in:Food item Consumption Purchased Self-produced
Percent
Grains, beans, potatoes -14 -2 -17Vegetables 2 71 -13Edible oil 8 74 -40Pork 30 30 31Beef and mutton 77 38 134Poultry and eggs 50 84 25Milk 167 293 132Fish and shellfish products 17 57 -25Fruit and nuts 39 47 27
Note: Based on average quantities consumed and purchased in 1995 and 2003.
Source: Calculated by USDA’s Economic Research Service from China National Bureau ofStatistics, (2004b).
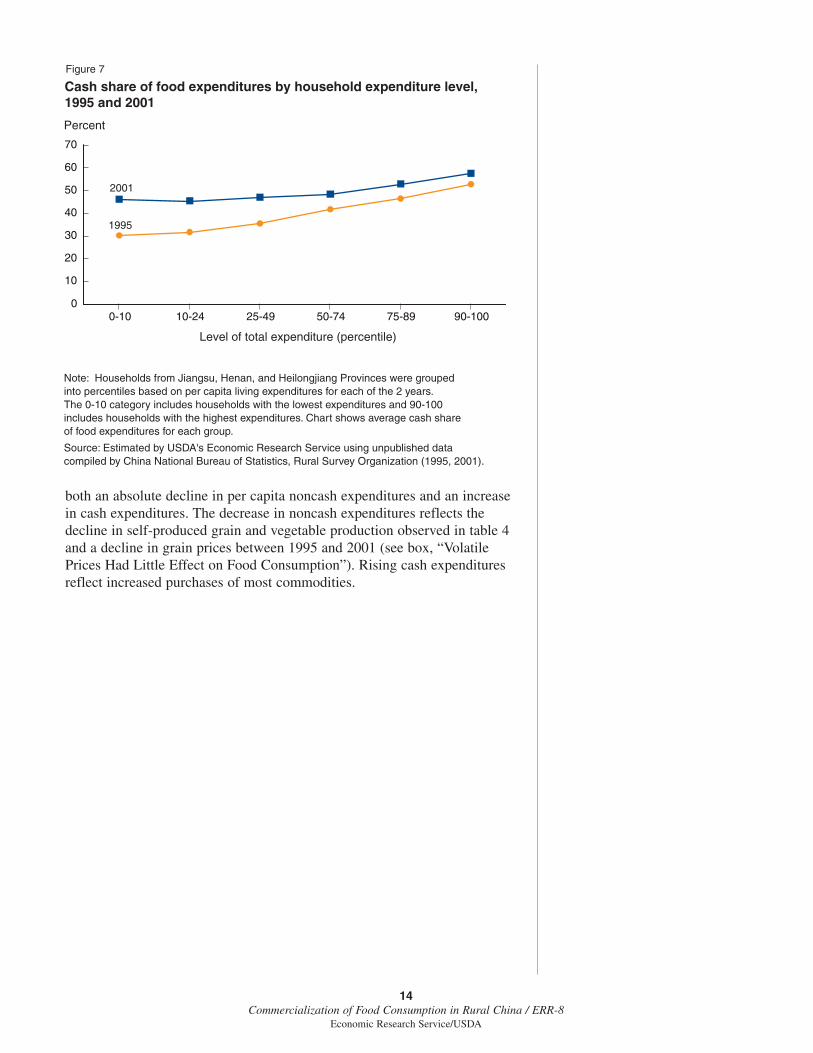
both an absolute decline in per capita noncash expenditures and an increasein cash expenditures. The decrease in noncash expenditures reflects thedecline in self-produced grain and vegetable production observed in table 4and a decline in grain prices between 1995 and 2001 (see box, “VolatilePrices Had Little Effect on Food Consumption”). Rising cash expendituresreflect increased purchases of most commodities.
14Commercialization of Food Consumption in Rural China / ERR-8
Economic Research Service/USDA
Figure 7
Cash share of food expenditures by household expenditure level, 1995 and 2001
Source: Estimated by USDA's Economic Research Service using unpublished data compiled by China National Bureau of Statistics, Rural Survey Organization (1995, 2001).
Note: Households from Jiangsu, Henan, and Heilongjiang Provinces were grouped into percentiles based on per capita living expenditures for each of the 2 years. The 0-10 category includes households with the lowest expenditures and 90-100 includes households with the highest expenditures. Chart shows average cash share of food expenditures for each group.
Percent
1995
2001
0-10 10-24 25-49 50-74 75-89 90-1000
10
20
30
40
50
60
70
Level of total expenditure (percentile)
15Commercialization of Food Consumption in Rural China / ERR-8
Economic Research Service/USDA
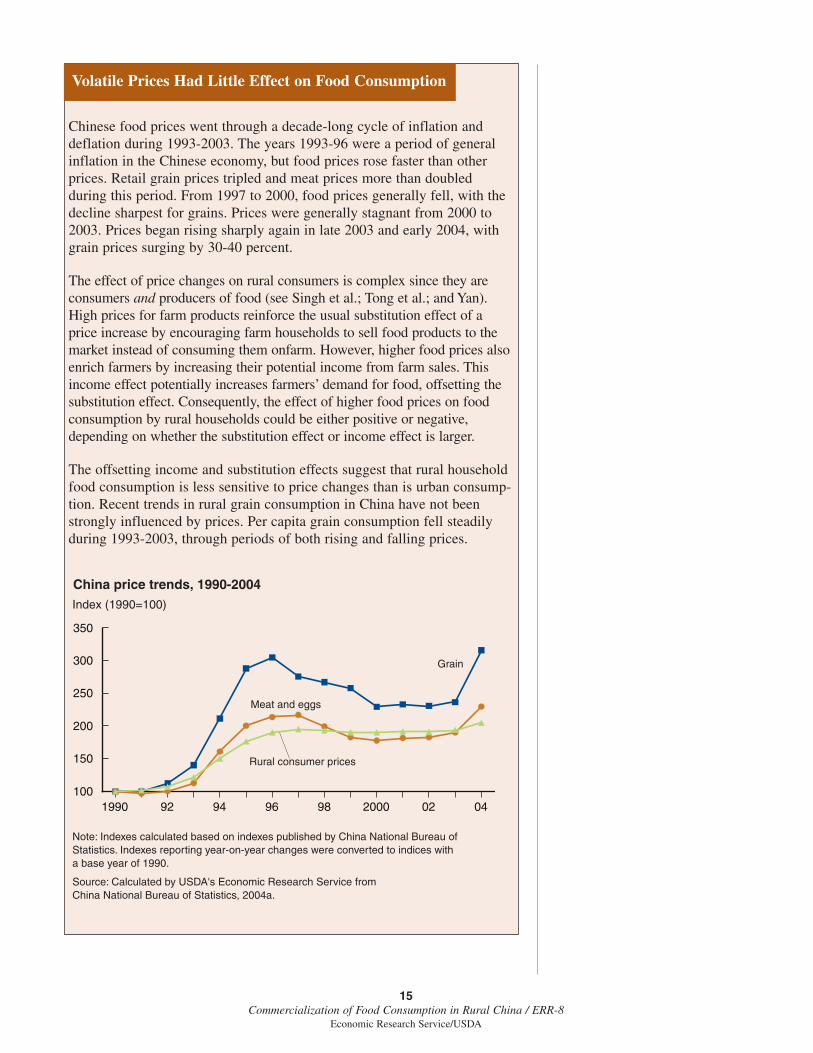
Chinese food prices went through a decade-long cycle of inflation anddeflation during 1993-2003. The years 1993-96 were a period of generalinflation in the Chinese economy, but food prices rose faster than otherprices. Retail grain prices tripled and meat prices more than doubledduring this period. From 1997 to 2000, food prices generally fell, with thedecline sharpest for grains. Prices were generally stagnant from 2000 to2003. Prices began rising sharply again in late 2003 and early 2004, withgrain prices surging by 30-40 percent.
The effect of price changes on rural consumers is complex since they areconsumers and producers of food (see Singh et al.; Tong et al.; and Yan).High prices for farm products reinforce the usual substitution effect of aprice increase by encouraging farm households to sell food products to themarket instead of consuming them onfarm. However, higher food prices alsoenrich farmers by increasing their potential income from farm sales. Thisincome effect potentially increases farmers’ demand for food, offsetting thesubstitution effect. Consequently, the effect of higher food prices on foodconsumption by rural households could be either positive or negative,depending on whether the substitution effect or income effect is larger.
The offsetting income and substitution effects suggest that rural householdfood consumption is less sensitive to price changes than is urban consump-tion. Recent trends in rural grain consumption in China have not beenstrongly influenced by prices. Per capita grain consumption fell steadilyduring 1993-2003, through periods of both rising and falling prices.
Volatile Prices Had Little Effect on Food Consumption
China price trends, 1990-2004
Note: Indexes calculated based on indexes published by China National Bureau of Statistics. Indexes reporting year-on-year changes were converted to indices with a base year of 1990.
Index (1990=100)
Rural consumer prices
Grain
Meat and eggs
Source: Calculated by USDA's Economic Research Service from China National Bureau of Statistics, 2004a.
1990 92 94 96 98 2000 02 04100
150
200
250
300
350
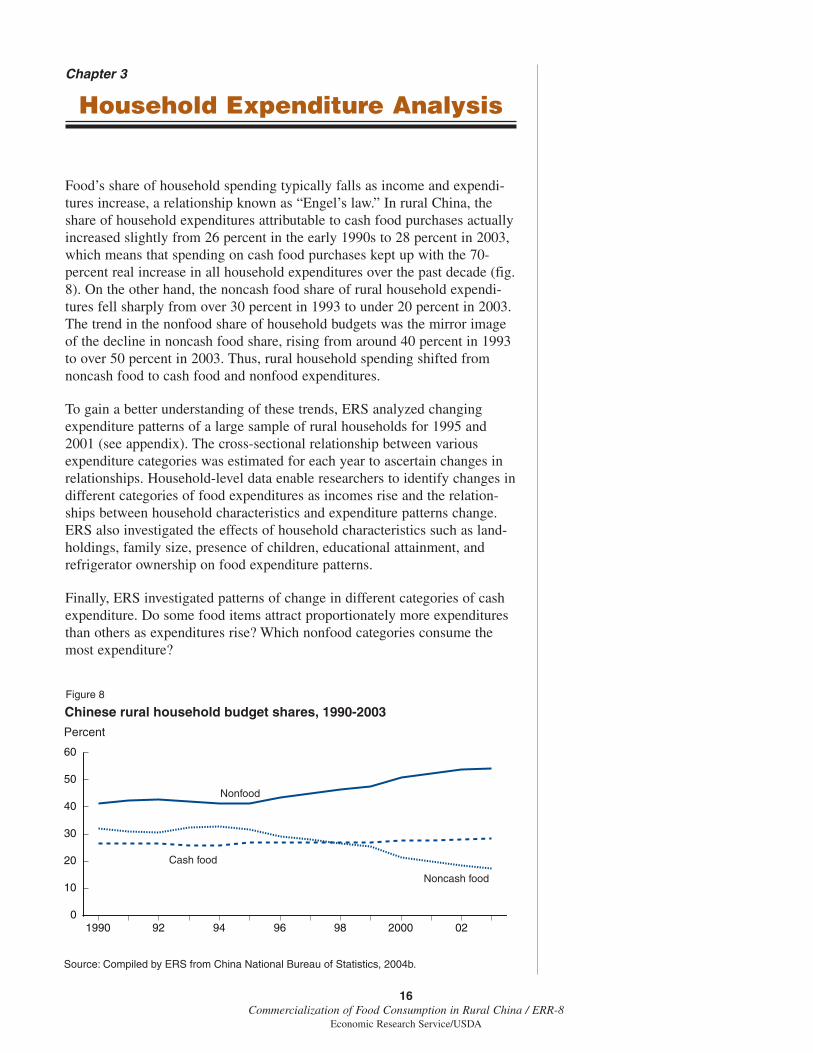
Food’s share of household spending typically falls as income and expendi-tures increase, a relationship known as “Engel’s law.” In rural China, theshare of household expenditures attributable to cash food purchases actuallyincreased slightly from 26 percent in the early 1990s to 28 percent in 2003,which means that spending on cash food purchases kept up with the 70-percent real increase in all household expenditures over the past decade (fig.8). On the other hand, the noncash food share of rural household expendi-tures fell sharply from over 30 percent in 1993 to under 20 percent in 2003.The trend in the nonfood share of household budgets was the mirror imageof the decline in noncash food share, rising from around 40 percent in 1993to over 50 percent in 2003. Thus, rural household spending shifted fromnoncash food to cash food and nonfood expenditures.
To gain a better understanding of these trends, ERS analyzed changingexpenditure patterns of a large sample of rural households for 1995 and2001 (see appendix). The cross-sectional relationship between variousexpenditure categories was estimated for each year to ascertain changes inrelationships. Household-level data enable researchers to identify changes indifferent categories of food expenditures as incomes rise and the relation-ships between household characteristics and expenditure patterns change.ERS also investigated the effects of household characteristics such as land-holdings, family size, presence of children, educational attainment, andrefrigerator ownership on food expenditure patterns.
Finally, ERS investigated patterns of change in different categories of cashexpenditure. Do some food items attract proportionately more expendituresthan others as expenditures rise? Which nonfood categories consume themost expenditure?
16Commercialization of Food Consumption in Rural China / ERR-8
Economic Research Service/USDA
Chapter 3
Household Expenditure Analysis
Figure 8
Chinese rural household budget shares, 1990-2003
Source: Compiled by ERS from China National Bureau of Statistics, 2004b.
Percent
Cash food
Nonfood
1990 92 94 96 98 2000 020
10
20
30
40
50
60
Noncash food
Model
ERS employed the Working-Leser model, a simple model with desirableproperties which expresses the household’s budget share of each item, j, as alinear function of the logarithm of household expenditures (Wu; Seale etal.). The model provides information on the tendency of households atdifferent income levels and with different characteristics to allocate expendi-tures among different budget categories. Demographic characteristics wereadded to the model. We did not include prices as explanatory variables.1
ERS estimated the following regression model:
wij = aj + bjLn(Yi) + Σk cjkXik + ei (3)
where wij is the share of expenditures made on category j by household i(pjqij/Yi),
Yi is per capita total living expenditure made by household i,
Xik are household characteristics,
ei is a random error term,
aj, bj, cjk, are parameters to be estimated for each expenditure item j.
When bj=0, the item’s budget share remains constant as expendituresincrease. If bj<0, the item’s budget share falls as expenditures rise and bj>0indicates that the item’s budget share increases. Since the budget sharesalways sum to 1, an increase in one item’s budget share must be offset by adecreasing share for other items.
According to this model, the expenditure elasticity for item j, nj, isexpressed as:
nj = 1 + (bj/wj). (4)
The falling budget share for noncash food expenditures observed in figure 8suggests that this expenditure category has a low (possibly negative) expen-diture elasticity, while the stable cash food expenditure share suggests anexpenditure elasticity of approximately 1.0 for cash food purchases. Therising budget share for nonfood expenditures suggests an elasticityexceeding 1.0 for the nonfood category.
The model also includes household demographic characteristics, Xik, thatmay affect food expenditures. These characteristics include the area of landcultivated by the household, the area of the household’s family plot, refrig-erator ownership, number of family members residing in the household, thenumber of small children (under age 6), the number of school-age children(ages 6-15), and the education level of laborers in the household.
First, ERS estimated the model using three expenditure categories—cashfood, noncash food, and nonfood—to compare the expenditure elasticities.2
The model used total household living expenditures as an explanatory vari-able. It was expected that cash food spending would have a larger expenditureelasticity than noncash food spending. The time series analysis in the previous
1 The effect of prices on food con-sumption is complex because ruralhouseholds are both consumers and pro-ducers of food (Singh et al.; Yan). Seebox, “Volatile Prices Had Little Effecton Food Consumption,” for details.
2 ERS did not separate nonfoodexpenditures into cash and noncashspending since our interest is mainlyin food expenditures and noncashspending for nonfood items was small.Noncash expenditures on nonfooditems averaged 57 yuan ($7) per per-son in 2001, most of which wasdevoted to housing.
17Commercialization of Food Consumption in Rural China / ERR-8
Economic Research Service/USDA

section suggests that noncash food spending may have a negative expenditureelasticity. ERS also investigated changes in elasticities over time.
Second, ERS investigated allocations of cash expenditures among differentfood and nonfood categories. Engel functions were estimated for cash foodexpenditure items using total cash expenditure by the household as the inde-pendent variable. This analysis provided insight on the types of food that arepurchased most frequently as China’s rural households increase their partici-pation in cash markets. Food expenditure elasticities were compared withnonfood elasticities to provide perspective on the role of food expendituresin households’ cash budgets. Finally, ERS examined the association betweenvarious expenditures and household characteristics.
Cash/Noncash Food Expenditure
The analysis compared expenditure allocations among cash food, noncashfood, and nonfood items by rural households at different income levels.Results from the 2 years studied show how expenditure relationships mayhave changed during the period of rapid commercialization of foodconsumption identified earlier in this report.
The model used household data from Heilongjiang, Henan, and JiangsuProvinces for 1995 and 2001. Data for over 9,000 households in the threeprovinces were available for each year to estimate budget share equationsfor cash food, noncash food, and nonfood expenditures, a total of six equa-tions. F-statistics indicated that the independent variables added significantexplanatory power to the models, and t-statistics indicated that most regres-sion coefficients were significantly different from zero. R2 values wereabout .20 for the cash food equations and .35 for the noncash food andnonfood equations.3
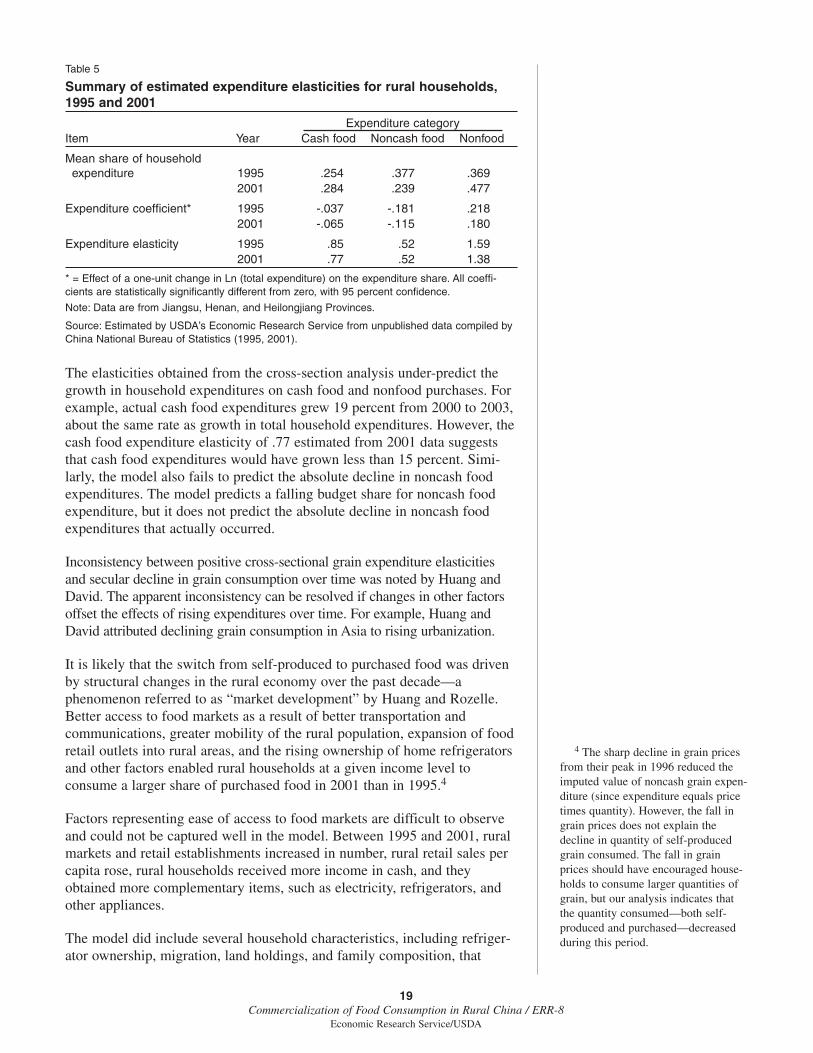
The trends in mean expenditure shares in the sample of households areconsistent with the national data shown in figure 8. The cash food share roseslightly, the noncash food share fell sharply, and the nonfood expenditureshare rose sharply between 1995 and 2001 (table 5). However, the expendi-ture coefficients and elasticities estimated from the cross-section data appearto be inconsistent with the trends in budget shares over time. Between 1995and 2001, the mean cash food share rose, but the estimate of the cash foodexpenditure elasticity is less than 1, suggesting that the budget share devotedto cash food expenditures should fall as total expenditure rises. The esti-mated cash food expenditure elasticity was .85 for 1995 and was evenlower, at .77, in 2001.
Not surprisingly, the noncash food expenditure elasticity is even lower, at.52. While this elasticity is clearly less than 1 (implying a sharply decliningbudget share), it is also significantly greater than 0, suggesting that noncashfood expenditure increases as income rises, as observed in figure 3.However, the aggregate data for 1996-2003 showed that inflation-adjustednoncash food expenditures decreased not only as a share of householdbudgets, but also in absolute terms (see fig. 6), suggesting that the noncashfood expenditure elasticity would be negative. The nonfood expenditureelasticity is significantly greater than 1, as expected.
3 Descriptions of variables andexpenditure categories are provided inappendix table 1. Full results of theregression estimates are reported inappendix tables 2 and 3.
18Commercialization of Food Consumption in Rural China / ERR-8
Economic Research Service/USDA
The elasticities obtained from the cross-section analysis under-predict thegrowth in household expenditures on cash food and nonfood purchases. Forexample, actual cash food expenditures grew 19 percent from 2000 to 2003,about the same rate as growth in total household expenditures. However, thecash food expenditure elasticity of .77 estimated from 2001 data suggeststhat cash food expenditures would have grown less than 15 percent. Simi-larly, the model also fails to predict the absolute decline in noncash foodexpenditures. The model predicts a falling budget share for noncash foodexpenditure, but it does not predict the absolute decline in noncash foodexpenditures that actually occurred.
Inconsistency between positive cross-sectional grain expenditure elasticitiesand secular decline in grain consumption over time was noted by Huang andDavid. The apparent inconsistency can be resolved if changes in other factorsoffset the effects of rising expenditures over time. For example, Huang andDavid attributed declining grain consumption in Asia to rising urbanization.
It is likely that the switch from self-produced to purchased food was drivenby structural changes in the rural economy over the past decade—aphenomenon referred to as “market development” by Huang and Rozelle.Better access to food markets as a result of better transportation andcommunications, greater mobility of the rural population, expansion of foodretail outlets into rural areas, and the rising ownership of home refrigeratorsand other factors enabled rural households at a given income level toconsume a larger share of purchased food in 2001 than in 1995.4
Factors representing ease of access to food markets are difficult to observeand could not be captured well in the model. Between 1995 and 2001, ruralmarkets and retail establishments increased in number, rural retail sales percapita rose, rural households received more income in cash, and theyobtained more complementary items, such as electricity, refrigerators, andother appliances.
The model did include several household characteristics, including refriger-ator ownership, migration, land holdings, and family composition, that
4 The sharp decline in grain pricesfrom their peak in 1996 reduced theimputed value of noncash grain expen-diture (since expenditure equals pricetimes quantity). However, the fall ingrain prices does not explain thedecline in quantity of self-producedgrain consumed. The fall in grainprices should have encouraged house-holds to consume larger quantities ofgrain, but our analysis indicates thatthe quantity consumed—both self-produced and purchased—decreasedduring this period.
19Commercialization of Food Consumption in Rural China / ERR-8
Economic Research Service/USDA
Table 5
Summary of estimated expenditure elasticities for rural households,1995 and 2001
Expenditure categoryItem Year Cash food Noncash food Nonfood
Mean share of household expenditure 1995 .254 .377 .369
2001 .284 .239 .477
Expenditure coefficient* 1995 -.037 -.181 .2182001 -.065 -.115 .180
Expenditure elasticity 1995 .85 .52 1.592001 .77 .52 1.38
* = Effect of a one-unit change in Ln (total expenditure) on the expenditure share. All coeffi-cients are statistically significantly different from zero, with 95 percent confidence.
Note: Data are from Jiangsu, Henan, and Heilongjiang Provinces.
Source: Estimated by USDA’s Economic Research Service from unpublished data compiled byChina National Bureau of Statistics (1995, 2001).
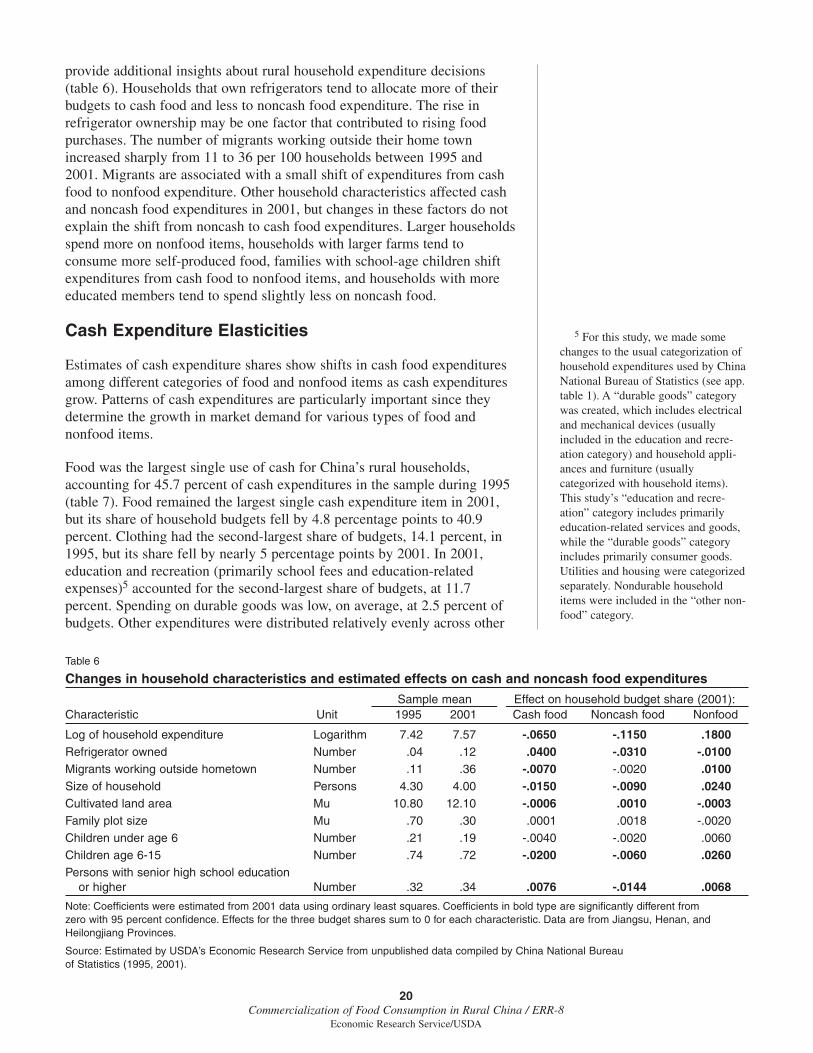
provide additional insights about rural household expenditure decisions(table 6). Households that own refrigerators tend to allocate more of theirbudgets to cash food and less to noncash food expenditure. The rise inrefrigerator ownership may be one factor that contributed to rising foodpurchases. The number of migrants working outside their home townincreased sharply from 11 to 36 per 100 households between 1995 and2001. Migrants are associated with a small shift of expenditures from cashfood to nonfood expenditure. Other household characteristics affected cashand noncash food expenditures in 2001, but changes in these factors do notexplain the shift from noncash to cash food expenditures. Larger householdsspend more on nonfood items, households with larger farms tend toconsume more self-produced food, families with school-age children shiftexpenditures from cash food to nonfood items, and households with moreeducated members tend to spend slightly less on noncash food.
Cash Expenditure Elasticities
Estimates of cash expenditure shares show shifts in cash food expendituresamong different categories of food and nonfood items as cash expendituresgrow. Patterns of cash expenditures are particularly important since theydetermine the growth in market demand for various types of food andnonfood items.
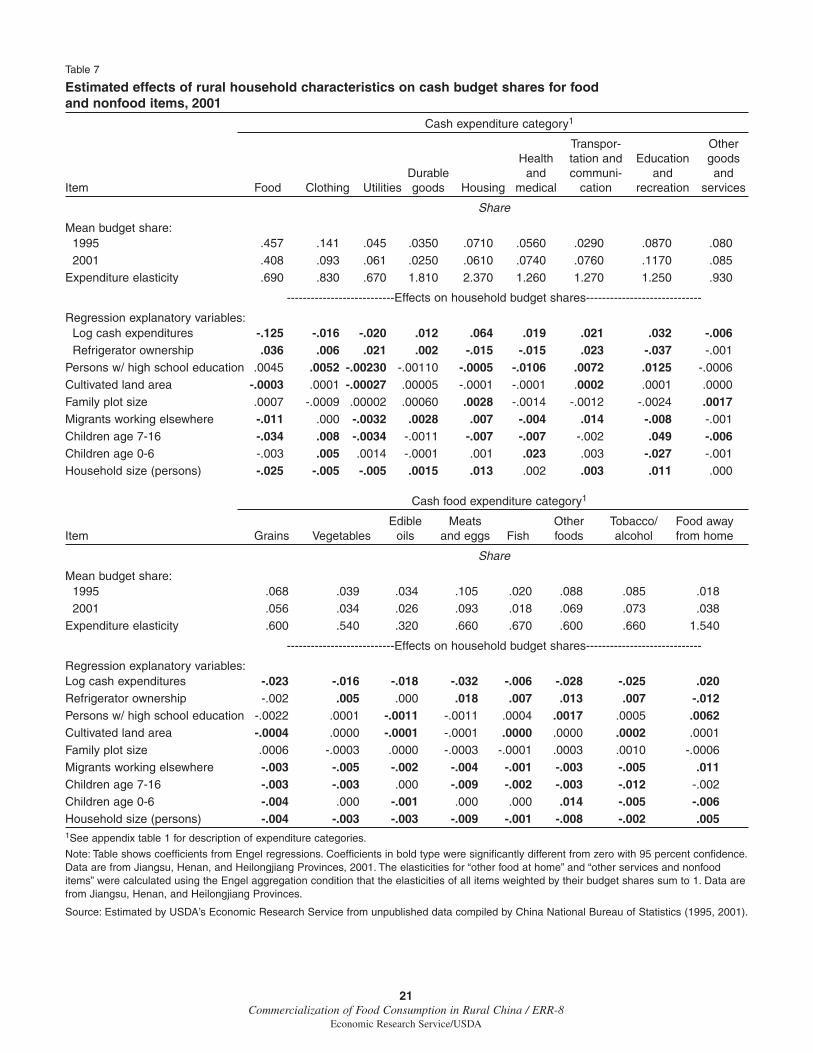
Food was the largest single use of cash for China’s rural households,accounting for 45.7 percent of cash expenditures in the sample during 1995(table 7). Food remained the largest single cash expenditure item in 2001,but its share of household budgets fell by 4.8 percentage points to 40.9percent. Clothing had the second-largest share of budgets, 14.1 percent, in1995, but its share fell by nearly 5 percentage points by 2001. In 2001,education and recreation (primarily school fees and education-relatedexpenses)5 accounted for the second-largest share of budgets, at 11.7percent. Spending on durable goods was low, on average, at 2.5 percent ofbudgets. Other expenditures were distributed relatively evenly across other
5 For this study, we made somechanges to the usual categorization ofhousehold expenditures used by ChinaNational Bureau of Statistics (see app.table 1). A “durable goods” categorywas created, which includes electricaland mechanical devices (usuallyincluded in the education and recre-ation category) and household appli-ances and furniture (usuallycategorized with household items).This study’s “education and recre-ation” category includes primarilyeducation-related services and goods,while the “durable goods” categoryincludes primarily consumer goods.Utilities and housing were categorizedseparately. Nondurable householditems were included in the “other non-food” category.
20Commercialization of Food Consumption in Rural China / ERR-8
Economic Research Service/USDA
Table 6
Changes in household characteristics and estimated effects on cash and noncash food expenditures
Sample mean Effect on household budget share (2001):Characteristic Unit 1995 2001 Cash food Noncash food Nonfood
Log of household expenditure Logarithm 7.42 7.57 -.0650 -.1150 .1800Refrigerator owned Number .04 .12 .0400 -.0310 -.0100Migrants working outside hometown Number .11 .36 -.0070 -.0020 .0100Size of household Persons 4.30 4.00 -.0150 -.0090 .0240Cultivated land area Mu 10.80 12.10 -.0006 .0010 -.0003Family plot size Mu .70 .30 .0001 .0018 -.0020Children under age 6 Number .21 .19 -.0040 -.0020 .0060Children age 6-15 Number .74 .72 -.0200 -.0060 .0260Persons with senior high school education
or higher Number .32 .34 .0076 -.0144 .0068
Note: Coefficients were estimated from 2001 data using ordinary least squares. Coefficients in bold type are significantly different from zero with 95 percent confidence. Effects for the three budget shares sum to 0 for each characteristic. Data are from Jiangsu, Henan, andHeilongjiang Provinces.
Source: Estimated by USDA’s Economic Research Service from unpublished data compiled by China National Bureau of Statistics (1995, 2001).
21Commercialization of Food Consumption in Rural China / ERR-8
Economic Research Service/USDA
Table 7
Estimated effects of rural household characteristics on cash budget shares for food and nonfood items, 2001
Cash expenditure category1
Transpor- OtherHealth tation and Education goods
Durable and communi- and andItem Food Clothing Utilities goods Housing medical cation recreation services
Share
Mean budget share:1995 .457 .141 .045 .0350 .0710 .0560 .0290 .0870 .0802001 .408 .093 .061 .0250 .0610 .0740 .0760 .1170 .085
Expenditure elasticity .690 .830 .670 1.810 2.370 1.260 1.270 1.250 .930
---------------------------Effects on household budget shares-----------------------------
Regression explanatory variables:Log cash expenditures -.125 -.016 -.020 .012 .064 .019 .021 .032 -.006Refrigerator ownership .036 .006 .021 .002 -.015 -.015 .023 -.037 -.001
Persons w/ high school education .0045 .0052 -.00230 -.00110 -.0005 -.0106 .0072 .0125 -.0006Cultivated land area -.0003 .0001 -.00027 .00005 -.0001 -.0001 .0002 .0001 .0000Family plot size .0007 -.0009 .00002 .00060 .0028 -.0014 -.0012 -.0024 .0017Migrants working elsewhere -.011 .000 -.0032 .0028 .007 -.004 .014 -.008 -.001Children age 7-16 -.034 .008 -.0034 -.0011 -.007 -.007 -.002 .049 -.006Children age 0-6 -.003 .005 .0014 -.0001 .001 .023 .003 -.027 -.001Household size (persons) -.025 -.005 -.005 .0015 .013 .002 .003 .011 .000
Cash food expenditure category1
Edible Meats Other Tobacco/ Food away Item Grains Vegetables oils and eggs Fish foods alcohol from home
Share
Mean budget share:1995 .068 .039 .034 .105 .020 .088 .085 .0182001 .056 .034 .026 .093 .018 .069 .073 .038
Expenditure elasticity .600 .540 .320 .660 .670 .600 .660 1.540
---------------------------Effects on household budget shares-----------------------------
Regression explanatory variables:Log cash expenditures -.023 -.016 -.018 -.032 -.006 -.028 -.025 .020Refrigerator ownership -.002 .005 .000 .018 .007 .013 .007 -.012Persons w/ high school education -.0022 .0001 -.0011 -.0011 .0004 .0017 .0005 .0062Cultivated land area -.0004 .0000 -.0001 -.0001 .0000 .0000 .0002 .0001Family plot size .0006 -.0003 .0000 -.0003 -.0001 .0003 .0010 -.0006Migrants working elsewhere -.003 -.005 -.002 -.004 -.001 -.003 -.005 .011Children age 7-16 -.003 -.003 .000 -.009 -.002 -.003 -.012 -.002Children age 0-6 -.004 .000 -.001 .000 .000 .014 -.005 -.006Household size (persons) -.004 -.003 -.003 -.009 -.001 -.008 -.002 .0051See appendix table 1 for description of expenditure categories.
Note: Table shows coefficients from Engel regressions. Coefficients in bold type were significantly different from zero with 95 percent confidence.Data are from Jiangsu, Henan, and Heilongjiang Provinces, 2001. The elasticities for “other food at home” and “other services and nonfooditems” were calculated using the Engel aggregation condition that the elasticities of all items weighted by their budget shares sum to 1. Data arefrom Jiangsu, Henan, and Heilongjiang Provinces.
Source: Estimated by USDA’s Economic Research Service from unpublished data compiled by China National Bureau of Statistics (1995, 2001).
categories. Housing accounted for only 6.1 percent of expenditures in 2001.Most rural Chinese households build or refurbish their own houses, oftenwith unpaid help from neighbors and friends, on land allocated by theirvillage. Few rural Chinese families pay rent or mortgages. Housingexpenses may be unusually high in a year when construction takes place andminimal in other years.
Engel regressions for various cash expenditure categories indicate that ruralhouseholds tend to spend additional cash disproportionately on nonfooditems, such as housing, education and recreation, health care, transportationand communications, and durable goods.6 Food, clothing, and utilities (elec-tricity, fuel, and water) are “necessities” for which the budget share declinesas expenditures rise. The food cash expenditure elasticity was .69, signifi-cantly less than 1. All nonfood items except clothing and utilities had cashexpenditure elasticities of 1 or higher. Housing had the largest cash expendi-ture elasticity of any major item, at 2.37, followed by durable goods, at1.81. The elasticities for health, transportation and communications, andeducation and recreation were in a narrow range of 1.25 to 1.27. The elas-ticity for other goods (mainly household goods and services, jewelry,cosmetics, and funerals and other services) was .93.
The changes in mean budget shares between 1995 and 2001 are not entirelyconsistent with the expenditure elasticities. The mean per capita cash livingexpenditure in the sample rose more than 50 percent between 1995 and2001. The budget shares devoted to food and clothing fell sharply, consis-tent with their low expenditure elasticities, but the budget shares for housingand durable goods—the categories with the highest elasticities—also fell.Price changes and cyclical factors may have influenced the budget sharesfor the 2 years. China’s rural economy was growing rapidly during 1995,but it was in a period of retrenchment in 2001. Rural housing constructionand purchases of “big ticket” durable goods, such as home appliances, tele-visions, and furniture, may have been unusually low during 2001 due toslow income growth that year.7 Declining food and clothing prices may haveexaggerated the decline in food and clothing budget shares. Wider avail-ability of electricity, water, and fuels in rural areas and increased fees forutilities may have boosted the utilities budget share. Transportation andcommunication’s share of budgets rose sharply as the rural populationbecame more mobile, thus paying more bus and rail fares and purchasingbicycles and scooters. Telephones and other communications systems alsobecame more widely available in rural China by 2001.
Food away from home clearly stands out as the one food expenditure itemthat is taking a larger share of household budgets as expenditures rise (seebox, “Rapid Growth in Away-From-Home Food Spending”). Between 1995and 2001, all at-home food items had decreasing cash budget shares andcash expenditure elasticities mostly in the range of .6 to .8, significantly lessthan 1. Food away from home’s share doubled from just 1.8 percent ofexpenditures in 1995 to 3.7 percent in 2001. Food away from home’s cashexpenditure elasticity was one of the largest of any category, food ornonfood. Food away from home’s expenditure elasticity was about equal tothat of durable goods, but the food away from home share of rural budgetsexceeded that of durable goods in 2001.
22Commercialization of Food Consumption in Rural China / ERR-8
Economic Research Service/USDA
6 Results estimated from data for1995, but not reported here, weremostly similar to the estimates for 2001.
7 Data on fixed asset investmentshow that rural household investmentincreased sharply in 1995 and fell in2001 (China National Bureau ofStatistics, Rural Survey Organization,2003).
23Commercialization of Food Consumption in Rural China / ERR-8
Economic Research Service/USDA
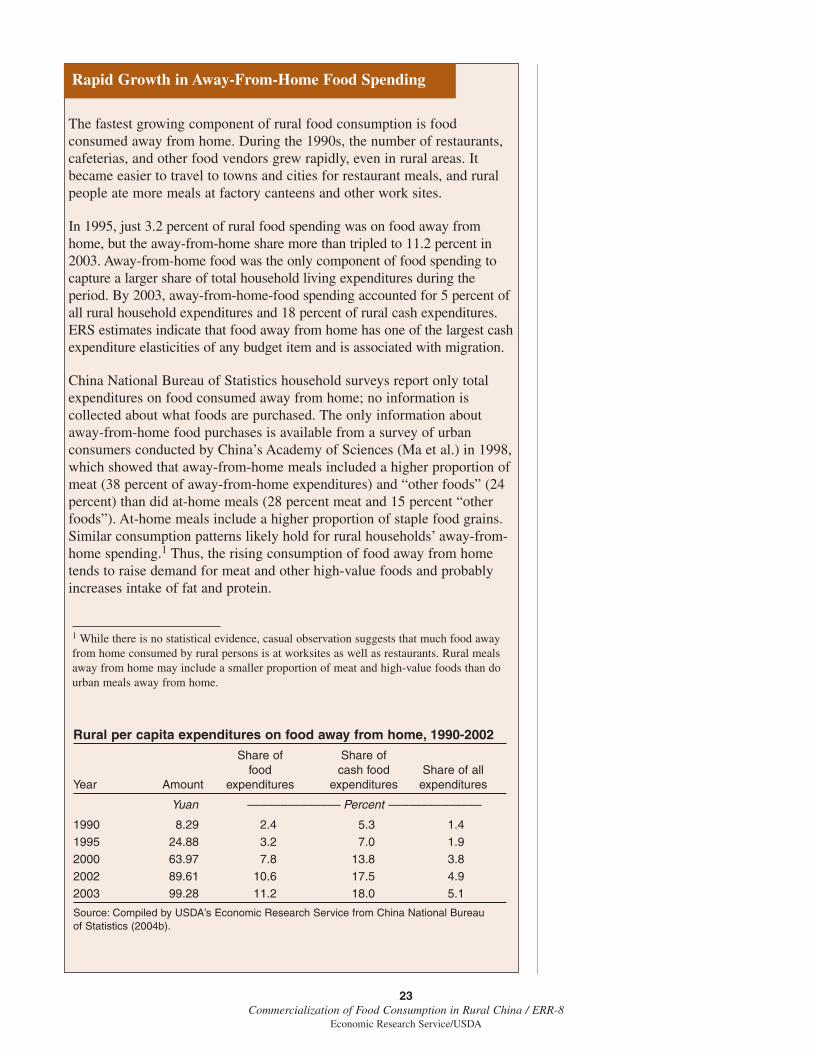
The fastest growing component of rural food consumption is foodconsumed away from home. During the 1990s, the number of restaurants,cafeterias, and other food vendors grew rapidly, even in rural areas. Itbecame easier to travel to towns and cities for restaurant meals, and ruralpeople ate more meals at factory canteens and other work sites.
In 1995, just 3.2 percent of rural food spending was on food away fromhome, but the away-from-home share more than tripled to 11.2 percent in2003. Away-from-home food was the only component of food spending tocapture a larger share of total household living expenditures during theperiod. By 2003, away-from-home-food spending accounted for 5 percent ofall rural household expenditures and 18 percent of rural cash expenditures.ERS estimates indicate that food away from home has one of the largest cashexpenditure elasticities of any budget item and is associated with migration.
China National Bureau of Statistics household surveys report only totalexpenditures on food consumed away from home; no information iscollected about what foods are purchased. The only information aboutaway-from-home food purchases is available from a survey of urbanconsumers conducted by China’s Academy of Sciences (Ma et al.) in 1998,which showed that away-from-home meals included a higher proportion ofmeat (38 percent of away-from-home expenditures) and “other foods” (24percent) than did at-home meals (28 percent meat and 15 percent “otherfoods”). At-home meals include a higher proportion of staple food grains.Similar consumption patterns likely hold for rural households’ away-from-home spending.1 Thus, the rising consumption of food away from hometends to raise demand for meat and other high-value foods and probablyincreases intake of fat and protein.
Rapid Growth in Away-From-Home Food Spending
Rural per capita expenditures on food away from home, 1990-2002
Share of Share offood cash food Share of all
Year Amount expenditures expenditures expenditures
Yuan –––––––––––––– Percent ––––––––––––––
1990 8.29 2.4 5.3 1.41995 24.88 3.2 7.0 1.92000 63.97 7.8 13.8 3.82002 89.61 10.6 17.5 4.92003 99.28 11.2 18.0 5.1
Source: Compiled by USDA’s Economic Research Service from China National Bureau of Statistics (2004b).
1 While there is no statistical evidence, casual observation suggests that much food awayfrom home consumed by rural persons is at worksites as well as restaurants. Rural mealsaway from home may include a smaller proportion of meat and high-value foods than dourban meals away from home.
All at-home food items had decreasing shares of cash budgets between 1995and 2001, and their cash expenditure elasticities were all .67 or lower.Among specific at-home food items, meat and eggs accounted for thelargest share of cash expenditures, followed by tobacco and alcohol. Whilegrain and vegetables accounted for the largest part of the rural Chinese diet,their share of cash expenditures was relatively low because these commodi-ties were largely self-produced, not purchased. Edible oils (.32) and vegeta-bles (.54) had the smallest cash expenditure elasticities. Other cashexpenditure elasticities of at-home food items ranged from .60 to .67.
The cash expenditure models also estimated the effects of household charac-teristics. As in the earlier analysis, refrigerator ownership tends to be associ-ated with greater cash food expenditures. The expenditure equations forspecific food categories show that refrigerator ownership is most stronglyassociated with meat expenditures, followed by “other foods” (including milkand processed foods) and fish. This pattern suggests, not surprisingly, thathouseholds owning refrigerators tend to spend more on perishable foods.
Households with larger cultivated land area tended to make slightly lowercash expenditures on food, especially on grain, but family plots were notsignificantly associated with food expenditures. Households with migrantmembers working elsewhere tended to spend more on food away from homeand transportation/communications and less on at-home food items. House-holds with high school-educated members (most rural people have a juniormiddle school or primary school education) tended to spend slightly moreon food away from home and “other food” (dairy, fruit, and processedfoods) and less on health care. Lower health care spending may reflectaccess to subsidized health care for more educated persons who are morelikely to be employed by government organizations.
Family composition affects how households allocate their spending. Thepresence of school-age children is associated with larger cash expenditureson education and less on food and most other categories. This reflects risingschool fees in rural areas, which apparently has induced families withschool-age children to divert cash away from other items to pay for educa-tion. The negative effect associated with school-age children is strongest fortobacco and alcohol. The presence of children under age 7 is associated withgreater spending on “other food” (probably reflecting greater spending ondairy products) and health care. Larger family size is associated with greaterbudget shares devoted to housing and education and less devoted to at-homefood and most nonfood items.
Summary of Household Expenditure Analysis
This analysis confirms that rural households in China tend to spend adisproportionate amount of their incremental income on nonfood goods andservices, especially housing and education. The shift in food expendituresfrom noncash (self-produced) to cash (purchased) food occurred faster thancan be explained by growth in expenditure. The shift might be explained inpart by rising refrigerator ownership (which boosts spending on perishablefoods) and migration (which shifts spending to food away from home and
24Commercialization of Food Consumption in Rural China / ERR-8
Economic Research Service/USDA

transportation and communications), but most of the change was due tofactors not included in the model, which may have included the spread ofmarkets and retail stores to rural areas, better transportation, and more infor-mation about markets and food products. Spending on food away fromhome is one of the fastest rising expenditure items in rural China. In 2001,expenditures on food away from home exceeded expenditures on durablegoods. Changes in China’s rural economy over time seem to have resultedin shifting of expenditures to education, transportation, communications,electricity, water, and fuel.
25Commercialization of Food Consumption in Rural China / ERR-8
Economic Research Service/USDA
China’s rural population, numbering 700 to 800 million, is beginning toattract the attention of food retailers. Changing rural food consumptionpatterns will also have an effect on cropping patterns. As commercializationincreases, more food will pass through markets instead of being consumedon the farms where it is grown. Increased consumption of purchased food isalso altering the character of rural diets.
Emergence of the Rural Market
China’s rural population has long been ignored by food retailers but is nowemerging as a viable market. Cash food expenditures by rural households in2003 totaled over $50 billion. The rural market is beginning to attract the atten-tion of retailers and product distributors who are encountering intense competi-tion for urban Chinese markets. As rural food consumption continues tocommercialize, more food will pass through markets, more food will beprocessed, and more value will be added to food products through distributionand marketing. This, in turn, will create many new market opportunities infood processing, marketing, and retail. In recent years, supermarket chainshave opened outlets in rural areas, and the Chinese government is activelyencouraging the development of rural retail networks, including the transfor-mation of rural market fairs into modern supermarkets.
Food consumed away from home is one of the fastest growing segments ofrural household expenditures. Estimated expenditure elasticity of 1.5suggests that 10-percent annual growth in rural household expenditureswould increase away-from-home food expenditures by 15 percent annu-ally. This suggests double-digit growth in restaurants, cafeterias, streetvendors, and other food service establishments serving the rural popula-tion. Per capita expenditures suggest that rural households spend $9billion per year on food away from home, and a 15-percent growth ratewould generate more than $1 billion in annual growth for the rural foodservice sector.
Rural household expenditures on food consumed at home have grown moreslowly than expenditures on other items, but income growth of 10 percentshould lead to at-home cash food expenditure growth of about 7 percent, ormore than $2 billion annually. Sales in rural supermarkets and conveniencestores may grow in double digits as rural households shift their expendituresaway from wet markets, roadside vendors, and informal exchange to modernfood stores.
While China’s rural market is large, it is widely dispersed over 31provinces, more than 2,000 counties, and 700,000 villages. Commercial-ization of food is advanced in the rural areas of China’s east coast, but has
26Commercialization of Food Consumption in Rural China / ERR-8
Economic Research Service/USDA
Chapter 4
Implications of Rural Food Commercialization

been slower in many poorer provinces of China’s hinterland. However,these regional differences are diminishing due to an array of factors,including construction of new roads, availability of automobile and bustransportation, dissemination of mobile phones, television, the Internet andother communications to rural areas, reduced barriers to interprovincialtrade, the emergence of national retail chains, and government policy thatencourages investment and economic development in central and westernprovinces.
Adjustment in Crop Plantings
As consumption of self-produced food declines in rural China, farms willdevote less cropland to small-scale rice, wheat, and vegetable production forfamily subsistence. The freed-up cropland used for rice and wheat in coastalareas of China will likely be diverted to produce high-value commercialcrops, such as vegetables, fruits, specialty crops, and concentrated livestockproduction. Grain production will likely become more concentrated onlarger farms in central and northeastern regions of China that have acomparative advantage in producing grain. Greater consumption of livestockproducts will require either more land devoted to feed grains and oilseeds orgreater imports of feed grains and livestock products.
Such adjustments are constrained by China’s land tenure system thatfeatures communal village ownership of agricultural land. Village authori-ties allocate small plots on an egalitarian basis to village members, whohold long-term leases on the land. Sub-leasing arrangements are possible inmany villages, but land can only be sold by village authorities. The landtenure system ensures that nearly all rural households have enough land togrow their own food, but lack of land markets prevents structural adjust-ments from taking place.
More Food Enters Markets
Historically, the high rate of food self-sufficiency in rural China meant thatmost food never left the farms where it was grown. Rural householdsurveys indicate that only 25 percent of grain produced in 1985 was sold tomarkets, while 75 percent was consumed by farm families, used as feed orseed, or stored on farms. Most other food commodities were also primarilyused on farms.
With rising productivity and declining consumption of self-producedcommodities, a larger proportion of agricultural products are enteringmarket channels. For example, rural household surveys indicate that theamount of grain sold per rural household member rose from 180 kg. in 1995to 300 kg. in 2003, an increase of 120 kg., or 66 percent (fig. 9). In 1995,rural households consumed significantly more grain than they sold. In 2003,the proportions were reversed, as sales exceeded consumption. Marketingsof other agricultural commodities also increased during this period. Therising proportion of commodities sold means that farmers are producingmore for markets than for their own consumption.
27Commercialization of Food Consumption in Rural China / ERR-8
Economic Research Service/USDA
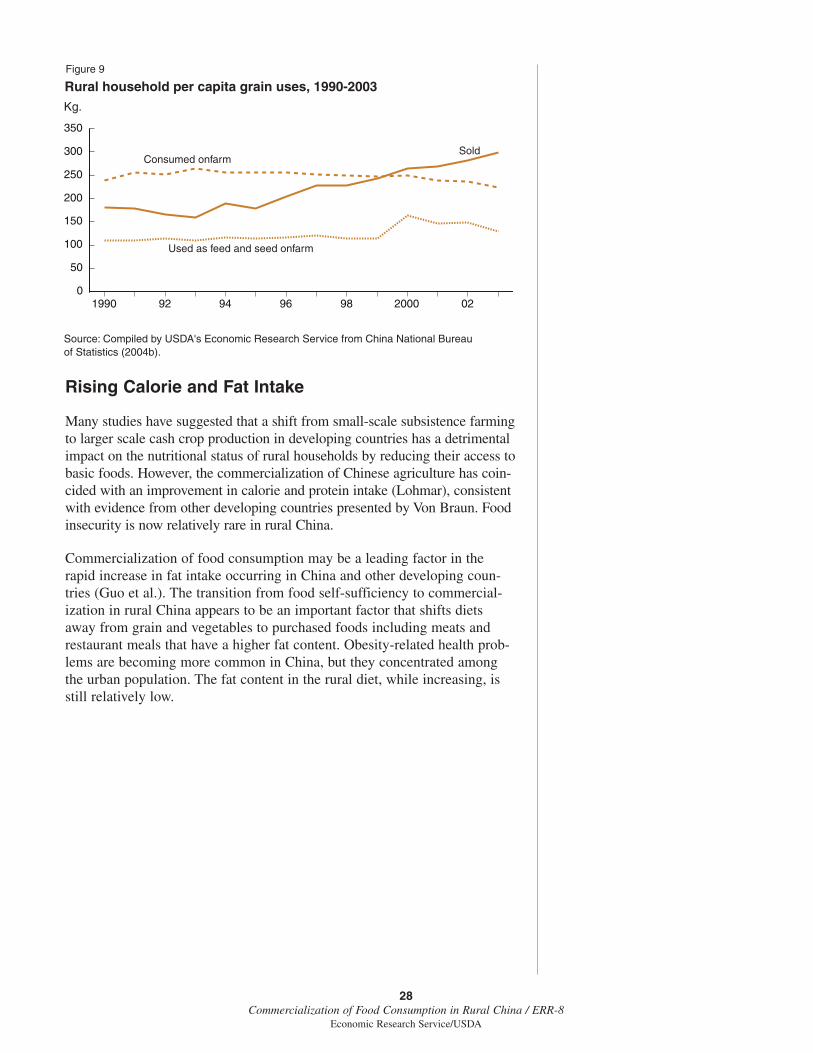
Rising Calorie and Fat Intake
Many studies have suggested that a shift from small-scale subsistence farmingto larger scale cash crop production in developing countries has a detrimentalimpact on the nutritional status of rural households by reducing their access tobasic foods. However, the commercialization of Chinese agriculture has coin-cided with an improvement in calorie and protein intake (Lohmar), consistentwith evidence from other developing countries presented by Von Braun. Foodinsecurity is now relatively rare in rural China.
Commercialization of food consumption may be a leading factor in therapid increase in fat intake occurring in China and other developing coun-tries (Guo et al.). The transition from food self-sufficiency to commercial-ization in rural China appears to be an important factor that shifts dietsaway from grain and vegetables to purchased foods including meats andrestaurant meals that have a higher fat content. Obesity-related health prob-lems are becoming more common in China, but they concentrated amongthe urban population. The fat content in the rural diet, while increasing, isstill relatively low.
28Commercialization of Food Consumption in Rural China / ERR-8
Economic Research Service/USDA
Figure 9
Rural household per capita grain uses, 1990-2003
Source: Compiled by USDA's Economic Research Service from China National Bureau of Statistics (2004b).
Kg.
Used as feed and seed onfarm
SoldConsumed onfarm
1990 92 94 96 98 2000 020
50
100
150
200
250
300
350
Chinese rural households are able to meet most of their basic nutritionalrequirements at minimal expense by consuming self-produced food, mostlygrains and vegetables. This self-sufficiency strategy frees up scarce cash forexpenditures on housing, school fees, and other nonfood expenditure items.Even well-off rural households self-supply a large portion of their food.Self-sufficiency may be a rational response to the lack of cash income andlimited access to retail food markets in rural China.
Now that rural households are entering the mainstream of the Chineseeconomy, they are becoming less reliant on subsistence food production.This study finds that households reduced consumption of self-produced foodand increased purchases of food at a rate faster than can be explained byincome growth or changes in other household characteristics during the late1990s and early 21st century.
The reasons for the shift away from self-produced food consumption are notclear. The development of markets cited by Huang and Rozelle, includingimproved transportation infrastructure and the opening of rural supermarketsand restaurants, could be contributing to the shift. The increased migrationand travel of rural persons probably also promotes cash food expenditures,especially consumption of food at work sites and cafeterias. Increasingownership of refrigerators, other kitchen appliances, and availability of elec-tricity are also hastening the shift away from subsistence. Decliningconsumption of self-produced grain could partly reflect farmers’ shift awayfrom grain production toward cash crops as rural households have beengiven greater freedom in choosing what to plant.
China’s transition to commercialized food consumption may have beenespecially fast due to its unprecedented rapid economic growth (8-10percent annual GDP growth since 1978), market liberalization, infrastruc-ture development, and increasing integration between the rural and urbaneconomies. In contrast, it is interesting to note that self-sufficiency in foodproduction increased in some Eastern European countries following theirtransition from central planning to market economies in the 1990s (Kostovand Linguard). This may have been a rational response to deterioratingeconomic security (high unemployment and inflation) and distribution ofland from large state farms to individuals during this period.
In the 21st century, it is likely that self-production of food will diminish andcommercialization of rural food markets in China will continue. This willbring tens of millions of consumers into the global food system and putmore agricultural commodities into formal market channels. While theimpact of each farm household’s increased cash food expenditure is small,the vast size of the rural population means that commercialization will havea significant impact on world food markets.
29Commercialization of Food Consumption in Rural China / ERR-8
Economic Research Service/USDA
Conclusions
China National Bureau of Statistics. China Statistical Yearbook 2004,Beijing: China Statistics Press, 2004a.
China National Bureau of Statistics, Rural Survey Organization. ChinaRural Household Survey Yearbook 2004, Beijing: China Statistics Press,2004b.
China National Bureau of Statistics, Urban Survey Organization. ChinaPrice and Urban Household Expenditure Survey Statistical Yearbook2003, Beijing: China Statistics Press, 2003a.
China National Bureau of Statistics, Rural Survey Organization. Researchon Investment in Rural Area of China, Beijing: China Statistics Press,2003b.
China National Bureau of Statistics, Rural Survey Organization. ChinaRural Household Survey, unpublished micro data for Heilongjiang,Henan, and Jiangsu Provinces, various years.
Gale, H. Frederick. “China’s Growing Affluence: How Food Markets AreResponding,” Amber Waves, Vol. 1, Issue 3, June 2003, pp. 14-21.
Gilmour, Brad, and Fred Gale. “A Maturing Retail Sector: Wider Channelsfor Food Imports?” in China’s Food and Agriculture: Issues for the 21stCentury, Fred Gale (ed.), Agriculture Information Bulletin 775, U.S.Department of Agriculture, Economic Research Service, April 2002, pp.14-16.
Guo, X., T.A. Mroz, B.M. Popkin, and F. Zhai. “Structural Change in theImpact of Income on Food Consumption in China, 1989-1993.”Economic Development and Cultural Change, Vol. 48, No. 4, July 2000,pp. 737-760.
Hsu, Hsin-Hui, Wen S. Chern, and Fred Gale. “How Will Rising IncomeAffect the Structure of Food Demand?” in China’s Food and Agriculture:Issues for the 21st Century, Fred Gale (ed.), Agriculture InformationBulletin 775, U.S. Department of Agriculture, Economic ResearchService, April 2002, pp. 10-13.
Huang, Jikun, and Cristina C. David. “Demand for Cereal Grains in Asia: TheEffect of Urbanization,” Agricultural Economics 8(1993), pp. 107-124.
Huang, Jikun, and Scott Rozelle. “Market Development and Food Demandin Rural China,” China Economic Review, Vol. 9, No. 1, 1998, pp. 25-45.
Kostov, P., and J. Lingard. “Subsistence Farming in Transitional Economies:Lessons From Bulgaria,” Journal of Rural Studies, Vol. 18, No. 1, 2002,pp. 83-94.
Lohmar, B. “Market Reforms and Policy Initiatives: Rapid Growth andFood Security in China,” Food Security Assessment, Outlook Report No.GFA13, U.S. Department of Agriculture, Economic Research Service,April 2002, pp. 22-30.
30Commercialization of Food Consumption in Rural China / ERR-8
Economic Research Service/USDA
References

Ma, Hengyun, Jikun Huang, Scott Rozelle, and Frank Fuller. “Getting Richand Eating Out: Consumption of Food Away From Home in UrbanChina,” Working Paper 02-E11, Chinese Center for Agricultural Policy,2002.
National Development and Reform Commission. National AgriculturalProducts Production Cost and Profit Data, Beijing: China StatisticsPress, 2004.
Popkin, B.M. “Nutrition in Transition: The Changing Global NutritionChallenge,” Asia Pacific J. Clin. Nutrition, Vol. 10 (suppl), 2001,S13-S18.
Seale, J., A. Regmi, and J. Bernstein. International Evidence on FoodConsumption Patterns, Technical Bulletin 1904, U.S. Department ofAgriculture, Economic Research Service, October 2003.
Singh, I.J., L. Squire, and J. Strauss (eds.). Agricultural Household Models:Extension, Applications and Policy, Baltimore: The Johns HopkinsUniversity Press, 1986.
Tong, Han, T.I. Wahl, and R.C. Mittelhammer. “The Effect of Self-Sufficiencyon Fruit and Vegetable Consumption of China’s Rural Households,” Reviewof Agricultural Economics, Vol. 23, No. 1, pp. 176-184.
U.S. Bureau of Labor Statistics. The Consumer Expenditure Survey, onlinedatabase, accessed January 2005. http://www.bls.gov/cex/home.htm
Von Braun, Joachim. “Introduction and Overview,” in Joachim Von Braunand Eileen Kennedy (eds.), Agricultural Commercialization, EconomicDevelopment and Nutrition, Baltimore: The Johns Hopkins UniversityPress, 1994.
Wu, YanRui. China’s Consumer Revolution, Northhampton, MA: EdwardElgar, 1999.
Yan, Wenye. Food Demand in Rural China: An Application of AgriculturalHousehold Models, PhD dissertation, Ohio State University, 2005.
31Commercialization of Food Consumption in Rural China / ERR-8
Economic Research Service/USDA

China’s rural household survey (RHS), conducted annually by ChinaNational Bureau of Statistics, Rural Survey Organization (RSO), is a richsource of information on household consumption patterns. Unlike manysurveys that record food purchases over a few weeks or rely on respondentrecall, the RHS collects consumption, purchase, and expenditure data usingdiaries kept over the course of an entire year.
The survey is designed to monitor growth in income and living standardsand evaluate progress in China’s efforts to alleviate poverty by collectingdetailed information on the production, exchange, consumption, asset accu-mulation, and social activities of a national sample of rural residents. Dataare used for rural policymaking at all levels of government and forcompiling national economic accounts.
The survey collects data from 68,000 households in about 9,000 villages of857 counties selected from the 31 provinces, autonomous regions, andmunicipalities using a complex multistage stratified sampling method. Arepresentative sample of counties is chosen from each province, and samplevillages are selected from the counties. A stratified sample of households ischosen from each of the sample villages. Stratification is based on per capitanet income, supplemented by population. The sample is representative at thenational and provincial levels. The sample of households is systematicallyrotated over a 5-year cycle.
The RHS collects information on 1,000 items, including (1) village-levelcharacteristics, (2) basic household information, (3) production and sales,(4) total income, expenditure, and net income, (5) total cash income andcash expenditure, (6) grain balance, and (7) food consumption. Expenditurecategories are shown in appendix table 1.
Respondents record all economic activities (production, purchases, sales,consumption) in a diary over the course of the entire year. Respondenthouseholds record both cash and in-kind transactions. Local assistantenumerators periodically visit households to record, check, and organize thediary book and to assist illiterate respondents. County interviewers often goto villages to supervise the recording, to provide guidance or help, and tocollect the diary books periodically. At the end of each calendar year, inter-views are arranged to collect community information, data on individuals,and some additional household information such as fixed asset ownership.
After the diary records are coded, the data are entered into a computer andchecked in the county survey branch. County survey branches send datadiskettes to provincial organizations and then to RSO in Beijing. RSO andprovincial organizations check, aggregate, and tabulate the data. Tabulationsof the data are published in annual and quarterly statistical reports and inresearch papers.
Information about consumption and expenditures are collected in detailthrough recording the quantity and purchase price, family consumption, and
32Commercialization of Food Consumption in Rural China / ERR-8
Economic Research Service/USDA
Appendix—China Rural Household Survey
durable goods owned at year-end. Average selling prices are used to imputethe value of in-kind consumption. Consumption information is classifiedinto eight aspects: food; clothing; residence; household facilities, articlesand services; medicines and medical services; transport and post-telecom-munication services; cultural, educational, recreational articles and services;and other commodities and services. Consumption expenditure refers to theoutlay during the survey period. The survey records actual expenditure forpurchasing houses, housing material, and durable consumer goods ratherthan imputed rent.
33Commercialization of Food Consumption in Rural China / ERR-8
Economic Research Service/USDA
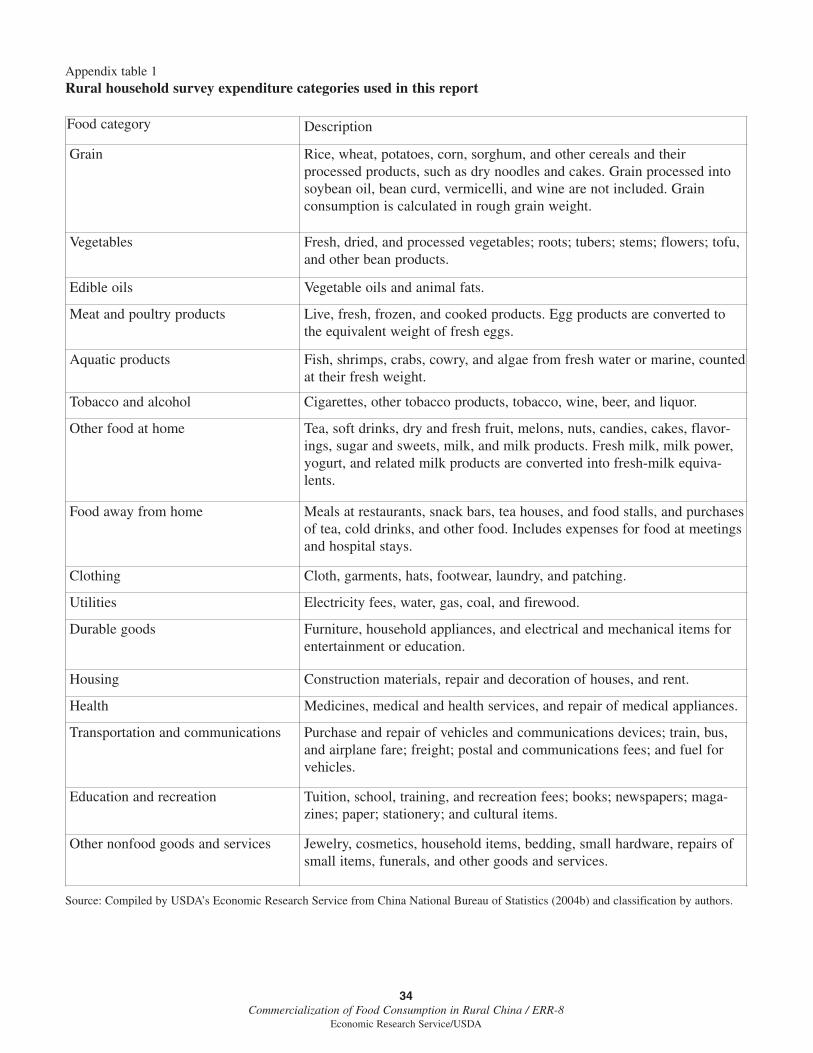
Appendix table 1Rural household survey expenditure categories used in this report
34Commercialization of Food Consumption in Rural China / ERR-8
Economic Research Service/USDA
Food category Description
Grain Rice, wheat, potatoes, corn, sorghum, and other cereals and theirprocessed products, such as dry noodles and cakes. Grain processed intosoybean oil, bean curd, vermicelli, and wine are not included. Grainconsumption is calculated in rough grain weight.
Vegetables Fresh, dried, and processed vegetables; roots; tubers; stems; flowers; tofu,and other bean products.
Edible oils Vegetable oils and animal fats.
Meat and poultry products Live, fresh, frozen, and cooked products. Egg products are converted tothe equivalent weight of fresh eggs.
Aquatic products Fish, shrimps, crabs, cowry, and algae from fresh water or marine, countedat their fresh weight.
Tobacco and alcohol Cigarettes, other tobacco products, tobacco, wine, beer, and liquor.
Other food at home Tea, soft drinks, dry and fresh fruit, melons, nuts, candies, cakes, flavor-ings, sugar and sweets, milk, and milk products. Fresh milk, milk power,yogurt, and related milk products are converted into fresh-milk equiva-lents.
Food away from home Meals at restaurants, snack bars, tea houses, and food stalls, and purchasesof tea, cold drinks, and other food. Includes expenses for food at meetingsand hospital stays.
Clothing Cloth, garments, hats, footwear, laundry, and patching.
Utilities Electricity fees, water, gas, coal, and firewood.
Durable goods Furniture, household appliances, and electrical and mechanical items forentertainment or education.
Housing Construction materials, repair and decoration of houses, and rent.
Health Medicines, medical and health services, and repair of medical appliances.
Transportation and communications Purchase and repair of vehicles and communications devices; train, bus,and airplane fare; freight; postal and communications fees; and fuel forvehicles.
Education and recreation Tuition, school, training, and recreation fees; books; newspapers; maga-zines; paper; stationery; and cultural items.
Other nonfood goods and services Jewelry, cosmetics, household items, bedding, small hardware, repairs ofsmall items, funerals, and other goods and services.
Source: Compiled by USDA’s Economic Research Service from China National Bureau of Statistics (2004b) and classification by authors.
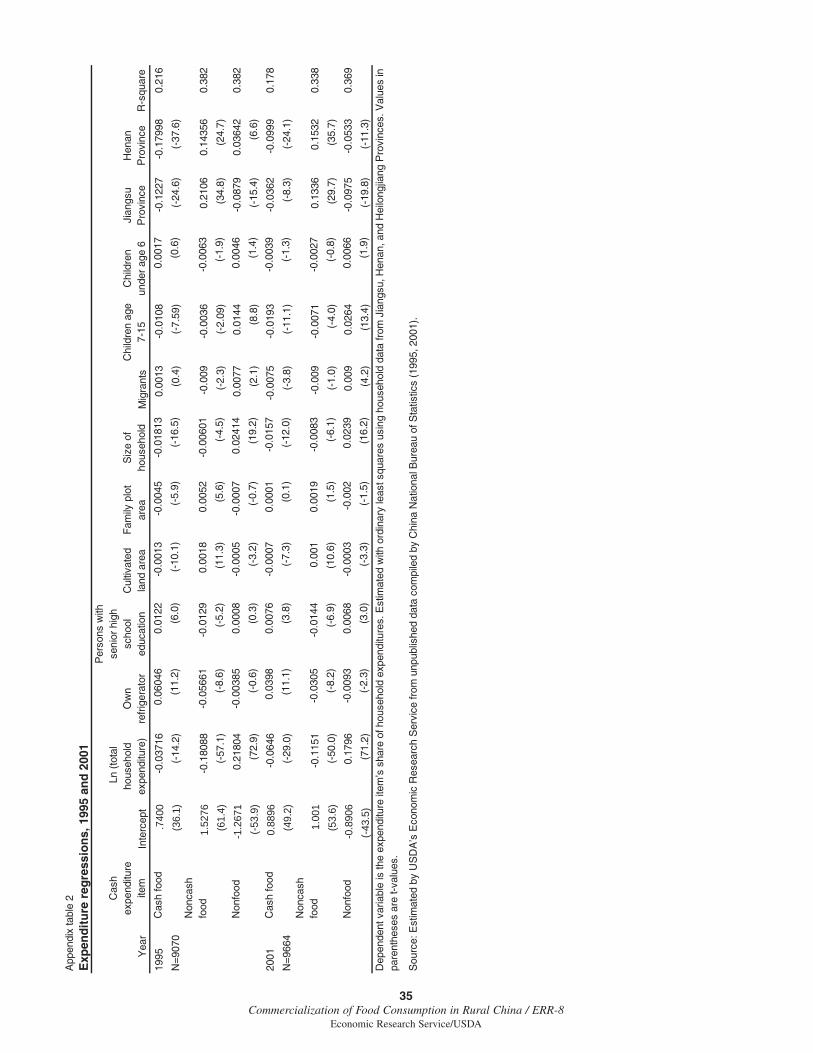
35Commercialization of Food Consumption in Rural China / ERR-8
Economic Research Service/USDA
App
endi
x ta
ble
2E
xpen
dit
ure
reg
ress
ion
s, 1
995
and
200
1
Yea
r
Cas
h ex
pend
iture
ite
m
Inte
rcep
t
Ln (
tota
l ho
useh
old
expe
nditu
re)
Ow
n re
frig
erat
or
Per
sons
with
se
nior
hig
h sc
hool
ed
ucat
ion
Cul
tivat
ed
land
are
aF
amily
plo
t ar
eaS
ize
of
hous
ehol
dM
igra
nts
Chi
ldre
n ag
e 7-
15C
hild
ren
unde
r ag
e 6
Jian
gsu
Pro
vinc
eH
enan
P
rovi
nce
R-s
quar
e
1995
Cas
h fo
od.7
400
-0.0
3716
0.06
046
0.01
22-0
.001
3-0
.004
5-0
.018
130.
0013
-0.0
108
0.00
17-0
.122
7-0
.179
980.
216
N=9
070
(36.
1)
(-14
.2)
(11.
2)
(
6.0)
(-10
.1)
(-5.
9)(-
16.5
)(0
.4)
(-
7.59
)(0
.6)
(-24
.6)
(-37
.6)
Non
cash
fo
od1.
5276
-0.1
8088
-0.0
5661
-0.0
129
0.00
180.
0052
-0.0
0601
-0.0
09-0
.003
6-0
.006
30.
2106
0.14
356
0.38
2
(61.
4)
(-57
.1)
(-8.
6)(-
5.2)
(
11.3
)
(5
.6)
(-4.
5)(-
2.3)
(-2.
09)
(-1.
9)(3
4.8)
(24.
7)
Non
food
-1.2
671
0.21
804
-0.0
0385
0.00
08-0
.000
5-0
.000
70.
0241
40.
0077
0.01
440.
0046
-0.0
879
0.03
642
0.38
2
(-53.
9)(7
2.9)
(-
0.6)
(0.
3)(-
3.2)
(-0.
7)
(1
9.2)
(2.1
)
(8.8
)
(1.
4)(-
15.4
)(6
.6)
2001
Cas
h fo
od0.
8896
-0.0
646
0.03
980.
0076
-0.0
007
0.00
01-0
.015
7-0
.007
5-0
.019
3-0
.003
9-0
.036
2-0
.099
90.
178
N=9
664
(49.
2)
(-29
.0)
(11.
1)
(
3.8)
(-7.
3)
(0
.1)
(-12
.0)
(-3.
8)(-
11.1
)(-
1.3)
(-8.
3)(-
24.1
)N
onca
sh
food
1.00
1-0
.115
1-0
.030
5-0
.014
40.
001
0.00
19-0
.008
3-0
.009
-0.0
071
-0.0
027
0.13
360.
1532
0.33
8
(53.
6)
(-50
.0)
(-8.
2)(-
6.9)
(
10.6
)
(1
.5)
(-6.
1)(-
1.0)
(-4.
0)(-
0.8)
(29.
7)
(3
5.7)
Non
food
-0.8
906
0.17
96-0
.009
30.
0068
-0.0
003
-0.0
020.
0239
0.00
90.
0264
0.00
66-0
.097
5-0
.053
30.
369
(-43.
5)(7
1.2)
(-
2.3)
(3.
0)(-
3.3)
(-1.
5)
(1
6.2)
(4.2
)
(13.
4)
(
1.9)
(-19
.8)
(-11
.3)
Dep
ende
nt v
aria
ble
is th
e ex
pend
iture
item
’s s
hare
of h
ouse
hold
exp
endi
ture
s. E
stim
ated
with
ord
inar
y le
ast s
quar
es u
sing
hou
seho
ld d
ata
from
Jia
ngsu
, Hen
an, a
nd H
eilo
ngjia
ng P
rovi
nces
. Val
ues
in
pare
nthe
ses
are
t-va
lues
.
Sou
rce:
Est
imat
ed b
y U
SD
A’s
Eco
nom
ic R
esea
rch
Ser
vice
from
unp
ublis
hed
data
com
pile
d by
Chi
na N
atio
nal B
urea
u of
Sta
tistic
s (1
995,
200
1).
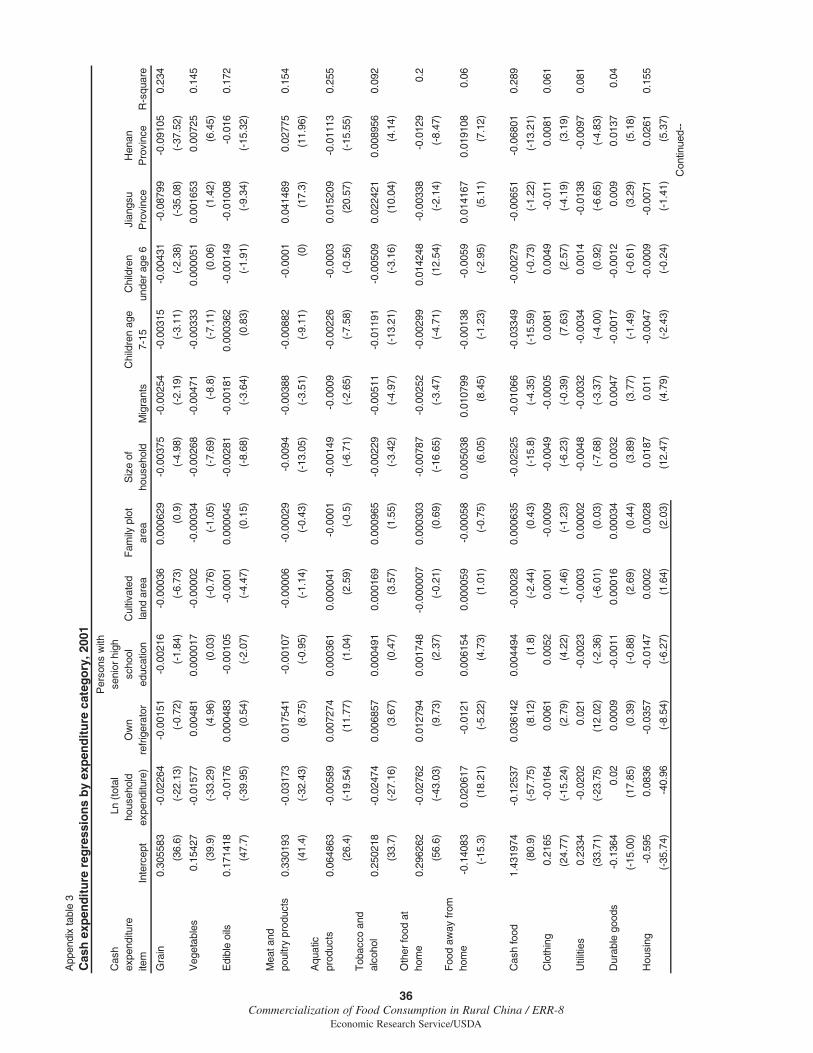
36Commercialization of Food Consumption in Rural China / ERR-8
Economic Research Service/USDA
App
endi
x ta
ble
3C
ash
exp
end
itur
e re
gre
ssio
ns
by
exp
end
itur
e ca
teg
ory
, 200
1
Cas
h ex
pend
iture
ite
m
Inte
rcep
t
Ln (
tota
l ho
useh
old
expe
nditu
re)
Ow
n re
frig
erat
or
Per
sons
with
se
nior
hig
h sc
hool
ed
ucat
ion
Cul
tivat
ed
land
are
aF
amily
plo
t ar
eaS
ize
of
hous
ehol
dM
igra
nts
Chi
ldre
n ag
e 7-
15C
hild
ren
unde
r ag
e 6
Jian
gsu
Pro
vinc
eH
enan
P
rovi
nce
R-s
quar
e
Gra
in0.
3055
83-0
.022
64-0
.001
51-0
.002
16-0
.000
360.
0006
29-0
.003
75-0
.002
54-0
.003
15-0
.004
31-0
.087
99-0
.091
050.
234
(36.
6)
(-
22.1
3)(-
0.72
)(-
1.84
)(-
6.73
)(0
.9)
(-
4.98
)(-
2.19
)(-
3.11
)(-
2.38
)(-
35.0
8)(-
37.5
2)
Veg
etab
les
0.15
427
-0.0
1577
0.00
481
0.00
0017
-0.0
0002
-0.0
0034
-0.0
0268
-0.0
0471
-0.0
0333
0.00
0051
0.00
1653
0.00
725
0.14
5
(39.
9)
(-
33.2
9)(4
.96)
(0.0
3)
(-
0.76
)(-
1.05
)(-
7.69
)(-
8.8)
(-7.
11)
(0.0
6)
(1
.42)
(6.4
5)
Edi
ble
oils
0.17
1418
-0.0
176
0.00
0483
-0.0
0105
-0.0
001
0.00
0045
-0.0
0281
-0.0
0181
0.00
0362
-0.0
0149
-0.0
1008
-0.0
160.
172
(47.
7)
(-
39.9
5)(0
.54)
(-2.
07)
(-4.
47)
(0.1
5)
(-
8.68
)(-
3.64
)(0
.83)
(-1.
91)
(-9.
34)
(-15
.32)
Mea
t and
po
ultr
y pr
oduc
ts0.
3301
93-0
.031
730.
0175
41-0
.001
07-0
.000
06-0
.000
29-0
.009
4-0
.003
88-0
.008
82-0
.000
10.
0414
890.
0277
50.
154
(41.
4)
(-
32.4
3)(8
.75)
(-0.
95)
(-1.
14)
(-0.
43)
(-13
.05)
(-3.
51)
(-9.
11)
(0)
(17.
3)
(1
1.96
)
A
quat
ic
prod
ucts
0.06
4863
-0.0
0589
0.00
7274
0.00
0361
0.00
0041
-0.0
001
-0.0
0149
-0.0
009
-0.0
0226
-0.0
003
0.01
5209
-0.0
1113
0.25
5
(26.
4)
(-
19.5
4)(1
1.77
)
(1
.04)
(2.5
9)
(-
0.5)
(-6.
71)
(-2.
65)
(-7.
58)
(-0.
56)
(20.
57)
(-
15.5
5)T
obac
co a
nd
alco
hol
0.25
0218
-0.0
2474
0.00
6857
0.00
0491
0.00
0169
0.00
0965
-0.0
0229
-0.0
0511
-0.0
1191
-0.0
0509
0.02
2421
0.00
8956
0.09
2
(33.
7)
(-
27.1
6)(3
.67)
(0.4
7)
(3
.57)
(1.5
5)
(-
3.42
)(-
4.97
)(-
13.2
1)(-
3.16
)(1
0.04
)
(4.1
4)
O
ther
food
at
hom
e0.
2962
62-0
.027
620.
0127
940.
0017
48-0
.000
007
0.00
0303
-0.0
0787
-0.0
0252
-0.0
0299
0.01
4248
-0.0
0338
-0.0
129
0.2
(56.
6)
(-
43.0
3)(9
.73)
(2.3
7)
(-
0.21
)(0
.69)
(-16
.65)
(-3.
47)
(-4.
71)
(12.
54)
(-2.
14)
(-8.
47)
Foo
d aw
ay fr
om
hom
e-0
.140
830.
0206
17-0
.012
10.
0061
540.
0000
59-0
.000
580.
0050
380.
0107
99-0
.001
38-0
.005
90.
0141
670.
0191
080.
06
(-15
.3)
(18.
21)
(-5.
22)
(4.7
3)
(1
.01)
(-0.
75)
(6.0
5)
(8
.45)
(-1.
23)
(-2.
95)
(5.1
1)
(7
.12)
Cas
h fo
od1.
4319
74-0
.125
370.
0361
420.
0044
94-0
.000
280.
0006
35-0
.025
25-0
.010
66-0
.033
49-0
.002
79-0
.006
51-0
.068
010.
289
(80.
9)
(-
57.7
5)(8
.12)
(1.8
)
(-2.
44)
(0.4
3)
(-
15.8
)(-
4.35
)(-
15.5
9)(-
0.73
)(-
1.22
)(-
13.2
1)
Clo
thin
g0.
2165
-0.0
164
0.00
610.
0052
0.00
01-0
.000
9-0
.004
9-0
.000
50.
0081
0.00
49-0
.011
0.00
810.
061
(24.
77)
(-
15.2
4)(2
.79)
(4.2
2)
(1
.46)
(-1.
23)
(-6.
23)
(-0.
39)
(7.6
3)
(2
.57)
(-4.
19)
(3.1
9)
Util
ities
0.23
34-0
.020
20.
021
-0.0
023
-0.0
003
0.00
002
-0.0
048
-0.0
032
-0.0
034
0.00
14-0
.013
8-0
.009
70.
081
(33.
71)
(-
23.7
5)(1
2.02
)
(-
2.36
)(-
6.01
)(0
.03)
(-7.
68)
(-3.
37)
(-4.
00)
(0.9
2)
(-
6.65
)(-
4.83
)
Dur
able
goo
ds-0
.136
40.
020.
0009
-0.0
011
0.00
016
0.00
034
0.00
320.
0047
-0.0
017
-0.0
012
0.00
90.
0137
0.04
(-15
.00)
(17.
85)
(0.3
9)
(-
0.88
)(2
.69)
(0.4
4)
(3
.89)
(3.7
7)
(-
1.49
)(-
0.61
)(3
.29)
(5.1
8)
Hou
sing
-0.5
950.
0836
-0.0
357
-0.0
147
0.00
020.
0028
0.01
870.
011
-0.0
047
-0.0
009
-0.0
071
0.02
610.
155
(-35
.74)
-40.
96(-
8.54
)(-
6.27
)(1
.64)
(2.0
3)
(1
2.47
)
(4
.79)
(-2.
43)
(-0.
24)
(-1.
41)
(5.3
7)
Con
tinue
d--

37Commercialization of Food Consumption in Rural China / ERR-8
Economic Research Service/USDA
App
endi
x ta
ble
3
Cas
h e
xpen
dit
ure
reg
ress
ion
s b
y ex
pen
dit
ure
cate
go
ry, 2
001—
Co
nti
nu
ed
Cas
h ex
pend
iture
ite
m
Inte
rcep
t
Ln (
tota
l ho
useh
old
expe
nditu
re)
Ow
n re
frig
erat
or
Per
sons
with
se
nior
hig
h sc
hool
ed
ucat
ion
Cul
tivat
ed
land
are
aF
amily
plo
t ar
eaS
ize
of
hous
ehol
dM
igra
nts
Chi
ldre
n ag
e 7-
15C
hild
ren
unde
r ag
e 6
Jian
gsu
Pro
vinc
eH
enan
P
rovi
nce
R-s
quar
e
Hea
lth
and
med
ical
(-3.
47)
(11.
29)
(-4.
24)
(-5.
38)
(-1.
15)
(-1.
16)
(2.1
2)
(-
1.95
)(-
4.39
)(7
.37)
(-4.
93)
(-3.
21)
Tra
nspo
rtat
ion
and
com
mun
icat
ions
(-7.
16)
(14.
27)
(7.6
6)
(4
.33)
(2.5
7)
(-
1.23
)(2
.31)
(8.3
5)
(-
1.32
)(1
.21)
(-0.
87)
(-1.
87)
Edu
catio
n an
d re
crea
tion
-0.1
920.
0327
-0.0
362
0.01
250.
0001
-0.0
024
0.01
-0.0
086
0.04
97-0
.026
70.
040.
0263
0.14
(-11
.34)
(15.
74)
(-8.
5)(5
.25)
(1.1
5)
(-
1.66
)(6
.53)
(-3.
66)
(24.
19)
(-7.
27)
(7.8
7)
(5
.35)
Oth
er n
onfo
od
good
s an
d se
rvic
es-0
.033
80.
0086
-0.0
024
-0.0
008
0.00
000.
0014
0.00
30.
0011
-0.0
045
-0.0
029
0.00
270.
0148
0.01
2
(-3.
71)
(7.7
1)
(-1.
06)
(-0.
64)
(-0.
33)
(1.8
6)
(3
.61)
(0.8
6)
(-
4.06
)(-
1.49
)(1
.00)
(5.5
9)
-0.0
488
0.01
95-0
.015
-0.0
107
-0.0
001
-0.0
014
0.00
27-0
.003
8-0
.007
50.
0225
-0.0
209
-0.0
132
0.02
9
-0.0
844
0.02
060.
0227
0.00
720.
0002
-0.0
012
0.00
250.
0136
-0.0
019
Not
e: D
epen
dent
var
iabl
e is
the
expe
nditu
re it
em’s
sha
re o
f cas
h ex
pend
iture
s. E
stim
ated
with
ord
inar
y le
ast s
quar
es u
sing
hou
seho
ld d
ata
from
Jia
ngsu
, Hen
an, a
nd H
eilo
ngjia
ng
Sou
rce:
Est
imat
ed b
y U
SD
A’s
Eco
nom
ic R
esea
rch
Ser
vice
from
unp
ublis
hed
data
com
pile
d by
Chi
na N
atio
nal B
urea
u of
Sta
tistic
s (1
995,
200
1).
Pro
vinc
es. N
= 9
,664
. Val
ues
in p
aren
thes
es a
re t-
valu
es. N
ote:
Dat
a ar
e fr
om J
iang
su, H
enan
and
Hei
long
jiang
Pro
vinc
es.
0.00
31-0
.003
1-0
.006
40.
053