commission for regulation of utilities energy and water
TRANSCRIPT
An Coimisiún um Rialáil Fóntais Commission for Regulation of Utilities
0
Information Paper
Reference: CRU20089 Date Published: 14/08/2020
An Coimisiún um Rialáil Fóntais
Commission for Regulation of Utilities
Energy and Water
Monitoring Report for 2019
www.cru.ie

An Coimisiún um Rialáil Fóntais Commission for Regulation of Utilities
1
CRU Mission Statement The CRU’s mission is to protect the public interest in Water, Energy and Energy Safety.
The CRU is guided by four strategic priorities that sit alongside the core activities we undertake to
deliver on the public interest. These are:
• Deliver sustainable low-carbon solutions with well-regulated markets and networks
• Ensure compliance and accountability through best regulatory practice
• Develop effective communications to support customers and the regulatory process
• Foster and maintain a high-performance culture and organisation to achieve our vision
Public/Customer Impact Statement The purpose of this report is to provide consumers, industry and other interested stakeholders with
relevant information on the development of competition in the electricity and gas retail markets, an
overview of the key developments in the water sector and the work of the CRU Customer Affairs
Team in providing a free dispute resolution service to customers.
Market monitoring forms an important part of the CRU’s activities. The information gleaned through
market monitoring helps to inform new policy and aids in the assessment of existing regulations.
The information and analysis provided in this report aims to provide insight into how the electricity
and gas retail markets are functioning and how water services are developing and to highlight any
specific issues that may need to be addressed. As well as information gathered through the
electricity and gas market monitoring framework, the report draws on additional information from
a number of key sources including CRU decision papers, stakeholder inputs, industry discussions,
audit findings and the CRU’s consumer survey.
This document is divided into three main sections, customer engagement and protection, energy
prices, and sectoral developments. Each section aims to give an overview of changes over 2019
period.
For any queries on this report please contact:
• [email protected] for Electricity and Gas
• [email protected] for Water
Revisions
Version Published Update
1 14/08/2020 Report published
An Coimisiún um Rialáil Fóntais Commission for Regulation of Utilities
2
Executive Summary – Key Messages
CUSTOMER ENGAGEMENT AND PROTECTION
• In 2019, energy suppliers received complaints from 0.9% of their electricity customers (22,145 complaints) and from 1.2% of their gas customers (8,156 complaints).
• In 2019, Irish Water received 68 domestic customer complaints for every 10,000 customers, which is a 0.58% complaint rate.
• Irish Water had fewer open complaints at the end of 2019 (357 complaints) compared to the number of open complaints at the end of 2018 (610 complaints).
• In 2019, there were less interruptions to water supply, with a year-on-year decrease in planned interruptions of 18% and a year-on-year decrease in unplanned interruptions of 31%.
• In 2019, Irish Water issued Boil Water Notices for water supplies which served a combined population of over 1.3 million people (driven by two large-scale incidents at the Leixlip water treatment plant in late 2019, which affected over 600,000 people on both occasions) and Water Restriction Notices for water supplies which served a combined population of over 8,000 people.
• In 2019, the electricity switching rate was 13.5% and the gas switching rate was 17.7%. Of total switches, 31% were dual fuel switches.
• According to the Monitoring Report on the Performance of European Retail Markets in 2018 published by CEER in November 2019, in 2018 Ireland had the fifth highest external switching rate for domestic electricity customers of 14.2%, while in gas it had the second highest external switching rate of 20.5% for domestic customers across European countries reported on.
• The total number of switches completed in the electricity market in 2019 was 323,566. This represents a decrease of 2.5% from 2018, when 331,900 customers switched.
• The total number of switches completed in the gas market in 2019 was 124,698. This represents a decrease of 9.1% from 2018, when 137,125 customers switched.
• In addition to switches between suppliers, approximately 10% of electricity customers and 12% of gas customers renegotiated their contracts with their current supplier in 2019. These figures represent a 15% and 30% increase from 2018 in electricity and gas respectively.
• In total, therefore, 25% of electricity and 29% of gas of customers looked for a better energy plan in 2019 through either switching supplier or renegotiating with their current supplier.
• If a customer had switched to the best available discount tariff each year for the past 4 years they could, over the course of the 4 years, potentially have saved up to: €726 on electricity; €494 on gas; and €1,343 on dual fuel.
• In 2019, the average price differential, and thus potential savings, for a domestic customer switching from a standard tariff to a discounted tariff was €207 for a domestic electricity customer, €170 for a domestic gas customer and €401 for a domestic dual fuel customer.
• At the of 2019, 11% of total electricity and 13% of total gas customers were in arrears and 0.5% of domestic electricity customers and 0.3% of domestic gas customers were on payment plans.
• On average more payment plans are completed by electricity and gas customers than broken (Electricity: 60% completed: 40% broken. Gas: 64% completed: 36% broken).

An Coimisiún um Rialáil Fóntais Commission for Regulation of Utilities
3
• In 2019, there were 2,031 new PAYG financial hardship meters installed for electricity and 415 for gas. In electricity this represents a 9% decrease from 2018 when 2,228 were installed, and in gas this represents a decrease of 44% from 2018 when 744 were installed.
• NPA disconnections of customers increased by 4% in electricity by 40% in gas in 2019 compared to 2018. The total number of NPA disconnections in 2019 was 5,008 for electricity and 2,424 for gas, representing 0.2% of all electricity and 0.3% of all gas customers in Ireland.
• At the end of 2019 there were 15,093 electricity smart meters installed.
ENERGY PRICES
• Estimated annual bills (EABs) across suppliers’ standard plans increased from 2018 by an average of 2.4% in electricity and 1.5% in gas in 2019, while EABs across suppliers’ best discounted plans decreased by an average of 4.6% in electricity and 3.9% in gas1.
• Three suppliers announced price increases in the first half of 2019, based on increased wholesale costs incurred in previous periods. At the end of Q3 2019, one supplier announced a second price change within the year, which involved a price increase in electricity and a price decrease in gas.
• At the end of 2019, Iberdrola offered the cheapest available standard electricity plan with an EAB of €9432. Energia offered the cheapest available discount plan for electricity at the end of 2018 with an EAB of €830.
• At the end of 2019, Iberdrola offered the cheapest available standard plan for gas with an EAB of €796. Flogas offered the cheapest available discount plan for gas at the end of 2019 with an EAB of €671.
• At the end of 2019, Energia offered the cheapest available dual fuel plan with an EAB of €1,495.
• Comparing Ireland’s energy prices to other European countries, in semester 1 of 2019 (January - June 2019), the average price in Ireland for domestic electricity consumption band DC was 7% above the Euro Area average. For domestic electricity consumption band DD, Ireland was 2% below the Euro Area average. The average price in consumption band DC decreased from semester 2 2018 to semester 1 2019 by 4.6% and the average price in consumption band DD decreased by 4.4%.
• The average price for the main domestic gas consumption band (D2) in Ireland was 4% below the Euro Area average. The average price in consumption band D2 decreased from semester 2 2018 to semester 1 2019 by 10.2%.
• On average the wholesale price of gas was 41% lower in 2019 compared to 2018 and the wholesale price of electricity was 21% lower in 2019 compared to 2018, with most of these increases occurring during the first half of the year.
1 Just Energy is not included in the calculations as it had increased its prices before leaving the market at the end of 2019. 2 All figures for domestic energy retail bills are inclusive of VAT.
An Coimisiún um Rialáil Fóntais Commission for Regulation of Utilities
4
SECTORAL DEVELOPMENTS IN ENERGY AND
WATER
• During 2019 two new suppliers entered the energy markets and one supplier left.
• There were 11 active suppliers in the domestic electricity market and 9 active suppliers in the domestic gas market, while 8 suppliers offered dual fuel.
• In Q4 2019, Electric Ireland held the greatest domestic electricity market share with 48.2% of total consumption. The remaining key suppliers in the domestic electricity market are Bord Gáis Energy with 17.99% market share by consumption in Q4 2019, followed by SSE Airtricity with 12.65%, Energia with 9.25%, PrePayPower with 6.87%, Panda Power with 2.5% and Pinergy with 1.29%.
• In the non-domestic markets Electric Ireland remained the largest electricity supplier in terms of consumption in the small business, and medium business market segments in 2019. Electric Ireland held the second largest share in the LEU market, with SSE Airtricity being the largest supplier in this segment.
• In Q4 2019 Bord Gáis Energy held the greatest market share in the domestic gas market with 43.8% of the market by customer numbers. This was followed by Electric Ireland with 21.4%, SSE Airtricity with 12.3%, Energia with 9.1%, PrePay Power with 7.2% and Panda Power with 1.56%.
• In the non-domestic markets Bord Gáis Energy remained the largest supplier in terms of customer numbers in the IC, medium-sized non-domestic gas and LDM gas market segments, while it is the third biggest supplier in the DM market segment with Energia having the largest share in this market segment followed by Electric Ireland.
• In 2019, Irish Water provided water services to nearly 1.8 million customers, with an average daily water demand of nearly 1,700 million litres of water.
• In 2019, the average daily amount of unaccounted for water, which includes water losses due to leaks, was 712 million litres, a reduction from 782 million litres in 2018.
• In 2019, the average annual household water demand was approximately 128,700 litres (353 litres per day) and the median was 96,000 (263 litres per day). Households with water use in the top 1% (approximately 15,000 households), accounted for nearly 15% of total household demand.
An Coimisiún um Rialáil Fóntais Commission for Regulation of Utilities
5
Table of Contents CRU Mission Statement ........................................................................................... 1
Public/Customer Impact Statement ........................................................................ 1
Executive Summary – Key Messages ..................................................................... 2
Glossary of Terms and Abbreviations .................................................................... 8
1. Introduction ...................................................................................................... 10
1.1 Background .............................................................................................................. 10
1.1.1 The Commission for Regulation of Utilities ............................................................... 10
1.1.2 Objectives of this Report .......................................................................................... 10
1.1.3 Related Documents .................................................................................................. 10
CUSTOMER ENGAGEMENT AND PROTECTION ................................................. 11
2. Energy and Water Customer Care .................................................................. 11
2.1 Customer Complaints to Energy Suppliers ............................................................... 11
2.2 Customer Complaints to Irish Water........................................................................ 12
2.3 CRU Customer Care Statistics................................................................................... 13
2.3.1 Customer Contacts ................................................................................................... 13
2.3.2 Customer Complaints ............................................................................................... 15
3. Audits of Compliance ...................................................................................... 18
3.1 Audits of Compliance for Energy Suppliers .............................................................. 18
3.2 Audits of Compliance for Irish Water ....................................................................... 18
4. Water Customer Activity ................................................................................. 20
4.1 Quality of Service ..................................................................................................... 20
4.1.1 Interruptions to Water Supply .................................................................................. 20
4.1.2 Boil Water Notices .................................................................................................... 21
4.1.3 Water Restriction Notices ......................................................................................... 21
4.2 First Fix Free Scheme ............................................................................................... 22
4.3.1 Number of Leak Repairs............................................................................................ 22
4.3.2 Water Saved Due to Leak Repairs ............................................................................. 23
5. Energy Consumer Survey ............................................................................... 24
6. Electricity and Gas Customer Switching and Renegotiations ..................... 26
6.1 Electricity and Gas Switching ................................................................................... 26
6.2 Renegotiations of Contracts/Tariffs ......................................................................... 29
An Coimisiún um Rialáil Fóntais Commission for Regulation of Utilities
6
6.3 Potential Cost Savings from Switching ..................................................................... 30
7. Energy Bill Management ................................................................................. 34
7.1 Energy Arrears and Payment Plans .......................................................................... 34
7.2 Energy Pay as You Go Financial Hardship Meters .................................................... 36
7.3 Energy Disconnections for Non-Payment of Account .............................................. 38
8. Energy Smart Meters ....................................................................................... 41
ENERGY PRICES .................................................................................................... 42
9. Retail Energy Prices ........................................................................................ 42
9.1 Calculation of Estimated Annual Bills ...................................................................... 42
9.2 Average Estimated Annual Bills Across Suppliers .................................................... 44
9.3 Estimated Annual Bills Over Time ............................................................................ 47
9.4 Electricity and Gas Prices in a European Context ..................................................... 49
10. Wholesale Energy Prices ................................................................................ 52
10.1 Wholesale Gas Prices ............................................................................................... 52
10.2 Wholesale Electricity Prices ..................................................................................... 52
10.3 Correlation of Wholesale Gas and Electricity Prices ................................................ 53
SECTORAL DEVELOPMENTS ............................................................................... 55
11. Energy Market Developments ......................................................................... 55
12. Electricity Market ............................................................................................. 58
12.1 Domestic Electricity Market Share ........................................................................... 59
12.2 Small-Sized Business Electricity Market Share ......................................................... 61
12.3 Medium-Sized Business Electricity Market Share .................................................... 63
12.4 Large Energy Users (LEUs) Electricity Market Share ................................................. 64
10.4 Electricity Market Concentration ............................................................................. 66
13. Gas Market ....................................................................................................... 67
13.1 Domestic Gas Market Share..................................................................................... 68
13.2 Industrial and Commercial (IC) Gas Market Share ................................................... 70
13.3 Medium-Sized Non-Domestic Gas Market Share ..................................................... 72
13.4 Daily Metered (DM) Market Share .......................................................................... 73
13.5 Large Daily Metered (LDM) Market Share ............................................................... 75
10.5 Gas Market Concentration ....................................................................................... 76
14. Water Sector ..................................................................................................... 77
14.1 Irish Water Customer Base ...................................................................................... 77
An Coimisiún um Rialáil Fóntais Commission for Regulation of Utilities
7
14.1.1 Irish Water Customer Breakdown ............................................................................. 77
14.1.2 Irish Water Customer Trends .................................................................................... 78
14.2 Water Consumption ................................................................................................. 78
14.2.1 Water Demand Breakdown ...................................................................................... 78
14.2.2 Domestic Usage ........................................................................................................ 79
15. Conclusion ....................................................................................................... 82
APENDICES ............................................................................................................ 83
Appendix 1 .............................................................................................................. 83
Electricity and Gas Prices in a European Context................................................................ 83
Annex 1 ................................................................................................................... 87
Overview of Business Electricity Pass Through Costs and Charges for 2018/19 ................. 87
Annex 2 ................................................................................................................... 88
Overview of Gas Pass Through Costs and Charges for 2018/19 .......................................... 88
An Coimisiún um Rialáil Fóntais Commission for Regulation of Utilities
8
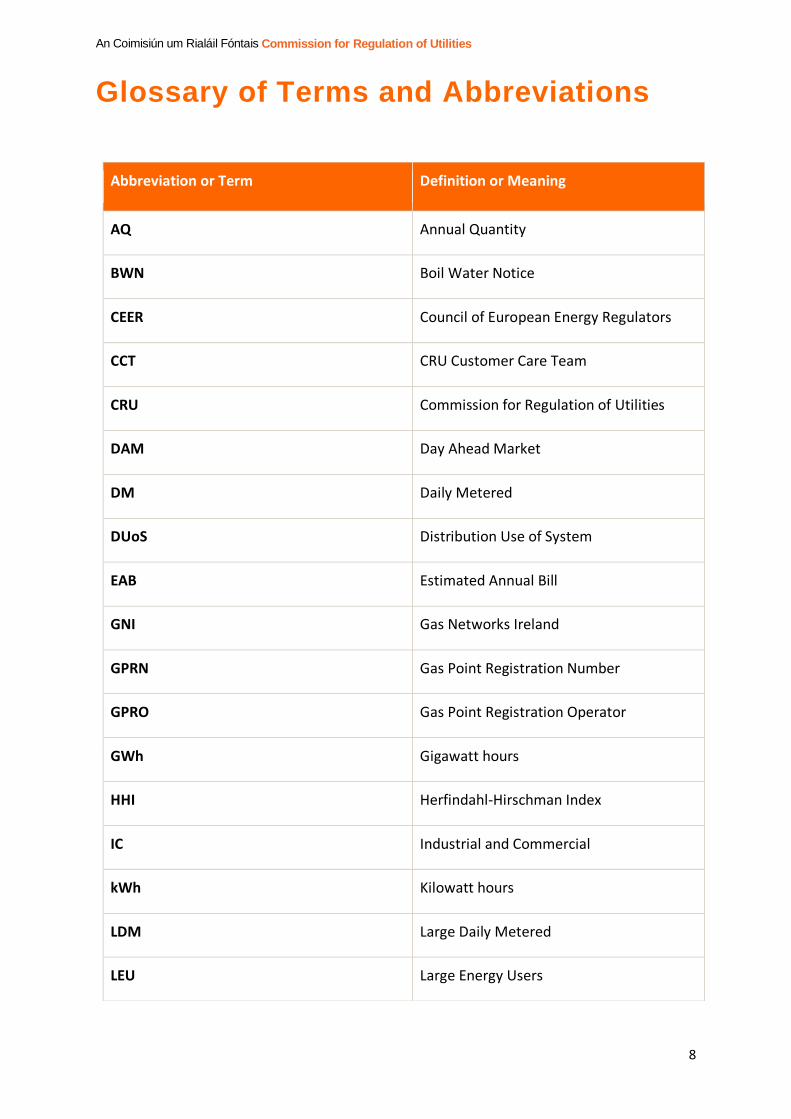
Glossary of Terms and Abbreviations
Abbreviation or Term Definition or Meaning
AQ Annual Quantity
BWN Boil Water Notice
CEER Council of European Energy Regulators
CCT CRU Customer Care Team
CRU Commission for Regulation of Utilities
DAM Day Ahead Market
DM Daily Metered
DUoS Distribution Use of System
EAB Estimated Annual Bill
GNI Gas Networks Ireland
GPRN Gas Point Registration Number
GPRO Gas Point Registration Operator
GWh Gigawatt hours
HHI Herfindahl-Hirschman Index
IC Industrial and Commercial
kWh Kilowatt hours
LDM Large Daily Metered
LEU Large Energy Users
An Coimisiún um Rialáil Fóntais Commission for Regulation of Utilities
9
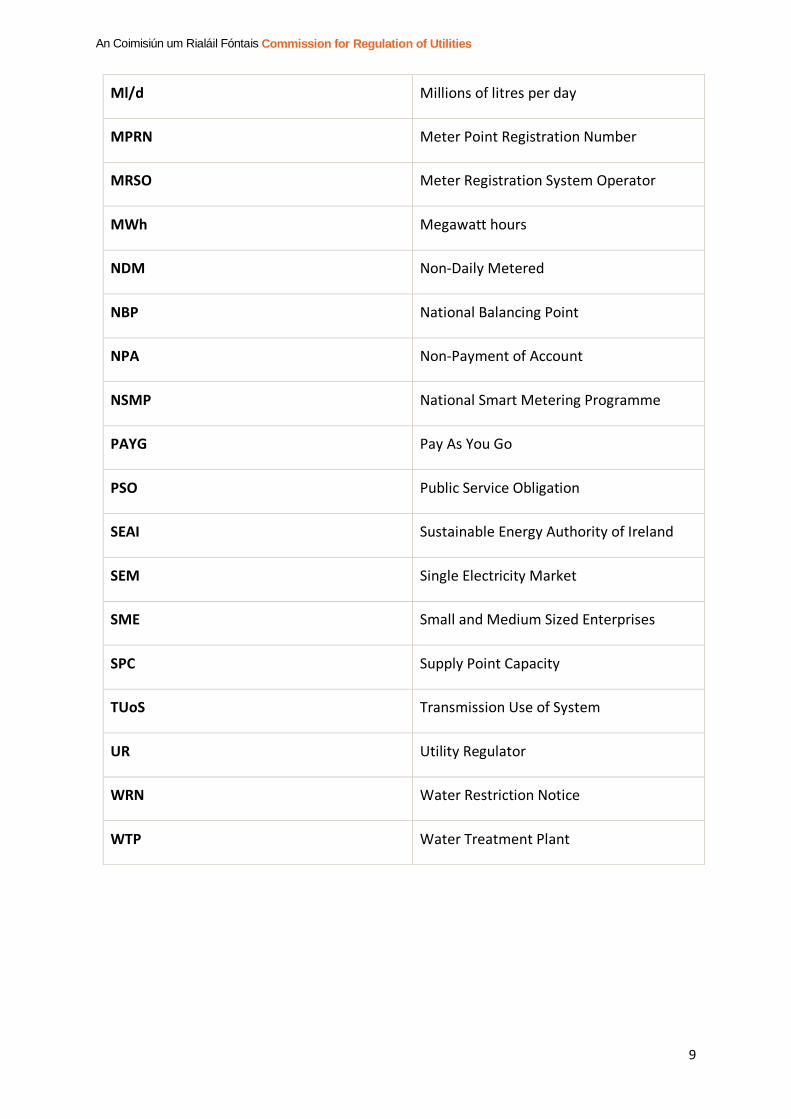
Ml/d Millions of litres per day
MPRN Meter Point Registration Number
MRSO Meter Registration System Operator
MWh Megawatt hours
NDM Non-Daily Metered
NBP National Balancing Point
NPA Non-Payment of Account
NSMP National Smart Metering Programme
PAYG Pay As You Go
PSO Public Service Obligation
SEAI Sustainable Energy Authority of Ireland
SEM Single Electricity Market
SME Small and Medium Sized Enterprises
SPC Supply Point Capacity
TUoS Transmission Use of System
UR Utility Regulator
WRN Water Restriction Notice
WTP Water Treatment Plant

An Coimisiún um Rialáil Fóntais Commission for Regulation of Utilities
10
1. Introduction
1.1 Background
1.1.1 The Commission for Regulation of Utilities
The Commission for Regulation of Utilities (CRU) is Ireland’s independent energy and water
regulator. The CRU was established in 1999 and now has a wide range of economic, customer
protection and safety responsibilities in energy. The CRU is also the regulator of Ireland’s public
water and wastewater system. Our mission is to regulate water, energy and safety in the public
interest.
Further information on the CRU’s role and relevant legislation can be found on the CRU’s website
at www.cru.ie.
1.1.2 Objectives of this Report
The purpose of this report is to provide consumers, industry and other interested stakeholders with
relevant information on the development of competition in the electricity and gas retail markets, an
overview of the key developments in the water sector and the work of the CRU Customer Affairs
Team in providing a free dispute resolution service to customers.
This report analyses trends in a number of key indicators, including prices, consumption, customer
numbers, internal and external switching, pay-as-you-go meters, and disconnections for non-
payment of account, and outlines the key developments in the retail electricity and gas markets.
Additionally, the report presents information on Irish Water’s customer base, excess use of water,
billing, first fix scheme, and quality of service, and customer complaints and contacts received by
the CRU Customer Affairs Team against energy suppliers and network companies, and Irish
Water.
The primary sources of data in this report are: Meter Registration System Operator (MRSO) - ESB
Networks, Gas Point Registration Operator (GPRO) - Gas Networks Ireland (GNI), energy
suppliers, Irish Water, and the CRU Customer Affairs Team.
1.1.3 Related Documents
Information on the CRU’s role and relevant legislation can be found on the CRU’s website at
www.cru.ie
11
CUSTOMER ENGAGEMENT AND PROTECTION
CUSTOMER ENGAGEMENT AND PROTECTION
2. Energy and Water Customer Care
Summary of Section
• This section contains information on the number of customer complaints received by energy suppliers, Irish Water and the CRU Customer Affairs Team.
• Complaints are defined as a customer’s expression of dissatisfaction and refer to the number of valid or invalid complaints made to the supplier regardless of form - letter, email, phone call, in person - during the reporting period. Only complaints requiring some form of explicit follow-up are included (i.e. where follow-up is required whether requested or not). Where a complaint has been resolved in the same reporting period as it had been raised, it is still included in this indicator.
• In 2019, energy suppliers received complaints from 0.9% of their electricity customers (22,145 complaints) and from 1.2% of their gas customers (8,156 complaints).
• In 2019, Irish Water received 68 domestic customer complaints for every 10,000 customers, which is a 0.58% complaint rate.
• Irish Water had fewer open complaints at the end of 2019 (357 complaints) compared to the number of open complaints at the end of 2018 (610 complaints).
2.1 Customer Complaints to Energy Suppliers
The CRU monitors three sources of energy customer complaints data: customer complaints
received by suppliers, statistics from the CRU Customer Care Team (see section 2.3), and the
CRU Consumer Survey (see section 5).
The CRU collects data from suppliers on a yearly basis concerning the number of complaints they
received from customers. The table below shows that suppliers received complaints from 1.3% of
their customers in 2019. On average more complaints are received from gas customers in
comparison to electricity. Overall, there is a small difference between domestic and non-domestic
complaint rates, with the rate of complaints for both gas and electricity being slightly lower for non-
domestic customers.
Market Segment Number of complaints
Total customers % of total customers
Domestic Electricity 20,118 2,099,559 1.0%
Non-Domestic Electricity 2,027 290,837 0.7%
Domestic Gas 7,948 678,766 1.2%
Non-Domestic Gas 208 27,103 0.8%
Dual Fuel 8,476 - -
Total 38,777 3,096,265 1.3%
Table 1: Complaints to Energy Suppliers in 2019 per Customer Category
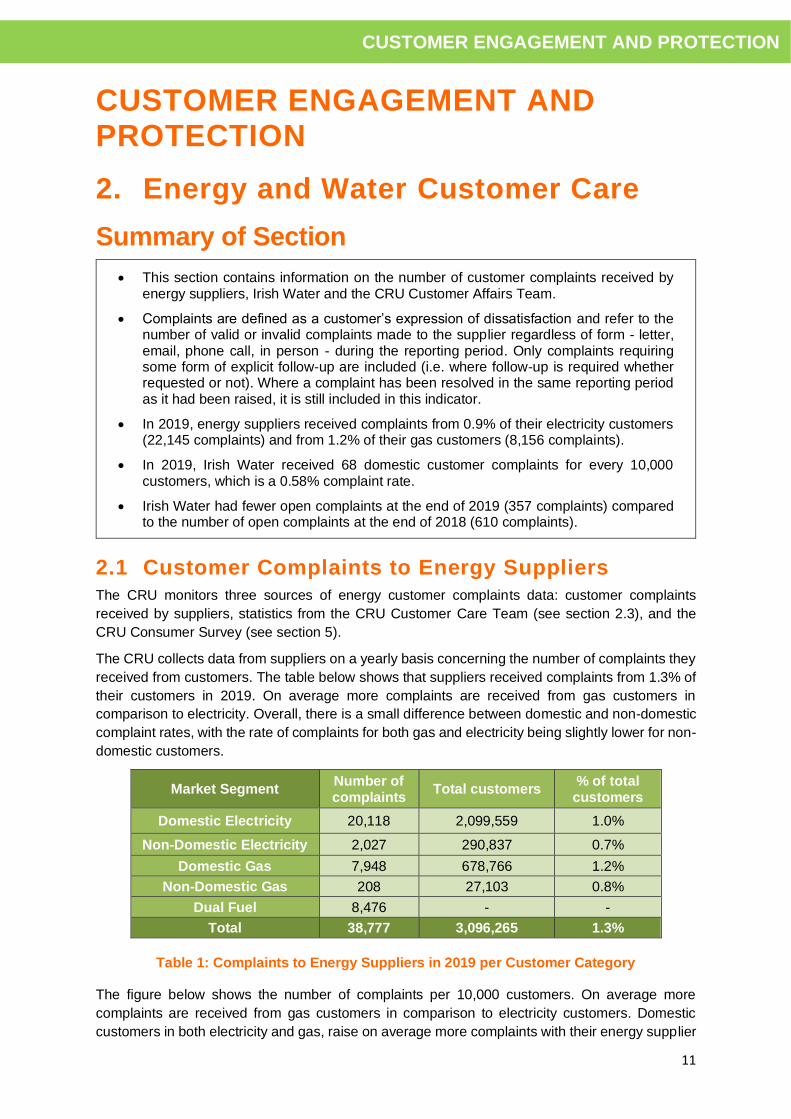
The figure below shows the number of complaints per 10,000 customers. On average more
complaints are received from gas customers in comparison to electricity customers. Domestic
customers in both electricity and gas, raise on average more complaints with their energy supplier
12
CUSTOMER ENGAGEMENT AND PROTECTION
compared to non-domestic customers. Between 2015-2019 there was a year-on-year increase in
the number of complaints per 10,000 domestic electricity customers. The number of complaints
per 10,000 customers was more variable for the other segments - domestic gas and non-domestic
electricity and gas - over the same period.
Figure 1: Complaints to Energy Suppliers per 10,000 Customers
2.2 Customer Complaints to Irish Water
Irish Water is obliged to report to the CRU on the number and type of domestic complaints it
receives, in accordance with the CRU-approved Domestic Customer Handbook. Currently, Irish
Water does not report non-domestic customer complaints data in this format to the CRU. However,
this is expected to begin later this year and the CRU plans to include this data in future iterations
of this report.
Most complaints received by Irish Water tend to be in customer operations matters including
blockages, reduced water pressure and flooding.
The table below shows the number of domestic customer complaints per 10,000 customers and
the number of complaints as a percentage of total customers. In 2019 there were 68 customer
complaints for every 10,000 customers, which is a 0.58% complaint rate. The number of complaints
is below those seen in the electricity and gas sectors. However, complaints in the water sector are
not as comparable to the electricity and gas sectors, as there is no retail competition or billing of
domestic customers.
Customer category 2017 2018 2019
Complaints per 10,000 customers 113 64 68
Customer Complaint % 0.64% 0.68% 0.58%
Table 2: Complaints to Irish Water per 10,000 Customers
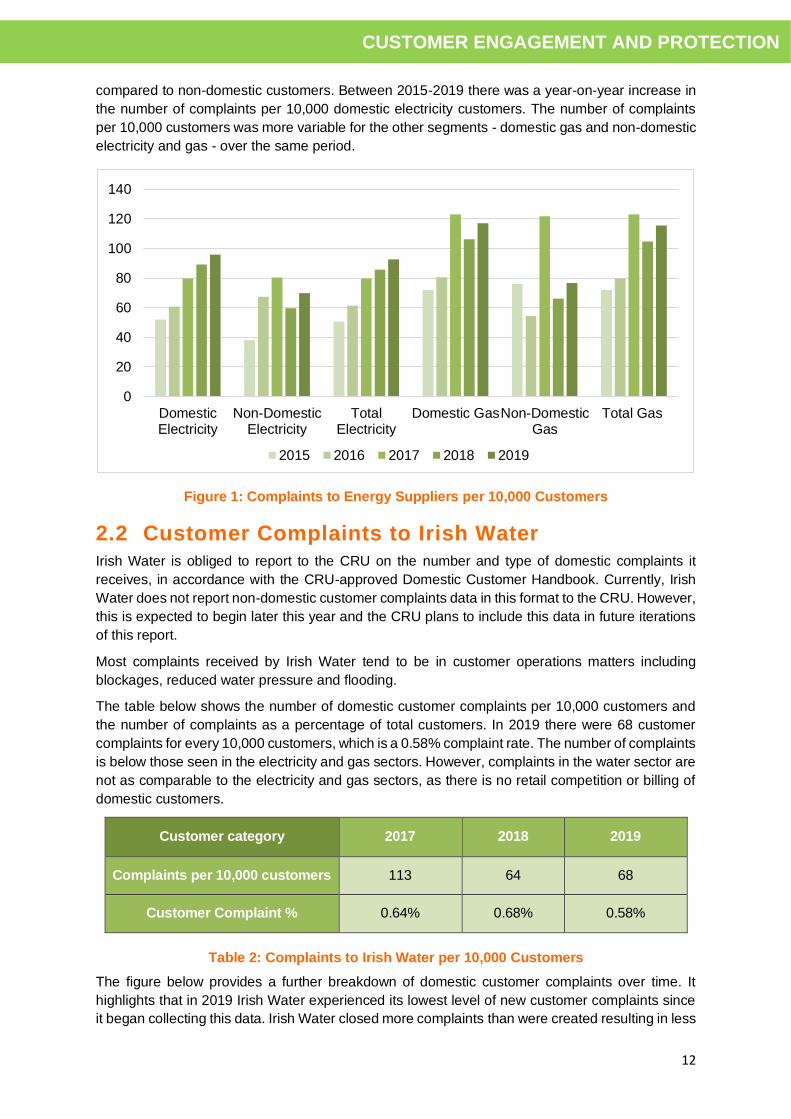
The figure below provides a further breakdown of domestic customer complaints over time. It
highlights that in 2019 Irish Water experienced its lowest level of new customer complaints since
it began collecting this data. Irish Water closed more complaints than were created resulting in less
0
20
40
60
80
100
120
140
DomesticElectricity
Non-DomesticElectricity
TotalElectricity
Domestic GasNon-DomesticGas
Total Gas
2015 2016 2017 2018 2019
13
CUSTOMER ENGAGEMENT AND PROTECTION
complaints being open at the end of 2019 (357) than there were open at the end of 2018 (610). In
addition, the number of complaints which took more than 60 days to resolve were reduced.
Figure 2: Customer Complaints to Irish Water
2.3 CRU Customer Care Statistics
2.3.1 Customer Contacts
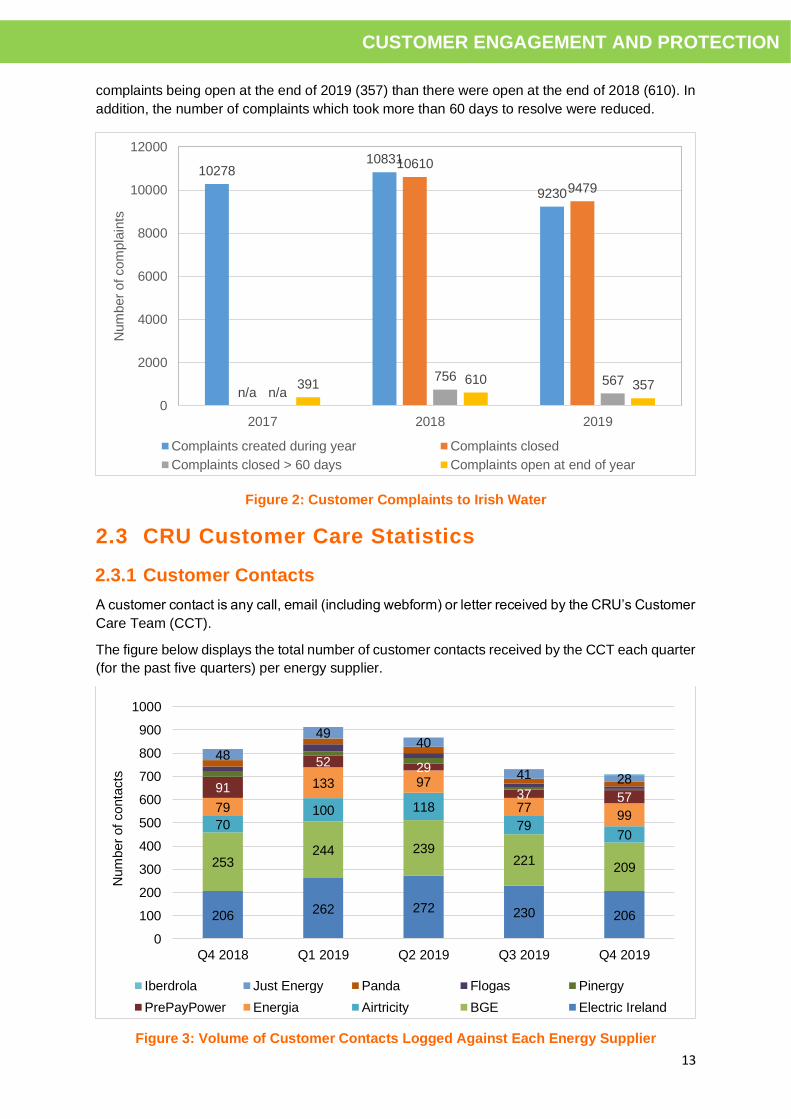
A customer contact is any call, email (including webform) or letter received by the CRU’s Customer
Care Team (CCT).
The figure below displays the total number of customer contacts received by the CCT each quarter
(for the past five quarters) per energy supplier.
Figure 3: Volume of Customer Contacts Logged Against Each Energy Supplier
1027810831
9230
n/a
10610
9479
n/a
756 567391 610 357
0
2000
4000
6000
8000
10000
12000
2017 2018 2019
Num
ber
of com
pla
ints
Complaints created during year Complaints closed
Complaints closed > 60 days Complaints open at end of year
206262 272 230 206
253244 239
221209
70100 118
7970
79
133 97
7799
91
52 29
37 57
48
4940
41 28
0
100
200
300
400
500
600
700
800
900
1000
Q4 2018 Q1 2019 Q2 2019 Q3 2019 Q4 2019
Num
ber
of conta
cts
Iberdrola Just Energy Panda Flogas Pinergy
PrePayPower Energia Airtricity BGE Electric Ireland
14
CUSTOMER ENGAGEMENT AND PROTECTION
Account problems and billing issues continue to account for the largest percentage of issues
brought to the CCT by energy customers; 54% in Q4 2019. Of the billing issues reported; high
bills, inaccurate bills, catch up bills (stemming from a history of estimated readings), change in
tariff, debt collection and problems associated with level pay plans were among the main problems
outlined by customers. Marketing and Sign Up accounted for 12% of customer contacts while
Customer Service accounted for 8%. Pay as you go (PAYG) issues also accounted for 8% of
contacts in Q4 2019. The percentage of switching contacts overall (combined for electricity and
gas) decreased from 7% in Q3 2019 to 6% in Q4 2019.
The remaining 18% of contacts consisted of varied issues.
Top 5 Contact Types - Energy Suppliers (Combined) Q4 2019
1 Billing 39%
2 Account Problems 15%
3 Marketing & Sign-up 12%
4 Customer Service 8%
5 PAYG issues 8%
Table 3: Breakdown of key issues logged against each energy supplier via customer
contacts
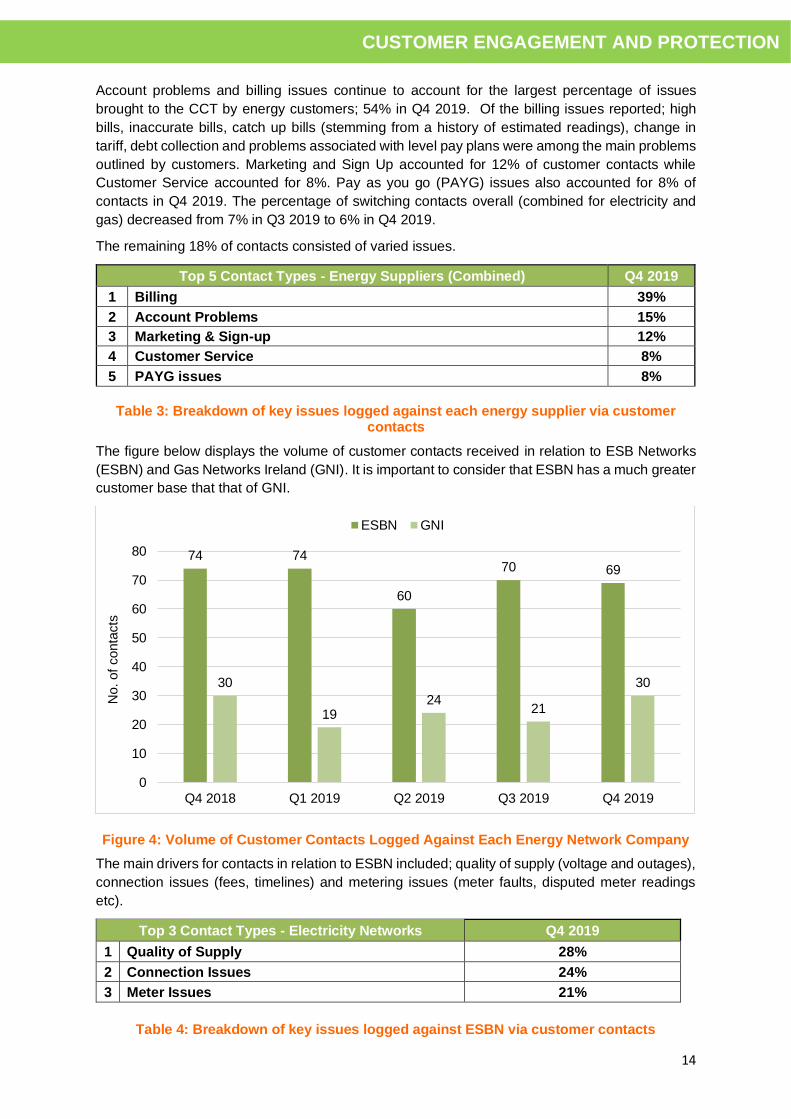
The figure below displays the volume of customer contacts received in relation to ESB Networks
(ESBN) and Gas Networks Ireland (GNI). It is important to consider that ESBN has a much greater
customer base that that of GNI.
Figure 4: Volume of Customer Contacts Logged Against Each Energy Network Company
The main drivers for contacts in relation to ESBN included; quality of supply (voltage and outages),
connection issues (fees, timelines) and metering issues (meter faults, disputed meter readings
etc).
Top 3 Contact Types - Electricity Networks Q4 2019
1 Quality of Supply 28%
2 Connection Issues 24%
3 Meter Issues 21%
Table 4: Breakdown of key issues logged against ESBN via customer contacts
74 74
60
70 69
30
1924
21
30
0
10
20
30
40
50
60
70
80
Q4 2018 Q1 2019 Q2 2019 Q3 2019 Q4 2019
No. of
conta
cts
ESBN GNI
15
CUSTOMER ENGAGEMENT AND PROTECTION
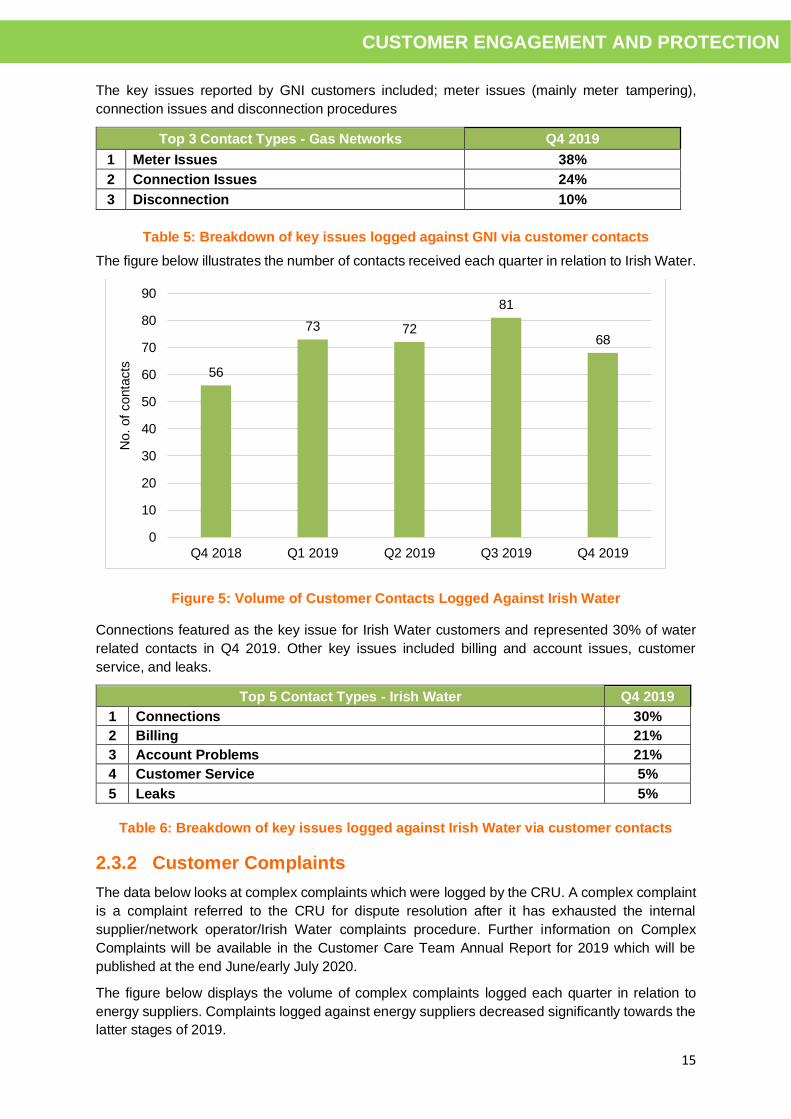
The key issues reported by GNI customers included; meter issues (mainly meter tampering),
connection issues and disconnection procedures
Top 3 Contact Types - Gas Networks Q4 2019
1 Meter Issues 38%
2 Connection Issues 24%
3 Disconnection 10%
Table 5: Breakdown of key issues logged against GNI via customer contacts
The figure below illustrates the number of contacts received each quarter in relation to Irish Water.
T
Figure 5: Volume of Customer Contacts Logged Against Irish Water
Connections featured as the key issue for Irish Water customers and represented 30% of water
related contacts in Q4 2019. Other key issues included billing and account issues, customer
service, and leaks.
Top 5 Contact Types - Irish Water Q4 2019
1 Connections 30%
2 Billing 21%
3 Account Problems 21%
4 Customer Service 5%
5 Leaks 5%
Table 6: Breakdown of key issues logged against Irish Water via customer contacts
2.3.2 Customer Complaints
The data below looks at complex complaints which were logged by the CRU. A complex complaint
is a complaint referred to the CRU for dispute resolution after it has exhausted the internal
supplier/network operator/Irish Water complaints procedure. Further information on Complex
Complaints will be available in the Customer Care Team Annual Report for 2019 which will be
published at the end June/early July 2020.
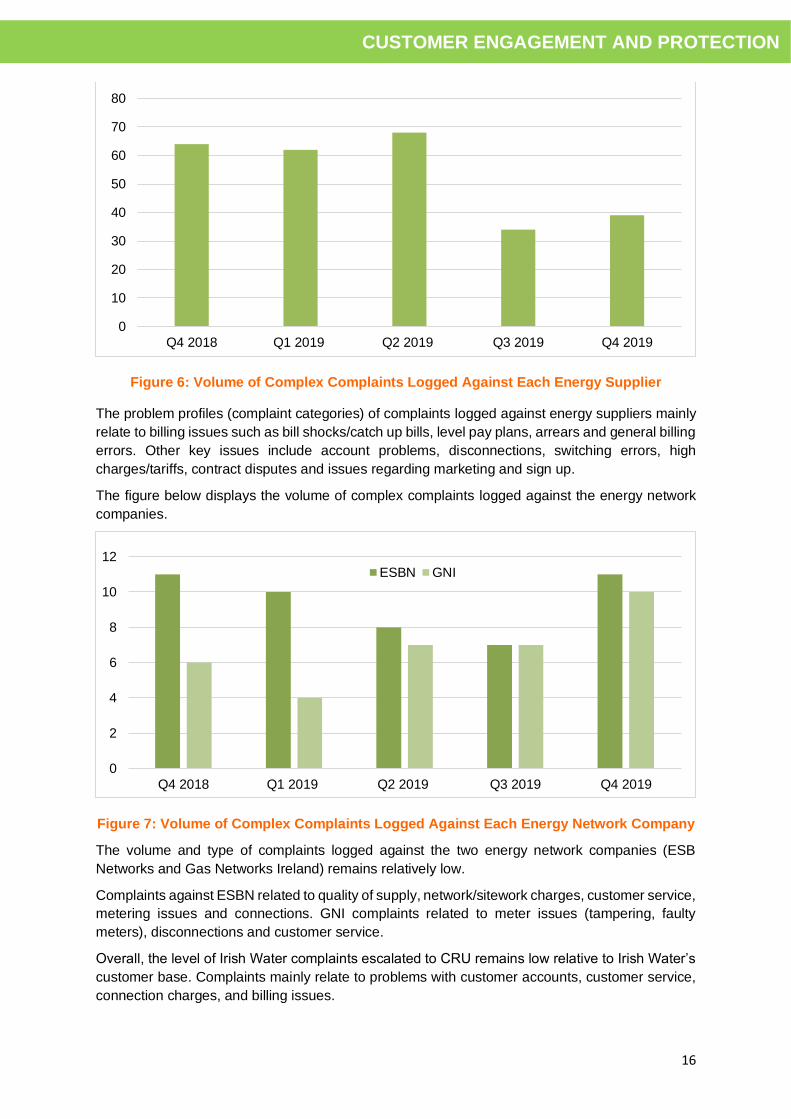
The figure below displays the volume of complex complaints logged each quarter in relation to
energy suppliers. Complaints logged against energy suppliers decreased significantly towards the
latter stages of 2019.
56
73 72
81
68
0
10
20
30
40
50
60
70
80
90
Q4 2018 Q1 2019 Q2 2019 Q3 2019 Q4 2019
No. of
conta
cts
16
CUSTOMER ENGAGEMENT AND PROTECTION
Figure 6: Volume of Complex Complaints Logged Against Each Energy Supplier
The problem profiles (complaint categories) of complaints logged against energy suppliers mainly
relate to billing issues such as bill shocks/catch up bills, level pay plans, arrears and general billing
errors. Other key issues include account problems, disconnections, switching errors, high
charges/tariffs, contract disputes and issues regarding marketing and sign up.
The figure below displays the volume of complex complaints logged against the energy network
companies.
Figure 7: Volume of Complex Complaints Logged Against Each Energy Network Company
The volume and type of complaints logged against the two energy network companies (ESB
Networks and Gas Networks Ireland) remains relatively low.
Complaints against ESBN related to quality of supply, network/sitework charges, customer service,
metering issues and connections. GNI complaints related to meter issues (tampering, faulty
meters), disconnections and customer service.
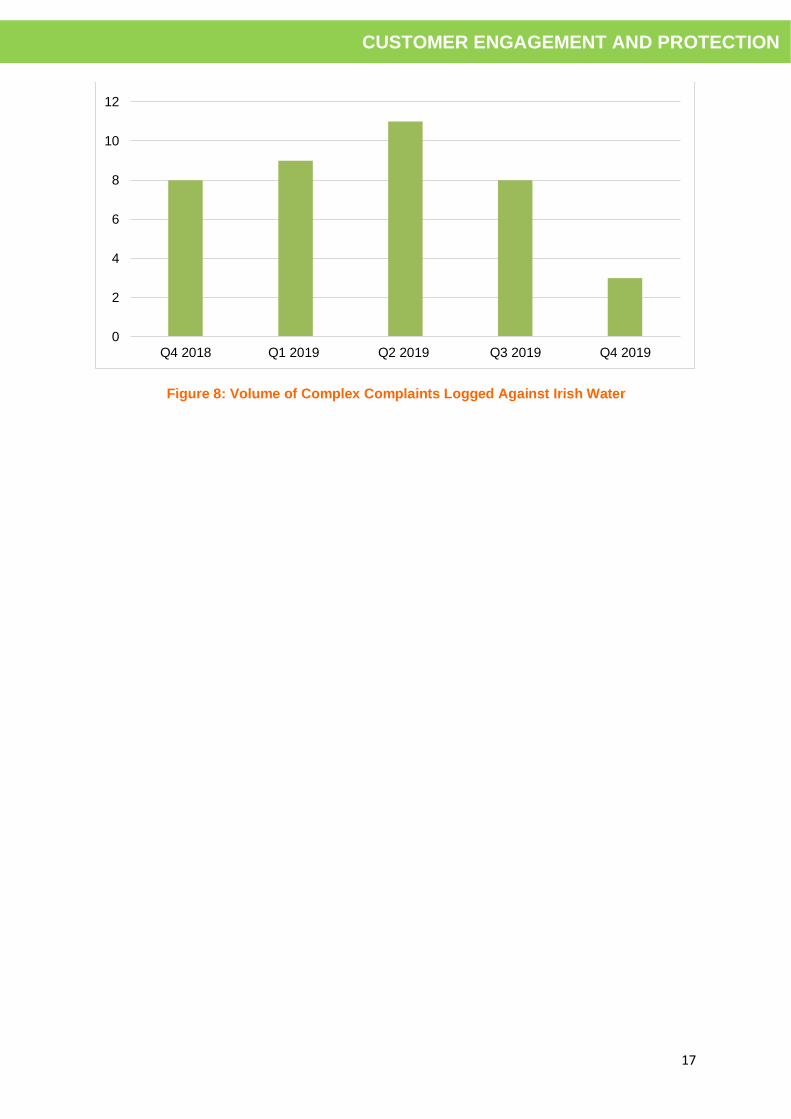
Overall, the level of Irish Water complaints escalated to CRU remains low relative to Irish Water’s
customer base. Complaints mainly relate to problems with customer accounts, customer service,
connection charges, and billing issues.
0
10
20
30
40
50
60
70
80
Q4 2018 Q1 2019 Q2 2019 Q3 2019 Q4 2019
0
2
4
6
8
10
12
Q4 2018 Q1 2019 Q2 2019 Q3 2019 Q4 2019
ESBN GNI
17
CUSTOMER ENGAGEMENT AND PROTECTION
Figure 8: Volume of Complex Complaints Logged Against Irish Water
0
2
4
6
8
10
12
Q4 2018 Q1 2019 Q2 2019 Q3 2019 Q4 2019
18
CUSTOMER ENGAGEMENT AND PROTECTION
3. Audits of Compliance
3.1 Audits of Compliance for Energy Suppliers
The CRU regularly conducts audits of compliance to ensure that suppliers are meeting their
regulatory obligations. The CRU’s Supplier Handbook sets out the minimum service requirements
that suppliers must adhere to in their dealings with energy customers. It comprises of individual
Codes of Practice that cover all key areas of customer-supplier interaction, including: billing,
disconnections, marketing, vulnerable customers and PAYG meters. These rules are in place to
ensure that customers enjoy a high standard of protection in their dealings with licensed suppliers
and are in line with the CRU’s legislative duties3.
In Q4 2019 the CRU audited suppliers’ adherence to the rules relating to the Codes of Practice for
Customer Sign-up for domestic and non-domestic customers.
Overall, the 2019 audit found a good level of compliance with only a small number of areas
requiring remedial actions.
• Eleven suppliers (both domestic and non-domestic) were subject to audit. These suppliers
included BE Energy, Bord Gáis Energy, Electric Ireland, Energia, Flogas, Go Power,
Naturgy, Panda Power, Pinergy, PrepayPower and SSE Airtricity.
• Seven suppliers (Bord Gáis Energy, Energia, Go Power, Naturgy, Panda Power,
PrepayPower, SSE Airtricity) were considered to have demonstrated full audit compliance.
• Four suppliers (BE Energy, Electric Ireland, Flogas, Pinergy) were requested to undertake
remedial actions. These actions where requested for the following five reasons:
o Ambiguous wording in example Welcome Letter.
o Inconsistency between deposit amounts stated in different documents.
o Inconsistency between how the number of days in cooling off period are presented
o Certain marketing SMS did not contain an easy method of unsubscribing.
o Conflicting information regarding winter disconnections.
• All areas requiring remedial actions were in regard to domestic customers, and at the time
of publication of the audit report in March 2020 all remedial actions have been completed by
suppliers, as requested.
The 2019 annual audit of compliance for electricity and gas suppliers can be found on the CRU
website.
3.2 Audits of Compliance for Irish Water
In its role as economic regulator of water, the CRU aims to protect the interests of customers by
monitoring the performance of Irish Water in delivering its services which includes service incidents
such as Boil Water Notices (BWN).
In October and November 2019 two separate BWNs related to issues with the operation of the
Leixlip Water Treatment Plant were issued to Irish Water customers, impacting on over 600,000
customers. Due to the large number of customers affected by these BWNs, the CRU has
conducted an audit on Irish Water’s levels of compliance with its obligations w ith regard to
customer service and customer protection during a BWN. The CRU reviewed the suite of BWN
obligations on Irish Water as set out in the Domestic and Non-Domestic Customer Handbooks.
3 S.I. No. 452 of 2004 European Communities (Internal Market in Natural Gas) S.I. No. 60 of 2005 (Electricity) European Communities (Internal Market in Electricity)
19
CUSTOMER ENGAGEMENT AND PROTECTION
Overall, this audit found that Irish Water complied with the majority of its obligations in relation to
BWNs, where 28 of the 34 individual BWN requirements assessed across both the Domestic and
Non-Domestic Customer Handbooks were completed in full.
In the course of the audit the CRU also identified two other incidents of non-compliance with
handbook requirements. A summary of the main findings is set out below.
• Anticipated Duration of the BWN
Finding 1 – Irish Water was not in compliance with Section 5.2.3 of the Domestic and Non-
Domestic Customer Handbooks which require it to highlight the anticipated duration of the
notice.
• Complaints Process
Finding 2 – Irish Water was not in compliance with sections 10.2.1 of the Domestic Customer
Handbook and Section 9.2.1 of the Non-Domestic Customer Handbooks which require it to
provide an easy process for customers/potential customers to use when they are
experiencing difficulties with their water/wastewater service supply and wish to make a
complaint to Irish Water.
• Additional Requirements of Vulnerable Customers
Finding 3 – Irish Water was not in compliance with Section 8.3.5 of the Domestic Customer
Handbook as it did not contact the specified Vulnerable Customers directly to ascertain what
extra requirements they might have in relation to the BWN.
Finding 4 - Irish Water was also not in compliance with Section 8.4.3 of the Domestic
Customer Handbook as it did not contact the specified Vulnerable Customers directly to
ascertain whether they require assistance to access alternative supplies.
• Digital Maps of BWN Areas
Finding 5 – Irish Water was not in compliance with Sections 5.1.2 of the Domestic and Non-
Domestic Customer Handbooks as information provided in digital maps regarding areas
where BWNs apply was neither accurate nor easy to understand.
Based on these findings, Irish Water was required to undertake remedial actions. At the time of
publication of the Audit of Compliance Information Paper, Irish Water had completed two of the
three required remedial actions in relation to the findings of non-compliance. The completion of the
outstanding action to address the digital online maps requires internal work by Irish Water which
was impacted by the COVID-19 restrictions.
The CRU also identified two other issues in the course of the audit which were noted as significant
but not deemed to be instances of non-compliance. These included a website outage which
impacted customer communication and a delay in issuing non-domestic bills. Irish Water is
required to submit a statement of billing compliance regarding rebates on non-domestic customer
bills. This is to be submitted to the CRU no later than 31st July 2020 when all relevant billing cycle
rebates should have been completed. This is to ensure that the customer rebates for BWNs are
provided in line with the requirements of the CoP on Billing for Non-Domestic Customers (in
particular Requirement 7.1.4).
The CRU will continue to monitor Irish Water’s compliance with its legislative obligations as set out
in the Customer Handbooks as part of its scheduled regulatory compliance work programme. This
will include quarterly spot checks, an annual audit and investigating any ad hoc issues should they
arise.
The full report of the Irish Water Compliance Audit of the Leixlip Water Treatment Plant Boil Water
Notices is available on the CRU website.
20
CUSTOMER ENGAGEMENT AND PROTECTION
4. Water Customer Activity
Summary of Section
• This section contains information on Irish Water’s supply of water to customers and its engagement with customers under the First Fix Scheme.
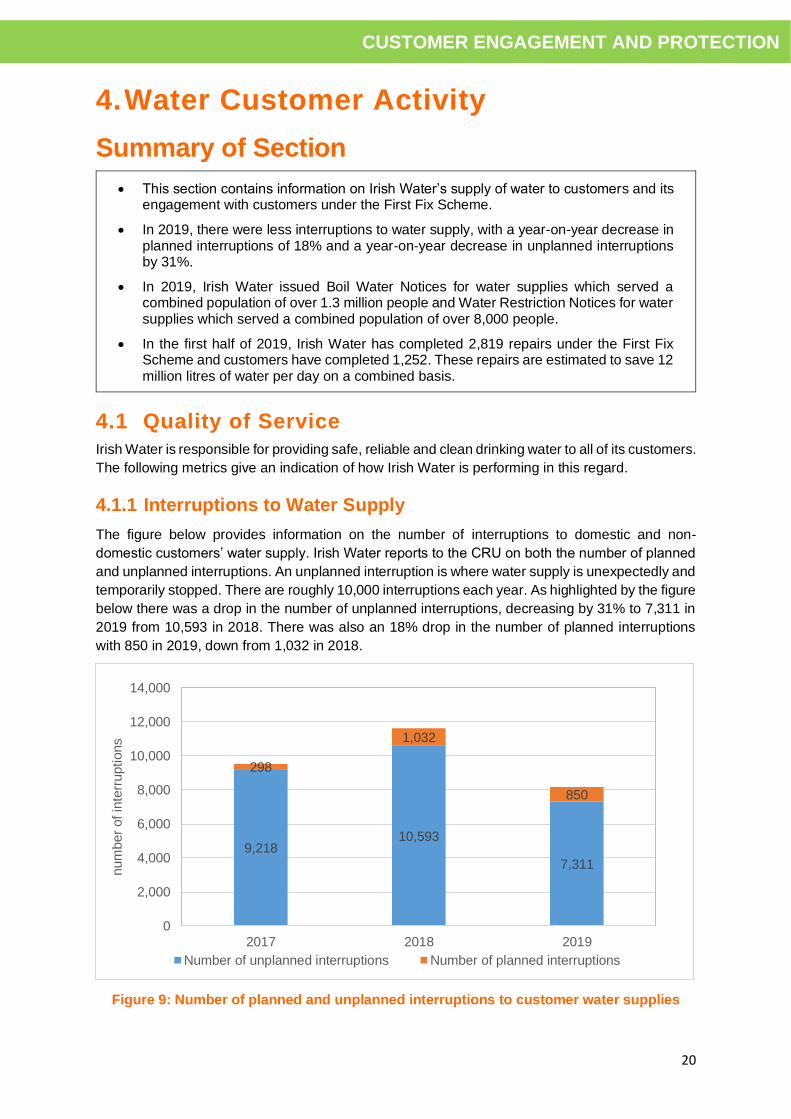
• In 2019, there were less interruptions to water supply, with a year-on-year decrease in planned interruptions of 18% and a year-on-year decrease in unplanned interruptions by 31%.
• In 2019, Irish Water issued Boil Water Notices for water supplies which served a combined population of over 1.3 million people and Water Restriction Notices for water supplies which served a combined population of over 8,000 people.
• In the first half of 2019, Irish Water has completed 2,819 repairs under the First Fix Scheme and customers have completed 1,252. These repairs are estimated to save 12 million litres of water per day on a combined basis.
4.1 Quality of Service
Irish Water is responsible for providing safe, reliable and clean drinking water to all of its customers.
The following metrics give an indication of how Irish Water is performing in this regard.
4.1.1 Interruptions to Water Supply
The figure below provides information on the number of interruptions to domestic and non-
domestic customers’ water supply. Irish Water reports to the CRU on both the number of planned
and unplanned interruptions. An unplanned interruption is where water supply is unexpectedly and
temporarily stopped. There are roughly 10,000 interruptions each year. As highlighted by the figure
below there was a drop in the number of unplanned interruptions, decreasing by 31% to 7,311 in
2019 from 10,593 in 2018. There was also an 18% drop in the number of planned interruptions
with 850 in 2019, down from 1,032 in 2018.
Figure 9: Number of planned and unplanned interruptions to customer water supplies
9,21810,593
7,311
298
1,032
850
0
2,000
4,000
6,000
8,000
10,000
12,000
14,000
2017 2018 2019
num
ber
of in
terr
uptions
Number of unplanned interruptions Number of planned interruptions

21
CUSTOMER ENGAGEMENT AND PROTECTION
4.1.2 Boil Water Notices
A boil water notice (BWN) is a formal notice issued to all properties in an area advising that drinking
water from the public mains is not safe to drink unless it is boiled and cooled beforehand. The table
below provides information on the population served by supplies with a BWN in place.
2015 2016 2017 2018 2019
Population served by supply
placed on a BWN during the year 22,699 98,431 17,970 97,559 1,304,860
Population served by supply with
a BWN lifted during the year 37,091 101,890 23,291 96,689 1,289,661
Population served by supply with
a BWN at year end 8,799 5,340 19 899 16,098
Table 7: Population served by supply with a boil water notice in place
At the end of 2019, Irish Water reported that a population of 16,098 was being served by 18
supplies with a BWN in place. This was an increase on the 899 served by supplies with a BWN at
the end of 2018. In addition, there was an increase in the population served by supplies placed on
BWNs during the year, with over 1.3 million affected. Typically, BWNs are issued due to a variety
of reasons including inadequate disinfection, monitoring results failures, source contamination and
adverse weather conditions. The main driver for the large population affected by BWNs in 2019
were the two separate BWNs related to issues with the operation of the Leixlip Water Treatment
Plant (WTP) in October and November 2019 impacting over 600,000 customers on both occasions.
Due to the large number of customers affected by these BWNs, the CRU has conducted an audit
on Irish Water’s levels of compliance with its obligations regarding customer service and customer
protection during a BWN. The CRU published this audit on its website in April 2020 (CRU/20/052).
4.1.3 Water Restriction Notices
A water restriction notice (WRN) is an instruction issued to the public if the water supply within a
certain area is not guaranteed to be at the quality standards required by the European Union
Drinking Water Regulations 2014 and either not safe to drink or use, as boiling it will have no effect
on removing the contaminant. There are several different types of water restriction notices that
may be issued e.g. Do Not Consume Notices are issued where water should not be used for
drinking or cooking but can be used for personal bathing or household cleaning activities etc.
2015 2016 2017 2018 2019
Population served by supply
placed on a WRN during the year 1,027 54 212 20,624 8,409
Population served by supply with
a WRN lifted during the year 651 188 347 20,190 9,104
Population served by supply with
a WRN at year end 4,219 4,085 3,950 4,384 3,689
Table 8: Population served by supply with a water restriction notice in place
At the end of 2019, the population served by supplies with a WRN in place was 3,689, which is
lower than previous years. However, 2019 also saw the second highest population, 9,104, served
by supplies placed on a water restriction during the year. Water restriction notices can be caused
by contamination of the source and problems with chlorine dosing. Some supplies may be affected
by lead due to the presence of lead pipework on the customer side. Irish Water’s Lead in Drinking
Water Mitigation Plan aims to reduce the supplies affected by this issue. The goal of the Mitigation
Plan is the removal of all lead pipework.
22
CUSTOMER ENGAGEMENT AND PROTECTION
4.2 First Fix Free Scheme
Irish Water produces 1.7 billion litres of treated water per day, but nearly half of this is lost through
leaking pipes. Irish Water estimate that 20% to 30% of water losses are through customer side
leakage.
To help address this, in August 2015 the CRU approved Irish Water’s First Fix Scheme. This
provides qualifying customers with free leak investigation and repair to their external supply pipe,
thus enabling greater water conservation. Irish Water identifies and prioritises the most significant
leaks first.
The CRU monitors the operation of the scheme through quarterly reports submitted by Irish Water.
These include details of number of repairs completed and litres of water saved.
Later this year, the CRU plans to consult on proposed changes to the scheme which would expand
its scope to make it available to a greater number of customers. As part of this consultation, the
CRU will review the operation of the first fix scheme to date and assess its effectiveness as a
leakage reduction measure over the past six years.
4.3.1 Number of Leak Repairs
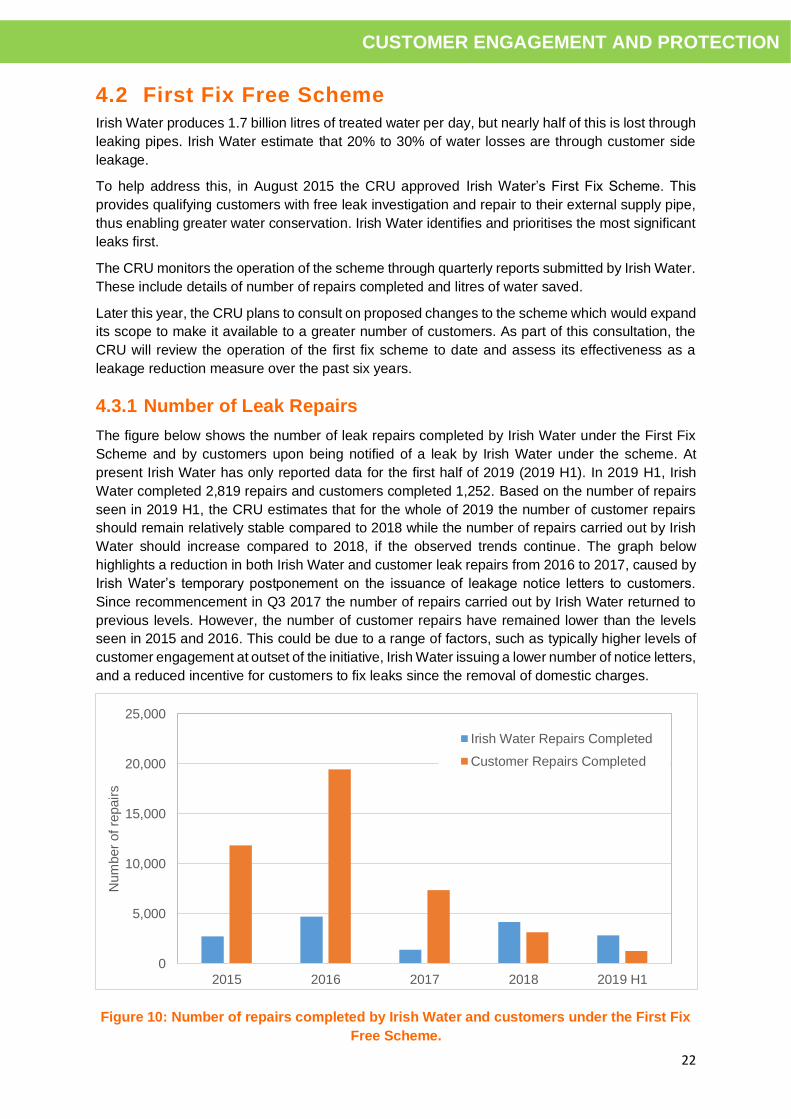
The figure below shows the number of leak repairs completed by Irish Water under the First Fix
Scheme and by customers upon being notified of a leak by Irish Water under the scheme. At
present Irish Water has only reported data for the first half of 2019 (2019 H1). In 2019 H1, Irish
Water completed 2,819 repairs and customers completed 1,252. Based on the number of repairs
seen in 2019 H1, the CRU estimates that for the whole of 2019 the number of customer repairs
should remain relatively stable compared to 2018 while the number of repairs carried out by Irish
Water should increase compared to 2018, if the observed trends continue. The graph below
highlights a reduction in both Irish Water and customer leak repairs from 2016 to 2017, caused by
Irish Water’s temporary postponement on the issuance of leakage notice letters to customers.
Since recommencement in Q3 2017 the number of repairs carried out by Irish Water returned to
previous levels. However, the number of customer repairs have remained lower than the levels
seen in 2015 and 2016. This could be due to a range of factors, such as typically higher levels of
customer engagement at outset of the initiative, Irish Water issuing a lower number of notice letters,
and a reduced incentive for customers to fix leaks since the removal of domestic charges.
Figure 10: Number of repairs completed by Irish Water and customers under the First Fix
Free Scheme.
0
5,000
10,000
15,000
20,000
25,000
2015 2016 2017 2018 2019 H1
Num
ber
of re
pair
s
Irish Water Repairs Completed
Customer Repairs Completed
23
CUSTOMER ENGAGEMENT AND PROTECTION
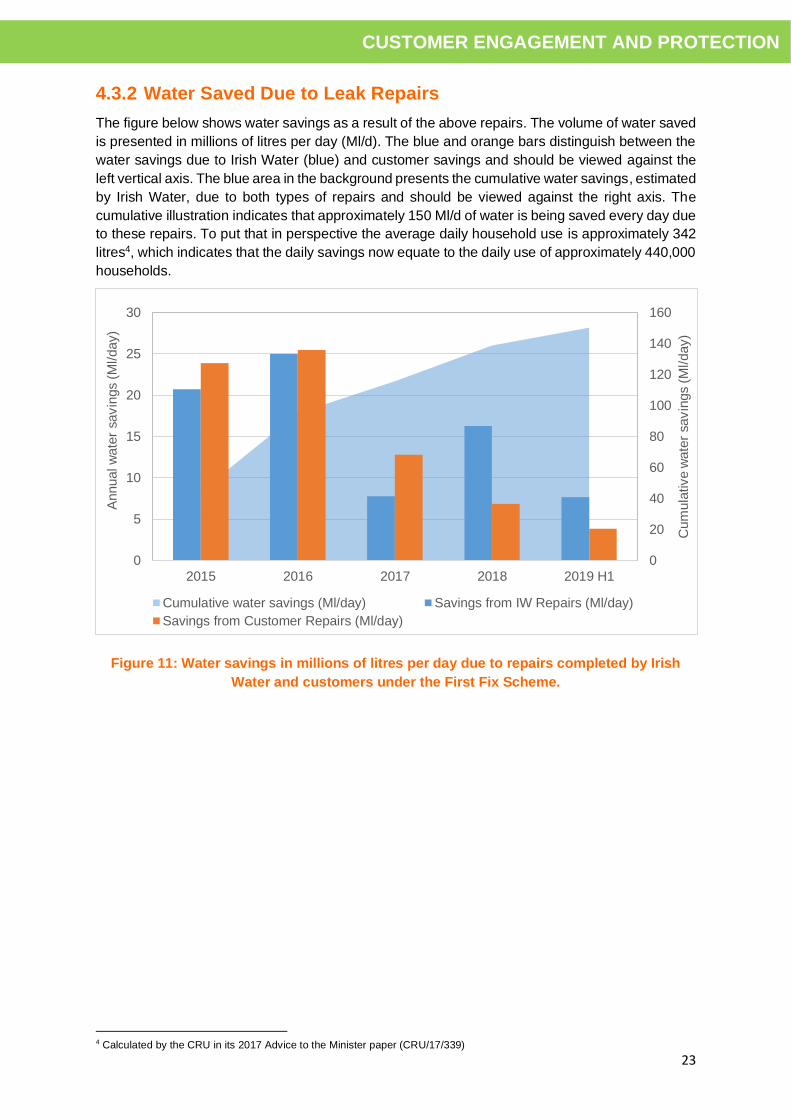
4.3.2 Water Saved Due to Leak Repairs
The figure below shows water savings as a result of the above repairs. The volume of water saved
is presented in millions of litres per day (Ml/d). The blue and orange bars distinguish between the
water savings due to Irish Water (blue) and customer savings and should be viewed against the
left vertical axis. The blue area in the background presents the cumulative water savings, estimated
by Irish Water, due to both types of repairs and should be viewed against the right axis. The
cumulative illustration indicates that approximately 150 Ml/d of water is being saved every day due
to these repairs. To put that in perspective the average daily household use is approximately 342
litres4, which indicates that the daily savings now equate to the daily use of approximately 440,000
households.
Figure 11: Water savings in millions of litres per day due to repairs completed by Irish
Water and customers under the First Fix Scheme.
4 Calculated by the CRU in its 2017 Advice to the Minister paper (CRU/17/339)
0
20
40
60
80
100
120
140
160
0
5
10
15
20
25
30
2015 2016 2017 2018 2019 H1
Cum
ula
tive w
ate
r savin
gs (
Ml/day)
Annual w
ate
r savin
gs (
Ml/day)
Cumulative water savings (Ml/day) Savings from IW Repairs (Ml/day)
Savings from Customer Repairs (Ml/day)
24
CUSTOMER ENGAGEMENT AND PROTECTION
5. Energy Consumer Survey Each year the CRU conducts a survey of the residential and Small and Medium Sized Enterprises
(SME) electricity and gas markets in Ireland to measure consumer engagement, experiences and
attitudes. The purpose of the survey is to provide additional consumer-based insights to the market
monitoring activities of the CRU, to contribute to consumer protection polices and codes of practice
for energy suppliers and to further empower customers in the competitive energy market.
This research has been ongoing since 2011 and provides an insight to the changes which have
occurred since then, as well as providing a more detailed update on attitudes in 2019. The 2019
research was conducted by Behaviour & Attitudes and The Research Perspective under the
direction of the CRU.
It is evident from the results of the survey that a number of factors influence customer’s perceptions
of and engagement in the respective energy markets. These factors include, inter alia, satisfaction
with suppliers, understanding of bills and the associated calculation of cost for both electricity and
gas consumed, market knowledge and the capability to easily evaluate offers from alternative
suppliers and finally the switching process and how easy customers find the comparison of tariffs.
Customers in both the residential and SME energy markets report a high level of satisfaction with
the service from their suppliers, with Overall Satisfaction scores of 88% and 89% in the residential
market and 82% and 85% respectively for electricity and gas in the SME market. In both markets
these scores show remarkable stability, reflected in the satisfaction scores, notwithstanding
changes in pricing and variations in service.
It is clear that more work needs to be done to motivate customers’ engagement in the market, for
both residential and SME customers. While awareness of competitors in the market has increased,
in particular for more recent entrants to the markets, close to 30% of residential and between 20%
and 30% of SME customers are passive in terms of awareness of offers from other suppliers.
Finding a way to motivate customers to consider other offers is dependent on their having the
capability to understand and compare alternatives. At present, between 26% and 30% of
residential customers and 33% and 36% of SME respondents indicate they have a good
understanding of and ability to compare offers in the electricity and gas markets.
Switching rates are showing improvement with 19% of residential electricity customers and 17%
of residential gas customers indicating they switched in the past 12 months and reducing
proportions who indicate they have never switched (49% electricity and 55% gas). In the case of
the SME market 29% of electricity customers and 22% of gas customers switched in the past 12
months, with the totals for never having switched now at 28% for electricity and 34% for gas. This
shows considerable improvement in terms of engagement and it is supported by the ease with
which customers perceive the process and their experience of the outcome. In the case of the
residential market, the switching process is receiving improved scores with 87% and 92%
respectively satisfied with the overall ease of switching and improved assessments of the
outcomes across all the metrics. Similarly, in the case of the SME market, ease of switching also
improved with 91% of SME’s in electricity and 87% of SME’s in the gas market reporting improved
satisfaction with the ease of the switching process, and improvement reported across almost all
the outcome metrics.
It is important to remain aware that those who switched supplier in the past 12 months tend to be
very focused on price savings and are clear that that there is price differentiation in the market. By
the same token, those who have never switched are likely to be less aware of price differences
between suppliers and of differentiated offers, and as such are unlikely to understand that the
benefits of switching supplier. The improvement in the switching highlights that barriers to switching
are becoming less significant and the ease with which a customer can switch is improving, but that
is the case for those who have switched. It is worth recalling that circa 50% of the residential market
25
CUSTOMER ENGAGEMENT AND PROTECTION
and close to 25% of the SME market have never switched, and the challenge remains to ensure
there are no structural or process barriers remaining which discourage that segment from
switching.
This is more important in regard to the future success of smart meters in empowering residential
and SME customer manage their energy consumption and associated cost to best effect. If
customers are aware of their consumption and cost thereof, they will be more likely to appreciate
the value of a smart meter in enabling them to manage these aspects of their domestic and
business affairs. In the 2019 measurement, it is clear that there is an appetite for smart meters
with 65% and 73% of residential electricity and gas customers respectively indicating interest in
getting a smart meter and 75% of SME’s in the electricity market indicating interest in having a
Time of Use tariff and furthermore 85% interested in viewing daily electricity usage.
More information on the background and result of the 2019 survey can be found on the CRU
website.

26
CUSTOMER ENGAGEMENT AND PROTECTION
6. Electricity and Gas Customer Switching and Renegotiations
Summary of Section
• This section contains information on customer engagement with energy suppliers. Switching and renegotiations activity are major areas in which customers directly engage with their energy supplier.
• In 2019, the electricity switching rate was 13.5% and the gas switching rate was 17.7%. Of total switches, 31% were dual fuel switches.
• According to the Monitoring Report on the Performance of European Retail Markets in 2018 published by CEER in November 2019, in 2018 Ireland had the fifth highest external switching rate for domestic electricity customers of 14.2%, while in gas it had the second highest external switching rate of 20.5% for domestic customers across European countries reported on.
• The total number of switches completed in the electricity market in 2019 was 323,566. This represents a decrease of 2.5% from 2018, when 331,900 customers switched.
• The total number of switches completed in the gas market in 2019 was 124,698. This represents a decrease of 9.1% from 2018, when 137,125 customers switched.
• In addition to switches between suppliers, approximately 10% of electricity customers and 12% of gas customers renegotiated their contracts with their current supplier in 2019. These figures represent a 15% and 30% increase from 2018 in electricity and gas respectively.
• In total, therefore, 25% of electricity and 29% of gas of customers looked for a better energy plan in 2019 through either switching supplier or renegotiating with their current supplier.
• If a customer had switched to the best available discount tariff each year for the past 4 years they could, over the course of the 4 years, potentially have saved up to: €726 on electricity; €494 on gas; and €1,343 on dual fuel.
6.1 Electricity and Gas Switching
This section analyses switching activity in the electricity and gas markets. Switching refers to the
action where a customer changes from one supplier to another. It is measured by the number of
completed switches in a period (not the number of switching requests).
Switching information is critically important in monitoring the effectiveness of competition, the level
of customer engagement in the market and the choices available to customers. Competition in the
electricity and gas markets is driven by engaged customers that look for suppliers offering
attractive products and tariffs.
High engagement by customers is an indicator of well-functioning energy markets. Informed by
analysis carried out in its review of competition (CER17019) and to assist customer participation
in the energy market on a consisted basis, in 2017 the CRU introduced changes to the Supplier
Handbook which sets out obligations on electricity and gas suppliers. These changes included
requirements for suppliers to display an Estimated Annual Bill (EAB) in their marketing and
advertising, to give customers 30 Days’ Notice prior to the end of the customer’s fixed-term
contract, and to issue an Annual Prompt to customers who have been on the same tariff for 3 years
or more highlighting the availability of alternative tariffs.

27
CUSTOMER ENGAGEMENT AND PROTECTION
To further promote customer engagement in the energy market, the CRU ran a Customer
Engagement campaign in 2018, encouraging energy customers to “Switch On” to their rights, their
savings and to energy safety. The positive impacts of this campaign were seen in the large
increase in switching rates in the months following this campaign.
The total number of electricity customer switches in 2018 was 331,900, representing a 14.1%
annual supplier switching rate, compared to 323,566 customer switches in 2019, representing a
13.5% annual supplier switching rate.
The total number of gas customer switches in 2018 was 137,125, representing a 19.7% annual
supplier switching rate, compared to 124,698 customer switches in 2019, representing a 17.7%
annual supplier switching rate.
The figure below shows the percentage of electricity customers that switch suppliers on an annual
basis. The electricity switching rate has been very stable since 2014, while the gas switching rate
has been a bit more variable and has been at a high in recent years.
There was a decrease observed in both the electricity and gas switching rates from 2018 to 2019,
with the biggest decrease observed in the gas rate. The CRU has launched another “Switch On”
campaign in 2020 to further promote switching, renegotiations and customer engagement with
energy suppliers.
Figure 12: Electricity and Gas Switching Rate
The figure below shows the percentage of electricity and gas customers, broken down into
domestic and non-domestic, that switch suppliers on an annual basis. The domestic electricity and
total electricity switching rates have been steady since 2015, while there has been a decrease in
the switching rate of the non-domestic electricity segment. In gas, the switching rate has been
more variable compared to electricity in all three categories.
Non-domestic customers may be affected by a lack of transparency in prices and contracts offered
by suppliers, as due to the nature of bespoke plans there are no comparison tools currently
available. This could possibly explain the change in the switching rates for non-domestic electricity
and gas customers over time.
0%
5%
10%
15%
20%
25%
2010 2011 2012 2013 2014 2015 2016 2017 2018 2019
% o
f custo
mers
that sw
itched s
upplier
Electricity Switching Rate Gas Switching Rate
28
CUSTOMER ENGAGEMENT AND PROTECTION
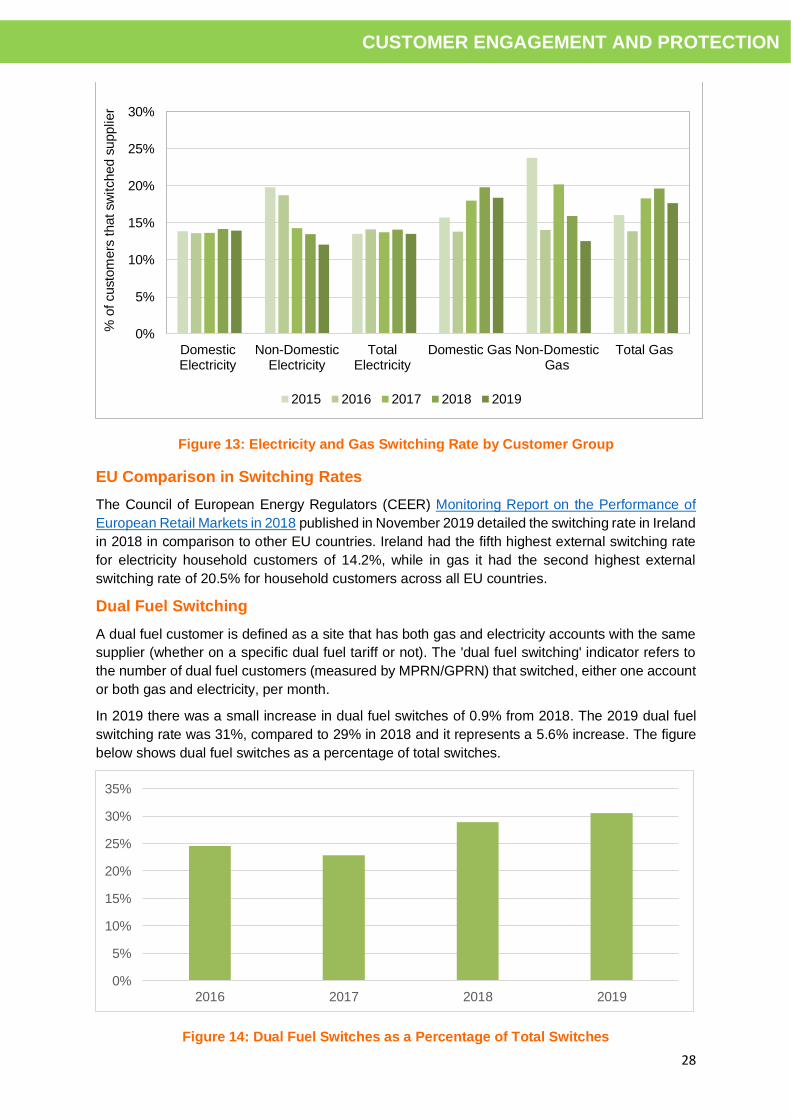
Figure 13: Electricity and Gas Switching Rate by Customer Group
EU Comparison in Switching Rates
The Council of European Energy Regulators (CEER) Monitoring Report on the Performance of
European Retail Markets in 2018 published in November 2019 detailed the switching rate in Ireland
in 2018 in comparison to other EU countries. Ireland had the fifth highest external switching rate
for electricity household customers of 14.2%, while in gas it had the second highest external
switching rate of 20.5% for household customers across all EU countries.
Dual Fuel Switching
A dual fuel customer is defined as a site that has both gas and electricity accounts with the same
supplier (whether on a specific dual fuel tariff or not). The 'dual fuel switching' indicator refers to
the number of dual fuel customers (measured by MPRN/GPRN) that switched, either one account
or both gas and electricity, per month.
In 2019 there was a small increase in dual fuel switches of 0.9% from 2018. The 2019 dual fuel
switching rate was 31%, compared to 29% in 2018 and it represents a 5.6% increase. The figure
below shows dual fuel switches as a percentage of total switches.
Figure 14: Dual Fuel Switches as a Percentage of Total Switches
0%
5%
10%
15%
20%
25%
30%
DomesticElectricity
Non-DomesticElectricity
TotalElectricity
Domestic Gas Non-DomesticGas
Total Gas
% o
f custo
mers
that sw
itched s
upplier
2015 2016 2017 2018 2019
0%
5%
10%
15%
20%
25%
30%
35%
2016 2017 2018 2019

29
CUSTOMER ENGAGEMENT AND PROTECTION
6.2 Renegotiations of Contracts/Tariffs
Renegotiations (internal switching) refer to situations where a new contract term, tariff or terms &
conditions have been negotiated between the supplier and the customer. The indicator includes
data on the number of successfully completed renegotiated contracts regardless of whether
initiated by the customer or the supplier or of the number of times an individual customer
renegotiated. This indicator does not include situations where a customer renegotiates a payment
plan or automatically defaults to the standard tariff or any other tariff that does not have a time
limited discount or lock in period associated with it.
Renegotiations give some further insight into customer engagement in the retail energy markets
and show that the number of renegotiations is a significant addition to external switching.
The figure below shows the rate of successfully completed renegotiated contracts over the year in
both the electricity and gas retail markets for domestic and non-domestic customers. The total gas
and total electricity renegotiation rates are similar. In 2019, 10% of electricity customers and 12%
of gas customers renegotiated their contract with their existing supplier. This represents an
increase of 15% in the electricity rate and an increase of 30% in the gas rate. The 2019
renegotiation rates in both electricity and gas are the highest rates recorded since 2016 when the
CRU started collecting data on this indicator. Non-domestic customers are more likely to
renegotiate, while non-domestic gas customers are the group most likely to renegotiate.
Figure 15: Renegotiation Rate by Customer Group
When the renegotiation rate is added to the switching rate it can be concluded that 24.6% and
29.3% of electricity and gas customers looked for a better energy plan through either switching
supplier or renegotiating with their existing supplier in 2019. This represents an increase of 3.6%
in electricity and 2.4% in gas from 2018. Even though, there was a decrease in switching in 2019,
there was an increase in renegotiations. It is important, therefore, to note that in 2019 there were
more customers engaging with energy suppliers compared to 2018.
The rate of switching and renegotiations in electricity has remained stable between 2016 - 2019,
while the equivalent rate in gas has seen a year on year increase with the biggest increase
observed between 2016 – 2017.
0%
5%
10%
15%
20%
25%
30%
35%
40%
DomesticElectricity
Non-DomesticElectricity
TotalElectricity
Domestic GasNon-DomesticGas
Total Gas% o
f custo
mers
that
reneg
otiate
d w
ith s
up
plie
r
2016 2017 2018 2019
30
CUSTOMER ENGAGEMENT AND PROTECTION
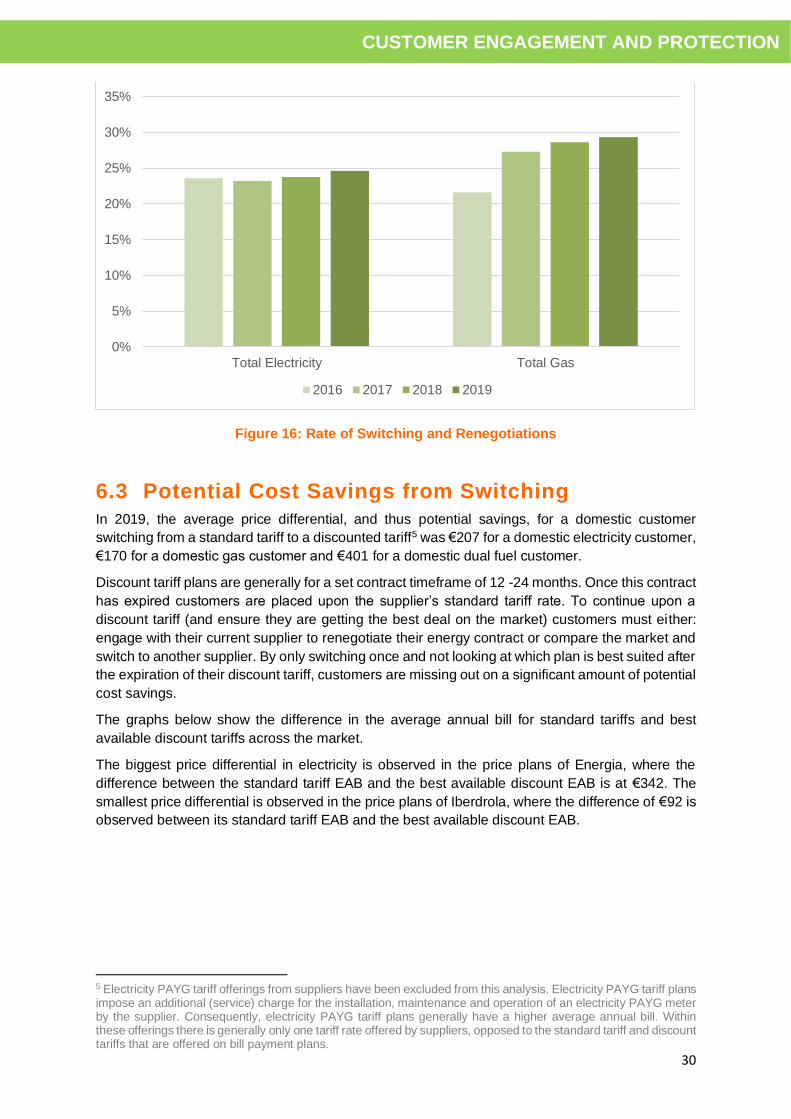
Figure 16: Rate of Switching and Renegotiations
6.3 Potential Cost Savings from Switching
In 2019, the average price differential, and thus potential savings, for a domestic customer
switching from a standard tariff to a discounted tariff5 was €207 for a domestic electricity customer,
€170 for a domestic gas customer and €401 for a domestic dual fuel customer.
Discount tariff plans are generally for a set contract timeframe of 12 -24 months. Once this contract
has expired customers are placed upon the supplier’s standard tariff rate. To continue upon a
discount tariff (and ensure they are getting the best deal on the market) customers must either:
engage with their current supplier to renegotiate their energy contract or compare the market and
switch to another supplier. By only switching once and not looking at which plan is best suited after
the expiration of their discount tariff, customers are missing out on a significant amount of potential
cost savings.
The graphs below show the difference in the average annual bill for standard tariffs and best
available discount tariffs across the market.
The biggest price differential in electricity is observed in the price plans of Energia, where the
difference between the standard tariff EAB and the best available discount EAB is at €342. The
smallest price differential is observed in the price plans of Iberdrola, where the difference of €92 is
observed between its standard tariff EAB and the best available discount EAB.
5 Electricity PAYG tariff offerings from suppliers have been excluded from this analysis. Electricity PAYG tariff plans impose an additional (service) charge for the installation, maintenance and operation of an electricity PAYG meter by the supplier. Consequently, electricity PAYG tariff plans generally have a higher average annual bill. Within these offerings there is generally only one tariff rate offered by suppliers, opposed to the standard tariff and discount tariffs that are offered on bill payment plans.
0%
5%
10%
15%
20%
25%
30%
35%
Total Electricity Total Gas
2016 2017 2018 2019

31
CUSTOMER ENGAGEMENT AND PROTECTION
Figure 17: Electricity EABs: Standard Tariff vs Best Available
Discount Tariff
The biggest price differential in gas is observed in the price plans of Flogas and SSE Airtricity. The
difference between the standard tariff EAB and the best available discount EAB of each supplier
is at €271. The smallest price differential is observed in the price plans of Bord Gáis Energy, where
the difference of €92 is observed between its standard tariff EAB and the best available discount
EAB.
Figure 18: Gas EABs: Standard Tariff vs Best Available
Discount Tariff
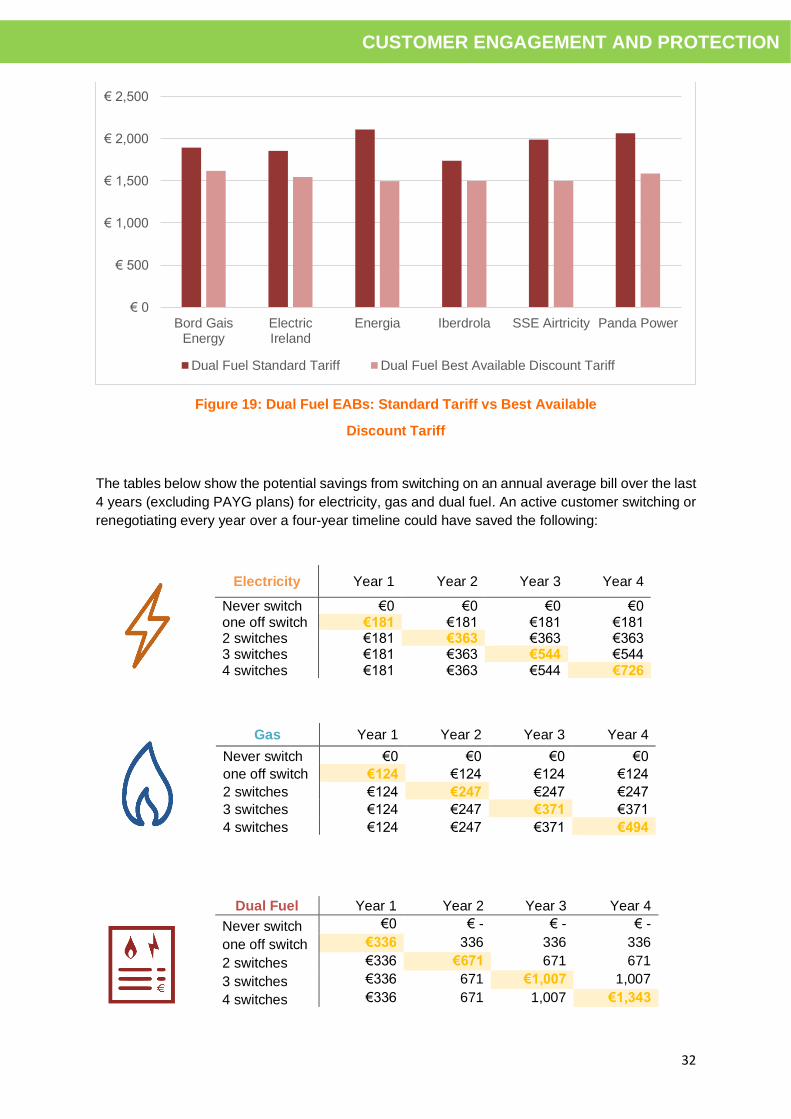
The biggest price differential in dual fuel is observed in the price plans of Energia, where the
difference between the standard tariff EAB and the best available discount EAB is at €615. The
smallest price differential is observed in the price plans of Iberdrola, where the difference of €240
is observed between its standard tariff EAB and the best available discount EAB.
€ 0
€ 200
€ 400
€ 600
€ 800
€ 1,000
€ 1,200
€ 1,400
Bord GaisEnergy
ElectricIreland
Energia Iberdrola SSEAirtricity
PandaPower
BEenergy
Electricity Standard Tariff Electricity Best Available Discount Tariff
€ 0
€ 100
€ 200
€ 300
€ 400
€ 500
€ 600
€ 700
€ 800
€ 900
€ 1,000
Bord GaisEnergy
ElectricIreland
Energia Iberdrola SSEAirtricity
PandaPower
Flogas**
Gas Standard Tariff Gas Best Available Discount Tariff
32
CUSTOMER ENGAGEMENT AND PROTECTION
Figure 19: Dual Fuel EABs: Standard Tariff vs Best Available
Discount Tariff
The tables below show the potential savings from switching on an annual average bill over the last
4 years (excluding PAYG plans) for electricity, gas and dual fuel. An active customer switching or
renegotiating every year over a four-year timeline could have saved the following:
Electricity Year 1 Year 2 Year 3 Year 4
Never switch €0 €0 €0 €0 one off switch €181 €181 €181 €181 2 switches €181 €363 €363 €363 3 switches €181 €363 €544 €544 4 switches €181 €363 €544 €726
Gas Year 1 Year 2 Year 3 Year 4
Never switch €0 €0 €0 €0
one off switch €124 €124 €124 €124
2 switches €124 €247 €247 €247
3 switches €124 €247 €371 €371
4 switches €124 €247 €371 €494
€ 0
€ 500
€ 1,000
€ 1,500
€ 2,000
€ 2,500
Bord GaisEnergy
ElectricIreland
Energia Iberdrola SSE Airtricity Panda Power
Dual Fuel Standard Tariff Dual Fuel Best Available Discount Tariff
Dual Fuel Year 1 Year 2 Year 3 Year 4
Never switch €0 € - € - € -
one off switch €336 336 336 336
2 switches €336 €671 671 671
3 switches €336 671 €1,007 1,007
4 switches €336 671 1,007 €1,343

33
CUSTOMER ENGAGEMENT AND PROTECTION
The graph below shows the compounded savings from repeat switching over a period of 4 years.
Figure 20: Savings from Repeat Switching Over a Period of 4 Years
Note that it may not be cost effective to switch more than four times over a four-year period. This
is because the best available discount plans offered by suppliers are in the form of a one-year
contract. If a customer breaks this contract and switches to a new plan before the contract has
expired then they are likely to incur an early termination fee from their supplier, generally in the
range of €50 to €200.
€ 726
€ 494
€ 1,343
€ -
€ 200.00
€ 400.00
€ 600.00
€ 800.00
€ 1,000.00
€ 1,200.00
€ 1,400.00
€ 1,600.00
Never switch one off switch 2 switches 3 switches 4 switches
Electricity Gas Dual
Linear (Electricity) Linear (Gas) Linear (Dual)
34
CUSTOMER ENGAGEMENT AND PROTECTION
7. Energy Bill Management
Summary of Section
• This section contains information on energy customers in arrears and on payment plans, new installations of energy pay as you go (PAYG) financial hardship meters and energy customer disconnections for non-payment of account (NPA).
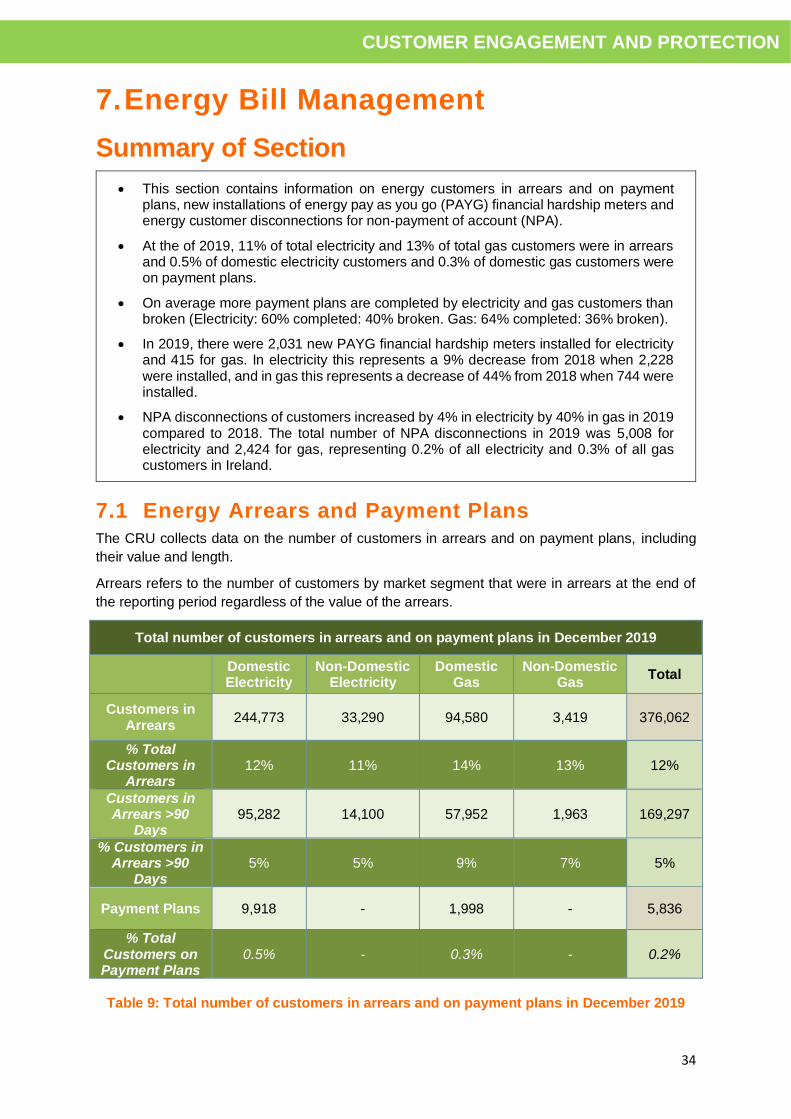
• At the of 2019, 11% of total electricity and 13% of total gas customers were in arrears and 0.5% of domestic electricity customers and 0.3% of domestic gas customers were on payment plans.
• On average more payment plans are completed by electricity and gas customers than broken (Electricity: 60% completed: 40% broken. Gas: 64% completed: 36% broken).
• In 2019, there were 2,031 new PAYG financial hardship meters installed for electricity and 415 for gas. In electricity this represents a 9% decrease from 2018 when 2,228 were installed, and in gas this represents a decrease of 44% from 2018 when 744 were installed.
• NPA disconnections of customers increased by 4% in electricity by 40% in gas in 2019 compared to 2018. The total number of NPA disconnections in 2019 was 5,008 for electricity and 2,424 for gas, representing 0.2% of all electricity and 0.3% of all gas customers in Ireland.
7.1 Energy Arrears and Payment Plans
The CRU collects data on the number of customers in arrears and on payment plans, including
their value and length.
Arrears refers to the number of customers by market segment that were in arrears at the end of
the reporting period regardless of the value of the arrears.
Total number of customers in arrears and on payment plans in December 2019
Domestic Electricity
Non-Domestic Electricity
Domestic Gas
Non-Domestic Gas
Total
Customers in Arrears
244,773 33,290 94,580 3,419 376,062
% Total Customers in
Arrears 12% 11% 14% 13% 12%
Customers in Arrears >90
Days 95,282 14,100 57,952 1,963 169,297
% Customers in Arrears >90
Days 5% 5% 9% 7% 5%
Payment Plans 9,918 - 1,998 - 5,836
% Total Customers on Payment Plans
0.5% - 0.3% - 0.2%
Table 9: Total number of customers in arrears and on payment plans in December 2019

35
CUSTOMER ENGAGEMENT AND PROTECTION
The figure below shows the percentage of customers that were in arrears at the end of each year.
The percentage of customers in arrears has remained stable with 11-14% of customers in arrears
in each customer group at the end of each year with the exception of 23% of non-domestic gas
customers that were in arrears at the end of 2017. At the of 2019, 11% of total electricity and 13%
of total gas customers were in arrears. This represents a 4% decrease in the rate of arrears for
electricity and an 8% increase for gas from 2018 when 12% of electricity and 12% of gas customers
were in arrears.
Figure 21: Percentage of Customers in Arrears by Customer Group
In electricity of those in arrears 39% (95,282) domestic and 42% (14,100) non-domestic have been
so for greater than 90 days. In gas of those in arrears 61% (57,952) domestic and 57% (1,963)
non-domestic have been so for greater than 90 days.
Due to the seasonality of gas usage, it is common for the gas market to have a higher percentage
of customers in arrears.
Figure 22: Percentage of Customers in Arrears for more than 90 Days by Customer Group
0%
5%
10%
15%
20%
25%
DomesticElectricity
Non-DomesticElectricity
TotalElectricity
Domestic Gas Non-DomesticGas
Total Gas
2017 2018 2019
0%
1%
2%
3%
4%
5%
6%
7%
8%
9%
DomesticElectricity
Non-DomesticElectricity
TotalElectricity
Domestic Gas Non-DomesticGas
Total Gas
2017 2018 2019
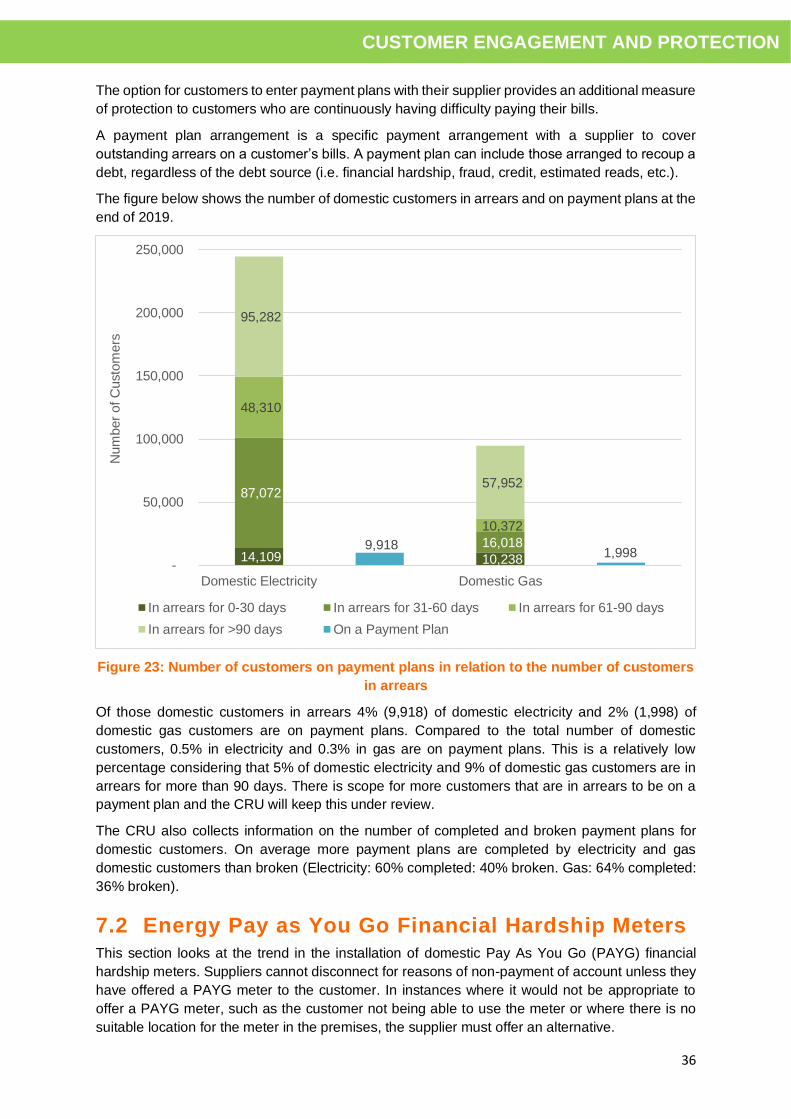
36
CUSTOMER ENGAGEMENT AND PROTECTION
The option for customers to enter payment plans with their supplier provides an additional measure
of protection to customers who are continuously having difficulty paying their bills.
A payment plan arrangement is a specific payment arrangement with a supplier to cover
outstanding arrears on a customer’s bills. A payment plan can include those arranged to recoup a
debt, regardless of the debt source (i.e. financial hardship, fraud, credit, estimated reads, etc.).
The figure below shows the number of domestic customers in arrears and on payment plans at the
end of 2019.
Figure 23: Number of customers on payment plans in relation to the number of customers
in arrears
Of those domestic customers in arrears 4% (9,918) of domestic electricity and 2% (1,998) of
domestic gas customers are on payment plans. Compared to the total number of domestic
customers, 0.5% in electricity and 0.3% in gas are on payment plans. This is a relatively low
percentage considering that 5% of domestic electricity and 9% of domestic gas customers are in
arrears for more than 90 days. There is scope for more customers that are in arrears to be on a
payment plan and the CRU will keep this under review.
The CRU also collects information on the number of completed and broken payment plans for
domestic customers. On average more payment plans are completed by electricity and gas
domestic customers than broken (Electricity: 60% completed: 40% broken. Gas: 64% completed:
36% broken).
7.2 Energy Pay as You Go Financial Hardship Meters
This section looks at the trend in the installation of domestic Pay As You Go (PAYG) financial
hardship meters. Suppliers cannot disconnect for reasons of non-payment of account unless they
have offered a PAYG meter to the customer. In instances where it would not be appropriate to
offer a PAYG meter, such as the customer not being able to use the meter or where there is no
suitable location for the meter in the premises, the supplier must offer an alternative.
14,109 10,238
87,072
16,018
48,310
10,372
95,282
57,952
9,918 1,998
-
50,000
100,000
150,000
200,000
250,000
Domestic Electricity Domestic Gas
Num
ber
of C
usto
mers
In arrears for 0-30 days In arrears for 31-60 days In arrears for 61-90 days
In arrears for >90 days On a Payment Plan

37
CUSTOMER ENGAGEMENT AND PROTECTION
Currently Bord Gáis Energy, Electric Ireland, Energia, Flogas, PrePayPower and SSE Airtricity
provide PAYG meters for financial hardship in the electricity and gas domestic markets.
ESB Networks and GNI are responsible for installing PAYG meters free of charge for customers
in financial difficulty at the request of suppliers (on foot of a customer agreeing to the installation
of a meter).
A number of suppliers also offer lifestyle choice prepayment options in the electricity and gas
domestic markets (Bord Gáis Energy, Electric Ireland, Energia, Flogas, Pinergy, PrePayPower and
SSE Airtricity). This is provided in the form of a PAYG meter unit that acts as a budget controller
in series with the existing meter.
Suppliers offering lifestyle choice prepayment meters charge additional daily service charges. This
makes them more expensive than alternatives. Customers considering opting for a lifestyle choice
prepayment meter should consider this additional cost and weigh it against the additional benefits
that the solution may bring them. It is important to note that customers who are experiencing
financial difficulty and avail of a free PAYG meter do not incur any additional charges. For gas,
GNI provides all PAYG meters. If a customer wishes to avail of a lifestyle choice meter in gas this
is purchased from GNI through their supplier. For electricity, the lifestyle choice prepayment meter
is an asset of the supplier rather than ESBN.
The figure below shows that the installation of new domestic electricity and gas PAYG financial
hardship meters decreased from 2015 to 2017 and has broadly levelled off over 2018 and 2019.
In 2019 there were 2,031 new installs of PAYG financial hardship installs in electricity and 415 in
gas, which represent 0.1% and 0.06% of total domestic electricity and total domestic gas
customers respectively. There was a reduction in the installation of new financial hardship PAYG
meters from 2018 of 9% in electricity and 44% in gas. It is likely that improved economic conditions
in recent years has also contributed to this year on year decrease in the installation of new financial
hardship PAYG meters.
Figure 24: Number of New Domestic Electricity and Gas PAYG Financial Hardship Installs
0
5,000
10,000
15,000
20,000
25,000
2014 2015 2016 2017 2018 2019
Electricity Gas
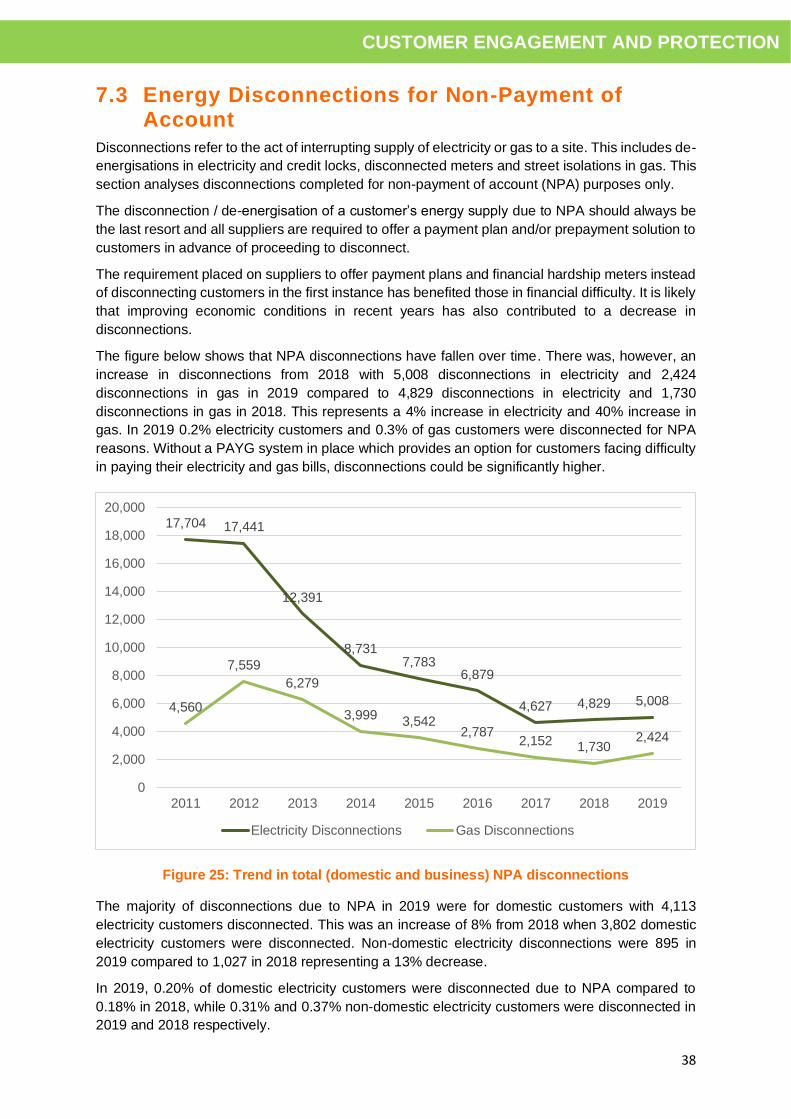
38
CUSTOMER ENGAGEMENT AND PROTECTION
7.3 Energy Disconnections for Non-Payment of Account
Disconnections refer to the act of interrupting supply of electricity or gas to a site. This includes de-
energisations in electricity and credit locks, disconnected meters and street isolations in gas. This
section analyses disconnections completed for non-payment of account (NPA) purposes only.
The disconnection / de-energisation of a customer’s energy supply due to NPA should always be
the last resort and all suppliers are required to offer a payment plan and/or prepayment solution to
customers in advance of proceeding to disconnect.
The requirement placed on suppliers to offer payment plans and financial hardship meters instead
of disconnecting customers in the first instance has benefited those in financial difficulty. It is likely
that improving economic conditions in recent years has also contributed to a decrease in
disconnections.
The figure below shows that NPA disconnections have fallen over time. There was, however, an
increase in disconnections from 2018 with 5,008 disconnections in electricity and 2,424
disconnections in gas in 2019 compared to 4,829 disconnections in electricity and 1,730
disconnections in gas in 2018. This represents a 4% increase in electricity and 40% increase in
gas. In 2019 0.2% electricity customers and 0.3% of gas customers were disconnected for NPA
reasons. Without a PAYG system in place which provides an option for customers facing difficulty
in paying their electricity and gas bills, disconnections could be significantly higher.
Figure 25: Trend in total (domestic and business) NPA disconnections
The majority of disconnections due to NPA in 2019 were for domestic customers with 4,113
electricity customers disconnected. This was an increase of 8% from 2018 when 3,802 domestic
electricity customers were disconnected. Non-domestic electricity disconnections were 895 in
2019 compared to 1,027 in 2018 representing a 13% decrease.
In 2019, 0.20% of domestic electricity customers were disconnected due to NPA compared to
0.18% in 2018, while 0.31% and 0.37% non-domestic electricity customers were disconnected in
2019 and 2018 respectively.
17,704 17,441
12,391
8,7317,783
6,879
4,627 4,829 5,0084,560
7,559
6,279
3,9993,542
2,7872,152 1,730
2,424
0
2,000
4,000
6,000
8,000
10,000
12,000
14,000
16,000
18,000
20,000
2011 2012 2013 2014 2015 2016 2017 2018 2019
Electricity Disconnections Gas Disconnections
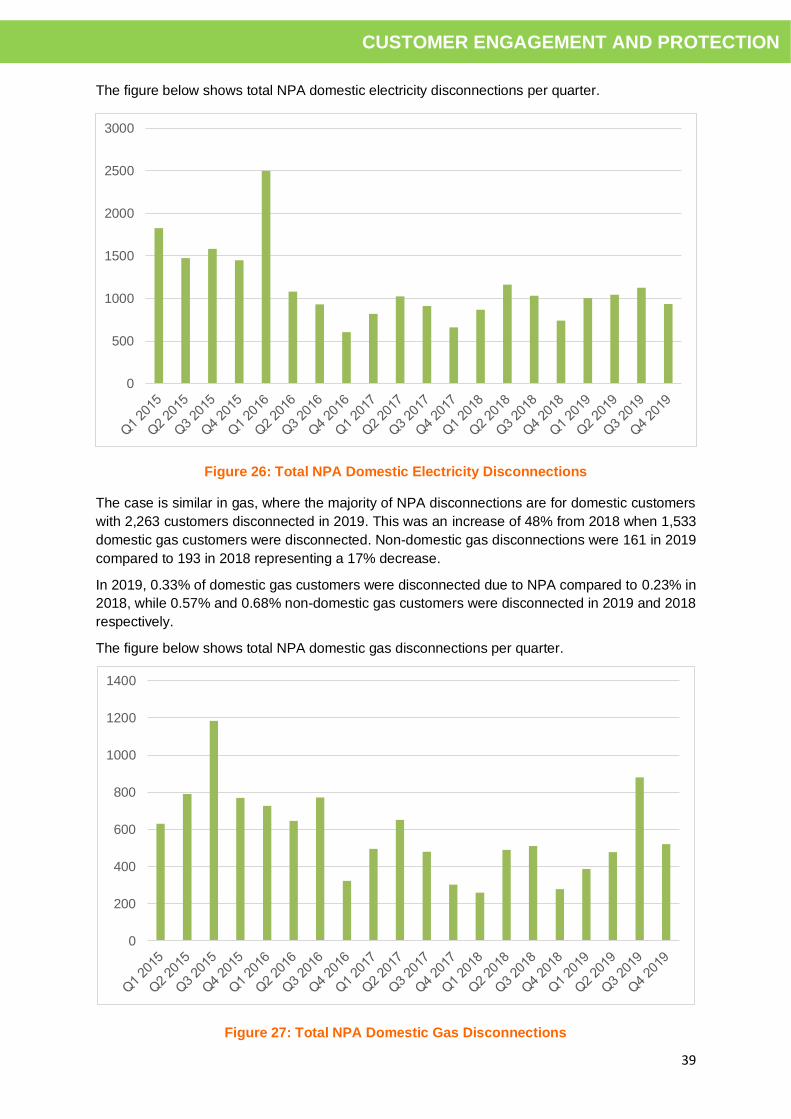
39
CUSTOMER ENGAGEMENT AND PROTECTION
The figure below shows total NPA domestic electricity disconnections per quarter.
Figure 26: Total NPA Domestic Electricity Disconnections
The case is similar in gas, where the majority of NPA disconnections are for domestic customers
with 2,263 customers disconnected in 2019. This was an increase of 48% from 2018 when 1,533
domestic gas customers were disconnected. Non-domestic gas disconnections were 161 in 2019
compared to 193 in 2018 representing a 17% decrease.
In 2019, 0.33% of domestic gas customers were disconnected due to NPA compared to 0.23% in
2018, while 0.57% and 0.68% non-domestic gas customers were disconnected in 2019 and 2018
respectively.
The figure below shows total NPA domestic gas disconnections per quarter.
Figure 27: Total NPA Domestic Gas Disconnections
0
500
1000
1500
2000
2500
3000
0
200
400
600
800
1000
1200
1400

40
CUSTOMER ENGAGEMENT AND PROTECTION
The increase in domestic gas disconnections could be attributed to the fact that there was a lower
number of disconnections than expected in 2018 and a number of disconnections which were
delayed until 2019. The CRU is concerned that there might be a further increase in disconnections
in 2020 due to the COVID-19 health emergency which may have put more customers into financial
difficulty paying their bills. As a result, the CRU has increased its monitoring for this indicator.
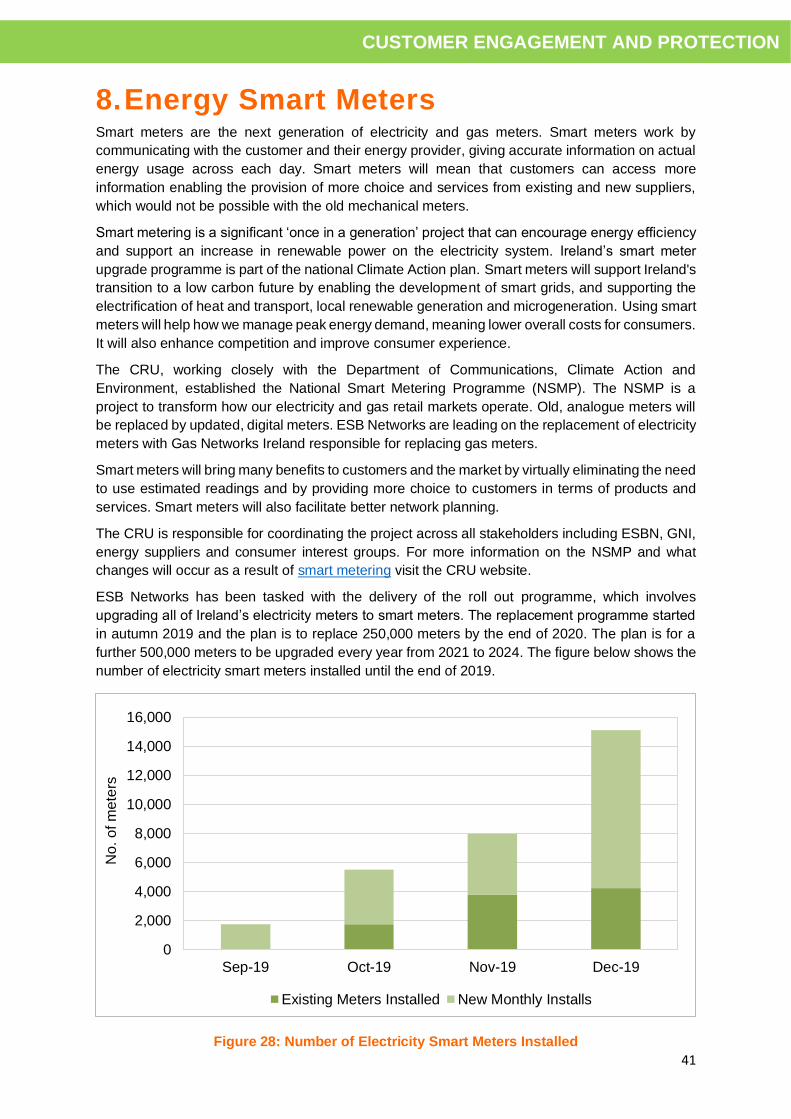
41
CUSTOMER ENGAGEMENT AND PROTECTION
8. Energy Smart Meters Smart meters are the next generation of electricity and gas meters. Smart meters work by
communicating with the customer and their energy provider, giving accurate information on actual
energy usage across each day. Smart meters will mean that customers can access more
information enabling the provision of more choice and services from existing and new suppliers,
which would not be possible with the old mechanical meters.
Smart metering is a significant ‘once in a generation’ project that can encourage energy efficiency
and support an increase in renewable power on the electricity system. Ireland’s smart meter
upgrade programme is part of the national Climate Action plan. Smart meters will support Ireland's
transition to a low carbon future by enabling the development of smart grids, and supporting the
electrification of heat and transport, local renewable generation and microgeneration. Using smart
meters will help how we manage peak energy demand, meaning lower overall costs for consumers.
It will also enhance competition and improve consumer experience.
The CRU, working closely with the Department of Communications, Climate Action and
Environment, established the National Smart Metering Programme (NSMP). The NSMP is a
project to transform how our electricity and gas retail markets operate. Old, analogue meters will
be replaced by updated, digital meters. ESB Networks are leading on the replacement of electricity
meters with Gas Networks Ireland responsible for replacing gas meters.
Smart meters will bring many benefits to customers and the market by virtually eliminating the need
to use estimated readings and by providing more choice to customers in terms of products and
services. Smart meters will also facilitate better network planning.
The CRU is responsible for coordinating the project across all stakeholders including ESBN, GNI,
energy suppliers and consumer interest groups. For more information on the NSMP and what
changes will occur as a result of smart metering visit the CRU website.
ESB Networks has been tasked with the delivery of the roll out programme, which involves
upgrading all of Ireland’s electricity meters to smart meters. The replacement programme started
in autumn 2019 and the plan is to replace 250,000 meters by the end of 2020. The plan is for a
further 500,000 meters to be upgraded every year from 2021 to 2024. The figure below shows the
number of electricity smart meters installed until the end of 2019.
Figure 28: Number of Electricity Smart Meters Installed
0
2,000
4,000
6,000
8,000
10,000
12,000
14,000
16,000
Sep-19 Oct-19 Nov-19 Dec-19
No
. o
f m
ete
rs
Existing Meters Installed New Monthly Installs

42
ENERGY PRICES
ENERGY PRICES
Summary of Section
• On average the wholesale price of gas was 41% lower in 2019 compared to 2018, with most of this increase occurring during the first half of the year.
• On average the wholesale price of electricity was 21% lower in 2019 compared to 2018, with most of this increase occurring during the first half of the year.
• Three suppliers announced price increases in the first half of 2019, based on increased wholesale costs incurred in previous periods. At the end of Q3 2019, one supplier announced a second price change within the year, which involved a price increase in electricity and a price decrease in gas.
• Estimated annual bills (EABs) across suppliers’ standard plans increased from 2018 by an average of 2.4% in electricity and 1.5% in gas in 2019, while EABs across suppliers’ best discounted plans decreased by an average of 4.6% in electricity and 3.9% in gas6.
• At the end of 2019, Iberdrola offered the cheapest available standard electricity plan with an EAB of €9437. Energia offered the cheapest available discount plan for electricity with an EAB of €830.
• At the end of 2019, Iberdrola offered the cheapest available standard plan for gas with an EAB of €796. Flogas offered the cheapest available discount plan for gas with an EAB of €671.
• At the end of 2019, Energia offered the cheapest available dual fuel plan with an EAB of €1,495.
• Comparing Ireland’s energy prices to other European countries, in semester 1 of 2019 (January - June 2019), the average price in Ireland for domestic electricity consumption band DC was 7% above the Euro Area average. For domestic electricity consumption band DD, Ireland was 2% below the Euro Area average. The average price in consumption band DC decreased from semester 2 2018 to semester 1 2019 by 4.6% and the average price in consumption band DD decreased by 4.4%.
• The average price for the main domestic gas consumption band (D2) in Ireland was 4% below the Euro Area average. The average price in consumption band D2 decreased from semester 2 2018 to semester 1 2019 by 10.2%.
9. Retail Energy Prices The retail electricity and gas markets in Ireland are fully price deregulated, therefore the CRU no
longer regulates the final electricity or gas prices in the domestic or business markets, but it does
monitor supplier prices. The retail energy markets are competitive markets which allow suppliers
to develop their individual strategies, including the setting of prices to customers.
9.1 Calculation of Estimated Annual Bills
In order for a domestic customer to accurately compare prices between suppliers, the comparison
of the Estimated Annual Bill (EAB), using current typical consumption values (4,200 kWh for
electricity and 11,000 kWh for gas) across suppliers is the best measure, unless a customer knows
their actual usage for the previous year and can estimate their usage for the coming year.
6 Just Energy is not included in the calculations as it left the market at the end of 2019. 7 All figures for domestic energy retail bills are inclusive of VAT.
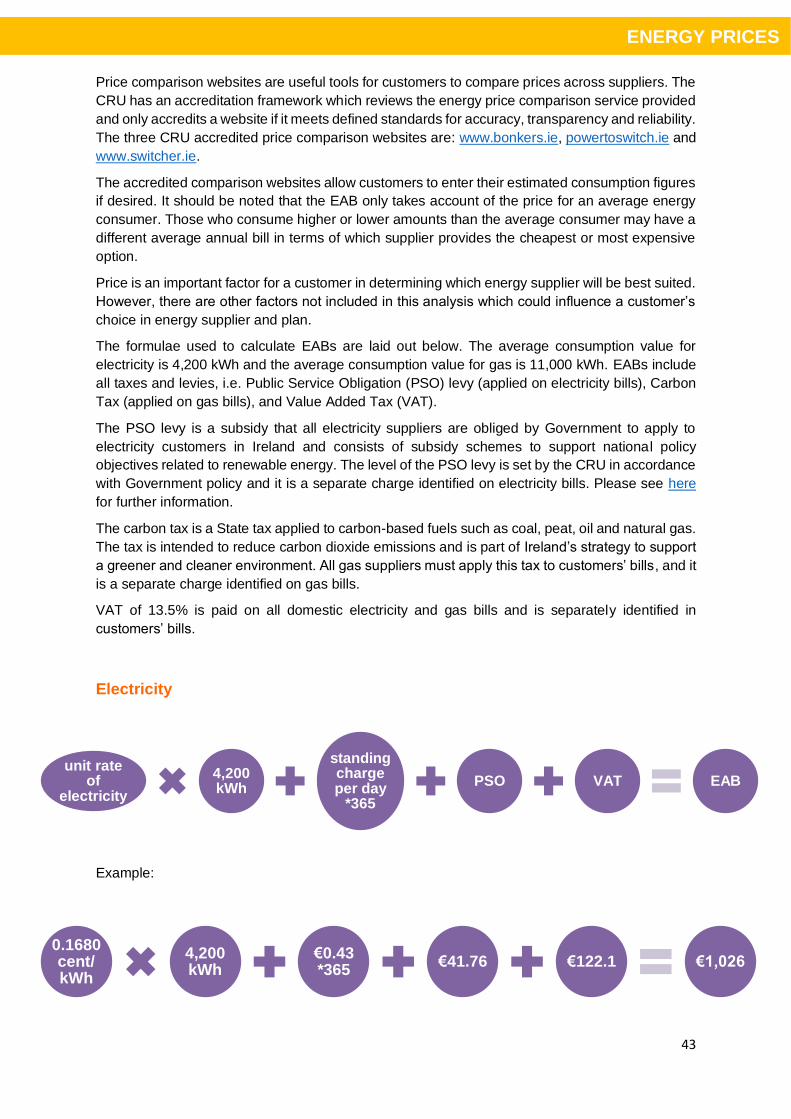
43
ENERGY PRICES
Price comparison websites are useful tools for customers to compare prices across suppliers. The
CRU has an accreditation framework which reviews the energy price comparison service provided
and only accredits a website if it meets defined standards for accuracy, transparency and reliability.
The three CRU accredited price comparison websites are: www.bonkers.ie, powertoswitch.ie and
www.switcher.ie.
The accredited comparison websites allow customers to enter their estimated consumption figures
if desired. It should be noted that the EAB only takes account of the price for an average energy
consumer. Those who consume higher or lower amounts than the average consumer may have a
different average annual bill in terms of which supplier provides the cheapest or most expensive
option.
Price is an important factor for a customer in determining which energy supplier will be best suited.
However, there are other factors not included in this analysis which could influence a customer’s
choice in energy supplier and plan.
The formulae used to calculate EABs are laid out below. The average consumption value for
electricity is 4,200 kWh and the average consumption value for gas is 11,000 kWh. EABs include
all taxes and levies, i.e. Public Service Obligation (PSO) levy (applied on electricity bills), Carbon
Tax (applied on gas bills), and Value Added Tax (VAT).
The PSO levy is a subsidy that all electricity suppliers are obliged by Government to apply to
electricity customers in Ireland and consists of subsidy schemes to support national policy
objectives related to renewable energy. The level of the PSO levy is set by the CRU in accordance
with Government policy and it is a separate charge identified on electricity bills. Please see here
for further information.
The carbon tax is a State tax applied to carbon-based fuels such as coal, peat, oil and natural gas.
The tax is intended to reduce carbon dioxide emissions and is part of Ireland’s strategy to support
a greener and cleaner environment. All gas suppliers must apply this tax to customers’ bills, and it
is a separate charge identified on gas bills.
VAT of 13.5% is paid on all domestic electricity and gas bills and is separately identified in
customers’ bills.
Electricity
Example:
unit rate of
electricity
4,200 kWh
standing charge per day
*365
PSO VAT EAB
0.1680 cent/ kWh
4,200 kWh
€0.43 *365
€41.76 €122.1 €1,026
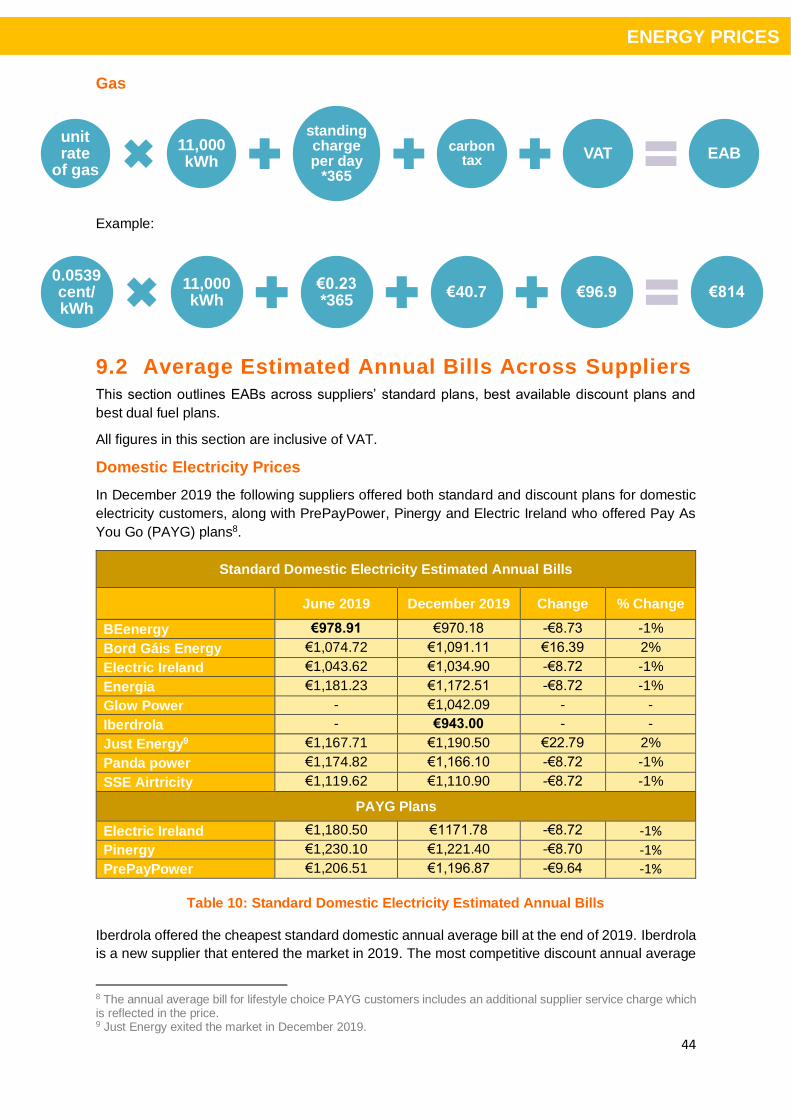
44
ENERGY PRICES
Gas
Example:
9.2 Average Estimated Annual Bills Across Suppliers
This section outlines EABs across suppliers’ standard plans, best available discount plans and
best dual fuel plans.
All figures in this section are inclusive of VAT.
Domestic Electricity Prices
In December 2019 the following suppliers offered both standard and discount plans for domestic
electricity customers, along with PrePayPower, Pinergy and Electric Ireland who offered Pay As
You Go (PAYG) plans8.
Standard Domestic Electricity Estimated Annual Bills
June 2019 December 2019 Change % Change
BEenergy €978.91 €970.18 -€8.73 -1%
Bord Gáis Energy €1,074.72 €1,091.11 €16.39 2%
Electric Ireland €1,043.62 €1,034.90 -€8.72 -1%
Energia €1,181.23 €1,172.51 -€8.72 -1%
Glow Power - €1,042.09 - -
Iberdrola - €943.00 - -
Just Energy9 €1,167.71 €1,190.50 €22.79 2%
Panda power €1,174.82 €1,166.10 -€8.72 -1%
SSE Airtricity €1,119.62 €1,110.90 -€8.72 -1%
PAYG Plans
Electric Ireland €1,180.50 €1171.78 -€8.72 -1%
Pinergy €1,230.10 €1,221.40 -€8.70 -1%
PrePayPower €1,206.51 €1,196.87 -€9.64 -1%
Table 10: Standard Domestic Electricity Estimated Annual Bills
Iberdrola offered the cheapest standard domestic annual average bill at the end of 2019. Iberdrola
is a new supplier that entered the market in 2019. The most competitive discount annual average
8 The annual average bill for lifestyle choice PAYG customers includes an additional supplier service charge which is reflected in the price. 9 Just Energy exited the market in December 2019.
unit rate
of gas
11,000 kWh
standing charge per day
*365
carbon tax VAT EAB
0.0539 cent/ kWh
11,000 kWh
€0.23 *365
€40.7 €96.9 €814

45
ENERGY PRICES
bill at the end of 2019 was offered by Energia. The average annual bill for domestic electricity
decreased across most suppliers from June 2019 to December 2019 for standard and the most
competitive discount plans, apart from the plans of Bord Gais Energy and Just Energy that
increased their prices during the period.
From June 2019 to December 2019, the average annual bill for both the standard domestic
electricity and the most competitive discount electricity offerings ranged across suppliers with a
decrease of 5% to an increase of 25%. The percentage decrease in the EABs between June 2019
and December 2019 reflects the reduction in the PSO levy in October 2019.
Most Competitive Discount Domestic Electricity Estimated Annual Bills
June 2019 December 2019 Change % Change
BEenergy €865.51 €856.86 -€8.65 -1%
Bord Gáis Energy €894.12 €853.44 -€40.68 -5%
Electric Ireland €846.12 €837.40 -€8.72 -1%
Energia €839.01 €830.29 -€8.72 -1%
Glow Power - €846.50 - -
Iberdrola - €851.47 - -
Just Energy €950.11 €1,190.50 €240.39 25%
Panda power €937.57 €928.85 -€8.72 -1%
SSE Airtricity €914.64 €879.22 -€35.42 -4%
Table 11: Most Competitive Discount Domestic Electricity Estimated Annual10
Domestic Gas Prices
In December 2019 the following suppliers offered standard and discounted plans for domestic gas
customers. Flogas, Electric Ireland, BGE and PrePayPower also offered PAYG plans11.
Standard Domestic Gas Estimated Annual Bills
June 2019 December 2019 Change % Change
Bord Gáis Energy €837.18 €804.89 -€32.29 -4%
Electric Ireland €819.92 €819.92 €0.00 0%
Energia €937.03 €937.03 €0.00 0%
Flogas €941.75 €941.75 €0.00 0%
Iberdrola - €796.21 - -
Just Energy €948.84 €948.84 €0.00 0%
Panda Power €895.40 €895.40 €0.00 0%
SSE Airtricity €880.91 €880.91 €0.00 0%
PAYG Plans
Bord Gáis Energy €937.18 €805.04 -€132.14 -14%
Electric Ireland €820.19 €819.92 -€0.27 0%
Flogas €942.04 €942.04 €0.00 0%
PrePayPower €901.56 €900.82 -€0.74 0%
Table 12: Standard Domestic Gas Estimated Annual Bills
10 It should be noted that some discounted plans offered by suppliers (including some of the best discounted plans presented here) are only available to new customers. 11 Note that some gas suppliers charge an installation fee for PAYG gas meters which is not included here.
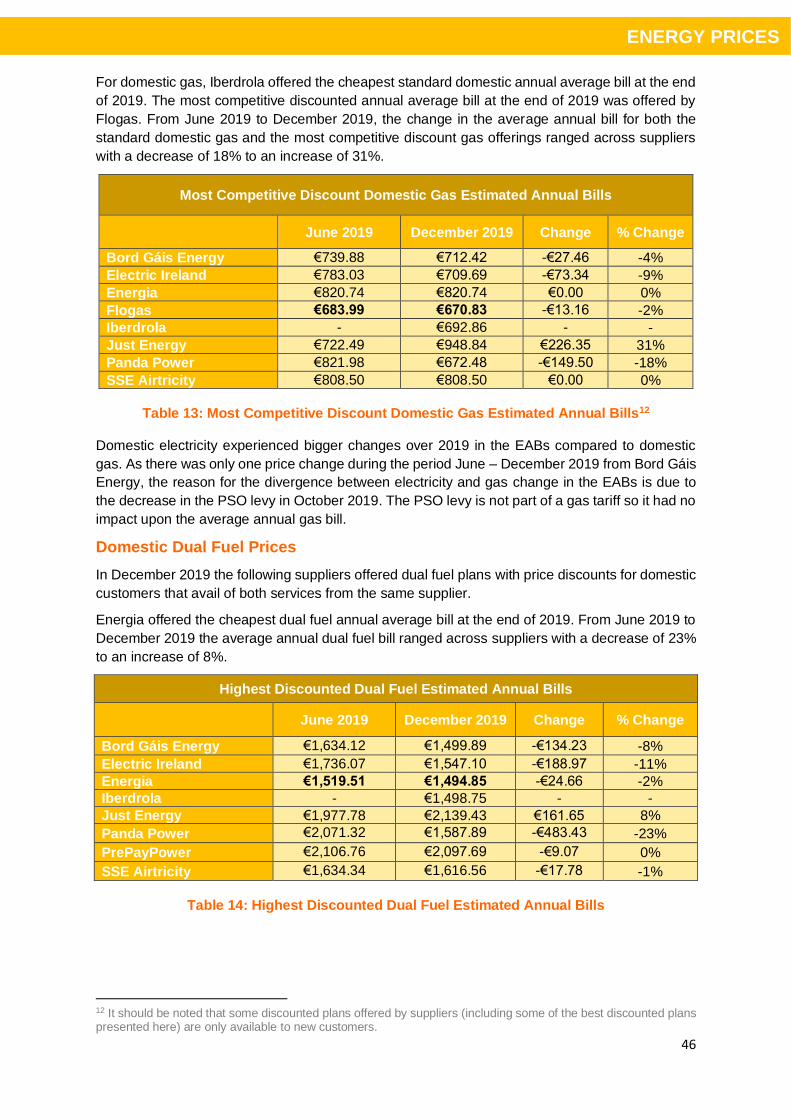
46
ENERGY PRICES
For domestic gas, Iberdrola offered the cheapest standard domestic annual average bill at the end
of 2019. The most competitive discounted annual average bill at the end of 2019 was offered by
Flogas. From June 2019 to December 2019, the change in the average annual bill for both the
standard domestic gas and the most competitive discount gas offerings ranged across suppliers
with a decrease of 18% to an increase of 31%.
Most Competitive Discount Domestic Gas Estimated Annual Bills
June 2019 December 2019 Change % Change
Bord Gáis Energy €739.88 €712.42 -€27.46 -4%
Electric Ireland €783.03 €709.69 -€73.34 -9%
Energia €820.74 €820.74 €0.00 0%
Flogas €683.99 €670.83 -€13.16 -2%
Iberdrola - €692.86 - -
Just Energy €722.49 €948.84 €226.35 31%
Panda Power €821.98 €672.48 -€149.50 -18%
SSE Airtricity €808.50 €808.50 €0.00 0%
Table 13: Most Competitive Discount Domestic Gas Estimated Annual Bills12
Domestic electricity experienced bigger changes over 2019 in the EABs compared to domestic
gas. As there was only one price change during the period June – December 2019 from Bord Gáis
Energy, the reason for the divergence between electricity and gas change in the EABs is due to
the decrease in the PSO levy in October 2019. The PSO levy is not part of a gas tariff so it had no
impact upon the average annual gas bill.
Domestic Dual Fuel Prices
In December 2019 the following suppliers offered dual fuel plans with price discounts for domestic
customers that avail of both services from the same supplier.
Energia offered the cheapest dual fuel annual average bill at the end of 2019. From June 2019 to
December 2019 the average annual dual fuel bill ranged across suppliers with a decrease of 23%
to an increase of 8%.
Highest Discounted Dual Fuel Estimated Annual Bills
June 2019 December 2019 Change % Change
Bord Gáis Energy €1,634.12 €1,499.89 -€134.23 -8%
Electric Ireland €1,736.07 €1,547.10 -€188.97 -11%
Energia €1,519.51 €1,494.85 -€24.66 -2%
Iberdrola - €1,498.75 - -
Just Energy €1,977.78 €2,139.43 €161.65 8%
Panda Power €2,071.32 €1,587.89 -€483.43 -23%
PrePayPower €2,106.76 €2,097.69 -€9.07 0%
SSE Airtricity €1,634.34 €1,616.56 -€17.78 -1%
Table 14: Highest Discounted Dual Fuel Estimated Annual Bills
12 It should be noted that some discounted plans offered by suppliers (including some of the best discounted plans presented here) are only available to new customers.

47
ENERGY PRICES
9.3 Estimated Annual Bills Over Time
Three suppliers announced price increases in the first half of 2019, based on increased wholesale
costs incurred in previous periods. At the end of Q3 2019, one supplier, Bord Gáis Energy,
announced a second price change within the year, which involved a price increase in electricity
and a price decrease in gas. This gas price decrease marked the first decrease resulting from
decreasing wholesale gas costs since the beginning of the year. During the first half of 2020 a
number of suppliers - Electric Ireland, PrePay Power, Bord Gáis Energy, SSE Airtricity, Pinergy
and Energia - announced price decreases in their electricity and gas prices resulting from
decreasing wholesale costs in previous months. These price decreases will be reflected in the
EABs included in our next report which will cover the first half of 2020.
The figures below show EABs across suppliers’ standard plans, best available discount plans and
best dual fuel plans in electricity and gas over the last three years.
Figure 29: Standard Domestic Electricity Estimated Annual Bills per Supplier
At the end of 2019, the cheapest standard electricity plan was offered by Iberdrola and the most
expensive by Energia, while in gas the cheapest standard plan was offered by Iberdrola and the
most expensive by Flogas.
Figure 30: Standard Domestic Gas Estimated Annual Bills per Supplier
€ 900
€ 950
€ 1,000
€ 1,050
€ 1,100
€ 1,150
€ 1,200
Dec-16 Jun-17 Dec-17 Jun-18 Dec-18 Jun-19 Dec-19
Energia
Panda Power
SSE Airtricity
BGE
Electric Ireland
Beenergy
Iberdrola
€ 650
€ 700
€ 750
€ 800
€ 850
€ 900
€ 950
Dec-16 Jun-17 Dec-17 Jun-18 Dec-18 Jun-19 Dec-19
Flogas
Energia
Panda Power
SSE Airtricity
Electric Ireland
BGE
Iberdrola
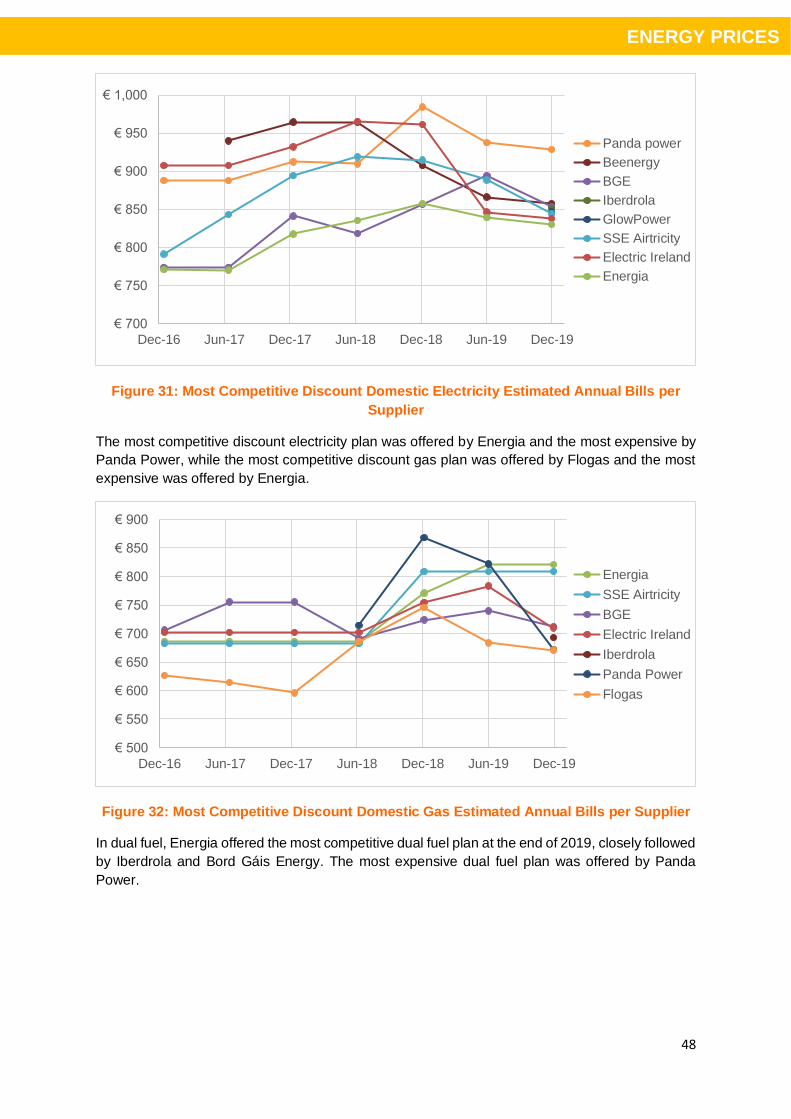
48
ENERGY PRICES
Figure 31: Most Competitive Discount Domestic Electricity Estimated Annual Bills per
Supplier
The most competitive discount electricity plan was offered by Energia and the most expensive by
Panda Power, while the most competitive discount gas plan was offered by Flogas and the most
expensive was offered by Energia.
Figure 32: Most Competitive Discount Domestic Gas Estimated Annual Bills per Supplier
In dual fuel, Energia offered the most competitive dual fuel plan at the end of 2019, closely followed
by Iberdrola and Bord Gáis Energy. The most expensive dual fuel plan was offered by Panda
Power.
€ 700
€ 750
€ 800
€ 850
€ 900
€ 950
€ 1,000
Dec-16 Jun-17 Dec-17 Jun-18 Dec-18 Jun-19 Dec-19
Panda power
Beenergy
BGE
Iberdrola
GlowPower
SSE Airtricity
Electric Ireland
Energia
€ 500
€ 550
€ 600
€ 650
€ 700
€ 750
€ 800
€ 850
€ 900
Dec-16 Jun-17 Dec-17 Jun-18 Dec-18 Jun-19 Dec-19
Energia
SSE Airtricity
BGE
Electric Ireland
Iberdrola
Panda Power
Flogas
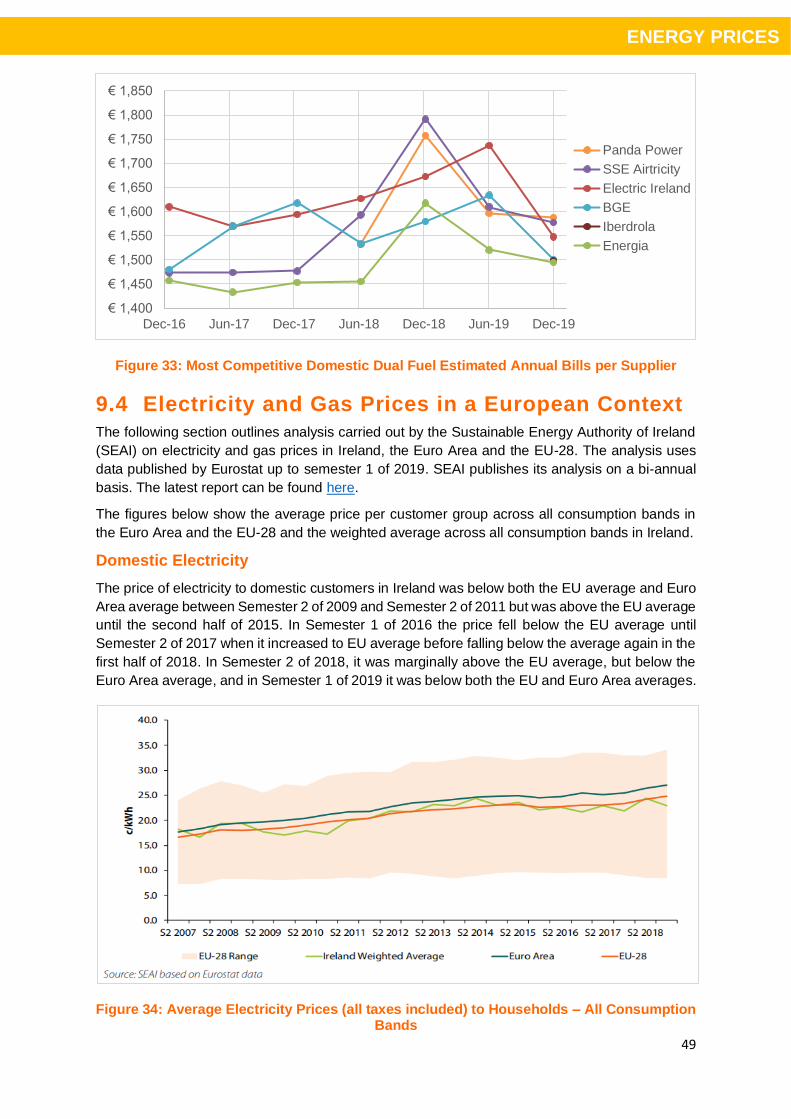
49
ENERGY PRICES
Figure 33: Most Competitive Domestic Dual Fuel Estimated Annual Bills per Supplier
9.4 Electricity and Gas Prices in a European Context
The following section outlines analysis carried out by the Sustainable Energy Authority of Ireland
(SEAI) on electricity and gas prices in Ireland, the Euro Area and the EU-28. The analysis uses
data published by Eurostat up to semester 1 of 2019. SEAI publishes its analysis on a bi-annual
basis. The latest report can be found here.
The figures below show the average price per customer group across all consumption bands in
the Euro Area and the EU-28 and the weighted average across all consumption bands in Ireland.
Domestic Electricity
The price of electricity to domestic customers in Ireland was below both the EU average and Euro
Area average between Semester 2 of 2009 and Semester 2 of 2011 but was above the EU average
until the second half of 2015. In Semester 1 of 2016 the price fell below the EU average until
Semester 2 of 2017 when it increased to EU average before falling below the average again in the
first half of 2018. In Semester 2 of 2018, it was marginally above the EU average, but below the
Euro Area average, and in Semester 1 of 2019 it was below both the EU and Euro Area averages.
Figure 34: Average Electricity Prices (all taxes included) to Households – All Consumption Bands
€ 1,400
€ 1,450
€ 1,500
€ 1,550
€ 1,600
€ 1,650
€ 1,700
€ 1,750
€ 1,800
€ 1,850
Dec-16 Jun-17 Dec-17 Jun-18 Dec-18 Jun-19 Dec-19
Panda Power
SSE Airtricity
Electric Ireland
BGE
Iberdrola
Energia
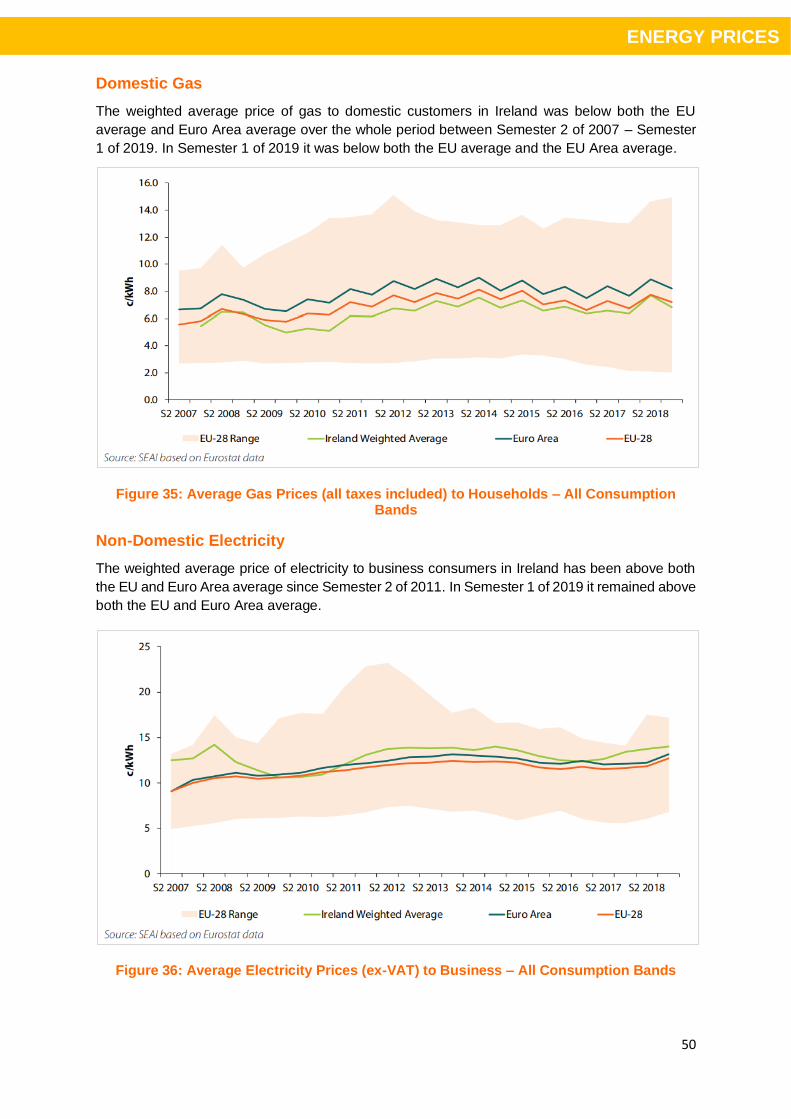
50
ENERGY PRICES
Domestic Gas
The weighted average price of gas to domestic customers in Ireland was below both the EU
average and Euro Area average over the whole period between Semester 2 of 2007 – Semester
1 of 2019. In Semester 1 of 2019 it was below both the EU average and the EU Area average.
Figure 35: Average Gas Prices (all taxes included) to Households – All Consumption Bands
Non-Domestic Electricity
The weighted average price of electricity to business consumers in Ireland has been above both
the EU and Euro Area average since Semester 2 of 2011. In Semester 1 of 2019 it remained above
both the EU and Euro Area average.
Figure 36: Average Electricity Prices (ex-VAT) to Business – All Consumption Bands

51
ENERGY PRICES
Non-Domestic Gas
The weighted average price of gas to business consumers in Ireland was below both the EU and
Euro Area average between Semester 2 of 2009 and Semester 2 of 2013. Since 2013 this has
fluctuated between the EU and Euro area average. Since Semester 2 of 2015, Irish business gas
prices have fluctuated around the EU and Euro area averages. In Semester 1 of 2019 it was below
both the EU average and Euro Area average.
Figure 37: Average Gas Prices (ex-Vat) to Business – All Consumption Bands

52
ENERGY PRICES
10. Wholesale Energy Prices One of the primary components of final retail energy prices is the cost of wholesale energy. As the
Irish electricity fuel mix is highly dependent on gas, the wholesale gas price is a major factor in
determining final retail electricity prices. The cost of wholesale gas also makes up a considerable
percentage of the final retail gas price.
10.1 Wholesale Gas Prices
The wholesale price of gas in Ireland is set by reference to the wholesale price at the trading hub
in Britain, the National Balancing Point (NBP) plus the cost of transport to Ireland via the
interconnectors.
As gas is sold for delivery at different times, suppliers develop hedging strategies which aim to
smooth the impact of buying gas at different prices and allow price stability for customers. This can
include Month Ahead, Day Ahead and Within Day wholesale gas products. Wholesale gas prices
are set in Sterling and gas at the NBP is sold in pence/therm. Therefore, Euro/Sterling currency
fluctuations influence wholesale gas prices in Euro in Ireland.
The figure below shows the change in average monthly day ahead gas prices over time at the
NBP. It also shows the average price across each year between 2012 and 2019.
Figure 38: NBP Day Ahead Gas, €/therm, 2012 – 2019
On average, the day ahead price declined from 2014 to 2016 but increased in 2017 and further in
2018, before falling again in 2019. In 2019 the average day ahead price for gas was 0.40 €/therm,
compared to 0.68 €/therm in 2018 and 0.51 €/therm in 2017. The average price of gas for 2019
was 41% lower than the average price for 2018.
10.2 Wholesale Electricity Prices
The wholesale electricity market on the island of Ireland is jointly regulated by the CRU and the
Utility Regulator (UR) and is known as the Single Electricity Market (SEM). New market
€ -
€ 0.10
€ 0.20
€ 0.30
€ 0.40
€ 0.50
€ 0.60
€ 0.70
€ 0.80
€ 0.90
€ 1.00
€ 1.10
Jan-1
2
May-1
2
Sep-1
2
Jan-1
3
May-1
3
Sep-1
3
Jan-1
4
May-1
4
Sep-1
4
Jan-1
5
May-1
5
Sep-1
5
Jan-1
6
May-1
6
Sep-1
6
Jan-1
7
May-1
7
Sep-1
7
Jan-1
8
May-1
8
Sep-1
8
Jan-1
9
May-1
9
Sep-1
9
Euro
/therm
NBP DA 2012 2013 2014 2015
2016 2017 2018 2019
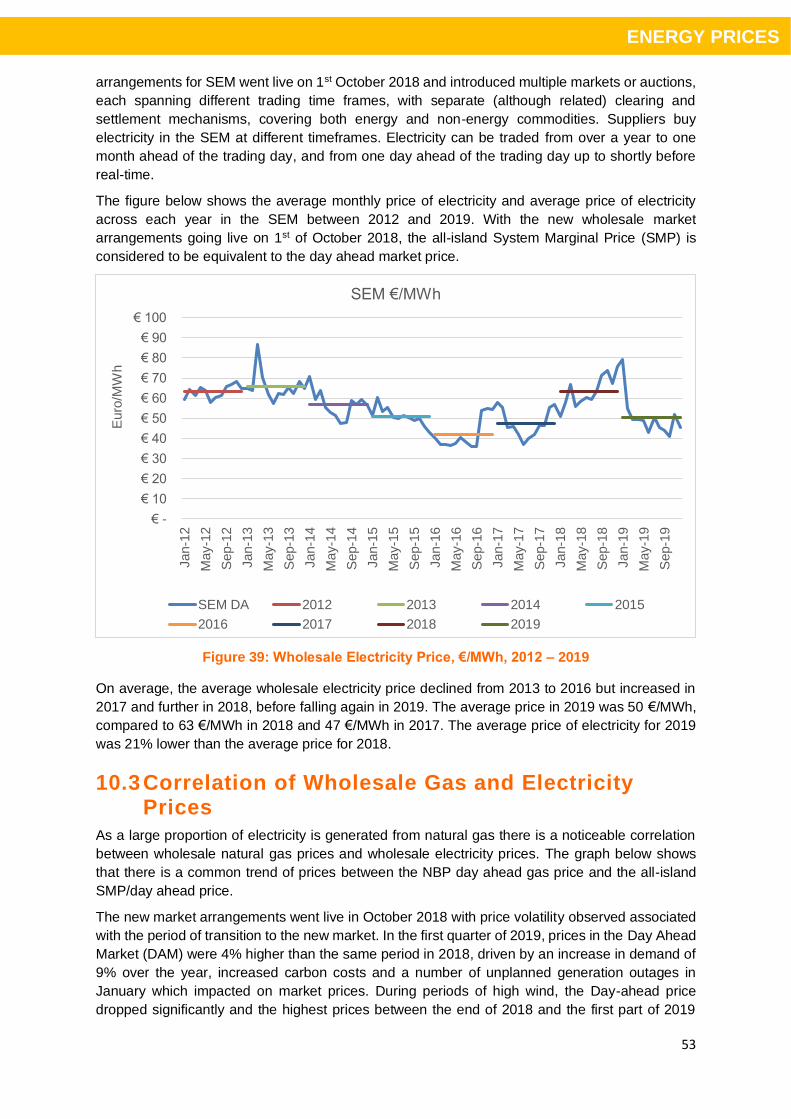
53
ENERGY PRICES
arrangements for SEM went live on 1st October 2018 and introduced multiple markets or auctions,
each spanning different trading time frames, with separate (although related) clearing and
settlement mechanisms, covering both energy and non-energy commodities. Suppliers buy
electricity in the SEM at different timeframes. Electricity can be traded from over a year to one
month ahead of the trading day, and from one day ahead of the trading day up to shortly before
real-time.
The figure below shows the average monthly price of electricity and average price of electricity
across each year in the SEM between 2012 and 2019. With the new wholesale market
arrangements going live on 1st of October 2018, the all-island System Marginal Price (SMP) is
considered to be equivalent to the day ahead market price.
Figure 39: Wholesale Electricity Price, €/MWh, 2012 – 2019
On average, the average wholesale electricity price declined from 2013 to 2016 but increased in
2017 and further in 2018, before falling again in 2019. The average price in 2019 was 50 €/MWh,
compared to 63 €/MWh in 2018 and 47 €/MWh in 2017. The average price of electricity for 2019
was 21% lower than the average price for 2018.
10.3 Correlation of Wholesale Gas and Electricity Prices
As a large proportion of electricity is generated from natural gas there is a noticeable correlation
between wholesale natural gas prices and wholesale electricity prices. The graph below shows
that there is a common trend of prices between the NBP day ahead gas price and the all-island
SMP/day ahead price.
The new market arrangements went live in October 2018 with price volatility observed associated
with the period of transition to the new market. In the first quarter of 2019, prices in the Day Ahead
Market (DAM) were 4% higher than the same period in 2018, driven by an increase in demand of
9% over the year, increased carbon costs and a number of unplanned generation outages in
January which impacted on market prices. During periods of high wind, the Day-ahead price
dropped significantly and the highest prices between the end of 2018 and the first part of 2019
€ -
€ 10
€ 20
€ 30
€ 40
€ 50
€ 60
€ 70
€ 80
€ 90
€ 100
Jan-1
2
May-1
2
Sep-1
2
Jan-1
3
May-1
3
Sep-1
3
Jan-1
4
May-1
4
Sep-1
4
Jan-1
5
May-1
5
Sep-1
5
Jan-1
6
May-1
6
Sep-1
6
Jan-1
7
May-1
7
Sep-1
7
Jan-1
8
May-1
8
Sep-1
8
Jan-1
9
May-1
9
Sep-1
9
Euro
/MW
h
SEM €/MWh
SEM DA 2012 2013 2014 2015
2016 2017 2018 2019
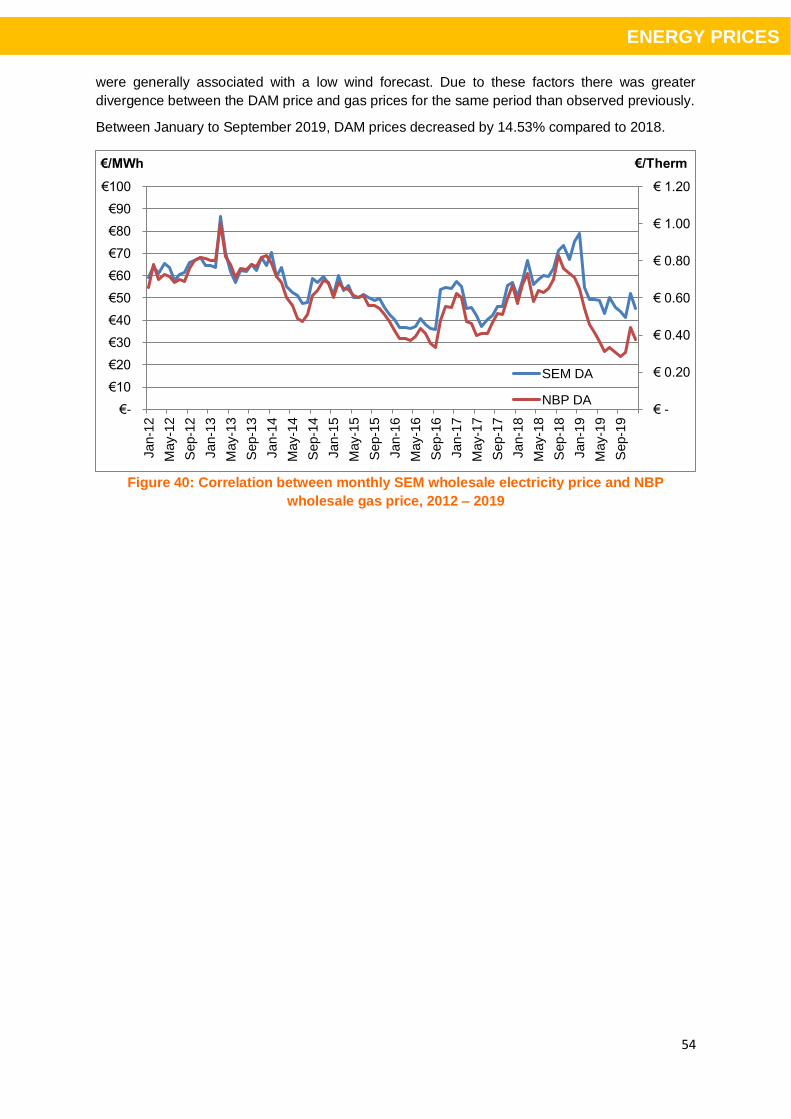
54
ENERGY PRICES
were generally associated with a low wind forecast. Due to these factors there was greater
divergence between the DAM price and gas prices for the same period than observed previously.
Between January to September 2019, DAM prices decreased by 14.53% compared to 2018.
Figure 40: Correlation between monthly SEM wholesale electricity price and NBP
wholesale gas price, 2012 – 2019
€ -
€ 0.20
€ 0.40
€ 0.60
€ 0.80
€ 1.00
€ 1.20
€-
€10
€20
€30
€40
€50
€60
€70
€80
€90
€100
Jan-1
2
May-1
2
Sep-1
2
Jan-1
3
May-1
3
Sep-1
3
Jan-1
4
May-1
4
Sep-1
4
Jan-1
5
May-1
5
Sep-1
5
Jan-1
6
May-1
6
Sep-1
6
Jan-1
7
May-1
7
Sep-1
7
Jan-1
8
May-1
8
Sep-1
8
Jan-1
9
May-1
9
Sep-1
9
€/Therm€/MWh
SEM DA
NBP DA
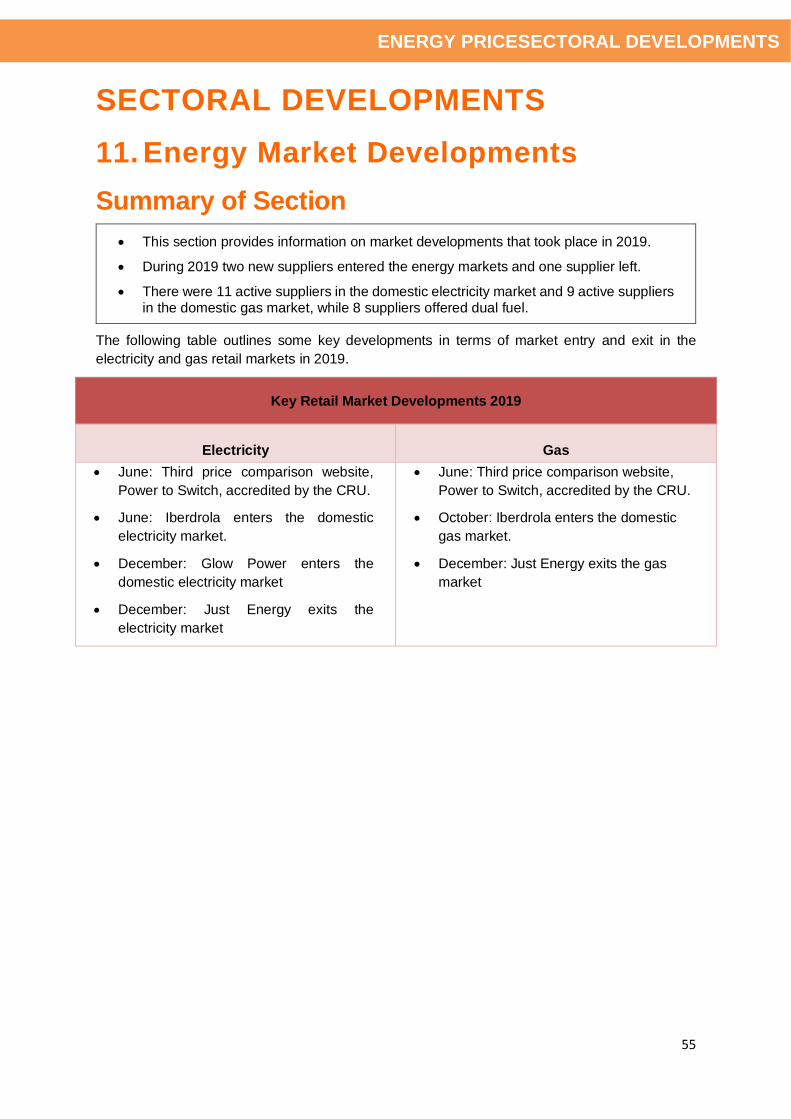
55
ENERGY PRICESECTORAL DEVELOPMENTS
SECTORAL DEVELOPMENTS
11. Energy Market Developments
Summary of Section
• This section provides information on market developments that took place in 2019.
• During 2019 two new suppliers entered the energy markets and one supplier left.
• There were 11 active suppliers in the domestic electricity market and 9 active suppliers in the domestic gas market, while 8 suppliers offered dual fuel.
The following table outlines some key developments in terms of market entry and exit in the
electricity and gas retail markets in 2019.
Key Retail Market Developments 2019
Electricity Gas
• June: Third price comparison website,
Power to Switch, accredited by the CRU.
• June: Iberdrola enters the domestic
electricity market.
• December: Glow Power enters the
domestic electricity market
• December: Just Energy exits the
electricity market
• June: Third price comparison website,
Power to Switch, accredited by the CRU.
• October: Iberdrola enters the domestic
gas market.
• December: Just Energy exits the gas
market
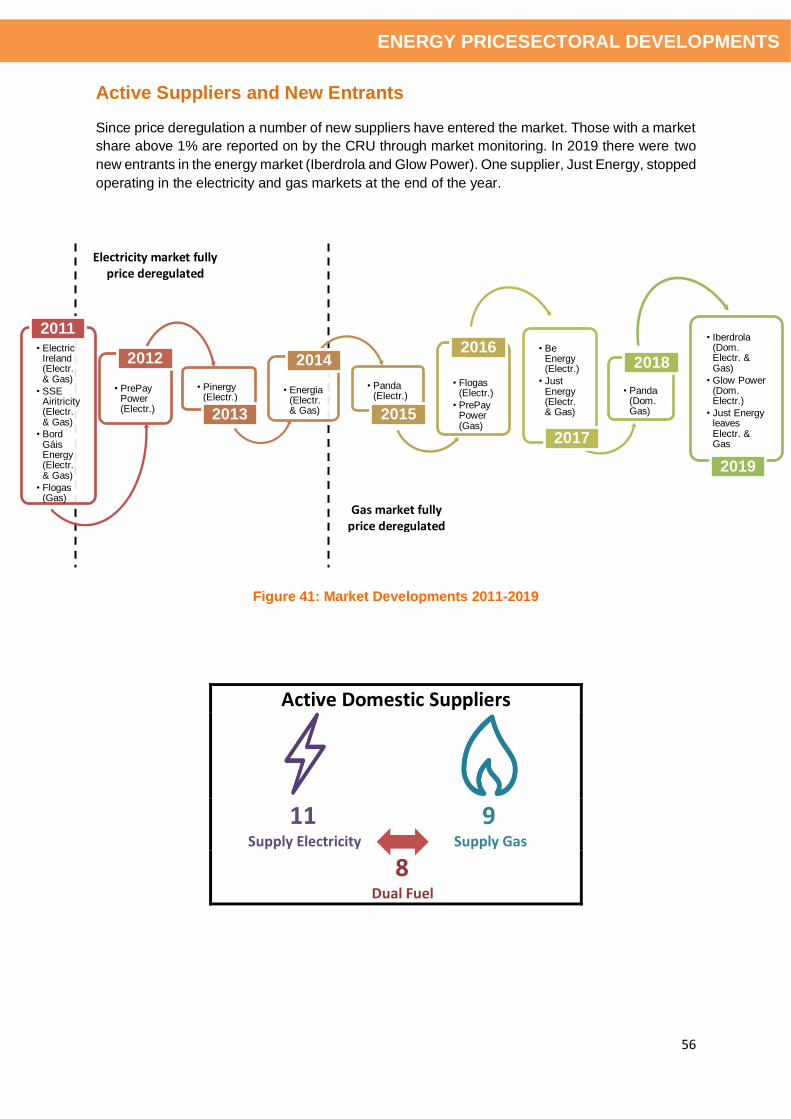
56
ENERGY PRICESECTORAL DEVELOPMENTS
Active Suppliers and New Entrants
Since price deregulation a number of new suppliers have entered the market. Those with a market
share above 1% are reported on by the CRU through market monitoring. In 2019 there were two
new entrants in the energy market (Iberdrola and Glow Power). One supplier, Just Energy, stopped
operating in the electricity and gas markets at the end of the year.
Figure 41: Market Developments 2011-2019
Active Domestic Suppliers
11 Supply Electricity
9 Supply Gas
8 Dual Fuel
• Electric Ireland (Electr. & Gas)
• SSE Airitricity (Electr. & Gas)
• Bord Gáis Energy (Electr. & Gas)
• Flogas (Gas)
2011
• PrePayPower (Electr.)
2012
• Pinergy (Electr.)
2013
• Energia (Electr. & Gas)
2014
• Panda (Electr.)
2015
• Flogas (Electr.)
• PrePayPower (Gas)
2016 • Be Energy (Electr.)
• Just Energy (Electr. & Gas)
2017
• Panda (Dom. Gas)
2018
• Iberdrola (Dom. Electr. & Gas)
• Glow Power (Dom. Electr.)
• Just Energy leaves Electr. & Gas
2019
Gas market fully price deregulated
Electricity market fully price deregulated
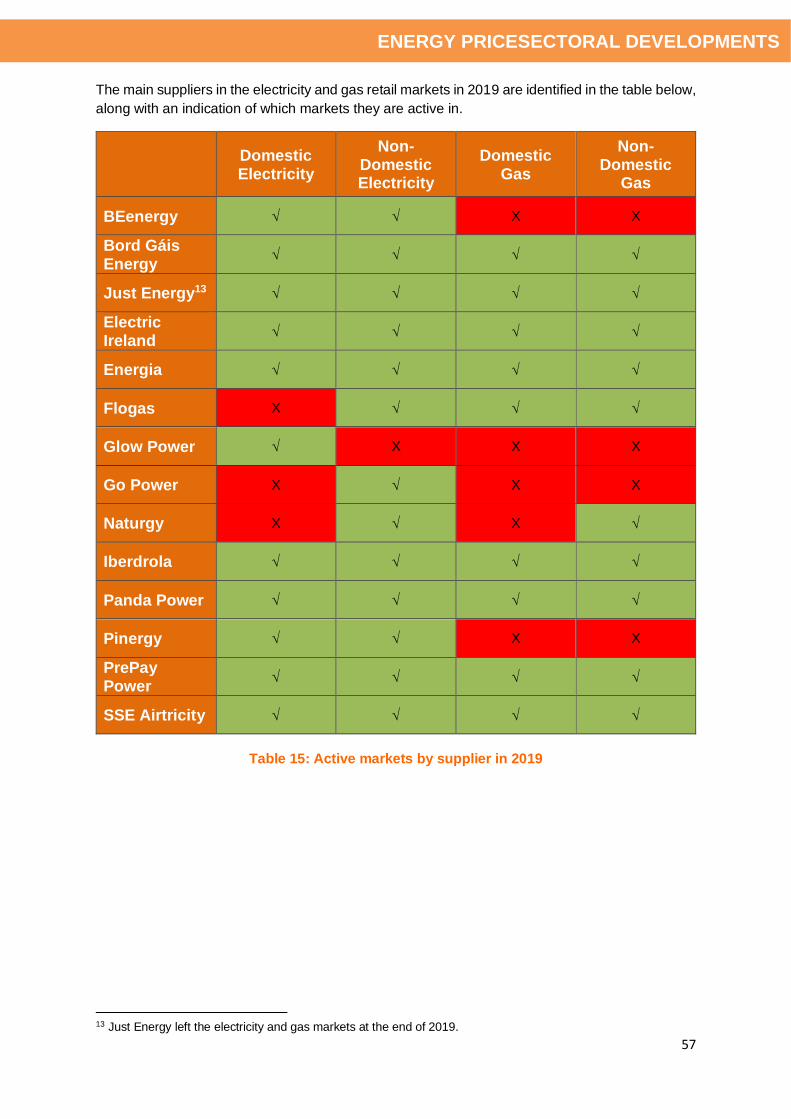
57
ENERGY PRICESECTORAL DEVELOPMENTS
The main suppliers in the electricity and gas retail markets in 2019 are identified in the table below,
along with an indication of which markets they are active in.
Domestic Electricity
Non-Domestic Electricity
Domestic Gas
Non-Domestic
Gas
BEenergy X X
Bord Gáis Energy
Just Energy13
Electric Ireland
Energia
Flogas X
Glow Power X X X
Go Power X X X
Naturgy X X
Iberdrola
Panda Power
Pinergy X X
PrePay Power
SSE Airtricity
Table 15: Active markets by supplier in 2019
13 Just Energy left the electricity and gas markets at the end of 2019.
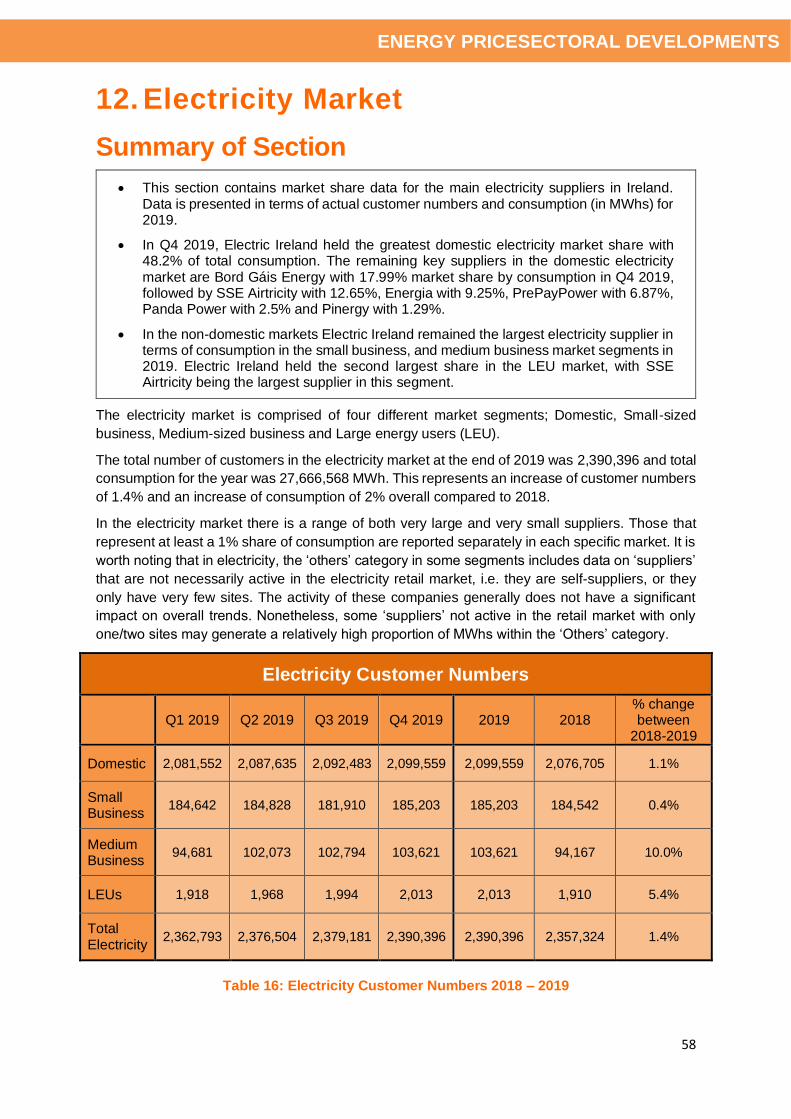
58
ENERGY PRICESECTORAL DEVELOPMENTS
12. Electricity Market
Summary of Section
• This section contains market share data for the main electricity suppliers in Ireland. Data is presented in terms of actual customer numbers and consumption (in MWhs) for 2019.
• In Q4 2019, Electric Ireland held the greatest domestic electricity market share with 48.2% of total consumption. The remaining key suppliers in the domestic electricity market are Bord Gáis Energy with 17.99% market share by consumption in Q4 2019, followed by SSE Airtricity with 12.65%, Energia with 9.25%, PrePayPower with 6.87%, Panda Power with 2.5% and Pinergy with 1.29%.
• In the non-domestic markets Electric Ireland remained the largest electricity supplier in terms of consumption in the small business, and medium business market segments in 2019. Electric Ireland held the second largest share in the LEU market, with SSE Airtricity being the largest supplier in this segment.
The electricity market is comprised of four different market segments; Domestic, Small-sized
business, Medium-sized business and Large energy users (LEU).
The total number of customers in the electricity market at the end of 2019 was 2,390,396 and total
consumption for the year was 27,666,568 MWh. This represents an increase of customer numbers
of 1.4% and an increase of consumption of 2% overall compared to 2018.
In the electricity market there is a range of both very large and very small suppliers. Those that
represent at least a 1% share of consumption are reported separately in each specific market. It is
worth noting that in electricity, the ‘others’ category in some segments includes data on ‘suppliers’
that are not necessarily active in the electricity retail market, i.e. they are self-suppliers, or they
only have very few sites. The activity of these companies generally does not have a significant
impact on overall trends. Nonetheless, some ‘suppliers’ not active in the retail market with only
one/two sites may generate a relatively high proportion of MWhs within the ‘Others’ category.
Electricity Customer Numbers
Q1 2019 Q2 2019 Q3 2019 Q4 2019 2019 2018
% change between
2018-2019
Domestic 2,081,552 2,087,635 2,092,483 2,099,559 2,099,559 2,076,705 1.1%
Small Business
184,642 184,828 181,910 185,203 185,203 184,542 0.4%
Medium Business
94,681 102,073 102,794 103,621 103,621 94,167 10.0%
LEUs 1,918 1,968 1,994 2,013 2,013 1,910 5.4%
Total Electricity
2,362,793 2,376,504 2,379,181 2,390,396 2,390,396 2,357,324 1.4%
Table 16: Electricity Customer Numbers 2018 – 2019
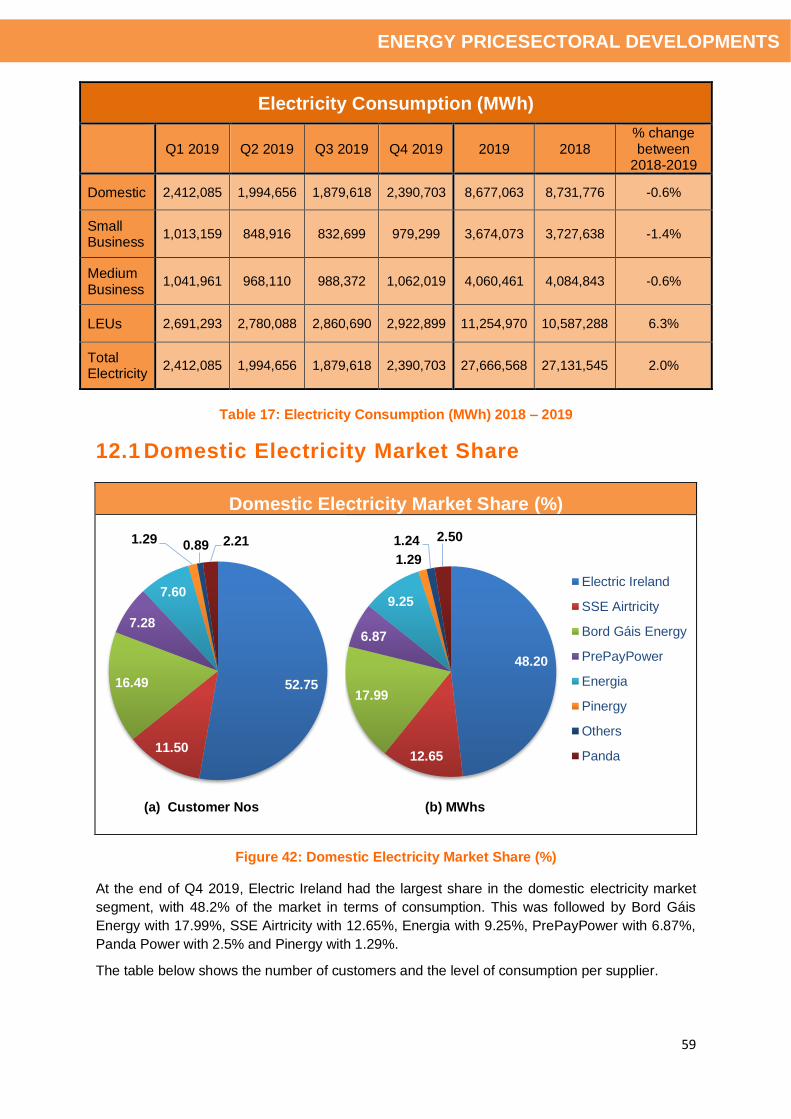
59
ENERGY PRICESECTORAL DEVELOPMENTS
Electricity Consumption (MWh)
Q1 2019 Q2 2019 Q3 2019 Q4 2019 2019 2018
% change between
2018-2019
Domestic 2,412,085 1,994,656 1,879,618 2,390,703 8,677,063 8,731,776 -0.6%
Small Business
1,013,159 848,916 832,699 979,299 3,674,073 3,727,638 -1.4%
Medium Business
1,041,961 968,110 988,372 1,062,019 4,060,461 4,084,843 -0.6%
LEUs 2,691,293 2,780,088 2,860,690 2,922,899 11,254,970 10,587,288 6.3%
Total Electricity
2,412,085 1,994,656 1,879,618 2,390,703 27,666,568 27,131,545 2.0%
Table 17: Electricity Consumption (MWh) 2018 – 2019
12.1 Domestic Electricity Market Share
Figure 42: Domestic Electricity Market Share (%)
At the end of Q4 2019, Electric Ireland had the largest share in the domestic electricity market
segment, with 48.2% of the market in terms of consumption. This was followed by Bord Gáis
Energy with 17.99%, SSE Airtricity with 12.65%, Energia with 9.25%, PrePayPower with 6.87%,
Panda Power with 2.5% and Pinergy with 1.29%.
The table below shows the number of customers and the level of consumption per supplier.
Domestic Electricity Market Share (%)
(a) Customer Nos (b) MWhs
52.75
11.50
16.49
7.28
7.60
1.29 0.89 2.21
48.20
12.65
17.99
6.87
9.25
1.29
1.24 2.50
Electric Ireland
SSE Airtricity
Bord Gáis Energy
PrePayPower
Energia
Pinergy
Others
Panda
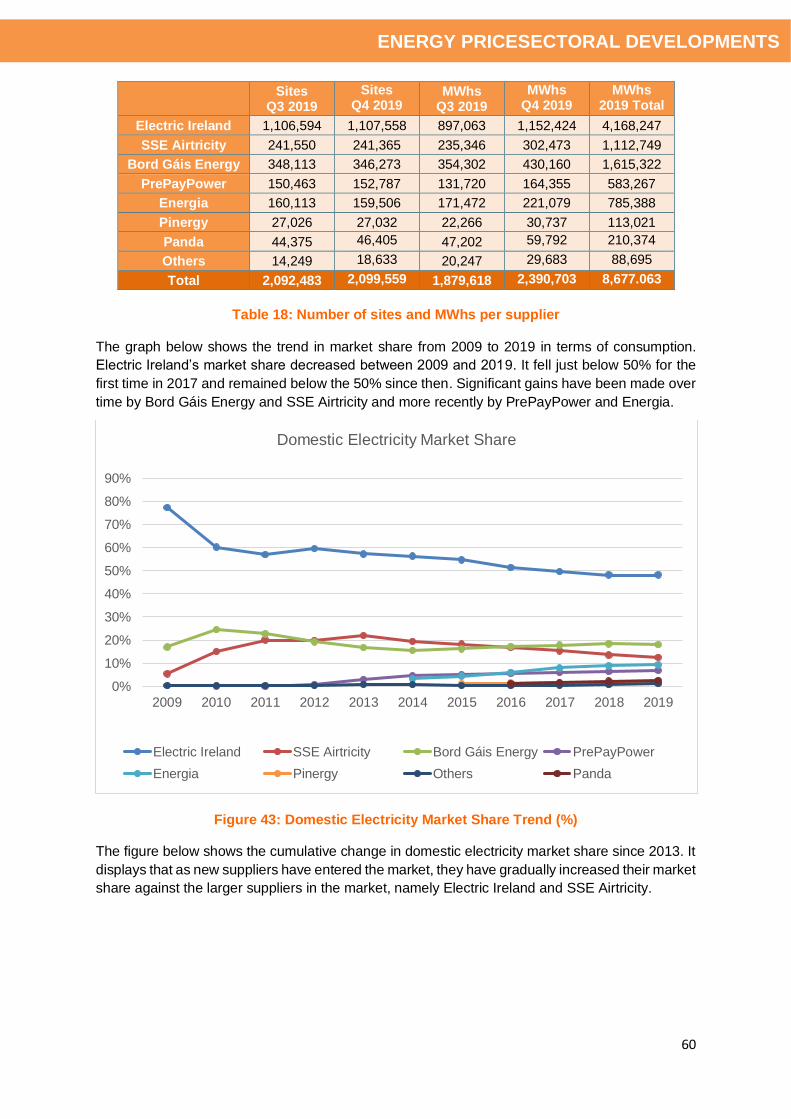
60
ENERGY PRICESECTORAL DEVELOPMENTS
Sites Q3 2019
Sites Q4 2019
MWhs Q3 2019
MWhs Q4 2019
MWhs 2019 Total
Electric Ireland 1,106,594 1,107,558 897,063 1,152,424 4,168,247
SSE Airtricity 241,550 241,365 235,346 302,473 1,112,749
Bord Gáis Energy 348,113 346,273 354,302 430,160 1,615,322
PrePayPower 150,463 152,787 131,720 164,355 583,267
Energia 160,113 159,506 171,472 221,079 785,388
Pinergy 27,026 27,032 22,266 30,737 113,021
Panda 44,375 46,405 47,202 59,792 210,374
Others 14,249 18,633 20,247 29,683 88,695
Total 2,092,483 2,099,559 1,879,618 2,390,703 8,677.063
Table 18: Number of sites and MWhs per supplier
The graph below shows the trend in market share from 2009 to 2019 in terms of consumption.
Electric Ireland’s market share decreased between 2009 and 2019. It fell just below 50% for the
first time in 2017 and remained below the 50% since then. Significant gains have been made over
time by Bord Gáis Energy and SSE Airtricity and more recently by PrePayPower and Energia.
Figure 43: Domestic Electricity Market Share Trend (%)
The figure below shows the cumulative change in domestic electricity market share since 2013. It
displays that as new suppliers have entered the market, they have gradually increased their market
share against the larger suppliers in the market, namely Electric Ireland and SSE Airtricity.
0%
10%
20%
30%
40%
50%
60%
70%
80%
90%
2009 2010 2011 2012 2013 2014 2015 2016 2017 2018 2019
Domestic Electricity Market Share
Electric Ireland SSE Airtricity Bord Gáis Energy PrePayPower
Energia Pinergy Others Panda

61
ENERGY PRICESECTORAL DEVELOPMENTS
Figure 44: Domestic Electricity Cumulative Change in Market Share
12.2 Small-Sized Business Electricity Market Share
Figure 45: Small-Sized Business Electricity Market Share (%)
At the end of Q4 2019, Electric Ireland had the largest share in the small business market segment,
with 30.68% of the market in terms of consumption. This was followed by Energia with 25.79%,
SSE Airtricity with 17.88% Bord Gáis Energy with 15.20%, PrePayPower with 4.23%, Flogas with
2.22%, and Go Power with 1.95%.
-15
-10
-5
0
5
10
15
2013 2014 2015 2016 2017 2018 2019
Domestic Electricity Cumulative Change in Market Share
Electric Ireland SSE Airtricity Bord Gáis Energy PrePayPower
Energia Pinergy Others Panda
Small Business Market Share (%)
(a) Customer Nos (b) MWhs
35.96
17.29
15.78
20.16
1.24
4.91
1.92 1.88
0.86
30.68
17.8815.20
25.79
4.23
2.22
1.95
2.05 Electric Ireland
SSE Airtricity
Bord Gáis Energy
Energia
Pinergy
Naturgy
PrePayPower
Panda Power
Flogas
Go Power
Others

62
ENERGY PRICESECTORAL DEVELOPMENTS
The table below shows the number of customers and the level of consumption per supplier.
Sites Q3 2019
Sites Q4 2019
MWhs Q3 2019
MWhs Q4 2019
MWhs 2019 Total
Electric Ireland 66,594 66,606 259,112 300,439 1,132,579
SSE Airtricity 32,257 32,014 149,265 175,096 683,405
Bord Gáis Energy 26,689 29,225 130,624 148,883 560,062
Energia 37,886 37,331 212,221 252,603 933,300
Panda Power 8,517 9,089 32,642 41,460 136,352
Flogas 2,564 3,562 15,737 21,712 82,860
Go Power 3,416 3,491 16,126 19,072 73,234
Others 3,987 3,885 19,971 20,034 72,280
Total 181,910 185,203 832,699 979,299 3,674,073
Table 19: Number of sites and MWhs per supplier
The graph below shows the trend in market share from 2009 to 2019 in terms of consumption.
Market shares in this segment have remained fairly steady for the different suppliers over the years.
Figure 46: Small-Sized Business Electricity Market Share Trend (%)
0%
5%
10%
15%
20%
25%
30%
35%
40%
45%
2009 2010 2011 2012 2013 2014 2015 2016 2017 2018 2019
Small Business Electricity Market Share
Electric Ireland SSE Airtricity Bord Gáis Energy Energia
Pinergy Naturgy PrePayPower Panda Power
Flogas Go Power Others

63
ENERGY PRICESECTORAL DEVELOPMENTS
12.3 Medium-Sized Business Electricity Market Share
Figure 47: Medium Business Electricity Market Share (%)
At the end of Q4 2019, Electric Ireland had the largest share in the medium business market
segment, with 30.68% of the market in terms of consumption. This was followed by Energia with
30.21%, SSE Airtricity with 17.51%, Bord Gáis Energy with 9.25%, Naturgy with 2.59% and Go
Power with 1.30%.
The table below shows the number of customers and the level of consumption per supplier.
Sites Q3 2019
Sites Q4 2019
MWhs Q3 2019
MWhs Q4 2019
MWhs 2019 Total
Electric Ireland 22,426 22,572 383,967 389,498 1,520,204
SSE Airtricity 9,562 9,516 180,489 185,943 753,294
Bord Gáis Energy 1,354 1,388 89,522 98,289 349,422
Energia 64,996 65,547 274,195 320,810 1,192,779
Naturgy 3,673 3,691 26,609 27,555 101,704
Panda Power 164 179 6,096 7,193 23,207
Go Power 276 308 11,844 13,812 49,847
Others 343 420 15,651 18,919 70,004
Total 102,794 103,621 988,372 1,062,019 4,060,461
Table 20: Number of sites and MWhs per supplier
Medium-Sized Business Electricity Market Share (%)
(a) Customer Nos (b) MWhs
21.78
9.18
1.3463.26
3.56
0.170.30
0.88
36.68
17.519.25
30.21
2.59
0.681.30
1.78
Electric Ireland
SSE Airtricity
Bord Gáis Energy
Energia
Naturgy
Panda Power
Go Power
Others

64
ENERGY PRICESECTORAL DEVELOPMENTS
The graph below shows the trend in market share 2009 to 2019 in terms of consumption. Electric
Ireland experienced a decline in its market share over a number of years following price
deregulation of the business market in October 2010, however its market share increased between
2012 and 2015 and remained fairly steady since. SSE Airtricity’s market share increased following
deregulation but decreased between 2012 and 2017 before increasing again in recent years.
Energia also gained a significant share in this segment with its market share fluctuating between
35-40% over the last ten years.
Figure 48: Medium-Sized Business Electricity Market Share Trend (%)
12.4 Large Energy Users (LEUs) Electricity Market Share
Figure 49: LEU Electricity Market Share (%)
0%
5%
10%
15%
20%
25%
30%
35%
40%
45%
2009 2010 2011 2012 2013 2014 2015 2016 2017 2018 2019
Medium Business Electricity Market Share
Electric Ireland SSE Airtricity Bord Gáis Energy Energia
Naturgy Go Power Others
LEU Market Share (%)
(a) Customer Nos (b) MWhs
36.41
16.69
14.90
18.43
5.967.60
34.93
35.40
6.83
11.52
3.108.21 Electric Ireland
SSE Airtricity
Bord Gáis Energy
Energia
Naturgy
Go Power
Others
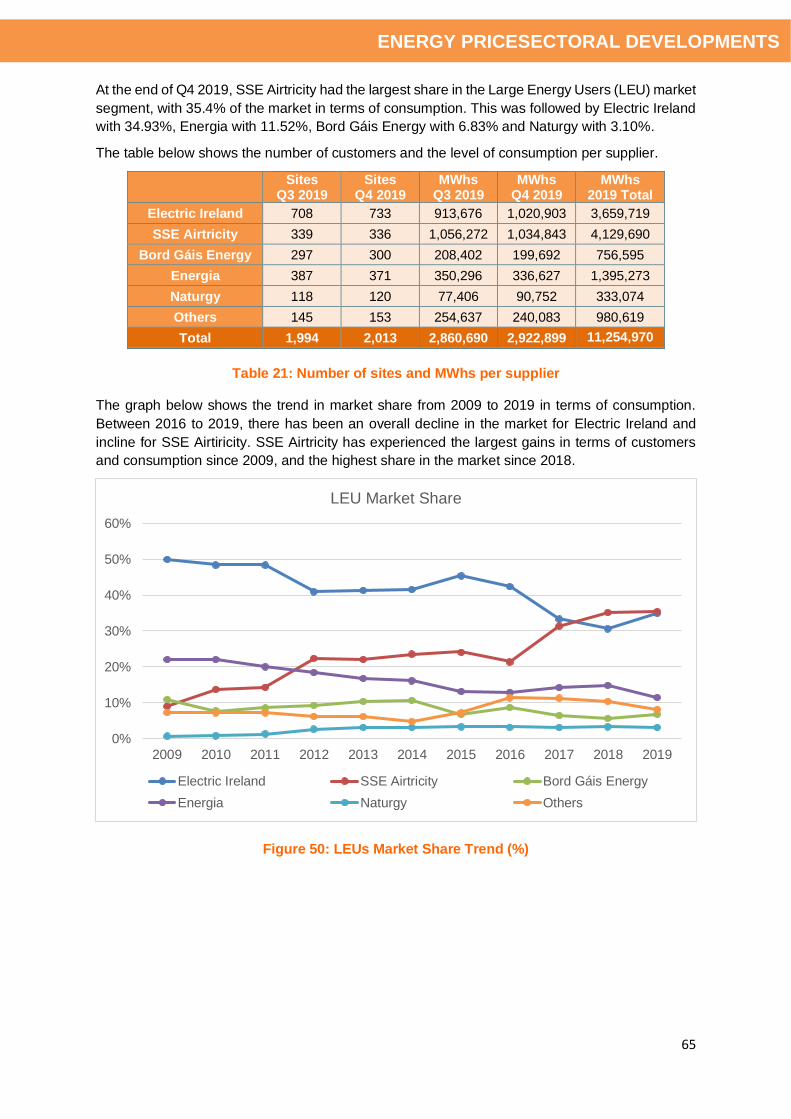
65
ENERGY PRICESECTORAL DEVELOPMENTS
At the end of Q4 2019, SSE Airtricity had the largest share in the Large Energy Users (LEU) market
segment, with 35.4% of the market in terms of consumption. This was followed by Electric Ireland
with 34.93%, Energia with 11.52%, Bord Gáis Energy with 6.83% and Naturgy with 3.10%.
The table below shows the number of customers and the level of consumption per supplier.
Sites Q3 2019
Sites Q4 2019
MWhs Q3 2019
MWhs Q4 2019
MWhs 2019 Total
Electric Ireland 708 733 913,676 1,020,903 3,659,719
SSE Airtricity 339 336 1,056,272 1,034,843 4,129,690
Bord Gáis Energy 297 300 208,402 199,692 756,595
Energia 387 371 350,296 336,627 1,395,273
Naturgy 118 120 77,406 90,752 333,074
Others 145 153 254,637 240,083 980,619
Total 1,994 2,013 2,860,690 2,922,899 11,254,970
Table 21: Number of sites and MWhs per supplier
The graph below shows the trend in market share from 2009 to 2019 in terms of consumption.
Between 2016 to 2019, there has been an overall decline in the market for Electric Ireland and
incline for SSE Airtiricity. SSE Airtricity has experienced the largest gains in terms of customers
and consumption since 2009, and the highest share in the market since 2018.
Figure 50: LEUs Market Share Trend (%)
0%
10%
20%
30%
40%
50%
60%
2009 2010 2011 2012 2013 2014 2015 2016 2017 2018 2019
LEU Market Share
Electric Ireland SSE Airtricity Bord Gáis Energy
Energia Naturgy Others
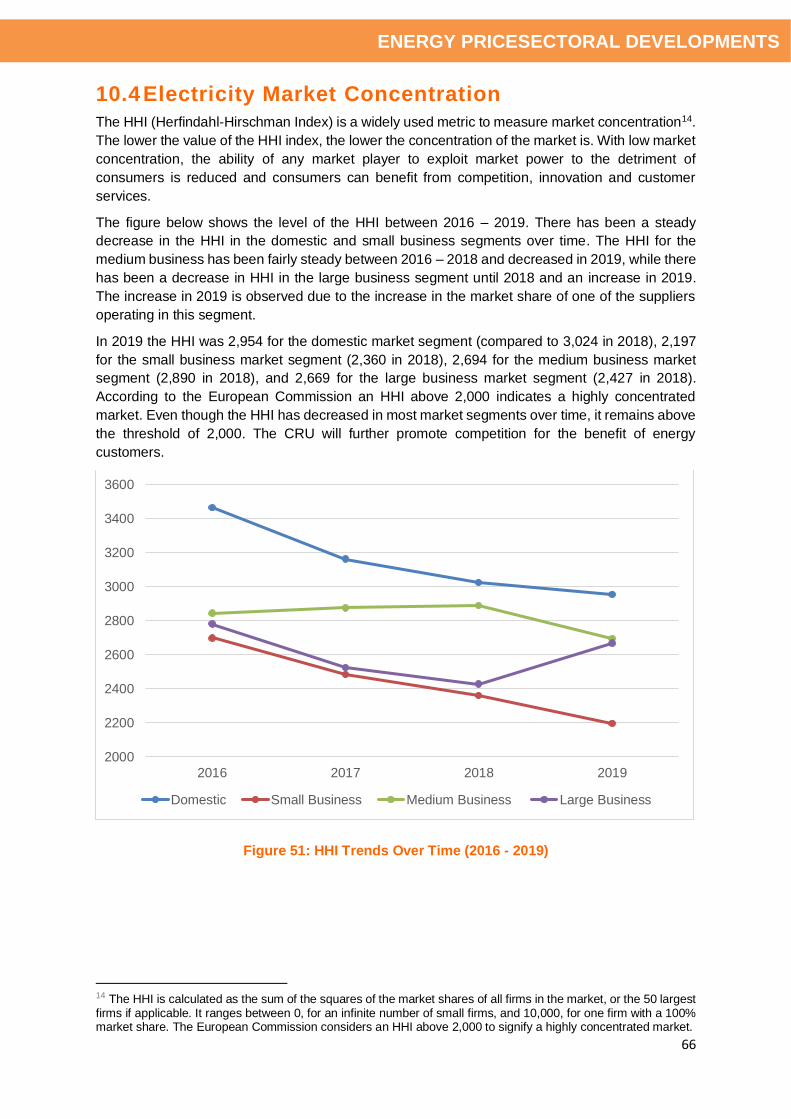
66
ENERGY PRICESECTORAL DEVELOPMENTS
10.4 Electricity Market Concentration
The HHI (Herfindahl-Hirschman Index) is a widely used metric to measure market concentration14.
The lower the value of the HHI index, the lower the concentration of the market is. With low market
concentration, the ability of any market player to exploit market power to the detriment of
consumers is reduced and consumers can benefit from competition, innovation and customer
services.
The figure below shows the level of the HHI between 2016 – 2019. There has been a steady
decrease in the HHI in the domestic and small business segments over time. The HHI for the
medium business has been fairly steady between 2016 – 2018 and decreased in 2019, while there
has been a decrease in HHI in the large business segment until 2018 and an increase in 2019.
The increase in 2019 is observed due to the increase in the market share of one of the suppliers
operating in this segment.
In 2019 the HHI was 2,954 for the domestic market segment (compared to 3,024 in 2018), 2,197
for the small business market segment (2,360 in 2018), 2,694 for the medium business market
segment (2,890 in 2018), and 2,669 for the large business market segment (2,427 in 2018).
According to the European Commission an HHI above 2,000 indicates a highly concentrated
market. Even though the HHI has decreased in most market segments over time, it remains above
the threshold of 2,000. The CRU will further promote competition for the benefit of energy
customers.
Figure 51: HHI Trends Over Time (2016 - 2019)
14 The HHI is calculated as the sum of the squares of the market shares of all firms in the market, or the 50 largest firms if applicable. It ranges between 0, for an infinite number of small firms, and 10,000, for one firm with a 100% market share. The European Commission considers an HHI above 2,000 to signify a highly concentrated market.
2000
2200
2400
2600
2800
3000
3200
3400
3600
2016 2017 2018 2019
Domestic Small Business Medium Business Large Business
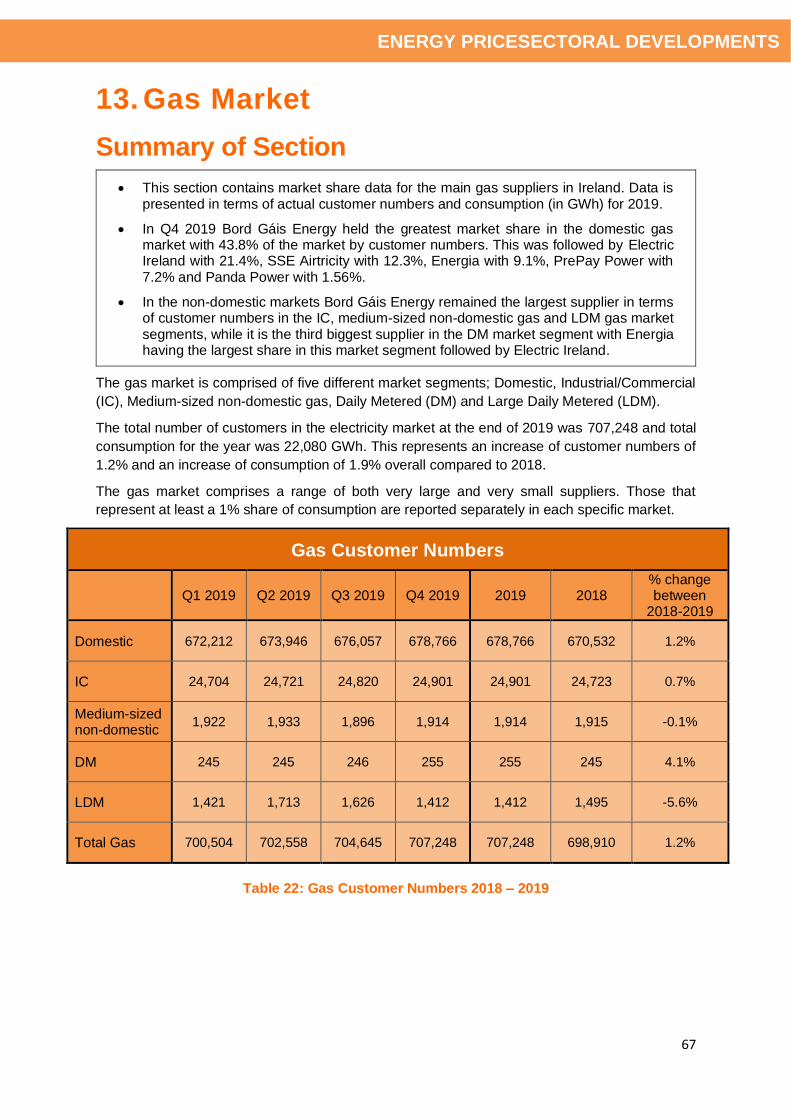
67
ENERGY PRICESECTORAL DEVELOPMENTS
13. Gas Market
Summary of Section
• This section contains market share data for the main gas suppliers in Ireland. Data is presented in terms of actual customer numbers and consumption (in GWh) for 2019.
• In Q4 2019 Bord Gáis Energy held the greatest market share in the domestic gas market with 43.8% of the market by customer numbers. This was followed by Electric Ireland with 21.4%, SSE Airtricity with 12.3%, Energia with 9.1%, PrePay Power with 7.2% and Panda Power with 1.56%.
• In the non-domestic markets Bord Gáis Energy remained the largest supplier in terms of customer numbers in the IC, medium-sized non-domestic gas and LDM gas market segments, while it is the third biggest supplier in the DM market segment with Energia having the largest share in this market segment followed by Electric Ireland.
The gas market is comprised of five different market segments; Domestic, Industrial/Commercial
(IC), Medium-sized non-domestic gas, Daily Metered (DM) and Large Daily Metered (LDM).
The total number of customers in the electricity market at the end of 2019 was 707,248 and total
consumption for the year was 22,080 GWh. This represents an increase of customer numbers of
1.2% and an increase of consumption of 1.9% overall compared to 2018.
The gas market comprises a range of both very large and very small suppliers. Those that
represent at least a 1% share of consumption are reported separately in each specific market.
Gas Customer Numbers
Q1 2019 Q2 2019 Q3 2019 Q4 2019 2019 2018
% change between
2018-2019
Domestic 672,212 673,946 676,057 678,766 678,766 670,532 1.2%
IC 24,704 24,721 24,820 24,901 24,901 24,723 0.7%
Medium-sized non-domestic
1,922 1,933 1,896 1,914 1,914 1,915 -0.1%
DM 245 245 246 255 255 245 4.1%
LDM 1,421 1,713 1,626 1,412 1,412 1,495 -5.6%
Total Gas 700,504 702,558 704,645 707,248 707,248 698,910 1.2%
Table 22: Gas Customer Numbers 2018 – 2019
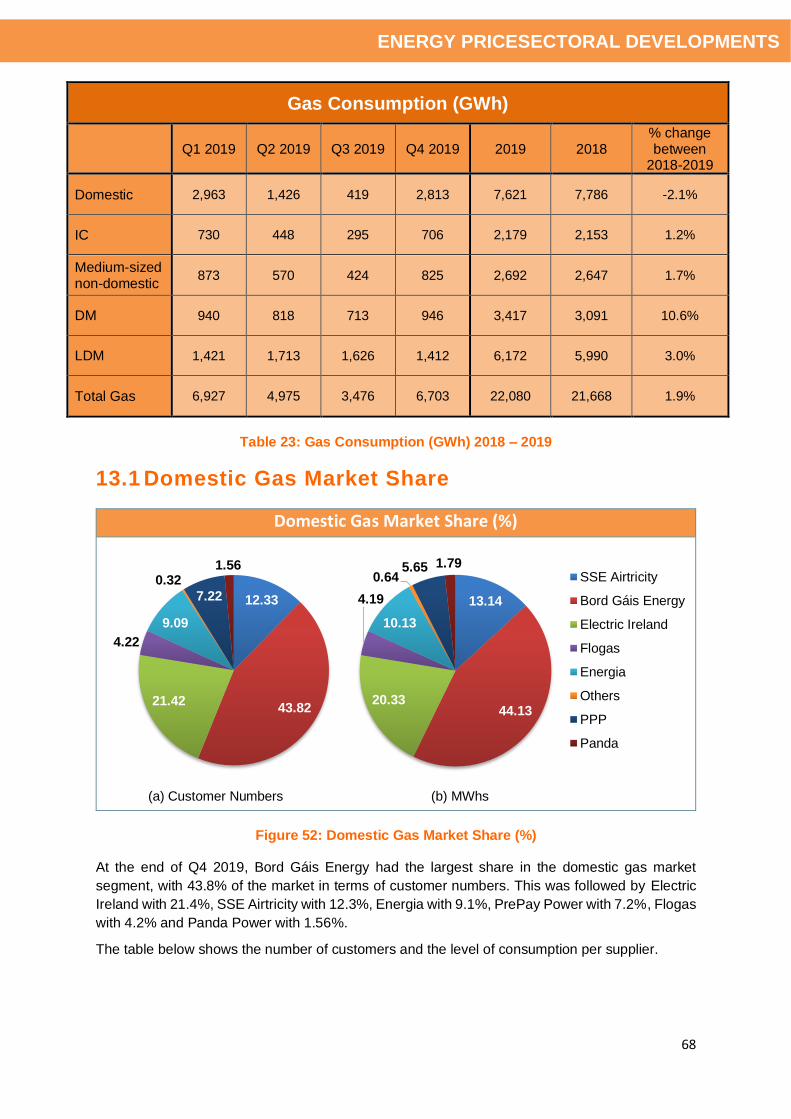
68
ENERGY PRICESECTORAL DEVELOPMENTS
Gas Consumption (GWh)
Q1 2019 Q2 2019 Q3 2019 Q4 2019 2019 2018
% change between
2018-2019
Domestic 2,963 1,426 419 2,813 7,621 7,786 -2.1%
IC 730 448 295 706 2,179 2,153 1.2%
Medium-sized non-domestic
873 570 424 825 2,692 2,647 1.7%
DM 940 818 713 946 3,417 3,091 10.6%
LDM 1,421 1,713 1,626 1,412 6,172 5,990 3.0%
Total Gas 6,927 4,975 3,476 6,703 22,080 21,668 1.9%
Table 23: Gas Consumption (GWh) 2018 – 2019
13.1 Domestic Gas Market Share
Figure 52: Domestic Gas Market Share (%)
At the end of Q4 2019, Bord Gáis Energy had the largest share in the domestic gas market
segment, with 43.8% of the market in terms of customer numbers. This was followed by Electric
Ireland with 21.4%, SSE Airtricity with 12.3%, Energia with 9.1%, PrePay Power with 7.2%, Flogas
with 4.2% and Panda Power with 1.56%.
The table below shows the number of customers and the level of consumption per supplier.
Domestic Gas Market Share (%)
(a) Customer Numbers (b) MWhs
12.33
43.8221.42
4.22
9.09
0.32
7.22
1.56
13.14
44.1320.33
4.19
10.13
0.645.65 1.79
SSE Airtricity
Bord Gáis Energy
Electric Ireland
Flogas
Energia
Others
PPP
Panda
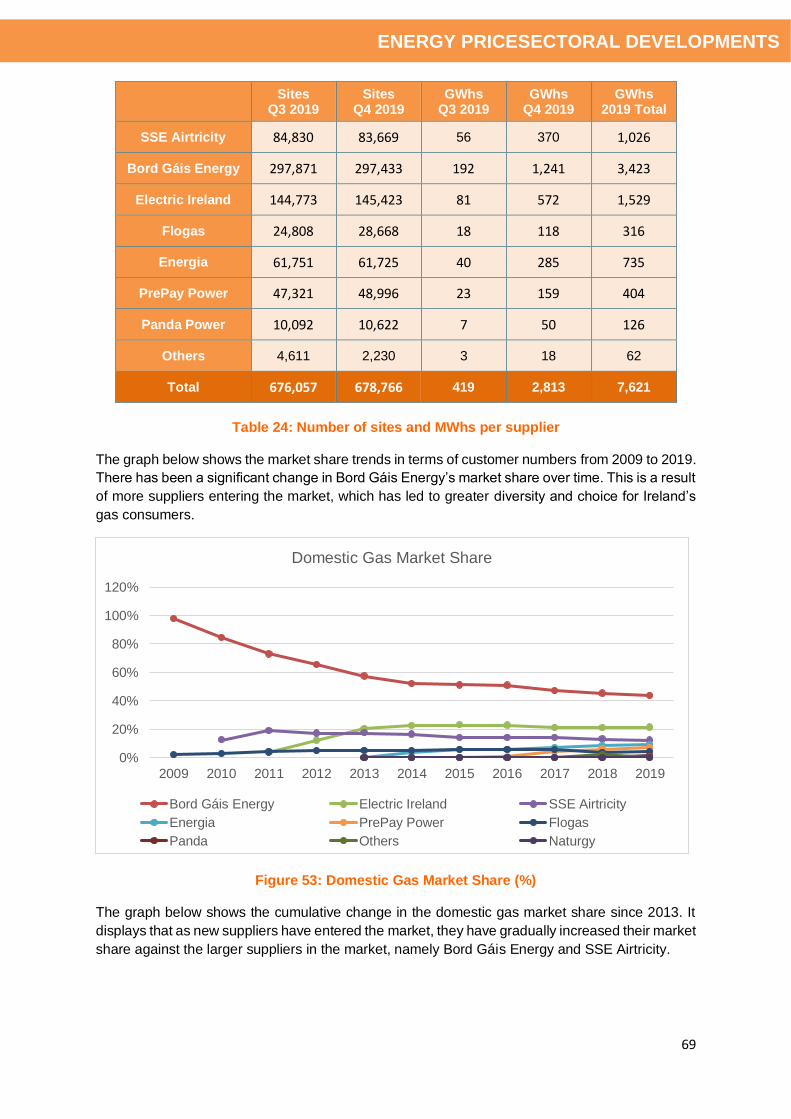
69
ENERGY PRICESECTORAL DEVELOPMENTS
Sites Q3 2019
Sites Q4 2019
GWhs Q3 2019
GWhs Q4 2019
GWhs 2019 Total
SSE Airtricity 84,830 83,669 56 370 1,026
Bord Gáis Energy 297,871 297,433 192 1,241 3,423
Electric Ireland 144,773 145,423 81 572 1,529
Flogas 24,808 28,668 18 118 316
Energia 61,751 61,725 40 285 735
PrePay Power 47,321 48,996 23 159 404
Panda Power 10,092 10,622 7 50 126
Others 4,611 2,230 3 18 62
Total 676,057 678,766 419 2,813 7,621
Table 24: Number of sites and MWhs per supplier
The graph below shows the market share trends in terms of customer numbers from 2009 to 2019.
There has been a significant change in Bord Gáis Energy’s market share over time. This is a result
of more suppliers entering the market, which has led to greater diversity and choice for Ireland’s
gas consumers.
Figure 53: Domestic Gas Market Share (%)
The graph below shows the cumulative change in the domestic gas market share since 2013. It
displays that as new suppliers have entered the market, they have gradually increased their market
share against the larger suppliers in the market, namely Bord Gáis Energy and SSE Airtricity.
0%
20%
40%
60%
80%
100%
120%
2009 2010 2011 2012 2013 2014 2015 2016 2017 2018 2019
Domestic Gas Market Share
Bord Gáis Energy Electric Ireland SSE Airtricity
Energia PrePay Power Flogas
Panda Others Naturgy

70
ENERGY PRICESECTORAL DEVELOPMENTS
Figure 54: Domestic Gas Cumulative Change in Market Share by Customer Numbers
13.2 Industrial and Commercial (IC) Gas Market Share
Figure 55: IC Gas Market Share (%)
At the end of Q4 2019, Bord Gáis Energy had the largest share in the IC gas market segment, with
45.1%% of the market in terms of customer numbers. This was followed by Flogas with 17.8%,
Energia with 14.3%, Electric Ireland with 11.5%, SSE Airtricity with 9.8% and Naturgy with 1.5%.
The table below shows the number of customers and the level of consumption per supplier.
-15
-10
-5
0
5
10
15
2013 2014 2015 2016 2017 2018 2019
%
Domestic Gas Cumulative Change in Market Share
SSE Airtricity BGE Electric Ireland Flogas Energia PPP
IC Market Share (%)
(a) Customer Numbers (b) MWhs
9.80
45.06
11.51
17.83
14.26
1.51 0.03
11.55
41.30
12.27
15.60
15.58
3.49 0.21
SSE Airtricity
Bord Gáis Energy
Electric Ireland
Flogas
Energia
Naturgy
Others
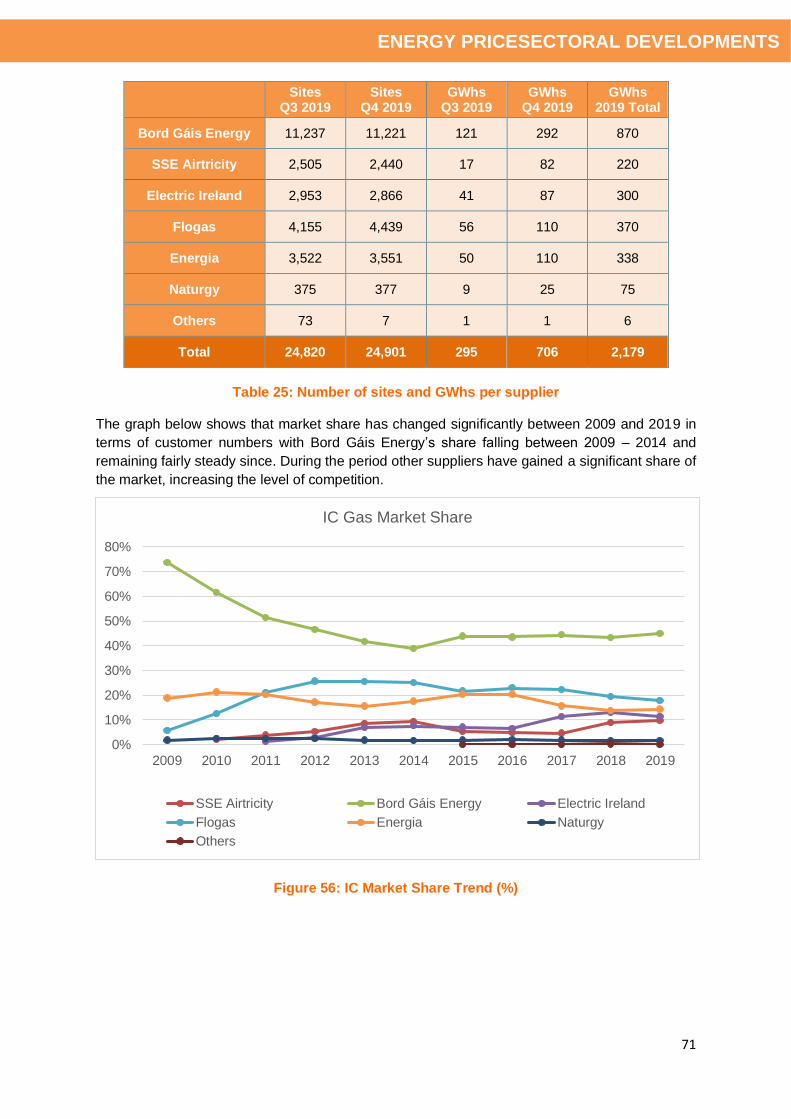
71
ENERGY PRICESECTORAL DEVELOPMENTS
Sites Q3 2019
Sites Q4 2019
GWhs Q3 2019
GWhs Q4 2019
GWhs 2019 Total
Bord Gáis Energy 11,237 11,221 121 292 870
SSE Airtricity 2,505 2,440 17 82 220
Electric Ireland 2,953 2,866 41 87 300
Flogas 4,155 4,439 56 110 370
Energia 3,522 3,551 50 110 338
Naturgy 375 377 9 25 75
Others 73 7 1 1 6
Total 24,820 24,901 295 706 2,179
Table 25: Number of sites and GWhs per supplier
The graph below shows that market share has changed significantly between 2009 and 2019 in
terms of customer numbers with Bord Gáis Energy’s share falling between 2009 – 2014 and
remaining fairly steady since. During the period other suppliers have gained a significant share of
the market, increasing the level of competition.
Figure 56: IC Market Share Trend (%)
0%
10%
20%
30%
40%
50%
60%
70%
80%
2009 2010 2011 2012 2013 2014 2015 2016 2017 2018 2019
IC Gas Market Share
SSE Airtricity Bord Gáis Energy Electric Ireland
Flogas Energia Naturgy
Others

72
ENERGY PRICESECTORAL DEVELOPMENTS
13.3 Medium-Sized Non-Domestic Gas Market Share
Figure 57: Medium-Sized Non-Domestic Gas Market Share (%)
At the end of Q4 2019, Bord Gáis Energy had the largest share in the medium-sized non-domestic
gas market segment, with 31.8%% of the market in terms of customer numbers. This was followed
by Electric Ireland with 15.6%, SSE Airtricity with 14.5%, Energia with 13.4%, Naturgy with 12.8%
and Flogas with 12%.
The table below shows the number of customers and the level of consumption per supplier.
Sites Q3 2019
Sites Q4 2019
GWhs Q3 2019
GWhs Q4 2019
GWhs 2019 Total
Bord Gáis Energy 613 608 131 266 850
SSE Airtricity 257 277 37 111 318
Electric Ireland 295 298 80 137 450
Flogas 240 230 66 106 392
Energia 249 257 61 106 358
Naturgy 242 244 47 100 323
Others 0 0 0 0 1
Total 1,896 1,914 424 825 2,692
Table 26: Number of sites and GWhs per supplier
The graph below shows the trends in market share from 2009 to 2019 in terms of customer
numbers. Bord Gáis Energy’s market share has declined significantly since 2009 and market share
in the medium-sized non-domestic gas segment has become more distributed over time.
Medium-Sized Non-Domestic Market Share (%)
(a) Customer Numbers (b) MWhs
14.47
31.77
15.57
12.02
13.43
12.75 13.40
32.25
16.62
12.80
12.79
12.15 SSE Airtricity
Bord Gáis Energy
Electric Ireland
Flogas
Energia
Naturgy

73
ENERGY PRICESECTORAL DEVELOPMENTS
Figure 58: Medium-Sized Non-Domestic Business Electricity Market Share Trend (%)
13.4 Daily Metered (DM) Market Share
Figure 59: DM Gas Market Share (%)
At the end of Q4 2019, Energia had the largest share in the DM market segment, with 24.7% of
the market in terms of customer numbers. This was followed by Electric Ireland with 21.6%, Bord
Gáis Energy with 20.4%, Naturgy with 17.3% and SSE Airtricity with 14.1%.
The table below shows the number of customers and the level of consumption per supplier.
0%
10%
20%
30%
40%
50%
60%
70%
80%
2009 2010 2011 2012 2013 2014 2015 2016 2017 2018 2019
Medium-Sized Non-Domestic Gas Market Share
SSE Airtricity Bord Gáis Energy Electric Ireland Flogas
Energia Naturgy Others
DM Market Share (%)
(a) Customer Numbers (b) MWhs
14.12
20.39
21.57
24.71
0.3917.25
1.57
15.31
17.84
19.37
30.14
0.5016.18
0.67
SSE Airtricity
Bord Gáis Energy
Electric Ireland
Energia
Gazprom
Naturgy
Flogas
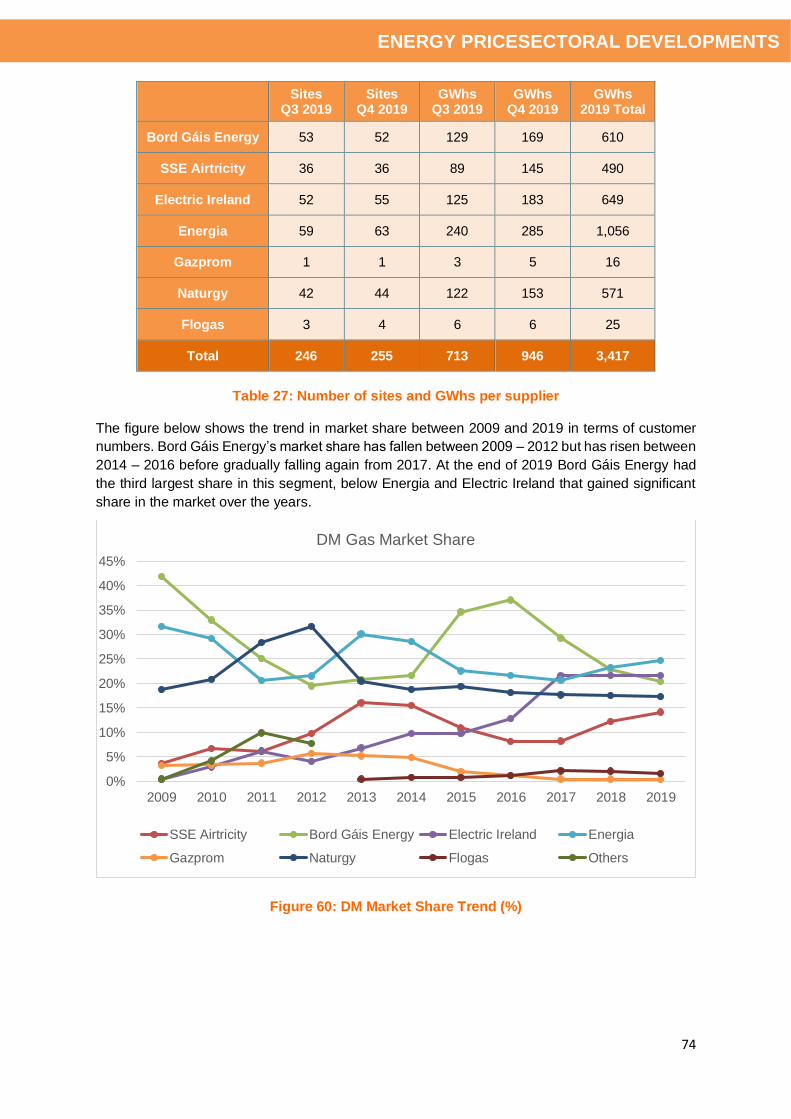
74
ENERGY PRICESECTORAL DEVELOPMENTS
Sites Q3 2019
Sites Q4 2019
GWhs Q3 2019
GWhs Q4 2019
GWhs 2019 Total
Bord Gáis Energy 53 52 129 169 610
SSE Airtricity 36 36 89 145 490
Electric Ireland 52 55 125 183 649
Energia 59 63 240 285 1,056
Gazprom 1 1 3 5 16
Naturgy 42 44 122 153 571
Flogas 3 4 6 6 25
Total 246 255 713 946 3,417
Table 27: Number of sites and GWhs per supplier
The figure below shows the trend in market share between 2009 and 2019 in terms of customer
numbers. Bord Gáis Energy’s market share has fallen between 2009 – 2012 but has risen between
2014 – 2016 before gradually falling again from 2017. At the end of 2019 Bord Gáis Energy had
the third largest share in this segment, below Energia and Electric Ireland that gained significant
share in the market over the years.
Figure 60: DM Market Share Trend (%)
0%
5%
10%
15%
20%
25%
30%
35%
40%
45%
2009 2010 2011 2012 2013 2014 2015 2016 2017 2018 2019
DM Gas Market Share
SSE Airtricity Bord Gáis Energy Electric Ireland Energia
Gazprom Naturgy Flogas Others
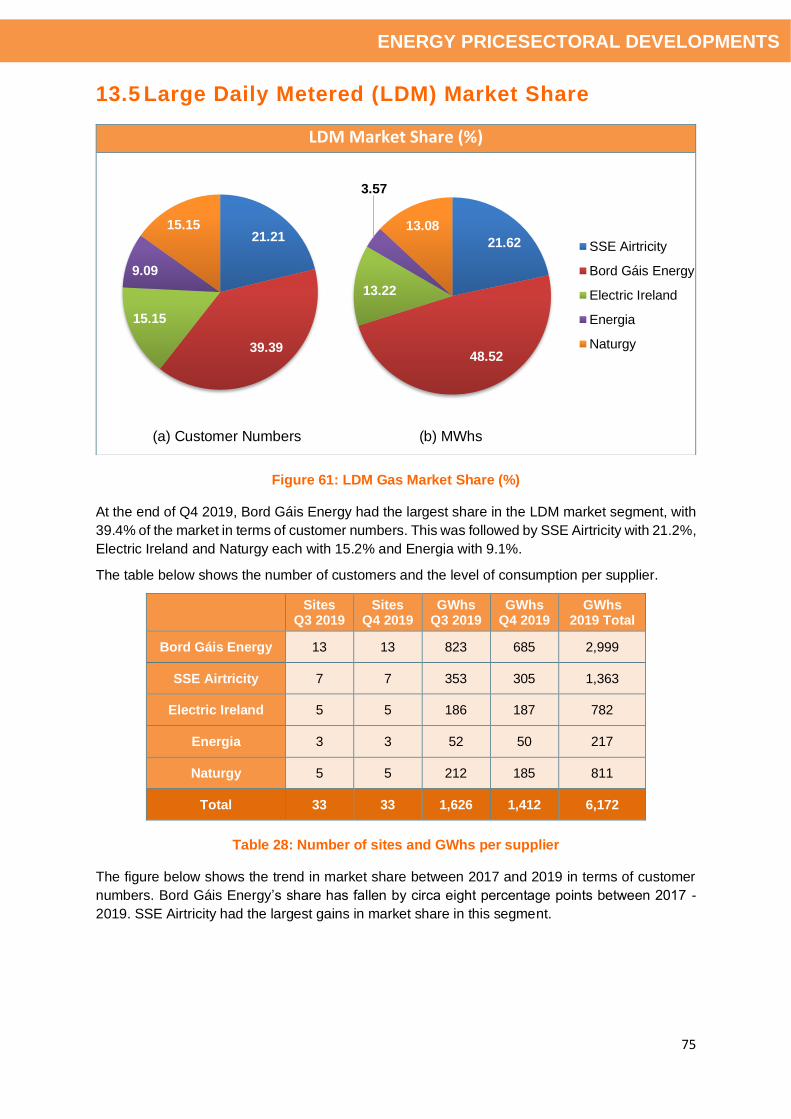
75
ENERGY PRICESECTORAL DEVELOPMENTS
13.5 Large Daily Metered (LDM) Market Share
Figure 61: LDM Gas Market Share (%)
At the end of Q4 2019, Bord Gáis Energy had the largest share in the LDM market segment, with
39.4% of the market in terms of customer numbers. This was followed by SSE Airtricity with 21.2%,
Electric Ireland and Naturgy each with 15.2% and Energia with 9.1%.
The table below shows the number of customers and the level of consumption per supplier.
Sites Q3 2019
Sites Q4 2019
GWhs Q3 2019
GWhs Q4 2019
GWhs 2019 Total
Bord Gáis Energy 13 13 823 685 2,999
SSE Airtricity 7 7 353 305 1,363
Electric Ireland 5 5 186 187 782
Energia 3 3 52 50 217
Naturgy 5 5 212 185 811
Total 33 33 1,626 1,412 6,172
Table 28: Number of sites and GWhs per supplier
The figure below shows the trend in market share between 2017 and 2019 in terms of customer
numbers. Bord Gáis Energy’s share has fallen by circa eight percentage points between 2017 -
2019. SSE Airtricity had the largest gains in market share in this segment.
LDM Market Share (%)
(a) Customer Numbers (b) MWhs
21.21
39.39
15.15
9.09
15.15
21.62
48.52
13.22
3.57
13.08
SSE Airtricity
Bord Gáis Energy
Electric Ireland
Energia
Naturgy
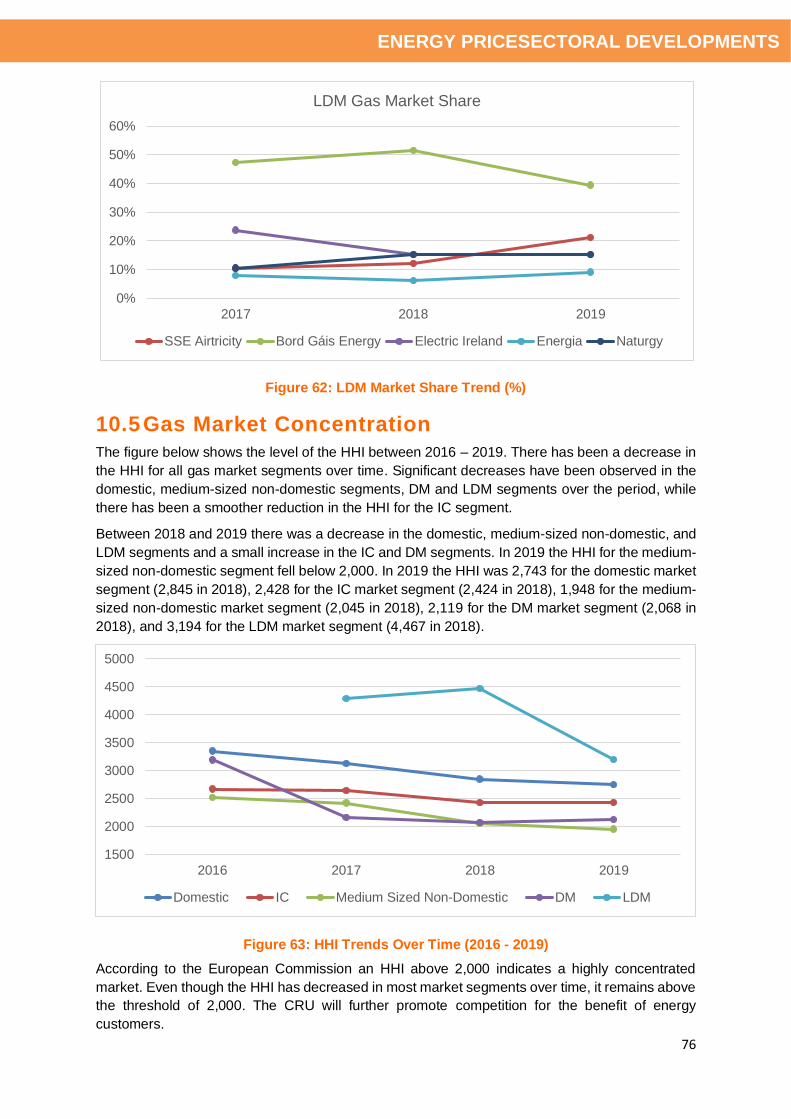
76
ENERGY PRICESECTORAL DEVELOPMENTS
Figure 62: LDM Market Share Trend (%)
10.5 Gas Market Concentration
The figure below shows the level of the HHI between 2016 – 2019. There has been a decrease in
the HHI for all gas market segments over time. Significant decreases have been observed in the
domestic, medium-sized non-domestic segments, DM and LDM segments over the period, while
there has been a smoother reduction in the HHI for the IC segment.
Between 2018 and 2019 there was a decrease in the domestic, medium-sized non-domestic, and
LDM segments and a small increase in the IC and DM segments. In 2019 the HHI for the medium-
sized non-domestic segment fell below 2,000. In 2019 the HHI was 2,743 for the domestic market
segment (2,845 in 2018), 2,428 for the IC market segment (2,424 in 2018), 1,948 for the medium-
sized non-domestic market segment (2,045 in 2018), 2,119 for the DM market segment (2,068 in
2018), and 3,194 for the LDM market segment (4,467 in 2018).
Figure 63: HHI Trends Over Time (2016 - 2019)
According to the European Commission an HHI above 2,000 indicates a highly concentrated
market. Even though the HHI has decreased in most market segments over time, it remains above
the threshold of 2,000. The CRU will further promote competition for the benefit of energy
customers.
0%
10%
20%
30%
40%
50%
60%
2017 2018 2019
LDM Gas Market Share
SSE Airtricity Bord Gáis Energy Electric Ireland Energia Naturgy
1500
2000
2500
3000
3500
4000
4500
5000
2016 2017 2018 2019
Domestic IC Medium Sized Non-Domestic DM LDM
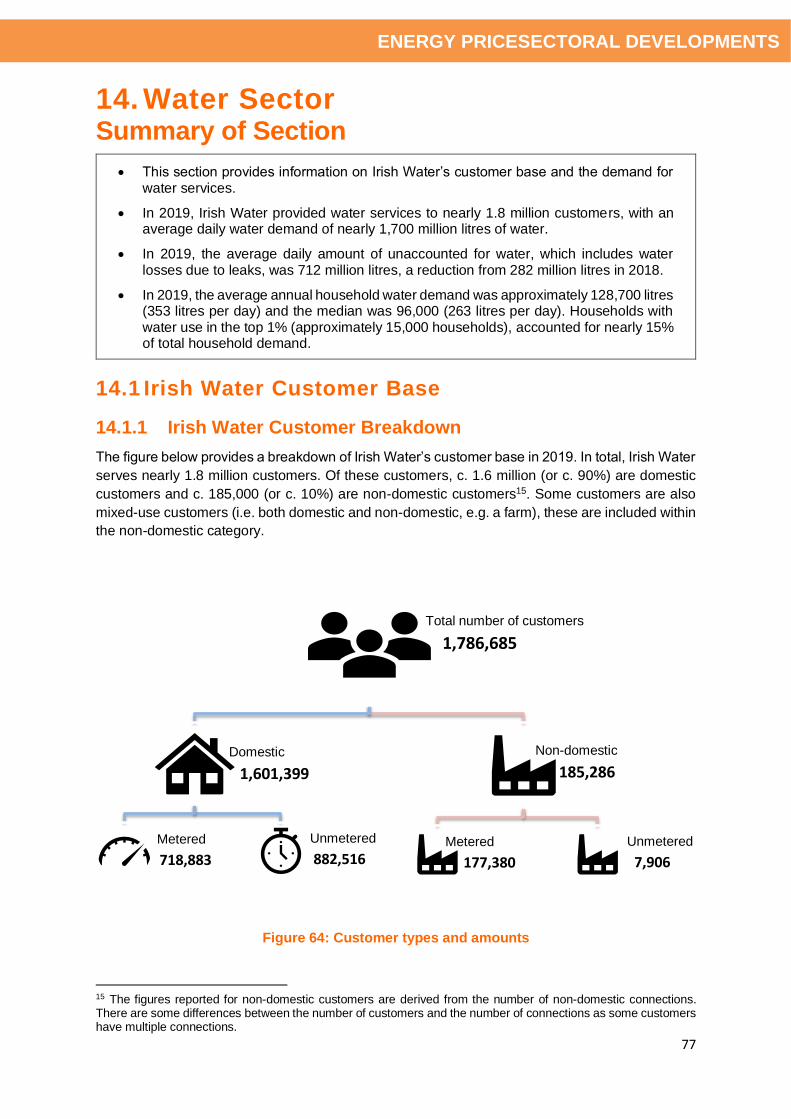
77
ENERGY PRICESECTORAL DEVELOPMENTS
14. Water Sector Summary of Section
• This section provides information on Irish Water’s customer base and the demand for water services.
• In 2019, Irish Water provided water services to nearly 1.8 million customers, with an average daily water demand of nearly 1,700 million litres of water.
• In 2019, the average daily amount of unaccounted for water, which includes water losses due to leaks, was 712 million litres, a reduction from 282 million litres in 2018.
• In 2019, the average annual household water demand was approximately 128,700 litres (353 litres per day) and the median was 96,000 (263 litres per day). Households with water use in the top 1% (approximately 15,000 households), accounted for nearly 15% of total household demand.
14.1 Irish Water Customer Base
14.1.1 Irish Water Customer Breakdown
The figure below provides a breakdown of Irish Water’s customer base in 2019. In total, Irish Water
serves nearly 1.8 million customers. Of these customers, c. 1.6 million (or c. 90%) are domestic
customers and c. 185,000 (or c. 10%) are non-domestic customers15. Some customers are also
mixed-use customers (i.e. both domestic and non-domestic, e.g. a farm), these are included within
the non-domestic category.
Figure 64: Customer types and amounts
15 The figures reported for non-domestic customers are derived from the number of non-domestic connections. There are some differences between the number of customers and the number of connections as some customers have multiple connections.
Total number of customers
1,786,685
Domestic
1,601,399
Metered
718,883
Unmetered
882,516
Non-domestic
185,286
Metered
177,380
Unmetered
7,906

78
ENERGY PRICESECTORAL DEVELOPMENTS
14.1.2 Irish Water Customer Trends
The table below provides further information on the customer breakdown by highlighting how the
number of customers has changed over time. The number of customers has stayed relatively
stable over time. Note that in the table below the number of metered customers (45%) is less than
the number of metered connections (60%). This is due to the customer numbers below reflecting
the number of customer accounts in Irish Waters systems as opposed to the total number of meters
in the ground. The difference is mostly due to Irish Water having a number of installed meters that
are yet to be matched to a customer.
2016 2017 2018 2019
Total number of customers
1,783,465 1,782,115 1,785,995 1,786,685
1. Number of domestic customers
1,599,247 1,597,897 1,600,374 1,601,399
1a. Metered domestic n/a 717,539 718,520 718,883
1b. Unmetered domestic
n/a 880,358 881,854 882,516
2. Number of non-domestic customers
184,218 184,218 185,621 185,286
2a. Metered non-domestic
n/a n/a 178,196 177,380
2b. Unmetered non-domestic
n/a n/a 7,425 7,906
Note: Some cells n/a as data was not reported for that period.
Table 29: Number of Irish Water Customers
14.2 Water Consumption
14.2.1 Water Demand Breakdown
The figure below provides a breakdown of Irish Water’s estimated water use by category in 2019.
The domestic sector accounts for approximately 33% of total water demand and the non-domestic
sector accounts for 23% of total water demand. The domestic demand and non-domestic demand
include water lost to leaks on customer properties. Approximately 42% of water is categorised as
unaccounted for water, the majority of which is made up of water losses from leaks and overflows.
Figure 65: Water demand breakdown for 2019
23%
33%
1%
42%
1%
Total non-domestic consumption
Total domestic consumption
Operational use
Unaccounted for water
Unrecorded connections

79
ENERGY PRICESECTORAL DEVELOPMENTS
Note: Operational use is water used by Irish Water in the operation of the water network.
Unrecorded connections includes Irish Water’s estimate of water used at connections not yet on
its systems, water taken illegally and standpipe use.
The CRU recognises the need for Irish Water to continue to reduce the level water leakage. The
severe weather events in recent years have highlighted the need for Irish Water to increase its
efforts to fix leaks, reduce and then maintain leakage at lower levels than is currently the case. To
reduce the overall amount of water lost to leakage, leaks must be found and repaired quicker than
new leaks appear. In 2019, Irish Water put in place its leakage management system, which will
assist in the reduction of the level of leakage. The reduction in unaccounted-for-water from 2018
to 2019 is a result of a combination of: a recategorization of water use from unaccounted-for-water
to domestic and non-domestic demand; data improvements arising from Irish Water’s new leakage
management system, and; Irish Water’s leakage reduction activities during the year.
Figure 66: Average Daily Water Demand Breakdown Over Time
14.2.2 Domestic Usage
The CRU analyses water consumption by domestic customers. This is done by analysing water
meter data. Approximately 60% of domestic customers have a water meter. Generally, the usage
patterns of these metered customers should be broadly similar to unmetered customers.
Therefore, by examining this data the CRU can gain an insight into water use trends in the entire
domestic sector. The graph below illustrates the annual water consumption per household (i.e. per
meter), both in terms of average and the median.
807 732 756 782 712
396396 337 335 395
508512 563 568 556
1717 17 17 17
0
200
400
600
800
1000
1200
1400
1600
1800
2000
2015 2016 2017 2018 2019
Million li
tres o
f w
ate
r per
day
Unaccounted for water Total non-domestic consumption
Total domestic consumption Operational use
Unrecorded connections
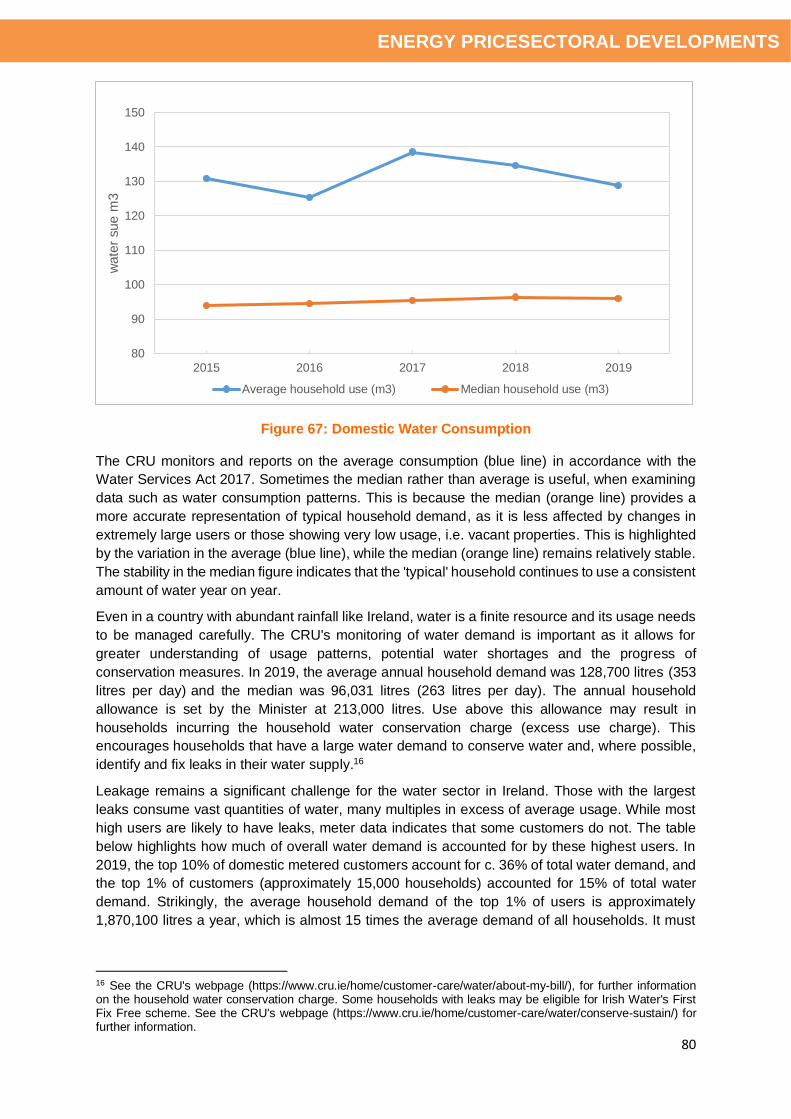
80
ENERGY PRICESECTORAL DEVELOPMENTS
Figure 67: Domestic Water Consumption
The CRU monitors and reports on the average consumption (blue line) in accordance with the
Water Services Act 2017. Sometimes the median rather than average is useful, when examining
data such as water consumption patterns. This is because the median (orange line) provides a
more accurate representation of typical household demand, as it is less affected by changes in
extremely large users or those showing very low usage, i.e. vacant properties. This is highlighted
by the variation in the average (blue line), while the median (orange line) remains relatively stable.
The stability in the median figure indicates that the 'typical' household continues to use a consistent
amount of water year on year.
Even in a country with abundant rainfall like Ireland, water is a finite resource and its usage needs
to be managed carefully. The CRU's monitoring of water demand is important as it allows for
greater understanding of usage patterns, potential water shortages and the progress of
conservation measures. In 2019, the average annual household demand was 128,700 litres (353
litres per day) and the median was 96,031 litres (263 litres per day). The annual household
allowance is set by the Minister at 213,000 litres. Use above this allowance may result in
households incurring the household water conservation charge (excess use charge). This
encourages households that have a large water demand to conserve water and, where possible,
identify and fix leaks in their water supply.16
Leakage remains a significant challenge for the water sector in Ireland. Those with the largest
leaks consume vast quantities of water, many multiples in excess of average usage. While most
high users are likely to have leaks, meter data indicates that some customers do not. The table
below highlights how much of overall water demand is accounted for by these highest users. In
2019, the top 10% of domestic metered customers account for c. 36% of total water demand, and
the top 1% of customers (approximately 15,000 households) accounted for 15% of total water
demand. Strikingly, the average household demand of the top 1% of users is approximately
1,870,100 litres a year, which is almost 15 times the average demand of all households. It must
16 See the CRU's webpage (https://www.cru.ie/home/customer-care/water/about-my-bill/), for further information on the household water conservation charge. Some households with leaks may be eligible for Irish Water's First Fix Free scheme. See the CRU's webpage (https://www.cru.ie/home/customer-care/water/conserve-sustain/) for further information.
80
90
100
110
120
130
140
150
2015 2016 2017 2018 2019
wate
r sue m
3
Average household use (m3) Median household use (m3)
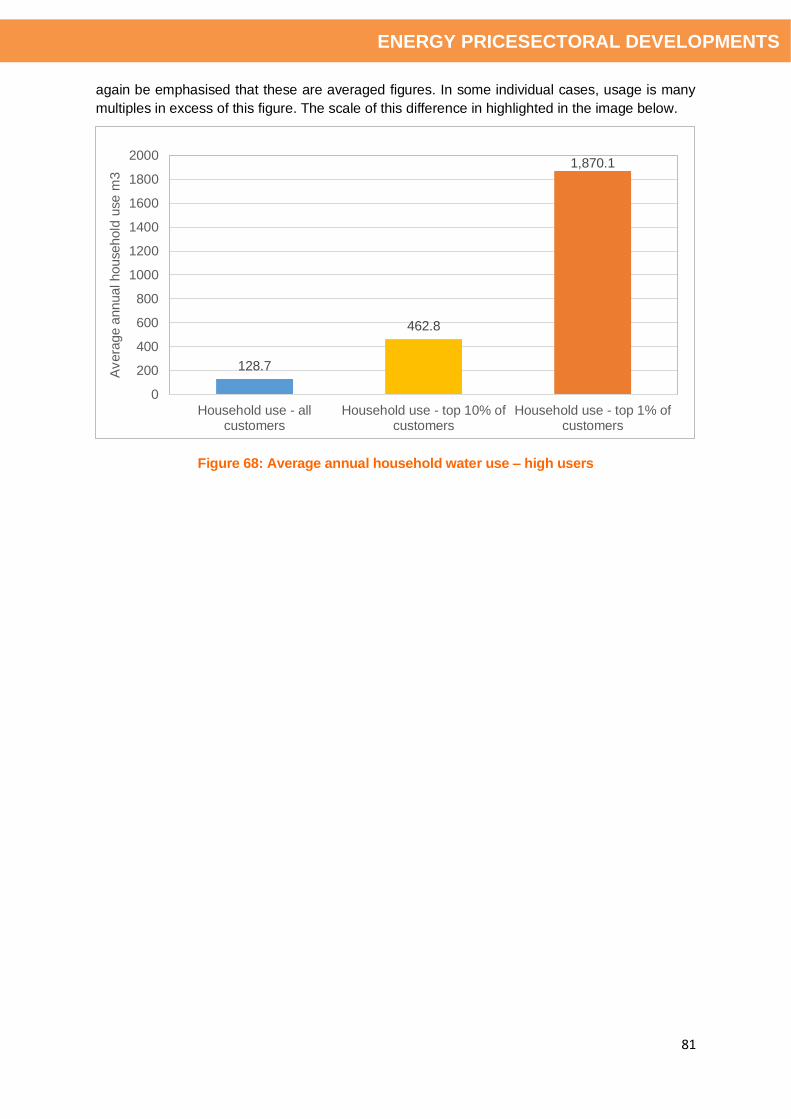
81
ENERGY PRICESECTORAL DEVELOPMENTS
again be emphasised that these are averaged figures. In some individual cases, usage is many
multiples in excess of this figure. The scale of this difference in highlighted in the image below.
Figure 68: Average annual household water use – high users
128.7
462.8
1,870.1
0
200
400
600
800
1000
1200
1400
1600
1800
2000
Household use - allcustomers
Household use - top 10% ofcustomers
Household use - top 1% ofcustomers
Avera
ge a
nnual household
use m
3
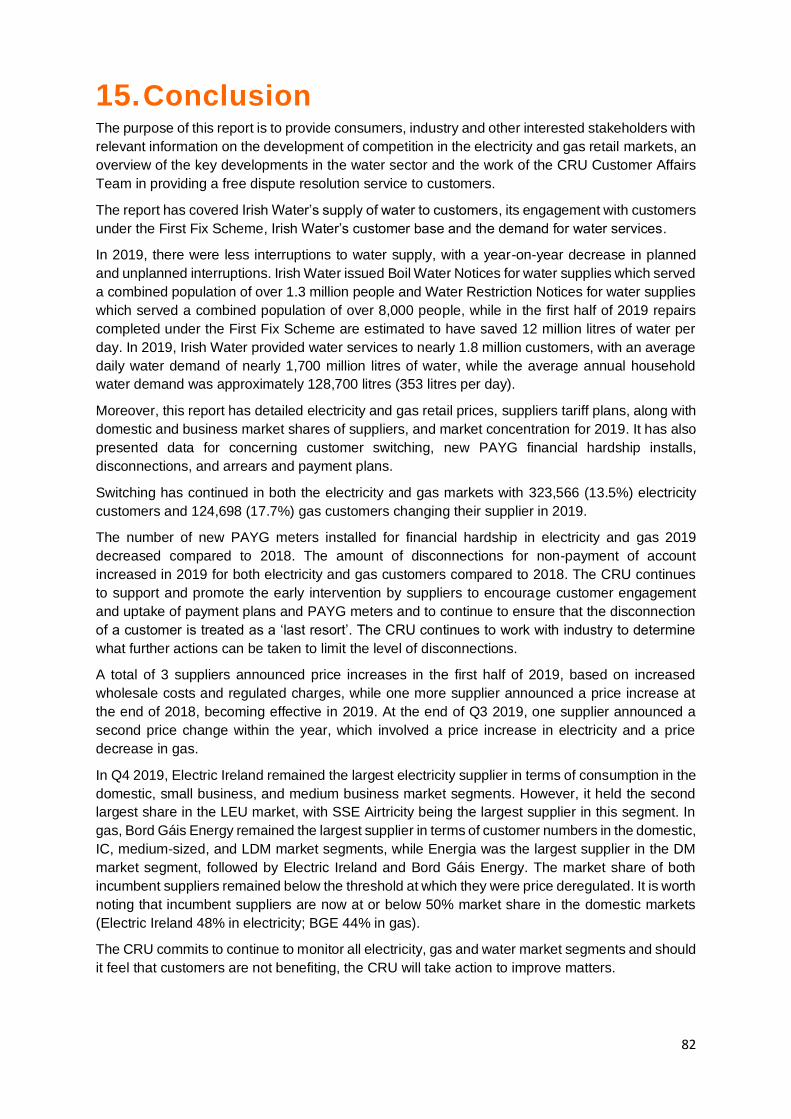
82
15. Conclusion The purpose of this report is to provide consumers, industry and other interested stakeholders with
relevant information on the development of competition in the electricity and gas retail markets, an
overview of the key developments in the water sector and the work of the CRU Customer Affairs
Team in providing a free dispute resolution service to customers.
The report has covered Irish Water’s supply of water to customers, its engagement with customers
under the First Fix Scheme, Irish Water’s customer base and the demand for water services.
In 2019, there were less interruptions to water supply, with a year-on-year decrease in planned
and unplanned interruptions. Irish Water issued Boil Water Notices for water supplies which served
a combined population of over 1.3 million people and Water Restriction Notices for water supplies
which served a combined population of over 8,000 people, while in the first half of 2019 repairs
completed under the First Fix Scheme are estimated to have saved 12 million litres of water per
day. In 2019, Irish Water provided water services to nearly 1.8 million customers, with an average
daily water demand of nearly 1,700 million litres of water, while the average annual household
water demand was approximately 128,700 litres (353 litres per day).
Moreover, this report has detailed electricity and gas retail prices, suppliers tariff plans, along with
domestic and business market shares of suppliers, and market concentration for 2019. It has also
presented data for concerning customer switching, new PAYG financial hardship installs,
disconnections, and arrears and payment plans.
Switching has continued in both the electricity and gas markets with 323,566 (13.5%) electricity
customers and 124,698 (17.7%) gas customers changing their supplier in 2019.
The number of new PAYG meters installed for financial hardship in electricity and gas 2019
decreased compared to 2018. The amount of disconnections for non-payment of account
increased in 2019 for both electricity and gas customers compared to 2018. The CRU continues
to support and promote the early intervention by suppliers to encourage customer engagement
and uptake of payment plans and PAYG meters and to continue to ensure that the disconnection
of a customer is treated as a ‘last resort’. The CRU continues to work with industry to determine
what further actions can be taken to limit the level of disconnections.
A total of 3 suppliers announced price increases in the first half of 2019, based on increased
wholesale costs and regulated charges, while one more supplier announced a price increase at
the end of 2018, becoming effective in 2019. At the end of Q3 2019, one supplier announced a
second price change within the year, which involved a price increase in electricity and a price
decrease in gas.
In Q4 2019, Electric Ireland remained the largest electricity supplier in terms of consumption in the
domestic, small business, and medium business market segments. However, it held the second
largest share in the LEU market, with SSE Airtricity being the largest supplier in this segment. In
gas, Bord Gáis Energy remained the largest supplier in terms of customer numbers in the domestic,
IC, medium-sized, and LDM market segments, while Energia was the largest supplier in the DM
market segment, followed by Electric Ireland and Bord Gáis Energy. The market share of both
incumbent suppliers remained below the threshold at which they were price deregulated. It is worth
noting that incumbent suppliers are now at or below 50% market share in the domestic markets
(Electric Ireland 48% in electricity; BGE 44% in gas).
The CRU commits to continue to monitor all electricity, gas and water market segments and should
it feel that customers are not benefiting, the CRU will take action to improve matters.
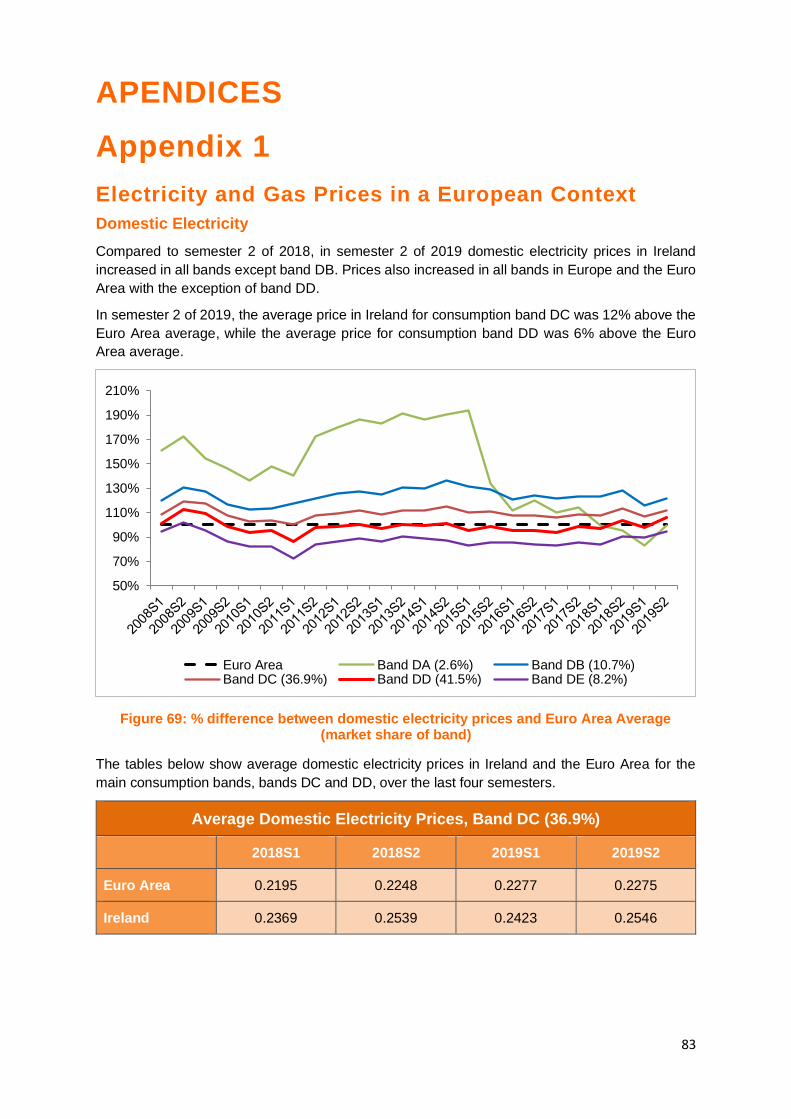
83
APENDICES
Appendix 1
Electricity and Gas Prices in a European Context
Domestic Electricity
Compared to semester 2 of 2018, in semester 2 of 2019 domestic electricity prices in Ireland
increased in all bands except band DB. Prices also increased in all bands in Europe and the Euro
Area with the exception of band DD.
In semester 2 of 2019, the average price in Ireland for consumption band DC was 12% above the
Euro Area average, while the average price for consumption band DD was 6% above the Euro
Area average.
Figure 69: % difference between domestic electricity prices and Euro Area Average (market share of band)
The tables below show average domestic electricity prices in Ireland and the Euro Area for the
main consumption bands, bands DC and DD, over the last four semesters.
Average Domestic Electricity Prices, Band DC (36.9%)
2018S1 2018S2 2019S1 2019S2
Euro Area 0.2195 0.2248 0.2277 0.2275
Ireland 0.2369 0.2539 0.2423 0.2546
50%
70%
90%
110%
130%
150%
170%
190%
210%
Euro Area Band DA (2.6%) Band DB (10.7%)Band DC (36.9%) Band DD (41.5%) Band DE (8.2%)

84
Average Domestic Electricity Prices, Band DD (41.5%)
2018S1 2018S2 2019S1 2019S2
Euro Area 0.2023 0.2085 0.2101 0.2084
Ireland 0.1958 0.2157 0.2062 0.2209
Domestic Gas
Compared to semester 2 of 2018, in semester 2 of 2019 domestic gas prices in Ireland decreased
in band D1 and increased in bands D2 and D3. Prices also increased in band D2 the Euro Area
but decreased in bands D1 and D3.
In semester 2 of 2019, the average price in Ireland was 12% above the EU average and 2% below
the Euro Area average.
Figure 70: % difference between domestic gas prices and Euro Area Average (market
share of band)
The table below shows average domestic gas prices in Ireland and the Euro Area for consumption
band D2 over the last four semesters.
Average Domestic Gas Prices, Band D2 (91.7%)
2018S1 2018S2 2019S1 2019S2
Euro Area 0.0660 0.0755 0.0709 0.0770
Ireland 0.0632 0.0761 0.0683 0.0764
50%
60%
70%
80%
90%
100%
110%
EU 28 Band D1 (4.9%) Band D2 (91.7%) Band D3 (3.4%)
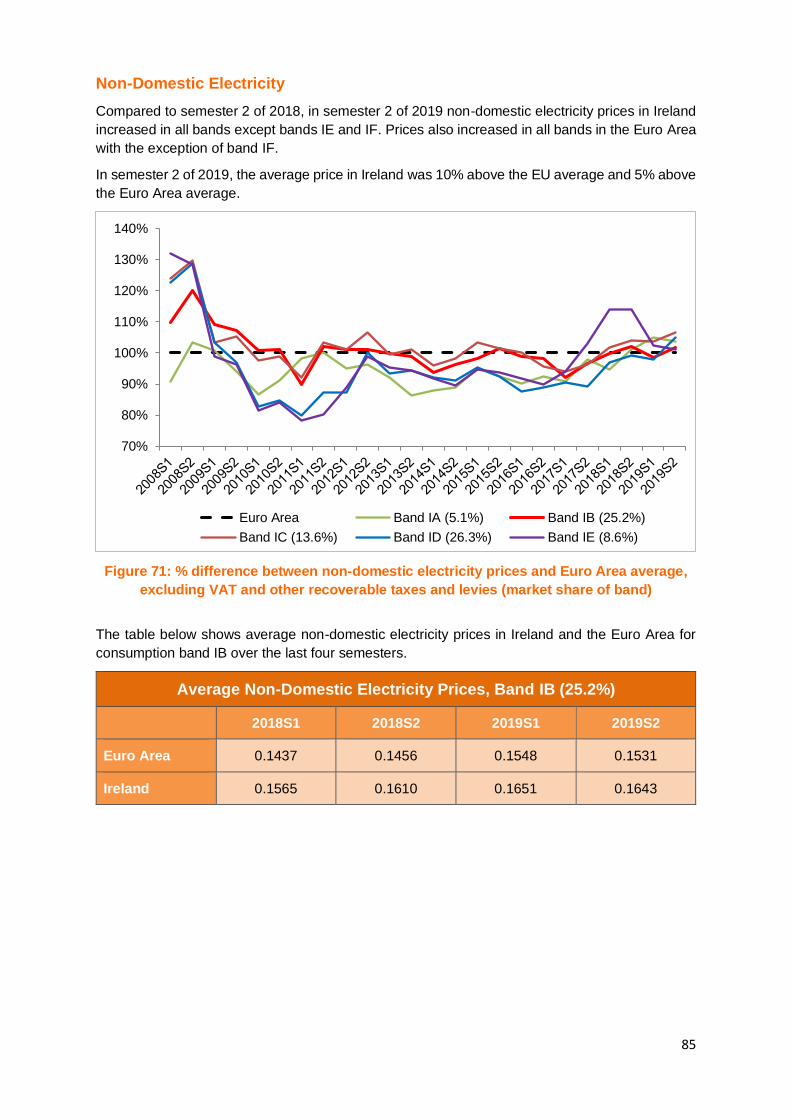
85
Non-Domestic Electricity
Compared to semester 2 of 2018, in semester 2 of 2019 non-domestic electricity prices in Ireland
increased in all bands except bands IE and IF. Prices also increased in all bands in the Euro Area
with the exception of band IF.
In semester 2 of 2019, the average price in Ireland was 10% above the EU average and 5% above
the Euro Area average.
Figure 71: % difference between non-domestic electricity prices and Euro Area average,
excluding VAT and other recoverable taxes and levies (market share of band)
The table below shows average non-domestic electricity prices in Ireland and the Euro Area for
consumption band IB over the last four semesters.
Average Non-Domestic Electricity Prices, Band IB (25.2%)
2018S1 2018S2 2019S1 2019S2
Euro Area 0.1437 0.1456 0.1548 0.1531
Ireland 0.1565 0.1610 0.1651 0.1643
70%
80%
90%
100%
110%
120%
130%
140%
Euro Area Band IA (5.1%) Band IB (25.2%)
Band IC (13.6%) Band ID (26.3%) Band IE (8.6%)

86
Non-Domestic Gas
Compared to semester 2 of 2018, in semester 2 of 2019 non-domestic gas prices in Ireland
decreased in all bands except band I4. Prices also decreased in all bands in the Euro Area with
the exception of band I1.
In semester 2 of 2019, the average price in Ireland was 5% above the EU average and 1% below
the Euro Area average. The average price in Ireland for consumption band I4 was 1% above the
EU average and equal to the Euro Area average.
Figure 72: % difference between non-domestic gas prices and Euro Area average,
excluding VAT and other recoverable taxes and levies (market share of band)
The table below shows average non-domestic gas prices in Ireland and the Euro Area for
consumption band I4 over the last four semesters.
Average Non-Domestic Gas Prices, Band I4 (33.5%)
2018S1 2018S2 2019S1 2019S2
Euro Area 0.0317 0.0320 0.0336 0.0308
Ireland 0.0342 0.0388 0.0342 0.0322
70%
75%
80%
85%
90%
95%
100%
105%
110%
115%
120%
Euro Area Band I1 (9.7%) Band I2 (17.7%)
Band I3 (23.5%) Band I4 (33.5%)
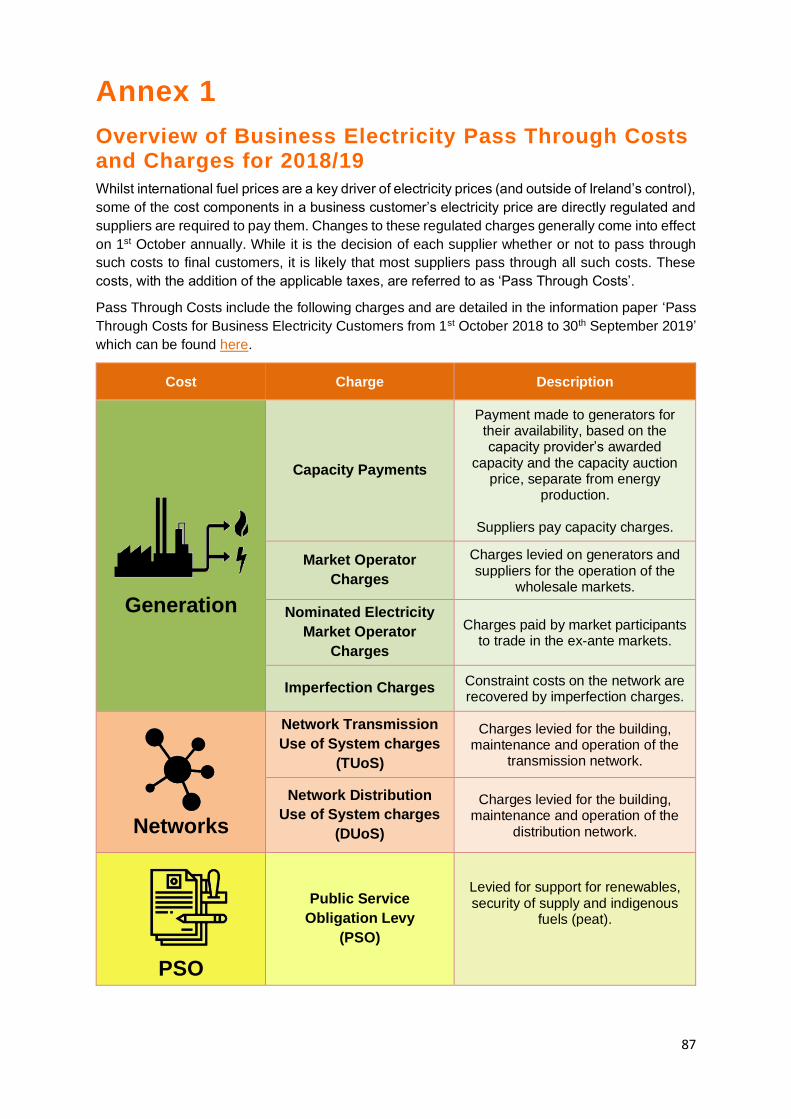
87
Annex 1
Overview of Business Electricity Pass Through Costs and Charges for 2018/19
Whilst international fuel prices are a key driver of electricity prices (and outside of Ireland’s control),
some of the cost components in a business customer’s electricity price are directly regulated and
suppliers are required to pay them. Changes to these regulated charges generally come into effect
on 1st October annually. While it is the decision of each supplier whether or not to pass through
such costs to final customers, it is likely that most suppliers pass through all such costs. These
costs, with the addition of the applicable taxes, are referred to as ‘Pass Through Costs’.
Pass Through Costs include the following charges and are detailed in the information paper ‘Pass
Through Costs for Business Electricity Customers from 1st October 2018 to 30th September 2019’
which can be found here.
Cost Charge Description
Generation
Capacity Payments
Payment made to generators for their availability, based on the capacity provider’s awarded
capacity and the capacity auction price, separate from energy
production.
Suppliers pay capacity charges.
Market Operator
Charges
Charges levied on generators and suppliers for the operation of the
wholesale markets.
Nominated Electricity
Market Operator
Charges
Charges paid by market participants to trade in the ex-ante markets.
Imperfection Charges Constraint costs on the network are recovered by imperfection charges.
Networks
Network Transmission
Use of System charges
(TUoS)
Charges levied for the building, maintenance and operation of the
transmission network.
Network Distribution
Use of System charges
(DUoS)
Charges levied for the building, maintenance and operation of the
distribution network.
PSO
Public Service
Obligation Levy
(PSO)
Levied for support for renewables, security of supply and indigenous
fuels (peat).
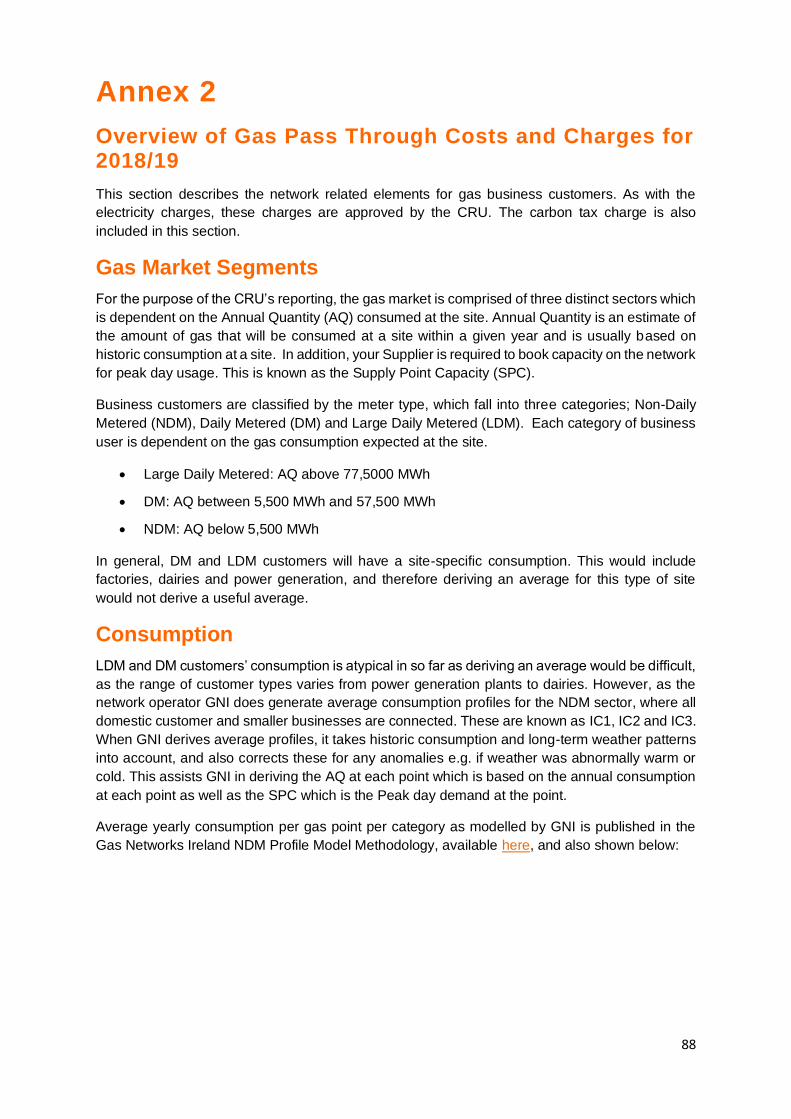
88
Annex 2
Overview of Gas Pass Through Costs and Charges for 2018/19
This section describes the network related elements for gas business customers. As with the
electricity charges, these charges are approved by the CRU. The carbon tax charge is also
included in this section.
Gas Market Segments
For the purpose of the CRU’s reporting, the gas market is comprised of three distinct sectors which
is dependent on the Annual Quantity (AQ) consumed at the site. Annual Quantity is an estimate of
the amount of gas that will be consumed at a site within a given year and is usually based on
historic consumption at a site. In addition, your Supplier is required to book capacity on the network
for peak day usage. This is known as the Supply Point Capacity (SPC).
Business customers are classified by the meter type, which fall into three categories; Non-Daily
Metered (NDM), Daily Metered (DM) and Large Daily Metered (LDM). Each category of business
user is dependent on the gas consumption expected at the site.
• Large Daily Metered: AQ above 77,5000 MWh
• DM: AQ between 5,500 MWh and 57,500 MWh
• NDM: AQ below 5,500 MWh
In general, DM and LDM customers will have a site-specific consumption. This would include
factories, dairies and power generation, and therefore deriving an average for this type of site
would not derive a useful average.
Consumption
LDM and DM customers’ consumption is atypical in so far as deriving an average would be difficult,
as the range of customer types varies from power generation plants to dairies. However, as the
network operator GNI does generate average consumption profiles for the NDM sector, where all
domestic customer and smaller businesses are connected. These are known as IC1, IC2 and IC3.
When GNI derives average profiles, it takes historic consumption and long-term weather patterns
into account, and also corrects these for any anomalies e.g. if weather was abnormally warm or
cold. This assists GNI in deriving the AQ at each point which is based on the annual consumption
at each point as well as the SPC which is the Peak day demand at the point.
Average yearly consumption per gas point per category as modelled by GNI is published in the
Gas Networks Ireland NDM Profile Model Methodology, available here, and also shown below:
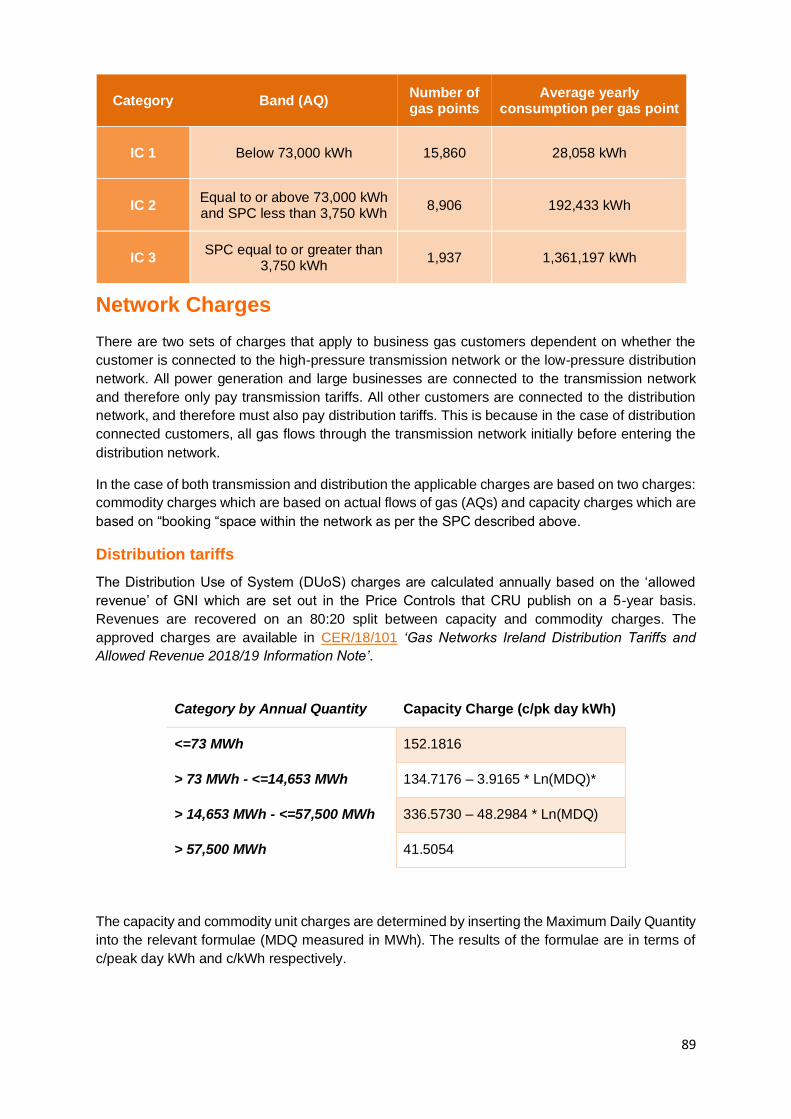
89
Category Band (AQ) Number of gas points
Average yearly consumption per gas point
IC 1 Below 73,000 kWh 15,860 28,058 kWh
IC 2 Equal to or above 73,000 kWh and SPC less than 3,750 kWh
8,906 192,433 kWh
IC 3 SPC equal to or greater than
3,750 kWh 1,937 1,361,197 kWh
Network Charges
There are two sets of charges that apply to business gas customers dependent on whether the
customer is connected to the high-pressure transmission network or the low-pressure distribution
network. All power generation and large businesses are connected to the transmission network
and therefore only pay transmission tariffs. All other customers are connected to the distribution
network, and therefore must also pay distribution tariffs. This is because in the case of distribution
connected customers, all gas flows through the transmission network initially before entering the
distribution network.
In the case of both transmission and distribution the applicable charges are based on two charges:
commodity charges which are based on actual flows of gas (AQs) and capacity charges which are
based on “booking “space within the network as per the SPC described above.
Distribution tariffs
The Distribution Use of System (DUoS) charges are calculated annually based on the ‘allowed
revenue’ of GNI which are set out in the Price Controls that CRU publish on a 5-year basis.
Revenues are recovered on an 80:20 split between capacity and commodity charges. The
approved charges are available in CER/18/101 ‘Gas Networks Ireland Distribution Tariffs and
Allowed Revenue 2018/19 Information Note’.
Category by Annual Quantity Capacity Charge (c/pk day kWh)
<=73 MWh 152.1816
> 73 MWh - <=14,653 MWh 134.7176 – 3.9165 * Ln(MDQ)*
> 14,653 MWh - <=57,500 MWh 336.5730 – 48.2984 * Ln(MDQ)
> 57,500 MWh 41.5054
The capacity and commodity unit charges are determined by inserting the Maximum Daily Quantity
into the relevant formulae (MDQ measured in MWh). The results of the formulae are in terms of
c/peak day kWh and c/kWh respectively.

90
Category by Annual Quantity Commodity Charge (c/kWh)
<=73 MWh 0.3318
> 73 MWh - <=14,653 MWh 0.2650 - 0.0258 * Ln(MDQ)
> 14,653 MWh - <=57,500 MWh 0.3088 - 0.0407 * Ln(MDQ)
> 57,500 MWh 0.0604
GNI has a distribution tariff calculator which allows you to input your distribution entry and/or exit
point requirements which will be used to calculate the applicable distribution tariff.
Transmission tariffs
Tariffs for the transmission system are based on an entry-exit regime. This means that customers
pay for putting gas onto the system and for off taking gas from the system. Similar to the distribution
system, these charges recover the allowed revenues for GNI.
The transmission system has three entry points; Moffat in Scotland where the GNI system joins
the UK gas system, Inch in Cork and Bellanaboy where Corrib gas enters the network. For each
of these there is an entry capacity tariff applicable. In addition, there is a single commodity charge
(per MWh) that applies regardless of the entry point.
In addition, there is a capacity and commodity charge for exiting the network. The same charge
applies regardless of where gas is taken off the network. The approved charges are available in
CER/18/102 ‘Gas Networks Ireland Transmission Tariffs and Allowed Revenue 2018/19’
Information Paper and are also set out below:
Moffat entry capacity €325.979
Inch entry capacity €53.027 (storage entry)
€123.452 (production entry)
Bellanaboy entry capacity €630.428
Entry Commodity €0.113
Exit Capacity €389.884
Exit Commodity €0.235
To calculate the cost on a per customer basis, similar to the distribution network, the capacity
booked and the commodity i.e. flow must be known. The capacity tariffs above are based on an
annual product which means that for each MWh of capacity booked, the customer can use that
amount each day of the tariff year which runs from October to September. In addition, customers
can purchase a short-term product which is capacity booked for a specific period of time. These
short-term capacity products are available as Quarterly, Monthly, Daily and Within Day products.
The charges for each of these products is based on a multiplier to the annual product. The decision
to purchase either an annual or a short-term product is usually dependent on the typical
consumption profile of a particular customer.

91
In addition, commodity charges apply on a per MWh basis. These are flow based and vary from
customer to customer.
The transmission calculator allows you to input your transmission entry and/or exit point
requirements which will be used to calculate the applicable transmission tariff.
Carbon tax
Since 1 May 2012 the rate of carbon tax has been €0.0037 per kWh. This is subject to VAT of
13.5%, making a total of €0.0042 per kWh. All-natural gas suppliers in Ireland have to levy the
carbon tax on their customers. Some natural gas customers are exempt from paying carbon tax.
These include:
• Natural gas consumers who use it for the purpose of generating electricity.
• Natural gas manufacturer consumers, where it is used for the purpose of chemical
reduction.
• Natural gas manufacturing customers where it is used in electrolytic or metallurgical
processes.
Partial exemptions from paying carbon tax apply to:
• Suppliers dealing with the cogeneration of environmentally friendly heat and power, as
decided by the Minister for Finance.
• Industrial and manufacturer consumers covered by a greenhouse gas emissions permit
that has been issued by the Environmental Protection Agency.