commission on innovation and excellence in...
TRANSCRIPT
Commission on Innovation and Excellence in Education William E. Kirwan, Chair
Agenda
June 28, 2017 9:30 a.m.-5:00 p.m.
120 House Office Building, Annapolis, Maryland
9:30 a.m. Chair’s Opening Remarks
9:40 a.m. Efforts to Improve the Teaching Profession (from April meeting)
• Jack R. Smith, Superintendent, Montgomery County Public Schools• Nancy Shapiro, Associate Vice Chancellor, University System of Maryland• Zachary Levine, Executive Director, TEACH.org
10:45 a.m. How Maryland Compares to Top Performing Systems – Element 2, Building Blocks 3 & 4 – World Class Instructional System and Clear Gateways Set to Global Standards with No Dead Ends
• Marc Tucker and Betsy Brown Ruzzi, National Center on Education and theEconomy (NCEE)
Commission Discussion of Building Blocks 3 & 4 Gap Analysis and Q&A
12:15 p.m. Break – Lunch Provided for Commissioners and Staff in Room 170/180
12:45 p.m. Breakout Group Discussions about Building Blocks 3 & 4 (see separate handouts for group assignments and discussion questions)
1:45 p.m. Breakout Group Report Out (5-10 minutes each) and Commission Discussion
2:30 p.m. Maryland School Case Studies from the APA Adequacy Study
• Gail Sunderman, Maryland Equity Project, University of Maryland,College Park Campus
• Karen Blannard, Community Superintendent, Baltimore County PublicSchools
• Missy Beltran, Principal, Chadwick Elementary School• Brandy Brady, Principal, Somerset Intermediate School• Tracie Bartemy, Director of Schools, Somerset County Public Schools
3:30 p.m. How Maryland Compares in U.S. on Student Achievement and Funding
• Matthew Chingos, Urban Institute
4:30 p.m. Public Comment
4:45 p.m. Chair’s Closing Remarks and Adjournment
Next Meeting: Wednesday, July 26, 2017, 9:30 a.m.-5:00 p.m., Room 120 HOB
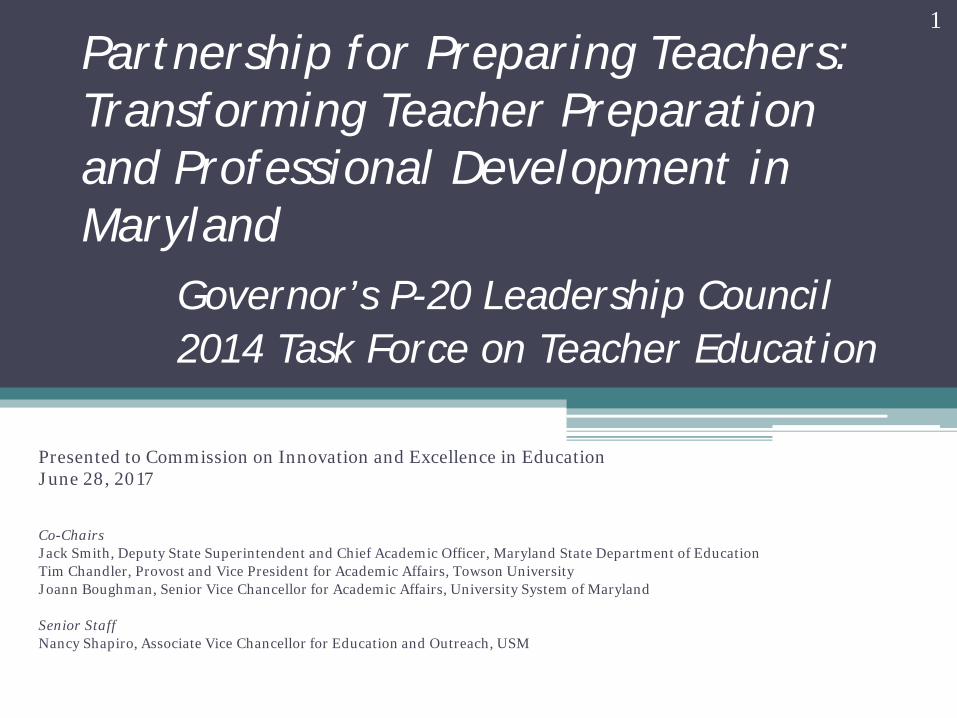
Partnership for Preparing Teachers: Transforming Teacher Preparation and Professional Development in Maryland
Governor’s P-20 Leadership Council 2014 Task Force on Teacher Education
Presented to Commission on Innovation and Excellence in EducationJune 28, 2017
Co-ChairsJack Smith, Deputy State Superintendent and Chief Academic Officer, Maryland State Department of EducationTim Chandler, Provost and Vice President for Academic Affairs, Towson UniversityJoann Boughman, Senior Vice Chancellor for Academic Affairs, University System of Maryland
Senior StaffNancy Shapiro, Associate Vice Chancellor for Education and Outreach, USM
1
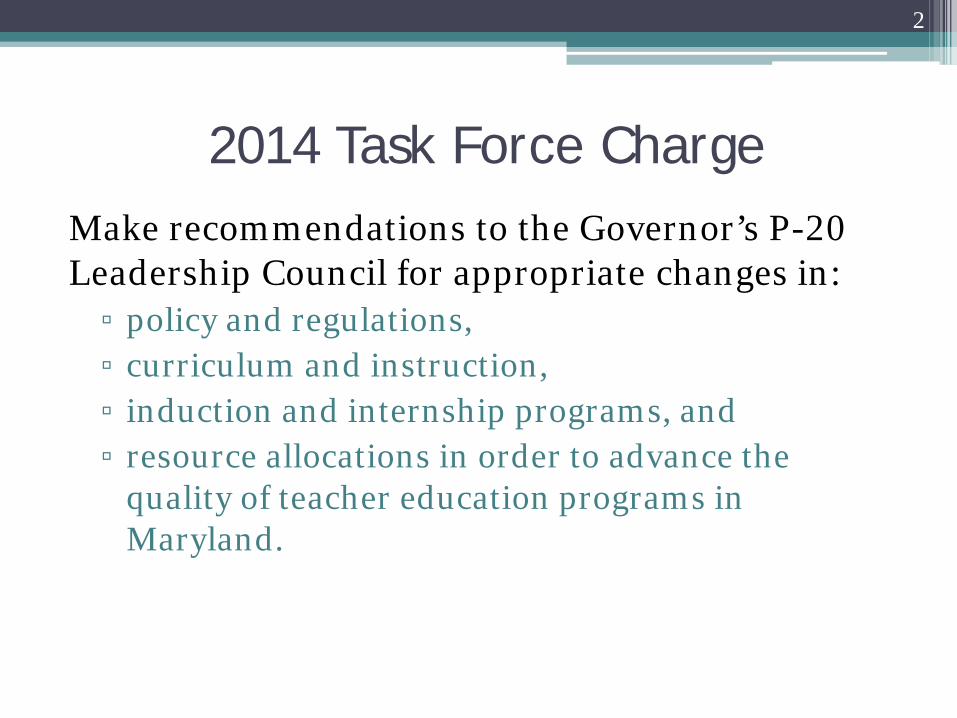
2014 Task Force ChargeMake recommendations to the Governor’s P-20 Leadership Council for appropriate changes in: ▫ policy and regulations, ▫ curriculum and instruction, ▫ induction and internship programs, and ▫ resource allocations in order to advance the
quality of teacher education programs in Maryland.
2
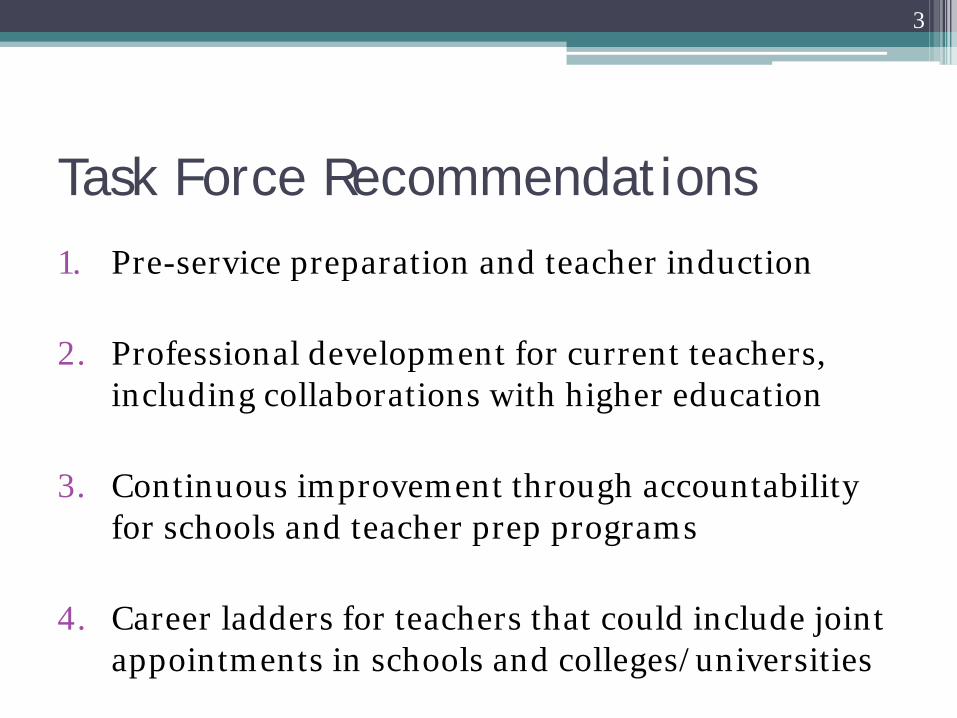
Task Force Recommendations1. Pre-service preparation and teacher induction
2. Professional development for current teachers, including collaborations with higher education
3. Continuous improvement through accountability for schools and teacher prep programs
4. Career ladders for teachers that could include joint appointments in schools and colleges/universities
3
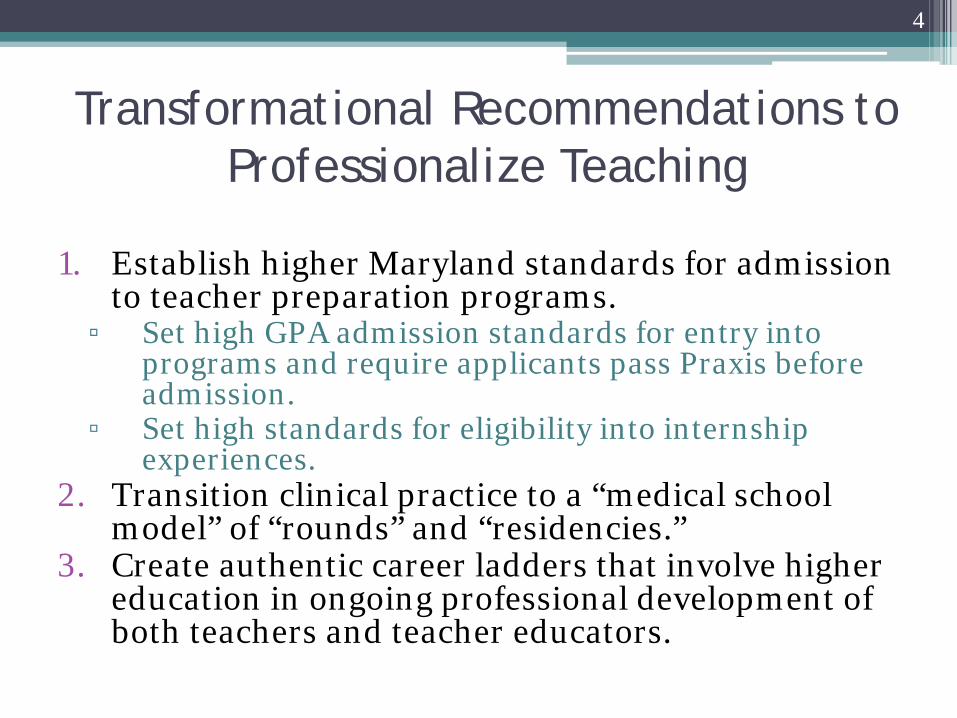
Transformational Recommendations to Professionalize Teaching
1. Establish higher Maryland standards for admission to teacher preparation programs.
▫ Set high GPA admission standards for entry into programs and require applicants pass Praxis before admission.
▫ Set high standards for eligibility into internship experiences.
2. Transition clinical practice to a “medical school model” of “rounds” and “residencies.”
3. Create authentic career ladders that involve higher education in ongoing professional development of both teachers and teacher educators.
4
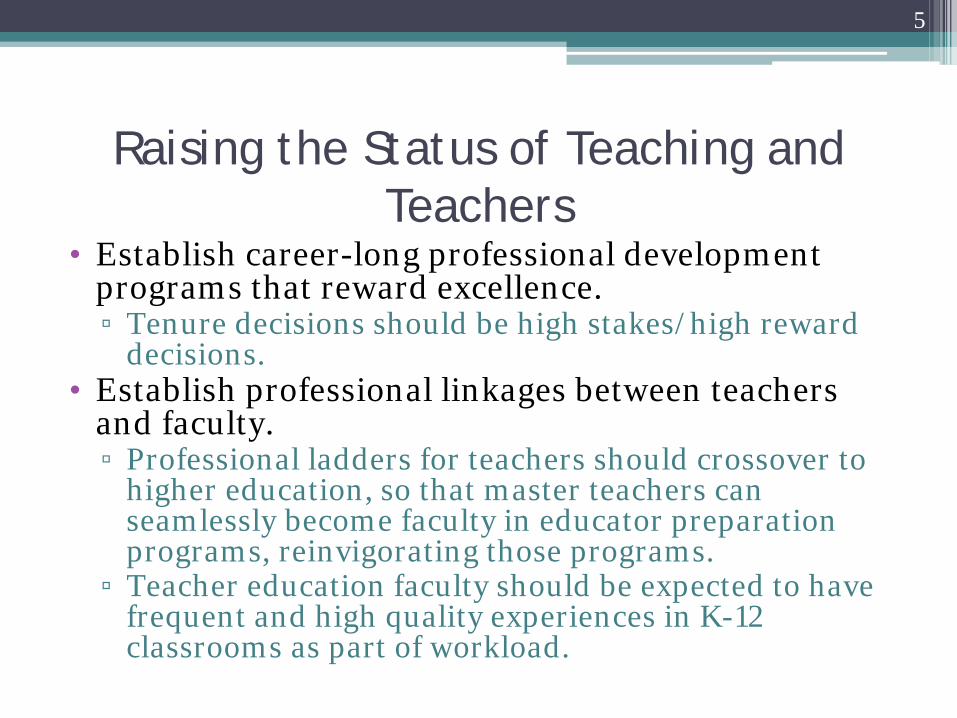
Raising the Status of Teaching and Teachers
• Establish career-long professional development programs that reward excellence.▫ Tenure decisions should be high stakes/high reward
decisions.• Establish professional linkages between teachers
and faculty.▫ Professional ladders for teachers should crossover to
higher education, so that master teachers can seamlessly become faculty in educator preparation programs, reinvigorating those programs.
▫ Teacher education faculty should be expected to have frequent and high quality experiences in K-12 classrooms as part of workload.
5

“Putting Our Money Where Our Mouth Is”
1. Establish collaboratively-supported Teaching Innovation Centers, assigning shared responsibility and fiscal support to LEAs and Higher ed.
2. Fund Centers with state “seed” money and, subsequently, with savings from reduced teacher attrition.
6
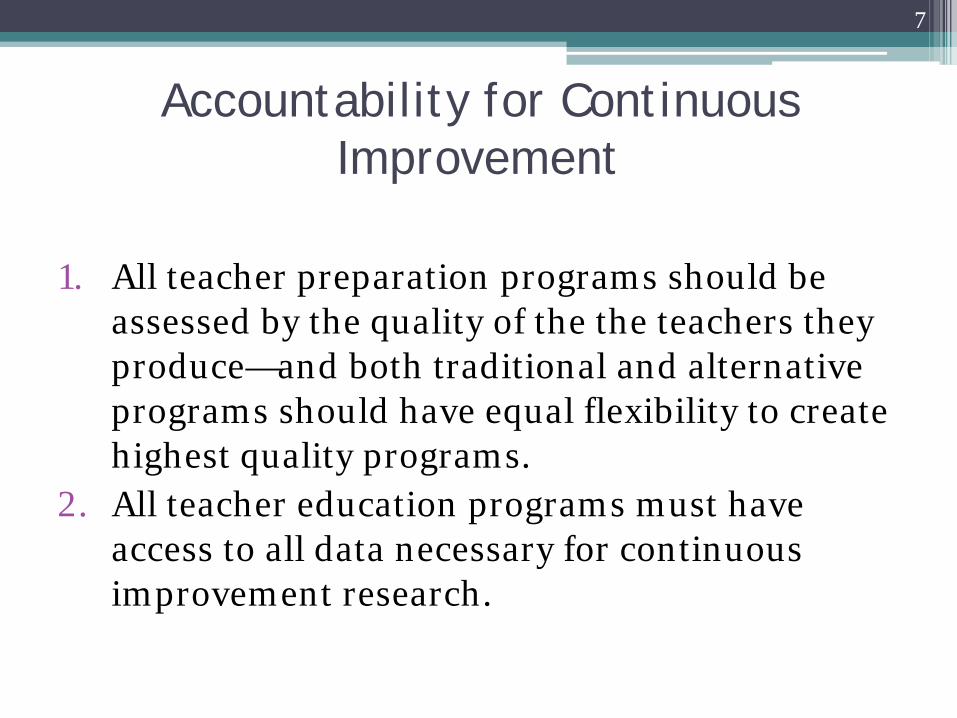
Accountability for Continuous Improvement
1. All teacher preparation programs should be assessed by the quality of the the teachers they produce—and both traditional and alternative programs should have equal flexibility to create highest quality programs.
2. All teacher education programs must have access to all data necessary for continuous improvement research.
7
Subsequent work related to P-20 recommendations
• Chapter 740 (SB 493) Teacher Induction, Retention, and Advancement Act of 2016. Statute required MSDE to establish a workgroup and submit interim and final reports to the governor (11/16; 12/17; 12/21)
• TIRA workgroup established 6/16, chaired by Sarah Spross, MSDE.
• ESSA plan under development at MSDE• Kirwan Commission in deliberation
8
TIRA Workgroup 2016-present• 2016: Committees were created: ▫ Recruitment▫ Preparation▫ Induction▫ Retention▫ CAEP (National Accreditation)
• 2017: Committees were reorganized: ▫ Certification▫ Quality Teacher Incentives▫ Professional Development, Induction and Mentoring▫ Institutional Performance Criteria (State program
approval vs. national accreditation)
9

Questions/Discussion
Contact:
Nancy ShapiroAssociate Vice Chancellor,
Education Policy and OutreachUniversity System of Maryland
[email protected](301) 445-2797
10
“Ensure a High Quality Pool through Modernized Teacher
Recruitment”
Presentation to Maryland Commission on Innovation and Excellence in
Education
Zachary LevineExecutive Director, TEACH.org
June 28, 2017
Rebranding teaching and rethinking recruitment
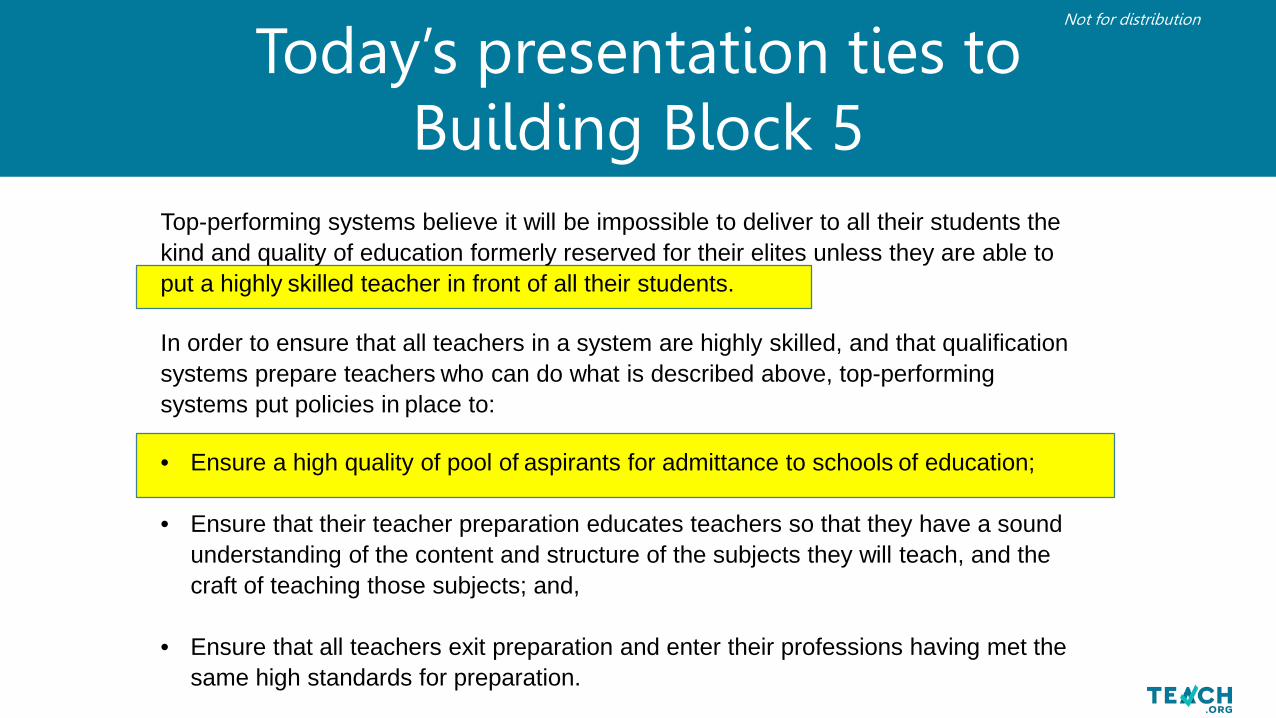
Today’s presentation ties to Building Block 5
Not for distribution
Top-performing systems believe it will be impossible to deliver to all their students the kind and quality of education formerly reserved for their elites unless they are able to put a highly skilled teacher in front of all their students.
In order to ensure that all teachers in a system are highly skilled, and that qualification systems prepare teachers who can do what is described above, top-performing systems put policies in place to:
• Ensure a high quality of pool of aspirants for admittance to schools of education;
• Ensure that their teacher preparation educates teachers so that they have a sound understanding of the content and structure of the subjects they will teach, and the craft of teaching those subjects; and,
• Ensure that all teachers exit preparation and enter their professions having met the same high standards for preparation.
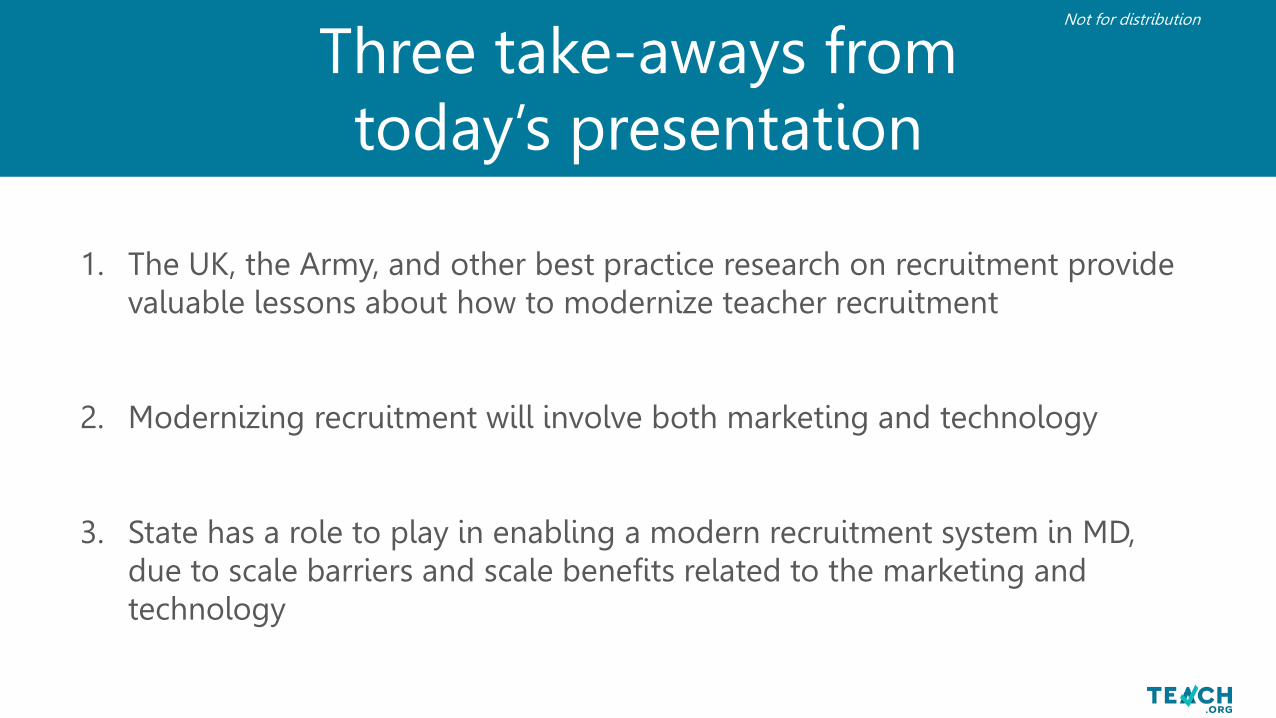
Three take-aways from today’s presentation
1. The UK, the Army, and other best practice research on recruitment provide valuable lessons about how to modernize teacher recruitment
2. Modernizing recruitment will involve both marketing and technology
3. State has a role to play in enabling a modern recruitment system in MD, due to scale barriers and scale benefits related to the marketing and technology
Not for distribution
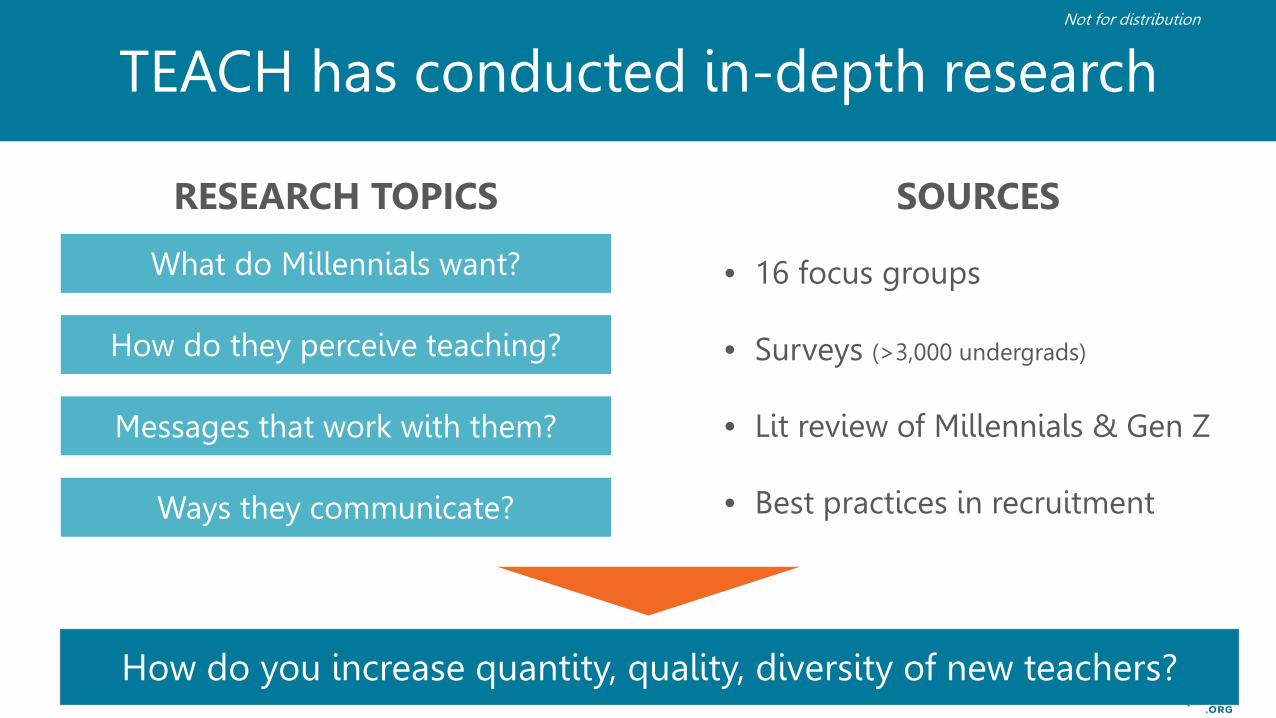
TEACH has conducted in-depth research
• 16 focus groups
• Surveys (>3,000 undergrads)
• Lit review of Millennials & Gen Z
• Best practices in recruitment
What do Millennials want?
How do they perceive teaching?
Messages that work with them?
Ways they communicate?
RESEARCH TOPICS SOURCES
How do you increase quantity, quality, diversity of new teachers?
Not for distribution
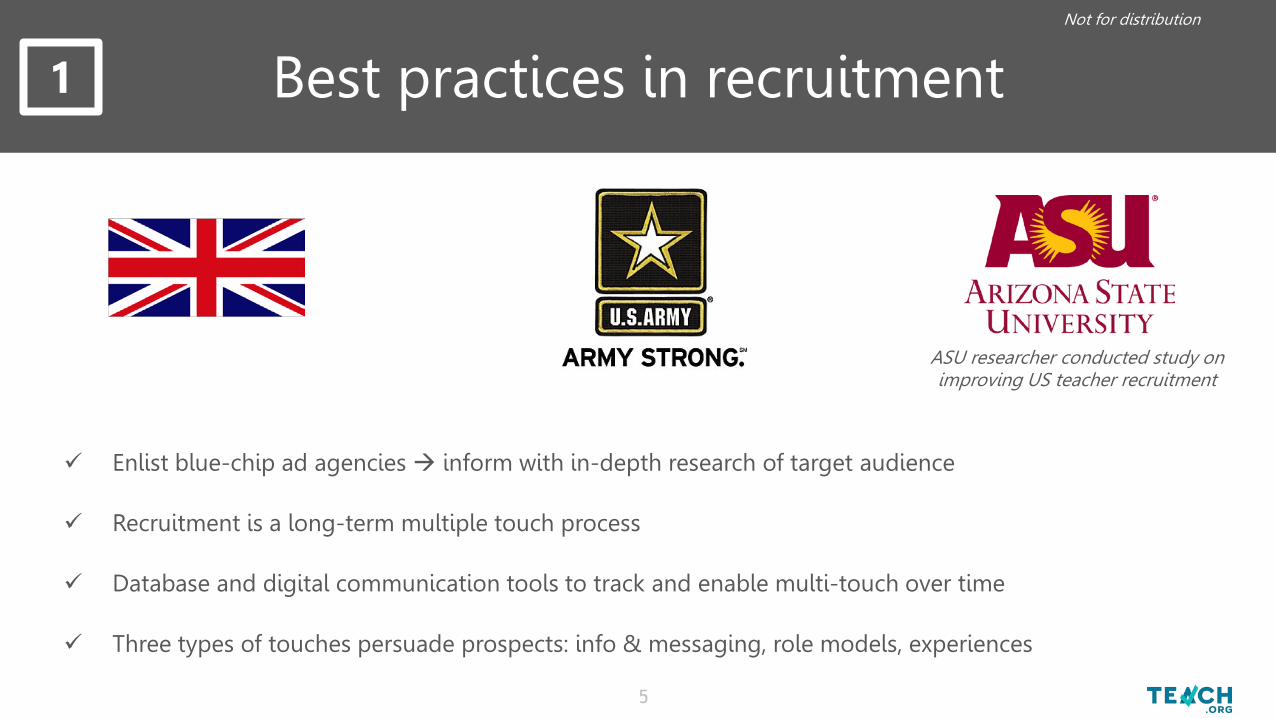
Best practices in recruitment
Enlist blue-chip ad agencies inform with in-depth research of target audience
Recruitment is a long-term multiple touch process
Database and digital communication tools to track and enable multi-touch over time
Three types of touches persuade prospects: info & messaging, role models, experiences
ASU researcher conducted study on improving US teacher recruitment
1
Not for distribution
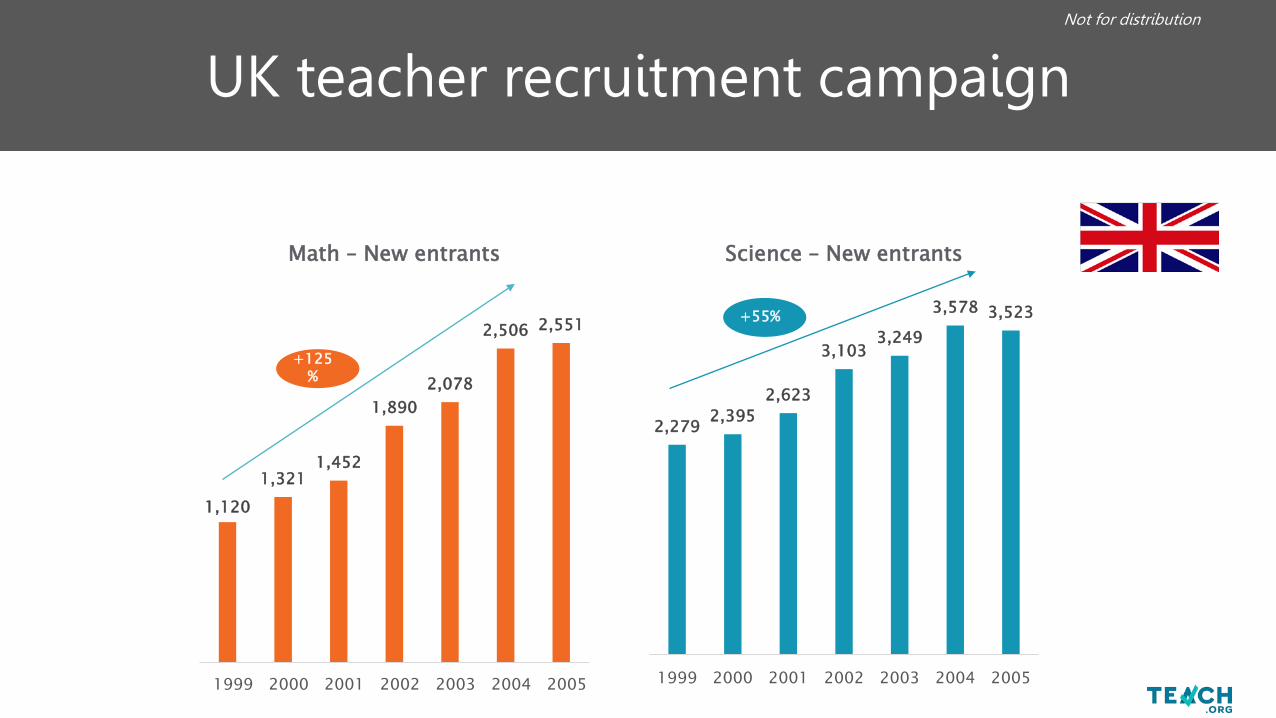
1,1201,321
1,452
1,8902,078
2,506 2,551
1999 2000 2001 2002 2003 2004 2005
Math – New entrants
2,279 2,3952,623
3,1033,249
3,578 3,523
1999 2000 2001 2002 2003 2004 2005
Science – New entrants
+125%
+55%
UK teacher recruitment campaign Not for distribution
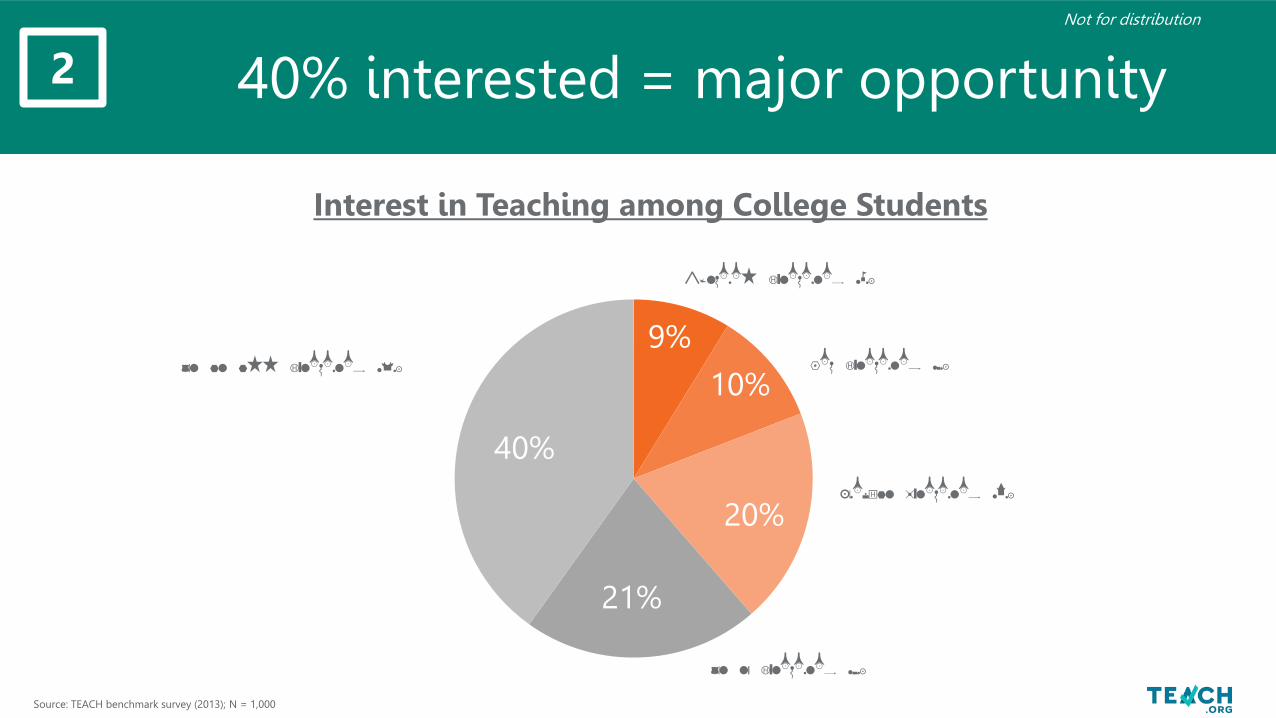
9%
10%
20%
21%
40%
7
Source: TEACH benchmark survey (2013); N = 1,000
Extremely interested (5s)
Very interested (4s)
Somewhat Interested (3s)
Not too interested (2s)
Not at all interested (1s)
40% interested = major opportunity
Interest in Teaching among College Students
2Not for distribution
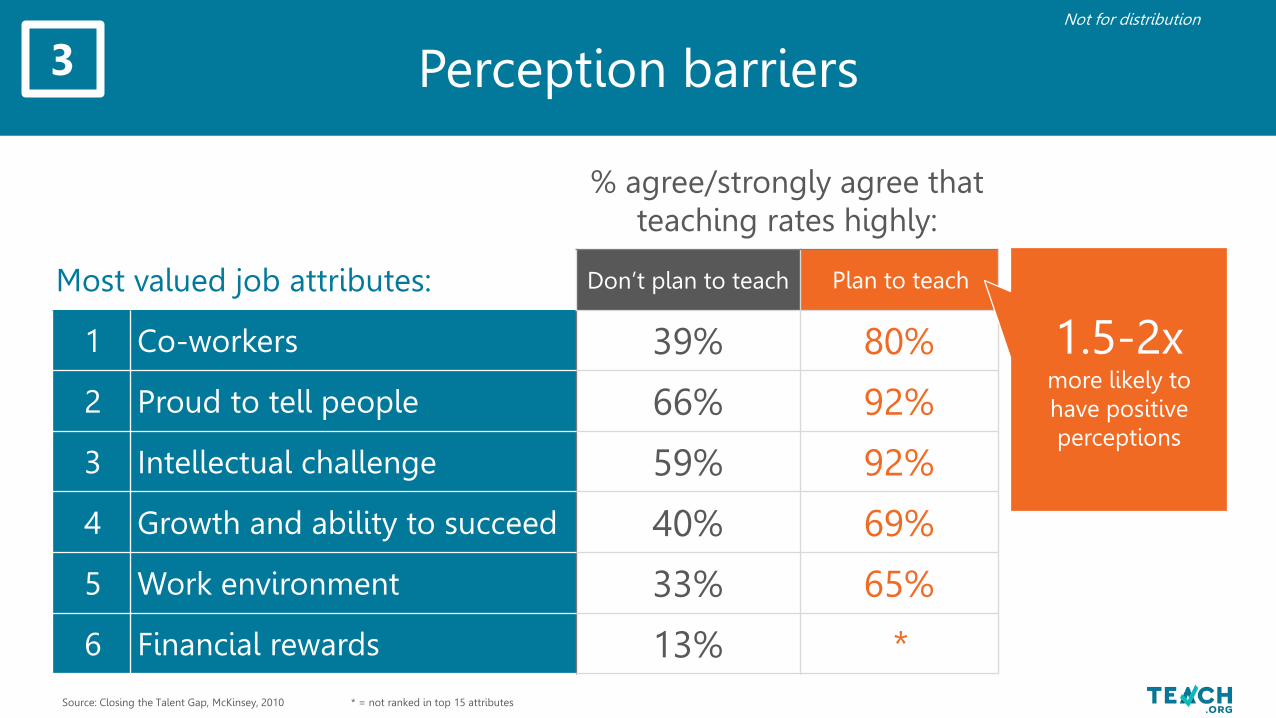
% agree/strongly agree that teaching rates highly:
Most valued job attributes: Don’t plan to teach Plan to teach
1 Co-workers 39% 80%
2 Proud to tell people 66% 92%
3 Intellectual challenge 59% 92%
4 Growth and ability to succeed 40% 69%
5 Work environment 33% 65%
6 Financial rewards 13% *
1.5-2x more likely to have positive perceptions
Source: Closing the Talent Gap, McKinsey, 2010 * = not ranked in top 15 attributes
Perception barriers3Not for distribution
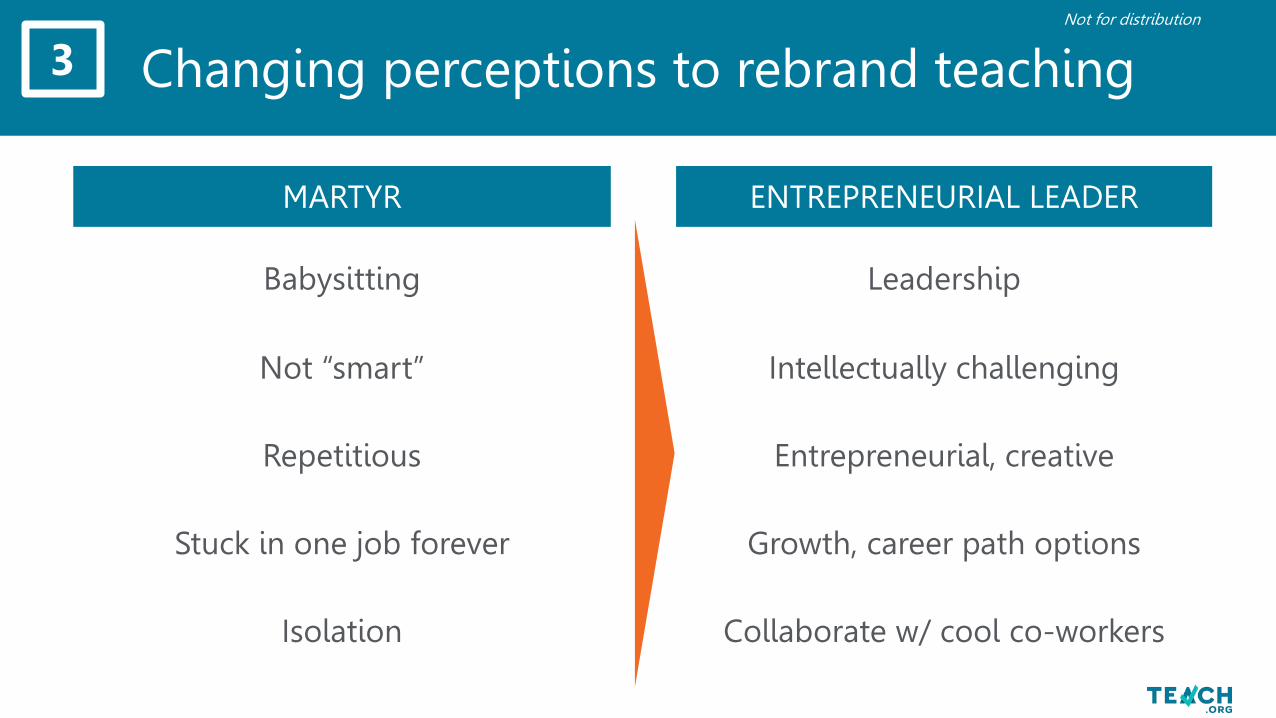
Changing perceptions to rebrand teaching3
Babysitting Leadership
MARTYR ENTREPRENEURIAL LEADER
Not “smart” Intellectually challenging
Repetitious Entrepreneurial, creative
Stuck in one job forever Growth, career path options
Isolation Collaborate w/ cool co-workers
Not for distribution
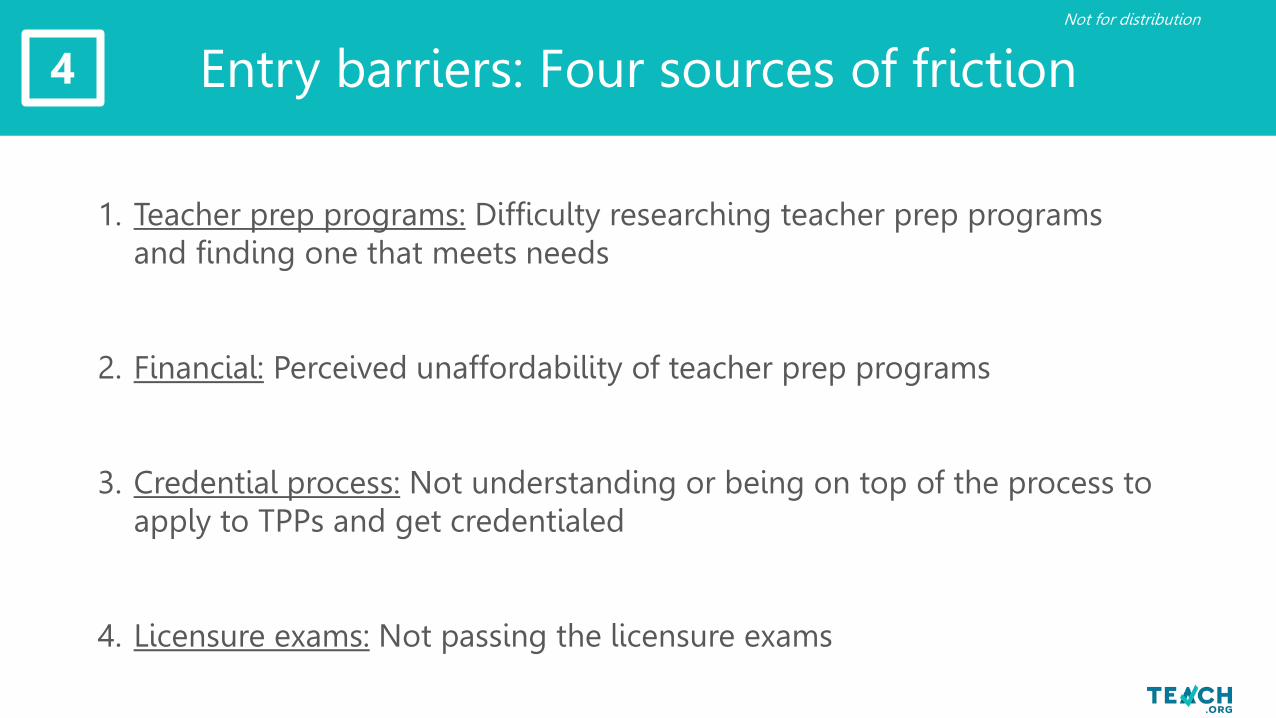
Entry barriers: Four sources of friction4
1. Teacher prep programs: Difficulty researching teacher prep programs and finding one that meets needs
2. Financial: Perceived unaffordability of teacher prep programs
3. Credential process: Not understanding or being on top of the process to apply to TPPs and get credentialed
4. Licensure exams: Not passing the licensure exams
Not for distribution
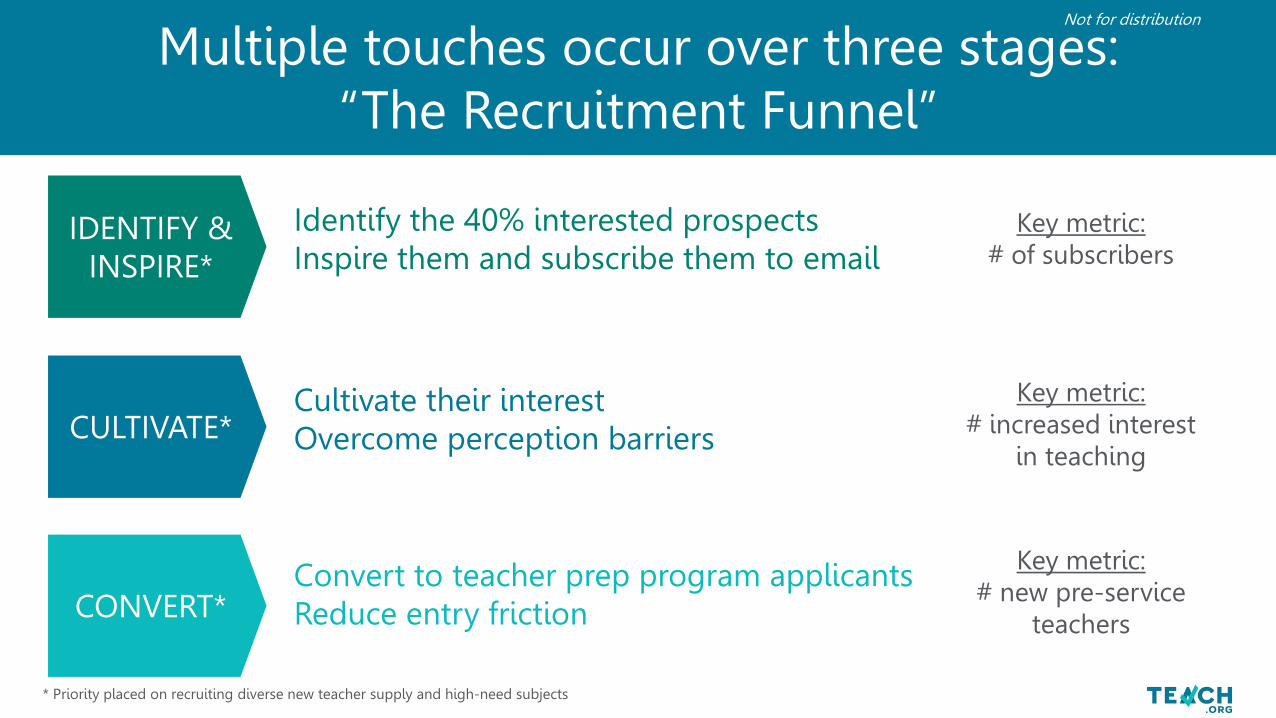
Multiple touches occur over three stages:“The Recruitment Funnel”
Key metric:# increased interest
in teaching
Cultivate their interestOvercome perception barriersCULTIVATE*
Identify the 40% interested prospectsInspire them and subscribe them to email
Key metric:# of subscribers
IDENTIFY & INSPIRE*
Key metric:# new pre-service
teachers
Convert to teacher prep program applicants Reduce entry frictionCONVERT*
* Priority placed on recruiting diverse new teacher supply and high-need subjects
Not for distribution
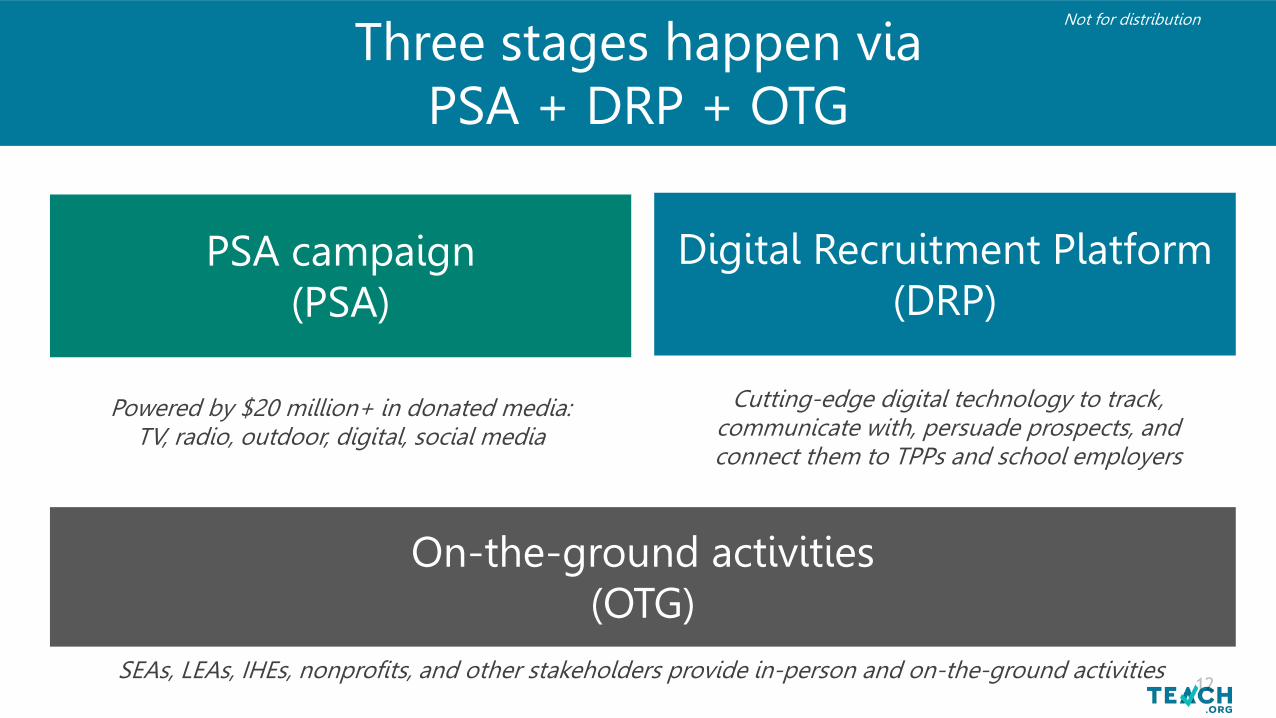
PSA campaign(PSA)
Digital Recruitment Platform (DRP)
Powered by $20 million+ in donated media:TV, radio, outdoor, digital, social media
Cutting-edge digital technology to track, communicate with, persuade prospects, and connect them to TPPs and school employers
On-the-ground activities(OTG)
Three stages happen via PSA + DRP + OTG
SEAs, LEAs, IHEs, nonprofits, and other stakeholders provide in-person and on-the-ground activities
Not for distribution
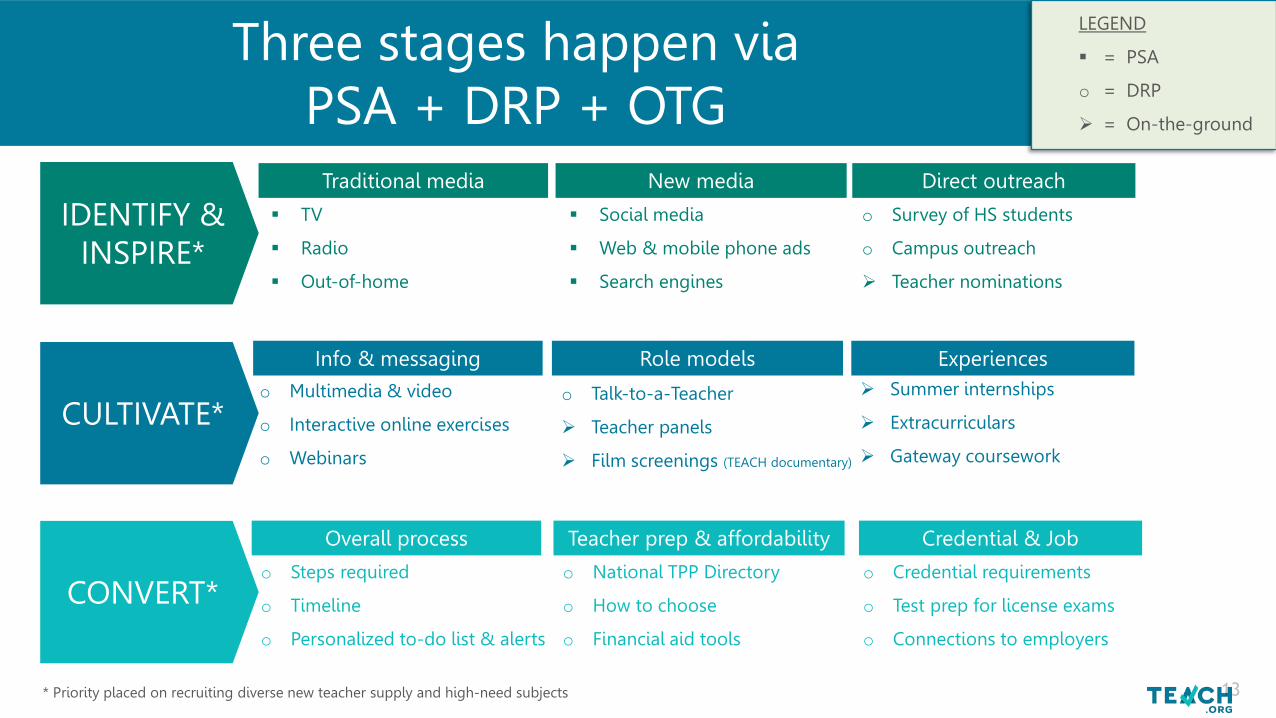
Summer internships
Extracurriculars
Gateway coursework
o Survey of HS students
o Campus outreach
Teacher nominations
Social media
Web & mobile phone ads
Search engines
o Talk-to-a-Teacher
Teacher panels
Film screenings (TEACH documentary)
o Multimedia & video
o Interactive online exercises
o Webinars
o National TPP Directory
o How to choose
o Financial aid tools
o Credential requirements
o Test prep for license exams
o Connections to employers
CULTIVATE*
Info & messaging ExperiencesRole models
IDENTIFY & INSPIRE*
CONVERT*o Steps required
o Timeline
o Personalized to-do list & alerts
TV
Radio
Out-of-home
Traditional media Direct outreachNew media
Overall process Credential & JobTeacher prep & affordability
* Priority placed on recruiting diverse new teacher supply and high-need subjects
Three stages happen via PSA + DRP + OTG
LEGEND
= PSA
o = DRP
= On-the-ground
PUBLIC SERVICE AWARENESS (PSA) CAMPAIGN
Not for distribution
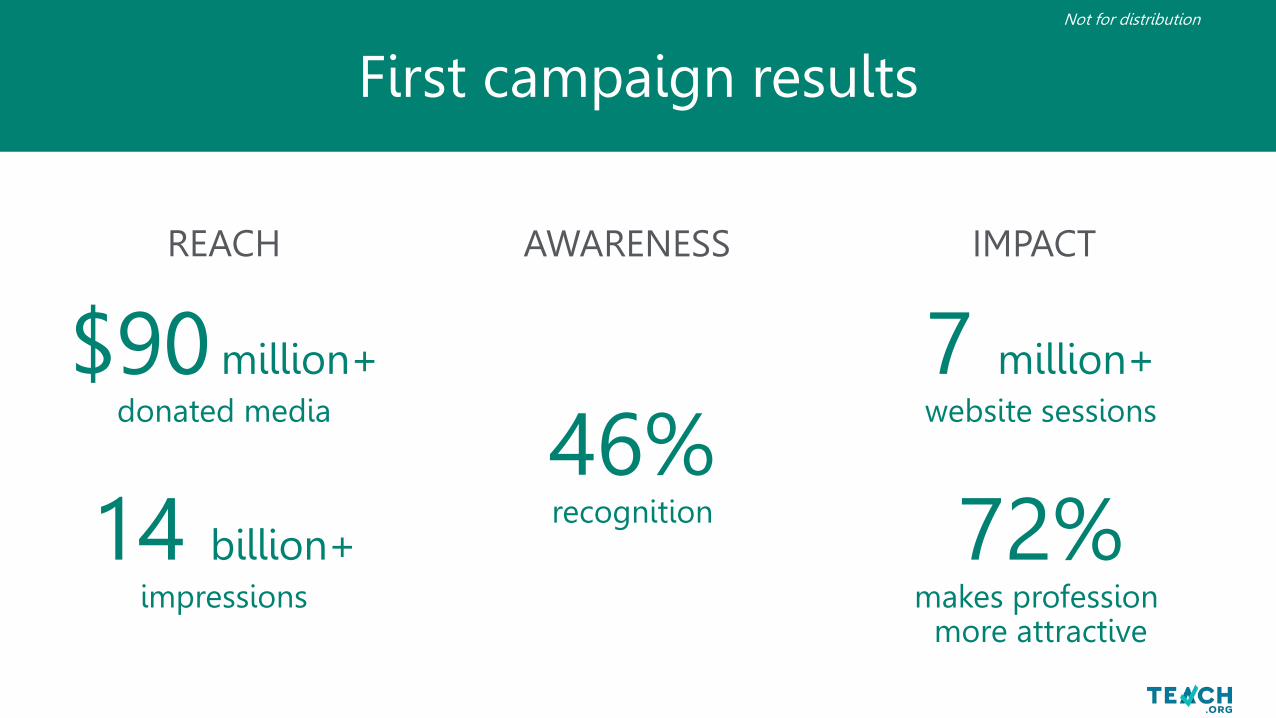
REACH
$90 million+donated media
14 billion+impressions
AWARENESS
46%recognition
IMPACT
7 million+website sessions
72%makes profession
more attractive
First campaign resultsNot for distribution
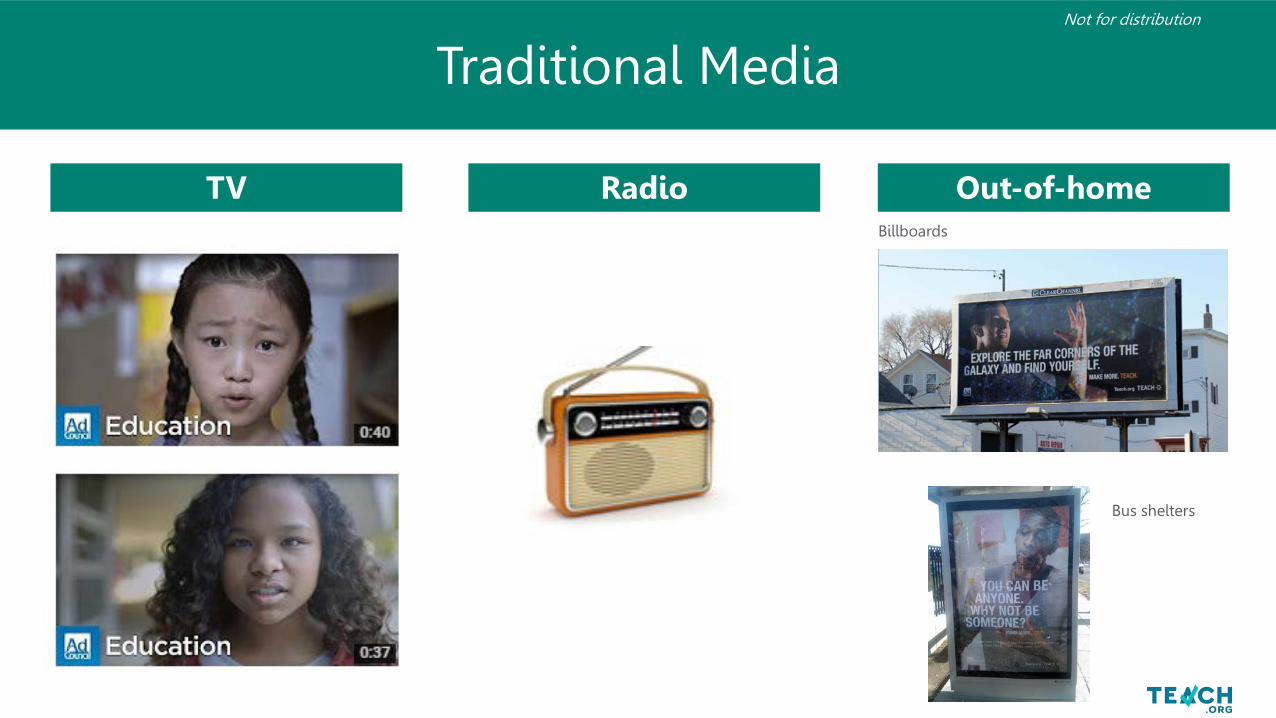
Traditional MediaNot for distribution
TV Radio Out-of-homeBillboards
Bus shelters

Social mediaNot for distribution
Digital/social media

World-class marketing agencies
The nation’s pre-eminent producer of public service announcement campaigns for the past 70 years.
Strong connections to media outlets in all 50 states and national media partners.
Ranked as one of the top 10 marketing agencies in the world.
Client list includes American Express, Whirlpool, Taco Bell, and Sony.
Not for distribution
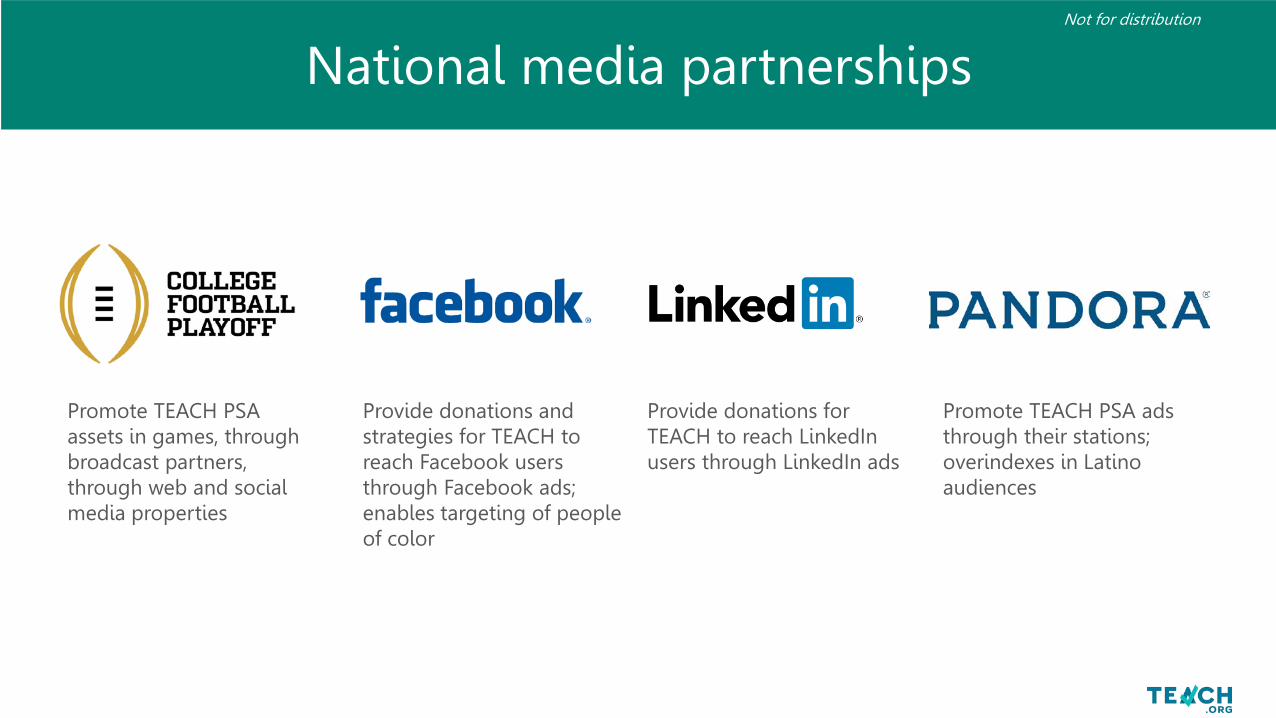
National media partnerships
Promote TEACH PSA assets in games, through broadcast partners, through web and social media properties
Provide donations and strategies for TEACH to reach Facebook users through Facebook ads; enables targeting of people of color
Promote TEACH PSA ads through their stations; overindexes in Latino audiences
Provide donations for TEACH to reach LinkedIn users through LinkedIn ads
Not for distribution

DIGITAL RECRUITING PLATFORM(DRP)
Not for distribution
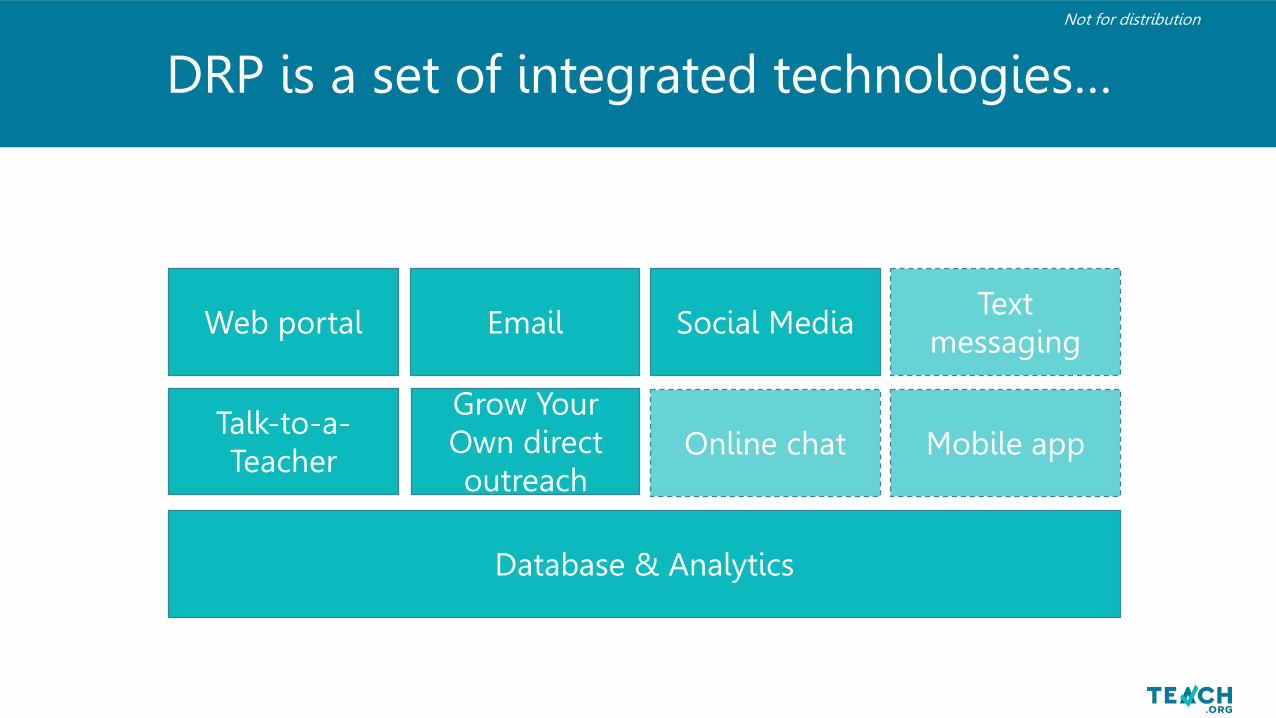
DRP is a set of integrated technologies…
Web portal Email Social MediaText
messaging
Online chat Mobile appGrow Your Own direct outreach
Talk-to-a-Teacher
Database & Analytics
Not for distribution
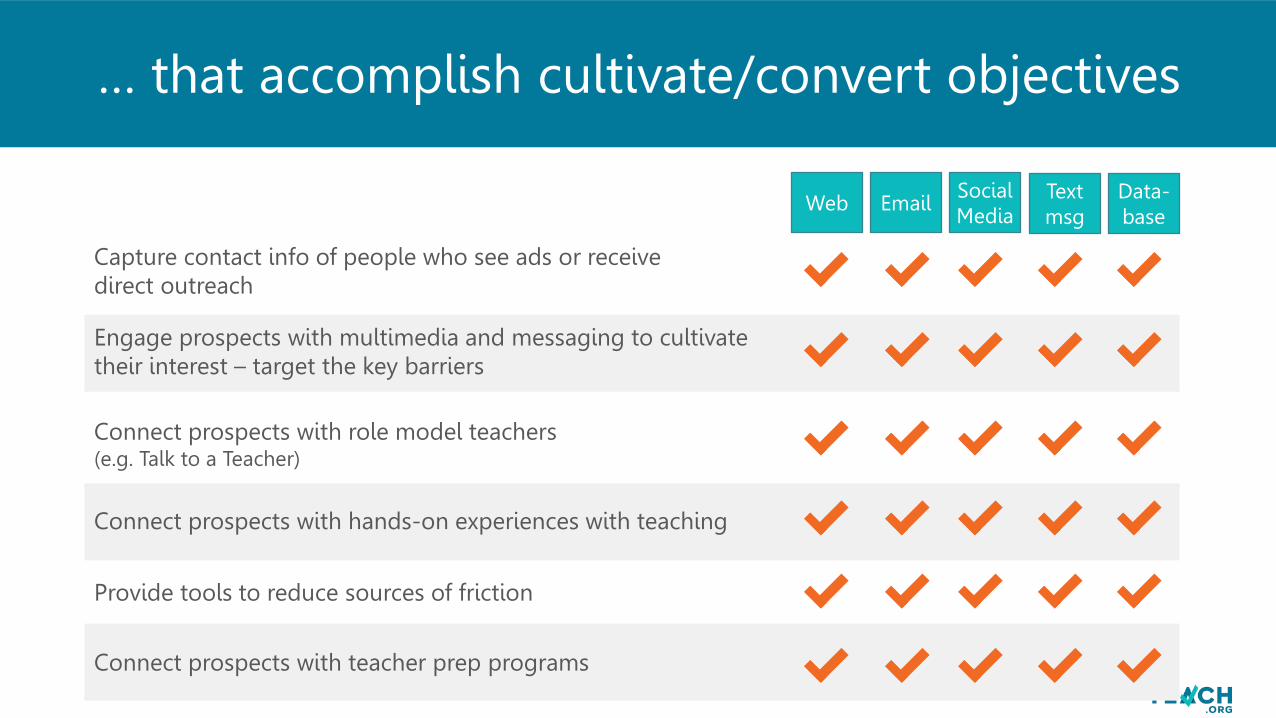
… that accomplish cultivate/convert objectives
Web EmailSocial Media
Text msg
Data-base
Capture contact info of people who see ads or receive direct outreach
Engage prospects with multimedia and messaging to cultivate their interest – target the key barriers
Connect prospects with role model teachers (e.g. Talk to a Teacher)
Connect prospects with hands-on experiences with teaching
Provide tools to reduce sources of friction
Connect prospects with teacher prep programs
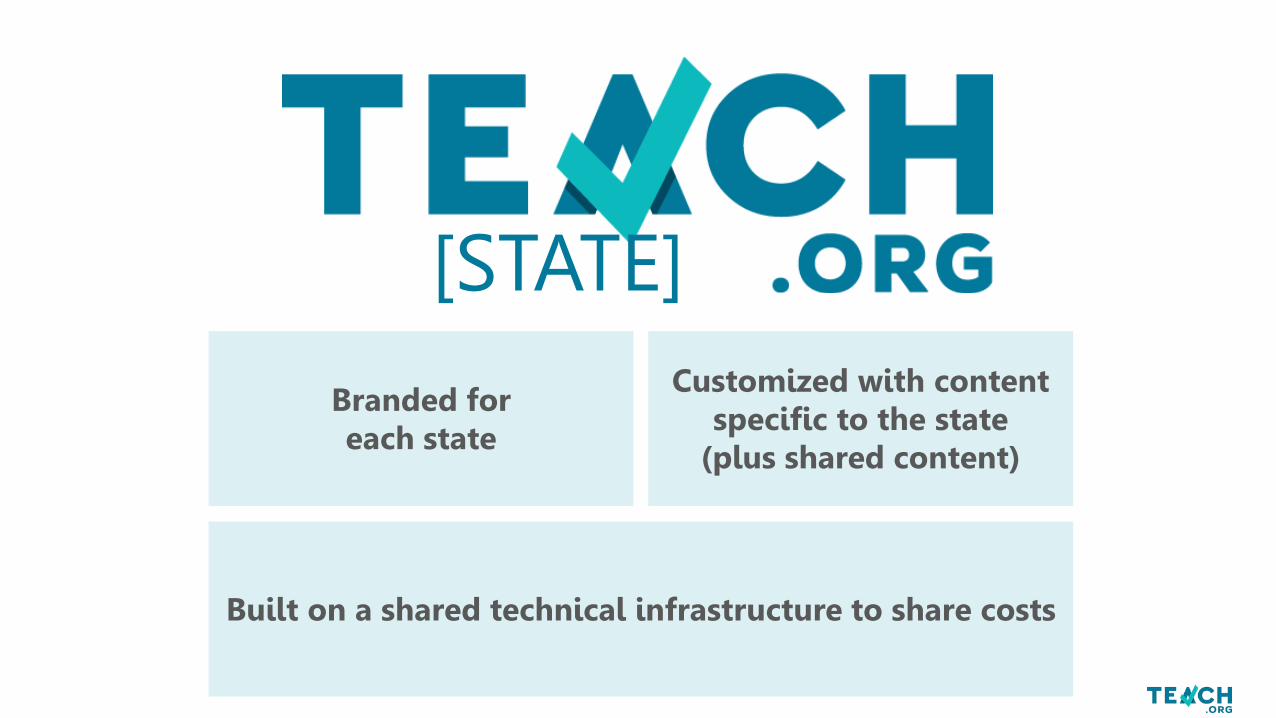
[STATE]
Branded for each state
Customized with content specific to the state
(plus shared content)
Built on a shared technical infrastructure to share costs
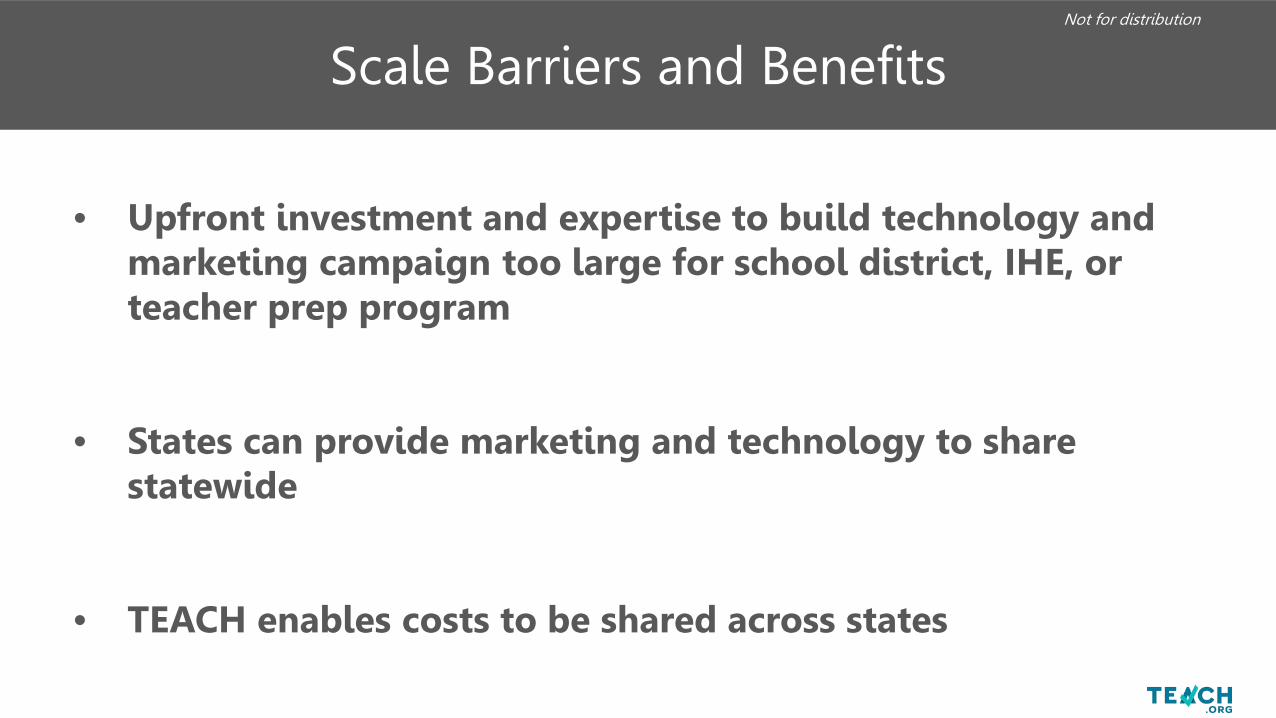
• Upfront investment and expertise to build technology and marketing campaign too large for school district, IHE, or teacher prep program
• States can provide marketing and technology to share statewide
• TEACH enables costs to be shared across states
Scale Barriers and BenefitsNot for distribution
APPENDIX
Not for distribution
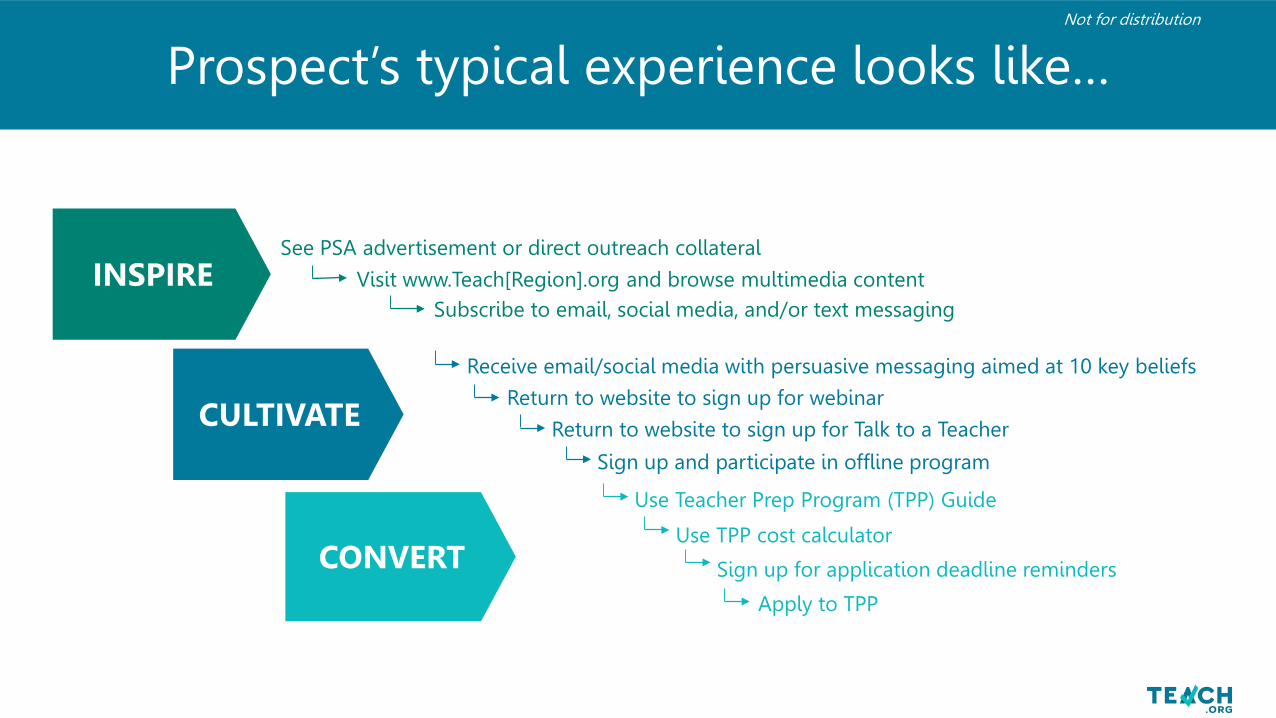
See PSA advertisement or direct outreach collateral INSPIRE Visit www.Teach[Region].org and browse multimedia content
Subscribe to email, social media, and/or text messaging
CULTIVATE
Receive email/social media with persuasive messaging aimed at 10 key beliefs
Return to website to sign up for webinar
Return to website to sign up for Talk to a Teacher
Sign up and participate in offline program
CONVERT
Use Teacher Prep Program (TPP) Guide
Use TPP cost calculator
Sign up for application deadline reminders
Apply to TPP
Prospect’s typical experience looks like…Not for distribution
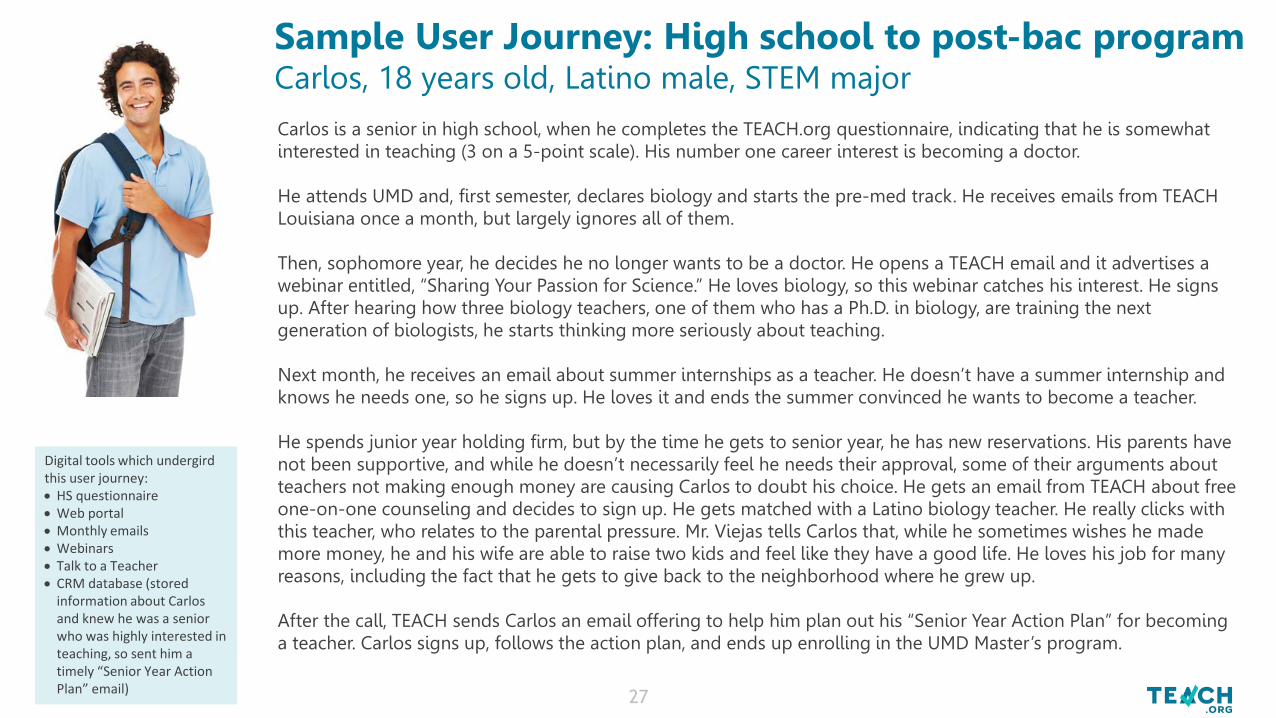
Carlos is a senior in high school, when he completes the TEACH.org questionnaire, indicating that he is somewhat interested in teaching (3 on a 5-point scale). His number one career interest is becoming a doctor.
He attends UMD and, first semester, declares biology and starts the pre-med track. He receives emails from TEACH Louisiana once a month, but largely ignores all of them.
Then, sophomore year, he decides he no longer wants to be a doctor. He opens a TEACH email and it advertises a webinar entitled, “Sharing Your Passion for Science.” He loves biology, so this webinar catches his interest. He signs up. After hearing how three biology teachers, one of them who has a Ph.D. in biology, are training the next generation of biologists, he starts thinking more seriously about teaching.
Next month, he receives an email about summer internships as a teacher. He doesn’t have a summer internship and knows he needs one, so he signs up. He loves it and ends the summer convinced he wants to become a teacher.
He spends junior year holding firm, but by the time he gets to senior year, he has new reservations. His parents have not been supportive, and while he doesn’t necessarily feel he needs their approval, some of their arguments about teachers not making enough money are causing Carlos to doubt his choice. He gets an email from TEACH about free one-on-one counseling and decides to sign up. He gets matched with a Latino biology teacher. He really clicks with this teacher, who relates to the parental pressure. Mr. Viejas tells Carlos that, while he sometimes wishes he made more money, he and his wife are able to raise two kids and feel like they have a good life. He loves his job for many reasons, including the fact that he gets to give back to the neighborhood where he grew up.
After the call, TEACH sends Carlos an email offering to help him plan out his “Senior Year Action Plan” for becoming a teacher. Carlos signs up, follows the action plan, and ends up enrolling in the UMD Master’s program.
Digital tools which undergird this user journey:• HS questionnaire• Web portal• Monthly emails• Webinars• Talk to a Teacher• CRM database (stored
information about Carlos and knew he was a senior who was highly interested in teaching, so sent him a timely “Senior Year Action Plan” email)
Sample User Journey: High school to post-bac programCarlos, 18 years old, Latino male, STEM major
SUMMARYGap Analysis for Building Blocks 3 & 4
Marc TuckerNational Center on Education and the Economy
28 June 2017
Maryland Commission on Innovation and Excellence in Education
Maryland Commission on Innovation and Excellence in Education
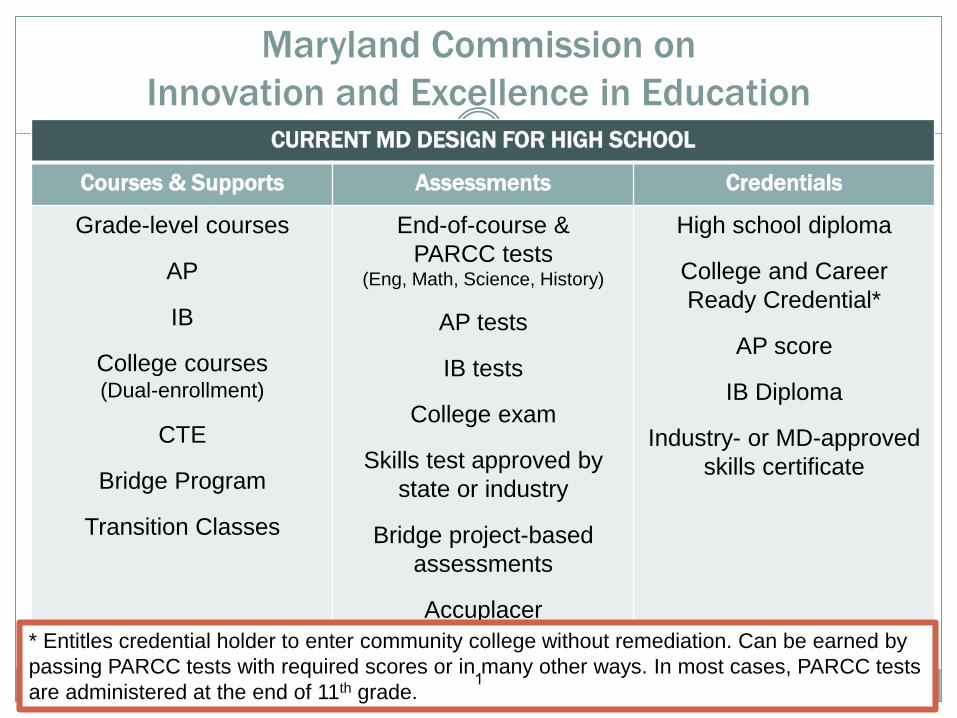
CURRENT MD DESIGN FOR HIGH SCHOOL
Courses & Supports Assessments Credentials
Grade-level courses
AP
IB
College courses (Dual-enrollment)
CTE
Bridge Program
Transition Classes
End-of-course & PARCC tests
(Eng, Math, Science, History)
AP tests
IB tests
College exam
Skills test approved by state or industry
Bridge project-basedassessments
Accuplacer
High school diploma
College and Career Ready Credential*
AP score
IB Diploma
Industry- or MD-approved skills certificate
* Entitles credential holder to enter community college without remediation. Can be earned by passing PARCC tests with required scores or in many other ways. In most cases, PARCC tests are administered at the end of 11th grade.
1
Maryland Commission on Innovation and Excellence in Education
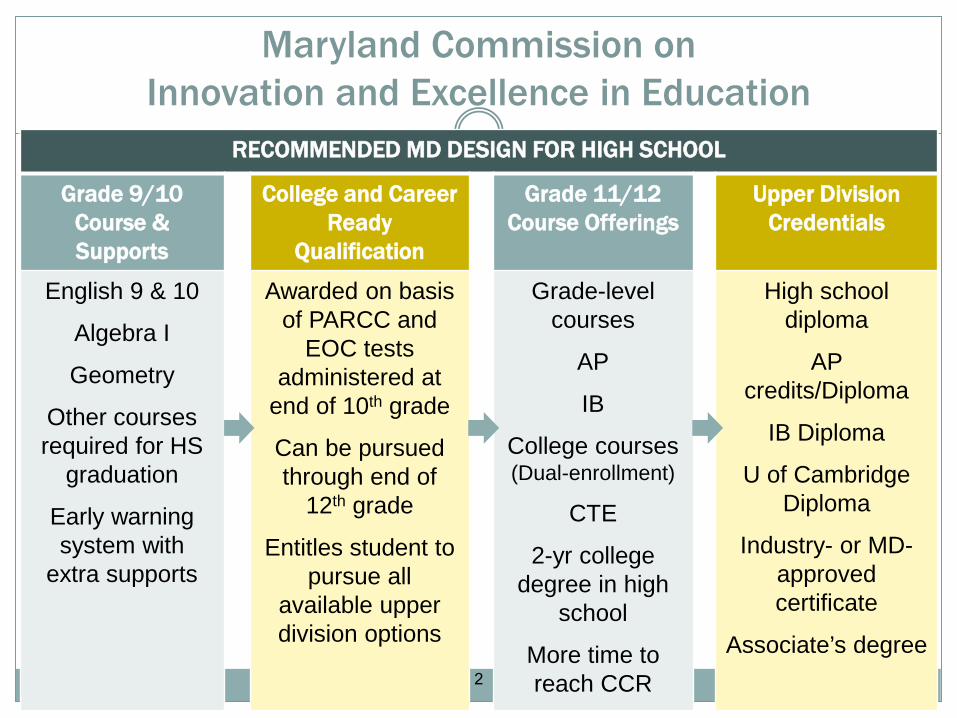
RECOMMENDED MD DESIGN FOR HIGH SCHOOL
Grade 9/10 Course & Supports
College and Career Ready
Qualification
Grade 11/12 Course Offerings
Upper Division Credentials
English 9 & 10
Algebra I
Geometry
Other courses required for HS
graduation
Early warning system with
extra supports
Awarded on basisof PARCC and
EOC testsadministered at
end of 10th grade
Can be pursued through end of
12th grade
Entitles student to pursue all
available upper division options
Grade-level courses
AP
IB
College courses (Dual-enrollment)
CTE
2-yr college degree in high
school
More time to reach CCR
High school diploma
AP credits/Diploma
IB Diploma
U of Cambridge Diploma
Industry- or MD-approvedcertificate
Associate’s degree2
A Few Big Points
MD’s standards, assessments and curriculum supports compare favorably to those of many if not most American states.
MD is far ahead of many other states in providing support to teachers to help them teach to the new standards and in providing support in high school to students who fail to reach high school standards.
MD legislation has set the 2019-20 school year as the deadline for fully implementing new CCR standards.
3
A Few Big Points
But:
Transition to envisioned system very complex, poorly
understood
Ultimate goal indistinct, also not widely understood
Role of high school diploma in relation to CCR not
clear
Pathways in relation to CCR not clear4
A Few Big Points
Not clear how CCR will improve CTE or increase the numbers ready to succeed in selective colleges and universities
CCR sets exams for end of 11th grade, not leaving enough time for students who might be years behind the standard to reach it by the end of high school
CCR standard likely 2-3 years below the global standard for students of that age
5
Modified Design
The recommended design, similar to that in many top-performing countries, is intended to: Build on what Maryland has already done;
Be easy to understand;
Enable Maryland students to match the average achievement of top performers; and
Allow excellent students to quality for admission to the world’s top universities and to lay the base for creating an internationally competitive technical work force, with good jobs for everyone who wants one.
6
Modified Design
Set the system up so that all students can take the courses they need to take to meet the college and career standard at the end of 10th grade, not 11th
grade. Base the CCR standard on cut scores on the
PARCC tests that are empirically determined to correlate with succeeding in the typical first-year program in MD’s community colleges and on a formula related to the MD system of end-of-course exams.
7
Modified Design
Create a clear, detailed curriculum framework for each of the subjects in the required K-10 curriculum that makes it clear what topics are to be covered in each grade or in grade spans in order to master the required curriculum to the CCR standard.
Create examples of student work that meet the standards for each grade or grade span for each topic, along with commentary as to why that work meets the standards.
Create model lessons for students from different backgrounds aligned with the curriculum framework, along with recommended texts and ancillary materials.
MD has made a good start in these areas, especially in English and Math.
8
Modified Design
Make it clear that, while all students are expected to master the CCR standards, it is understood that: Especially able students should be given an enriched
curriculum that will enable them to reach the 10th grade with a deeper understanding of the subjects in the core curriculum;
Some students will not be able to meet the CCR standard by the end of the 10th grade and, if that becomes clear beforethey reach the 10th grade, they are given more time than others to master the curriculum framework;
The CCR standard will be reached by almost all students but the standard is fixed while the time needed to reach it is not; and
The primary focus of the Maryland school accountability program will be on student progress toward the CCR standard.
9
Modified Design
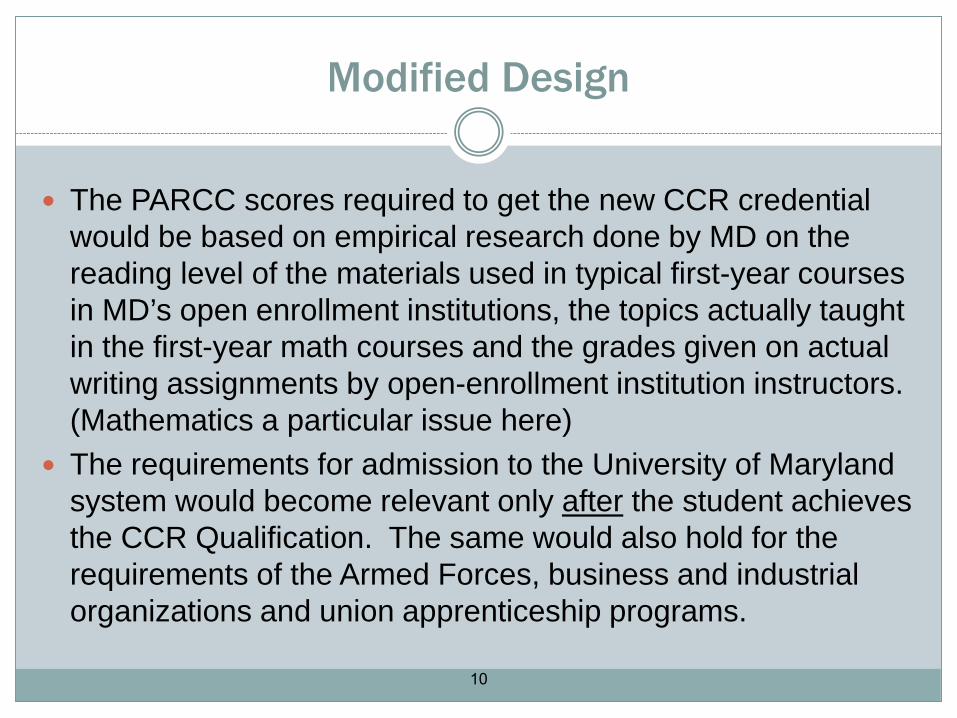
The PARCC scores required to get the new CCR credential would be based on empirical research done by MD on the reading level of the materials used in typical first-year courses in MD’s open enrollment institutions, the topics actually taught in the first-year math courses and the grades given on actual writing assignments by open-enrollment institution instructors. (Mathematics a particular issue here)
The requirements for admission to the University of Maryland system would become relevant only after the student achieves the CCR Qualification. The same would also hold for the requirements of the Armed Forces, business and industrial organizations and union apprenticeship programs.
10
A Different Design
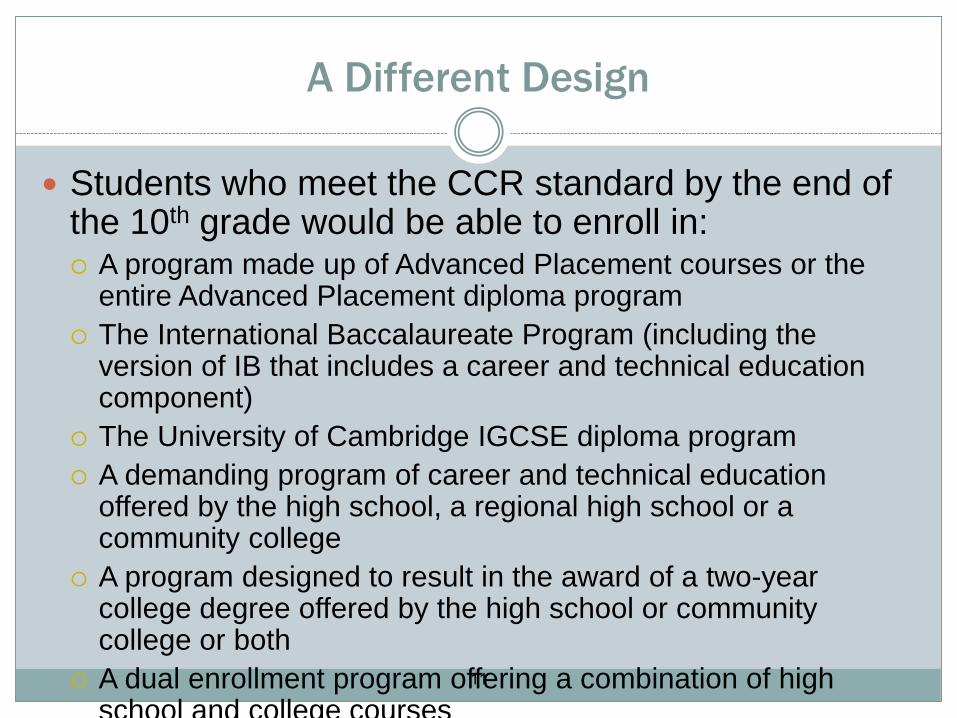
Students who meet the CCR standard by the end of the 10th grade would be able to enroll in: A program made up of Advanced Placement courses or the
entire Advanced Placement diploma program The International Baccalaureate Program (including the
version of IB that includes a career and technical education component)
The University of Cambridge IGCSE diploma program A demanding program of career and technical education
offered by the high school, a regional high school or a community college
A program designed to result in the award of a two-year college degree offered by the high school or community college or both
A dual enrollment program offering a combination of high school and college courses
11
Modified Design
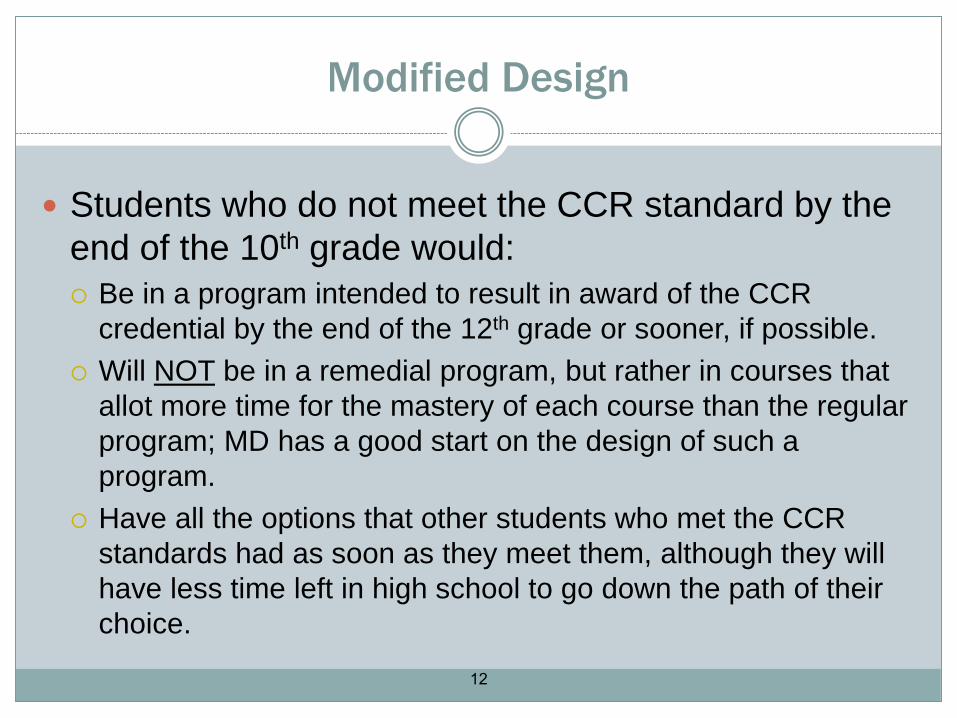
Students who do not meet the CCR standard by the end of the 10th grade would: Be in a program intended to result in award of the CCR
credential by the end of the 12th grade or sooner, if possible. Will NOT be in a remedial program, but rather in courses that
allot more time for the mastery of each course than the regular program; MD has a good start on the design of such a program.
Have all the options that other students who met the CCR standards had as soon as they meet them, although they will have less time left in high school to go down the path of their choice.
12
Why This Design
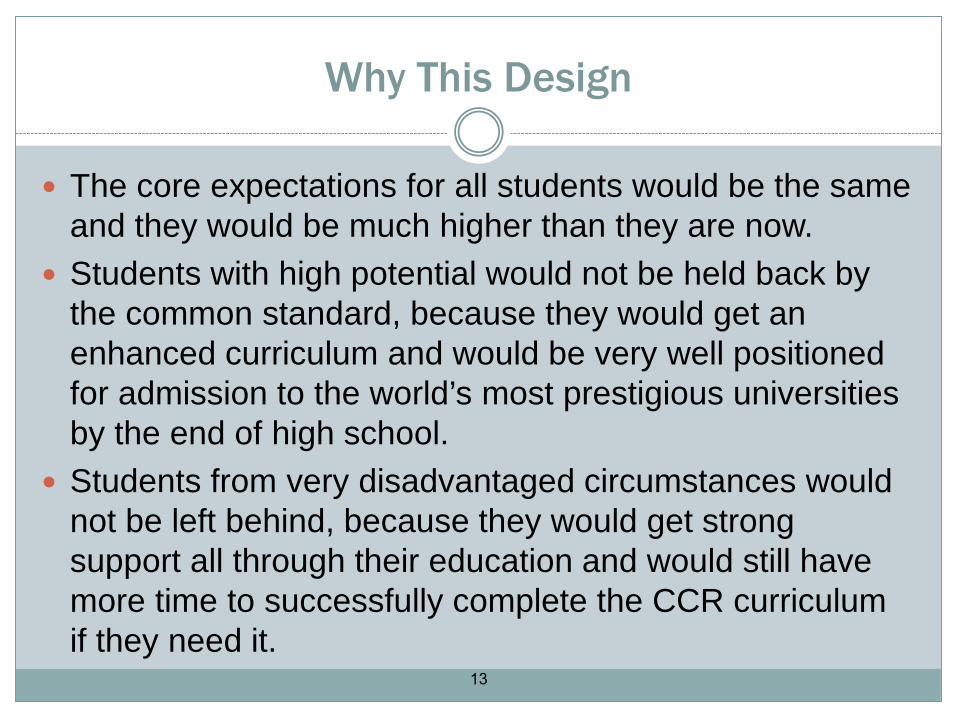
The core expectations for all students would be the same and they would be much higher than they are now.
Students with high potential would not be held back by the common standard, because they would get an enhanced curriculum and would be very well positioned for admission to the world’s most prestigious universities by the end of high school.
Students from very disadvantaged circumstances would not be left behind, because they would get strong support all through their education and would still have more time to successfully complete the CCR curriculum if they need it.
13
Why This Design
Career and technical education students would have to reach the same high standards as everyone else, so the status of career and technical education would rise.
Many more students would be prepared for and would elect to take an AP diploma program, an IB Diploma program or a University of Cambridge program in grades 11 and 12, and would therefore be prepared to go the University of Maryland institution and the most admired institutions in the world.
14
Why This Design
Many more students would be ready for success in Maryland’s community colleges, increasing enrollment and greatly improving completion rates.
Because many Maryland students would be ready to take a full two-year degree program in grades 11 and 12 of high school, Maryland families would save a great deal of money.
15
Why This Design
Because many students would be taking what is now college in high school, Maryland four-year institutions could raise their standards for the courses they teach, and thereby greatly increase the productivity of the whole system, including higher education.
Because a much larger fraction of the cohort would get real credentials in high school and be much better prepared to succeed after high school, the significant cohort that now winds up without any credential of significant value in the marketplace would greatly decrease.
16
Why This Design
Because Maryland’s schools would be producing career and technical education graduates with much higher academic and technical skills, Maryland could become a magnet for high-value-added companies like Massachusetts, the Bay Area, the Austin Area and the Research Triangle in North Carolina.
17
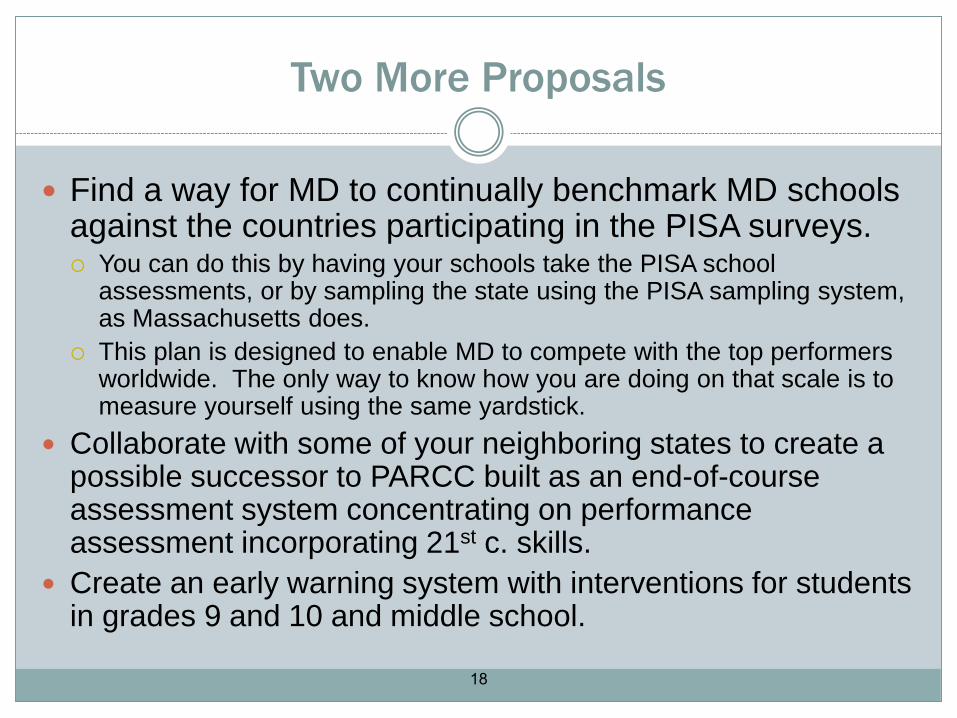
Two More Proposals
Find a way for MD to continually benchmark MD schools against the countries participating in the PISA surveys. You can do this by having your schools take the PISA school
assessments, or by sampling the state using the PISA sampling system, as Massachusetts does.
This plan is designed to enable MD to compete with the top performers worldwide. The only way to know how you are doing on that scale is to measure yourself using the same yardstick.
Collaborate with some of your neighboring states to create a possible successor to PARCC built as an end-of-course assessment system concentrating on performance assessment incorporating 21st c. skills.
Create an early warning system with interventions for students in grades 9 and 10 and middle school.
18
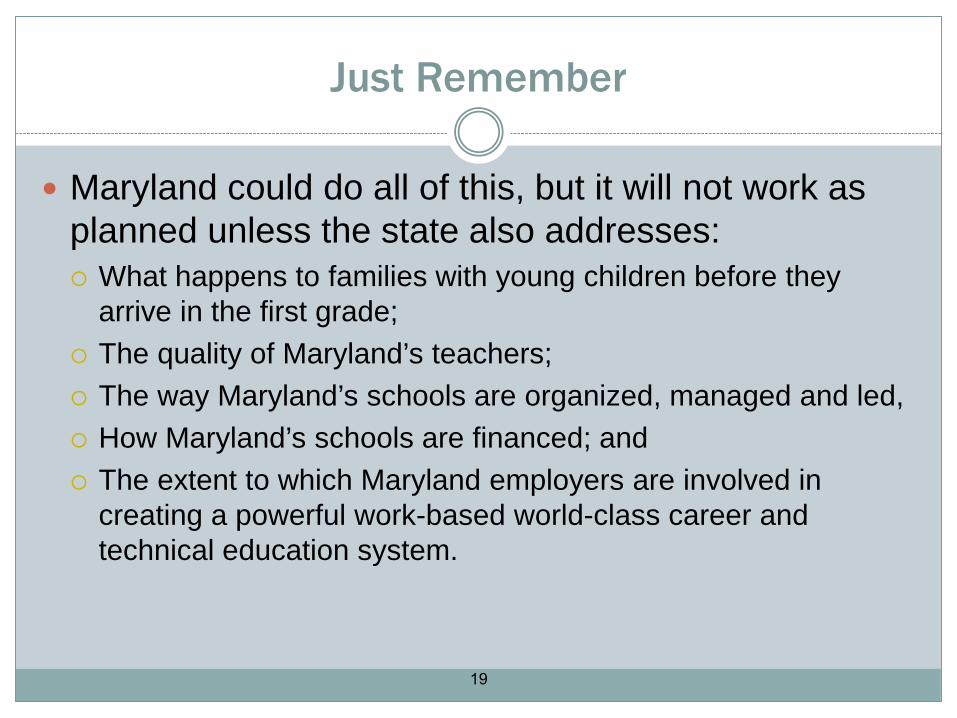
Just Remember
Maryland could do all of this, but it will not work as planned unless the state also addresses: What happens to families with young children before they
arrive in the first grade; The quality of Maryland’s teachers; The way Maryland’s schools are organized, managed and led, How Maryland’s schools are financed; and The extent to which Maryland employers are involved in
creating a powerful work-based world-class career and technical education system.
19

Commission on Innovation and Excellence in Education Breakout Group Discussion June 28, 2017
1
BREAKOUT GROUPS (Brit Kirwan will float among the groups)One breakout session. All will meet in Room 170/180 immediately following lunch.
Group A Group B Group C Elizabeth Ysla Leight* David Steiner* David Helfman* Scott Dorsey David Brinkley Robert Caret Buzzy Hettleman Stephen Guthrie Chester Finn Anne Kaiser Maggie McIntosh Adrienne Jones Nancy King Paul Pinsky Richard Madaleno Leslie Pellegrino Karen Salmon Morgan Showalter Craig Rice Joy Schaefer Margaret Williams Steve Waugh Alonzo Washington Bill Valentine
* is group leader/reporter for today
BUILDING BLOCK 3: DEVELOP WORLD-CLASS, HIGHLY COHERENT INSTRUCTIONAL SYSTEM
BUILDING BLOCK 4: CREATE CLEAR GATEWAYS FOR STUDENTS THROUGH THE SYSTEM, SET TO GLOBAL STANDARDS, WITH NO DEAD ENDS
ALL BREAKOUT GROUPS (plus see additional questions for each group)
1. Should Maryland change its definition of CCR so that students are prepared for successin initial credit-bearing community college courses by the end of 10th grade? Rather thanpreparing students for success in credit-bearing community college and four-yearuniversities by the end of 11th grade as we are working toward now in the State?
2. If Maryland makes this change, by what year could Maryland implement a system thatwould allow all or most students to be CCR by the end of 10th grade?
3. Ultimately, should a Maryland high school diploma and CCR be the same thing,including non-PARCC subjects like science, languages, government/history, art, etc.?
4. Should the system be set up so that all courses, tests and examinations required forstudents to be CCR are available by the end of 10th grade rather than at the end of grade11, as currently envisioned?
______________________________________________________________________________

Commission on Innovation and Excellence in Education Breakout Group Discussion June 28, 2017
2
Breakout Group A
5. What would an effective system look like for catching students who are falling behind as soon as possible and making sure they get on track to get their CCR qualification at the end of grade 10?
6. What would an effective system look like for identifying students who might be years behind in elementary and middle school at the end of elementary school or during middle school and for creating a trajectory for them that would allow them to graduate with the CCR qualification (e.g., summer school, Saturday programs, after school programs)?
______________________________________________________________________________
Breakout Group B
7. What should be used to measure CCR for each subject (e.g. PARCC, SAT, Accuplacer, course grade, projects)? For what subjects?
8. What opportunities are needed for students who are CCR by the end of 10th grade (e.g., AP courses, the AP diploma program, the IB diploma program, the IB diploma program that includes a career and technical education component, the University of Cambridge IGCSE program, a dual enrollment education program, a complete 2-year college degree program, a demanding career and technical education program culminating in an industry-recognized credential, or a program of regular high courses selected to match the requirements of the University of Maryland System.) Does that set of offerings sound right to you? Are there some you would delete? Are there any you would add?
__________________________________________________________________
Breakout Group C
9. Should Maryland administer some form of PISA (every 3 years) to measure Maryland
students directly against other nations and top performing systems?
10. Should Maryland periodically review its standards and curriculum against top performing systems and nations? If so, how often? By whom?
11. Given that policies are generally viewed in four-year increments, how does Maryland ensure that the State remains committed to the CCR goals (see Questions 1-4) over the longer term and does not change course before the goals are achieved?

Case Studies of High Performing and Improving Schools in
MarylandGail L. Sunderman, PhDUniversity of Maryland
Presentation to theCommission on Innovation and Excellence in Education
June 28, 2017
Presentation Overview
• Purpose of Case Studies• School Selection & Study Overview• Elements of Successful Schools• Conclusions
2
Purpose of Case Studies• Inform components of the Maryland adequacy study:
– About successful school improvement programs and strategies
– The staffing costs of these programs and strategies • Investigate programs that were effective in raising
student achievement• Compare these strategies to the Evidence Based
Model• Studies were conducted between October 2014 and
March 2015
3
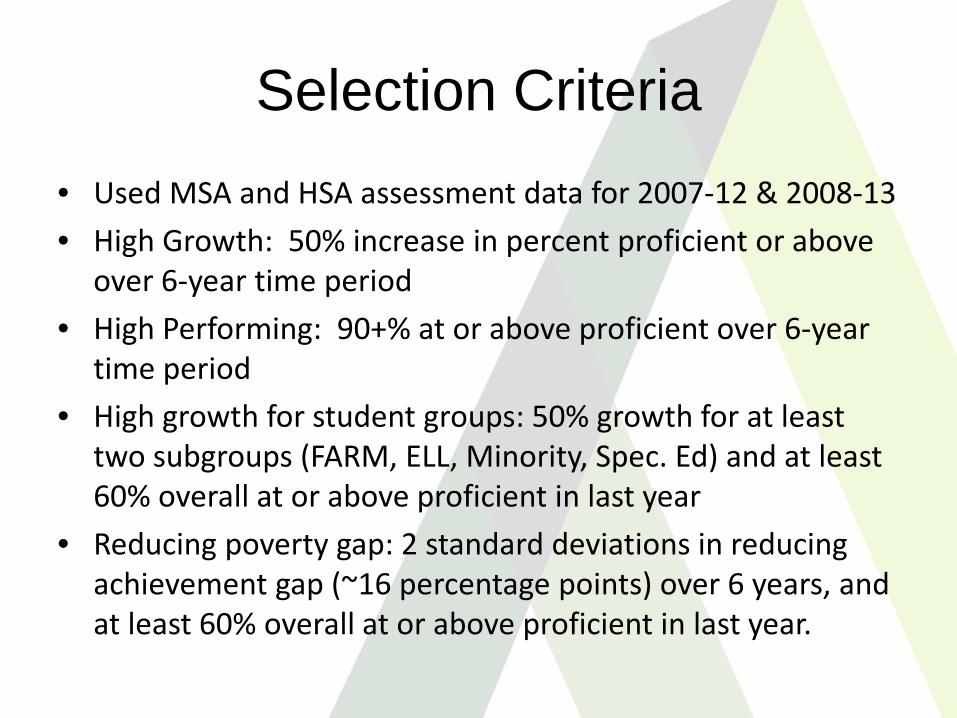
Selection Criteria• Used MSA and HSA assessment data for 2007-12 & 2008-13• High Growth: 50% increase in percent proficient or above
over 6-year time period• High Performing: 90+% at or above proficient over 6-year
time period• High growth for student groups: 50% growth for at least
two subgroups (FARM, ELL, Minority, Spec. Ed) and at least 60% overall at or above proficient in last year
• Reducing poverty gap: 2 standard deviations in reducing achievement gap (~16 percentage points) over 6 years, and at least 60% overall at or above proficient in last year.
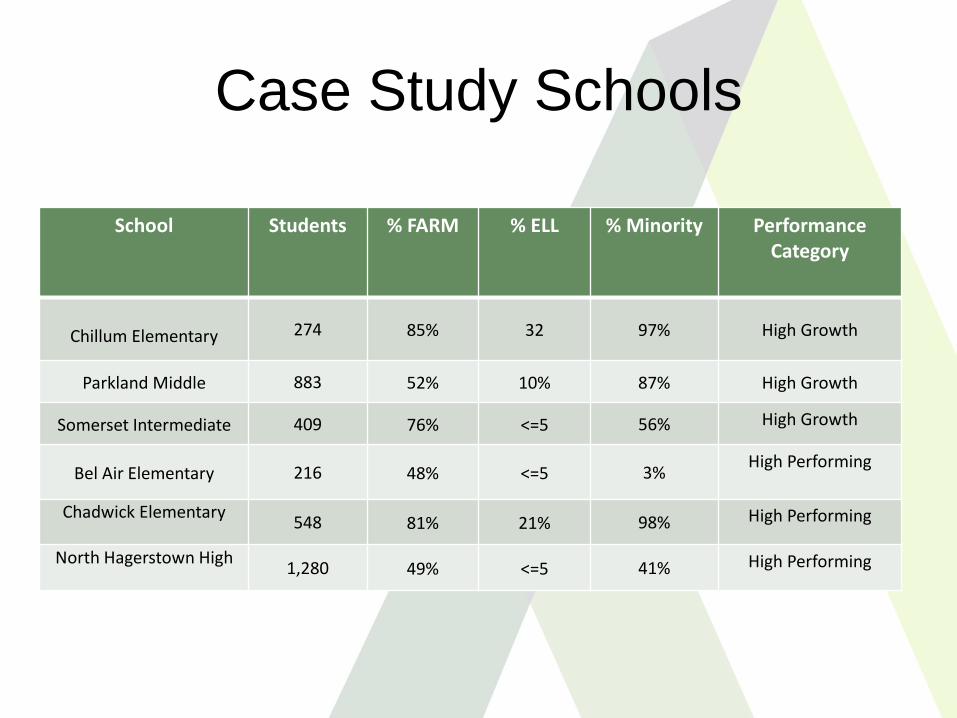
Case Study Schools
School Students % FARM % ELL % Minority Performance Category
Chillum Elementary 274 85% 32 97% High Growth
Parkland Middle 883 52% 10% 87% High Growth
Somerset Intermediate 409 76% <=5 56% High Growth
Bel Air Elementary 216 48% <=5 3% High Performing
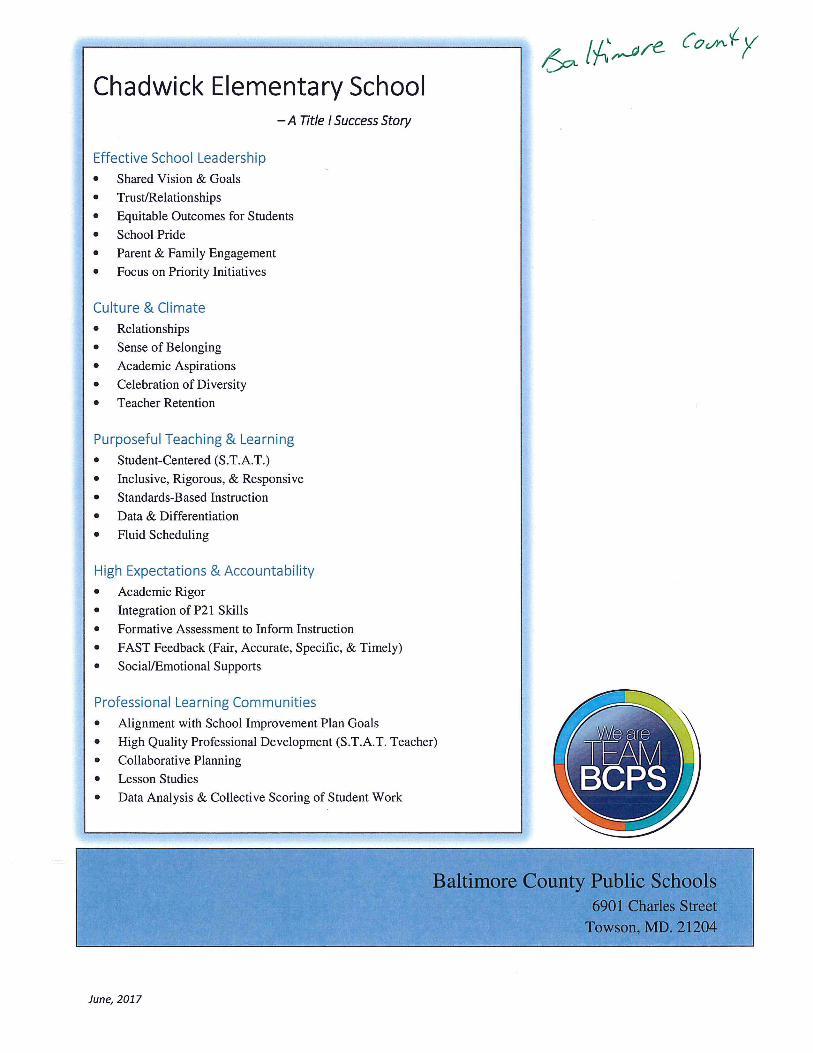
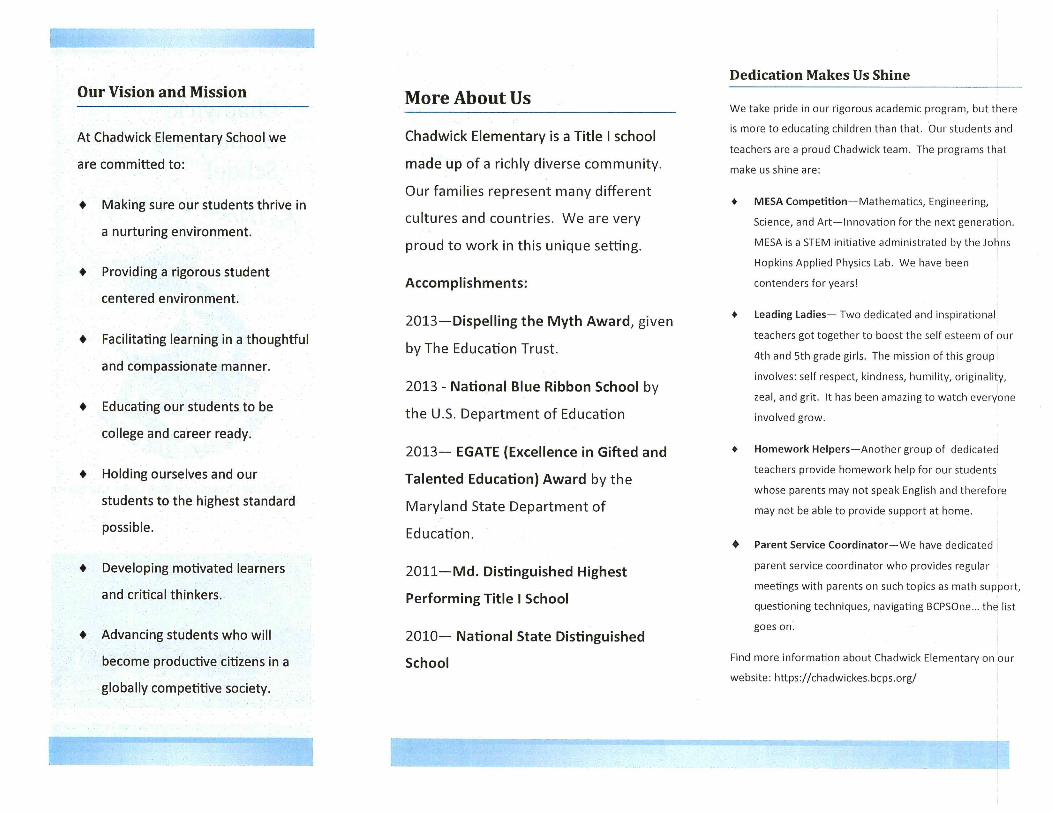
Chadwick Elementary 548 81% 21% 98% High Performing
North Hagerstown High 1,280 49% <=5 41% High Performing
5
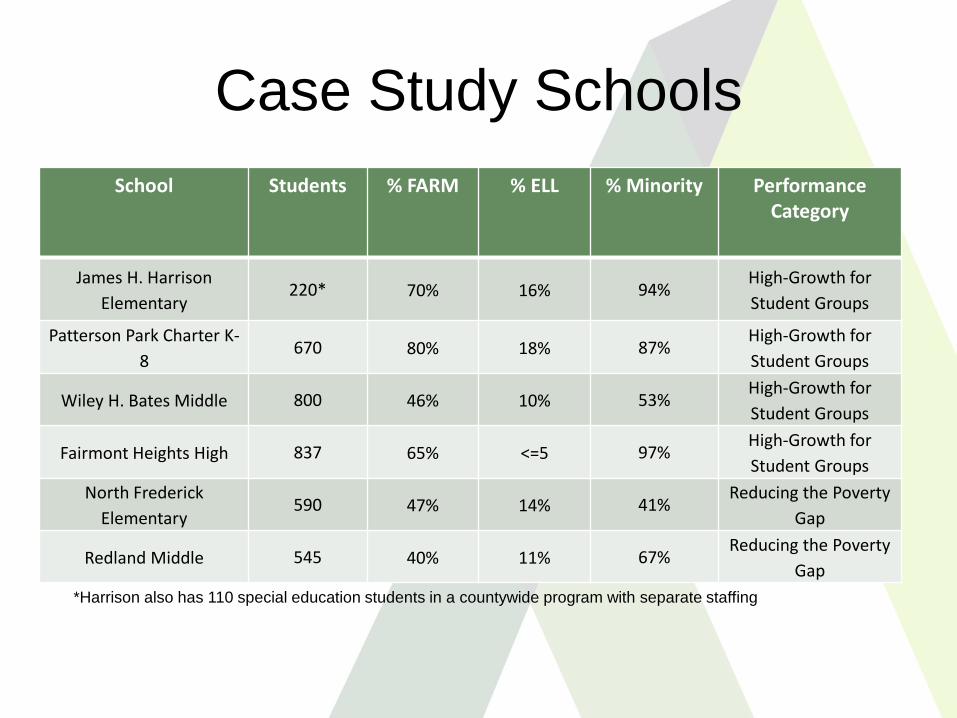
Case Study SchoolsSchool Students % FARM % ELL % Minority Performance
Category
James H. Harrison Elementary
220* 70% 16% 94% High-Growth for Student Groups
Patterson Park Charter K-8
670 80% 18% 87% High-Growth for Student Groups
Wiley H. Bates Middle 800 46% 10% 53% High-Growth for Student Groups
Fairmont Heights High 837 65% <=5 97% High-Growth for Student Groups
North Frederick Elementary
590 47% 14% 41% Reducing the Poverty
Gap
Redland Middle 545 40% 11% 67% Reducing the Poverty
Gap
6
*Harrison also has 110 special education students in a countywide program with separate staffing
Common Elements of Schools• Goals to improve performance in reading and math• Adopt new curriculum materials to align with the
Common Core• Implement school wide approaches to effective
instructional practice, including tailoring instruction to individual student needs
• Density of instructional leadership – teacher leaders, instructional coaches, principals and central office personnel
• School culture characterized by both individual and school wide accountability for results – success defined by impact on student achievement
7
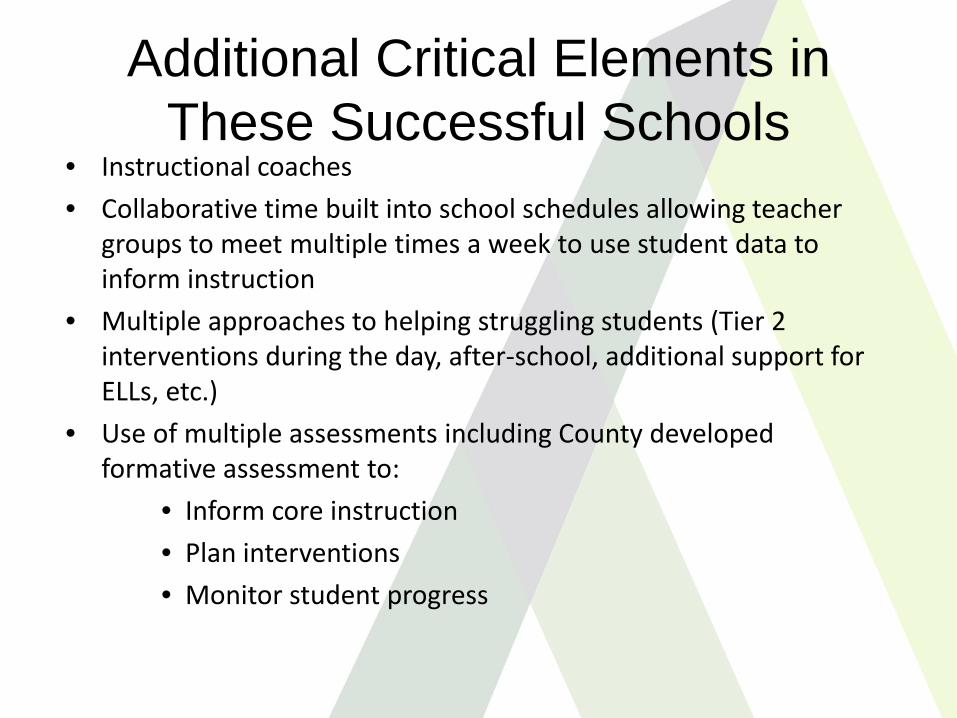
Additional Critical Elements in These Successful Schools
• Instructional coaches• Collaborative time built into school schedules allowing teacher
groups to meet multiple times a week to use student data to inform instruction
• Multiple approaches to helping struggling students (Tier 2 interventions during the day, after-school, additional support for ELLs, etc.)
• Use of multiple assessments including County developed formative assessment to:
• Inform core instruction • Plan interventions • Monitor student progress
8
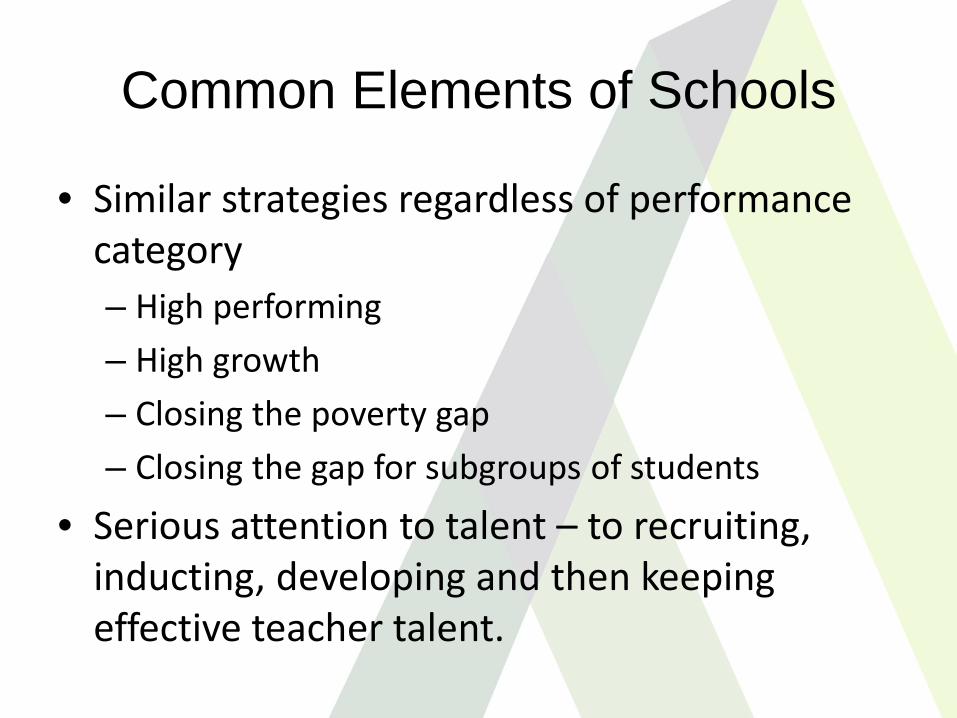
Common Elements of Schools
• Similar strategies regardless of performance category– High performing – High growth– Closing the poverty gap – Closing the gap for subgroups of students
• Serious attention to talent – to recruiting, inducting, developing and then keeping effective teacher talent.
9
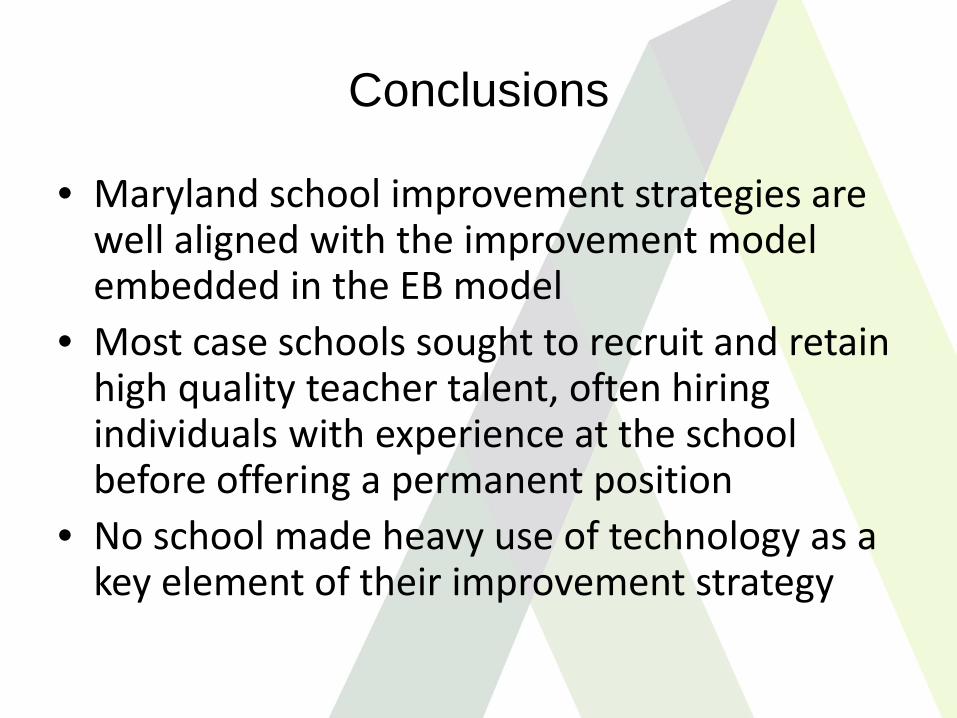
Conclusions
• Maryland school improvement strategies are well aligned with the improvement model embedded in the EB model
• Most case schools sought to recruit and retain high quality teacher talent, often hiring individuals with experience at the school before offering a permanent position
• No school made heavy use of technology as a key element of their improvement strategy
10
C o l l e g e o f E d u c a t i o n , U n i v e r s i t y o f M a r y l a n d
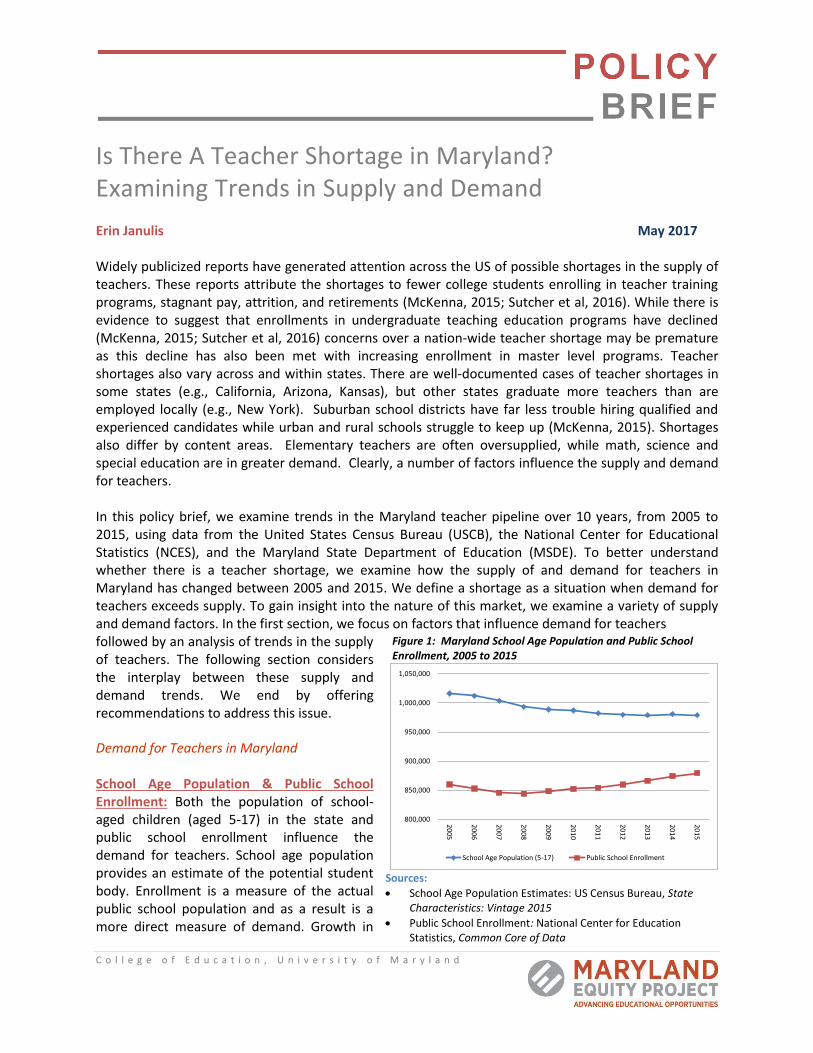
Is There A Teacher Shortage in Maryland? Examining Trends in Supply and Demand
Erin Janulis May 2017
Widely publicized reports have generated attention across the US of possible shortages in the supply of teachers. These reports attribute the shortages to fewer college students enrolling in teacher training programs, stagnant pay, attrition, and retirements (McKenna, 2015; Sutcher et al, 2016). While there is evidence to suggest that enrollments in undergraduate teaching education programs have declined (McKenna, 2015; Sutcher et al, 2016) concerns over a nation-wide teacher shortage may be premature as this decline has also been met with increasing enrollment in master level programs. Teacher shortages also vary across and within states. There are well-documented cases of teacher shortages in some states (e.g., California, Arizona, Kansas), but other states graduate more teachers than are employed locally (e.g., New York). Suburban school districts have far less trouble hiring qualified and experienced candidates while urban and rural schools struggle to keep up (McKenna, 2015). Shortages also differ by content areas. Elementary teachers are often oversupplied, while math, science and special education are in greater demand. Clearly, a number of factors influence the supply and demand for teachers.
In this policy brief, we examine trends in the Maryland teacher pipeline over 10 years, from 2005 to 2015, using data from the United States Census Bureau (USCB), the National Center for Educational Statistics (NCES), and the Maryland State Department of Education (MSDE). To better understand whether there is a teacher shortage, we examine how the supply of and demand for teachers in Maryland has changed between 2005 and 2015. We define a shortage as a situation when demand for teachers exceeds supply. To gain insight into the nature of this market, we examine a variety of supply and demand factors. In the first section, we focus on factors that influence demand for teachers followed by an analysis of trends in the supply of teachers. The following section considers the interplay between these supply and demand trends. We end by offering recommendations to address this issue.
Demand for Teachers in Maryland
School Age Population & Public School Enrollment: Both the population of school-aged children (aged 5-17) in the state and public school enrollment influence the demand for teachers. School age population provides an estimate of the potential student body. Enrollment is a measure of the actual public school population and as a result is a more direct measure of demand. Growth in
Figure 1: Maryland School Age Population and Public School Enrollment, 2005 to 2015
Sources:
School Age Population Estimates: US Census Bureau, StateCharacteristics: Vintage 2015
Public School Enrollment: National Center for Education Statistics, Common Core of Data
800,000
850,000
900,000
950,000
1,000,000
1,050,000
20
05
20
06
20
07
20
08
20
09
20
10
20
11
20
12
20
13
20
14
20
15
School Age Population (5-17) Public School Enrollment
C o l l e g e o f E d u c a t i o n , U n i v e r s i t y o f M a r y l a n d
enrollment generally indicates an increase in the demand for teachers. As Figure 1 shows, the total school age population in Maryland has declined 3.7%, from 1,016,053 in 2005 to 979,191 in 2015 (USCB, 2015). In contrast, public school enrollment declined 1.9% between 2005 and 2008, mirroring the population decline during that time period, but has climbed since, for an increase of 2.2% between 2005 and 2015 (NCES, 2016). If the number of students enrolling in public schools continues to increase, this may impact the number of teachers required in Maryland. Changes in class size also influence the demand for teachers. Many states saw an increase in the student-teacher ratio in a response to budget
cuts following the 2008 recession. Some have argued that as states attempt to return to pre-recession student teacher ratios (15.3:1 in 2008 compared to 16.0:1 in 2015 nationally), demand for teachers will increase (Sutcher et al, 2016). The student teacher ratio in Maryland has ranged from a 2008 pre-recession ratio of 14.3:1 to a high of 14.9:1 in 2013, and at 14.8:1 in 2014, it was below the nationwide pre-recession average of 15.3:1 (NCES, 2016). If the Maryland trend towards student-teacher ratios closer to pre-recession levels continues, Maryland may need additional teachers.
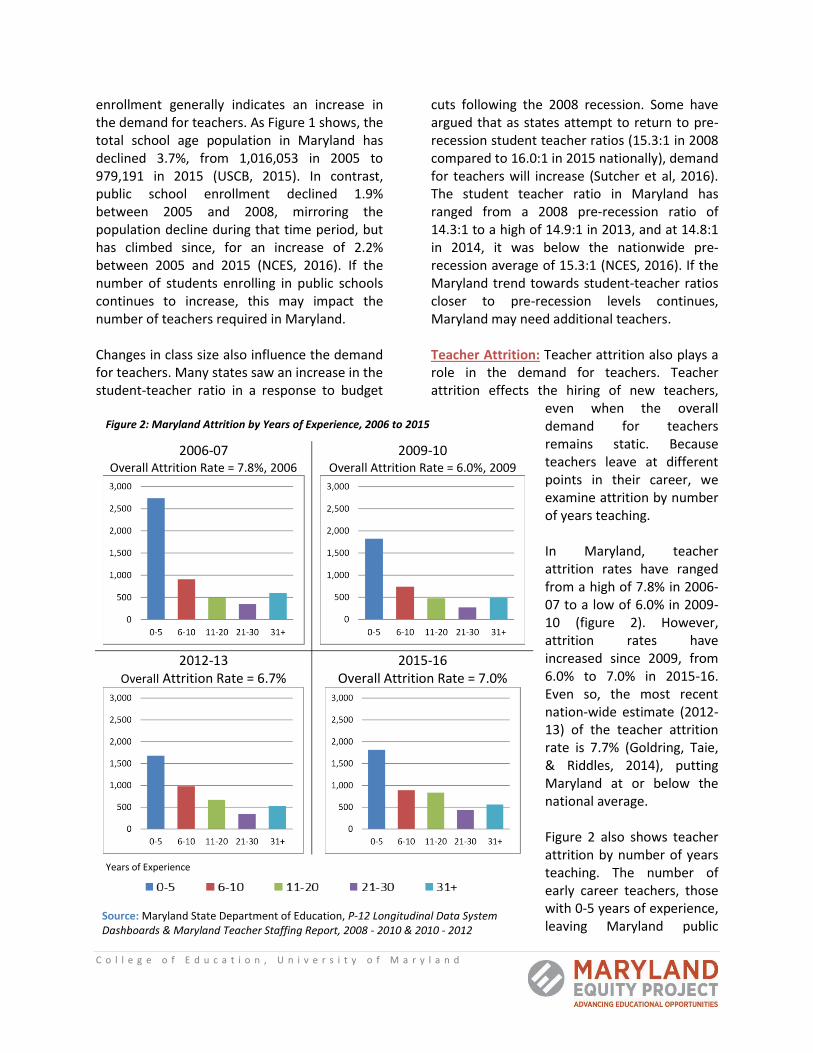
Teacher Attrition: Teacher attrition also plays a role in the demand for teachers. Teacher attrition effects the hiring of new teachers,
even when the overall demand for teachers remains static. Because teachers leave at different points in their career, we examine attrition by number of years teaching. In Maryland, teacher attrition rates have ranged from a high of 7.8% in 2006-07 to a low of 6.0% in 2009-10 (figure 2). However, attrition rates have increased since 2009, from 6.0% to 7.0% in 2015-16. Even so, the most recent nation-wide estimate (2012-13) of the teacher attrition rate is 7.7% (Goldring, Taie, & Riddles, 2014), putting Maryland at or below the national average. Figure 2 also shows teacher attrition by number of years teaching. The number of early career teachers, those with 0-5 years of experience, leaving Maryland public
2006-07 Overall Attrition Rate = 7.8%, 2006
2009-10 Overall Attrition Rate = 6.0%, 2009
2012-13 Overall Attrition Rate = 6.7%
2015-16 Overall Attrition Rate = 7.0%
Years of Experience
Source: Maryland State Department of Education, P-12 Longitudinal Data System Dashboards & Maryland Teacher Staffing Report, 2008 - 2010 & 2010 - 2012
Figure 2: Maryland Attrition by Years of Experience, 2006 to 2015
3 | C o l l e g e o f E d u c a t i o n , U n i v e r s i t y o f M a r y l a n d
schools dropped, from 2,737 in 2006-07 to 1,681 in 2012. This drop persisted despite an overall attrition rate increase of 0.7% from 2009-10 to 2012-13. While fewer early career teachers leave the profession they still accounted for 40% of overall attrition in 2015-16. At the other end of the spectrum, the proportion of teachers leaving late in their career or retiring (21+ years of experience), remained fairly constant at 12-13%, ranging from a low of 755 in 2009-10 to a high of 999 in 2015-16. While there is often a concern about retiring baby boomers, these data suggest that the wave of retirements among this generation has passed. Instead, mid-career teachers, those with 6-10 and 11-20 years of experience, make up a larger number (increasing from 1,398 in 2006-07 to 1,722 in 2015-16) of those leaving the state’s public schools. This suggests that although the state has improved the retention of teachers early in their career, it has not had substantial effects on overall attrition rates because more mid-career teachers are leaving. Other Demand Factors: Teachers are certified in a specific content area, and typically, there are some content areas that are considered surplus areas while others are traditional shortage areas. MSDE estimates teacher shortages in critical content areas using a regression analysis of the number of teachers hired in a given year compared to the number of teachers produced by colleges and universities in Maryland for each certification area. While hiring data used in the regression analysis includes in-state and out-of-state hires, the production data includes only those graduates from Maryland institutions of higher education. Since more than half of new hires in Maryland are from out of state (see figure 6), this method inflates content area teacher shortages because it does not take into account out of state hires. That said, in 2016 MSDE reported critical teacher shortages in art, dance, Family and consumer sciences, technology education, English, ESOL, foreign language (French & Spanish), mathematics, science, and special education (MSDE, 2016).
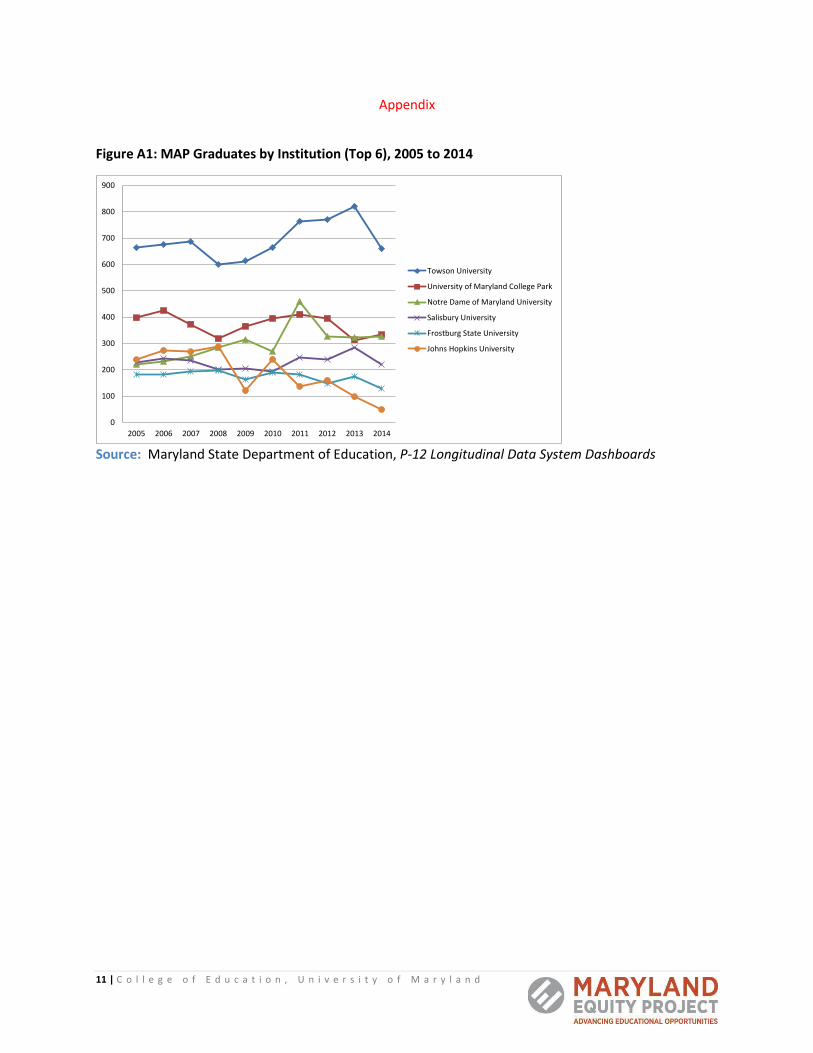
Research suggests that urban and rural school districts tend to have a harder time filling positions than suburban districts (Schwartzbeck, et al, 2005, Hanushek, Kain, & Rivkin, 2004). However, Maryland does not have a measure to track teacher shortages by geographic region that is independent of content area shortages. MSDE collects information on geographic shortages in content areas from a school district survey, which asks whether the district wants to be declared an area of geographic shortage. All counties in Maryland have declared shortages in at least one content area (MSDE, 2016). Supply of Teachers in Maryland Maryland Teacher Pipeline: Compared to other fields, licensing requirements create relatively high barriers to entry to the teaching field. To earn certification, students must attend a state approved teacher-training program, earn a bachelor’s degree, and pass a teacher certification exam. To measure the supply of teachers, we use: (1) the number of graduates of Maryland teacher education programs, and (2) enrollment in Maryland teacher education programs. There is more than one path to obtaining a teaching certificate in Maryland. The primary path is through a Maryland Academic Program (MAP). These are educator preparation programs approved by MSDE and offered by 23 colleges and universities in Maryland (MSDE, 2015). MAP graduates receive a bachelors’ or masters’ degree and are certified to teach in Maryland. MAPs may also offer certificate programs for those who have a non-teaching B.A. and wish to obtain teaching licensure without obtaining an additional degree. Of the 23 programs, six institutions produce roughly three-fourths of the candidates: Towson University, University of Maryland College Park, Johns Hopkins University, Salisbury University, Notre Dame of Maryland University, Frostburg State University (see Appendix figure A1 for graduates by institution).
4 | C o l l e g e o f E d u c a t i o n , U n i v e r s i t y o f M a r y l a n d
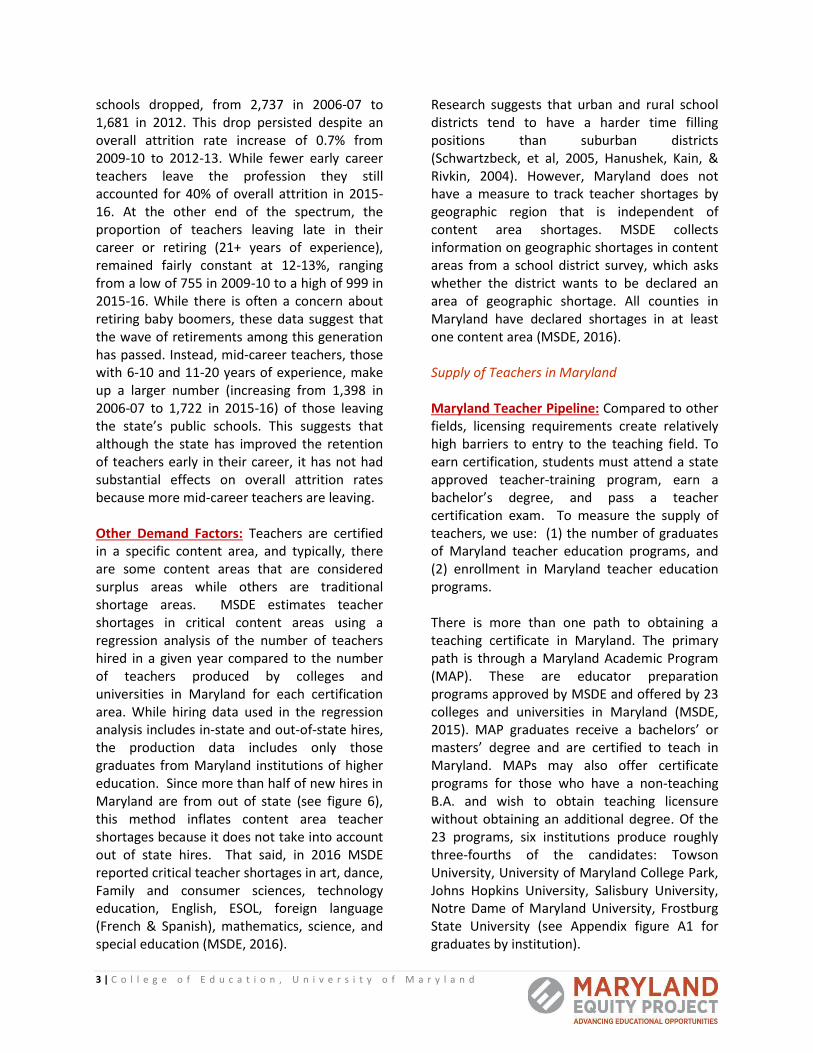
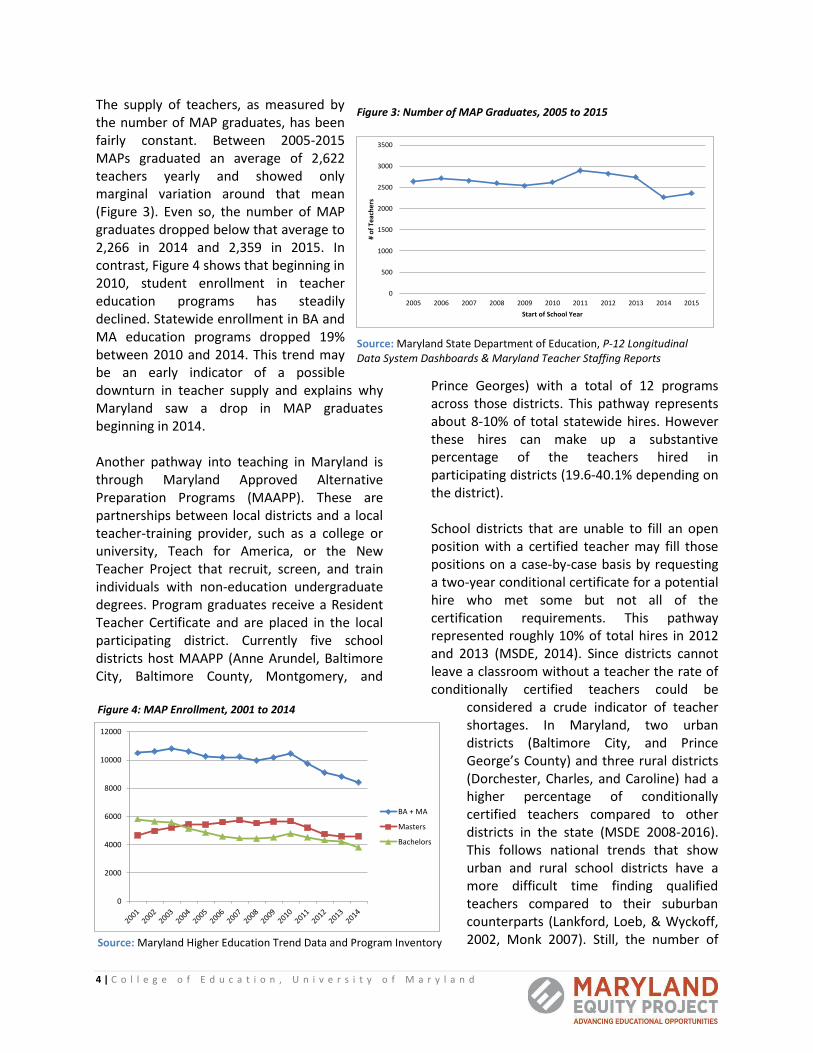
The supply of teachers, as measured by the number of MAP graduates, has been fairly constant. Between 2005-2015 MAPs graduated an average of 2,622 teachers yearly and showed only marginal variation around that mean (Figure 3). Even so, the number of MAP graduates dropped below that average to 2,266 in 2014 and 2,359 in 2015. In contrast, Figure 4 shows that beginning in 2010, student enrollment in teacher education programs has steadily declined. Statewide enrollment in BA and MA education programs dropped 19% between 2010 and 2014. This trend may be an early indicator of a possible downturn in teacher supply and explains why Maryland saw a drop in MAP graduates beginning in 2014. Another pathway into teaching in Maryland is through Maryland Approved Alternative Preparation Programs (MAAPP). These are partnerships between local districts and a local teacher-training provider, such as a college or university, Teach for America, or the New Teacher Project that recruit, screen, and train individuals with non-education undergraduate degrees. Program graduates receive a Resident Teacher Certificate and are placed in the local participating district. Currently five school districts host MAAPP (Anne Arundel, Baltimore City, Baltimore County, Montgomery, and
Prince Georges) with a total of 12 programs across those districts. This pathway represents about 8-10% of total statewide hires. However these hires can make up a substantive percentage of the teachers hired in participating districts (19.6-40.1% depending on the district). School districts that are unable to fill an open position with a certified teacher may fill those positions on a case-by-case basis by requesting a two-year conditional certificate for a potential hire who met some but not all of the certification requirements. This pathway represented roughly 10% of total hires in 2012 and 2013 (MSDE, 2014). Since districts cannot leave a classroom without a teacher the rate of conditionally certified teachers could be
considered a crude indicator of teacher shortages. In Maryland, two urban districts (Baltimore City, and Prince George’s County) and three rural districts (Dorchester, Charles, and Caroline) had a higher percentage of conditionally certified teachers compared to other districts in the state (MSDE 2008-2016). This follows national trends that show urban and rural school districts have a more difficult time finding qualified teachers compared to their suburban counterparts (Lankford, Loeb, & Wyckoff, 2002, Monk 2007). Still, the number of
Figure 4: MAP Enrollment, 2001 to 2014
Source: Maryland Higher Education Trend Data and Program Inventory
0
2000
4000
6000
8000
10000
12000
BA + MA
Masters
Bachelors
Figure 3: Number of MAP Graduates, 2005 to 2015
Source: Maryland State Department of Education, P-12 Longitudinal Data System Dashboards & Maryland Teacher Staffing Reports
0
500
1000
1500
2000
2500
3000
3500
2005 2006 2007 2008 2009 2010 2011 2012 2013 2014 2015
# o
f Te
ach
ers
Start of School Year
5 | C o l l e g e o f E d u c a t i o n , U n i v e r s i t y o f M a r y l a n d
teachers holding a conditional certificate has declined dramatically in the last 10 years, from 7.5% of all teachers in 2006 (MSDE, 2006) to 1% in 2013 (MSDE, 2014). This drop is likely related to school district efforts to meet the federal highly qualified teacher requirements (MSDE, 2012). Given that federal law no longer requires that core teachers achieve highly qualified status, this may change in the future. Since many teachers receive their teacher training and/or initial license in other states, Maryland offers pathways for graduates from approved out of state programs to receive their initial certificate or transfer their out of state teaching license to Maryland. Maryland has historically been an import state, and as a result these out of state hires account for a significant portion of the total supply of teachers. Trends in the Teacher Labor Market in Maryland Changes in Hiring: The critical question is whether the supply of teachers is sufficient to meet the demand for teachers. This section compares trends in the supply and demand for teachers. Figure 5 compares the number of teachers hired to the number of MAP graduates. It shows that Maryland hires more teachers than it graduates from MAPs. Between 2006 and 2010 the number of teachers hired dropped
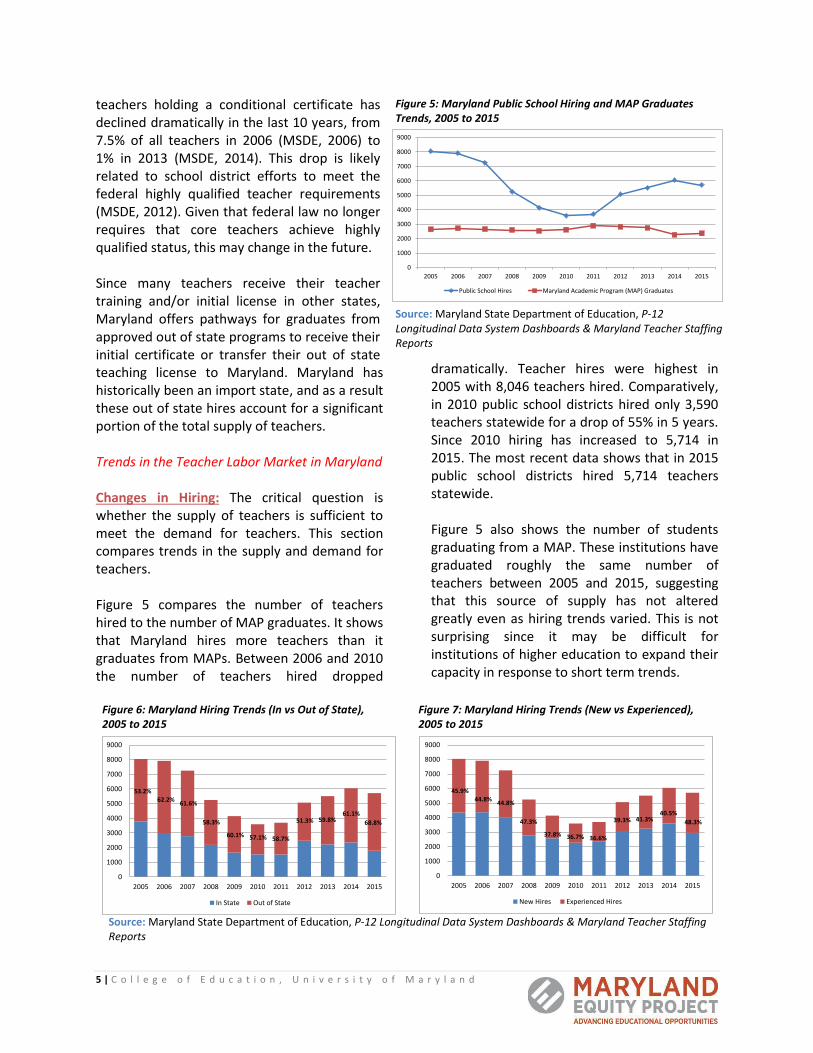
dramatically. Teacher hires were highest in 2005 with 8,046 teachers hired. Comparatively, in 2010 public school districts hired only 3,590 teachers statewide for a drop of 55% in 5 years. Since 2010 hiring has increased to 5,714 in 2015. The most recent data shows that in 2015 public school districts hired 5,714 teachers statewide. Figure 5 also shows the number of students graduating from a MAP. These institutions have graduated roughly the same number of teachers between 2005 and 2015, suggesting that this source of supply has not altered greatly even as hiring trends varied. This is not surprising since it may be difficult for institutions of higher education to expand their capacity in response to short term trends.
Figure 5: Maryland Public School Hiring and MAP Graduates Trends, 2005 to 2015
Source: Maryland State Department of Education, P-12 Longitudinal Data System Dashboards & Maryland Teacher Staffing Reports
0
1000
2000
3000
4000
5000
6000
7000
8000
9000
2005 2006 2007 2008 2009 2010 2011 2012 2013 2014 2015
Public School Hires Maryland Academic Program (MAP) Graduates
Figure 7: Maryland Hiring Trends (New vs Experienced), 2005 to 2015
Figure 6: Maryland Hiring Trends (In vs Out of State), 2005 to 2015
Source: Maryland State Department of Education, P-12 Longitudinal Data System Dashboards & Maryland Teacher Staffing Reports
0
1000
2000
3000
4000
5000
6000
7000
8000
9000
2005 2006 2007 2008 2009 2010 2011 2012 2013 2014 2015
In State Out of State
53.2%62.2%
61.6%
58.3%
60.1% 57.1% 58.7%
51.3% 59.8%61.1%
68.8%
0
1000
2000
3000
4000
5000
6000
7000
8000
9000
2005 2006 2007 2008 2009 2010 2011 2012 2013 2014 2015
New Hires Experienced Hires
45.9%44.8%
44.8%
47.3%
37.8% 36.7% 36.6%
39.3% 41.3%40.5%
48.3%
6 | C o l l e g e o f E d u c a t i o n , U n i v e r s i t y o f M a r y l a n d
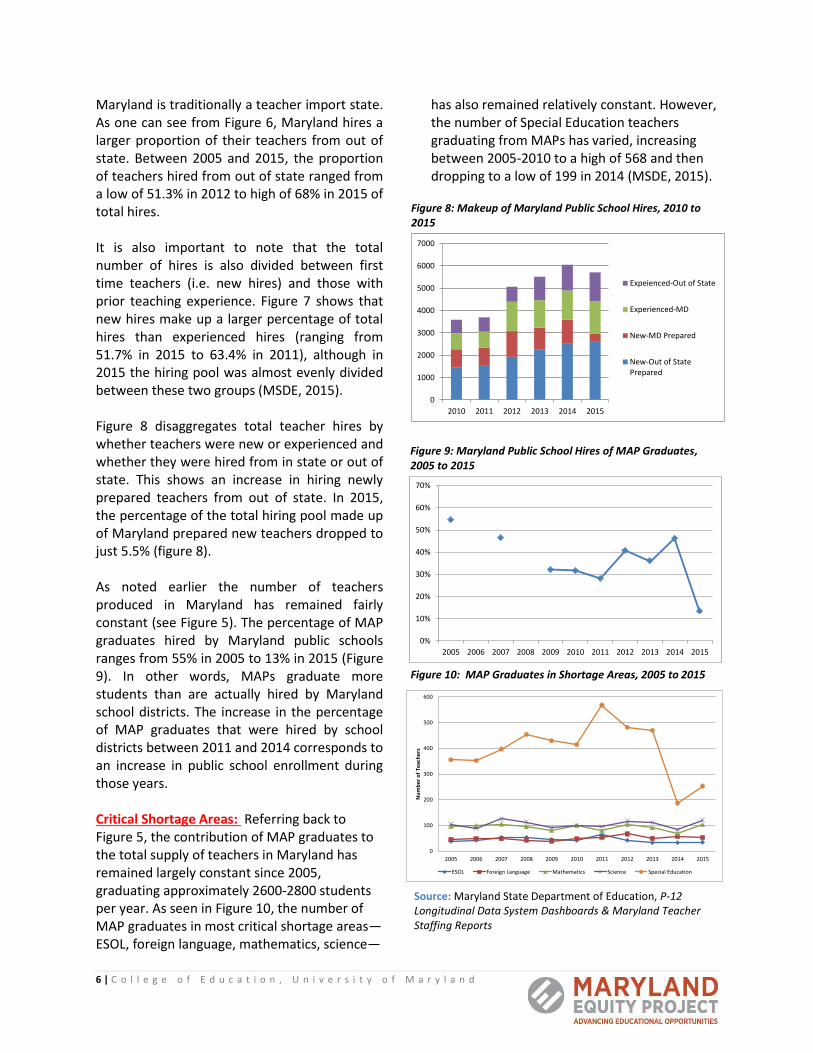
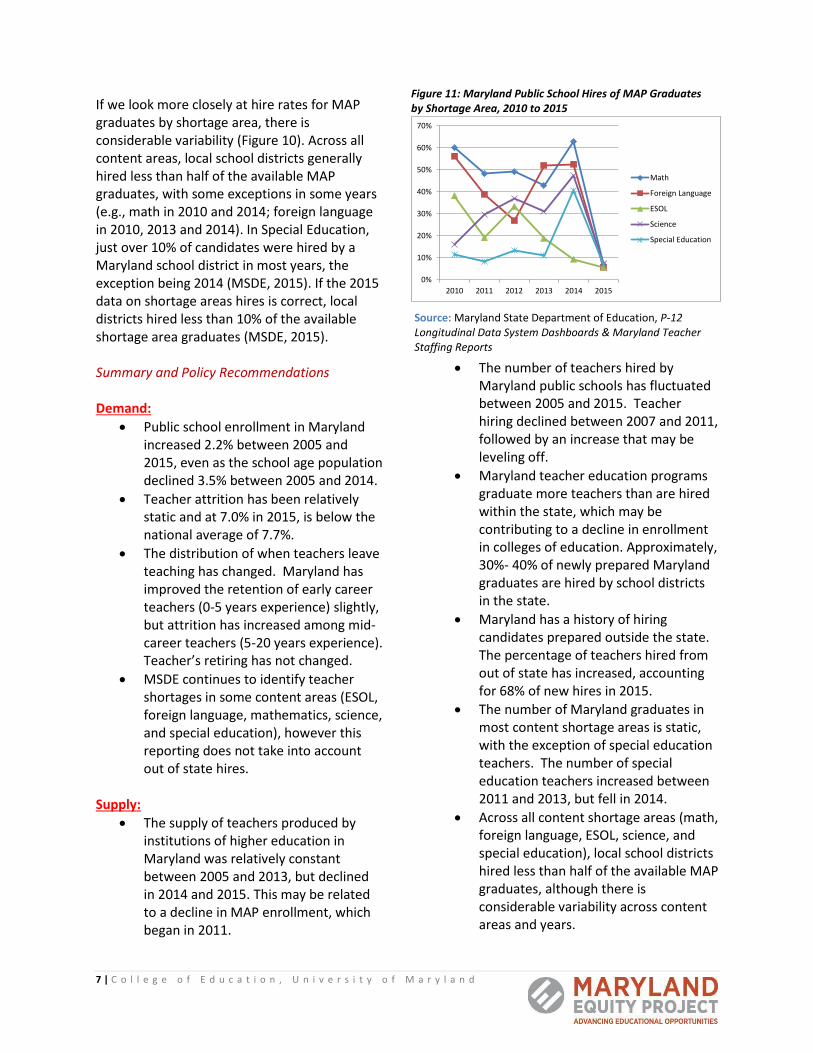
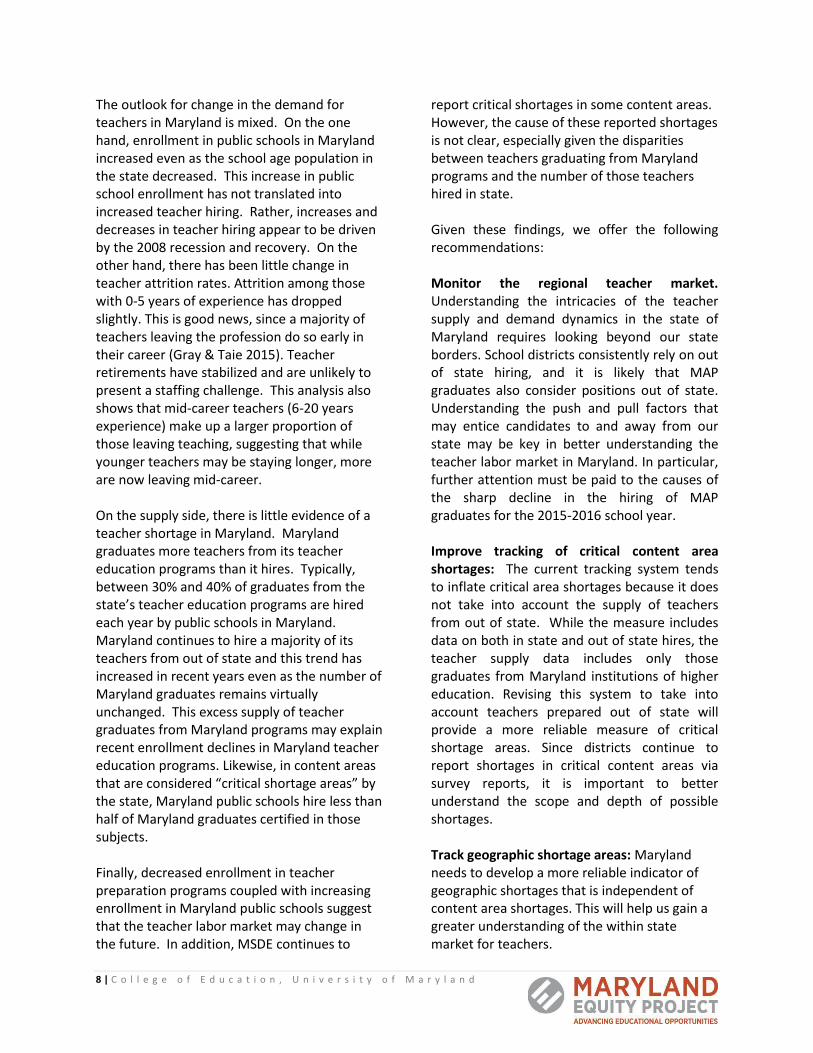
Maryland is traditionally a teacher import state. As one can see from Figure 6, Maryland hires a larger proportion of their teachers from out of state. Between 2005 and 2015, the proportion of teachers hired from out of state ranged from a low of 51.3% in 2012 to high of 68% in 2015 of total hires. It is also important to note that the total number of hires is also divided between first time teachers (i.e. new hires) and those with prior teaching experience. Figure 7 shows that new hires make up a larger percentage of total hires than experienced hires (ranging from 51.7% in 2015 to 63.4% in 2011), although in 2015 the hiring pool was almost evenly divided between these two groups (MSDE, 2015). Figure 8 disaggregates total teacher hires by whether teachers were new or experienced and whether they were hired from in state or out of state. This shows an increase in hiring newly prepared teachers from out of state. In 2015, the percentage of the total hiring pool made up of Maryland prepared new teachers dropped to just 5.5% (figure 8). As noted earlier the number of teachers produced in Maryland has remained fairly constant (see Figure 5). The percentage of MAP graduates hired by Maryland public schools ranges from 55% in 2005 to 13% in 2015 (Figure 9). In other words, MAPs graduate more students than are actually hired by Maryland school districts. The increase in the percentage of MAP graduates that were hired by school districts between 2011 and 2014 corresponds to an increase in public school enrollment during those years. Critical Shortage Areas: Referring back to Figure 5, the contribution of MAP graduates to the total supply of teachers in Maryland has remained largely constant since 2005, graduating approximately 2600-2800 students per year. As seen in Figure 10, the number of MAP graduates in most critical shortage areas—ESOL, foreign language, mathematics, science—
has also remained relatively constant. However, the number of Special Education teachers graduating from MAPs has varied, increasing between 2005-2010 to a high of 568 and then dropping to a low of 199 in 2014 (MSDE, 2015).
Figure 10: MAP Graduates in Shortage Areas, 2005 to 2015
Source: Maryland State Department of Education, P-12 Longitudinal Data System Dashboards & Maryland Teacher Staffing Reports
0
100
200
300
400
500
600
2005 2006 2007 2008 2009 2010 2011 2012 2013 2014 2015
Nu
mb
er
of
Teac
he
rs
ESOL Foreign Language Mathematics Science Special Education
Figure 9: Maryland Public School Hires of MAP Graduates, 2005 to 2015
0%
10%
20%
30%
40%
50%
60%
70%
2005 2006 2007 2008 2009 2010 2011 2012 2013 2014 2015
Figure 8: Makeup of Maryland Public School Hires, 2010 to 2015
0
1000
2000
3000
4000
5000
6000
7000
2010 2011 2012 2013 2014 2015
Expeienced-Out of State
Experienced-MD
New-MD Prepared
New-Out of StatePrepared
7 | C o l l e g e o f E d u c a t i o n , U n i v e r s i t y o f M a r y l a n d
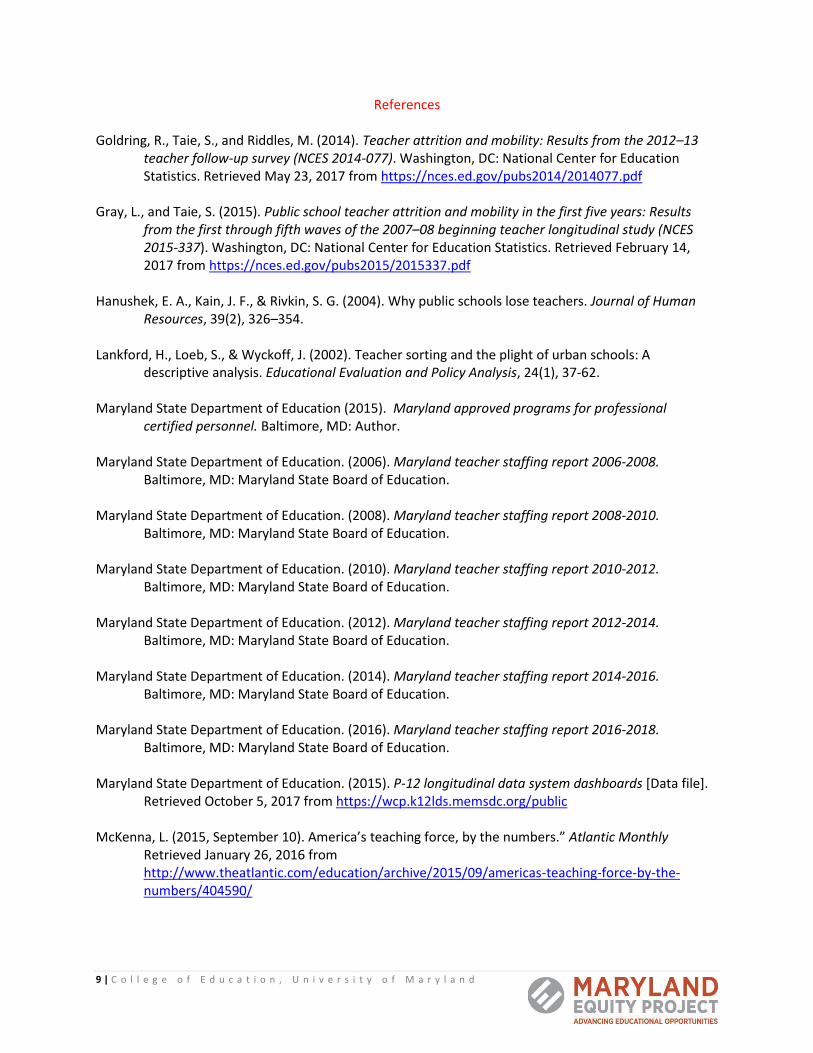
If we look more closely at hire rates for MAP graduates by shortage area, there is considerable variability (Figure 10). Across all content areas, local school districts generally hired less than half of the available MAP graduates, with some exceptions in some years (e.g., math in 2010 and 2014; foreign language in 2010, 2013 and 2014). In Special Education, just over 10% of candidates were hired by a Maryland school district in most years, the exception being 2014 (MSDE, 2015). If the 2015 data on shortage areas hires is correct, local districts hired less than 10% of the available shortage area graduates (MSDE, 2015). Summary and Policy Recommendations Demand:
Public school enrollment in Maryland increased 2.2% between 2005 and 2015, even as the school age population declined 3.5% between 2005 and 2014.
Teacher attrition has been relatively static and at 7.0% in 2015, is below the national average of 7.7%.
The distribution of when teachers leave teaching has changed. Maryland has improved the retention of early career teachers (0-5 years experience) slightly, but attrition has increased among mid-career teachers (5-20 years experience). Teacher’s retiring has not changed.
MSDE continues to identify teacher shortages in some content areas (ESOL, foreign language, mathematics, science, and special education), however this reporting does not take into account out of state hires.
Supply:
The supply of teachers produced by institutions of higher education in Maryland was relatively constant between 2005 and 2013, but declined in 2014 and 2015. This may be related to a decline in MAP enrollment, which began in 2011.
The number of teachers hired by Maryland public schools has fluctuated between 2005 and 2015. Teacher hiring declined between 2007 and 2011, followed by an increase that may be leveling off.
Maryland teacher education programs graduate more teachers than are hired within the state, which may be contributing to a decline in enrollment in colleges of education. Approximately, 30%- 40% of newly prepared Maryland graduates are hired by school districts in the state.
Maryland has a history of hiring candidates prepared outside the state. The percentage of teachers hired from out of state has increased, accounting for 68% of new hires in 2015.
The number of Maryland graduates in most content shortage areas is static, with the exception of special education teachers. The number of special education teachers increased between 2011 and 2013, but fell in 2014.
Across all content shortage areas (math, foreign language, ESOL, science, and special education), local school districts hired less than half of the available MAP graduates, although there is considerable variability across content areas and years.
Figure 11: Maryland Public School Hires of MAP Graduates by Shortage Area, 2010 to 2015
Source: Maryland State Department of Education, P-12 Longitudinal Data System Dashboards & Maryland Teacher Staffing Reports
0%
10%
20%
30%
40%
50%
60%
70%
2010 2011 2012 2013 2014 2015
Math
Foreign Language
ESOL
Science
Special Education
8 | C o l l e g e o f E d u c a t i o n , U n i v e r s i t y o f M a r y l a n d
The outlook for change in the demand for teachers in Maryland is mixed. On the one hand, enrollment in public schools in Maryland increased even as the school age population in the state decreased. This increase in public school enrollment has not translated into increased teacher hiring. Rather, increases and decreases in teacher hiring appear to be driven by the 2008 recession and recovery. On the other hand, there has been little change in teacher attrition rates. Attrition among those with 0-5 years of experience has dropped slightly. This is good news, since a majority of teachers leaving the profession do so early in their career (Gray & Taie 2015). Teacher retirements have stabilized and are unlikely to present a staffing challenge. This analysis also shows that mid-career teachers (6-20 years experience) make up a larger proportion of those leaving teaching, suggesting that while younger teachers may be staying longer, more are now leaving mid-career. On the supply side, there is little evidence of a teacher shortage in Maryland. Maryland graduates more teachers from its teacher education programs than it hires. Typically, between 30% and 40% of graduates from the state’s teacher education programs are hired each year by public schools in Maryland. Maryland continues to hire a majority of its teachers from out of state and this trend has increased in recent years even as the number of Maryland graduates remains virtually unchanged. This excess supply of teacher graduates from Maryland programs may explain recent enrollment declines in Maryland teacher education programs. Likewise, in content areas that are considered “critical shortage areas” by the state, Maryland public schools hire less than half of Maryland graduates certified in those subjects. Finally, decreased enrollment in teacher preparation programs coupled with increasing enrollment in Maryland public schools suggest that the teacher labor market may change in the future. In addition, MSDE continues to
report critical shortages in some content areas. However, the cause of these reported shortages is not clear, especially given the disparities between teachers graduating from Maryland programs and the number of those teachers hired in state. Given these findings, we offer the following recommendations: Monitor the regional teacher market. Understanding the intricacies of the teacher supply and demand dynamics in the state of Maryland requires looking beyond our state borders. School districts consistently rely on out of state hiring, and it is likely that MAP graduates also consider positions out of state. Understanding the push and pull factors that may entice candidates to and away from our state may be key in better understanding the teacher labor market in Maryland. In particular, further attention must be paid to the causes of the sharp decline in the hiring of MAP graduates for the 2015-2016 school year. Improve tracking of critical content area shortages: The current tracking system tends to inflate critical area shortages because it does not take into account the supply of teachers from out of state. While the measure includes data on both in state and out of state hires, the teacher supply data includes only those graduates from Maryland institutions of higher education. Revising this system to take into account teachers prepared out of state will provide a more reliable measure of critical shortage areas. Since districts continue to report shortages in critical content areas via survey reports, it is important to better understand the scope and depth of possible shortages. Track geographic shortage areas: Maryland needs to develop a more reliable indicator of geographic shortages that is independent of content area shortages. This will help us gain a greater understanding of the within state market for teachers.
9 | C o l l e g e o f E d u c a t i o n , U n i v e r s i t y o f M a r y l a n d
References Goldring, R., Taie, S., and Riddles, M. (2014). Teacher attrition and mobility: Results from the 2012–13
teacher follow-up survey (NCES 2014-077). Washington, DC: National Center for Education Statistics. Retrieved May 23, 2017 from https://nces.ed.gov/pubs2014/2014077.pdf
Gray, L., and Taie, S. (2015). Public school teacher attrition and mobility in the first five years: Results
from the first through fifth waves of the 2007–08 beginning teacher longitudinal study (NCES 2015-337). Washington, DC: National Center for Education Statistics. Retrieved February 14, 2017 from https://nces.ed.gov/pubs2015/2015337.pdf
Hanushek, E. A., Kain, J. F., & Rivkin, S. G. (2004). Why public schools lose teachers. Journal of Human
Resources, 39(2), 326–354. Lankford, H., Loeb, S., & Wyckoff, J. (2002). Teacher sorting and the plight of urban schools: A
descriptive analysis. Educational Evaluation and Policy Analysis, 24(1), 37-62. Maryland State Department of Education (2015). Maryland approved programs for professional
certified personnel. Baltimore, MD: Author. Maryland State Department of Education. (2006). Maryland teacher staffing report 2006-2008.
Baltimore, MD: Maryland State Board of Education. Maryland State Department of Education. (2008). Maryland teacher staffing report 2008-2010.
Baltimore, MD: Maryland State Board of Education. Maryland State Department of Education. (2010). Maryland teacher staffing report 2010-2012.
Baltimore, MD: Maryland State Board of Education. Maryland State Department of Education. (2012). Maryland teacher staffing report 2012-2014.
Baltimore, MD: Maryland State Board of Education. Maryland State Department of Education. (2014). Maryland teacher staffing report 2014-2016.
Baltimore, MD: Maryland State Board of Education. Maryland State Department of Education. (2016). Maryland teacher staffing report 2016-2018.
Baltimore, MD: Maryland State Board of Education. Maryland State Department of Education. (2015). P-12 longitudinal data system dashboards [Data file].
Retrieved October 5, 2017 from https://wcp.k12lds.memsdc.org/public McKenna, L. (2015, September 10). America’s teaching force, by the numbers.” Atlantic Monthly
Retrieved January 26, 2016 from http://www.theatlantic.com/education/archive/2015/09/americas-teaching-force-by-the-numbers/404590/
10 | C o l l e g e o f E d u c a t i o n , U n i v e r s i t y o f M a r y l a n d
Monk, D. H. (2007). Recruiting and retaining high-quality teachers in rural areas. The Future of Children, 17(1), 155-174.
National Center for Education Statistics. (2016). State nonfiscal survey of public elementary/secondary
education, 1990-91 through 2015-16. U.S. Department of Education, Common Core of Data, (CCD) Retrieved December 1, 2016 from https://nces.ed.gov/ccd/stnfis.asp
National Center for Education Statistics. (2014) Digest of educational statistics: Postsecondary education
2000-2013. Retrieved December 1, 2016 from https://nces.ed.gov/programs/digest/current_tables.asp
Schwartzbeck, T.D., Prince, C. D., Redfield, D., Morris, H., & Hammer, P.C. (2003). How are rural districts
meeting the teacher quality requirements of No Child Left Behind? Charleston, WV: Appalachia Educational Laboratory.
Sutcher, L., Darling-Hammond, L., & Carver-Thomas, D (2016). A coming crisis in teaching? Teacher
supply, demand, and shortages in the U.S. Palo Alto, CA: Learning Policy Institute. United States Census Bureau. (2014). Annual estimates of the resident population. [Data file]. Retrieved
from http://factfinder.census.gov/faces/tableservices/jsf/pages/productview.xhtml?src=bkmk
11 | C o l l e g e o f E d u c a t i o n , U n i v e r s i t y o f M a r y l a n d
Appendix
Figure A1: MAP Graduates by Institution (Top 6), 2005 to 2014
Source: Maryland State Department of Education, P-12 Longitudinal Data System Dashboards
0
100
200
300
400
500
600
700
800
900
2005 2006 2007 2008 2009 2010 2011 2012 2013 2014
Towson University
University of Maryland College Park
Notre Dame of Maryland University
Salisbury University
Frostburg State University
Johns Hopkins University
12 | C o l l e g e o f E d u c a t i o n , U n i v e r s i t y o f M a r y l a n d
About the Maryland Equity Project The Maryland Equity Project seeks to improve education through research that supports an informed public policy debate on the quality and distribution of educational opportunities. It conducts, synthesizes, and distributes research on key educational issues in Maryland and facilitates collaboration between researchers and policymakers. The Maryland Equity Project is a program in the Department of Teaching and Learning, Policy and Leadership in the College of Education at The University of Maryland. Copyright © 2017 The Maryland Equity Project, University of Maryland, College Park, MD. This publication should be cited as: Janulis, E.M. (2017). Is there a teacher shortage in Maryland? Examining trends in supply and demand. College Park, MD: Maryland Equity Project, The University of Maryland. Additional copies of this report may be obtained from our Web site at: www.mdequity.org Maryland Equity Project College of Education University of Maryland 2110 Benjamin Building College Park, MD 20740 Phone: 301-932-1934 Email: [email protected] Website: www.mdequity.org Twitter @mdequity
About the Author
Erin Janulis is a research assistant with the Maryland Equity Project and a second year doctoral student in the Education Policy Studies Program in the Department of Teaching and Learning, Policy and Leadership in the College of Education, University of Maryland.

Somerset County Public SchoolsSomerset Intermediate School
June 28, 2017
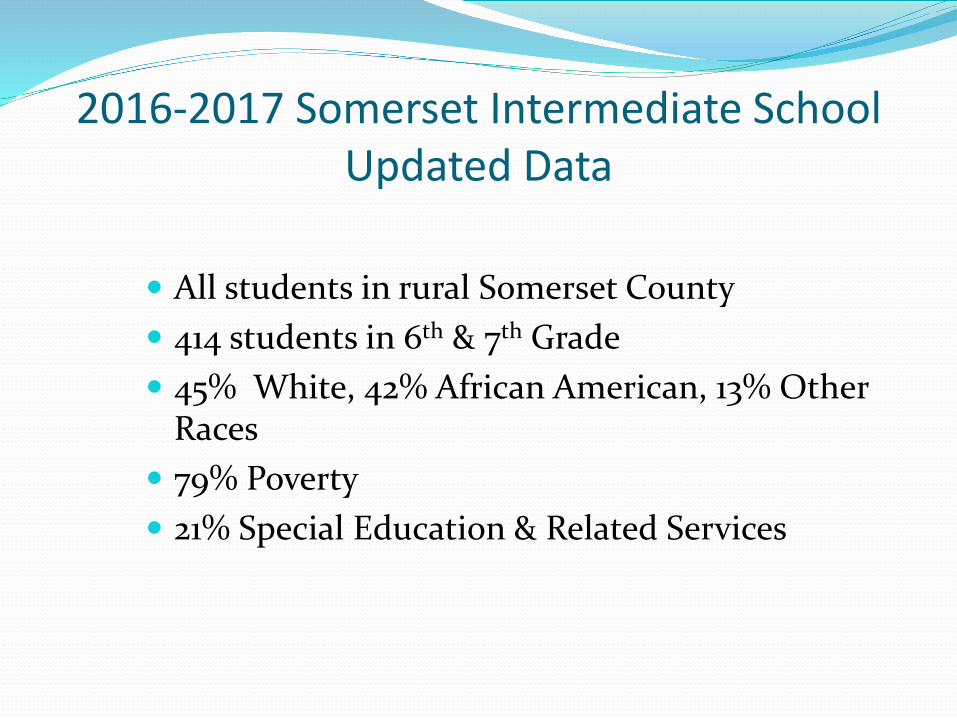
2016-2017 Somerset Intermediate School Updated Data
All students in rural Somerset County 414 students in 6th & 7th Grade 45% White, 42% African American, 13% Other
Races 79% Poverty 21% Special Education & Related Services
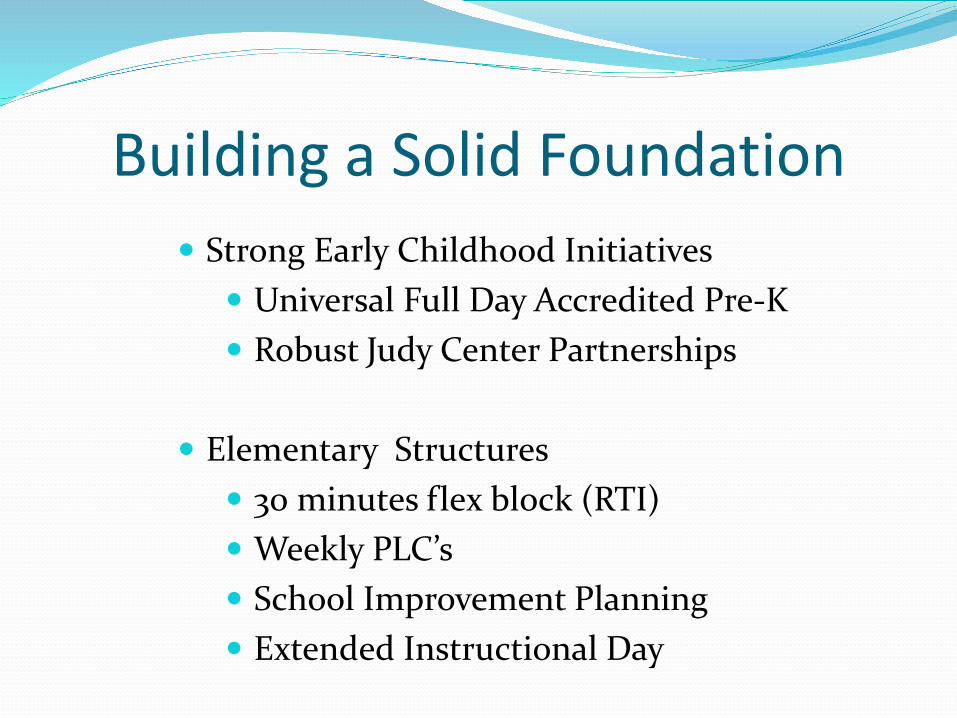
Building a Solid Foundation Strong Early Childhood Initiatives
Universal Full Day Accredited Pre-K Robust Judy Center Partnerships
Elementary Structures 30 minutes flex block (RTI) Weekly PLC’s School Improvement Planning Extended Instructional Day
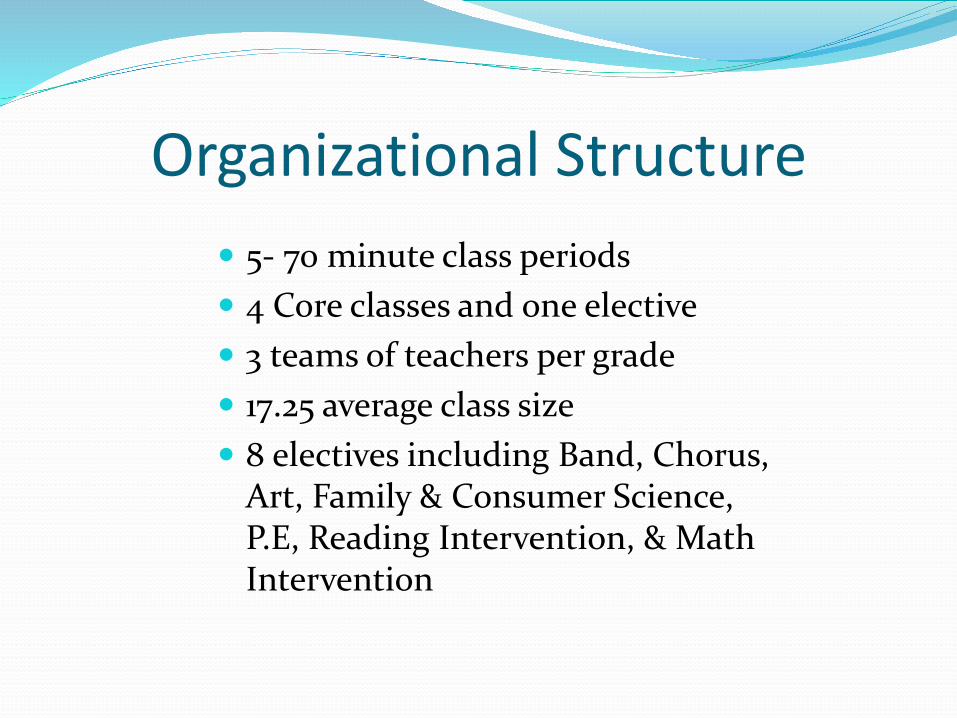
Organizational Structure 5- 70 minute class periods 4 Core classes and one elective 3 teams of teachers per grade 17.25 average class size 8 electives including Band, Chorus,
Art, Family & Consumer Science, P.E, Reading Intervention, & Math Intervention
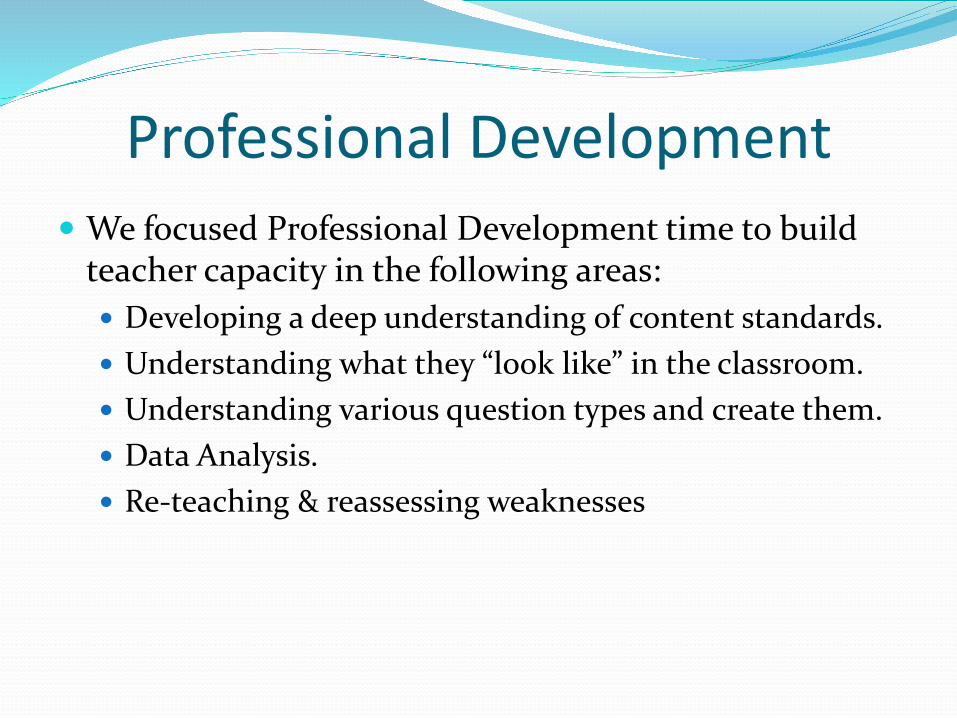
Professional Development We focused Professional Development time to build
teacher capacity in the following areas: Developing a deep understanding of content standards. Understanding what they “look like” in the classroom. Understanding various question types and create them. Data Analysis. Re-teaching & reassessing weaknesses

Teacher Collaboration Weekly Team Meeting (ELA, Math, SS, Science)
Monthly SIT meetings
Monthly Content Meetings
Negotiated Professional Development Days

Curriculum Alignment/Assessment Writing Monthly meeting for each content group lead by the
Instructional Facilitator and/or content supervisor. Jason Pfirman- 7th Grade Social Studies
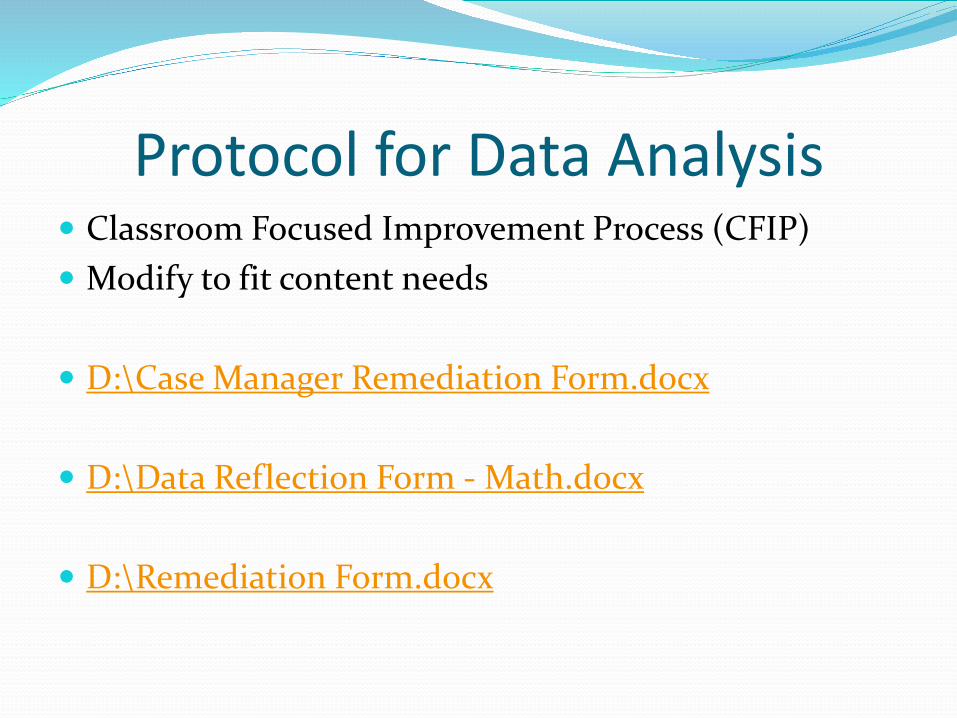
Protocol for Data Analysis Classroom Focused Improvement Process (CFIP) Modify to fit content needs
D:\Case Manager Remediation Form.docx
D:\Data Reflection Form - Math.docx
D:\Remediation Form.docx

What do the teacher’s think? Mrs. DeVaughn- 6th grade Math
Intervention/Enrichment Support Pull Out/Push In Nikki Carpenter-7th grade Math
SCPS…Success Nothing Less
Small but Mighty Working together toward a common goal Family Culture
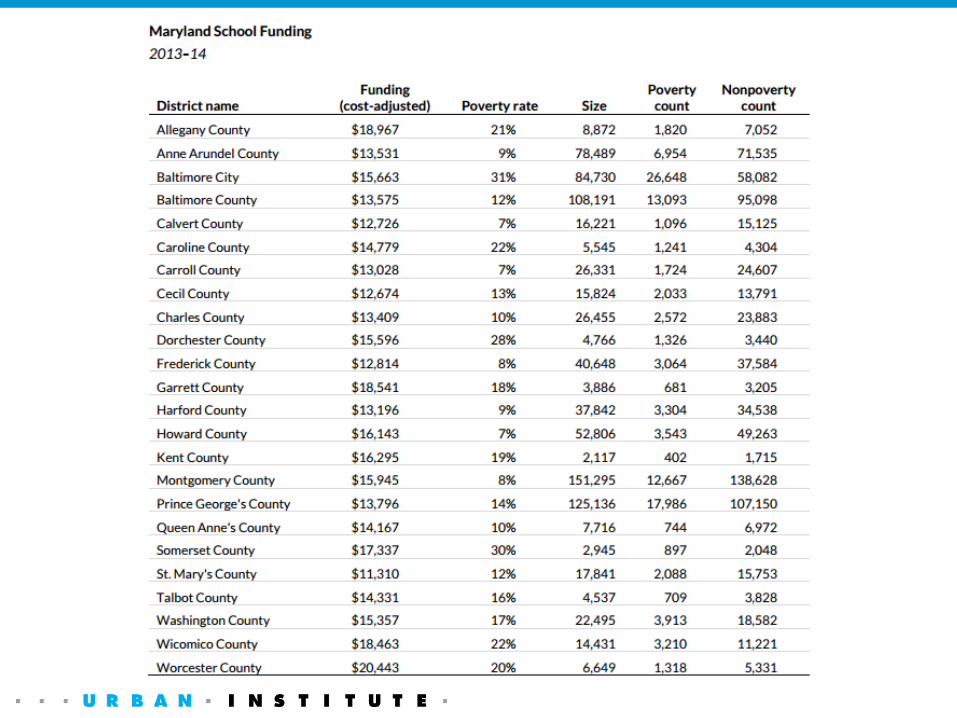
Student Achievement and School Funding: How Does
Maryland Compare?Matthew M. Chingos
Commission on Innovation and Excellence in Education June 28, 2017
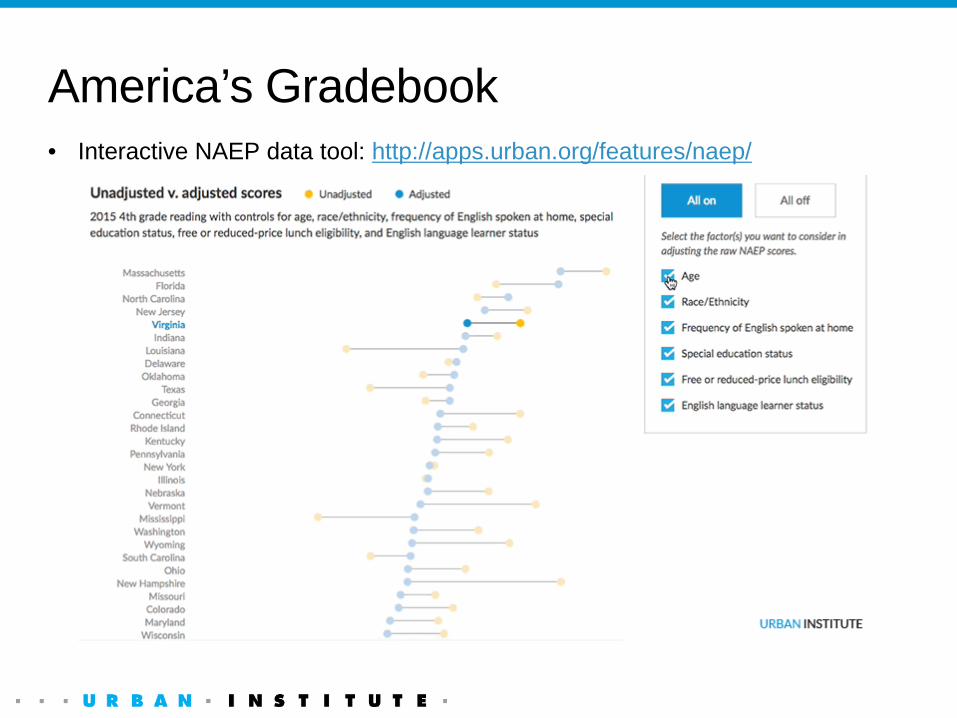
America’s Gradebook• Interactive NAEP data tool: http://apps.urban.org/features/naep/
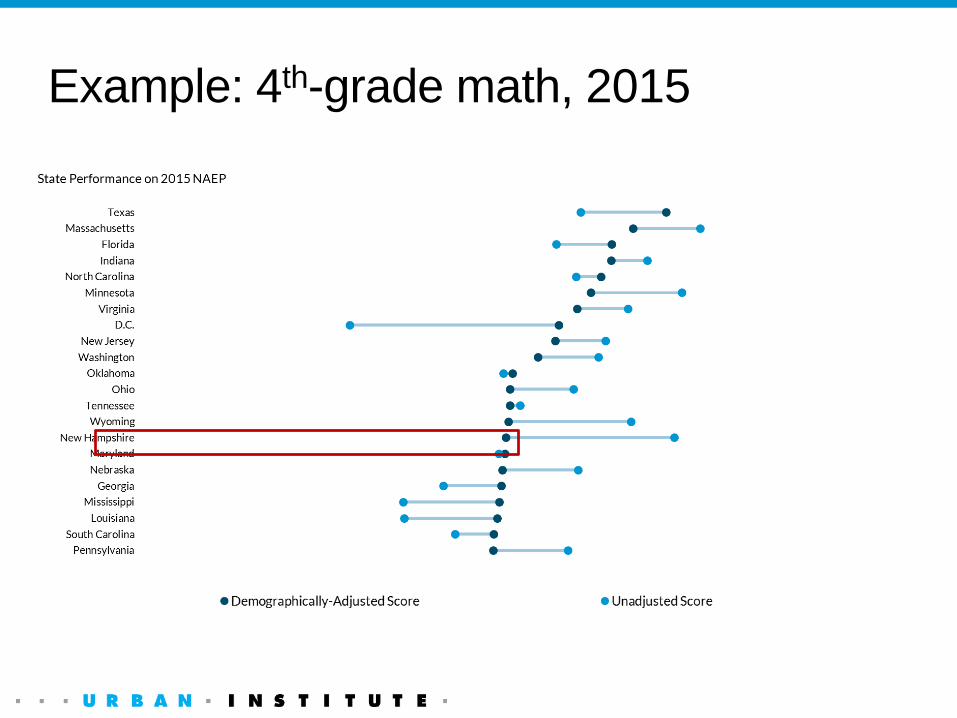
Example: 4th-grade math, 2015
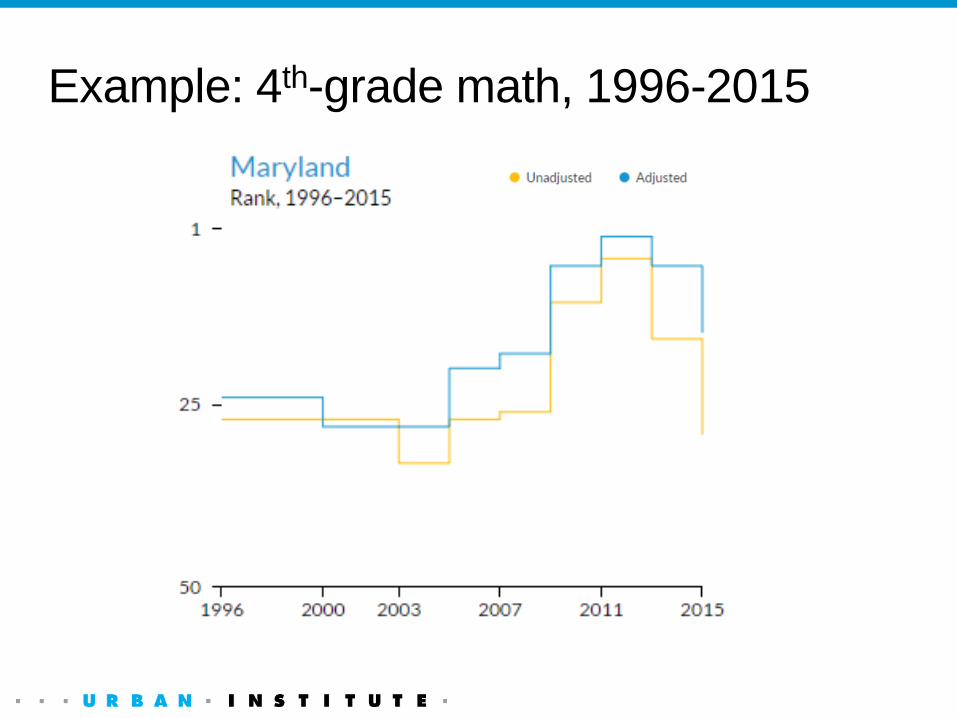
Example: 4th-grade math, 1996-2015
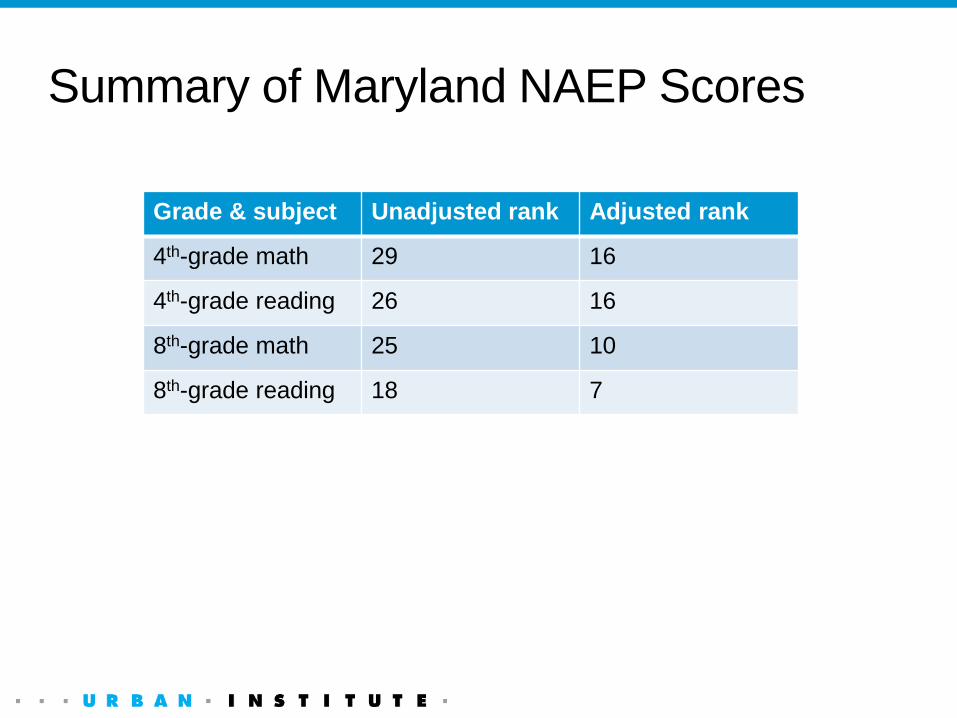
Summary of Maryland NAEP Scores
Grade & subject Unadjusted rank Adjusted rank
4th-grade math 29 16
4th-grade reading 26 16
8th-grade math 25 10
8th-grade reading 18 7
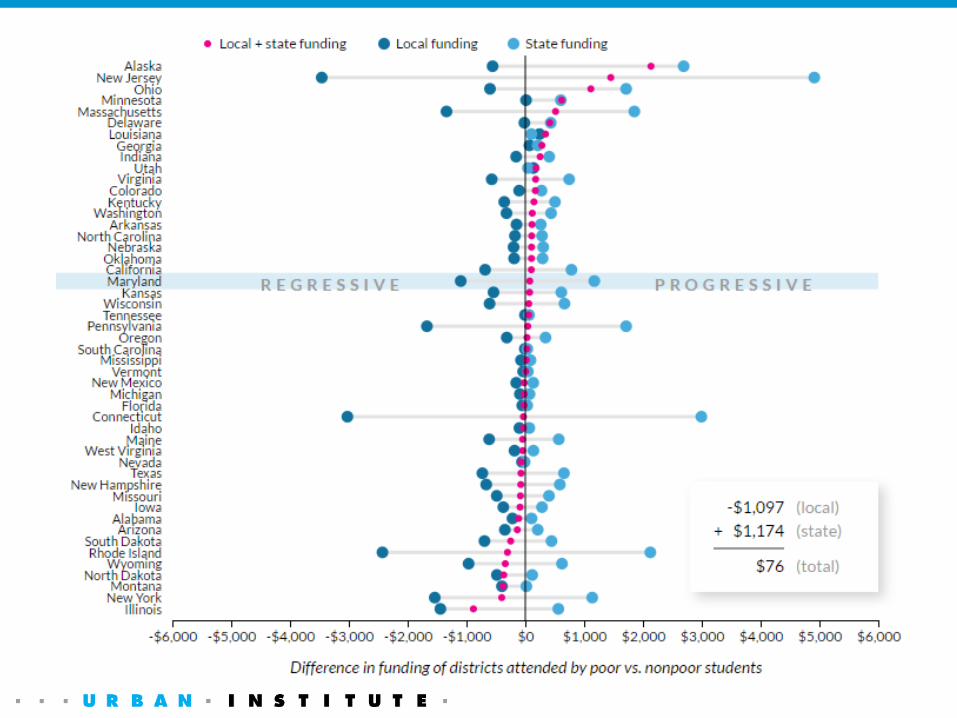
School Funding Progressivity
• New data interactive: http://urbn.is/k12funding
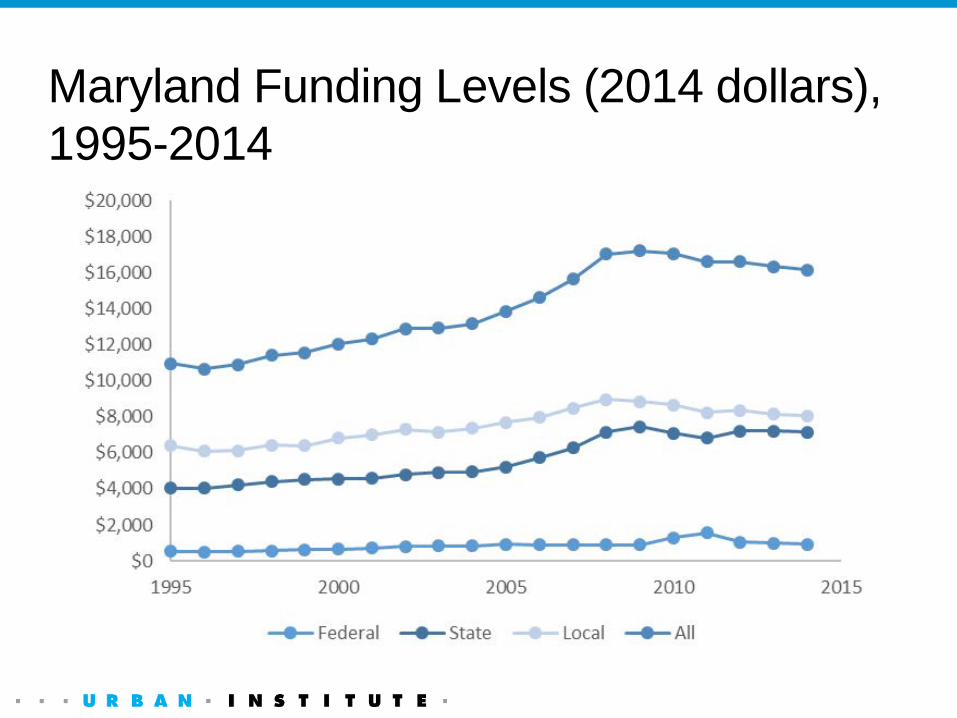
Maryland Funding Levels (2014 dollars), 1995-2014
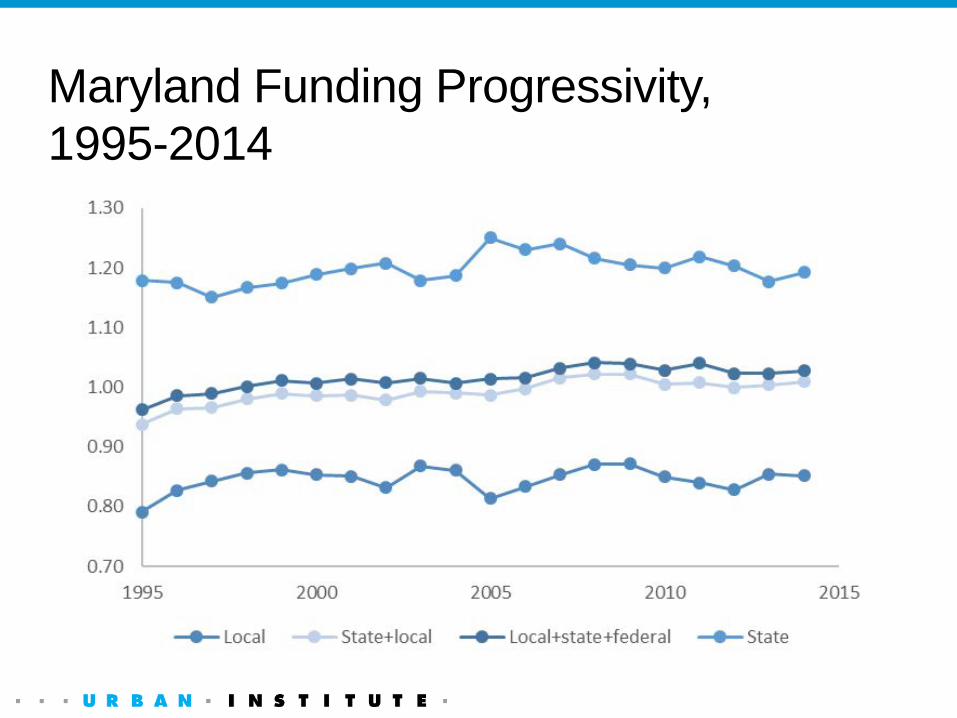
Maryland Funding Progressivity, 1995-2014
Thank You
• Email: [email protected]
• Twitter: @chingos
• Urban Institute’s Education Policy Program: http://www.urban.org/policy-centers/cross-center-initiatives/education-policy-program