commission to reform maryland’s pretrial system – final · pdf filecommission to...
TRANSCRIPT
DRAFT
Commission to Reform Maryland’s
Pretrial System
Final Report
December 19, 2014
2 | P a g e
Table of Contents
EXECUTIVE SUMMARY………………………………………………………………. 3
COMMISSION MEMBERSHIP………………………………………………………… 5
MESSAGE FROM THE CHAIR………………………………………………...…… 7
BACKGROUND….………………………………………..…………................. ……... 8
DeWolfe v. Richmond …………………………………......………………………….…… 8
Jail Populations……………………………………...………………………….………….. 11
Improving Pretrial Services…………….……………..…...………………..…..……….…... 13
THE COMMISSION………………………………………….…………….……………. 15
Commission Meetings and Activities……………...………………………………………. 16
Maryland Pretrial Risk Assessment Data Collection Study Overview……...…………… 17
RECOMMENDATIONS…………………………………………………………………. 20
STATEMENT OF SENATOR CHRISTOPHER B. SHANK AND SCOTT
SHELLENBERGER, STATE’S ATTORNEY ……………………………… 33
DISSENT…………………………………………………………………………………... 34
APPENDICES…………………………..………………………………………………… 35
Maryland Pretrial Risk Assessment Data Collection Study…………………......……………… 36
Counties with Formal Pretrial Units in Maryland……………………………….…………….. 69
2012 Court Commissioner Activities by District…………….………………..…..……….…... 70
2013 Initial Appearances by County……………………………………….…………….. 71
2013 Release on Recognizance (ROR) Rates by District in Maryland……..…...…………….. 72
2013 Initial Appearance Decisions by District……………………………….…………….. 73
2013 Failure to Appear Rates by Bail Type…………….……………………..…..……….…... 74
Types of Bonds Set and Posted to a Court Commissioner (2013)…………………………… 75
2014 YTD Average Percentage of the Daily Jail Population that is Pretrial…………….….…... 76
2014 YTD Average Intake Pretrial Population that has been Detained for more than 90 Days... 77

3 | P a g e
EXECUTIVE SUMMARY
The Governor’s Commission to Reform Maryland’s Pretrial System (“the Commission”) was established
by Executive Order1 on May 27, 2014 to gather experts and interested parties, with the goal of developing
recommendations to ensure that Maryland operates the best possible statewide pretrial system. The
Commission was preceded by the Task Force to Study the Laws and Policies Relating to Representation
of Indigent Criminal Defendants by the Public Defender. The work of the Commission was also informed
by legislative deliberations during the 2014 Session of the Maryland General Assembly.
On July 1, 2014, the State of Maryland began to implement a Court of Appeals decision that requires
state-furnished counsel for indigent defendants at initial appearances before a District Court
Commissioner. The Commission studied characteristics of the current pretrial system, including outcomes
associated with the provision of counsel at the initial appearance phase.
The Commission met five times and also formed three subcommittees related to Managing Public Safety
through Risk-Based Decision Making, Pretrial System Improvement, and Individual Rights and
Collateral Consequences. These three subcommittees held five additional meetings.
The Commission ultimately voted to approve the following 14 recommendations:
Recommendation One: Create a uniform pretrial services agency which mandates a process that
will ensure continuity and consistency across all 24 jurisdictions. Pretrial services will be responsible
for gathering criminal records, administering a statewide risk assessment tool and other relevant
information that will be beneficial in determining the initial appearance and to avoid the redundancy
of various agencies pulling the same information. Pretrial services will also be responsible for
supervision of those released under pretrial supervision and provide referrals for treatment,
counseling and other services, particularly for those individuals with limited means, to address the
underlying needs that may have caused the criminal behavior.
Recommendation Two: Provide adequate funding and/or personnel to implement a validated risk
assessment tool modeled after best practices to pilot in jurisdictions to be utilized by the Court
Commissioners after the data has been analyzed.
Recommendation Three: The Judiciary should evaluate the current pretrial system to determine
whether it has the capacity to implement best practices in pretrial justice. This evaluation should
consider the repurposing of District Court Commissioners from their current duties to conducting
risk assessments on defendants and supervising defendants pretrial.
Recommendation Four: The use of secured, financial conditions of pretrial release (cash, property,
or surety bond) that require a low-risk defendant to pay some amount of money in order to obtain
release, while permitting high-risk defendants with the resources to pay their bonds to leave jail
unsupervised, be completely eliminated.
Recommendation Five: Cash bail, and its associated impact, should be monitored by the Maryland
Insurance Administration to determine if changes need to be developed and implemented including a
comparison between secured and unsecured bond.
1 Md. Code Regs. 01.01.2014.08 (May 27, 2014).
2 DeWolfe v. Richmond, 434 Md. 444 (2013).
3 Pilgrim, Shirleen, M., & Rossmark, Claire, E (2013), Task Force to Study the Laws and Policies Relating to Representation

4 | P a g e
Recommendation Six: The Commission recommends that under no circumstances should we
institutionalize the Judicial Branch of Government as the line manager of what amounts to the
Lawyer-Referral Service Program for Attorneys to represent indigent criminally accused in their
First Appearance before a Commissioner. The Office of the Public Defender was created by statute
to represent indigent criminally accused. It is an Executive Branch Agency of State Government and
should have that responsibility from the initial appearance through appeals.
Recommendation Seven: The Commission recommends earlier and enhanced prosecutorial
screening, particularly of citizens’ complaints, by way of Maryland rule, prior to the issuance of a
summons or warrant, except for domestically related crimes.
Recommendation Eight: Maximize and expand the use of the criminal citation process by law
enforcement.
Recommendation Nine: Create a system so that only one entity in the pretrial process has to pull
and summarize the arrestee’s record, consistent with and in accordance with state and federal law
and the independent needs of the system in order to operate efficiently.
Recommendation Ten: Provide state funding to create a shared jail management system, possibly
through the Department of Public Safety and Correctional Services’ Offender Case Management
System (OCMS), to allow for data collection on the pretrial population statewide.
Recommendation Eleven: It is recommended that funding be provided for court and public safety-
designated facilities to be outfitted with audio/visual equipment to optimize court hearing
efficiencies.
Recommendation Twelve: That whatever pretrial system is contemplated, the critical principle of
prompt presentment no later than 24 hours of arrest remain.
Recommendation Thirteen: Data are needed in order to effectively determine impact of process
and procedures on various demographics (race, gender, non-English speaking, and indigence defined
as eligibility for representation by the Office of the Public Defender or appointed attorney).
Additionally, timeliness factors such as rates of waiver to arrests and time between arrest and
presentment, by jurisdiction, should be compared and measured.
Recommendation Fourteen: A Commission to Study the Maryland Criminal Justice System shall
be created. The purpose of the Commission shall be to improve the effectiveness and efficiency of
state and local criminal justice systems by providing a centralized and impartial forum for statewide
policy development and planning with a focus on evidence-based decision making. The primary duty
of the Commission shall be to develop and maintain a state criminal justice policy and
comprehensive, long-range plan for a coordinated and cost-effective state criminal justice system
that encompasses public safety, defendant and offender accountability, crime reduction and
prevention, and defendant and offender treatment and rehabilitation.
5 | P a g e
COMMISSION MEMBERS
Richard M. Karceski, Esq., Chair
Law Offices of Richard Karceski
Hon. Jesse Bane
Sheriff, Harford County
Tammy Brown, Esq.
Governor’s Office of Crime Control &
Prevention
Cherise Fanno Burdeen
Pretrial Justice Institute
Hon. Luke Clippinger, Esq.
Maryland House of Delegates
Paul DeWolfe, Esq.
Public Defender of Maryland
Wendell M. France
Department of Public Safety & Correctional
Services
Brian J. Frank, Esq.
Lexington National Insurance
Paul F. Kemp, Esq.
Ethridge, Quinn, Kemp, Rowan & Hartinger
Dorothy J. Lennig, Esq.
House of Ruth Maryland
Timothy F. Maloney, Esq.
Joseph, Greenwalk and Laake
Mary Lou McDonough
Prince George’s County Department of
Corrections
Capt. Michael R. Merican
St. Mary’s County Sheriff’s Office
Hon. John P. Morrissey
Chief Judge, District Court of Maryland
Hon. Joseline Pena-Melnyk, Esq.
Maryland House of Delegates
Hon. Steven I. Platt
The Platt Group, Inc.
Jacqueline Robarge
Power Inside
Michael Schatzow, Esq.
Venable, LLP.
Hon. Christopher Shank
Maryland State Senate
Hon. Scott D. Shellenberger, Esq.
Baltimore County State’s Attorney
Angela Y. Talley
Montgomery County Pretrial Services
Rev. Dr. Sheridan Todd Yeary
NAACP Maryland State Conference
Hon. Robert Zirkin, Esq.
Maryland State Senate
6 | P a g e
EX OFFICIO
Hon. Kathleen Dumais, Maryland House of Delegates
Toni Holness, Esq., ACLU of Maryland
Terry Kokolis, Superintendent, Anne Arundel County Department of Detention Facilities
Sara Love, Esq., ACLU of Maryland
Natasha Mehu, Esq., Maryland Association of Counties
7 | P a g e
MESSAGE FROM THE CHAIR
Governor Martin O'Malley tasked this Commission with looking at ways to improve the pretrial justice
system in Maryland. In light of the current events in Maryland around pretrial justice, including the
recently implemented DeWolfe v. Richmond decision, the Commission was presented with many
complex issues to consider. In crafting recommendations, the Commission carefully discussed and
contemplated suggestions from all Commission members, to ultimately arrive at the final fourteen
recommendations. These recommendations serve as an important step forward for pretrial reform in
Maryland.
We are grateful to the Governor for creating the Commission and for making a commitment to pretrial
justice. It has been an honor to lead this Commission.
Sincerely,
Richard Karceski, Esq.
8 | P a g e
BACKGROUND
Commission members representing the cross-section of decision makers forming Maryland’s criminal
justice system brought a wealth of experience to important conversations about public safety, victims,
defendants, and limited resources throughout the system. The Commission listened to presentations from
state and national experts and reviewed research on practices that have yielded positive results in other
jurisdictions. At the outset, the Commission stated the importance of a pretrial system that optimizes
public safety, individual liberty, and cost effectiveness.
DeWolfe v. Richmond
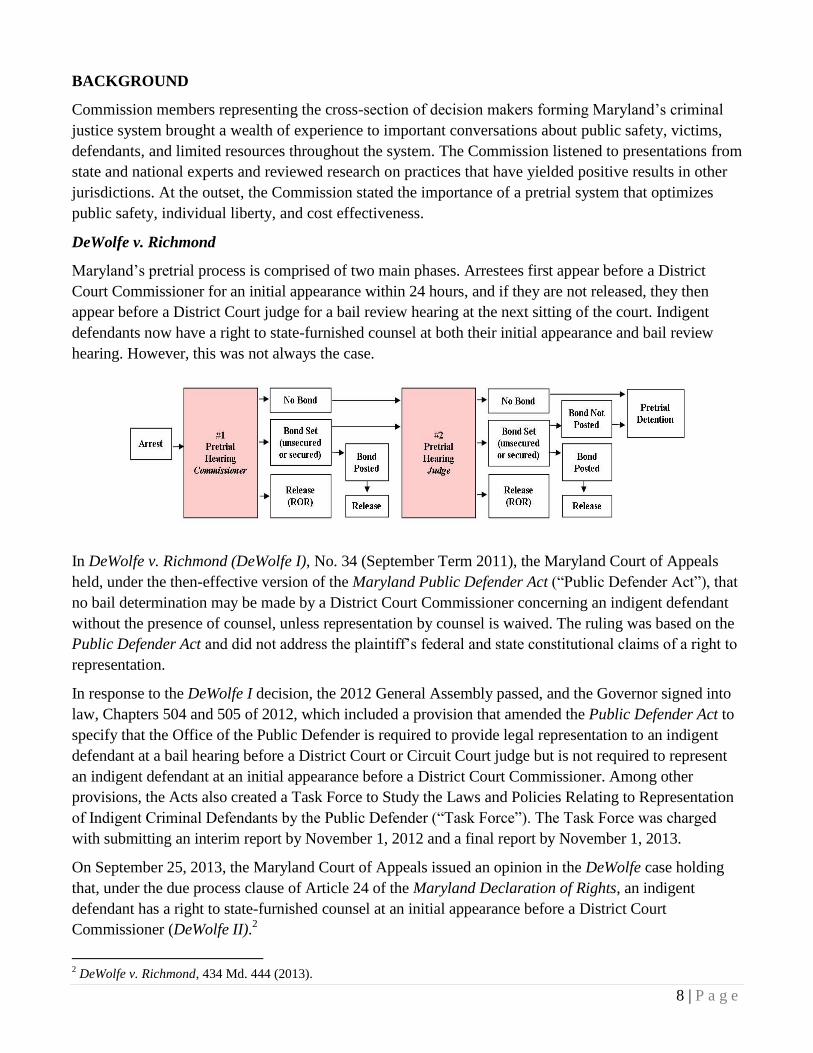
Maryland’s pretrial process is comprised of two main phases. Arrestees first appear before a District
Court Commissioner for an initial appearance within 24 hours, and if they are not released, they then
appear before a District Court judge for a bail review hearing at the next sitting of the court. Indigent
defendants now have a right to state-furnished counsel at both their initial appearance and bail review
hearing. However, this was not always the case.
In DeWolfe v. Richmond (DeWolfe I), No. 34 (September Term 2011), the Maryland Court of Appeals
held, under the then-effective version of the Maryland Public Defender Act (“Public Defender Act”), that
no bail determination may be made by a District Court Commissioner concerning an indigent defendant
without the presence of counsel, unless representation by counsel is waived. The ruling was based on the
Public Defender Act and did not address the plaintiff’s federal and state constitutional claims of a right to
representation.
In response to the DeWolfe I decision, the 2012 General Assembly passed, and the Governor signed into
law, Chapters 504 and 505 of 2012, which included a provision that amended the Public Defender Act to
specify that the Office of the Public Defender is required to provide legal representation to an indigent
defendant at a bail hearing before a District Court or Circuit Court judge but is not required to represent
an indigent defendant at an initial appearance before a District Court Commissioner. Among other
provisions, the Acts also created a Task Force to Study the Laws and Policies Relating to Representation
of Indigent Criminal Defendants by the Public Defender (“Task Force”). The Task Force was charged
with submitting an interim report by November 1, 2012 and a final report by November 1, 2013.
On September 25, 2013, the Maryland Court of Appeals issued an opinion in the DeWolfe case holding
that, under the due process clause of Article 24 of the Maryland Declaration of Rights, an indigent
defendant has a right to state-furnished counsel at an initial appearance before a District Court
Commissioner (DeWolfe II).2
2 DeWolfe v. Richmond, 434 Md. 444 (2013).
9 | P a g e
The Task Force’s 2013 final report also included several recommendations related to the potential for
reform within Maryland’s pretrial system.3
2014 Legislative Session
During the 2014 legislative session, multiple bills were introduced that attempted to further the Task
Force recommendations and address the DeWolfe decision. Two of these bills, SB 973 and HB 537,
proposed a collapsing of the initial appearance and bail review hearing into one hearing before a District
Court judge, to uphold defendants’ constitutional rights and also gain cost efficiencies, particularly in
light of the expenses associated with providing counsel at two hearings shortly after arrest. The proposed
legislation was not adopted. On May 28, 2014, the Court of Appeals vacated the stay and injunction that
was previously issued in DeWolfe II as of 8:00 a.m. on July 1, 2014, thereby initiating implementation of
the decision.4
In the final hours of the 2014 legislative session, the General Assembly earmarked $10 million dollars of
the Maryland Judiciary’s budget to fund appointed attorneys to represent indigent defendants at initial
appearances.5
DeWolfe v. Richmond Implementation
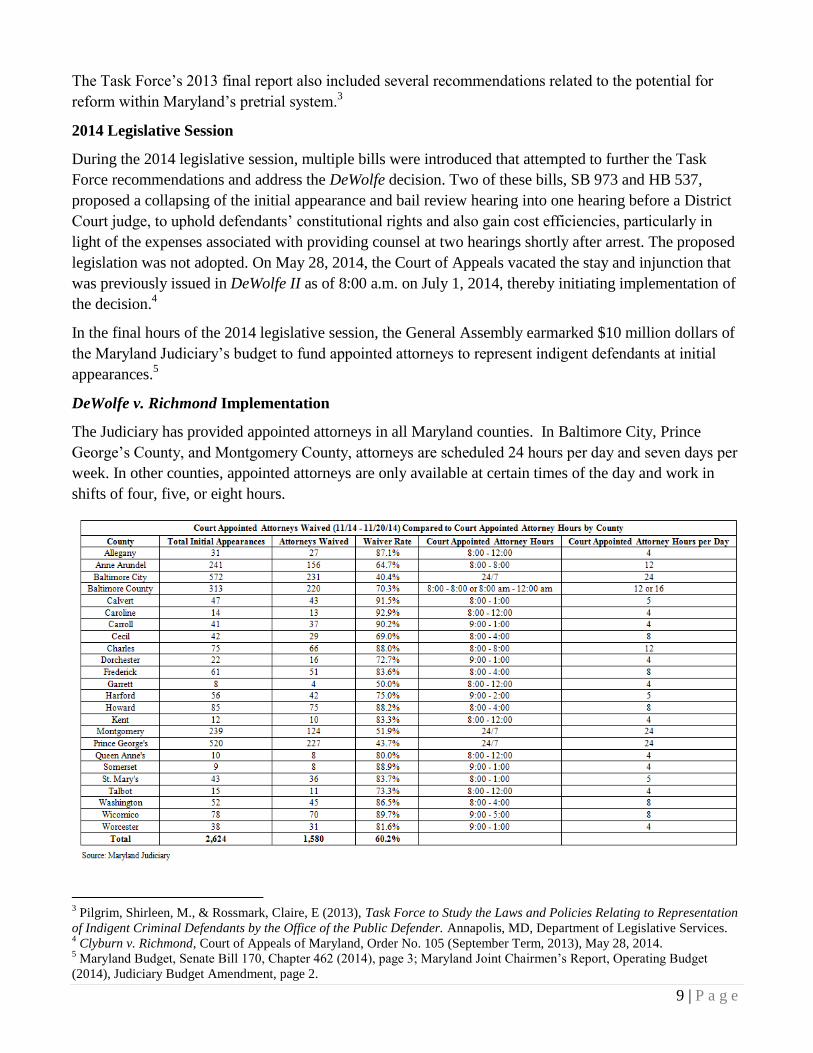
The Judiciary has provided appointed attorneys in all Maryland counties. In Baltimore City, Prince
George’s County, and Montgomery County, attorneys are scheduled 24 hours per day and seven days per
week. In other counties, appointed attorneys are only available at certain times of the day and work in
shifts of four, five, or eight hours.
3 Pilgrim, Shirleen, M., & Rossmark, Claire, E (2013), Task Force to Study the Laws and Policies Relating to Representation
of Indigent Criminal Defendants by the Office of the Public Defender. Annapolis, MD, Department of Legislative Services. 4 Clyburn v. Richmond, Court of Appeals of Maryland, Order No. 105 (September Term, 2013), May 28, 2014.
5 Maryland Budget, Senate Bill 170, Chapter 462 (2014), page 3; Maryland Joint Chairmen’s Report, Operating Budget
(2014), Judiciary Budget Amendment, page 2.

10 | P a g e
The chart above lists the rates at which defendants waive the right to an appointed attorney since the
Richmond decision has been implemented, by jurisdiction, for the week of November 14th
through
November 20th
2014. An analysis of waiver rates shows that waiver rates are lowest in jurisdictions where
appointed attorneys are available at any time of day. At the majority of initial appearances statewide, the
defendant waived his or her right to state furnished counsel. The highest rate of waivers occurred in
Caroline County, where only one defendant requested an attorney. The lowest waiver rate was in
Baltimore City (40.4%).
In addition to the costs of appointed attorneys, other criminal justice agencies have had unanticipated
expenditures. Note the following expenditures in the chart below from July 1 through December 1, 2014.
The costs below represent the need for local jails and prosecutors to hire more staff and/or pay overtime
for staff due to Richmond implementation. In the corrections environment, additional staff is needed to
monitor arrestee movement and provide a secure environment for the appointed panel attorneys. For
example, in Prince George’s County, there have been costs associated with additional correctional
officer staffing due to the longer time period between the arrest and the initial appearance. In Prince
George’s County, the average time an arrestee is waiting for their initial appearance has increased from
4.5 hours to 12 hours.6 As a result, the county added a total of three correctional officers on all shifts
between its two correctional intake facilities. These additional posts cost approximately $86,000 per
month in overtime, or $430,000 from July 1 - November 30, 2014. The projected cost to the County will
be approximately $1 million in FY 2015. It is important to note that this chart does not capture any cost-
savings associated with the presence of counsel at the initial appearance hearings.
6 Prince George’s County Department of Corrections.
11 | P a g e
Jail Populations
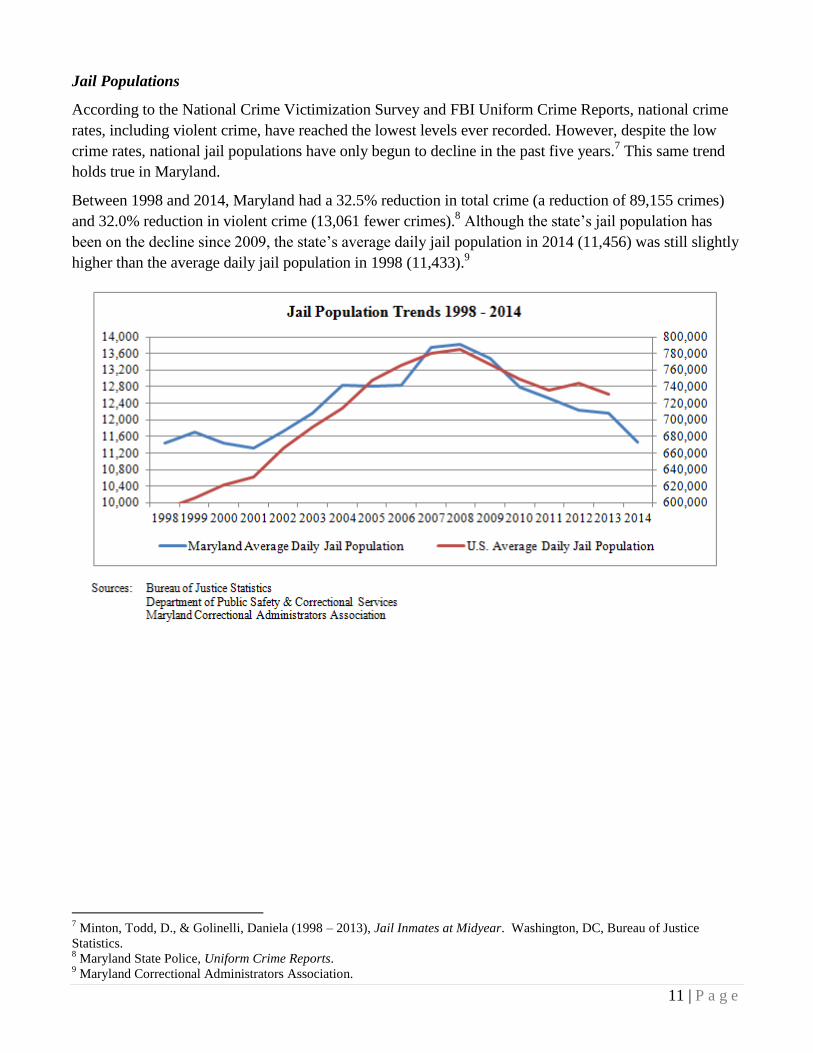
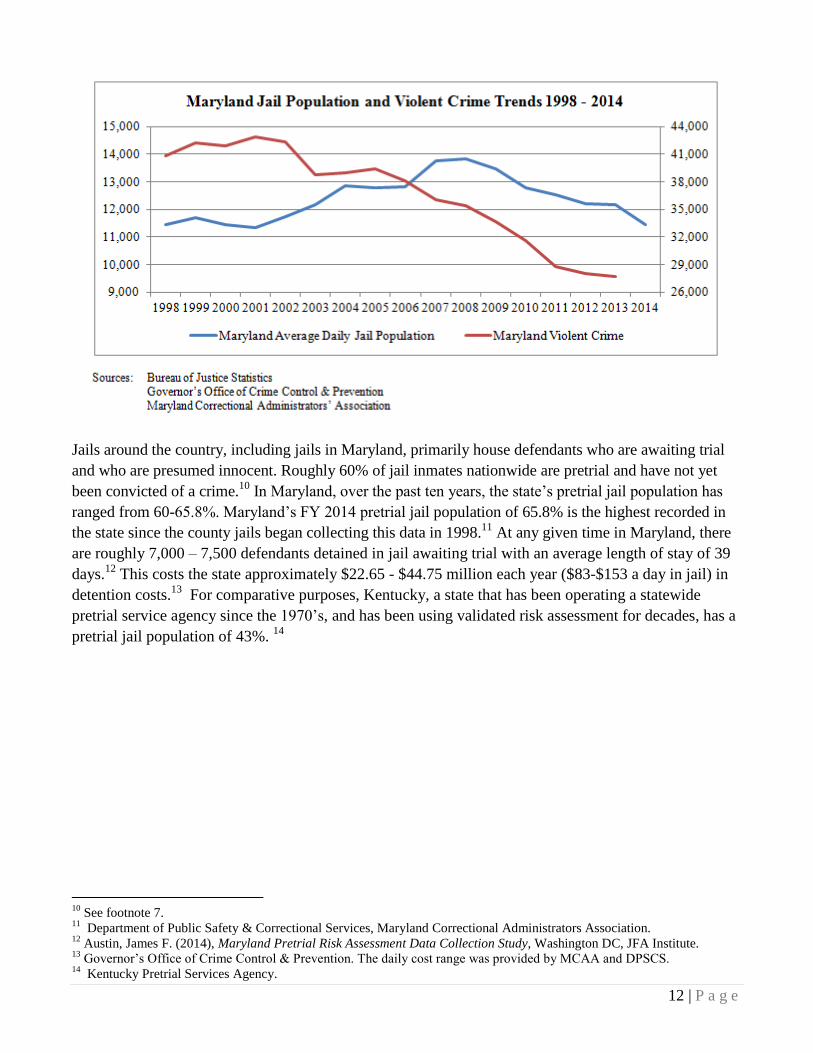
According to the National Crime Victimization Survey and FBI Uniform Crime Reports, national crime
rates, including violent crime, have reached the lowest levels ever recorded. However, despite the low
crime rates, national jail populations have only begun to decline in the past five years.7 This same trend
holds true in Maryland.
Between 1998 and 2014, Maryland had a 32.5% reduction in total crime (a reduction of 89,155 crimes)
and 32.0% reduction in violent crime (13,061 fewer crimes).8 Although the state’s jail population has
been on the decline since 2009, the state’s average daily jail population in 2014 (11,456) was still slightly
higher than the average daily jail population in 1998 (11,433).9
7 Minton, Todd, D., & Golinelli, Daniela (1998 – 2013), Jail Inmates at Midyear. Washington, DC, Bureau of Justice
Statistics. 8 Maryland State Police, Uniform Crime Reports.
9 Maryland Correctional Administrators Association.
12 | P a g e
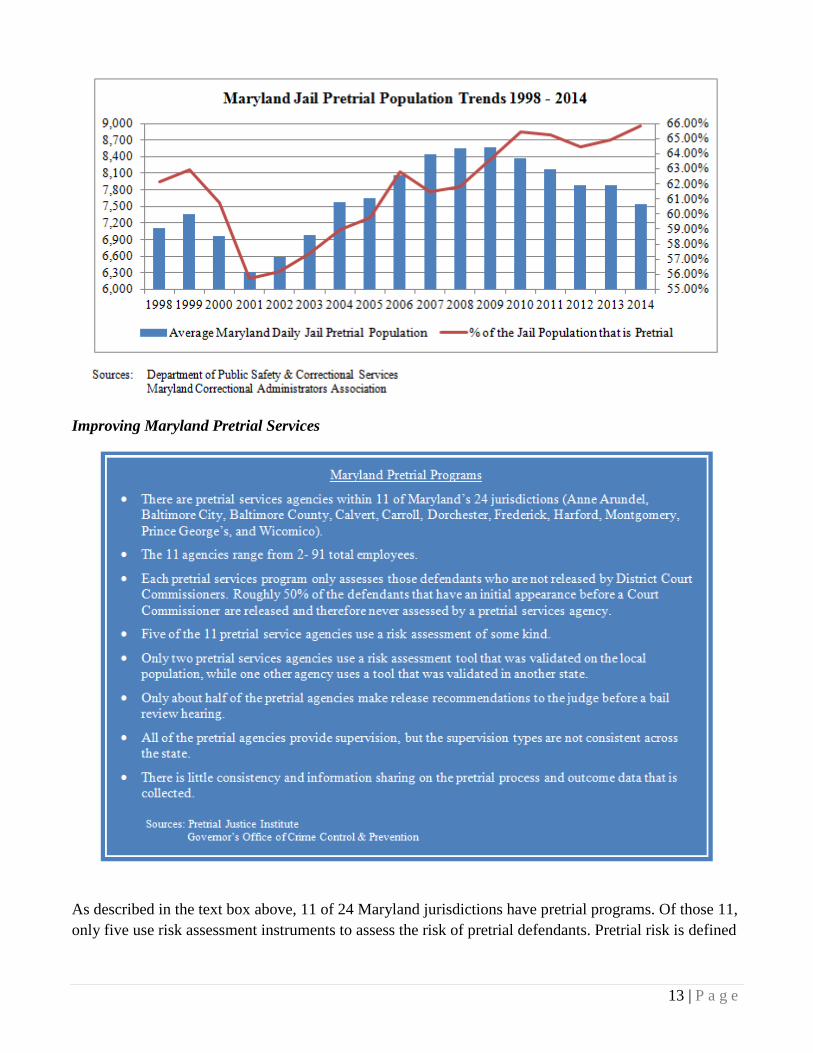
Jails around the country, including jails in Maryland, primarily house defendants who are awaiting trial
and who are presumed innocent. Roughly 60% of jail inmates nationwide are pretrial and have not yet
been convicted of a crime.10
In Maryland, over the past ten years, the state’s pretrial jail population has
ranged from 60-65.8%. Maryland’s FY 2014 pretrial jail population of 65.8% is the highest recorded in
the state since the county jails began collecting this data in 1998.11
At any given time in Maryland, there
are roughly 7,000 – 7,500 defendants detained in jail awaiting trial with an average length of stay of 39
days.12
This costs the state approximately $22.65 - $44.75 million each year ($83-$153 a day in jail) in
detention costs.13
For comparative purposes, Kentucky, a state that has been operating a statewide
pretrial service agency since the 1970’s, and has been using validated risk assessment for decades, has a
pretrial jail population of 43%. 14
10
See footnote 7. 11
Department of Public Safety & Correctional Services, Maryland Correctional Administrators Association. 12
Austin, James F. (2014), Maryland Pretrial Risk Assessment Data Collection Study, Washington DC, JFA Institute. 13
Governor’s Office of Crime Control & Prevention. The daily cost range was provided by MCAA and DPSCS. 14
Kentucky Pretrial Services Agency.
13 | P a g e
Improving Maryland Pretrial Services
As described in the text box above, 11 of 24 Maryland jurisdictions have pretrial programs. Of those 11,
only five use risk assessment instruments to assess the risk of pretrial defendants. Pretrial risk is defined
14 | P a g e
as the likelihood of committing another crime or failing to appear in court.15
While each of these
agencies is successful in the work that they do, they are not fully in compliance with national standards
and evidence-based practices. The National Association of Pretrial Service Agencies (NAPSA) has
developed standards on key elements of an effective and efficient pretrial services program. These
standards are outlined below.
Universal Screening: Effective pretrial programs screen all defendants eligible for release by state statute
or local court order that appear for a pretrial hearing before a judicial officer.
Validated Risk and Needs Assessment: Effective pretrial programs use validated risk criteria and
assessments to gauge a defendant’s suitability for release pending trial. The assessment should be
empirically validated using local data to ensure that its factors are proven to be the most predictive of
future court appearance and re-arrest pending trial. An effective pretrial program should make
recommendations to the court based on the findings of this risk assessment. These recommendations
should be the least restrictive to reasonably ensure court appearance and community safety.
Sequential Review of Release/Diversion Eligibility: Effective pretrial programs provide screening,
assessment, and recommendations at multiple decision points following a pretrial hearing for those
defendants who are eligible for release but are detained. Subsequent screening, assessment, and
recommendations during the detention period should focus on new or updated information about the
defendant and recommendations should be appropriate to the defendant’s newly assessed risk level.
Supervision to Match Risk: Pretrial supervision levels tied to assessed risk of pretrial misconduct –
reoffending or failing to appear – greatly improve pretrial outcomes. Conversely, over-supervision of
low risk defendants produces poorer outcomes and wastes resources. Some examples of effective
pretrial supervision strategies for low risk defendants include court notifications through telephone calls,
emails, or text messages, early and meaningful response to defendant misconduct, regular reporting,
drug testing, GPS electronic monitoring, and treatment referrals. 16
Data Collection and Performance Measurement: Highly functioning pretrial services agencies collect
key data and are able to report progress related to agency objectives. For example, Kentucky’s
statewide Pretrial Services Agency designed a computerized, case information management system and
partnered with the National Institute of Corrections to define outcome measures, performance measures,
and mission-critical data. All pretrial officers statewide use an electronic application to collect, assess,
and monitor defendant information, including a record of every interaction between a pretrial officer and
a defendant. Transitioning from a paper-based system to the computerized case management system
created new possibilities for Kentucky Pretrial Services to collect, organize, analyze and interpret data.
Pretrial staff receive training, and pretrial supervisors are required to calculate each local program’s
performance and outcome data and submit a report detailing the analysis.
The collection and retrieval of key data increases a jurisdiction’s ability to measure outcomes. For
example, the Kentucky Pretrial Services Agency is able to report on appearance rate, safety rate, success
rate, and pretrial detainee length of stay. Monitoring the pretrial system performance is essential to
15
Pretrial Justice Institute (2013), Report to the Pretrial Release Subcommittee of the Task Force to Study the Laws and
Policies Relating to Representation of Indigent Criminal Defendants by the Office of the Public Defender, Pretrial Justice
Institute. 16
Kennedy, Spurgeon. (August 2014). Elements of an Effective Pretrial Services Program. Presentation to the National
Institute of Corrections Orientation for New Pretrial Executives, Denver, CO.
15 | P a g e
reducing pretrial misconduct and improving public safety. 17
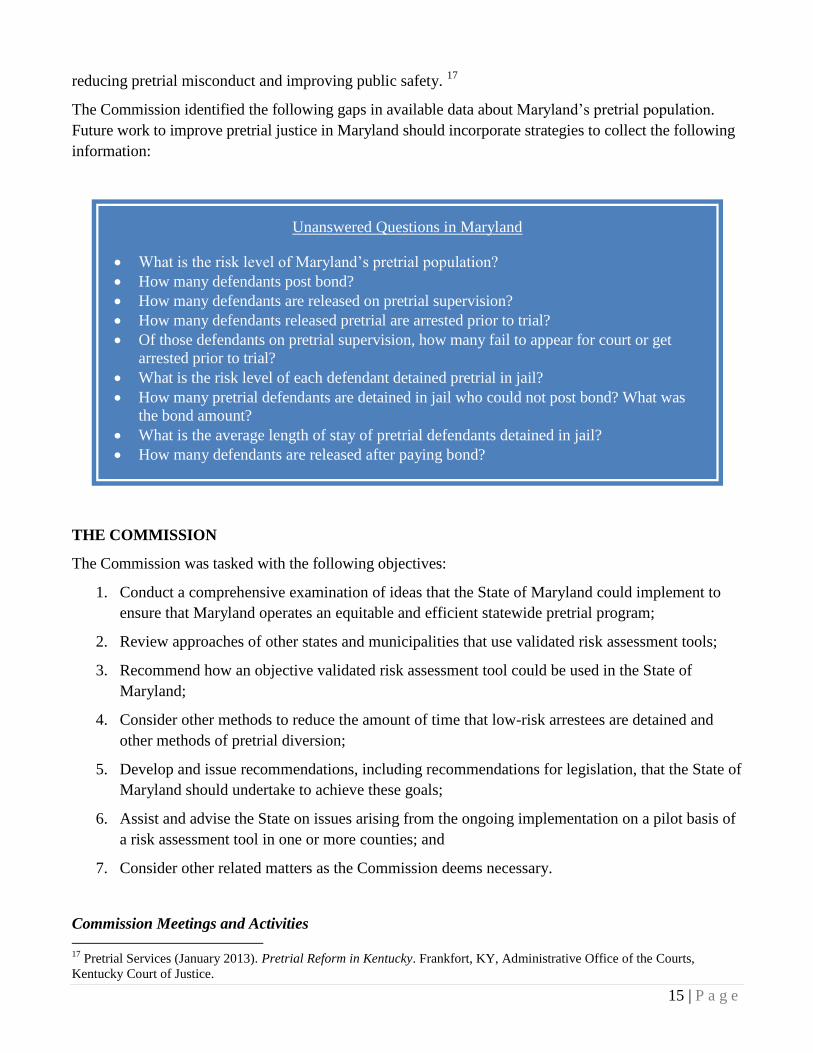
The Commission identified the following gaps in available data about Maryland’s pretrial population.
Future work to improve pretrial justice in Maryland should incorporate strategies to collect the following
information:
THE COMMISSION
The Commission was tasked with the following objectives:
1. Conduct a comprehensive examination of ideas that the State of Maryland could implement to
ensure that Maryland operates an equitable and efficient statewide pretrial program;
2. Review approaches of other states and municipalities that use validated risk assessment tools;
3. Recommend how an objective validated risk assessment tool could be used in the State of
Maryland;
4. Consider other methods to reduce the amount of time that low-risk arrestees are detained and
other methods of pretrial diversion;
5. Develop and issue recommendations, including recommendations for legislation, that the State of
Maryland should undertake to achieve these goals;
6. Assist and advise the State on issues arising from the ongoing implementation on a pilot basis of
a risk assessment tool in one or more counties; and
7. Consider other related matters as the Commission deems necessary.
Commission Meetings and Activities
17
Pretrial Services (January 2013). Pretrial Reform in Kentucky. Frankfort, KY, Administrative Office of the Courts,
Kentucky Court of Justice.
Unanswered Questions in Maryland
What is the risk level of Maryland’s pretrial population?
How many defendants post bond?
How many defendants are released on pretrial supervision?
How many defendants released pretrial are arrested prior to trial?
Of those defendants on pretrial supervision, how many fail to appear for court or get
arrested prior to trial?
What is the risk level of each defendant detained pretrial in jail?
How many pretrial defendants are detained in jail who could not post bond? What was
the bond amount?
What is the average length of stay of pretrial defendants detained in jail?
How many defendants are released after paying bond?
16 | P a g e
The Commission met six times between June and December of 2014. The Commission also formed three
subcommittees:
Managing Public Safety through Risk-Based Decision Making Subcommittee
The purpose of this subcommittee was to consider the feasibility and challenges of implementing an
evidence- and risk-based pretrial system. The subcommittee reviewed and analyzed available risk
assessment tools, pretrial supervision models, and other best practices towards implementing a risk-
based pretrial system that protects public safety and ensures optimal individual outcomes.
Pretrial System Improvement Subcommittee
The purpose of this subcommittee was to evaluate the current pretrial process in Maryland, including
Richmond compliance and the right to counsel, and propose solutions that will optimize the efficiency of
the pretrial system and help manage available resources. This subcommittee looked at both time-saving
and cost-saving solutions, as well as information sharing throughout the system.
Individual Rights and Collateral Consequences Subcommittee
The purpose of this subcommittee was to ensure that all individuals in Maryland who come into contact
with the criminal justice system receive fair and equitable treatment throughout the pretrial process. This
subcommittee identified disparities within the pretrial system and proposed potential solutions.
The Pretrial Commission completed the following activities:
Provided an overview of the Maryland District Court Commissioner system;
Presented the characteristics of an ideal pretrial system;
Reviewed potential changes to Maryland’s pretrial system that would generate the most benefit
to the criminal justice system;
Created a matrix of pretrial data requests to be completed by various criminal justice agencies;
Hosted a panel discussion with pretrial justice system representatives from the District of
Columbia;
Presented findings from site visits to Kentucky and Colorado pretrial services agencies;
Reviewed validated risk assessment tools from multiple jurisdictions as well as the methodology
for completing a pretrial risk assessment tool validation study;
Made recommendations intended to improve the efficiency of the pretrial system in Maryland,
ensure fair and equal justice throughout, and incorporate evidence-based practices into pretrial
system reform; and
Approved the Maryland Pretrial Risk Assessment Data Collection Study to collect data on a
cohort of defendants over a two-week period, using a validated risk assessment tool from
another jurisdiction (see Appendix A for the results).

17 | P a g e
Maryland Pretrial Risk Assessment Data Collection Study Overview
On September 22, 2014, the Commission voted to support a Pretrial Risk Assessment Data Collection
Study. The study was also recommended by the National Institute of Corrections.
The purpose of this study was to gather data on a cohort of Maryland defendants over a two-week
period, using a validated risk assessment tool from the state of Kentucky. Such a study will help policy-
makers understand the risk level (failing to appear for court or being re-arrested prior to trial) of the
Maryland pretrial population. The analysis also evaluated pretrial release decisions relative to the
presumed risk levels of Maryland defendants. Six Maryland counties agreed to participate in the data
collection effort: Baltimore City, Harford County, Montgomery County, Prince George’s County, St.
Mary’s County, and Washington County. In each jurisdiction, intake officers compared the factors in the
Kentucky Pretrial Risk Assessment (KPRA) to each defendant’s criminal history. All defendants who
were booked between Wednesday October 15th
at 12:00 a.m. and Tuesday October 29th
at 11:59 p.m.
were included. In addition, intake officers recorded the pretrial release decision made by the Court
Commissioner during the initial appearance, as well as the release decision made by the judge during the
bail review hearing for each defendant.
The KPRA was validated by the Vera Institute of Justice in 2013, based on a population data set of over
88,000 cases. A list of the factors, weightings, and recommendations of the KPRA tool are shown in the
chart below:
Factor Weight
1. Pending cases (none, violation, misdemeanor, felony) None=0
Yes=7
2. Active FTA or prior FTA on felony/misdemeanor charge No=0
Yes=2
3. Prior FTA on violation or traffic charge No=0
Yes=1
4. Prior misdemeanor convictions No=0
Yes=2
5. Prior felony convictions No=0
Yes=1
6. Prior violent crime convictions No=0
Yes=1
7. Currently on felony probation/parole No=0
Yes=1
Scores/Levels/Recommendation Procedures
0-2 = Low Risk = Release ROR/USB per statute
3-9 = Moderate Risk = Release ROR/USB per statute with pretrial supervision
10-15 = High Risk = Judicial Discretion
The KPRA factors reflect many of the factors included in other risk assessment instruments that have
been validated using large data sets. This study was not meant to endorse this particular risk assessment
18 | P a g e
tool or replace a validation study. Its sole purpose was to gather data on the risk levels of the Maryland
pretrial population.
Dr. James Austin from the JFA Institute analyzed the data collected during the study period. The JFA
Institute is a non-profit organization whose staff has over 30 years of experience in the evaluation of
criminal justice practices and design of research-based policy solutions.
Major Findings
1. Over a two-week period a total of 3,244 defendants were arrested and booked into six local jail
systems for a variety of crimes.
2. The vast majority (78%) of these defendants were able to secure release within a few days with
70% securing release at the initial appearance.
3. The most frequent offenses for these defendants were FTA (21%), 2nd
degree assault (15%), and
drug possession (11%).
4. There was considerable variance in the overall release rates of defendants by the primary crime
for which they were charged. Overall, release rates were lowest for defendants charged with the
most violent crimes (murder, rape and robbery).
5. In terms of risk assessment, 33% of the sample were scored under the Kentucky risk assessment
instrument as low risk, 45% were moderate risk, and 33% were higher risk.
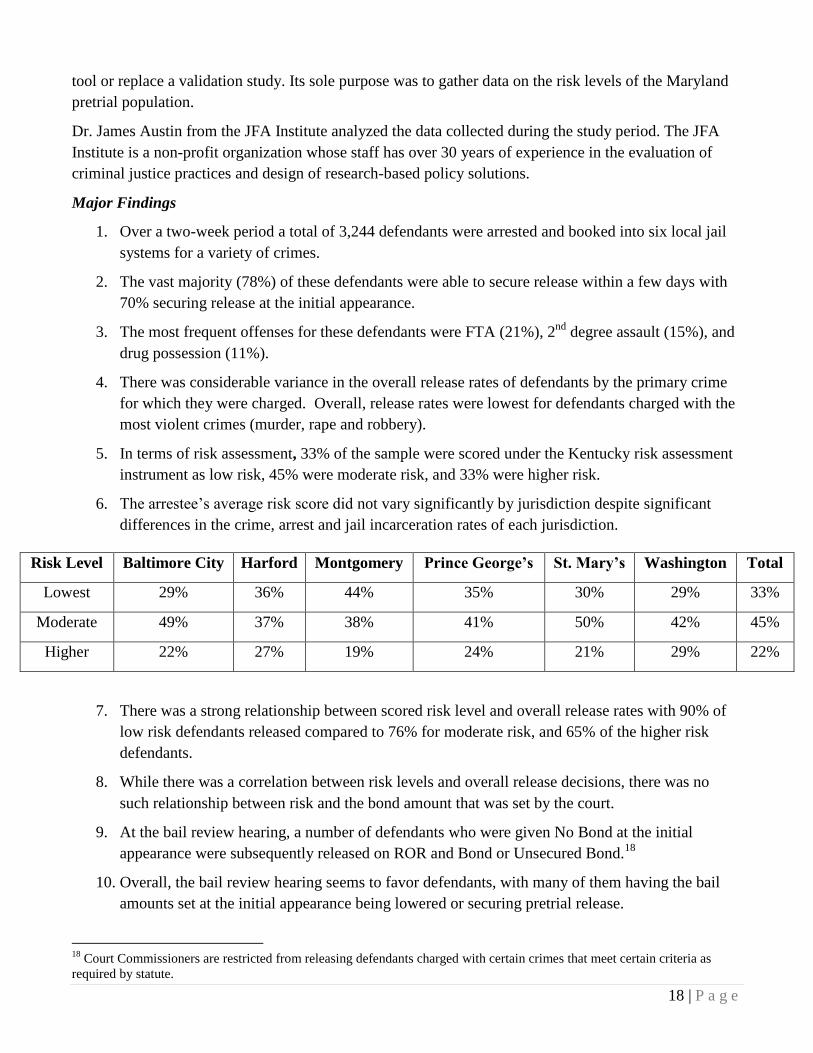
6. The arrestee’s average risk score did not vary significantly by jurisdiction despite significant
differences in the crime, arrest and jail incarceration rates of each jurisdiction.
Risk Level Baltimore City Harford Montgomery Prince George’s St. Mary’s Washington Total
Lowest 29% 36% 44% 35% 30% 29% 33%
Moderate 49% 37% 38% 41% 50% 42% 45%
Higher 22% 27% 19% 24% 21% 29% 22%
7. There was a strong relationship between scored risk level and overall release rates with 90% of
low risk defendants released compared to 76% for moderate risk, and 65% of the higher risk
defendants.
8. While there was a correlation between risk levels and overall release decisions, there was no
such relationship between risk and the bond amount that was set by the court.
9. At the bail review hearing, a number of defendants who were given No Bond at the initial
appearance were subsequently released on ROR and Bond or Unsecured Bond.18
10. Overall, the bail review hearing seems to favor defendants, with many of them having the bail
amounts set at the initial appearance being lowered or securing pretrial release.
18
Court Commissioners are restricted from releasing defendants charged with certain crimes that meet certain criteria as
required by statute.
19 | P a g e
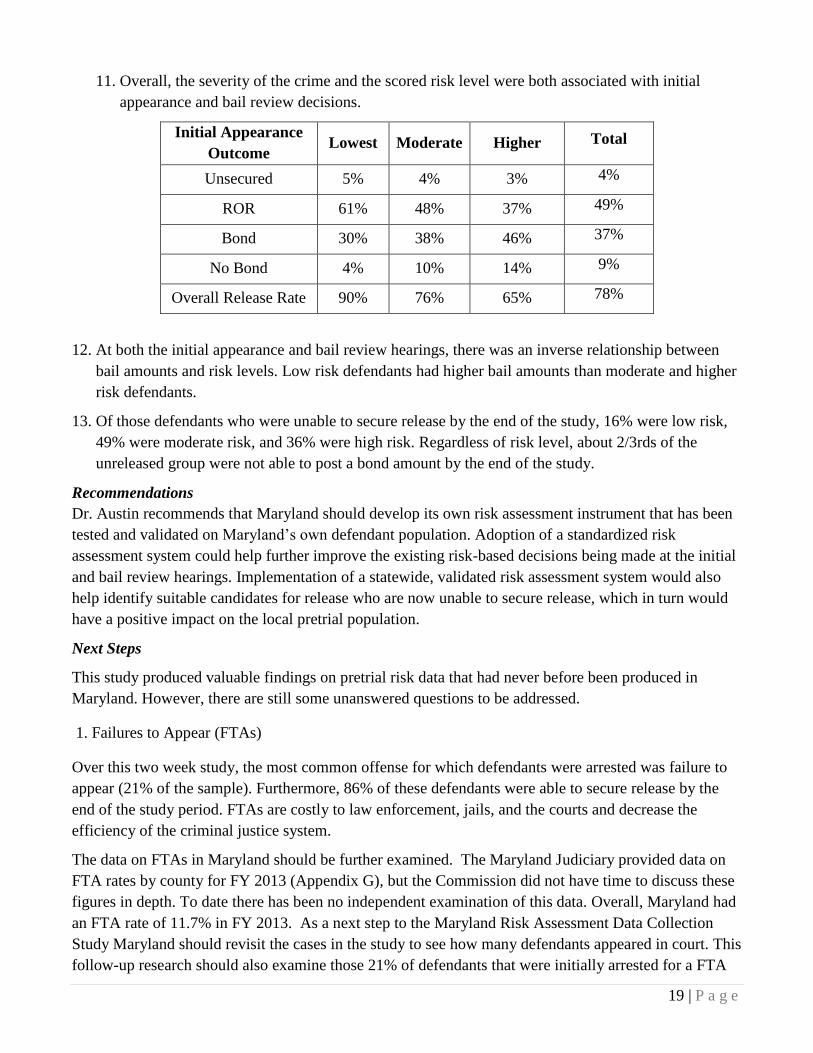
11. Overall, the severity of the crime and the scored risk level were both associated with initial
appearance and bail review decisions.
Initial Appearance
Outcome Lowest Moderate Higher Total
Unsecured 5% 4% 3% 4%
ROR 61% 48% 37% 49%
Bond 30% 38% 46% 37%
No Bond 4% 10% 14% 9%
Overall Release Rate 90% 76% 65% 78%
12. At both the initial appearance and bail review hearings, there was an inverse relationship between
bail amounts and risk levels. Low risk defendants had higher bail amounts than moderate and higher
risk defendants.
13. Of those defendants who were unable to secure release by the end of the study, 16% were low risk,
49% were moderate risk, and 36% were high risk. Regardless of risk level, about 2/3rds of the
unreleased group were not able to post a bond amount by the end of the study.
Recommendations
Dr. Austin recommends that Maryland should develop its own risk assessment instrument that has been
tested and validated on Maryland’s own defendant population. Adoption of a standardized risk
assessment system could help further improve the existing risk-based decisions being made at the initial
and bail review hearings. Implementation of a statewide, validated risk assessment system would also
help identify suitable candidates for release who are now unable to secure release, which in turn would
have a positive impact on the local pretrial population.
Next Steps
This study produced valuable findings on pretrial risk data that had never before been produced in
Maryland. However, there are still some unanswered questions to be addressed.
1. Failures to Appear (FTAs)
Over this two week study, the most common offense for which defendants were arrested was failure to
appear (21% of the sample). Furthermore, 86% of these defendants were able to secure release by the
end of the study period. FTAs are costly to law enforcement, jails, and the courts and decrease the
efficiency of the criminal justice system.
The data on FTAs in Maryland should be further examined. The Maryland Judiciary provided data on
FTA rates by county for FY 2013 (Appendix G), but the Commission did not have time to discuss these
figures in depth. To date there has been no independent examination of this data. Overall, Maryland had
an FTA rate of 11.7% in FY 2013. As a next step to the Maryland Risk Assessment Data Collection
Study Maryland should revisit the cases in the study to see how many defendants appeared in court. This
follow-up research should also examine those 21% of defendants that were initially arrested for a FTA
20 | P a g e
to see how many of them subsequently failed to appear for court.
Research shows that court notification programs significantly reduce a defendant’s likelihood of failing
to appear for court.19
There should be further examination of Maryland’s current court notification
process. GOCCP has also discussed the possibility of establishing pilot programs in Maryland to test the
concept of voice, text, or email notifications to remind defendants of upcoming trial dates.
2. Public Safety
While the Maryland Risk Assessment Data Collection Study showed that low risk defendants were more
likely to be released than moderate or high risk defendants, the study also showed that 65% of high risk
defendants were released. Once the cases in the study have been disposed, the State should further
examine the 2,533 defendants who were released to determine how many of those defendants were re-
arrested prior to trial, particularly for a violent offense. This data will also be useful when conducting a
pretrial risk assessment validation study in Maryland, and will help identify defendants who pose a high
risk of failing to appear or a threat to public safety who should be preventatively detained in jail and not
allowed to secure pretrial release.
3. Pretrial Detention
Further analysis should be conducted to determine if the highest risk defendants are being detained. Of
the 711 defendants detained in jail during the JFA Institute study, 36% were high risk, 49% were
moderate risk, and 16% were low risk. Across all risk levels, 68% of defendants were detained because
he/she could not post a bond amount set by a judicial officer. Were these defendants detained because
they were a public safety risk or because they did not have the financial means to be released? There are
more efficient and cost-effective pretrial practices than pretrial detention, such as pretrial supervision.
The United States Courts determined that it is roughly 10 times cheaper to put a defendant on pretrial
supervision than to detain them in jail.20
Further analysis should be completed on those defendants detained during this study, including a
demographic analysis (race, gender, and age), to determine whether there is a disproportionate impact on
people of color or people of a certain age or gender. The implementation of a validated pretrial risk
assessment statewide could help identify defendants who are suitable for release. This would have a
positive impact on the local pretrial population as well as public safety as a whole.
RECOMMENDATIONS
The Commission voted to approve 14 recommendations as described below.
Recommendation One: Create a uniform pretrial services agency which mandates a process that will
ensure continuity and consistency across all 24 jurisdictions. Pretrial services will be responsible for
19
Bornstein, Brian, H., Tomkins, Alan, J., & Neeley, Elizabeth, M. (May 2011). Reducing Courts’ Failure to Appear Rate: A
procedural Justice Approach., Lincoln, NE. University of Nebraska Public Policy Center. 20
United States Courts (July 2013). Supervision Costs Significantly Less than Incarceration in Federal System. Washington ,
DC. Retrieved from
http://news.uscourts.gov/supervision-costs-significantly-less-incarceration-federal-system
21 | P a g e
gathering criminal records, administering a statewide risk assessment tool and other relevant
information that will be beneficial in determining the initial appearance and to avoid the redundancy of
various agencies pulling the same information. Pretrial services will also be responsible for supervision
of those released under pretrial supervision and provide referrals for treatment, counseling and other
services, particularly for those individuals with limited means, to address the underlying needs that may
have caused the criminal behavior.
Pretrial release and detention policies and decisions have very important implications for public safety
as well as society’s capacity to achieve the ideal of equal justice under the law. By providing judicial
officers with essential information for decision making and by helping to supervise released defendants,
pretrial services programs help courts to increase public safety and reduce discrimination based on
wealth and other factors not related to risk of flight or danger to the community. Fair and effective
pretrial release policies are an essential component of public safety and equal justice.
The three main goals of any pretrial services agency are to:
1.) Maximize public safety;
2.) Maximize release; and
3.) Maximize court appearance.
Pretrial services programs perform two critical functions: gather and present information about
defendants to judicial officers to be used in making decisions about a defendant’s pretrial custody or
release status, and to supervise defendants who are released from custody during the pretrial period by
monitoring their compliance with release conditions and by helping to ensure they appear for scheduled
court appearances.
The decision to release or detain someone pretrial has significant consequences for the community. This
decision not only affects public safety, but also has implications for the size of jail populations and the
costs associated with the pretrial detention of defendants. This decision point also has important
consequences for defendants. According to the National Institute of Justice, “the decision to release or
hold a defendant pretrial directly affects their ability to assert their innocence, negotiate a disposition,
and mitigate the severity of a sentence.”21
Furthermore, pretrial detention disrupts a defendant’s
employment, family life, and other ties to the community.22
In Maryland, a statewide pretrial services program will help ensure uniformity and consistency in the
application of best practices in pretrial, without necessarily restructuring the fundamentals of our pretrial
justice system. A statewide pretrial services program will also allow Maryland to maximize resources
and efficiencies while maintaining public safety in the state. Kentucky’s budget to operate its statewide
pretrial services program is $12.75 million for FY 2015.23
The following national organizations have
produced express policy statements generally supporting the use of evidence-based and best pretrial
practices, which include risk assessment and fair and transparent preventive detention, at the front end of
the criminal justice system:
21
Mahoney, Barry., Beaudin, Bruce, D., Carver III, John, A., Ryan, Daniel, B., & Hoffman, Richard B., (March 2001).
Pretrial Services Programs: Responsibilities and Potential. Washington DC. National Institute of Justice. 22
See footnote 21. 23
Kentucky Pretrial Services Agency
22 | P a g e
The Conference of Chief Justices
The Conference of State Court Administrators
The National Association of Counties
The International Association of Chiefs of Police
The Association of Prosecuting Attorneys
The American Council of Chief Defenders
The National Association of Criminal Defense Lawyers
The American Jail Association
The American Bar Association
The National Judicial College
The National Sheriff’s Association
The American Probation and Parole Association
The National Association of Pretrial Services Agencies24
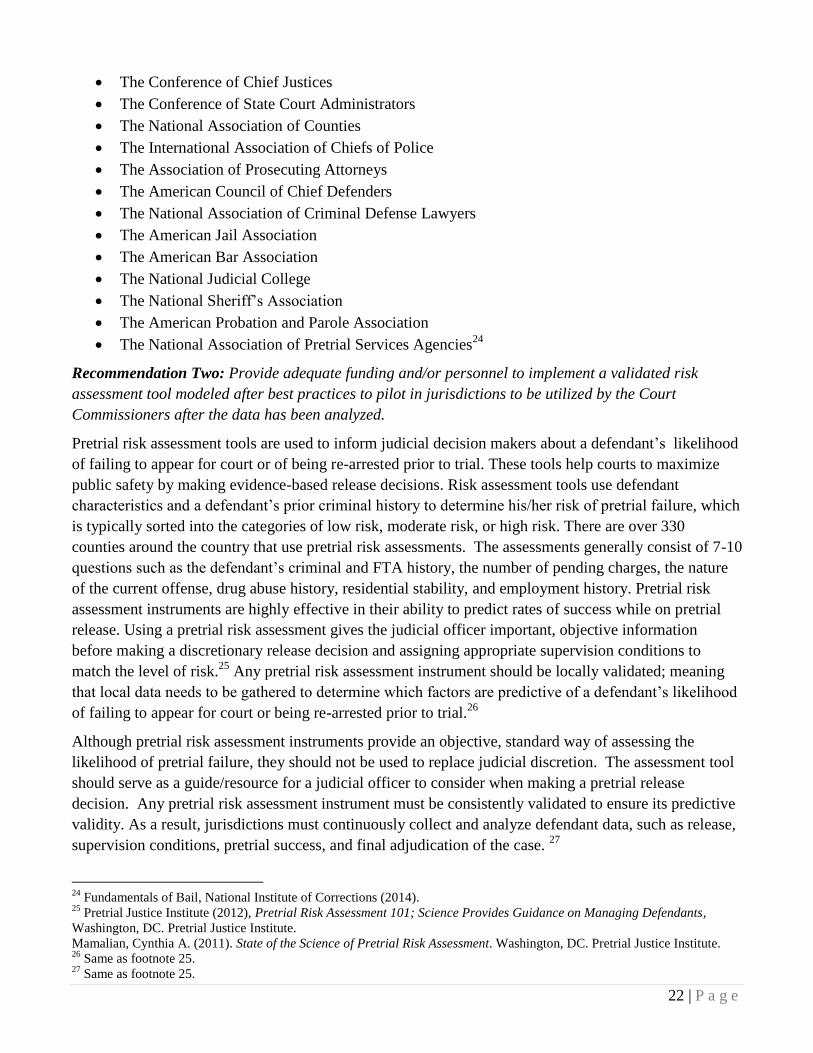
Recommendation Two: Provide adequate funding and/or personnel to implement a validated risk
assessment tool modeled after best practices to pilot in jurisdictions to be utilized by the Court
Commissioners after the data has been analyzed.
Pretrial risk assessment tools are used to inform judicial decision makers about a defendant’s likelihood
of failing to appear for court or of being re-arrested prior to trial. These tools help courts to maximize
public safety by making evidence-based release decisions. Risk assessment tools use defendant
characteristics and a defendant’s prior criminal history to determine his/her risk of pretrial failure, which
is typically sorted into the categories of low risk, moderate risk, or high risk. There are over 330
counties around the country that use pretrial risk assessments. The assessments generally consist of 7-10
questions such as the defendant’s criminal and FTA history, the number of pending charges, the nature
of the current offense, drug abuse history, residential stability, and employment history. Pretrial risk
assessment instruments are highly effective in their ability to predict rates of success while on pretrial
release. Using a pretrial risk assessment gives the judicial officer important, objective information
before making a discretionary release decision and assigning appropriate supervision conditions to
match the level of risk.25
Any pretrial risk assessment instrument should be locally validated; meaning
that local data needs to be gathered to determine which factors are predictive of a defendant’s likelihood
of failing to appear for court or being re-arrested prior to trial.26
Although pretrial risk assessment instruments provide an objective, standard way of assessing the
likelihood of pretrial failure, they should not be used to replace judicial discretion. The assessment tool
should serve as a guide/resource for a judicial officer to consider when making a pretrial release
decision. Any pretrial risk assessment instrument must be consistently validated to ensure its predictive
validity. As a result, jurisdictions must continuously collect and analyze defendant data, such as release,
supervision conditions, pretrial success, and final adjudication of the case. 27
24
Fundamentals of Bail, National Institute of Corrections (2014). 25
Pretrial Justice Institute (2012), Pretrial Risk Assessment 101; Science Provides Guidance on Managing Defendants,
Washington, DC. Pretrial Justice Institute.
Mamalian, Cynthia A. (2011). State of the Science of Pretrial Risk Assessment. Washington, DC. Pretrial Justice Institute. 26
Same as footnote 25. 27
Same as footnote 25.

23 | P a g e
Recommendation Three: The Judiciary should evaluate the current pretrial system to determine
whether it has the capacity to implement best practices in pretrial justice. This evaluation should
consider the repurposing of District Court Commissioners from their current duties to conducting risk
assessments on defendants and supervising defendants pretrial.
Implementation of the Commission’s first recommendation – to establish a uniform pretrial services
agency – will require additional staff and resources. The Maryland Judiciary currently employs District
Court Commissioners who are selected and trained to perform many essential functions, including initial
appearances. The Commission urges the Judiciary to identify opportunities for efficiencies during the
initial appearance and bail review hearing phases, and to implement evidence-based practices that serve
to maximize public safety and court appearance rates across Maryland. Solutions may require research,
funding, training, technology, legislation, and the review of existing Maryland Rules. Specifically, the
Commission recommends building upon current release guidelines by developing and implementing a
locally validated risk assessment instrument. Under Maryland Rule 4-216, Commissioners may consider
the following factors in determining release:
Nature and circumstances of the offense charged;
Nature of the evidence against the defendant;
Potential sentence upon conviction;
Defendant’s prior record of appearance at court, including flight and FTAs;
Defendant’s family ties, employment status, history and financial resources;
Defendant’s reputation and character, including mental condition;
Defendant’s length of time of residence in the community and the state’s recommendations from
pretrial services, State’s Attorneys and defendant’s counsel;
Danger of the defendant to the victim, another person or community;
Danger of the defendant to himself or herself;
Any other factors bearing on willful failure to appear and safety of the victim, another person or
community; and
Prior convictions and/or prior adjudications of delinquency that occurred within three years of
the date the defendant is charged as an adult.
Additionally, the Commission suggests increasing court capacity for pretrial risk mitigation, including
monitoring and supervision. A full list of Court Commissioner activities can be found in Appendix C.
Recommendation Four: The use of secured, financial conditions of pretrial release (cash, property, or
surety bond) that require a low-risk defendant to pay some amount of money in order to obtain release,
while permitting high-risk defendants with the resources to pay their bonds to leave jail unsupervised,
be completely eliminated.
The use of secured financial conditions of pretrial release, bail or bond, a common practice for over a
century across the United States, is based on the premise that requiring defendants to post a financial
bond prior to release increases public safety and court appearance. However, researchers have noted that
24 | P a g e
this approach results in defendants who are unable to pay the bond and must remain in jail pending trial,
regardless of whether they present a risk, while those who are able to pay the bond are released.
For the past 20 years, the District of Columbia has used a pretrial system that rarely employs financial
conditions of release. Judges in D.C. make “hold or release” decisions, in every case, without bond.
These decisions are guided by a comprehensive preventive detention statute that reflects the
community’s policy priorities. In addition, decisions are informed by the results of an empirically
derived pretrial risk assessment tool which assesses the defendant’s likelihood to appear at the trial and
the defendant’s likelihood to commit another crime while released.
In D.C. approximately 85% of pretrial defendants are released with conditions that correlate to risk
level. About 90% of the released defendants appear in court as required and remain crime-free during
the pretrial period. Only 1% of releases are charged with violent offenses while on pretrial release.
These public safety and appearance rates meet or surpass outcomes from many other jurisdictions that
rely on secured bail. In D.C., the 15% of defendants who remain in jail pending trial according to the
preventive detention statute have no opportunity to purchase their way out. These results, consistent over
a 20-year period and coming from a jurisdiction that experiences significant crime levels, demonstrate
that the use of financial conditions at the bail decision is obsolete, and even dangerous, because financial
conditions are not based on risk.28
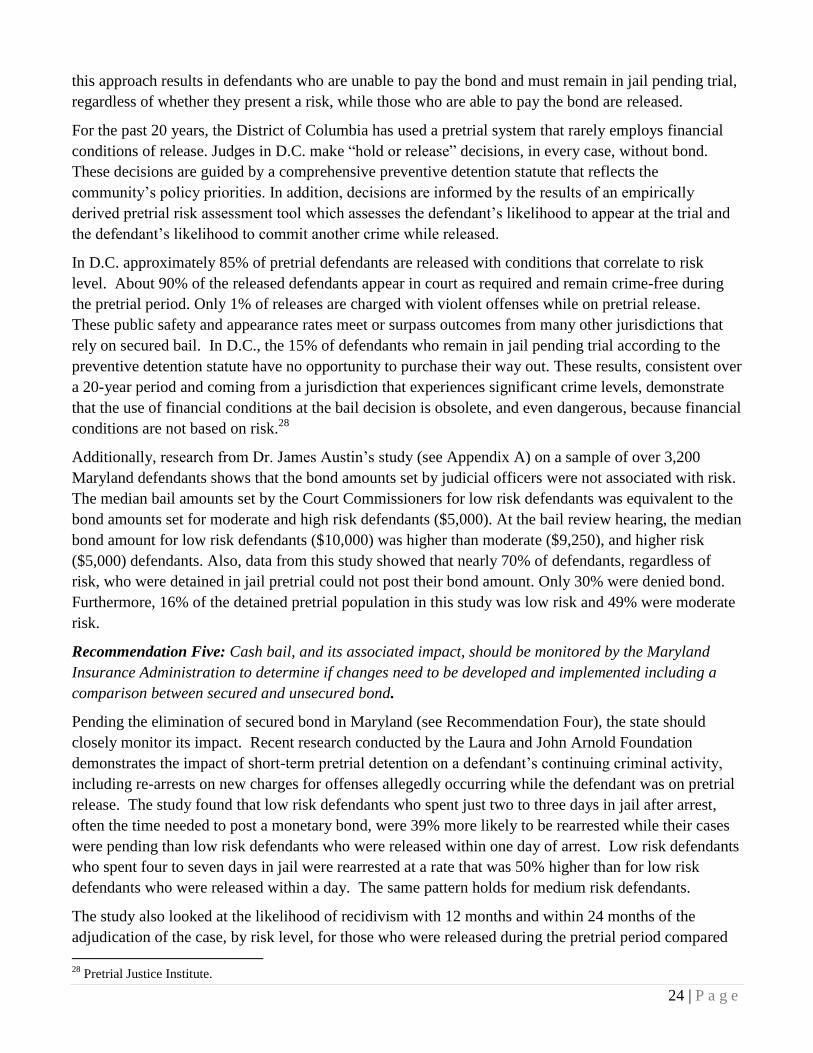
Additionally, research from Dr. James Austin’s study (see Appendix A) on a sample of over 3,200
Maryland defendants shows that the bond amounts set by judicial officers were not associated with risk.
The median bail amounts set by the Court Commissioners for low risk defendants was equivalent to the
bond amounts set for moderate and high risk defendants ($5,000). At the bail review hearing, the median
bond amount for low risk defendants ($10,000) was higher than moderate ($9,250), and higher risk
($5,000) defendants. Also, data from this study showed that nearly 70% of defendants, regardless of
risk, who were detained in jail pretrial could not post their bond amount. Only 30% were denied bond.
Furthermore, 16% of the detained pretrial population in this study was low risk and 49% were moderate
risk.
Recommendation Five: Cash bail, and its associated impact, should be monitored by the Maryland
Insurance Administration to determine if changes need to be developed and implemented including a
comparison between secured and unsecured bond.
Pending the elimination of secured bond in Maryland (see Recommendation Four), the state should
closely monitor its impact. Recent research conducted by the Laura and John Arnold Foundation
demonstrates the impact of short-term pretrial detention on a defendant’s continuing criminal activity,
including re-arrests on new charges for offenses allegedly occurring while the defendant was on pretrial
release. The study found that low risk defendants who spent just two to three days in jail after arrest,
often the time needed to post a monetary bond, were 39% more likely to be rearrested while their cases
were pending than low risk defendants who were released within one day of arrest. Low risk defendants
who spent four to seven days in jail were rearrested at a rate that was 50% higher than for low risk
defendants who were released within a day. The same pattern holds for medium risk defendants.
The study also looked at the likelihood of recidivism with 12 months and within 24 months of the
adjudication of the case, by risk level, for those who were released during the pretrial period compared
28
Pretrial Justice Institute.
25 | P a g e
to those who were detained until disposition on bonds that they could not post. Low risk defendants
who were detained pretrial recidivated at a rate that was 27% higher within 12 months, and 28% higher
within 24 months, than low risk defendants who were released during the pretrial period. The same
pattern holds for those who had been scored as medium risk.29
Other recent research from Colorado compared the public safety and court appearance rates for
defendants who were required to post a secured bond and for those who were required to post an
unsecured bond. Unlike other studies that have made similar comparisons, this study controlled for the
defendants’ risk levels, as identified through the use of the empirically derived Colorado Pretrial Risk
Assessment Tool. The study found that, across all risk levels, there were no statistically significant
differences in public safety and court appearance rates for those released on secured versus unsecured
bonds. The study did find, however, that those released on secured bonds used substantially more jail
bed space than those released on unsecured bond, given the longer time it takes for those with secured
bonds to make the financial arrangements for release. Thus, the study found that while nothing was
gained in terms of better public safety and court appearance outcomes by requiring defendants to post a
secured bond, doing so came with the cost of unnecessarily consuming jail bed days.30
These two
studies, taken together, illustrate that any jurisdiction that relies on secured bonds should regularly
assess the effects of that approach on public safety and on system costs.
Recommendation Six: The Commission recommends that under no circumstances should we
institutionalize the Judicial Branch of Government as the line manager of what amounts to the Lawyer-
Referral Service Program for Attorneys to represent indigent criminally accused in their First
Appearance before a Commissioner. The Office of the Public Defender was created by statute to
represent indigent criminally accused. It is an Executive Branch Agency of State Government and
should have that responsibility from the initial appearance through appeals.
The Commission has concerns about the current system in which the Judiciary oversees appointed
attorneys to represent defendants during their initial appearances before a District Court Commissioner.
The Judicial Branch is constitutionally required to be the neutral arbiter between prosecution and
defense in our adversarial system of justice. Therefore, the hiring, training, supervising and paying of
defense attorneys may raise ethical and constitutional issues.
The Office of the Public Defender was created by statute to represent indigent criminally accused and
performs this function at the bail review stage. It is an Executive Branch Agency of State Government
with legal and managerial expertise in criminal defense matters and should have that responsibility from
the initial appearance through appeals. Defendants also stand to benefit from the continuity of counsel.
Furthermore, there is efficiency in having one entity cover the defense of criminal cases from start to
finish. Examples of such advantages are the unified management and supervision of personnel and the
gathering and coordination of all case-related information into confidential case files and electronic data.
Recommendation Seven: The Commission recommends earlier and enhanced prosecutorial screening,
particularly of citizens’ complaints, by way of Maryland rule, prior to the issuance of a summons or
warrant, except for domestically related crimes.
29
Lowenkamp, Christopher, T., VanNostrand, and Holsinger, Alexander (2013), The Hidden Costs of Pretrial Detention,
Laura and John Arnold Foundation. 30
Jones, Michael R. (2013) Unsecured Bonds: The As Effective and Most Efficient Pretrial Release Option, Washington,
DC: Pretrial Justice Institute.
26 | P a g e
Part IV of the National District Attorneys Association’s (NDAA) National Prosecution Standards, Third
Edition, sets out standards for Pretrial Considerations. Standard 4-1.1 states that, “the decision to initiate
a criminal prosecution should be made by the prosecutor’s office. Where state law allows criminal
charges to be initiated by law enforcement or by other persons or means, prosecutors should, at the
earliest practical time, decide whether the charges should be pursued.”31
In the commentary on the
pretrial section, the NDAA Standards state, “[i]t could be argued that screening decisions are the most
important made by prosecutors in the exercise of their discretion in the search for justice. The screening
decision determines whether or not a matter will be absorbed into the criminal justice system. While the
decision may be very easy at times, at others it will require an examination of the prosecutor’s beliefs
regarding the criminal justice system, the goals of prosecution, and a broad assortment of other
factors.”32
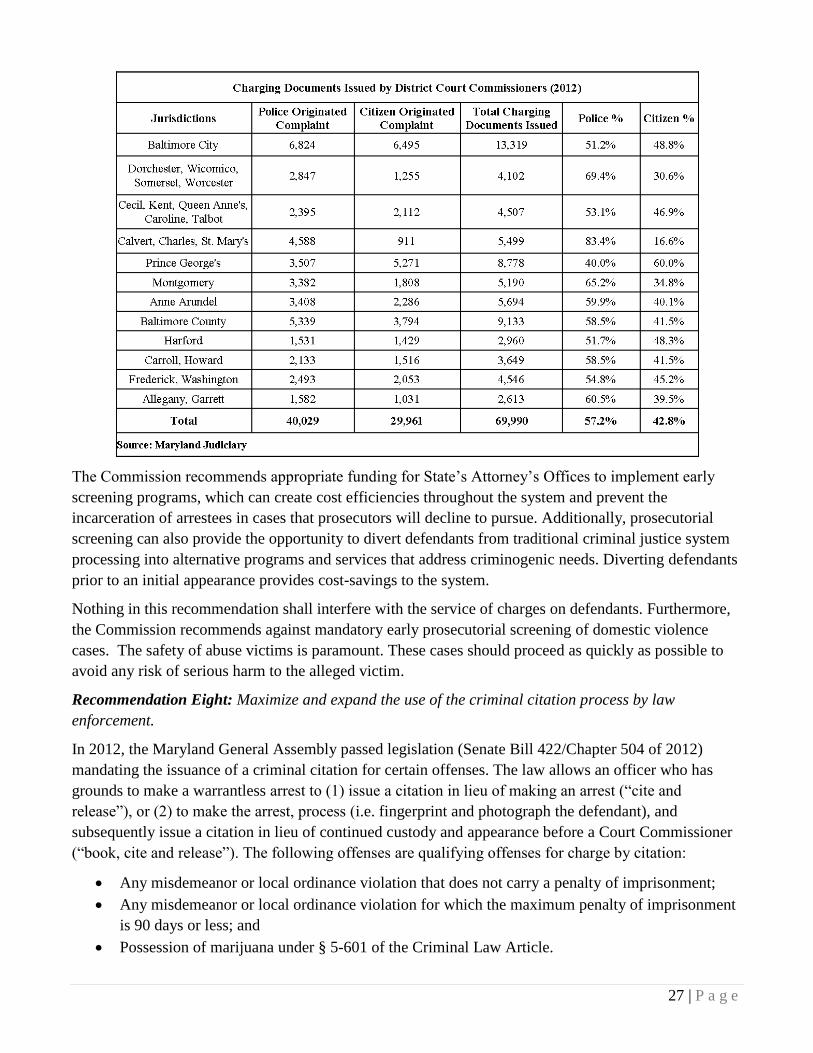
In Maryland, all State’s Attorney’s Offices screen felony cases, but only four jurisdictions screen
misdemeanor cases. In the District of Columbia, all local charges are screened by the United States
Attorney’s Office. As a result, only 40-50% of cases go to court.33
In 2012 in Maryland, citizen
complaints comprised 42.8% of the total charging documents issued by District Court Commissioners.
In Prince George’s County, 60% of the charging documents issued were originated by citizen
complaints. In Maryland, 96.7% of the complaints filed with a District Court Commissioner result in the
issuance of a charging document; only 3.3% are denied.34
Earlier and enhanced prosecutorial screening
of citizen complaints may help reduce the number of cases that advance through the criminal justice
system. More information is needed to fully evaluate how many citizen complaints are ultimately
dismissed after significant resources are expended.
31
National District Attorneys Association, National Prosecution Standards, Third Edition (updated 2009), retrieved at
http://www.ndaa.org/pdf/NDAA%20NPS%203rd%20Ed.%20w%20Revised%20Commentary.pdf 32
See footnote 31. 33
Rubenstein, David (September 2014). Presentation at the Commission to Reform Maryland’s Pretrial System. 34
Maryland Judiciary, 2012 District Court Commissioner Activities.
27 | P a g e
The Commission recommends appropriate funding for State’s Attorney’s Offices to implement early
screening programs, which can create cost efficiencies throughout the system and prevent the
incarceration of arrestees in cases that prosecutors will decline to pursue. Additionally, prosecutorial
screening can also provide the opportunity to divert defendants from traditional criminal justice system
processing into alternative programs and services that address criminogenic needs. Diverting defendants
prior to an initial appearance provides cost-savings to the system.
Nothing in this recommendation shall interfere with the service of charges on defendants. Furthermore,
the Commission recommends against mandatory early prosecutorial screening of domestic violence
cases. The safety of abuse victims is paramount. These cases should proceed as quickly as possible to
avoid any risk of serious harm to the alleged victim.
Recommendation Eight: Maximize and expand the use of the criminal citation process by law
enforcement.
In 2012, the Maryland General Assembly passed legislation (Senate Bill 422/Chapter 504 of 2012)
mandating the issuance of a criminal citation for certain offenses. The law allows an officer who has
grounds to make a warrantless arrest to (1) issue a citation in lieu of making an arrest (“cite and
release”), or (2) to make the arrest, process (i.e. fingerprint and photograph the defendant), and
subsequently issue a citation in lieu of continued custody and appearance before a Court Commissioner
(“book, cite and release”). The following offenses are qualifying offenses for charge by citation:
Any misdemeanor or local ordinance violation that does not carry a penalty of imprisonment;
Any misdemeanor or local ordinance violation for which the maximum penalty of imprisonment
is 90 days or less; and
Possession of marijuana under § 5-601 of the Criminal Law Article.
28 | P a g e
Section 4-101(c)(1)(i)(2) of the Criminal Procedure Article outlines the exceptions to the above
offenses. Additionally, although the law mandates the issuance of a citation for qualifying offenses, a
defendant must meet certain criteria to be released without appearing before a District Court
Commissioner. If a defendant cannot meet the criteria specified by statute, the officer must file a
statement of charges and ensure the defendant’s appearance before a Court Commissioner.
The statute also mandates the Maryland Statistical Analysis Center (MSAC) located at GOCCP to
compile an annual report on all criminal citations issued by law enforcement. MSAC concluded that
there were over 27,000 criminal citations issued by law enforcement in 2013. This represents an 80%
increase in the number of criminal citations issued annually. (On average, 15,000 criminal citations were
issued between 2007 and 2012).35
According to data from the Maryland Judiciary, there were nearly
20,000 fewer initial appearances in 2013 than in 2012 (153,305 compared to 172,895 in 2012).36
Based
on the criminal citation legislation passed in 2012, it is predicted that this drop in initial appearances is
related to the increased use of criminal citations. From a cost perspective, the further expansion of
criminal citations has the potential to save money by reducing arrest and booking costs.
Recommendation Nine: Create a system so that only one entity in the pretrial process has to pull and
summarize the arrestee’s record, consistent with and in accordance with state and federal law and the
independent needs of the system in order to operate efficiently.
In some Maryland jurisdictions, the criminal background of an arrestee is searched by several entities
prior to the initial appearance. The admitting officer, the pretrial investigator, the prosecutor, and the
Commissioner all search the same multiple databases, which is time consuming. By creating a system
where one entity compiles standard criminal history information and shares the data with other parties in
the system, valuable time and resources could be saved.
Recommendation Ten: Provide state funding to create a shared jail management system, possibly
through the Department of Public Safety and Correctional Services’ Offender Case Management System
(OCMS), to allow for data collection on the pretrial population statewide.
In Maryland, there are 23 local jails and detention centers and one detention center operated by the
Department of Public Safety and Correctional Services (DPSCS). Each facility utilizes its own jail
information management system. These local information systems do not interface with each other or
with the DPSCS’s Offender Case Management System (OCMS), thereby creating a critical barrier to the
seamless and timely flow of information. With nearly 250,000 arrests in Maryland each year, many
defendants have been placed in multiple jails and state prisons. Unfortunately, these independent jail
systems make it virtually impossible for a comprehensive set of information to follow a defendant as he
or she moves in and out of local facilities and state prisons. In addition, documented gang affiliations
and institutional security infractions from one local jail may be unknown if a defendant enters another
local jail or state prison facility.
In 2014, GOCCP was awarded a grant to interface local jail systems with the State’s OCMS. The grant
allows Maryland to connect and integrate state prison and local jail systems, as well as share
correctional information across jurisdictional boundaries. To implement this project, GOCCP will work
35
Maryland Statistical Analysis Center (2014). First Report to the State of Maryland Under SB 422: 2013 Criminal Citations
Data Analysis. Towson, MD. Governor’s Office of Crime Control & Prevention. 36
Maryland Judiciary.
29 | P a g e
with DPSCS and the Maryland Correctional Administrators Association (MCAA) to achieve greater
integration among institutional data systems to more effectively track and monitor both defendants and
offenders. Because MCAA is an organization of local jails and detention centers in Maryland, its
objective is consistent with that of DPSCS; to coordinate the collection, sharing, and analysis of relevant
defendant and offender information to improve institutional security, enhance public safety, and
facilitate inmate reentry efforts. MCAA’s President has committed to partner with DPSCS and GOCCP
to accomplish the following goals: (1) leverage existing resources to facilitate new and improved
information sharing among the corrections community; (2) create a central repository or access point
where law enforcement can access information on inmates who are, or have been, in state prisons and
local jails; (3) improve prison and jail security; (4) ensure critical information is analyzed and
disseminated to appropriate individuals for prompt action; and (5) develop a national model for
corrections-based information sharing. Despite the progress that Maryland has made in the
implementation of OCMS, there are still cost limitations to expanding the program statewide.
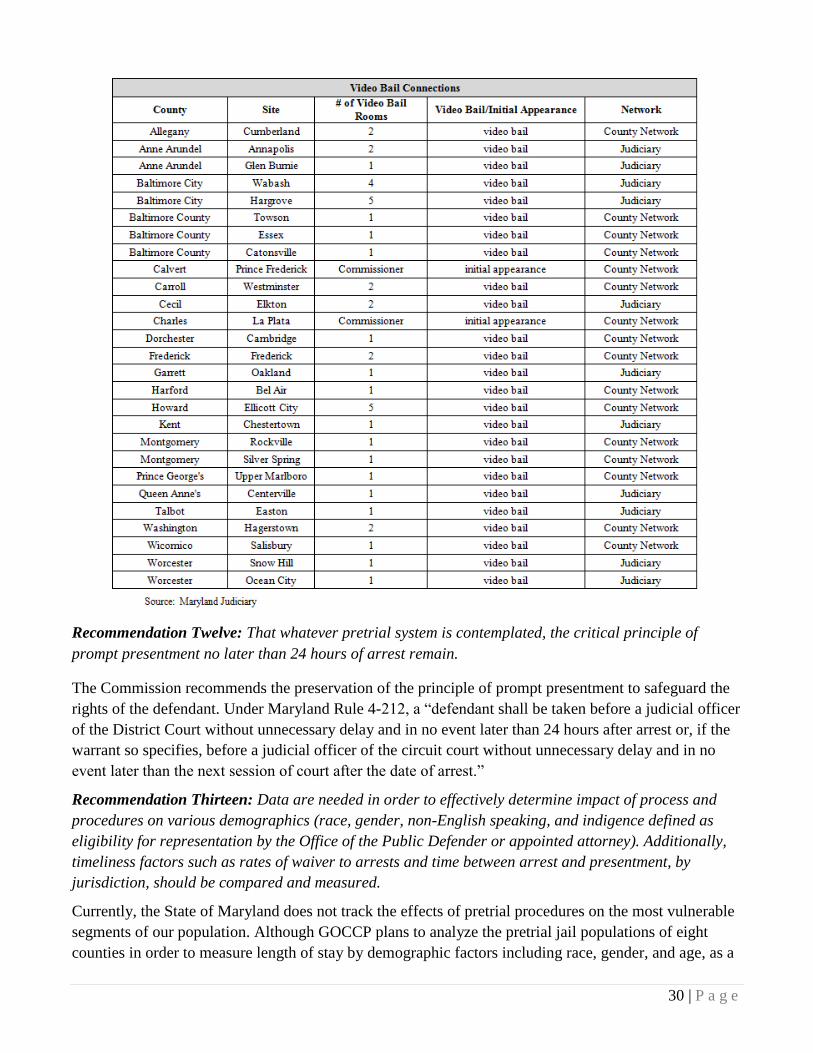
Recommendation Eleven: It is recommended that funding be provided for court and public safety-
designated facilities to be outfitted with audio/visual equipment to optimize court hearing efficiencies.
Maryland Rule 4-231 allows for the use of video conferencing during an initial appearance or a bail
review hearing. Currently, there are 27 court locations in Maryland that utilize this option.
Videoconferencing has several benefits, including allowing the court to process criminal cases more
efficiently and effectively. According to a survey conducted by the National Center for State Courts in
2010, participants cited time, staff, and fuel savings as videoconferencing benefits. According to the
study, jurisdictions reported the following savings: $31 million since inception (PA); 30% of travel
expenses (UT); $600,000 per year; $50,000 per year; and $500 per hearing were noted by different
courts.37
Maryland should explore the expanded use of videoconferencing to further the efficiencies of
the criminal justice system, while ensuring that this program serves to uphold individual constitutional
rights and the interests of crime victims. The following chart shows where videoconferencing is
currently being used in Maryland for initial appearances and bail review hearings.
37
National Center for State Courts, Video Conferencing Survey (2010), Retrieved at http://www.ncsc.org/services-and-
experts/areas-of-expertise/technology/ncsc-video-conferencing-survey.aspx.
30 | P a g e
Recommendation Twelve: That whatever pretrial system is contemplated, the critical principle of
prompt presentment no later than 24 hours of arrest remain.
The Commission recommends the preservation of the principle of prompt presentment to safeguard the
rights of the defendant. Under Maryland Rule 4-212, a “defendant shall be taken before a judicial officer
of the District Court without unnecessary delay and in no event later than 24 hours after arrest or, if the
warrant so specifies, before a judicial officer of the circuit court without unnecessary delay and in no
event later than the next session of court after the date of arrest.”
Recommendation Thirteen: Data are needed in order to effectively determine impact of process and
procedures on various demographics (race, gender, non-English speaking, and indigence defined as
eligibility for representation by the Office of the Public Defender or appointed attorney). Additionally,
timeliness factors such as rates of waiver to arrests and time between arrest and presentment, by
jurisdiction, should be compared and measured.
Currently, the State of Maryland does not track the effects of pretrial procedures on the most vulnerable
segments of our population. Although GOCCP plans to analyze the pretrial jail populations of eight
counties in order to measure length of stay by demographic factors including race, gender, and age, as a

31 | P a g e
state, Maryland is still missing critical information to effectively study our current pretrial system. At
every stage in the U.S. criminal justice system, people of color fare worse than their white counterparts
and the pretrial stage is no exception. The bail system in America is unfair to defendants, victims, the
general public, and particularly people of color.38
Black defendants are more likely to be detained than
are white defendants, and Latinos are the most likely to be detained.39
Nationally, Black men are given
bonds 35% higher than White men while Latino men are given bonds 19% higher than White men.40
Furthermore, people of color are more likely to be living in poverty and are therefore disadvantaged by a
monetary bail system.41
Recommendation Fourteen: A Commission to Study the Maryland Criminal Justice System shall be
created. The purpose of the Commission shall be to improve the effectiveness and efficiency of state and
local criminal justice systems by providing a centralized and impartial forum for statewide policy
development and planning with a focus on evidence-based decision making. The primary duty of the
Commission shall be to develop and maintain a state criminal justice policy and comprehensive, long-
range plan for a coordinated and cost-effective state criminal justice system that encompasses public
safety, defendant and offender accountability, crime reduction and prevention, and defendant and
offender treatment and rehabilitation.
In Maryland, although there have been prior commissions to look at the structure and functions of the
judicial branch and the future of the civil justice system, none of these prior commissions have directly
addressed the operation of the criminal justice system as a whole. More importantly, none examined the
institutions of the executive and judicial branches of government to determine if they were effectively
checking and balancing each other and thereby producing a fair, impartial and efficient criminal justice
system.
The Pretrial Commission notes that Oregon and Wisconsin have highly functioning state-level Criminal
Justice Commissions. Oregon’s Criminal Justice Commission is charged with developing a long-range
state public safety plan which includes making recommendations on the capacity and use of state prisons
and local jails, implementation of community corrections programs, and methods to reduce future
criminal conduct.42
The Wisconsin Criminal Justice Study Commission was formed in 2005 by the U.W.
Law School, Marquette Law School, the State Bar of Wisconsin, and the Wisconsin Department of
Justice. The Commission's purpose is to study issues affecting the accuracy of the criminal justice
system in order to ensure that the system convicts the guilty, and only the guilty. Its membership
includes judges, prosecutors, police officers, defense attorneys, victims' advocates, academics, and
community leaders from outside the justice system.43
The pretrial justice system cannot be analyzed in isolation from other stages of the criminal justice
process. The pretrial phase has measurable effects on other decision points. Therefore, the Commission
38
Pretrial Justice Institute (2014). Race & Bail in America. Pretrial Justice Institute. Retrieved from
http://www.pretrial.org/the-problem/race-bail/ . 39
See footnote 38. 40
Becki Ney, Center for Effective Public Policy, Implementing Pretrial Reform in Maryland Presentation (December 8,
2014). 41
See footnote 40. 42
Criminal Justice Commission, About Us. Oregon Criminal Justice Commission. Retrieved from
http://www.oregon.gov/CJC/Pages/contact_us.aspx. 43
State Bar of Wisconsin (May, 2007), More About the Wisconsin Criminal Justice Study Commission. Wisconsin Lawyer,
80(5).

32 | P a g e
recommends that a standing group of criminal justice stakeholders be established to come together
regularly to discuss and coordinate the criminal justice issues of the state and to consider the
implementation of evidence-based practices throughout all stages of the criminal justice system. This
recommendation is not meant to impede the ongoing efforts to improve pretrial justice in Maryland, but
rather to acknowledge the critical impact of pretrial decisions on later decision points in the criminal
justice system.
33 | P a g e
STATEMENT OF SENATOR CHRISTOPHER B. SHANK
AND SCOTT SHELLENBERGER, STATE’S ATTORNEY
We the undersigned commend the work of the commission and strongly support the majority of the
recommendations that will improve Maryland’s Pretrial System.
However, we would respectfully dissent from recommendation number four. The use of secured
financial bond whether in the form of cash, property or surety bond serves an important function in
Maryland’s Criminal Justice System. When family members, loved ones or friends have put financial
resources toward effecting a defendant’s release pretrial, it is an incentive for the defendant to appear in
court. With financial resources on the line many defendants will not fail to appear for fear of a financial
loss. The defendant’s personal investment in the current system of pretrial release has a useful place
within the pretrial system.
We strongly support the recommendation that the Maryland Insurance Commissioner review and report
where there are cases of abuse. In addition, the data the Commission has reviewed indicate that certain
high risk individuals are being released by making bail, further supporting the notion that more risk
assessment and supervision are called for. We believe, similar to the state of Colorado, that a vital and
effective system of pre-trial risk assessment and supervision can co-exist and support the current system
of utilizing bail. Our District Court Commissioners and Judges should have the discretion to utilize both
based on objective factors of risk and protecting public safety.
Christopher B. Shank
Maryland State Senate
Scott D. Shellenberger
State’s Attorney for
Baltimore County

34 | P a g e
DISSENT OF BRIAN J. FRANK
The Report and Recommendations of The Governor’s Commission to Reform Maryland’s Pretrial
System (the “Commission”) are a non-solution to a non-problem. Accordingly, I issue this dissent.
Although the Executive Order establishing the Commission called for an examination of the entire
pretrial system, the central problem confronting the Maryland criminal justice system -- and the real
impetus for the creation of the Commission -- was the Richmond v. DeWolfe case ("DeWolfe"), and the
havoc occasioned by the implementation of that ruling. Regrettably, in its Report, the Commission
barely touches upon the systemic problems associated with the DeWolfe ruling.
In regards to the Commission's recommendations for an overhaul of Maryland's pretrial system, imposed
time limitations for a comprehensive dissent to the Report do not allow for a full discussion of the
Commission's glaring failure to consider the most relevant data (most particularly the failure to appear
data provided by the District Court of Maryland), its neglect in terms of establishing benchmarks for
desired outcomes and its lack of critical analysis of the programs run in other jurisdictions. Perhaps,
most importantly, the Commission chose not to undertake a financial cost analysis of its sought after
"Pretrial Utopia," something that was self-evident from the presentation and discussion of the District of
Columbia's pretrial release system and its exorbitant budget.
Suffice it to say, the Commission ignored the most relevant data and consciously determined not to look
at costs because many of its members were predisposed to the outcomes set forth in the Report.
Respectfully submitted,
Brian J. Frank

35 | P a g e
APPENDIX A – MARYLAND PRETRIAL RISK ASSESSMENT DATA COLLECTION STUDY
Acknowledgements
The Commission would like to thank the Wardens and correctional intake officers and pretrial staff from
Baltimore City, Harford County, Montgomery County, Prince George’s County, St. Mary’s County, and
Washington County for agreeing to participate and produce data for the Maryland Pretrial Risk
Assessment Data Collection Study. Your efforts have produced valuable findings on the risk population
of Maryland defendants which have never before been collected. This data will be valuable in the State’s
efforts towards pretrial system reform.
Maryland Pretrial Risk Assessment Data Collection Study
Prepared by
James Austin, Ph.D.Johnette Peyton, M.S., MPH
The JFA InstituteDenver, CO/Malibu, CA/Washington, D.C.
Introduction
The Governor’s Office of Crime Control & Prevention (GOCCP) partnered with the Departmentof Public Safety & Correctional Services (DPSCS) and several local jail administrators, to beginexamining the risk levels of pretrial defendants in Maryland and how the courts are makingpretrial release decisions based on risk.
The purpose of this study was to gather data on a cohort of Maryland defendants over a two-week period, using a validated risk assessment tool from the state of Kentucky. Such a studywould help policy-makers understand the level of risk of failing to appear (FTA) or being re-arrested while under pretrial status. The analysis also evaluated how pretrial release decisionsare being made by judicial officers relative to the presumed risk levels of Maryland defendants.
The Kentucky Pretrial Risk Assessment (KPRA) instrument was chosen based on therecommendations of national pretrial experts, including the National Institute of Corrections.
The KPRA is one of eight known multi-jurisdictional risk instruments that have been deployed inColorado, Connecticut, Florida, Kentucky, Ohio, Maine, Virginia and the federal court system.These risk assessments use a variation of similar factors which have consistently been shown tobe predictors of FTAs or pretrial re-arrests. The Kentucky Pretrial Services Agency (KPSA) hasused the KPRA instrument from 2006 – 2013, which was initially validated by the JFA Institutein 2010 and then revalidated by the Vera Institute of Justice in 2013. These validation studieshave served to slightly modified and refined the original versions of the KPRA.
The KPRA is particularly useful for this exercise because it was implemented uniformly acrossthe state of Kentucky in both rural and urban settings. Another benefit of the KPRA is that itdoes not require an interview with the defendant which allowed for data to be collected ondefendants in a much timelier manner using existing databases.
JFA Institute was selected by GOCCP to conduct the analysis of 3,244 cases that were submittedfor analysis by the following six jurisdictions that agreed to participate in the data collectionstudy:
1. Baltimore City
2. Harford County
3. Montgomery County
4. Prince George’s County
5. St. Mary’s County
6. Washington County.
JFA Institute’s task was to conduct independent statistical analysis of the 3,244 records that weresubmitted by the six counties data that applied the KPRA to each defendant.
Initial Appearance and Bail Review Hearing
In Maryland defendants will appear before a Commissioner within a short period of time to makewhat is referred to as an initial appearance. At that hearing, bail is set and decisions are made onwhether to release the defendant or release the defendant based on one’s own recognizance
2

(ROR).
There are some offenses that by statute cannot result in a release by the Court Commissioner.These crimes are listed in the Maryland District Court Quick Reference Guide located at the endof this report. Factors that the Commissioners consider when making release determinations arealso included. Also, there is no formal requirement that the bond set by the Commissioner bebased on risk.
If the defendant is not released at the initial appearance, a subsequent Bail Hearing by a Judge isheld. The defendant’s record is reviewed once again, which can result in a change in the bailamount and a decision to release or detain. Judges are not constrained by the list of crimes forwhich Commissioners are not allowed to make release decisions at this review.
Research Design
As suggested above, the KPRA has evolved over time. In particular the number of scoringfactors has been reduced to eliminate redundancies and improve the amount of effort to completea risk assessment. The most recent version is referred to as the pre-screener instrument that canbe applied without the benefit of an interview. The number of scoring items is limited to sevenand includes the most common pretrial risk factors found in any validated tool such as currentoffense, criminal history, prior FTAs, pending cases, current probation, and parole statuses. Thefactors, weighting of the tool, and release recommendations are shown in Table 1.
The three risk levels require some explanation. The numerous studies of pretrial release have all shown that defendants released have relatively high (85-90%) success rates. Part of the reason for these high rates is the amount of time available to fail.
3
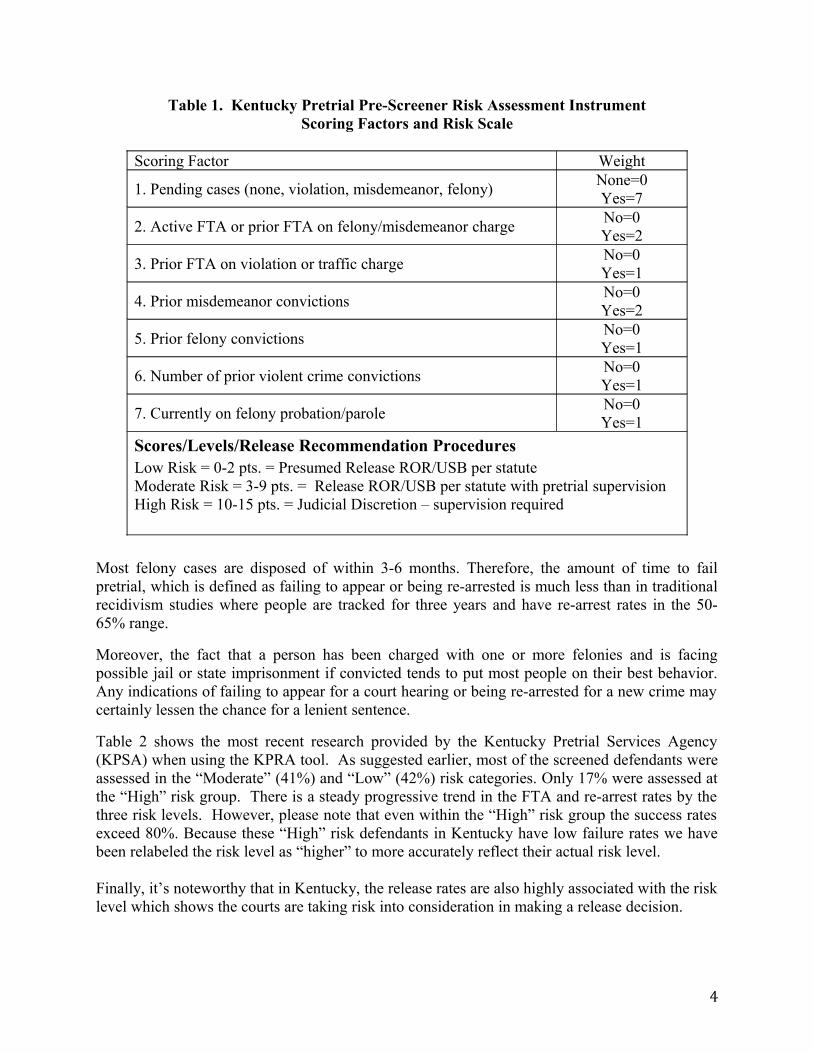
Table 1. Kentucky Pretrial Pre-Screener Risk Assessment InstrumentScoring Factors and Risk Scale
Scoring Factor Weight
1. Pending cases (none, violation, misdemeanor, felony) None=0Yes=7
2. Active FTA or prior FTA on felony/misdemeanor chargeNo=0Yes=2
3. Prior FTA on violation or traffic chargeNo=0Yes=1
4. Prior misdemeanor convictionsNo=0Yes=2
5. Prior felony convictionsNo=0Yes=1
6. Number of prior violent crime convictionsNo=0Yes=1
7. Currently on felony probation/paroleNo=0Yes=1
Scores/Levels/Release Recommendation ProceduresLow Risk = 0-2 pts. = Presumed Release ROR/USB per statuteModerate Risk = 3-9 pts. = Release ROR/USB per statute with pretrial supervisionHigh Risk = 10-15 pts. = Judicial Discretion – supervision required
Most felony cases are disposed of within 3-6 months. Therefore, the amount of time to failpretrial, which is defined as failing to appear or being re-arrested is much less than in traditionalrecidivism studies where people are tracked for three years and have re-arrest rates in the 50-65% range.
Moreover, the fact that a person has been charged with one or more felonies and is facingpossible jail or state imprisonment if convicted tends to put most people on their best behavior.Any indications of failing to appear for a court hearing or being re-arrested for a new crime maycertainly lessen the chance for a lenient sentence.
Table 2 shows the most recent research provided by the Kentucky Pretrial Services Agency(KPSA) when using the KPRA tool. As suggested earlier, most of the screened defendants wereassessed in the “Moderate” (41%) and “Low” (42%) risk categories. Only 17% were assessed atthe “High” risk group. There is a steady progressive trend in the FTA and re-arrest rates by thethree risk levels. However, please note that even within the “High” risk group the success ratesexceed 80%. Because these “High” risk defendants in Kentucky have low failure rates we havebeen relabeled the risk level as “higher” to more accurately reflect their actual risk level.
Finally, it’s noteworthy that in Kentucky, the release rates are also highly associated with the risklevel which shows the courts are taking risk into consideration in making a release decision.
4

Table 2. Recent Results of KPRA Pretrial ScreeningsJune 2011- June 2012
Risk Levels %Non FTA
RatesNon
Re-ArrestReleaseRates
Low 42% 93% 94% 85%Moderate 41% 87% 87% 68%High 17% 81% 80% 54%
Source: KPSA
Sampling Procedures
Maryland Correctional Intake Officers from the six jurisdictions used various databases to applythe KPRA instrument on all defendants arrested between October 15 th and October 29th. Thisprocess produced a total sample of 3,244 defendants. Only those defendants that went before aDistrict Court Commissioner at an initial appearance were scored by the KPRA and the risk levelwas recorded by the intake officer.
For each defendant, Intake Officers also recorded the pretrial release decision made by the CourtCommissioner at the initial appearance as well as the decision made by the judge during a bailreview hearing, if there was one. At the conclusion of the two-week period, all data elementswere provided to the JFA Institute. This file was then formatted for statistical analysis.
Table 3 provides background information on the six jurisdictions on a number of keydemographic and criminal justice attributes. In general, the six selected jurisdictions provide adiverse and representative picture of places where people are arrested and detained on criminalcharges.
Baltimore City stands out by its size and higher rates of reported crime (total and violent),arrests, jail bookings, and jail incarceration rate. In contrast, Montgomery County has very lowcrime, arrest, and jail incarceration rates. The other counties tend to have rates that fallsomewhere between Baltimore City and Montgomery County. When using the number of totalarrests as a measure of incarceration rates as opposed to the jurisdiction’s population, thedifferences among the jurisdictions decline.
Table 3 also provides estimated measures of the total average lengths of stay (LOS) in custodyfor all bookings based on the jail population and estimated bookings for the entire year. Theaverage total LOS ranges from a high of 58 days in Baltimore City and a low of 23 days inHarford County. Any systemic change in pretrial release practices would have an importantimpact on the estimated LOS and the jail populations, which have large proportions of pretrialdetainees.
The majority of the 3,244 cases sampled were from Baltimore City (1,520 or 47% of the totalsample). The smaller jurisdictions generated sufficient numbers so that comparisons byjurisdiction can be done. In total, the sample reflected about 5% of the total bookings per year.
5
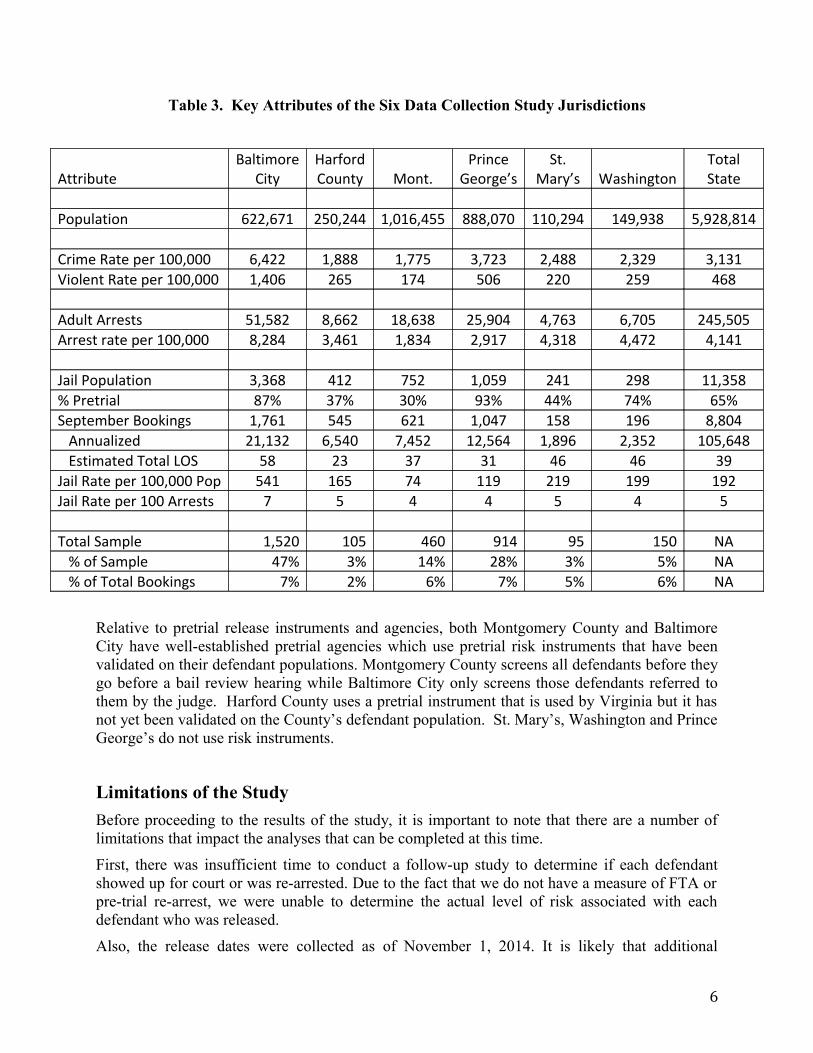
Table 3. Key Attributes of the Six Data Collection Study Jurisdictions
AttributeBaltimore
CityHarfordCounty Mont.
PrinceGeorge’s
St.Mary’s Washington
TotalState
Population 622,671 250,244 1,016,455 888,070 110,294 149,938 5,928,814 Crime Rate per 100,000 6,422 1,888 1,775 3,723 2,488 2,329 3,131Violent Rate per 100,000 1,406 265 174 506 220 259 468 Adult Arrests 51,582 8,662 18,638 25,904 4,763 6,705 245,505Arrest rate per 100,000 8,284 3,461 1,834 2,917 4,318 4,472 4,141 Jail Population 3,368 412 752 1,059 241 298 11,358% Pretrial 87% 37% 30% 93% 44% 74% 65%September Bookings 1,761 545 621 1,047 158 196 8,804 Annualized 21,132 6,540 7,452 12,564 1,896 2,352 105,648 Estimated Total LOS 58 23 37 31 46 46 39Jail Rate per 100,000 Pop 541 165 74 119 219 199 192Jail Rate per 100 Arrests 7 5 4 4 5 4 5 Total Sample 1,520 105 460 914 95 150 NA % of Sample 47% 3% 14% 28% 3% 5% NA % of Total Bookings 7% 2% 6% 7% 5% 6% NA
Relative to pretrial release instruments and agencies, both Montgomery County and BaltimoreCity have well-established pretrial agencies which use pretrial risk instruments that have beenvalidated on their defendant populations. Montgomery County screens all defendants before theygo before a bail review hearing while Baltimore City only screens those defendants referred tothem by the judge. Harford County uses a pretrial instrument that is used by Virginia but it hasnot yet been validated on the County’s defendant population. St. Mary’s, Washington and PrinceGeorge’s do not use risk instruments.
Limitations of the Study
Before proceeding to the results of the study, it is important to note that there are a number oflimitations that impact the analyses that can be completed at this time.
First, there was insufficient time to conduct a follow-up study to determine if each defendantshowed up for court or was re-arrested. Due to the fact that we do not have a measure of FTA orpre-trial re-arrest, we were unable to determine the actual level of risk associated with eachdefendant who was released.
Also, the release dates were collected as of November 1, 2014. It is likely that additional
6
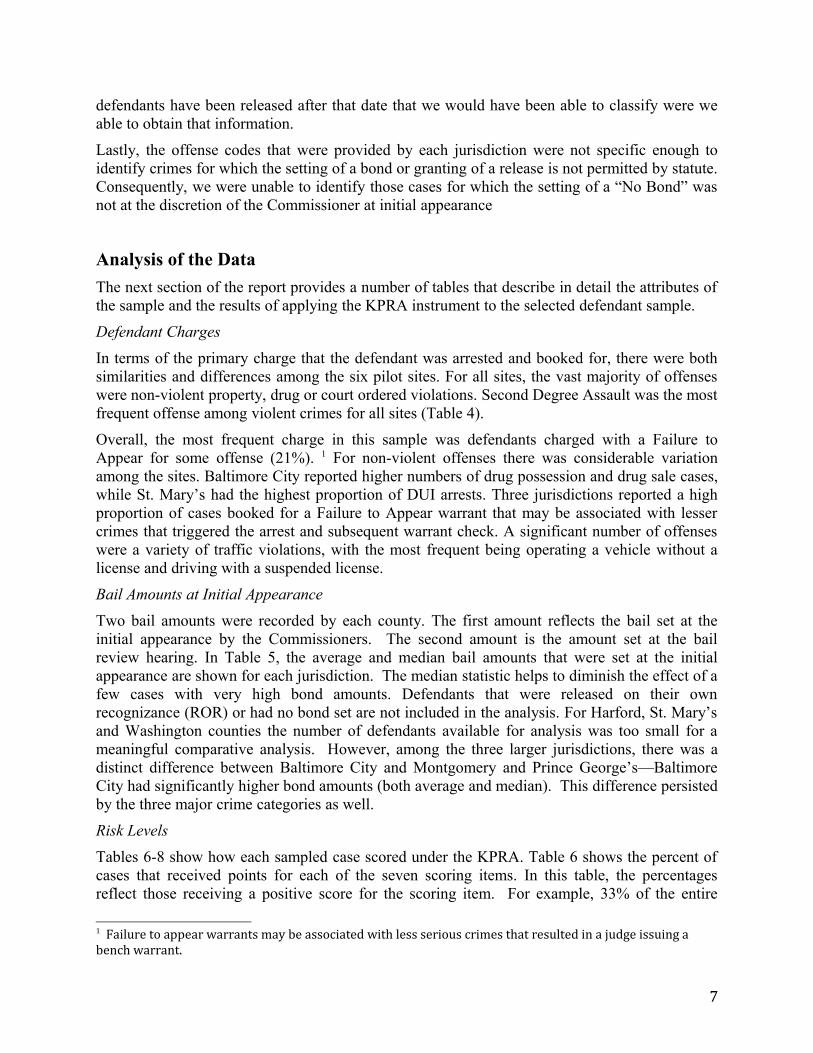
defendants have been released after that date that we would have been able to classify were weable to obtain that information.
Lastly, the offense codes that were provided by each jurisdiction were not specific enough toidentify crimes for which the setting of a bond or granting of a release is not permitted by statute.Consequently, we were unable to identify those cases for which the setting of a “No Bond” wasnot at the discretion of the Commissioner at initial appearance
Analysis of the Data
The next section of the report provides a number of tables that describe in detail the attributes ofthe sample and the results of applying the KPRA instrument to the selected defendant sample.
Defendant Charges
In terms of the primary charge that the defendant was arrested and booked for, there were bothsimilarities and differences among the six pilot sites. For all sites, the vast majority of offenseswere non-violent property, drug or court ordered violations. Second Degree Assault was the mostfrequent offense among violent crimes for all sites (Table 4).
Overall, the most frequent charge in this sample was defendants charged with a Failure toAppear for some offense (21%). 1 For non-violent offenses there was considerable variationamong the sites. Baltimore City reported higher numbers of drug possession and drug sale cases,while St. Mary’s had the highest proportion of DUI arrests. Three jurisdictions reported a highproportion of cases booked for a Failure to Appear warrant that may be associated with lessercrimes that triggered the arrest and subsequent warrant check. A significant number of offenseswere a variety of traffic violations, with the most frequent being operating a vehicle without alicense and driving with a suspended license.
Bail Amounts at Initial Appearance
Two bail amounts were recorded by each county. The first amount reflects the bail set at theinitial appearance by the Commissioners. The second amount is the amount set at the bailreview hearing. In Table 5, the average and median bail amounts that were set at the initialappearance are shown for each jurisdiction. The median statistic helps to diminish the effect of afew cases with very high bond amounts. Defendants that were released on their ownrecognizance (ROR) or had no bond set are not included in the analysis. For Harford, St. Mary’sand Washington counties the number of defendants available for analysis was too small for ameaningful comparative analysis. However, among the three larger jurisdictions, there was adistinct difference between Baltimore City and Montgomery and Prince George’s—BaltimoreCity had significantly higher bond amounts (both average and median). This difference persistedby the three major crime categories as well.
Risk Levels
Tables 6-8 show how each sampled case scored under the KPRA. Table 6 shows the percent ofcases that received points for each of the seven scoring items. In this table, the percentagesreflect those receiving a positive score for the scoring item. For example, 33% of the entire
1 Failure to appear warrants may be associated with less serious crimes that resulted in a judge issuing a bench warrant.
7

sample had other pending charges at the time of the arrest, and 47% had a prior or active FTAwarrant.
While there was some variation among the six sites, there was a common trend where largepercentages of the sample had other pending charges, prior FTAs (criminal or traffic), priormisdemeanors and prior felony convictions. On the other hand, there was also a sub-group thathas no prior history. Small percentages had a prior conviction for a violent crime and/or were onstate probation or parole supervision.
Table 7 shows the total KPRA risk score for each jurisdiction. The cut-off for the risk levels arehighlighted in red. As expected, there was a core group of low risk defendants receiving eithernone or 1-2 points based on the scoring items described above. These were persons with no otherpending charge and very limited if any prior criminal records. Similarly, there was a small butvisible group with a considerable prior record and most likely other pending charges who werescoring 10 points or higher.
The majority of defendants were in the middle with an overall average point score of 5.4 points.The average risk score did not vary significantly by jurisdiction despite the earlier noteddifferences in the crime, arrest and incarceration rates.
The similarities in the risk levels across the sites are illustrated in Table 8. For the entire sample,most defendants were scored as either low (33%) or moderate (45%) with 22% assessed ashigher risk. Using the same instrument in Kentucky, their risk levels consisted of 42% low risk,41% moderate risk, and 17% higher risk.
There were some differences with Montgomery County having the highest proportion of low risk(44%) and Washington County having the highest proportion of highest risk (29%). One iscautioned not to make too much out of these county by county differences based on the size ofthe samples and the extent of the differences.
8

Table 4. Primary Charge at Booking
Primary OffenseBaltimore
City Harford Mont.Prince
George’sSt.
Mary’s Wash. TotalTotal Cases 1,520 105 460 914 95 150 3,244 Violent 25% 28% 20% 25% 21% 29% 24% 1st Degree Assault 2% 3% 3% 3% 2% 4% 2% 2nd Degree Assault 14% 19% 13% 15% 14% 19% 15% Child Abuse 1% 1% 0% 0% 2% 0% 0% Murder 1% 1% 0% 0% 0% 1% 1% Rape 0% 0% 0% 0% 0% 1% 0% Robbery 4% 2% 2% 3% 2% 1% 3% Other Violent 0% 1% 0% 0% 1% 1% 0% Weapons 3% 2% 1% 3% 0% 3% 3% Other Sex Crimes 3% 1% 2% 3% 2% 3% 3% Non-Violent 57% 42% 47% 36% 72% 35% 48% Burglary 5% 11% 4% 2% 4% 11% 4% Disorder Cond/Public Drunk 5% 4% 8% 5% 5% 5% 6% Drug Possession 17% 7% 7% 5% 5% 2% 11% Drug Sale 8% 1% 4% 5% 0% 1% 6% DUI 1% 2% 1% 1% 17% 0% 2% Other Non-Violent 2% 3% 2% 2% 3% 4% 2% Other Traffic Violations 8% 3% 9% 5% 13% 3% 7% Resist Arrest 1% 2% 1% 1% 2% 1% 1% Theft/Fraud 10% 11% 12% 9% 22% 8% 10% Trespass 0% 0% 0% 0% 0% 0% 0% Court Related 15% 30% 31% 37% 5% 33% 25% FTA 14% 27% 27% 31% 0% 28% 21% Violation of Court Order 1% 3% 4% 6% 5% 5% 3%
9
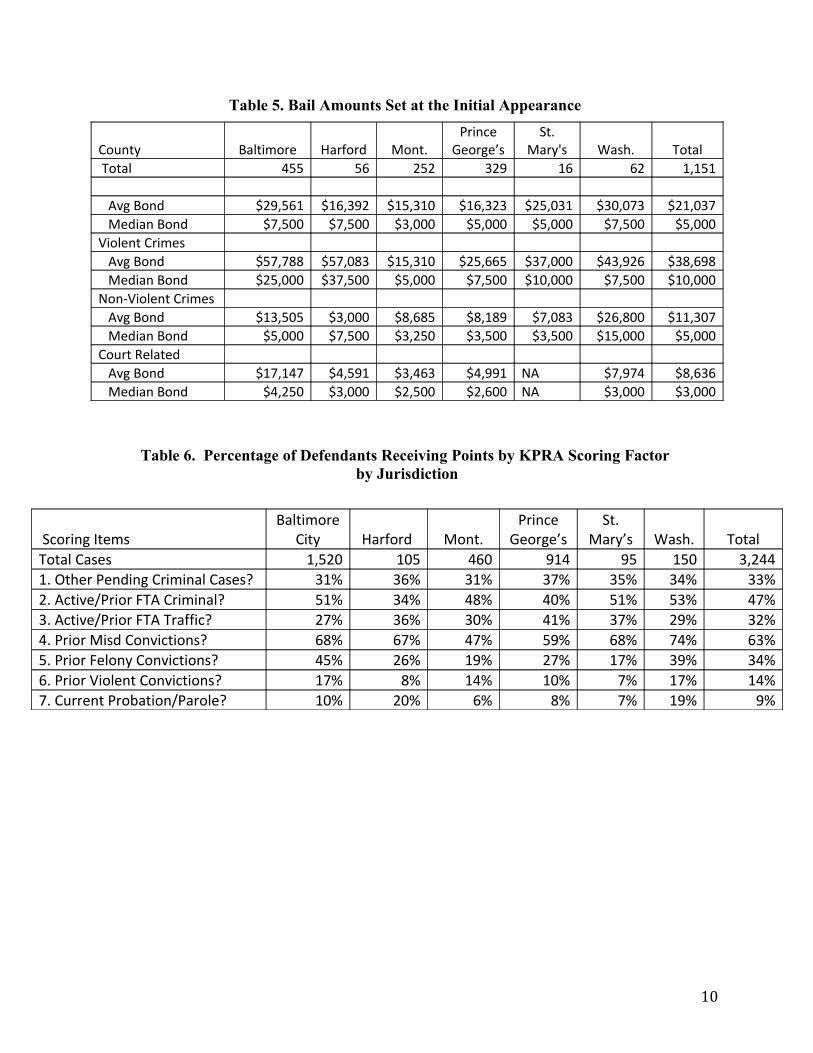
Table 5. Bail Amounts Set at the Initial Appearance
County Baltimore Harford Mont.Prince
George’sSt.
Mary's Wash. Total Total 455 56 252 329 16 62 1,151
Avg Bond $29,561 $16,392 $15,310 $16,323 $25,031 $30,073 $21,037 Median Bond $7,500 $7,500 $3,000 $5,000 $5,000 $7,500 $5,000Violent Crimes Avg Bond $57,788 $57,083 $15,310 $25,665 $37,000 $43,926 $38,698 Median Bond $25,000 $37,500 $5,000 $7,500 $10,000 $7,500 $10,000Non-Violent Crimes Avg Bond $13,505 $3,000 $8,685 $8,189 $7,083 $26,800 $11,307 Median Bond $5,000 $7,500 $3,250 $3,500 $3,500 $15,000 $5,000Court Related Avg Bond $17,147 $4,591 $3,463 $4,991 NA $7,974 $8,636 Median Bond $4,250 $3,000 $2,500 $2,600 NA $3,000 $3,000
Table 6. Percentage of Defendants Receiving Points by KPRA Scoring Factor by Jurisdiction
Scoring ItemsBaltimore
City Harford Mont.Prince
George’sSt.
Mary’s Wash. TotalTotal Cases 1,520 105 460 914 95 150 3,2441. Other Pending Criminal Cases? 31% 36% 31% 37% 35% 34% 33%2. Active/Prior FTA Criminal? 51% 34% 48% 40% 51% 53% 47%3. Active/Prior FTA Traffic? 27% 36% 30% 41% 37% 29% 32%4. Prior Misd Convictions? 68% 67% 47% 59% 68% 74% 63%5. Prior Felony Convictions? 45% 26% 19% 27% 17% 39% 34%6. Prior Violent Convictions? 17% 8% 14% 10% 7% 17% 14%7. Current Probation/Parole? 10% 20% 6% 8% 7% 19% 9%
10
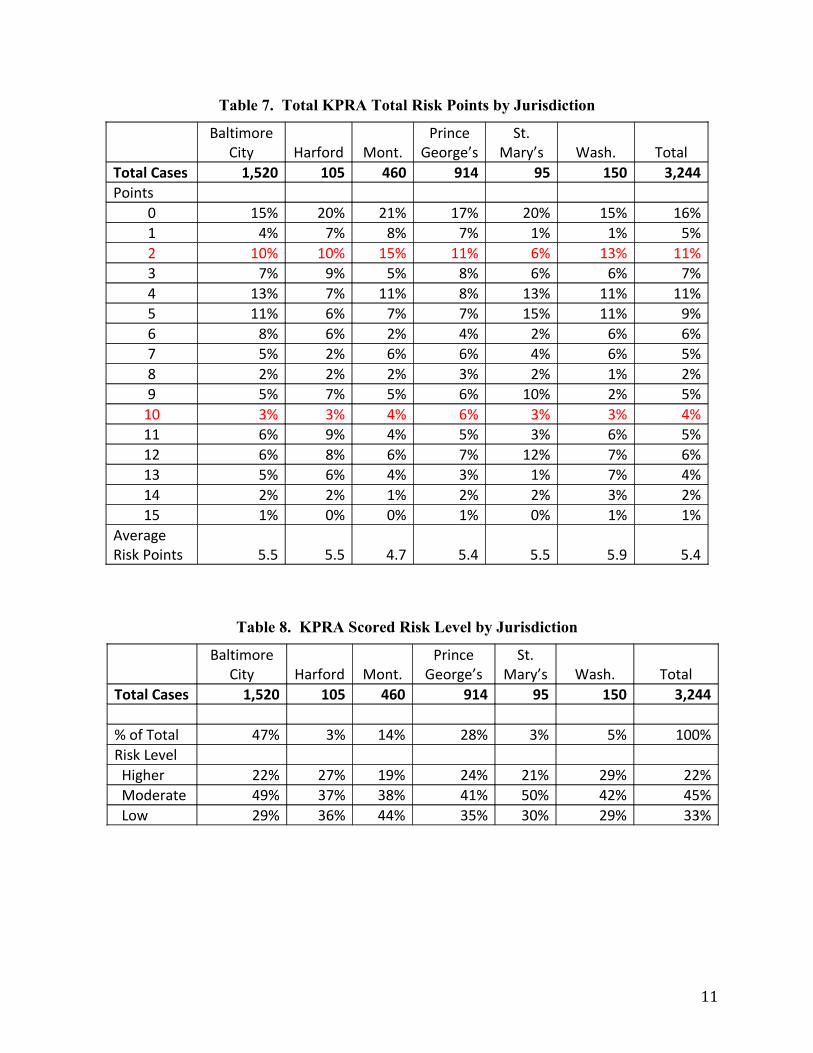
Table 7. Total KPRA Total Risk Points by Jurisdiction
Baltimore
City Harford Mont.Prince
George’sSt.
Mary’s Wash. TotalTotal Cases 1,520 105 460 914 95 150 3,244Points
0 15% 20% 21% 17% 20% 15% 16%1 4% 7% 8% 7% 1% 1% 5%2 10% 10% 15% 11% 6% 13% 11%3 7% 9% 5% 8% 6% 6% 7%4 13% 7% 11% 8% 13% 11% 11%5 11% 6% 7% 7% 15% 11% 9%6 8% 6% 2% 4% 2% 6% 6%7 5% 2% 6% 6% 4% 6% 5%8 2% 2% 2% 3% 2% 1% 2%9 5% 7% 5% 6% 10% 2% 5%
10 3% 3% 4% 6% 3% 3% 4%11 6% 9% 4% 5% 3% 6% 5%12 6% 8% 6% 7% 12% 7% 6%13 5% 6% 4% 3% 1% 7% 4%14 2% 2% 1% 2% 2% 3% 2%15 1% 0% 0% 1% 0% 1% 1%
Average Risk Points 5.5 5.5 4.7 5.4 5.5 5.9 5.4
Table 8. KPRA Scored Risk Level by Jurisdiction
Baltimore
City Harford Mont.Prince
George’sSt.
Mary’s Wash. TotalTotal Cases 1,520 105 460 914 95 150 3,244 % of Total 47% 3% 14% 28% 3% 5% 100%Risk Level Higher 22% 27% 19% 24% 21% 29% 22% Moderate 49% 37% 38% 41% 50% 42% 45% Low 29% 36% 44% 35% 30% 29% 33%
11
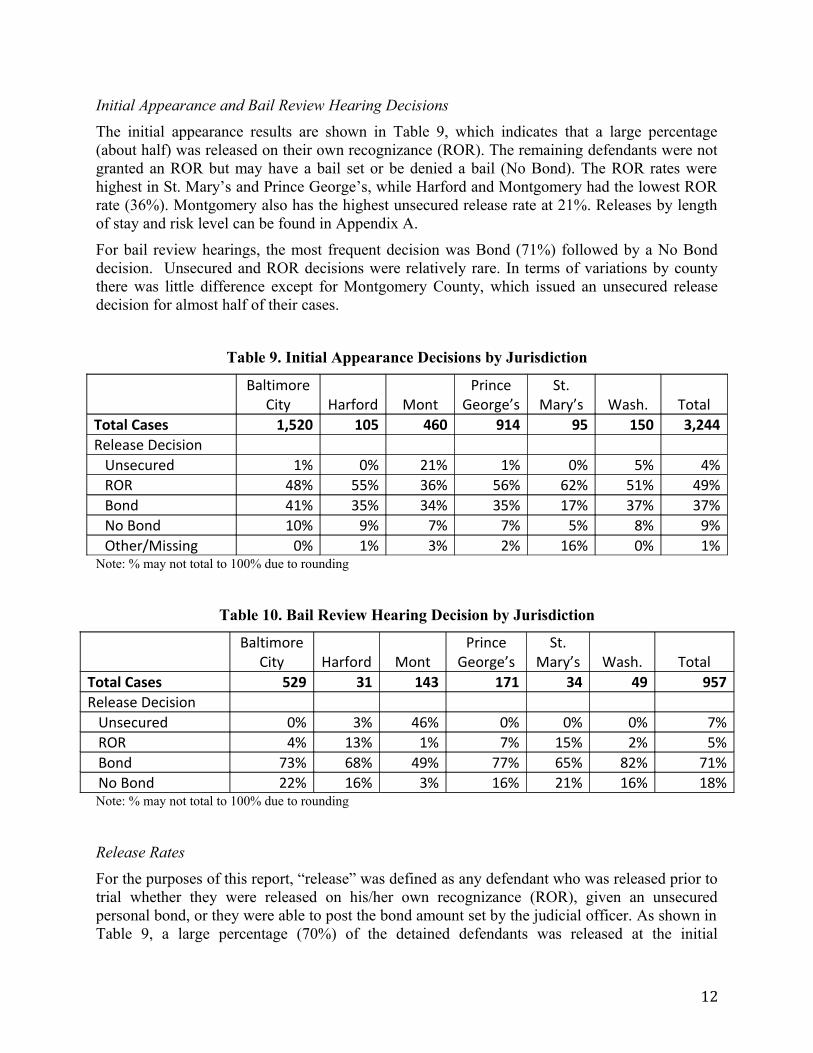
Initial Appearance and Bail Review Hearing Decisions
The initial appearance results are shown in Table 9, which indicates that a large percentage(about half) was released on their own recognizance (ROR). The remaining defendants were notgranted an ROR but may have a bail set or be denied a bail (No Bond). The ROR rates werehighest in St. Mary’s and Prince George’s, while Harford and Montgomery had the lowest RORrate (36%). Montgomery also has the highest unsecured release rate at 21%. Releases by lengthof stay and risk level can be found in Appendix A.
For bail review hearings, the most frequent decision was Bond (71%) followed by a No Bonddecision. Unsecured and ROR decisions were relatively rare. In terms of variations by countythere was little difference except for Montgomery County, which issued an unsecured releasedecision for almost half of their cases.
Table 9. Initial Appearance Decisions by Jurisdiction
Baltimore
City Harford MontPrince
George’sSt.
Mary’s Wash. TotalTotal Cases 1,520 105 460 914 95 150 3,244Release Decision Unsecured 1% 0% 21% 1% 0% 5% 4% ROR 48% 55% 36% 56% 62% 51% 49% Bond 41% 35% 34% 35% 17% 37% 37% No Bond 10% 9% 7% 7% 5% 8% 9% Other/Missing 0% 1% 3% 2% 16% 0% 1%Note: % may not total to 100% due to rounding
Table 10. Bail Review Hearing Decision by Jurisdiction
Baltimore
City Harford MontPrince
George’sSt.
Mary’s Wash. TotalTotal Cases 529 31 143 171 34 49 957Release Decision Unsecured 0% 3% 46% 0% 0% 0% 7% ROR 4% 13% 1% 7% 15% 2% 5% Bond 73% 68% 49% 77% 65% 82% 71% No Bond 22% 16% 3% 16% 21% 16% 18%
Note: % may not total to 100% due to rounding
Release Rates
For the purposes of this report, “release” was defined as any defendant who was released prior totrial whether they were released on his/her own recognizance (ROR), given an unsecuredpersonal bond, or they were able to post the bond amount set by the judicial officer. As shown inTable 9, a large percentage (70%) of the detained defendants was released at the initial
12
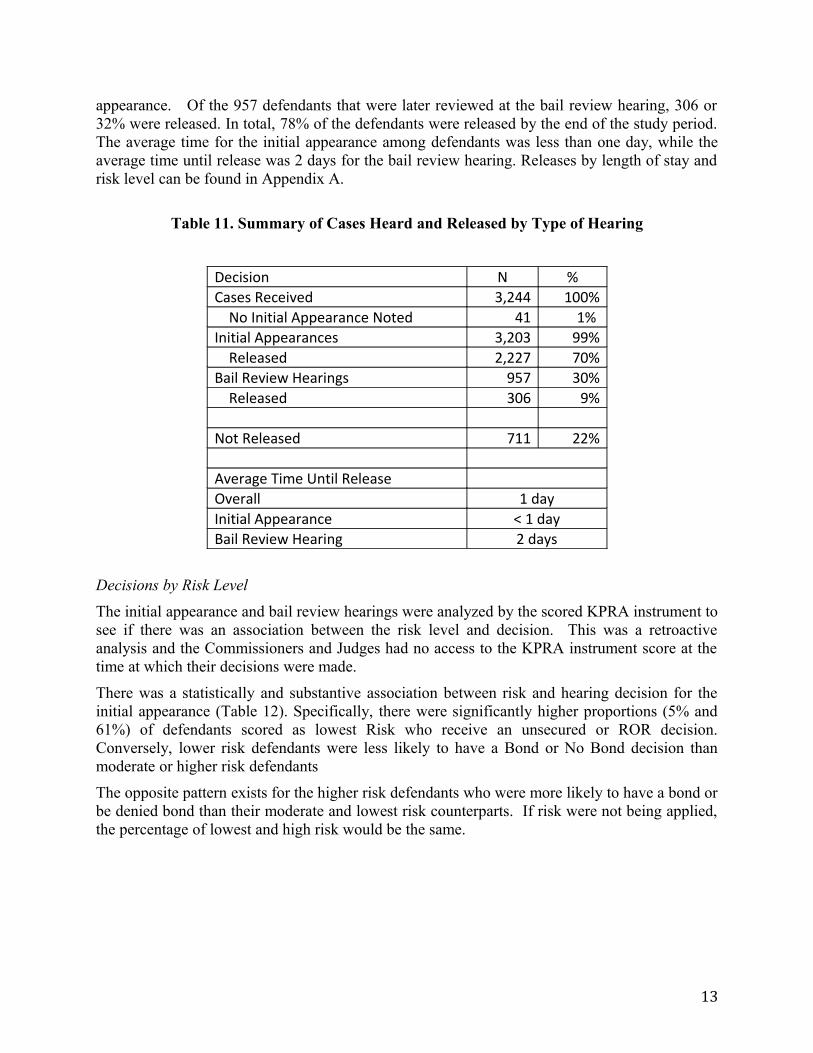
appearance. Of the 957 defendants that were later reviewed at the bail review hearing, 306 or32% were released. In total, 78% of the defendants were released by the end of the study period.The average time for the initial appearance among defendants was less than one day, while theaverage time until release was 2 days for the bail review hearing. Releases by length of stay andrisk level can be found in Appendix A.
Table 11. Summary of Cases Heard and Released by Type of Hearing
Decision N %Cases Received 3,244 100% No Initial Appearance Noted 41 1% Initial Appearances 3,203 99% Released 2,227 70%Bail Review Hearings 957 30% Released 306 9% Not Released 711 22%
Average Time Until ReleaseOverall 1 dayInitial Appearance < 1 dayBail Review Hearing 2 days
Decisions by Risk Level
The initial appearance and bail review hearings were analyzed by the scored KPRA instrument tosee if there was an association between the risk level and decision. This was a retroactiveanalysis and the Commissioners and Judges had no access to the KPRA instrument score at thetime at which their decisions were made.
There was a statistically and substantive association between risk and hearing decision for theinitial appearance (Table 12). Specifically, there were significantly higher proportions (5% and61%) of defendants scored as lowest Risk who receive an unsecured or ROR decision.Conversely, lower risk defendants were less likely to have a Bond or No Bond decision thanmoderate or higher risk defendants
The opposite pattern exists for the higher risk defendants who were more likely to have a bond orbe denied bond than their moderate and lowest risk counterparts. If risk were not being applied,the percentage of lowest and high risk would be the same.
13
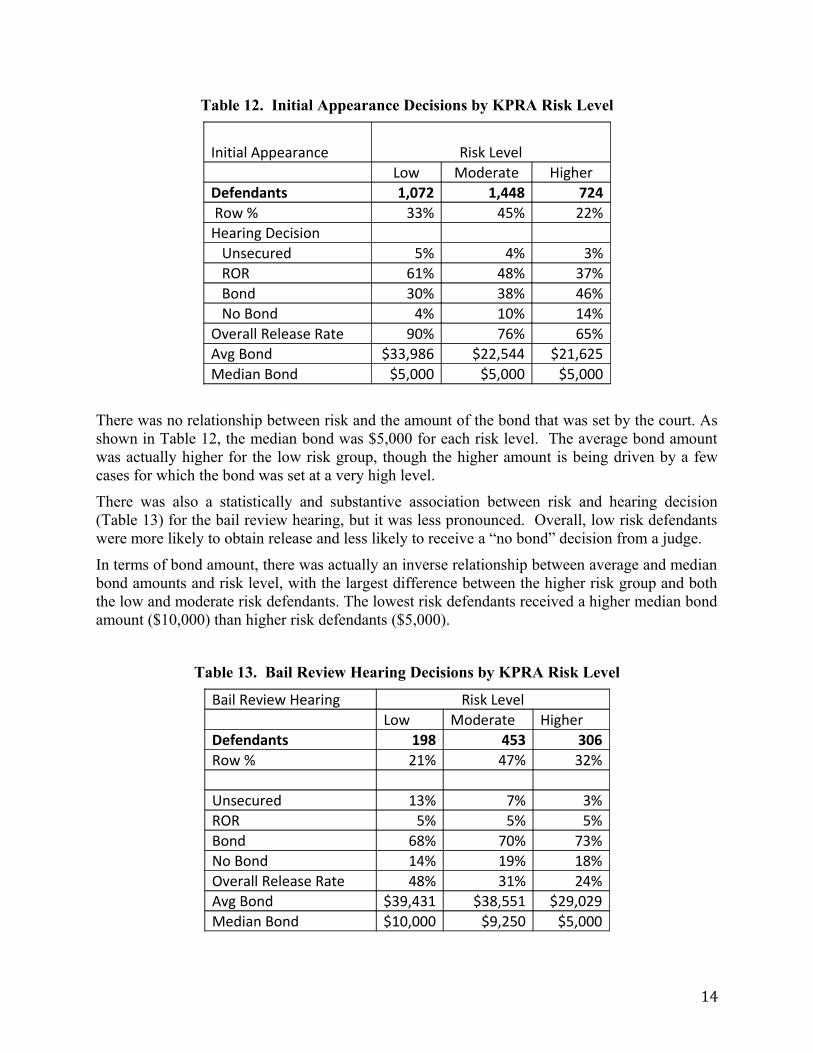
Table 12. Initial Appearance Decisions by KPRA Risk Level
Initial Appearance Risk Level Low Moderate HigherDefendants 1,072 1,448 724 Row % 33% 45% 22%Hearing Decision Unsecured 5% 4% 3% ROR 61% 48% 37% Bond 30% 38% 46% No Bond 4% 10% 14%Overall Release Rate 90% 76% 65%Avg Bond $33,986 $22,544 $21,625Median Bond $5,000 $5,000 $5,000
There was no relationship between risk and the amount of the bond that was set by the court. Asshown in Table 12, the median bond was $5,000 for each risk level. The average bond amountwas actually higher for the low risk group, though the higher amount is being driven by a fewcases for which the bond was set at a very high level.
There was also a statistically and substantive association between risk and hearing decision(Table 13) for the bail review hearing, but it was less pronounced. Overall, low risk defendantswere more likely to obtain release and less likely to receive a “no bond” decision from a judge.
In terms of bond amount, there was actually an inverse relationship between average and medianbond amounts and risk level, with the largest difference between the higher risk group and boththe low and moderate risk defendants. The lowest risk defendants received a higher median bondamount ($10,000) than higher risk defendants ($5,000).
Table 13. Bail Review Hearing Decisions by KPRA Risk Level
Bail Review Hearing Risk Level Low Moderate HigherDefendants 198 453 306Row % 21% 47% 32% Unsecured 13% 7% 3%ROR 5% 5% 5%Bond 68% 70% 73%No Bond 14% 19% 18%Overall Release Rate 48% 31% 24%Avg Bond $39,431 $38,551 $29,029Median Bond $10,000 $9,250 $5,000
14
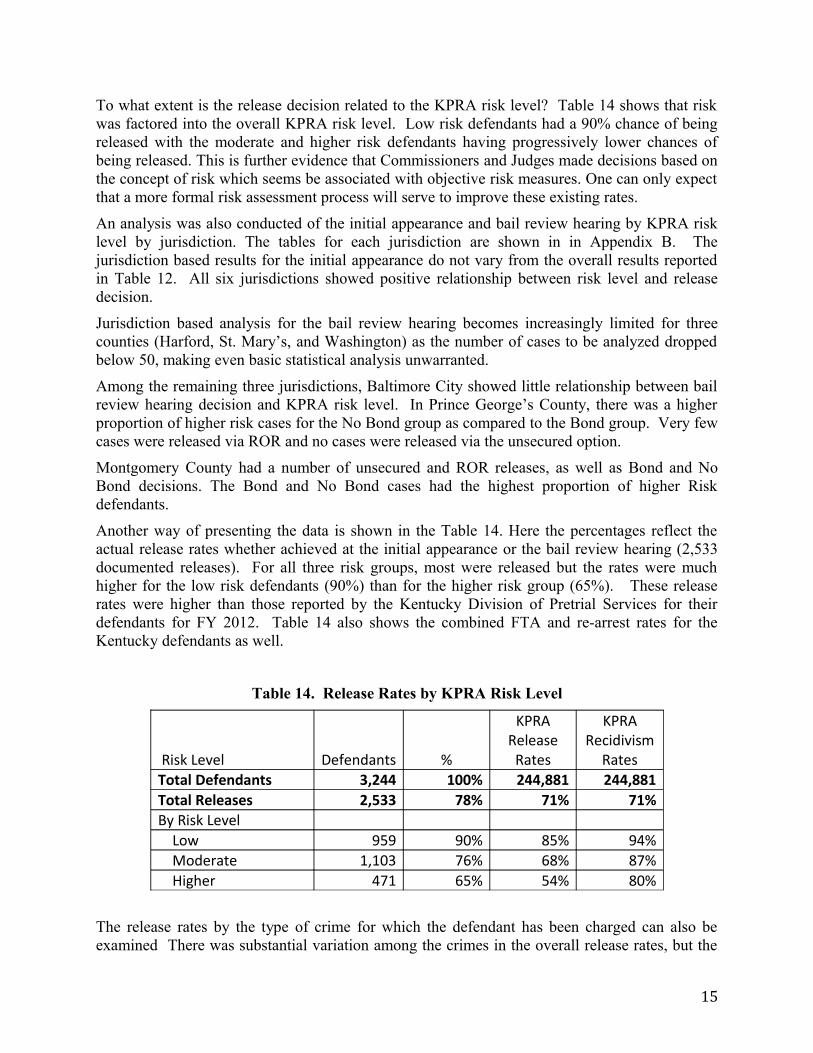
To what extent is the release decision related to the KPRA risk level? Table 14 shows that riskwas factored into the overall KPRA risk level. Low risk defendants had a 90% chance of beingreleased with the moderate and higher risk defendants having progressively lower chances ofbeing released. This is further evidence that Commissioners and Judges made decisions based onthe concept of risk which seems be associated with objective risk measures. One can only expectthat a more formal risk assessment process will serve to improve these existing rates.
An analysis was also conducted of the initial appearance and bail review hearing by KPRA risklevel by jurisdiction. The tables for each jurisdiction are shown in in Appendix B. Thejurisdiction based results for the initial appearance do not vary from the overall results reportedin Table 12. All six jurisdictions showed positive relationship between risk level and releasedecision.
Jurisdiction based analysis for the bail review hearing becomes increasingly limited for threecounties (Harford, St. Mary’s, and Washington) as the number of cases to be analyzed droppedbelow 50, making even basic statistical analysis unwarranted.
Among the remaining three jurisdictions, Baltimore City showed little relationship between bailreview hearing decision and KPRA risk level. In Prince George’s County, there was a higherproportion of higher risk cases for the No Bond group as compared to the Bond group. Very fewcases were released via ROR and no cases were released via the unsecured option.
Montgomery County had a number of unsecured and ROR releases, as well as Bond and NoBond decisions. The Bond and No Bond cases had the highest proportion of higher Riskdefendants.
Another way of presenting the data is shown in the Table 14. Here the percentages reflect theactual release rates whether achieved at the initial appearance or the bail review hearing (2,533documented releases). For all three risk groups, most were released but the rates were muchhigher for the low risk defendants (90%) than for the higher risk group (65%). These releaserates were higher than those reported by the Kentucky Division of Pretrial Services for theirdefendants for FY 2012. Table 14 also shows the combined FTA and re-arrest rates for theKentucky defendants as well.
Table 14. Release Rates by KPRA Risk Level
Risk Level Defendants %
KPRAReleaseRates
KPRARecidivism
RatesTotal Defendants 3,244 100% 244,881 244,881Total Releases 2,533 78% 71% 71%By Risk Level Low 959 90% 85% 94% Moderate 1,103 76% 68% 87% Higher 471 65% 54% 80%
The release rates by the type of crime for which the defendant has been charged can also beexamined There was substantial variation among the crimes in the overall release rates, but the
15
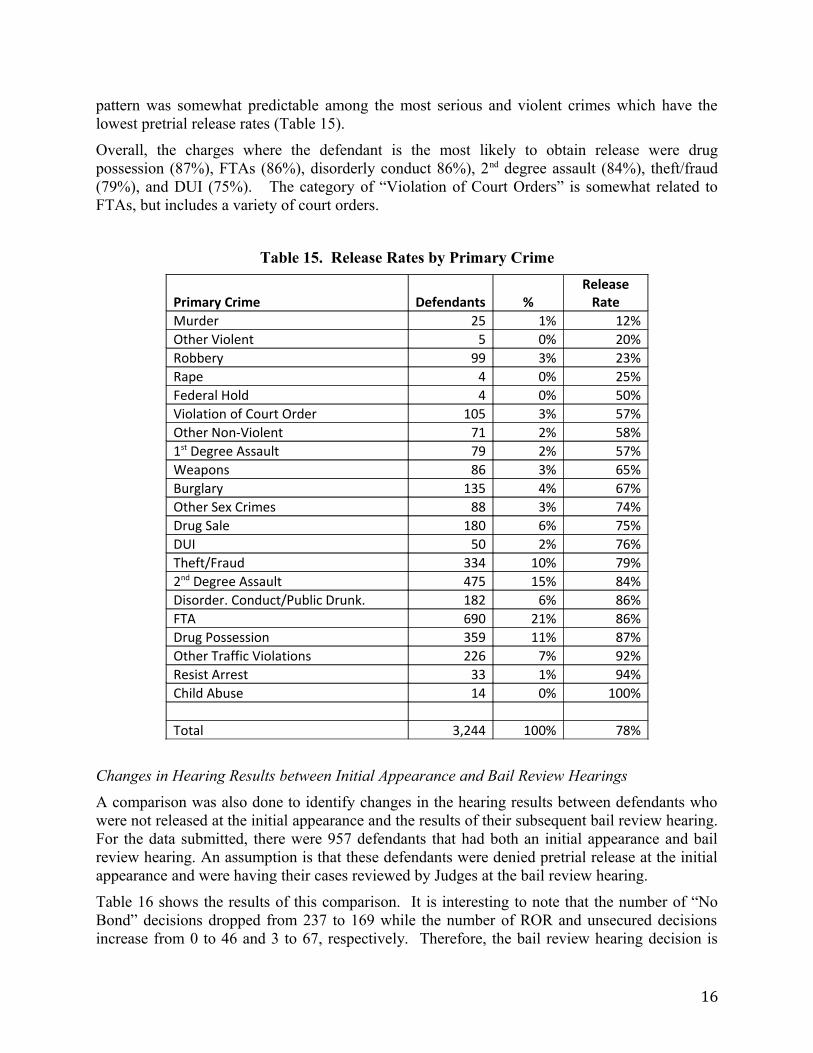
pattern was somewhat predictable among the most serious and violent crimes which have thelowest pretrial release rates (Table 15).
Overall, the charges where the defendant is the most likely to obtain release were drugpossession (87%), FTAs (86%), disorderly conduct 86%), 2nd degree assault (84%), theft/fraud(79%), and DUI (75%). The category of “Violation of Court Orders” is somewhat related toFTAs, but includes a variety of court orders.
Table 15. Release Rates by Primary Crime
Primary Crime Defendants %Release
RateMurder 25 1% 12%Other Violent 5 0% 20%Robbery 99 3% 23%Rape 4 0% 25%Federal Hold 4 0% 50%Violation of Court Order 105 3% 57%Other Non-Violent 71 2% 58%1st Degree Assault 79 2% 57%Weapons 86 3% 65%Burglary 135 4% 67%Other Sex Crimes 88 3% 74%Drug Sale 180 6% 75%DUI 50 2% 76%Theft/Fraud 334 10% 79%2nd Degree Assault 475 15% 84%Disorder. Conduct/Public Drunk. 182 6% 86%FTA 690 21% 86%Drug Possession 359 11% 87%Other Traffic Violations 226 7% 92%Resist Arrest 33 1% 94%Child Abuse 14 0% 100% Total 3,244 100% 78%
Changes in Hearing Results between Initial Appearance and Bail Review Hearings
A comparison was also done to identify changes in the hearing results between defendants whowere not released at the initial appearance and the results of their subsequent bail review hearing.For the data submitted, there were 957 defendants that had both an initial appearance and bailreview hearing. An assumption is that these defendants were denied pretrial release at the initialappearance and were having their cases reviewed by Judges at the bail review hearing.
Table 16 shows the results of this comparison. It is interesting to note that the number of “NoBond” decisions dropped from 237 to 169 while the number of ROR and unsecured decisionsincrease from 0 to 46 and 3 to 67, respectively. Therefore, the bail review hearing decision is
16
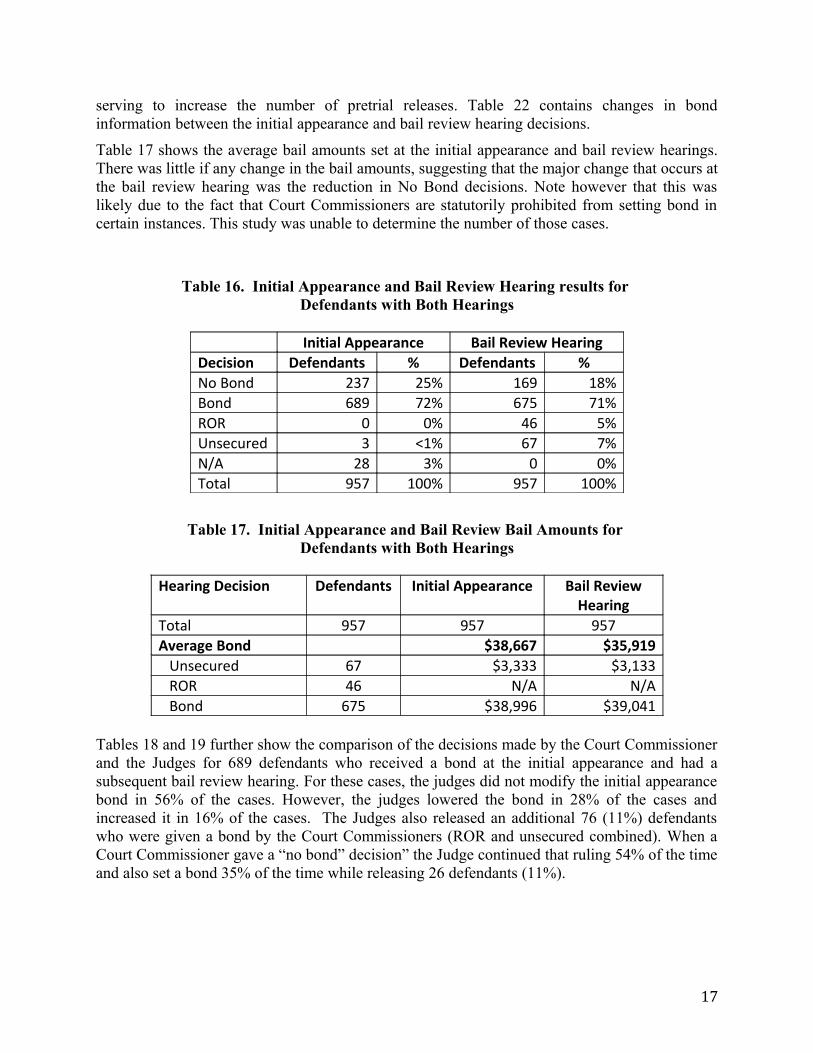
serving to increase the number of pretrial releases. Table 22 contains changes in bondinformation between the initial appearance and bail review hearing decisions.
Table 17 shows the average bail amounts set at the initial appearance and bail review hearings.There was little if any change in the bail amounts, suggesting that the major change that occurs atthe bail review hearing was the reduction in No Bond decisions. Note however that this waslikely due to the fact that Court Commissioners are statutorily prohibited from setting bond incertain instances. This study was unable to determine the number of those cases.
Table 16. Initial Appearance and Bail Review Hearing results for Defendants with Both Hearings
Initial Appearance Bail Review HearingDecision Defendants % Defendants %No Bond 237 25% 169 18%Bond 689 72% 675 71%ROR 0 0% 46 5%Unsecured 3 <1% 67 7%N/A 28 3% 0 0%Total 957 100% 957 100%
Table 17. Initial Appearance and Bail Review Bail Amounts for Defendants with Both Hearings
Hearing Decision Defendants Initial Appearance Bail Review
HearingTotal 957 957 957Average Bond $38,667 $35,919 Unsecured 67 $3,333 $3,133 ROR 46 N/A N/A Bond 675 $38,996 $39,041
Tables 18 and 19 further show the comparison of the decisions made by the Court Commissionerand the Judges for 689 defendants who received a bond at the initial appearance and had asubsequent bail review hearing. For these cases, the judges did not modify the initial appearancebond in 56% of the cases. However, the judges lowered the bond in 28% of the cases andincreased it in 16% of the cases. The Judges also released an additional 76 (11%) defendantswho were given a bond by the Court Commissioners (ROR and unsecured combined). When aCourt Commissioner gave a “no bond” decision” the Judge continued that ruling 54% of the timeand also set a bond 35% of the time while releasing 26 defendants (11%).
17

Table 18. Adjustment of Initial Appearance Bond Decision by Judge At Bail Review Hearing
Received a Bond by Court CommissionerBail Review Hearing Decision Defendants %Bond 578 84% Bond stayed the same 325 56% Bond Increased 91 16% Bond Decreased 160 28%No Bond 35 5%ROR 30 4%Unsecured 46 7%Total 689 100%
Table 19. Adjustment of Initial Appearance No Bond Decision by Judge At Bail Review Hearing
Received a No Bond by Court CommissionerBail Review Hearing Decision Defendants %Bond 82 35%No Bond 129 54%ROR 12 5%Unsecured 14 6%Total 689 100%
Profile of the Non-Released Defendants
There were 711 defendants who were not released as of November 1, 2014. Individuals notreleased likely represent the bulk of the local jail’s pretrial population. Most research has shownthat defendants who were unable to secure release within the first few days of detention tend toremain in jail until their criminal cases are disposed of by the courts. The following tables showthe attributes of these defendants who were not released relative to their levels of risk, bond andcharges.
While approximately (35%) were in the higher risk group, the remaining 65% were eithermoderate to low risk for FTA or being rearrested while under pretrial release status (Table 20).At both the initial appearance and bail review hearings, about 68%had a bond set and could havebeen released had they been able to secure the funds to post bail. Another 30% had a No Bondorder set indicating no possibility for release.
18
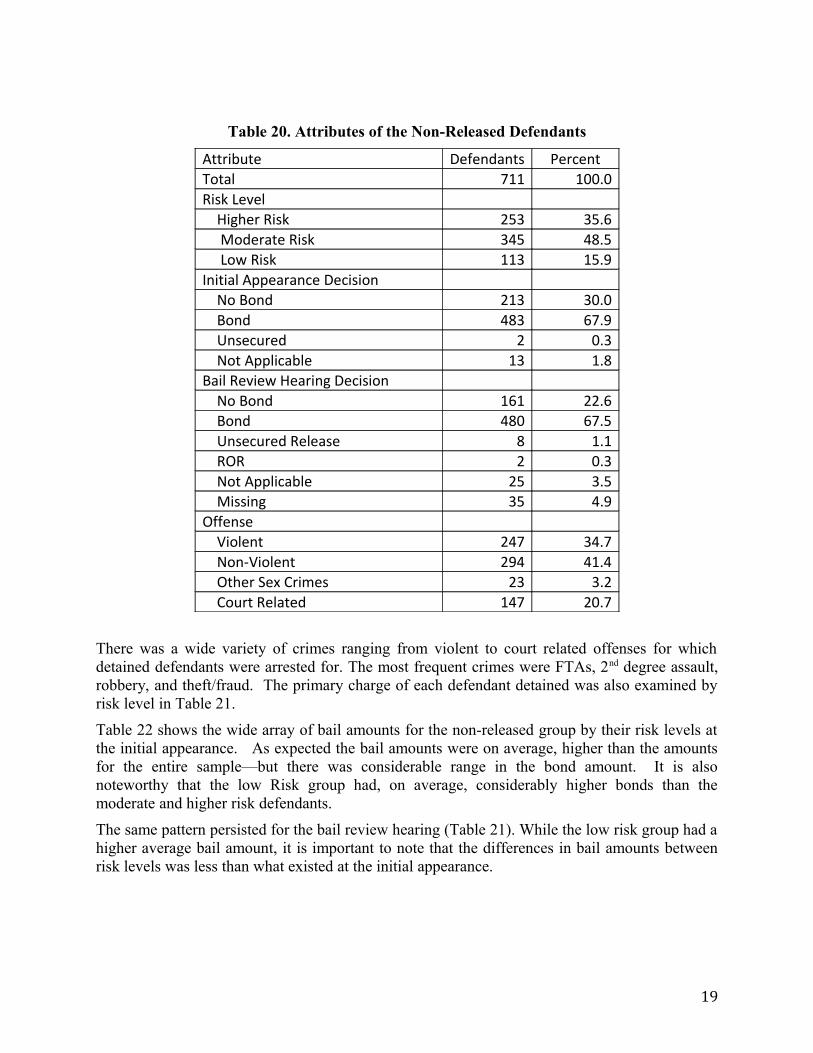
Table 20. Attributes of the Non-Released Defendants
Attribute Defendants PercentTotal 711 100.0Risk Level Higher Risk 253 35.6 Moderate Risk 345 48.5 Low Risk 113 15.9Initial Appearance Decision No Bond 213 30.0 Bond 483 67.9 Unsecured 2 0.3 Not Applicable 13 1.8Bail Review Hearing Decision No Bond 161 22.6 Bond 480 67.5 Unsecured Release 8 1.1 ROR 2 0.3 Not Applicable 25 3.5 Missing 35 4.9Offense Violent 247 34.7 Non-Violent 294 41.4 Other Sex Crimes 23 3.2 Court Related 147 20.7
There was a wide variety of crimes ranging from violent to court related offenses for whichdetained defendants were arrested for. The most frequent crimes were FTAs, 2nd degree assault,robbery, and theft/fraud. The primary charge of each defendant detained was also examined byrisk level in Table 21.
Table 22 shows the wide array of bail amounts for the non-released group by their risk levels atthe initial appearance. As expected the bail amounts were on average, higher than the amountsfor the entire sample—but there was considerable range in the bond amount. It is alsonoteworthy that the low Risk group had, on average, considerably higher bonds than themoderate and higher risk defendants.
The same pattern persisted for the bail review hearing (Table 21). While the low risk group had ahigher average bail amount, it is important to note that the differences in bail amounts betweenrisk levels was less than what existed at the initial appearance.
19

Table 21. Primary Charge for the Non-Releases by Risk Level
Risk Level
Crime Low Moderate Higher Total Percent
FTA 5 50 45 100 14.12nd Degree Assault 21 43 14 78 11.0Robbery 25 34 17 76 10.7Theft/Fraud 7 29 33 69 9.7Drug Possession 3 22 22 47 6.6Drug Sale 4 21 20 45 6.3Burglary 5 22 18 45 6.3Violation of Court Order 25 2 18 45 6.31st Degree Assault 6 22 6 34 4.8Other Non-Violent 7 15 8 30 4.2Weapons 8 15 7 30 4.2Disorderly Conduct/Public Drunk 2 14 10 26 3.7Other Sex Crimes 2 12 9 23 3.2Murder 7 9 6 22 3.1Other Traffic Violations 0 12 6 18 2.5DUI 7 3 2 12 1.7Other Violent 0 2 2 4 0.6Rape 1 1 1 3 0.4Federal Hold 1 0 1 2 0.3Resist Arrest 0 1 1 2 0.3
The reason the bonds between the initial appearance and bail review hearing were lower isbecause Judges were disproportionately lowering the bail amounts set by the Commissioners.Table 22 shows that of 689 cases for which a bond was set by a Commissioner, 160 werelowered at the bail review hearing. Furthermore, another 76 defendants were released on RORor Unsecured Bails. This means that a total of 236 (39%) defendants benefited by the bailreview Hearing by either having their bail amounts lowered or gaining release. Conversely, 126defendants had their bonds increased or received a no bond decision.
20

Table 22. Initial Appearance Bail Amount for the Non-Releases by Risk Level
Initial Appearance Bail Amount Risk Level Low Moderate HigherDefendants 79 234 170Row % 16% 48% 35%
<$1,001 4% 5% 9%$1,001 - $2,500 4% 9% 12%$2,501 - $5,000 9% 25% 29%
$5,001 - $10,000 13% 15% 15%$10,001 - $15,000 6% 5% 5%$15,001 - $25,000 11% 10% 8%$25,001 - $50,000 10% 13% 11%
$50,001 - $100,000 19% 11% 4%>$100,000 24% 7% 7%
Average Bail Amount $98,324 $36,086 $31,743
21
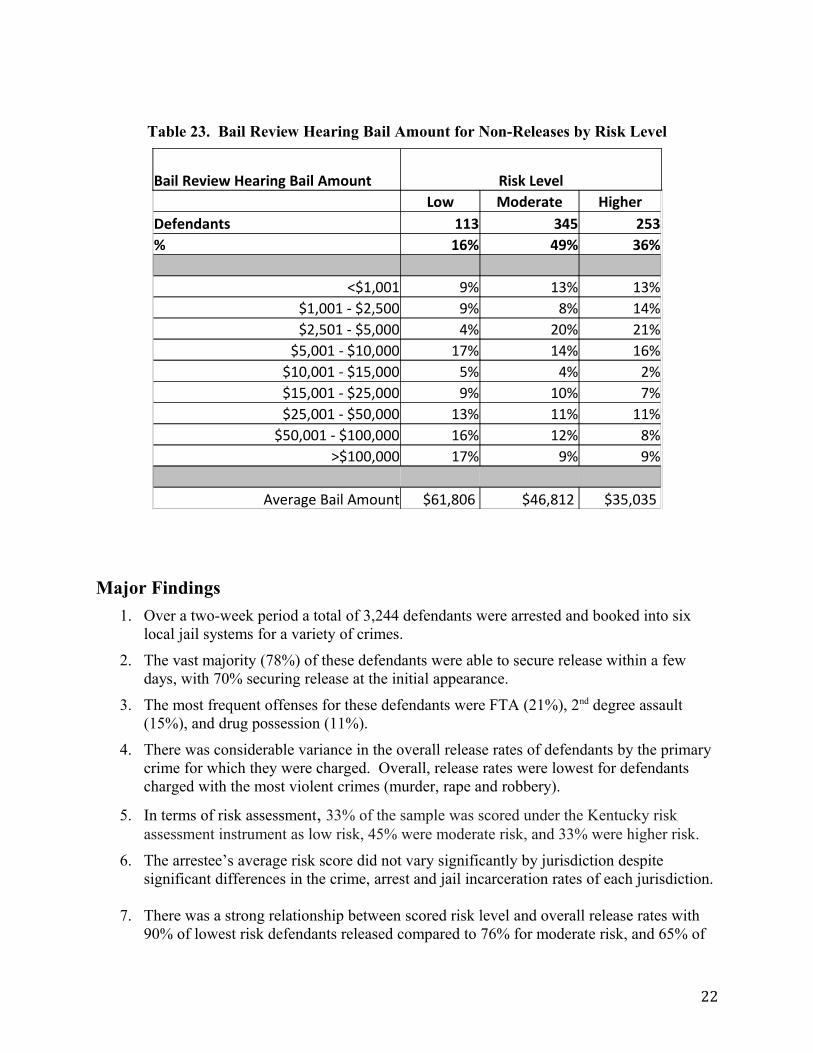
Table 23. Bail Review Hearing Bail Amount for Non-Releases by Risk Level
Bail Review Hearing Bail Amount Risk Level Low Moderate HigherDefendants 113 345 253% 16% 49% 36%
<$1,001 9% 13% 13%$1,001 - $2,500 9% 8% 14%$2,501 - $5,000 4% 20% 21%
$5,001 - $10,000 17% 14% 16%$10,001 - $15,000 5% 4% 2%$15,001 - $25,000 9% 10% 7%$25,001 - $50,000 13% 11% 11%
$50,001 - $100,000 16% 12% 8%>$100,000 17% 9% 9%
Average Bail Amount $61,806 $46,812 $35,035
Major Findings
1. Over a two-week period a total of 3,244 defendants were arrested and booked into six local jail systems for a variety of crimes.
2. The vast majority (78%) of these defendants were able to secure release within a few days, with 70% securing release at the initial appearance.
3. The most frequent offenses for these defendants were FTA (21%), 2nd degree assault (15%), and drug possession (11%).
4. There was considerable variance in the overall release rates of defendants by the primary crime for which they were charged. Overall, release rates were lowest for defendants charged with the most violent crimes (murder, rape and robbery).
5. In terms of risk assessment, 33% of the sample was scored under the Kentucky risk assessment instrument as low risk, 45% were moderate risk, and 33% were higher risk.
6. The arrestee’s average risk score did not vary significantly by jurisdiction despite significant differences in the crime, arrest and jail incarceration rates of each jurisdiction.
7. There was a strong relationship between scored risk level and overall release rates with 90% of lowest risk defendants released compared to 76% for moderate risk, and 65% of
22

the higher risk defendants.
8. While there was a correlation between risk levels and overall release decisions, there was no such relationship between risk and the bond amount that was set by the court.
9. At the bail review hearing, a number of defendants who were given No Bond at the initialappearance were subsequently released on ROR and Bond or Unsecured Bond.
10. Overall, the bail review hearing seems to favor defendants, with many of them having thebail amounts set at the initial appearance being lowered or securing pretrial release.
11. Overall, the severity of the crime and the scored risk level were both associated with initial appearance and bail review decisions.
12. At both the initial and bail review hearings, there was an inverse relationship between bail amounts and risk levels. Low risk defendants had higher bail amounts than moderate and higher risk defendants.
13. Of those defendants who were unable to secure release by the end of the study, 16% werelow risk, 49% were moderate risk, and 36% were high risk. Regardless of risk level, about two-third of the not released group were not able to post a bond amount by the end of the study.
Policy Recommendations
1. The state should develop its own risk assessment instrument that has been tested andvalidated on its own defendant population.
2. Such a risk assessment instrument study can be completed with the instrument readied forimplementation within six months.
3. Adoption of a standardized risk assessment system will help improve the existing risk-based decisions being made at the initial and bail review hearings.
4. Implementation of a statewide, validated risk assessment system would also help identifysuitable candidates for release who are now unable to secure release which in turn wouldhave a positive impact on the local pretrial population.
Overview of the Proposed Validation Study
A validation study for a pretrial risk statewide assessment system is designed to identifyscreening factors that are statistically associated with two key measures of pretrial performance:1) failure to appear (FTA) and/or 2) re-arrest while under pretrial supervision. Potentialindividual scoring items (also known as the independent variables) are tested to see which oneshave the strongest relationship with FTA and re-arrests. The screening items selected are thenweighted based on their statistical strengths to create a scale that can be translated into risk levels(low, moderate and higher).
The validation research design consists of creating a cohort of defendants arrested, booked intocustody and subsequently released on some form of pretrial release order (e.g. bail, ROR). Foreach released defendant, both potential risk factors and the FTA/re-arrest data are collected.Statistical analysis is then performed (both bivariate and multi-variate) to determine which set of
23

risk variables perform best in identifying the actual risk level of the released defendants.
24
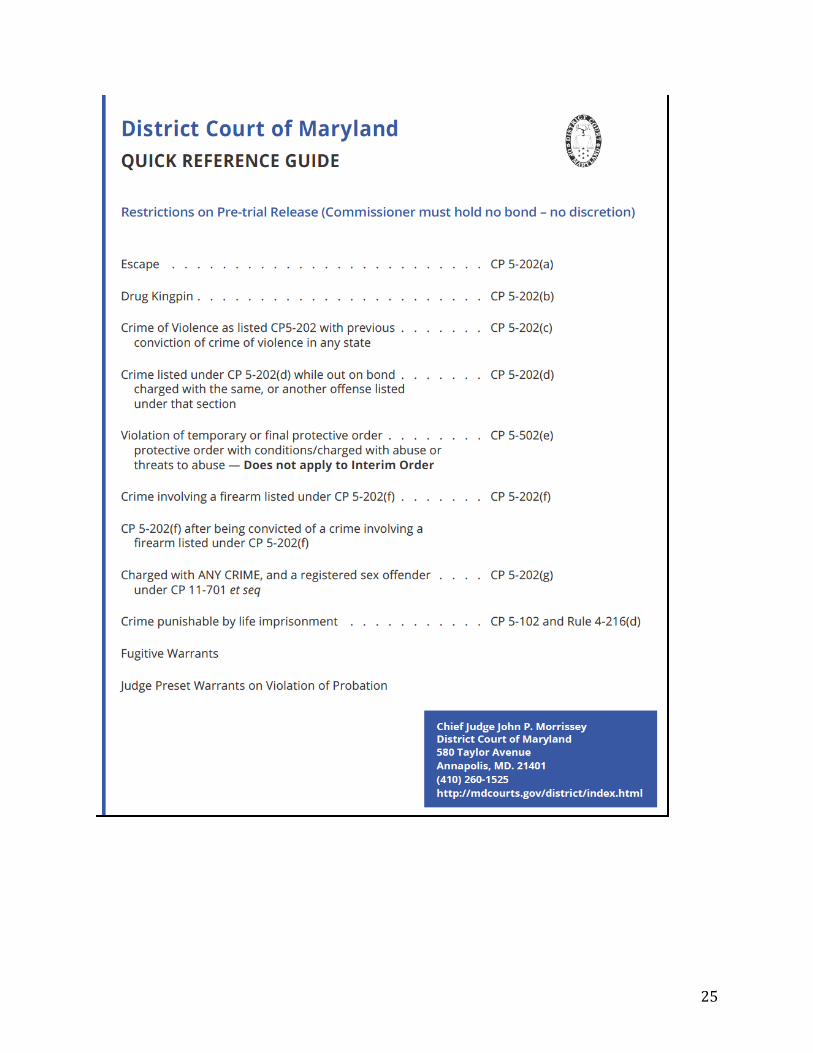
25
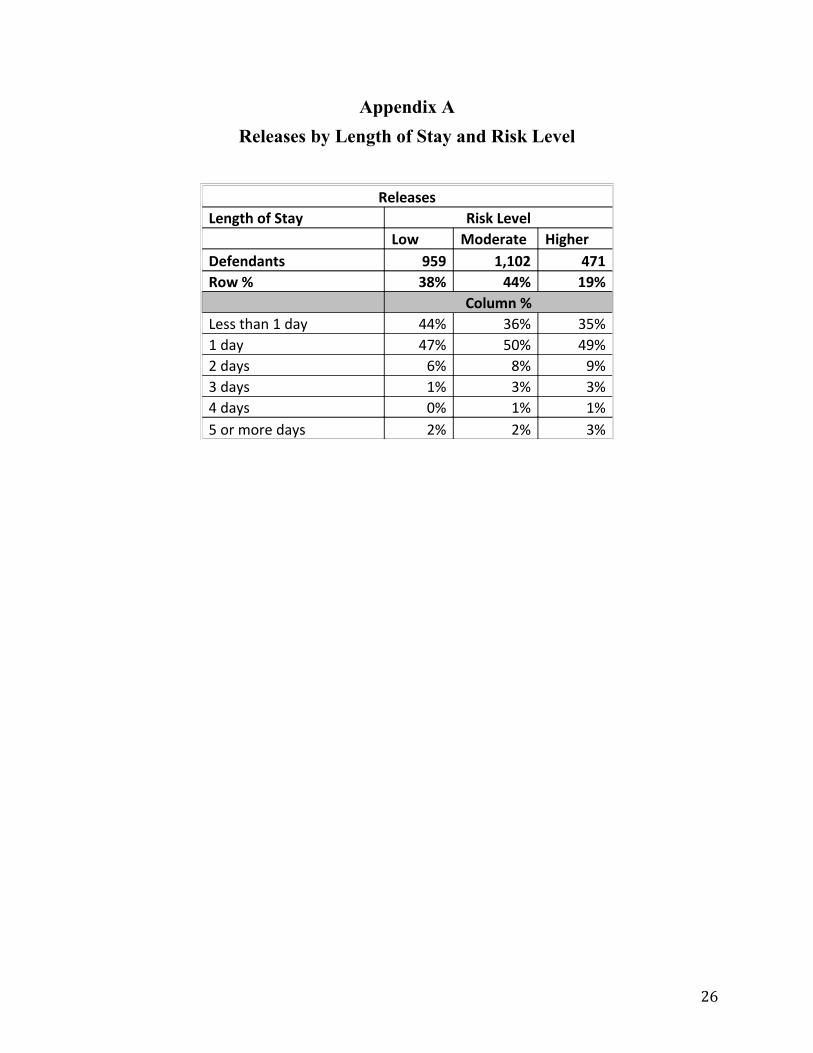
Appendix A
Releases by Length of Stay and Risk Level
ReleasesLength of Stay Risk Level Low Moderate HigherDefendants 959 1,102 471Row % 38% 44% 19% Column %Less than 1 day 44% 36% 35%1 day 47% 50% 49%2 days 6% 8% 9%3 days 1% 3% 3%4 days 0% 1% 1%5 or more days 2% 2% 3%
26
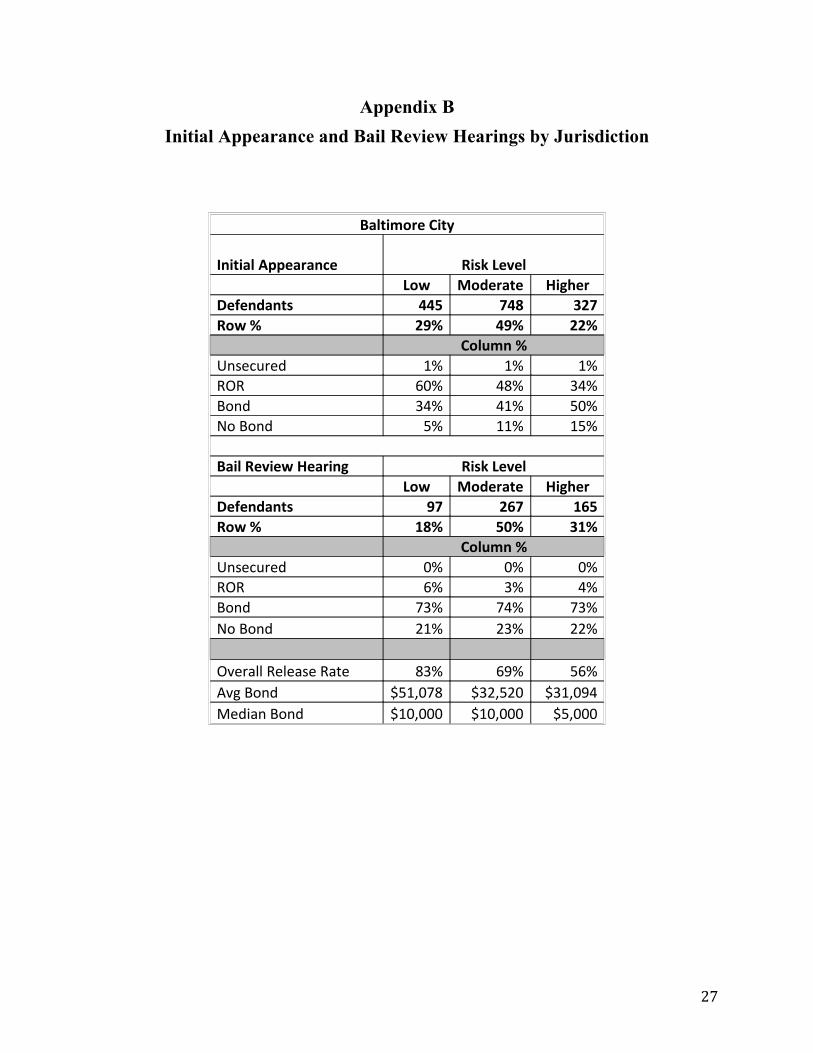
Appendix B
Initial Appearance and Bail Review Hearings by Jurisdiction
Baltimore City
Initial Appearance Risk Level Low Moderate HigherDefendants 445 748 327Row % 29% 49% 22%
Column %Unsecured 1% 1% 1%ROR 60% 48% 34%Bond 34% 41% 50%No Bond 5% 11% 15% Bail Review Hearing Risk Level Low Moderate HigherDefendants 97 267 165Row % 18% 50% 31% Column %Unsecured 0% 0% 0%ROR 6% 3% 4%Bond 73% 74% 73%No Bond 21% 23% 22%
Overall Release Rate 83% 69% 56%Avg Bond $51,078 $32,520 $31,094Median Bond $10,000 $10,000 $5,000
27
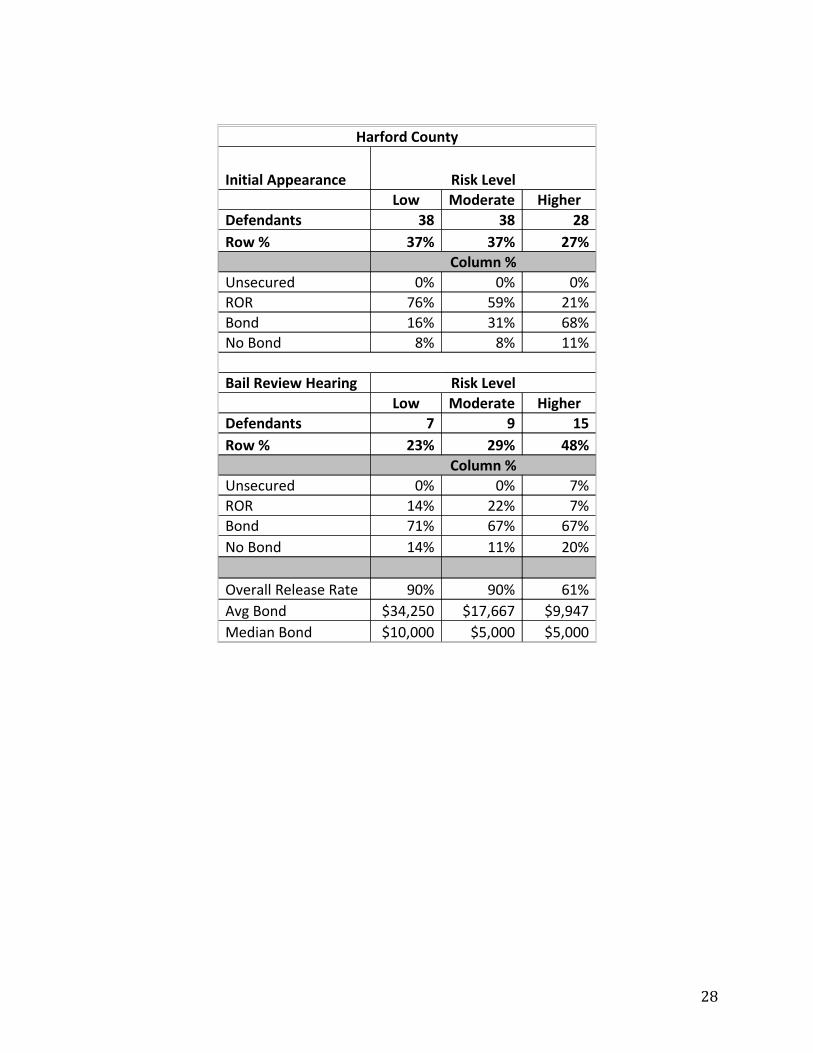
Harford County
Initial Appearance Risk Level Low Moderate HigherDefendants 38 38 28Row % 37% 37% 27% Column %Unsecured 0% 0% 0%ROR 76% 59% 21%Bond 16% 31% 68%No Bond 8% 8% 11% Bail Review Hearing Risk Level Low Moderate HigherDefendants 7 9 15Row % 23% 29% 48% Column %Unsecured 0% 0% 7%ROR 14% 22% 7%Bond 71% 67% 67%No Bond 14% 11% 20%
Overall Release Rate 90% 90% 61%Avg Bond $34,250 $17,667 $9,947Median Bond $10,000 $5,000 $5,000
28
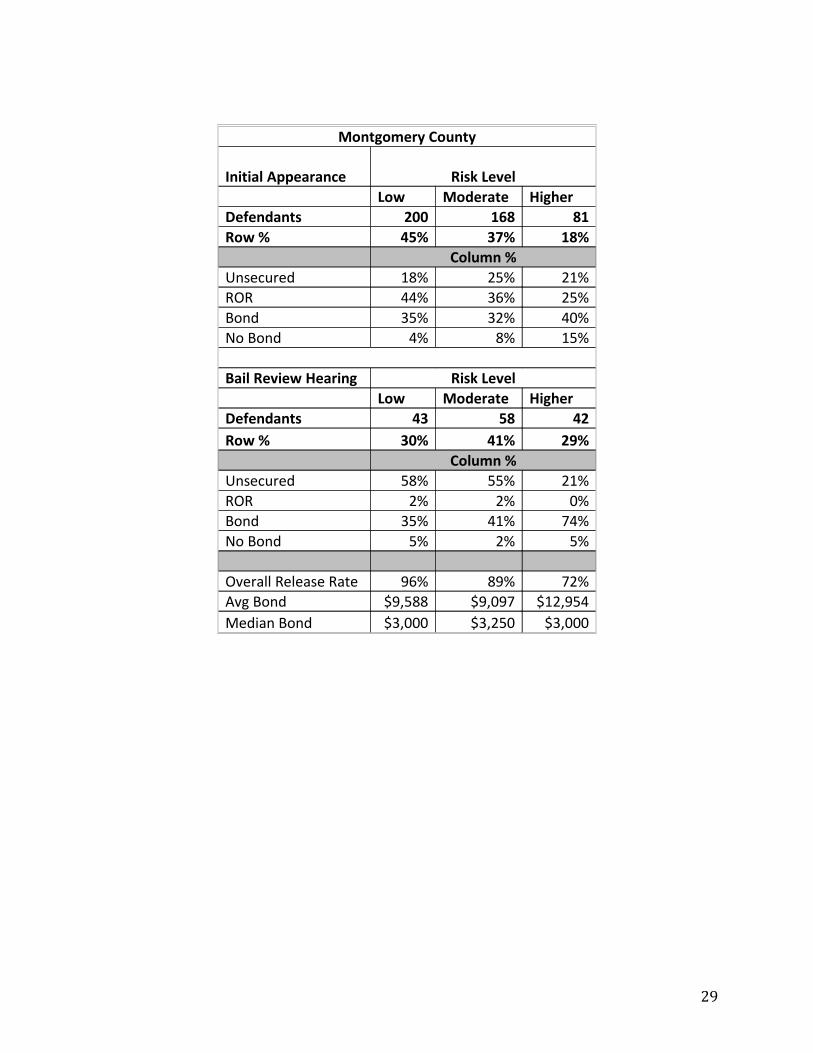
Montgomery County
Initial Appearance Risk Level Low Moderate HigherDefendants 200 168 81Row % 45% 37% 18% Column %Unsecured 18% 25% 21%ROR 44% 36% 25%Bond 35% 32% 40%No Bond 4% 8% 15% Bail Review Hearing Risk Level Low Moderate HigherDefendants 43 58 42Row % 30% 41% 29% Column %Unsecured 58% 55% 21%ROR 2% 2% 0%Bond 35% 41% 74%No Bond 5% 2% 5%
Overall Release Rate 96% 89% 72%Avg Bond $9,588 $9,097 $12,954Median Bond $3,000 $3,250 $3,000
29
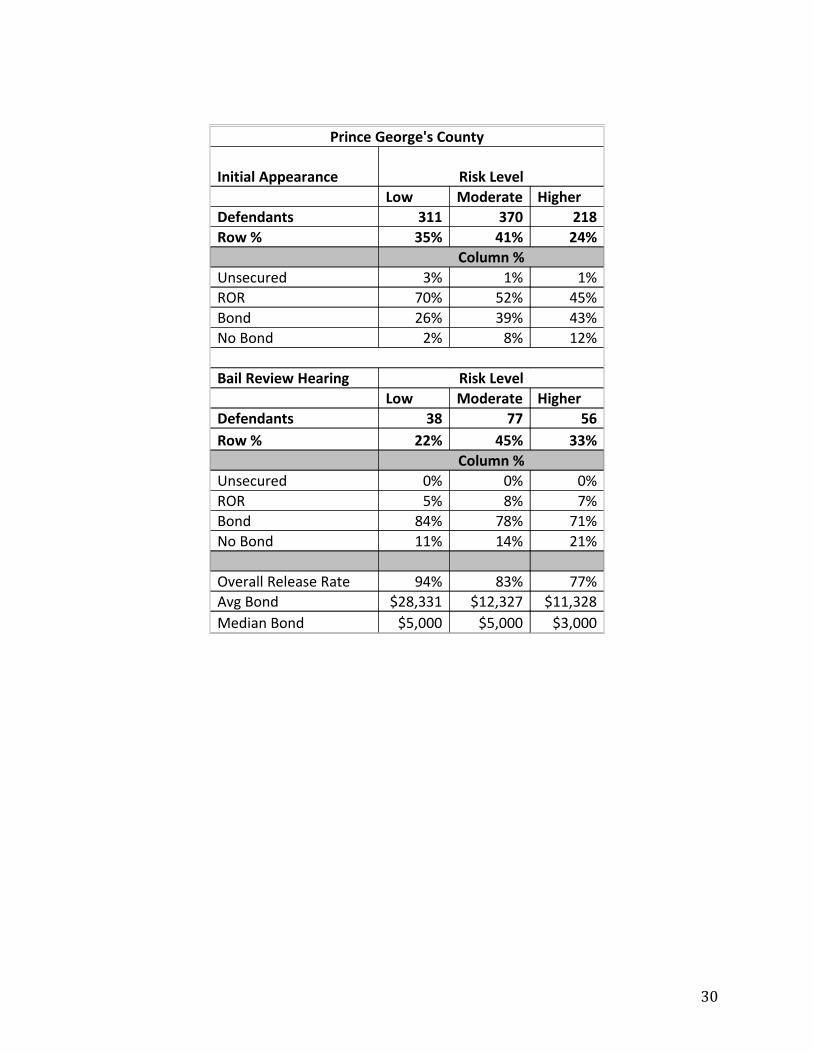
Prince George's County
Initial Appearance Risk Level Low Moderate HigherDefendants 311 370 218Row % 35% 41% 24% Column %Unsecured 3% 1% 1%ROR 70% 52% 45%Bond 26% 39% 43%No Bond 2% 8% 12% Bail Review Hearing Risk Level Low Moderate HigherDefendants 38 77 56Row % 22% 45% 33% Column %Unsecured 0% 0% 0%ROR 5% 8% 7%Bond 84% 78% 71%No Bond 11% 14% 21%
Overall Release Rate 94% 83% 77%Avg Bond $28,331 $12,327 $11,328Median Bond $5,000 $5,000 $3,000
30

St. Mary's County
Initial Appearance Risk Level Low Moderate HigherDefendants 26 39 15% 33% 49% 19% Column %Unsecured 0% 0% 0%ROR 92% 72% 47%Bond 8% 26% 27%No Bond 0% 3% 27% Bail Review Hearing Risk Level Low Moderate HigherDefendants 4 17 13% 12% 50% 38% Column %Unsecured 0% 0% 0%ROR 0% 18% 15%Bond 100% 47% 77%No Bond 0% 35% 8%
Overall Release Rate 93% 83% 60%Avg Bond $126,750 $6,700 $20,000Median Bond $126,750 $5,000 $20,000
31
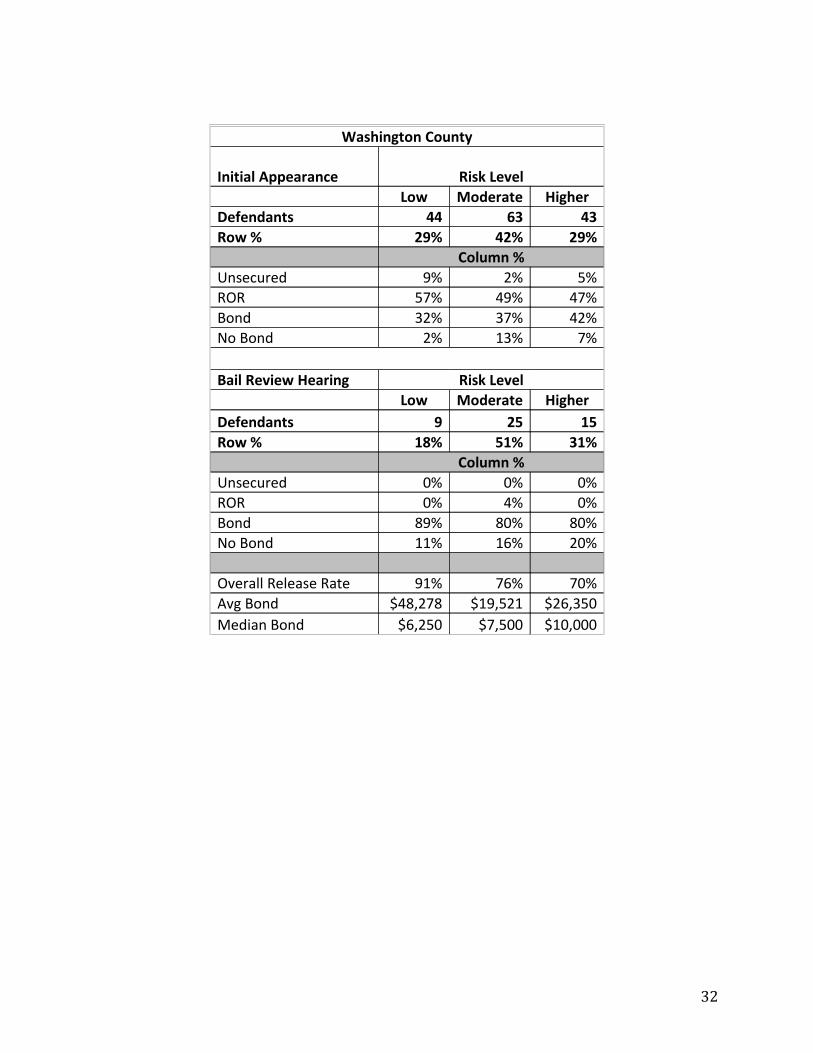
Washington County
Initial Appearance Risk Level Low Moderate HigherDefendants 44 63 43Row % 29% 42% 29% Column %Unsecured 9% 2% 5%ROR 57% 49% 47%Bond 32% 37% 42%No Bond 2% 13% 7% Bail Review Hearing Risk Level Low Moderate HigherDefendants 9 25 15Row % 18% 51% 31% Column %Unsecured 0% 0% 0%ROR 0% 4% 0%Bond 89% 80% 80%No Bond 11% 16% 20%
Overall Release Rate 91% 76% 70%Avg Bond $48,278 $19,521 $26,350Median Bond $6,250 $7,500 $10,000
32
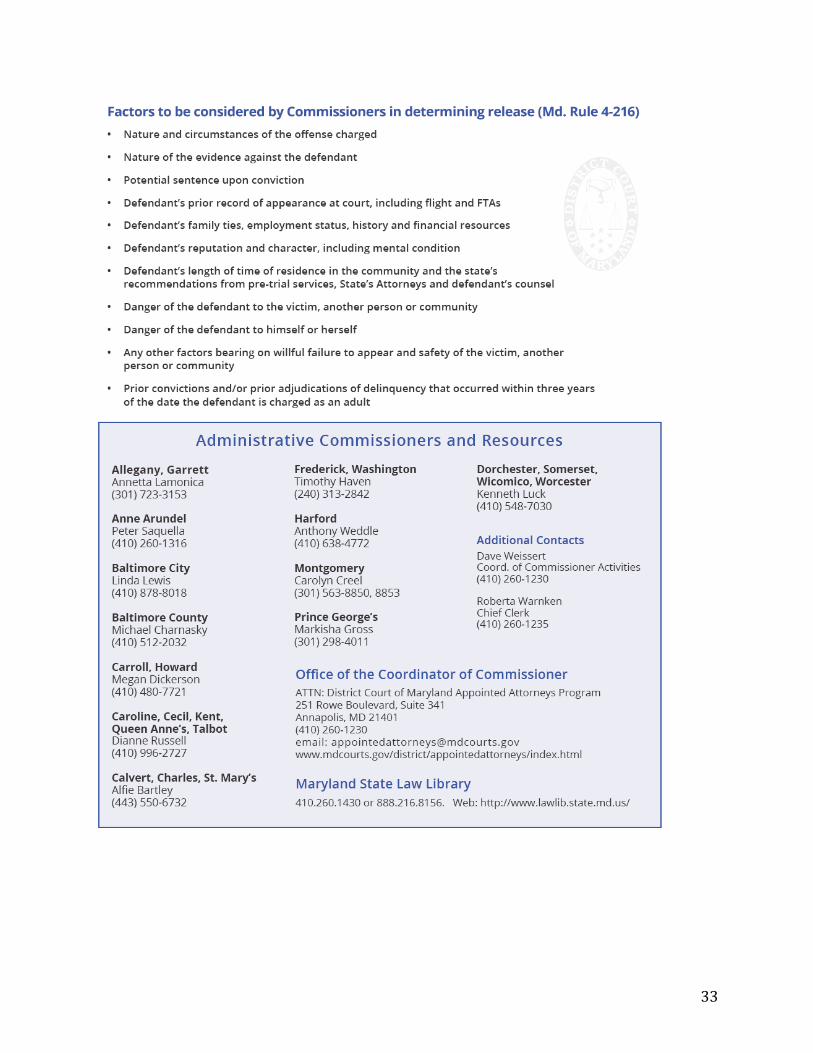
33
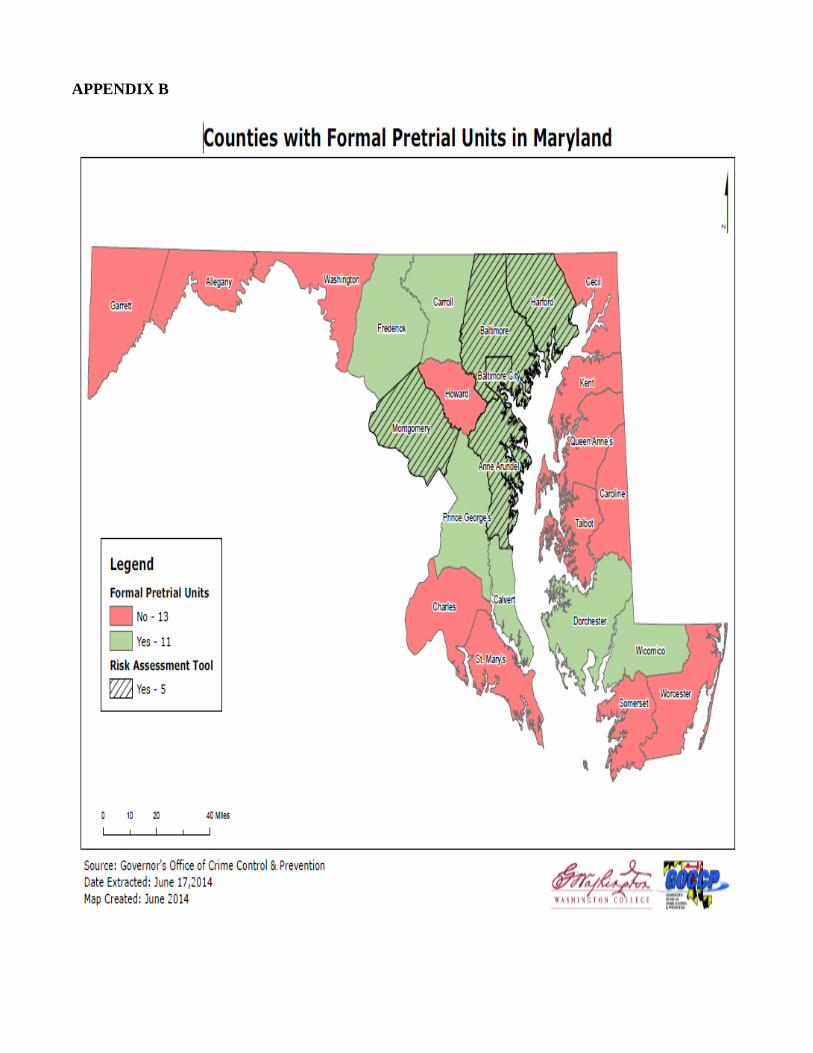
APPENDIX B
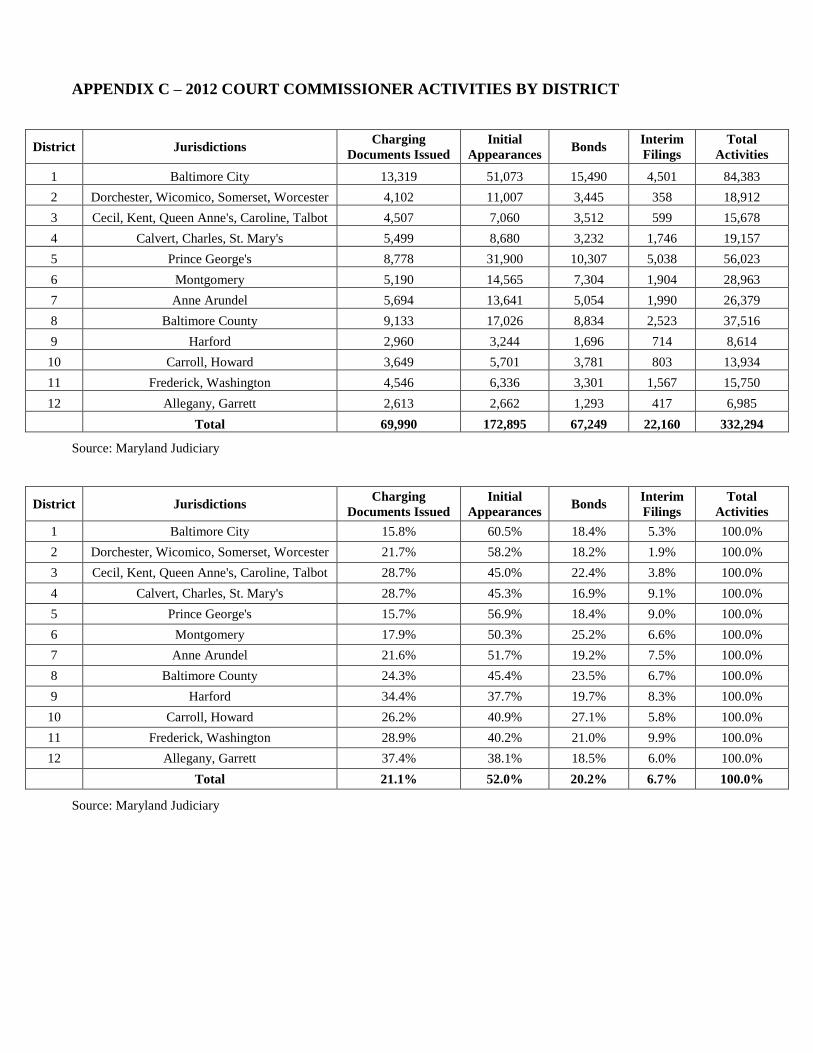
APPENDIX C – 2012 COURT COMMISSIONER ACTIVITIES BY DISTRICT
District Jurisdictions Charging
Documents Issued
Initial
Appearances Bonds
Interim
Filings
Total
Activities
1 Baltimore City 13,319 51,073 15,490 4,501 84,383
2 Dorchester, Wicomico, Somerset, Worcester 4,102 11,007 3,445 358 18,912
3 Cecil, Kent, Queen Anne's, Caroline, Talbot 4,507 7,060 3,512 599 15,678
4 Calvert, Charles, St. Mary's 5,499 8,680 3,232 1,746 19,157
5 Prince George's 8,778 31,900 10,307 5,038 56,023
6 Montgomery 5,190 14,565 7,304 1,904 28,963
7 Anne Arundel 5,694 13,641 5,054 1,990 26,379
8 Baltimore County 9,133 17,026 8,834 2,523 37,516
9 Harford 2,960 3,244 1,696 714 8,614
10 Carroll, Howard 3,649 5,701 3,781 803 13,934
11 Frederick, Washington 4,546 6,336 3,301 1,567 15,750
12 Allegany, Garrett 2,613 2,662 1,293 417 6,985
Total 69,990 172,895 67,249 22,160 332,294
Source: Maryland Judiciary
District Jurisdictions Charging
Documents Issued
Initial
Appearances Bonds
Interim
Filings
Total
Activities
1 Baltimore City 15.8% 60.5% 18.4% 5.3% 100.0%
2 Dorchester, Wicomico, Somerset, Worcester 21.7% 58.2% 18.2% 1.9% 100.0%
3 Cecil, Kent, Queen Anne's, Caroline, Talbot 28.7% 45.0% 22.4% 3.8% 100.0%
4 Calvert, Charles, St. Mary's 28.7% 45.3% 16.9% 9.1% 100.0%
5 Prince George's 15.7% 56.9% 18.4% 9.0% 100.0%
6 Montgomery 17.9% 50.3% 25.2% 6.6% 100.0%
7 Anne Arundel 21.6% 51.7% 19.2% 7.5% 100.0%
8 Baltimore County 24.3% 45.4% 23.5% 6.7% 100.0%
9 Harford 34.4% 37.7% 19.7% 8.3% 100.0%
10 Carroll, Howard 26.2% 40.9% 27.1% 5.8% 100.0%
11 Frederick, Washington 28.9% 40.2% 21.0% 9.9% 100.0%
12 Allegany, Garrett 37.4% 38.1% 18.5% 6.0% 100.0%
Total 21.1% 52.0% 20.2% 6.7% 100.0%
Source: Maryland Judiciary
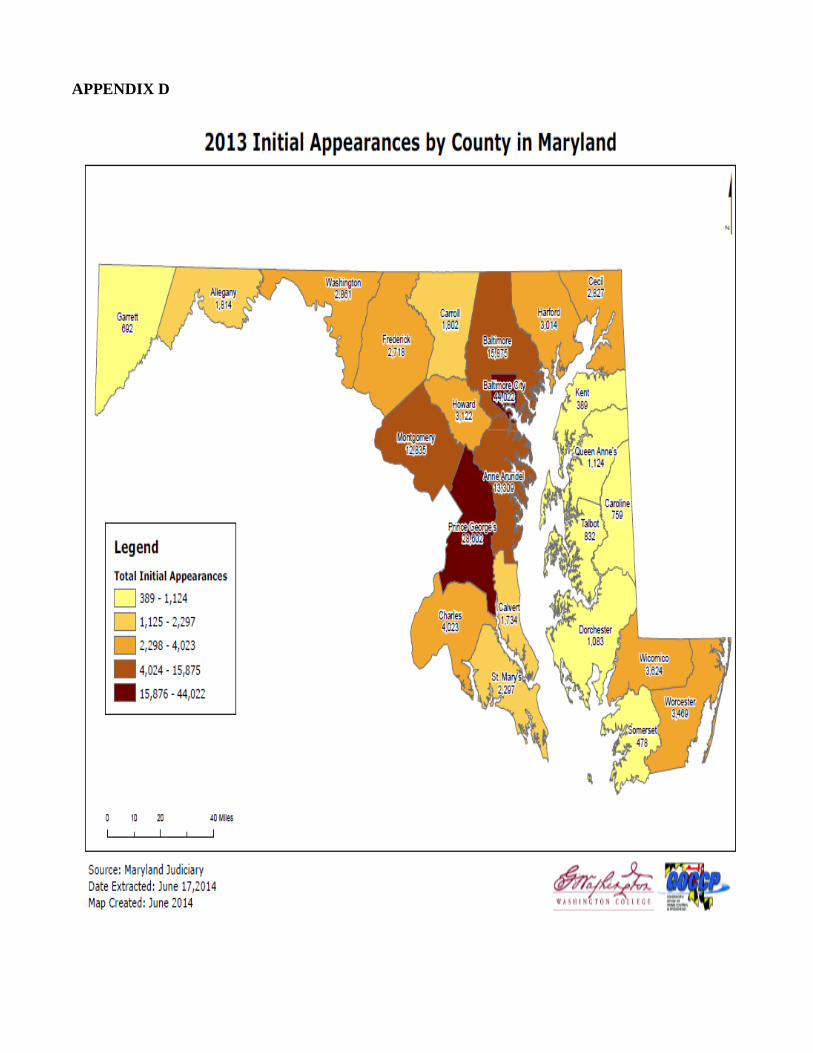
APPENDIX D

APPENDIX E
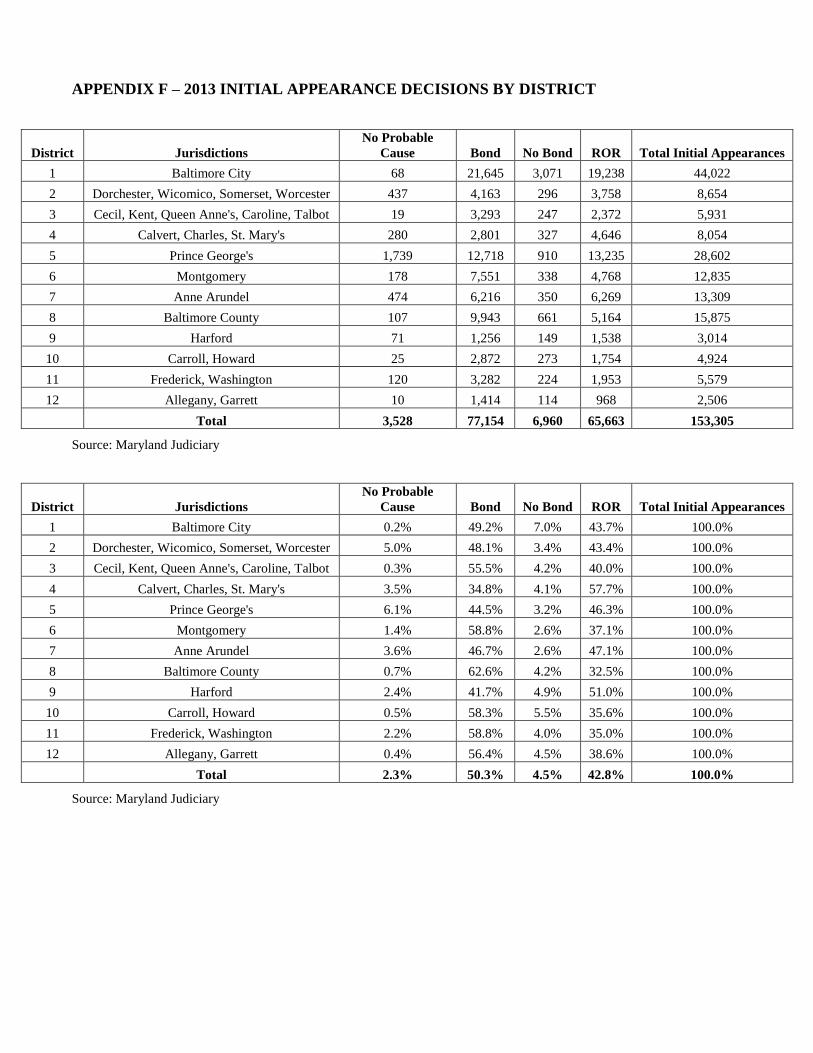
APPENDIX F – 2013 INITIAL APPEARANCE DECISIONS BY DISTRICT
District Jurisdictions
No Probable
Cause Bond No Bond ROR Total Initial Appearances
1 Baltimore City 68 21,645 3,071 19,238 44,022
2 Dorchester, Wicomico, Somerset, Worcester 437 4,163 296 3,758 8,654
3 Cecil, Kent, Queen Anne's, Caroline, Talbot 19 3,293 247 2,372 5,931
4 Calvert, Charles, St. Mary's 280 2,801 327 4,646 8,054
5 Prince George's 1,739 12,718 910 13,235 28,602
6 Montgomery 178 7,551 338 4,768 12,835
7 Anne Arundel 474 6,216 350 6,269 13,309
8 Baltimore County 107 9,943 661 5,164 15,875
9 Harford 71 1,256 149 1,538 3,014
10 Carroll, Howard 25 2,872 273 1,754 4,924
11 Frederick, Washington 120 3,282 224 1,953 5,579
12 Allegany, Garrett 10 1,414 114 968 2,506
Total 3,528 77,154 6,960 65,663 153,305
Source: Maryland Judiciary
District Jurisdictions
No Probable
Cause Bond No Bond ROR Total Initial Appearances
1 Baltimore City 0.2% 49.2% 7.0% 43.7% 100.0%
2 Dorchester, Wicomico, Somerset, Worcester 5.0% 48.1% 3.4% 43.4% 100.0%
3 Cecil, Kent, Queen Anne's, Caroline, Talbot 0.3% 55.5% 4.2% 40.0% 100.0%
4 Calvert, Charles, St. Mary's 3.5% 34.8% 4.1% 57.7% 100.0%
5 Prince George's 6.1% 44.5% 3.2% 46.3% 100.0%
6 Montgomery 1.4% 58.8% 2.6% 37.1% 100.0%
7 Anne Arundel 3.6% 46.7% 2.6% 47.1% 100.0%
8 Baltimore County 0.7% 62.6% 4.2% 32.5% 100.0%
9 Harford 2.4% 41.7% 4.9% 51.0% 100.0%
10 Carroll, Howard 0.5% 58.3% 5.5% 35.6% 100.0%
11 Frederick, Washington 2.2% 58.8% 4.0% 35.0% 100.0%
12 Allegany, Garrett 0.4% 56.4% 4.5% 38.6% 100.0%
Total 2.3% 50.3% 4.5% 42.8% 100.0%
Source: Maryland Judiciary

APPENDIX G – 2013 FAILURE TO APPEAR RATES BY BAILTYPE
County ROR FTA
Rate
Cash FTA
Rate
Percentage
FTA Rate
Corp FTA
Rate
Property
FTA Rate
Unsecured
FTA Rate
Other
FTA Rate
Total FTA
Rate
Allegany 11.1% 2.4% 4.5% 6.2% 0.0% 3.5% 0.0% 8.1%
Anne Arundel 13.3% 10.5% 15.4% 11.6% 4.5% 17.4% 0.0% 12.6%
Baltimore City 13.9% 5.1% 1.8% 5.1% 2.6% 6.4% 0.0% 10.7%
Baltimore County 11.0% 4.7% 15.5% 6.9% 1.5% 10.5% 50.0% 8.7%
Calvert 7.1% 0.0% 2.7% 7.5% 8.6% 6.6% 0.0% 6.7%
Caroline 12.7% 0.0% 2.8% 4.0% 6.6% 5.3% 0.0% 9.3%
Carroll 8.9% 14.2% 0.0% 4.1% 0.0% 7.8% 0.0% 7.2%
Cecil 11.5% 0.0% 11.6% 11.0% 2.6% 16.0% 0.0% 11.4%
Charles 21.2% 10.5% 13.3% 14.9% 7.8% 16.2% 0.0% 18.9%
Dorchester 8.5% 2.5% 2.6% 3.8% 0.0% 4.0% 0.0% 5.9%
Frederick 9.5% 0.0% 9.7% 11.1% 7.1% 13.7% 0.0% 10.1%
Garrett 7.0% 0.0% 6.7% 12.1% 0.0% 15.1% 0.0% 8.1%
Harford 10.4% 0.0% 2.3% 8.8% 0.0% 2.2% 0.0% 9.3%
Howard 8.7% 0.0% 5.4% 5.0% 2.9% 10.7% 0.0% 8.0%
Kent 4.5% 0.0% 0.0% 10.0% 0.0% 5.0% 0.0% 6.1%
Montgomery 19.5% 5.3% 8.5% 12.3% 10.4% 13.1% 0.0% 14.8%
Prince George's 18.2% 8.0% 10.1% 10.8% 8.7% 19.4% 0.0% 15.3%
Queen Anne's 11.0% 0.0% 3.7% 7.1% 14.2% 9.5% 0.0% 9.5%
Somerset 6.1% 14.2% 0.0% 2.3% 9.0% 5.6% 0.0% 5.1%
St. Mary's 16.6% 11.1% 8.5% 9.6% 13.5% 16.6% 0.0% 15.1%
Talbot 7.3% 9.5% 8.5% 5.4% 5.2% 14.4% 0.0% 7.7%
Washington 12.1% 0.0% 10.8% 6.4% 2.3% 12.1% 0.0% 9.4%
Wicomico 11.2% 4.0% 3.0% 7.2% 0.0% 11.0% 0.0% 9.3%
Worcester 14.8% 0.0% 12.2% 13.9% 18.1% 10.5% 0.0% 14.4%
Total 14.3% 6.0% 7.7% 7.8% 7.7% 11.6% 2.9% 11.7%
Source: Maryland Judiciary
Cash - cash, certified or cashier’s check or approved credit card (Vital Check).
Percentage - A percentage of the bail is accepted as collateral for release from detention; default is for entire bond amount.
Corp - Licensed Insurance Insurer using Power of Attorney that reflects the amounts.
Property - Real estate located in Maryland owned by defendant or surety.
Unsecured - Signature is collateral for release; default is for entire amount of bond.
Note: The Commission did not have time discuss these figures in depth. To date there has been no independent examination
of this data.
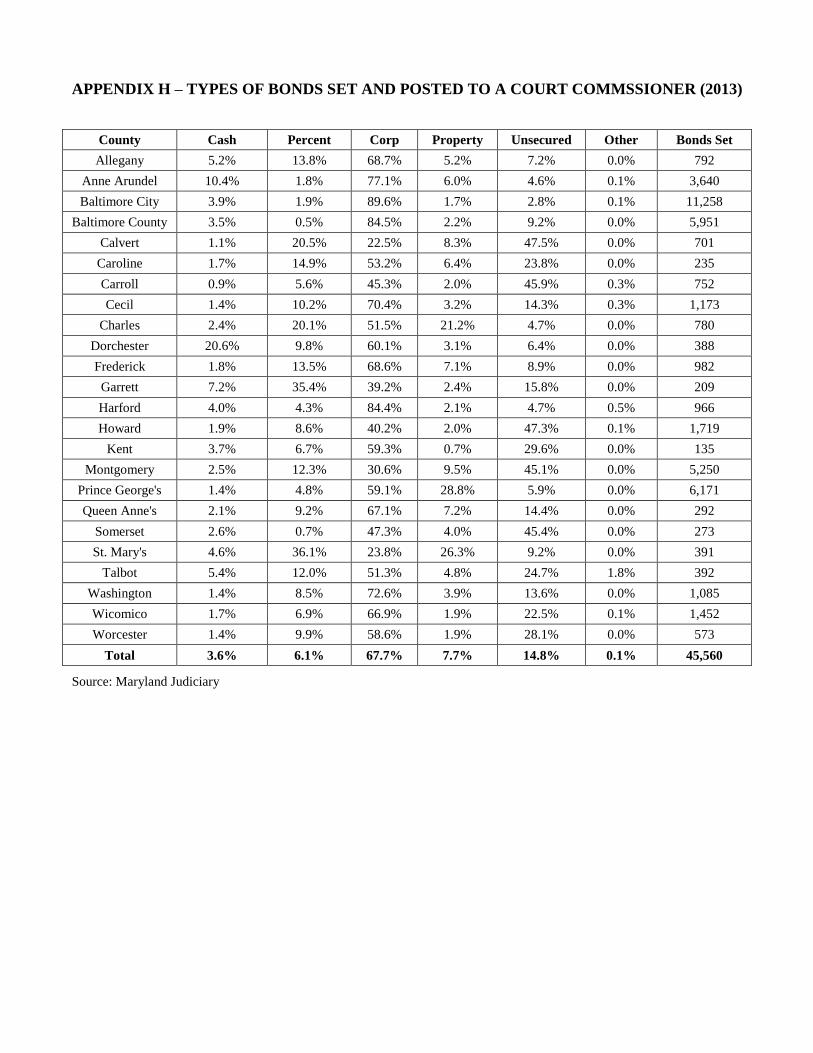
APPENDIX H – TYPES OF BONDS SET AND POSTED TO A COURT COMMSSIONER (2013)
County Cash Percent Corp Property Unsecured Other Bonds Set
Allegany 5.2% 13.8% 68.7% 5.2% 7.2% 0.0% 792
Anne Arundel 10.4% 1.8% 77.1% 6.0% 4.6% 0.1% 3,640
Baltimore City 3.9% 1.9% 89.6% 1.7% 2.8% 0.1% 11,258
Baltimore County 3.5% 0.5% 84.5% 2.2% 9.2% 0.0% 5,951
Calvert 1.1% 20.5% 22.5% 8.3% 47.5% 0.0% 701
Caroline 1.7% 14.9% 53.2% 6.4% 23.8% 0.0% 235
Carroll 0.9% 5.6% 45.3% 2.0% 45.9% 0.3% 752
Cecil 1.4% 10.2% 70.4% 3.2% 14.3% 0.3% 1,173
Charles 2.4% 20.1% 51.5% 21.2% 4.7% 0.0% 780
Dorchester 20.6% 9.8% 60.1% 3.1% 6.4% 0.0% 388
Frederick 1.8% 13.5% 68.6% 7.1% 8.9% 0.0% 982
Garrett 7.2% 35.4% 39.2% 2.4% 15.8% 0.0% 209
Harford 4.0% 4.3% 84.4% 2.1% 4.7% 0.5% 966
Howard 1.9% 8.6% 40.2% 2.0% 47.3% 0.1% 1,719
Kent 3.7% 6.7% 59.3% 0.7% 29.6% 0.0% 135
Montgomery 2.5% 12.3% 30.6% 9.5% 45.1% 0.0% 5,250
Prince George's 1.4% 4.8% 59.1% 28.8% 5.9% 0.0% 6,171
Queen Anne's 2.1% 9.2% 67.1% 7.2% 14.4% 0.0% 292
Somerset 2.6% 0.7% 47.3% 4.0% 45.4% 0.0% 273
St. Mary's 4.6% 36.1% 23.8% 26.3% 9.2% 0.0% 391
Talbot 5.4% 12.0% 51.3% 4.8% 24.7% 1.8% 392
Washington 1.4% 8.5% 72.6% 3.9% 13.6% 0.0% 1,085
Wicomico 1.7% 6.9% 66.9% 1.9% 22.5% 0.1% 1,452
Worcester 1.4% 9.9% 58.6% 1.9% 28.1% 0.0% 573
Total 3.6% 6.1% 67.7% 7.7% 14.8% 0.1% 45,560
Source: Maryland Judiciary
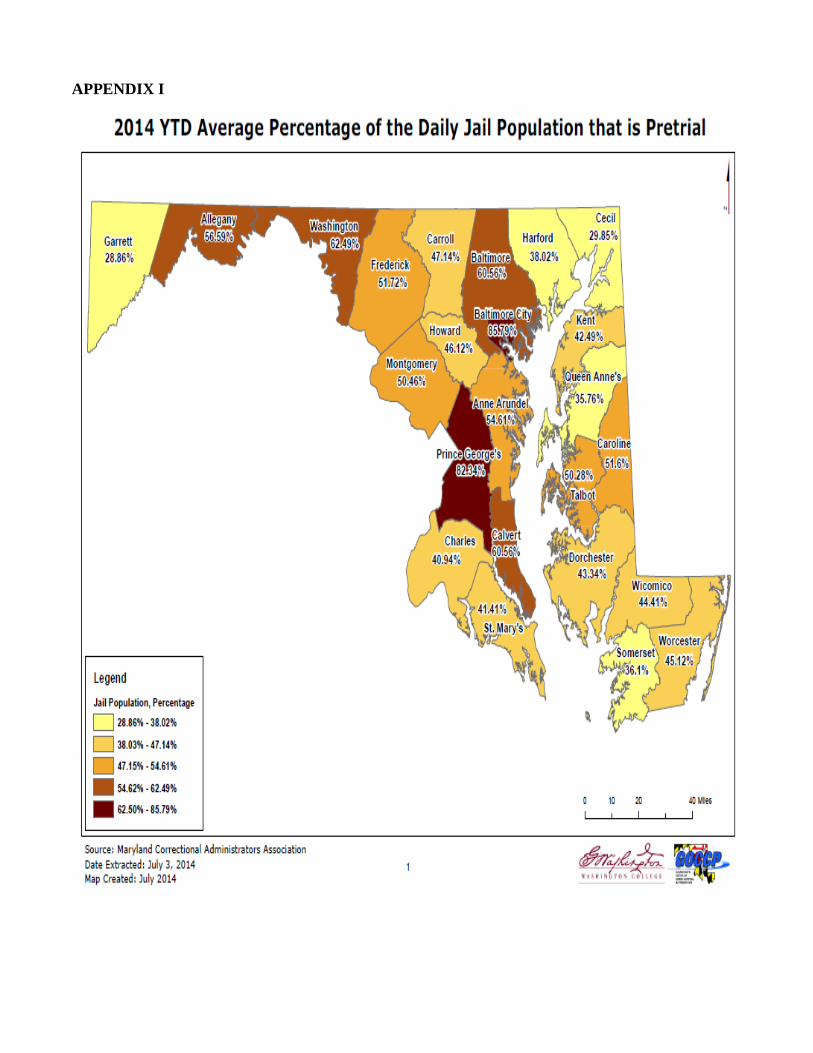
APPENDIX I
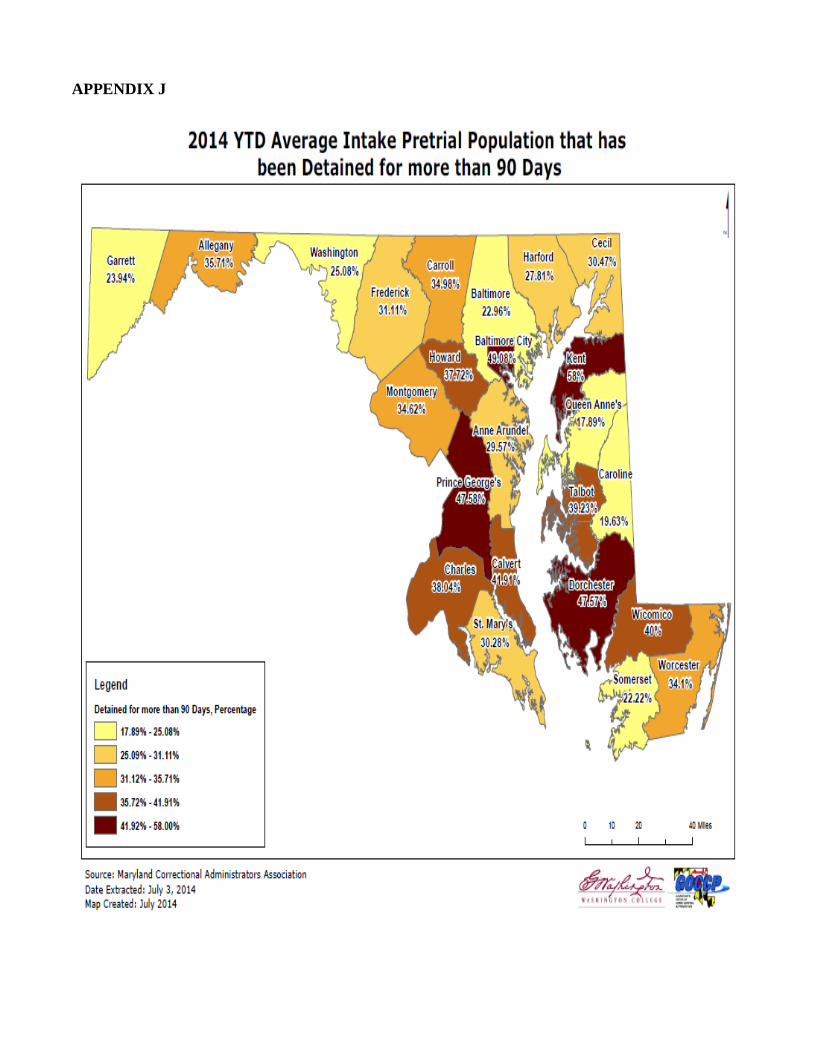
APPENDIX J