commissioning of gpu accelerated monte carlo code fred
TRANSCRIPT
Commissioning of GPU–AcceleratedMonte Carlo Code FRED for ClinicalApplications in Proton TherapyJan Gajewski1, Magdalena Garbacz1, Chih-Wei Chang2, Katarzyna Czerska1,Marco Durante3,4, Nils Krah5, Katarzyna Krzempek1, Renata Kopec1, Liyong Lin2,Natalia Mojzeszek1, Vincenzo Patera6,7, Monika Pawlik-Niedzwiecka1,8, Ilaria Rinaldi 9,Marzena Rydygier1, Elzbieta Pluta10, Emanuele Scifoni11, Agata Skrzypek1,Francesco Tommasino11,12, Angelo Schiavi 6,7 and Antoni Rucinski 1*
1Institute of Nuclear Physics Polish Academy of Sciences, Krakow, Poland, 2Department of Radiation Oncology and WinshipCancer Institute, Emory University, Atlanta, GA, United States, 3Biophysics Department, GSI Helmholtzzentrum furSchwerionenforschung, Darmstadt, Germany, 4Technische Universitat Darmstadt, Institut fur Festkorperphysik, Darmstadt,Germany, 5CNRS/CREATIS, UMR 5220, Lyon, France, 6INFN - Sezione di Roma, Roma, Italy, 7Dipartimento di Scienze di Base eApplicate per l’Ingegneria, Sapienza Università di Roma, Roma, Italy, 8Institute of Physics, Jagiellonian University, Krakow, Poland,9ZonPTC/Maastro Clinic, Maastricht, Netherlands, 10Maria Sklodowska-Curie Institute – Oncology Center, Krakow, Poland,11Trento Institute for Fundamental Physics and Applications, Trento, Italy, 12Maria Sklodowska-Curie Institute –Oncology Center,Krakow, Poland, 13Department of Physics, University of Trento, Trento, Italy
We present commissioning and validation of FRED, a graphical processing unit(GPU)–accelerated Monte Carlo code, for two proton beam therapy facilities ofdifferent beam line design: CCB (Krakow, IBA) and EMORY (Atlanta, Varian). Wefollowed clinical acceptance tests required to approve the certified treatmentplanning system for clinical use. We implemented an automated and efficientprocedure to build a parameter library characterizing the clinical proton pencil beam.Beam energy, energy spread, lateral propagation model, and a dosimetric calibrationfactor were parametrized based on measurements performed during the facility start-up.The FRED beam model was validated against commissioning and supplementarymeasurements performed with and without range shifter. We obtained 1)submillimeter agreement of Bragg peak shapes in water and lateral beam profiles inair and slab phantoms, 2) < 2% dose agreement for spread out Bragg peaks of differentranges, 3) average gamma index (2%/2 mm) passing rate of > 95% for > 1000 patientverification measurements using a two-dimensional array of ionization chambers, and 4)gamma index passing rate of > 99% for three-dimensional dose distributions computedwith FRED and measured with an array of ionization chambers behind ananthropomorphic phantom. The results of example treatment planning study on> 100 patients demonstrated that FRED simulations in computed tomography enablean accurate prediction of dose distribution in patient and application of FRED as secondpatient quality assurance tool. Computation of a patient treatment in a CT using 104
protons per pencil beam took on average 2′30 min with a tracking rate of 2.9×10⁵ p+/s.FRED was successfully commissioned and validated against the clinical beam model,showing that it could potentially be used in clinical routine. Thanks to high computationalperformance due to GPU acceleration and an automated beam model implementation
Edited by:Kris Thielemans,
University College London,United Kingdom
Reviewed by:Julien Bert,
INSERM U1101 Laboratoire deTraitement de l’information Médicale
(LaTIM), FranceXiaoying Liang,
University of Florida, United States
*Correspondence:Antoni Rucinski
[email protected];[email protected]
Specialty section:This article was submitted to Medical
Physics and Imaging,a section of the journal
Frontiers in Physics
Received: 29 May 2020Accepted: 19 August 2020
Published: 21 January 2021
Citation:Gajewski J, Garbacz M, Chang C-W,
Czerska K, Durante M, Krah N,Krzempek K, Kopec R, Lin L,
Mojzeszek N, Patera V, Pawlik-Niedzwiecka M, Rinaldi I, Rydygier M,
Pluta E, Scifoni E, Skrzypek A,Tommasino F, Schiavi A and Rucinski
A (2021) Commissioning ofGPU–Accelerated Monte Carlo
Code FRED for Clinical Applicationsin Proton Therapy.
Front. Phys. 8:567300.doi: 10.3389/fphy.2020.567300
Frontiers in Physics | www.frontiersin.org January 2021 | Volume 8 | Article 5673001
ORIGINAL RESEARCHpublished: 21 January 2021
doi: 10.3389/fphy.2020.567300

method, the application of FRED is now possible for research or quality assurancepurposes in most of the proton facilities.
Keywords: Monte Carlo, treatment planning, GPU, radiation therapy, proton theraphy, dosimetry, commissioning,beam modelling
1 INTRODUCTION
In proton radiation therapy, Monte Carlo (MC) methods offermore accurate modeling of proton interactions withheterogeneous media and improve dose calculation accuracyin complex geometries with respect to analytical pencil beamalgorithms [1–4]. The application of MC algorithms intreatment planning can eventually lead to a reduction in thetarget volume safety margins by about 2% and more accurateprediction of the treatment outcomes [5]. The state-of-the-artcommercial proton beam therapy (PBT) treatment planningsystems (TPS) employ MC methods for treatment planoptimization and dose calculation [6, 7], but they are still notthe standard treatment planning tools in all clinically operatingPBT facilities. Many proton facilities still use analytical pencilbeam algorithms of limited accuracy in heterogeneous media.Also, the time performance of the MC-based TPS remains to bean issue, especially when applying robust optimizationalgorithms that require computing several dose distributionsfor one computed tomography (CT) image or in treatments ofmoving targets where 4D-CT consisting of a series of CT imagesof several motion phases of one patient are employed intreatment plan optimization [8]. In addition, protonradiation therapy quality assurance (QA) procedures are timeconsuming and require manpower for experimentalmeasurements of dose distributions in phantoms, typicallyperformed at a few depths in water for each treatment field.In fact, time needed for patient QA could be dedicated for theactual patient treatment. Therefore, reduction in the number ofmeasurements is widely discussed among medical physicists[9–14]. Supplementing or replacing patient QA measurementswith dose distribution recalculation using a second,independent, dose-calculation engines can be beneficial forPBT facilities.
In several PBT facilities, general purpose MC simulationtoolkits, such as: FLUKA [15], Geant4 [16, 17], or Shield-HIT[18] as well as more user-friendly environments built onGeant4 like GATE/GATE-RTion [19–21] and TOPAS [22,23], are used to support research activities and/orsimulations for patient QA. The clinical application ofgeneral purpose MC tools is limited, mainly due to the timerequired to recalculate a complete plan ranging from tens ofminutes to even a few hours. For this reason, the parallelizationof the particle tracking on several central processing units(CPU) or general purpose graphical processing units (GPU) isof interest for radiotherapy. The PBT-dedicated GPU-basedMC code gPMC implemented by Jia et al. [24] was furtherdeveloped [25] and validated using clinical patient data [26].Following the gPMC development, Wan Chen Tseung andcolleagues presented a high-performance GPU-accelerated
MC code, which is used for routine clinical QA and as thedose calculation engine in a clinical MC-based IntensityModulated Proton Therapy (IMPT) treatment planningsystem [27]. Recently, an analytical pencil beam algorithm,the FRoG platform, was implemented on GPU for clinicalinvestigations with different ion types [28, 29].
The commissioning and validation of the independent, MC-based dose calculation engine for research or patient QApurposes is a time-consuming process that requiresknowledgeable and experienced manpower. Only recently,standards for beam modeling and beam modelcommissioning for MC dose calculation–based radiationtherapy treatment planning were proposed [30]. Theexperimental characterization of the proton beam properties(longitudinal and lateral profiles as well as dosimetriccalibration) as a function of primary beam energy is facilitydependent because different PBT centers use differentaccelerators, measurement methods, and TPS. The completeimplementation of passive and active beam delivery nozzlegeometry was described by Paganetti et al. [1] for cyclotron-based facilities and by Parodi et al. [31] for synchrotron-basedfacilities. However, it was suggested later that for MC dosecalculation purposes, defining the beam model following theclinical commissioning procedure and avoiding detailedsimulations of the beam nozzle geometry is possible with aprecision that is sufficient for clinical application [10, 32, 33].
This article reports on commissioning of the GPU-accelerated MC code FRED [34] and its validation at twocyclotron-based proton beam therapy facilities of differentbeam line design: Varian ProBeam in Atlanta, GA (UnitedStates), and IBA Protheus C-235 in Krakow (Poland). Thesoftware toolkit FRED (Fast paRticle thErapy Dose evaluator)[34] was developed at the University of Rome for parallelizedproton beam transport simulations in heterogeneous geometrydefined by the patient CT. We describe in detail FREDcommissioning steps, that is, automated characterization ofthe beam model that describes the proton beam used forpatient treatment and follows the clinical QA procedures.Finally, we validated our commissioning procedure using theoptimized beam models. We simulated dose distributions inFRED and compared the results with verification measurementsperformed in homogeneous and heterogeneous phantoms withand without range shifters as suggested by Winterhalter et al.[35]. Such extensive experimental validation of FRED accuracyand time performance has been never reported before. Toincrease the confidence of the reader about the accuracy ofFRED simulations, selected results were also compared withclinical TPS simulations. Eventually, we evaluated clinicalcases of patient treatment plans to demonstrate the clinicalapplicability of FRED.
Frontiers in Physics | www.frontiersin.org January 2021 | Volume 8 | Article 5673002
Gajewski et al. FRED MC for Proton Therapy
2 MATERIALS AND METHODS
2.1 GPU–Accelerated Monte Carlo CodeFREDThe great benefit of FRED with respect to general purpose MCcodes is its computation performance achievable on a varietyof different hardware without compromising the dosecomputation accuracy. The typical tracking rates rangefrom 10–100 thousand protons per second using a singleCPU to about million particles per second using GPUcards. FRED is equipped with an interface to convertphantom/patient geometries stored in DICOM CT imagesto a voxelized geometry of the patient containing the atomictissue composition using a conversion table based onstoichiometric calibration [36]. In addition to patientgeometry, user-defined geometries of specific materialcomposition can be included enabling simulations ofproton transport in passive elements like range shifter.
The physical interaction models implemented in FRED aretrimmed down with respect to general purpose MC codes, such asGeant4/FLUKA within the regime that is relevant for particletherapy, in order to speed up the execution time withoutcompromising the accuracy of dose-deposition calculations. Inparticular, the physics processes contributing to the dosedeposited by protons in patient tissue, that is, mean energyloss, energy fluctuations, nuclear elastic and inelasticinteractions with target nuclei as well as the trajectorydeflection via a multiple Coulomb scattering, are implementedin FRED [34]. Moreover, FRED offers linear energy transfer (LET)and relative biological effectiveness (RBE)–weighted dosecalculations by means of different RBE models, providingfurther information, which is not available in the state-of-the-art commercial TPS. The LET and RBE computations in FRED areout of the scope of this study.
2.2 CommissioningMeasurements and FRED
SimulationsFRED commissioning was performed for one gantry room of twoPBT facilities of different beam line design equipped with scannedproton beams that are in clinical operation since 2016 and 2018,respectively. Krakow facility is an IBA design based on Proteus C-235 cyclotron equipped with two rotational gantries, an eyetreatment room and an experimental hall. The TPS Eclipsefrom Varian, version 13.6, is used for treatment planning inCCB. It uses analytical proton convolution superposition (PCS)algorithm for the dose calculation and optimization [37].EMORY PBT center in Atlanta is a ProBeam system designedby Varian and equipped with three rotational gantries and twohorizontal beam lines. The TPS RayStation from RaySearchlaboratories, version 8A, equipped with MC dose algorithm isused for treatment planning in EMORY [7]. The properties ofproton beams and the measurement methods used for theacquisition of clinical beam model commissioning data at bothfacilities are listed in Table 1.
The commissioning measurements that include depth dosedistribution measurements in water phantom, measurements
of the lateral profiles (without range shifter) in air, andabsolute dose measurements in a water phantom were usedto build parameter libraries characterizing the FRED beammodel for Krakow and Atlanta facilities. The waterphantom and in-air setup used for commissioningmeasurements are schematically illustrated in Figures 1 Aand B respectively. The figure indicates how the proton beamis transported from the nozzle toward the detector/phantom.During irradiation, the beam is deflected vertically andhorizontally by scanning magnets and crosses a positionsensitive ionization chamber (IC23), which is used forbeam lateral position and size measurement. The procedureof the commissioning data acquisition is not described here indetail as it is out of the scope of this article.
The FRED simulation setup mimics the commissioningmeasurements setup shown in Figures 1 A and B. The virtualbeam source is located at the position of the scanning magnetlocated closer to the isocenter because at this position, thedeflection of the beam in both X and Y directions is defined.The different position of the X and Y scanning magnets is takeninto account, while calculating the direction of a single pencilbeam. The beam propagation in the IC23 is omitted in thesimulations and is taken into account by adjusting beamsource parameters, in such a way that the beam size fits theresults of beam size measurements in air performed withscintillating screen (Lynx). The proton beam was propagatedwithout and with range shifter. FRED simulations in water wereperformed in 40 × 40 × 40 cm3 virtual phantoms of 1 × 1 × 1 mm3
voxel size (Figure 1A). The ionization potential of water was setto 80 eV [38]. FRED simulations of the in-air setup used for beammodel validation were performed in a virtual air phantom. Thetotal time of FRED MC simulations includes tracking time, timeneeded for memory allocation, and the file writing. The trackingrate of simulation is given as the number of protons tracked persecond (p+/s).
2.3 Beam Model ParametersThe beam model parameters characterize longitudinal and lateralpencil beam profiles as well as dosimetric calibration. Twoparameters, energy (E) and energy spread (Eσ), characterizeproton pencil beam depth dose distribution (longitudinal)profile. One further parameter, monitor units (MU) to thenumber of particles conversion factor (SFMU), characterizesintegral dose distribution (IDD) dosimetrically, by means ofdose measurement at 2 cm depth, following TPScommissioning protocol and other references [37, 39, 40]. Thelateral propagation of the proton pencil beam can becharacterized by a quadratic model by means of modelingbeam emittance or bilinear model by defining virtual pointsource. In fact, the bilinear model is an approximation of aquadratic model in a limited range. The virtual point sourceapproach can be applied when the waist of the quadratic functionof emittance model is far enough from the isocenter toapproximate lateral beam propagation behind the nozzle exitby a bilinear function. FRED is capable of handling lateral beampropagation using both virtual point source or emittanceapproaches.
Frontiers in Physics | www.frontiersin.org January 2021 | Volume 8 | Article 5673003
Gajewski et al. FRED MC for Proton Therapy

FIGURE 1 | Experimental and simulation setups for water phantom (A), in-air scintillating screen measurements (B), and measurements in a solid water slabphantom (C). On the left, beam nozzle elements (scanning magnets and position sensitive beam monitor (BM) chambers), not taken into account in MC simulations, areshown (gray scale). In MC simulations, the primaries are generated inMonte Carlo virtual source and transported through range shifter (RS) to phantoms/detectors (blue).The figure is not to scale.
TABLE 1 | Selected properties of CCB and EMORY PBT centers and measurement methods used for the proton beam model commissioning.
Parameter CCB EMORY
Energy range [MeV] 70-226.1 70-242Measurement step [MeV] 10 10RS thicknesses [mm] (density [g/cm3]) 36.7 (1.168) 20, 30, 50 (1.202, 1.191, 1.191)RS material PMMA LexanSnout position [cm] Fixed: 36.9 Variable: 5.5-42SM distance (X/Y ) [cm] 221.5/184.6 200/256Lateral profile meas. Method (air) Lynx (IBA) Lynx (IBA)Detector position relative to isocenter [cm] −20, −10, 0, +10, +20 −30, −20, −10, 0, +5Water phantom Blue phantom2 (IBA) Blue phantom2 (IBA)IDD meas. method (water) Bragg peak chamber (PTW) StingRay (IBA dosimetry)— ϕ � 81.6mm ϕ � 120mmIDD meas. acceptance correction Yes (FLUKA) NoAbs. dosimetry meas. method (water) Markus (PTW) at 2 cm PPC-40 (IBA) at 2 cmMonoenergetic field size 10 × 10 cm2 10 × 10 cm2
RS : range shifter; SM : scanning magnet; meas.: measurement; IDD : integrated depth dose; Abs.: absolute.
Frontiers in Physics | www.frontiersin.org January 2021 | Volume 8 | Article 5673004
Gajewski et al. FRED MC for Proton Therapy
For characterizing the lateral propagation, the lateral beamprofiles measured during facility commissioning in air at differentZ positions (cf. Figure 1B) were fitted using the Gaussian fit, andits σ(z) was calculated. Additionally, the σ(z) measured with thebeam monitor chambers in the nozzle can be used [41]. Thisimproves the quality of the lateral beam propagation modeling,especially in cases where the waist of the beam is located betweenthe nozzle and the first measured point in air. Fitting σ(z) tocommissioning data from both facilities at different distancesfrom the isocenter using bilinear and quadratic functionsindicated that the emittance model is appropriate for Krakowfacility, whereas the virtual point source model can be used forEMORY.
For characterizing the beam lateral propagation in Krakow, sixemittance model parameters (ϵ, α, β), three in X direction andthree in Y direction, were used. The Twiss parameters ϵ, α, and β
were obtained according to the following formula [42]:
σ2(z) � ϵ · (β − 2 · α · z + 1 + α2
β· z2), (1)
where the emittance ϵ corresponds to the area in the X/Yposition–velocity phase space and is assumed to be constantover the beam propagation in air. The Twiss parameter α isrelated to the focusing/defocusing of the beam, whereas β
characterizes the length over which the beam changes itstransverse shape.
For characterizing the beam lateral propagation in Atlanta,four parameters, two in X direction and two in Y direction,specific for a bilinear approximation were used. The parameterswere obtained according to the following formula:
σ(z) � S · z − VSD, (2)
where the S is the function slope and corresponds to the rate ofthe spot size variation and VSD stands for virtual sourcedistance and corresponds to the distance from the virtualsource to the isocenter. Note that for both approaches,virtual point source and emittance model of lateral beampropagation, particles are transported starting from theposition of the scanning magnets regardless of the positionthe emittance waist and VSD.
For TPS exploiting analytical pencil beam algorithm, theemittance model is defined for configurations with and withoutrange shifter, whereas in MC-based TPS and in FRED, only theconfiguration without range shifter is defined, and protontransport in range shifter is simulated according to its modelparameters (material composition, density, physical thickness).
2.4 Generation of Beam Model ParameterLibraryWe implemented a set of software tools that calculate beam modelparameters in three automated steps (see Figure 2). The beammodel parameter libraries were generated in the entire proton beamenergy range in 10MeV steps (Table 1) for both facilities. Figure 2schematically illustrates how the FRED MC commissioningprocedure uses the facility commissioning measurements as theinput to obtain beammodel parameters per nominal energy, that is,
beam energy E, energy spread Eσ, MU scaling factor SFMU, and sixemittance or four virtual point source parameters. The procedure isautomated and does not require any interaction with the user,except preparation of the measurement data. FRED simulations ofsingle pencil beams were performed using 108 primary protons.
Step 1. In the first step (Figure 2: Step 1), the emittance orvirtual point source model (Eqs 1 and 2) was fitted to themeasured beam spot size (σx/y) as a function of the positionalong the beam (see Section 2.3). For Krakow beam model, inaddition to the beam size measurements performed with Lynx(pixel size 0.5 × 0.5 mm2), the beam size measurementsperformed during irradiation with IC23 (resolution 5 mmin X/Y directions) installed close to the nozzle exit wereused to fit the emittance model (see Section 2.3). In thisway, emittance model parameters (ϵ, α, β) or virtual pointsource parameters (S, VSD) were obtained for X and Ydirections and each energy.
Step 2. In the second step (Figure 2: Step 2), beam energy (E)and energy spread (Eσ) were obtained. The measured andsimulated IDD profiles were fitted using a formalism proposedby Bortfeld [43, 44]. Using the fit and semiempirical relationsproposed by Bortfeld [43], the initial energy and energy spread ofprotons producing an IDD distribution were computed. TheBragg peak range (R80%) defined as 80% of the maximal valueat the distal falloff and the Bragg peak full width at half maximum(FWHM) were numerically calculated from the fitted curve. TheE, Eσ, R80%, and FWHM parameters were calculated forexperimental data and each FRED simulation. An automatediterative optimization procedure was developed to find such Eand Eσ values in FRED, which minimize the absolute difference ofBragg peak range (
∣∣∣∣ΔR80%
∣∣∣∣) and FWHM (|ΔFWHM|) betweensimulation and measurement. The dependence of
∣∣∣∣ΔR80%
∣∣∣∣ and|ΔFWHM| on E and Eσ is a continuous function with a singleglobal minimum. The optimization procedure was implementedin Python exploiting the Nelder–Mead simplex algorithm [45].The initial guess of energy and energy spread was estimated fromthe Bortfeld curve fitted to measured data. Each consecutive stepof the optimization algorithm included the following: 1) newsimulation of a depth dose distribution in water with energy andenergy spread computed by the optimization algorithm, 2)Bortfeld curve fit and estimation of R80% and FWHM for thesimulated curve, and 3) estimation of
∣∣∣∣ΔR80%
∣∣∣∣ and |ΔFWHM|comparing measurement and new simulation. The FRED beamenergy (E) and energy spread (Eσ) are considered optimal when∣∣∣∣ΔR80%
∣∣∣∣ and |ΔFWHM| are less than or equal to 0.05 mm.Step 3. In the third step (Figure 2: Step 3), the dosimetric
calibration from TPS MU to the number of particles (SFSFMU)was obtained for each nominal energy, mimicking themeasurement setup. For this purpose, a monoenergetic 10 ×10 cm2
field in water was simulated with spot spacing 2.5 mm, 1MU per spot and unitary MU scaling factor. The dose in theuniform field center at 2 cm depth in water, D2 cm, was derivedfrom the simulation. The MU scaling factor (SFMU) was obtainedas the ratio between D2cm obtained from commissioningmeasurement and FRED MC simulation.
The output of the characterization procedure is a list of beammodel parameters per nominal energy and is stored in a text file.
Frontiers in Physics | www.frontiersin.org January 2021 | Volume 8 | Article 5673005
Gajewski et al. FRED MC for Proton Therapy
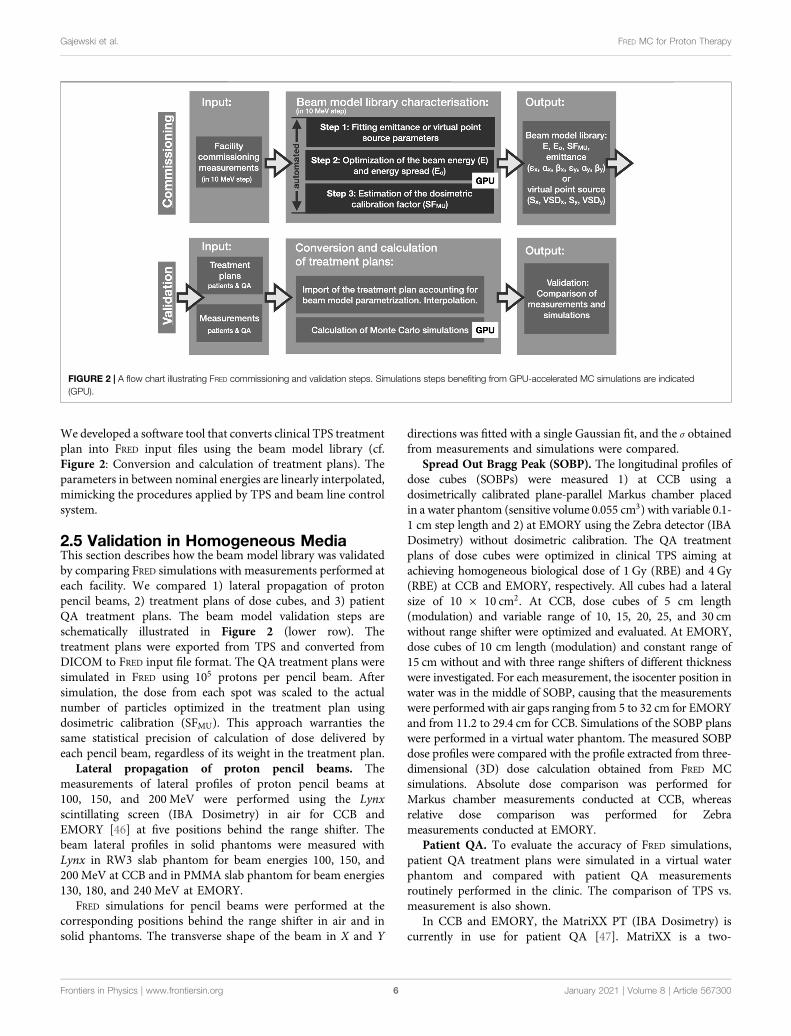
We developed a software tool that converts clinical TPS treatmentplan into FRED input files using the beam model library (cf.Figure 2: Conversion and calculation of treatment plans). Theparameters in between nominal energies are linearly interpolated,mimicking the procedures applied by TPS and beam line controlsystem.
2.5 Validation in Homogeneous MediaThis section describes how the beam model library was validatedby comparing FRED simulations with measurements performed ateach facility. We compared 1) lateral propagation of protonpencil beams, 2) treatment plans of dose cubes, and 3) patientQA treatment plans. The beam model validation steps areschematically illustrated in Figure 2 (lower row). Thetreatment plans were exported from TPS and converted fromDICOM to FRED input file format. The QA treatment plans weresimulated in FRED using 105 protons per pencil beam. Aftersimulation, the dose from each spot was scaled to the actualnumber of particles optimized in the treatment plan usingdosimetric calibration (SFMU). This approach warranties thesame statistical precision of calculation of dose delivered byeach pencil beam, regardless of its weight in the treatment plan.
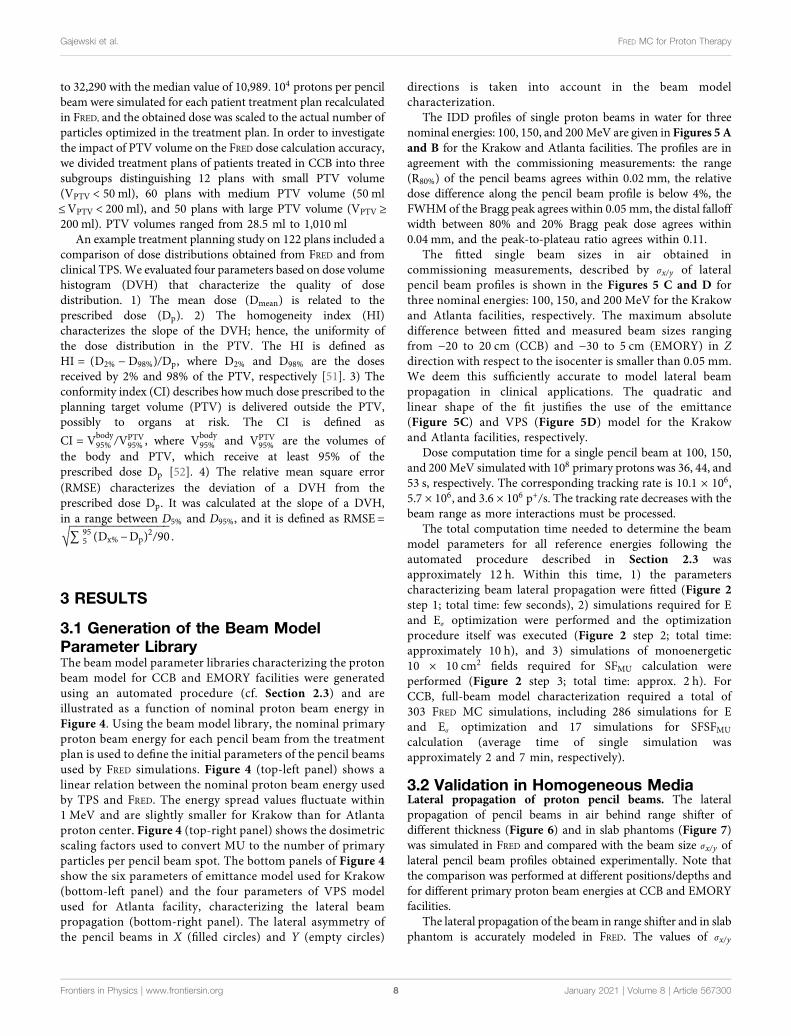
Lateral propagation of proton pencil beams. Themeasurements of lateral profiles of proton pencil beams at100, 150, and 200 MeV were performed using the Lynxscintillating screen (IBA Dosimetry) in air for CCB andEMORY [46] at five positions behind the range shifter. Thebeam lateral profiles in solid phantoms were measured withLynx in RW3 slab phantom for beam energies 100, 150, and200 MeV at CCB and in PMMA slab phantom for beam energies130, 180, and 240 MeV at EMORY.
FRED simulations for pencil beams were performed at thecorresponding positions behind the range shifter in air and insolid phantoms. The transverse shape of the beam in X and Y
directions was fitted with a single Gaussian fit, and the σ obtainedfrom measurements and simulations were compared.
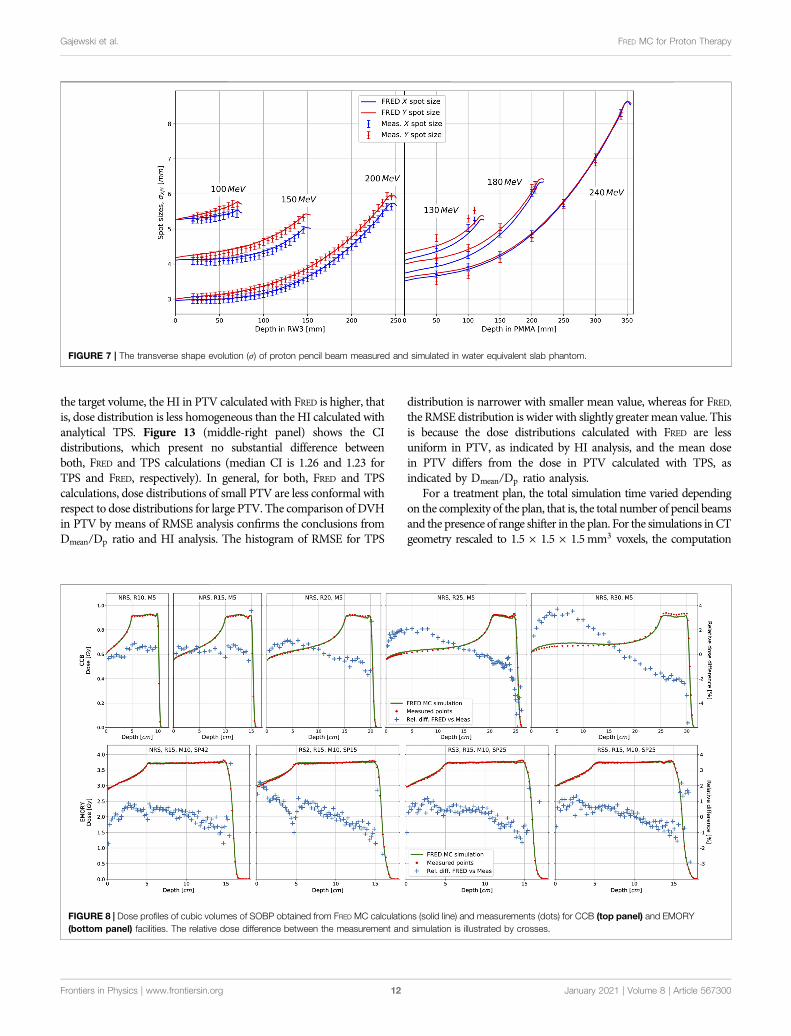
Spread Out Bragg Peak (SOBP). The longitudinal profiles ofdose cubes (SOBPs) were measured 1) at CCB using adosimetrically calibrated plane-parallel Markus chamber placedin a water phantom (sensitive volume 0.055 cm3) with variable 0.1-1 cm step length and 2) at EMORY using the Zebra detector (IBADosimetry) without dosimetric calibration. The QA treatmentplans of dose cubes were optimized in clinical TPS aiming atachieving homogeneous biological dose of 1 Gy (RBE) and 4 Gy(RBE) at CCB and EMORY, respectively. All cubes had a lateralsize of 10 × 10 cm2. At CCB, dose cubes of 5 cm length(modulation) and variable range of 10, 15, 20, 25, and 30 cmwithout range shifter were optimized and evaluated. At EMORY,dose cubes of 10 cm length (modulation) and constant range of15 cm without and with three range shifters of different thicknesswere investigated. For each measurement, the isocenter position inwater was in the middle of SOBP, causing that the measurementswere performed with air gaps ranging from 5 to 32 cm for EMORYand from 11.2 to 29.4 cm for CCB. Simulations of the SOBP planswere performed in a virtual water phantom. The measured SOBPdose profiles were compared with the profile extracted from three-dimensional (3D) dose calculation obtained from FRED MCsimulations. Absolute dose comparison was performed forMarkus chamber measurements conducted at CCB, whereasrelative dose comparison was performed for Zebrameasurements conducted at EMORY.
Patient QA. To evaluate the accuracy of FRED simulations,patient QA treatment plans were simulated in a virtual waterphantom and compared with patient QA measurementsroutinely performed in the clinic. The comparison of TPS vs.measurement is also shown.
In CCB and EMORY, the MatriXX PT (IBA Dosimetry) iscurrently in use for patient QA [47]. MatriXX is a two-
FIGURE 2 | A flow chart illustrating FRED commissioning and validation steps. Simulations steps benefiting from GPU-accelerated MC simulations are indicated(GPU).
Frontiers in Physics | www.frontiersin.org January 2021 | Volume 8 | Article 5673006
Gajewski et al. FRED MC for Proton Therapy

dimensional (2D) array of 1020 plane-parallel ionizationchambers of 4 mm diameter arranged in a 32 × 32 grid withthe distance between chambers of 7.62 mm. In both facilities, theMatriXX detector was calibrated to dose in water according toprotocol proposed by the manufacturer. Patient QAmeasurements are typically performed at 3-5 depths at CCBand at 1-3 depths at EMORY. The measurement depths areselected by amedical physicist during the QA preparation processfor each patient individually, to cover the entire treatment field.For EMORY, the air gap ranges from 5 to 22 cm, whereas forCCB, it ranges from 21.7 to 27.7 cm. The patient QA treatmentplans of 74 patients (1077 measured layers, 967 without and 110with range shifter) treated in Krakow and 13 patients (56measured layers) treated in EMORY were evaluated. The dosedistributions obtained from TPS and FRED calculations werecompared to measured data by means of dose profile andgamma index (GI) analysis [48]. GI calculation toolsimplemented in PyMedPhys Python package [49] were usedfor evaluation. The 3D GI test (2 mm distance-to-agreementand 2% of local dose difference criteria, with the dose cutoff at2% of the maximum dose) was used to compare 2D slice of dosefield measurement (reference) with 3D FRED dose distributioncalculation (evaluation).
2.6 Validation in Heterogeneous MediaThe end-to-end experimental validation of FRED physics models,beam model, and CT calibration using a heterogeneous CIRShead-and-neck phantom (model 731-HN) [50] was performed inKrakow. The experimental setup is shown in Figure 3. The CIRSphantom consists of five materials equivalent to the followingtissues/organs: brain, bone, larynx, trachea, sinus, teeth, and nasalcavities. One half of the phantom consists of single piece, and theother is sliced into three segments as shown in Figure 3A. TheCIRS phantom was positioned in the treatment room usingorthogonal X-ray imaging system and the phantom CT scan,following the clinical patient positioning procedure applied inKrakow. The irradiation plans of 10 × 10 cm2 monoenergeticfields at nominal energies 100, 150, and 200 MeV were preparedin clinical TPS with and without range shifter. The dosedistribution downstream from the CIRS phantom wasmeasured using the MatriXX detector placed in the DigiPhantwater phantom (IBA Dosimetry, see Section 2.5). Data were
acquired in 5 mm water-equivalent steps yielding 3D dosedistribution with lateral resolution of 7.62 mm andlongitudinal resolution of 5 mm. Dose distributions weremeasured behind half CIRS head in water for nominalenergies 150 and 200 MeV (cf. Figure 3B). The dosedistribution was measured behind 1/6 slice of CIRS head inwater-equivalent RW3 slab phantom using 100 MeV protonbeam (IBA Dosimetry; cf. Figure 3C) because 100 MeVprotons have insufficient range to traverse the half-headphantom to acquire dose distribution in water using MatriXX(with and without range shifter).
The measurements were compared to FRED simulations of theexperimental setup performed in the CT image of the CIRS andwater phantoms. The CT image of CIRS phantom was acquiredusing the CT scanner (Siemens SOMATOM) calibrated fortreatment planning in Krakow. The comparison of measuredand simulated 3D dose distributions was performed using a 3DGI method.
2.7 Patient DataA retrospective patient study was performed to investigate timeperformance of FRED as an independent, MC-based, proton dosecomputation tool and demonstrate its applicability for patientQA in the clinic. For this purpose, we referred our results to theTPS computations.
The 122 treatment plans (including boost plans) of 90 headand neck as well as brain patients treated at CCB from 2016 to2018 and an example treatment plan of a patient treated inEMORY in 2019 [7] were simulated in FRED on CT geometries.The clinical CT images were sampled down to 1.5 × 1.5 ×1.5 mm3 voxel size. The facility-specific clinical CT calibrationcurve obtained from stoichiometric calibration [36] wasimplemented in FRED. The CT calibration curve used in FREDcontains information on the composition, relative stoppingpower (RSP) of protons, radiation length, and density of 93materials. The density and RSP of CT numbers between 93predefined points are linearly interpolated. The CT images ofthe patient anatomy and delineated contours were used for theoptimization of plans in clinical TPS using an analytical intensitymodulated proton therapy (IMPT) optimization algorithm.Depending on the target size and the number of fields, thenumber of pencil beams in a treatment plan varied from 1,378
FIGURE 3 | Schematic illustration of CIRS phantom (A) and setup used for experiment and FRED MC simulations (B, C). (A) CIRS head phantom sliced into one-piece half-head and the other half sliced further into three segments; (B) setup with half-head CIRS and MatriXX detector placed in water phantom; (C) setup with oneslice of CIRS and MatriXX detector placed between water-equivalent RW3 solid phantom. Setup (B) was irradiated with monoenergetic field at nominal proton beamenergy 150 and 200 MeV, whereas setup (C) at 100 MeV, all with and without range shifter.
Frontiers in Physics | www.frontiersin.org January 2021 | Volume 8 | Article 5673007
Gajewski et al. FRED MC for Proton Therapy
to 32,290 with the median value of 10,989. 104 protons per pencilbeam were simulated for each patient treatment plan recalculatedin FRED, and the obtained dose was scaled to the actual number ofparticles optimized in the treatment plan. In order to investigatethe impact of PTV volume on the FRED dose calculation accuracy,we divided treatment plans of patients treated in CCB into threesubgroups distinguishing 12 plans with small PTV volume(VPTV < 50 ml), 60 plans with medium PTV volume (50 ml≤VPTV < 200 ml), and 50 plans with large PTV volume (VPTV ≥200 ml). PTV volumes ranged from 28.5 ml to 1,010 ml
An example treatment planning study on 122 plans included acomparison of dose distributions obtained from FRED and fromclinical TPS. We evaluated four parameters based on dose volumehistogram (DVH) that characterize the quality of dosedistribution. 1) The mean dose (Dmean) is related to theprescribed dose (Dp). 2) The homogeneity index (HI)characterizes the slope of the DVH; hence, the uniformity ofthe dose distribution in the PTV. The HI is defined asHI � (D2% − D98%)/Dp, where D2% and D98% are the dosesreceived by 2% and 98% of the PTV, respectively [51]. 3) Theconformity index (CI) describes howmuch dose prescribed to theplanning target volume (PTV) is delivered outside the PTV,possibly to organs at risk. The CI is defined as
CI � Vbody95% /VPTV
95% , where Vbody95% and VPTV
95% are the volumes ofthe body and PTV, which receive at least 95% of theprescribed dose Dp [52]. 4) The relative mean square error(RMSE) characterizes the deviation of a DVH from theprescribed dose Dp. It was calculated at the slope of a DVH,in a range between D5% and D95%, and it is defined as RMSE�����������������∑ 95
5 (Dx% −Dp)2/90√
.
3 RESULTS
3.1 Generation of the Beam ModelParameter LibraryThe beam model parameter libraries characterizing the protonbeam model for CCB and EMORY facilities were generatedusing an automated procedure (cf. Section 2.3) and areillustrated as a function of nominal proton beam energy inFigure 4. Using the beam model library, the nominal primaryproton beam energy for each pencil beam from the treatmentplan is used to define the initial parameters of the pencil beamsused by FRED simulations. Figure 4 (top-left panel) shows alinear relation between the nominal proton beam energy usedby TPS and FRED. The energy spread values fluctuate within1 MeV and are slightly smaller for Krakow than for Atlantaproton center. Figure 4 (top-right panel) shows the dosimetricscaling factors used to convert MU to the number of primaryparticles per pencil beam spot. The bottom panels of Figure 4show the six parameters of emittance model used for Krakow(bottom-left panel) and the four parameters of VPS modelused for Atlanta facility, characterizing the lateral beampropagation (bottom-right panel). The lateral asymmetry ofthe pencil beams in X (filled circles) and Y (empty circles)
directions is taken into account in the beam modelcharacterization.
The IDD profiles of single proton beams in water for threenominal energies: 100, 150, and 200 MeV are given in Figures 5 Aand B for the Krakow and Atlanta facilities. The profiles are inagreement with the commissioning measurements: the range(R80%) of the pencil beams agrees within 0.02 mm, the relativedose difference along the pencil beam profile is below 4%, theFWHM of the Bragg peak agrees within 0.05 mm, the distal falloffwidth between 80% and 20% Bragg peak dose agrees within0.04 mm, and the peak-to-plateau ratio agrees within 0.11.
The fitted single beam sizes in air obtained incommissioning measurements, described by σx/y of lateralpencil beam profiles is shown in the Figures 5 C and D forthree nominal energies: 100, 150, and 200 MeV for the Krakowand Atlanta facilities, respectively. The maximum absolutedifference between fitted and measured beam sizes rangingfrom −20 to 20 cm (CCB) and −30 to 5 cm (EMORY) in Zdirection with respect to the isocenter is smaller than 0.05 mm.We deem this sufficiently accurate to model lateral beampropagation in clinical applications. The quadratic andlinear shape of the fit justifies the use of the emittance(Figure 5C) and VPS (Figure 5D) model for the Krakowand Atlanta facilities, respectively.
Dose computation time for a single pencil beam at 100, 150,and 200 MeV simulated with 108 primary protons was 36, 44, and53 s, respectively. The corresponding tracking rate is 10.1 × 106,5.7 × 106, and 3.6 × 10⁶ p+/s. The tracking rate decreases with thebeam range as more interactions must be processed.
The total computation time needed to determine the beammodel parameters for all reference energies following theautomated procedure described in Section 2.3 wasapproximately 12 h. Within this time, 1) the parameterscharacterizing beam lateral propagation were fitted (Figure 2step 1; total time: few seconds), 2) simulations required for Eand Eσ optimization were performed and the optimizationprocedure itself was executed (Figure 2 step 2; total time:approximately 10 h), and 3) simulations of monoenergetic10 × 10 cm2
fields required for SFMU calculation wereperformed (Figure 2 step 3; total time: approx. 2 h). ForCCB, full-beam model characterization required a total of303 FRED MC simulations, including 286 simulations for Eand Eσ optimization and 17 simulations for SFSFMU
calculation (average time of single simulation wasapproximately 2 and 7 min, respectively).
3.2 Validation in Homogeneous MediaLateral propagation of proton pencil beams. The lateralpropagation of pencil beams in air behind range shifter ofdifferent thickness (Figure 6) and in slab phantoms (Figure 7)was simulated in FRED and compared with the beam size σx/y oflateral pencil beam profiles obtained experimentally. Note thatthe comparison was performed at different positions/depths andfor different primary proton beam energies at CCB and EMORYfacilities.
The lateral propagation of the beam in range shifter and in slabphantom is accurately modeled in FRED. The values of σx/y
Frontiers in Physics | www.frontiersin.org January 2021 | Volume 8 | Article 5673008
Gajewski et al. FRED MC for Proton Therapy

obtained from measurements agree with simulated values mostlywithin 100 µm, as indicated by error bars in Figures 6 and 7. Theresults in air and in slab phantoms are within the spot size QAacceptance criterion of ± 0.6 mm used by CCB therapy center.
Spread Out Bragg Peak (SOBP). Depth dose distributionprofiles of cubic volumes obtained from measurements and FREDsimulations are shown in Figure 8 for CCB in the top panels andfor EMORY in the bottom panels. The results obtained for CCBare absolute dose, whereas they are relatively normalized to thedose value in the middle of the SOBP for EMORY. Because thetreatment plans were optimized in clinical TPS, the obtainedphysical dose differs from the prescribed biological dose by theRBE factor of 10%.
Good agreement between FRED MC simulations and dosemeasurements along the SOBP profiles was obtained. Themaximum relative dose difference is 2% for most of themeasurement points. The largest relative dose differences areobserved at the distal falloff, that is, a high-dose gradient region,and result from the detector positioning uncertainties, estimatedto be about ± 0.3 mm. Small variations between themeasurements and simulations are present at the beginning of
the plateau and in the SOBP of cubes between the range of 25 and30 cm. They are potentially related to the implementation of thenuclear interaction model in FRED for the highest beam energies.This accuracy is acceptable for the scope of the presented clinicalapplication.
The tracking rate of the dose cube simulation ranged from4.5 × 106 to 2.0 × 10⁶ p+/s and the complete dose computationtime for a single dose cube was up to 10 min, with the statistics105 primaries per pencil beam.
Patient QA. 2D transversal dose maps obtained frommeasurements performed with the MatriXX detector in waterphantom were compared with FRED and TPS simulations ofpatient treatment plans using the GI analysis. Data from 1077measurements performed at CCB and 52 measurementsperformed at EMORY were investigated, and the results of thecomparison are summarized in Figure 9. The average GI passingrate obtained comparing all simulated and measured layers was97.83% (4.94) (1σ) for CCB and 95.51% (3.88) (1σ) for EMORY.Of 1,077 layers evaluated for CCB, 1,022 fulfilled the requirementfor the GI passing rate (%GP) to be greater than 90%. ForEMORY, 47 of 52 investigated layers fulfilled this requirement.
FIGURE 4 | The parameters characterizing proton beammodel used in CCB and EMORY facilities at the entire primary proton beam energy range. Nominal energycorresponds to energy used by clinical TPS. Top-left panel: Beam energy and energy spread; Top-right panel: dosimetric calibration; bottom-left panel: emittancemodel parameters used in CCB; bottom-right panel: VPS model parameters used in EMORY.
Frontiers in Physics | www.frontiersin.org January 2021 | Volume 8 | Article 5673009
Gajewski et al. FRED MC for Proton Therapy

Figure 10 shows an example of a transversal dose field layerextracted from FRED MC simulation and the corresponding dosedistribution measured with MatriXX at the same depth in water,as well as in the GI map.
For a patient verification treatment plan, the average trackingrate and complete dose computation time were 3.4(0.4)×106 p+/s(1σ) and 2’34 (1’38) min (1σ), respectively.
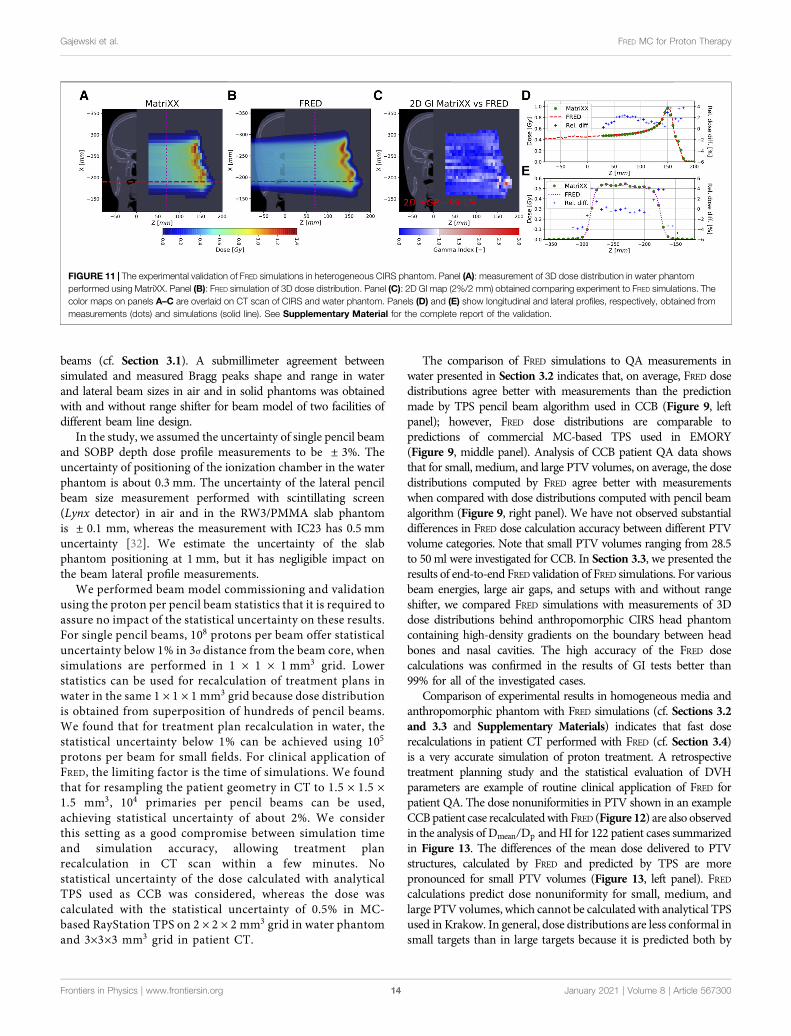
3.3 Validation in Heterogeneous MediaThe experimental validation of FRED accuracy was performed bycomparing 3D dose distributions behind the heterogeneousphantom obtained experimentally and from FRED simulations(cf. Section 2.6). An example of the comparison of FREDsimulation against the experimentally acquired data is shownin Figure 11. Two 3D dose measurements, one with and otherwithout range shifter, were performed for each of the investigatedenergies (100, 150, 200 MeV). An excellent agreement betweenFRED simulations and measurements was achieved. For all the
investigated cases, the 3D GI (2%/2 mm) is greater than 99%.Comparing the clinical (analytical) TPS simulation and themeasurements, the GI passing rate is 93.298.0
76.3% (σ � 8.4%). Seethe Supplementary Material of the article for detailed results ofother measurements performed at 100 and 200 MeV, with andwithout range shifter.
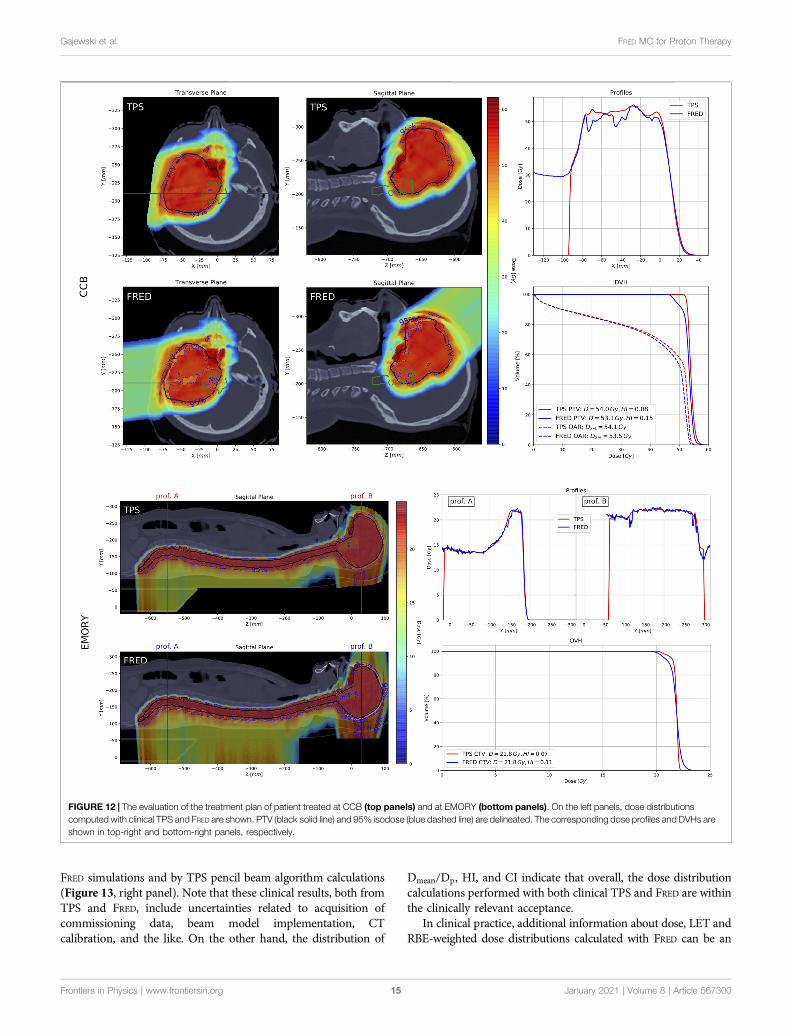
3.4 Example Clinical Application of FREDAs an example, dose distributions, dose profiles, and DVHsrecalculated with FRED and clinical TPS, for one patient casefrom CCB and one from EMORY, are shown in Figure 12. ForCCB patient case (Figure 12 top panels), dose distributionscomputed with FRED are less uniform compared to theanalytical TPS calculations. This is also observed analyzing thedose profiles and the DVH for PTV and results in the reduction ofthe mean dose in PTV and organ at risk. For EMORY patient case(Figure 12 bottom panels), the differences in dose distributionsare less visible as MC-based TPS was used for the dose
FIGURE 5 | Examples of longitudinal proton beam propagation in water (top panels) and lateral proton beam propagation (σ) in X and Y directions in air (bottompanels) for CCB (left) and EMORY (right) facilities at three proton beam energies: 100, 150, and 200 MeV. Depth dose distribution profiles of proton pencil beamssimulated with beam model parameters in FRED (FRED Bragg peak) and obtained experimentally during the facility commissioning (measured Bragg peak) for CCB(panel A) and EMORY (panel B). The transverse shape and velocity evolution of the proton beam represented bymeans of the emittancemodel for CCB (panel C)and VPS model for EMORY (panel D).
Frontiers in Physics | www.frontiersin.org January 2021 | Volume 8 | Article 56730010
Gajewski et al. FRED MC for Proton Therapy

optimization and calculation. The observed differences betweenFRED and RayStation MC-based TPS are similar to the resultsobtained comparing RayStation with ECLIPSE MC algorithmreported by Chang et al. [7].
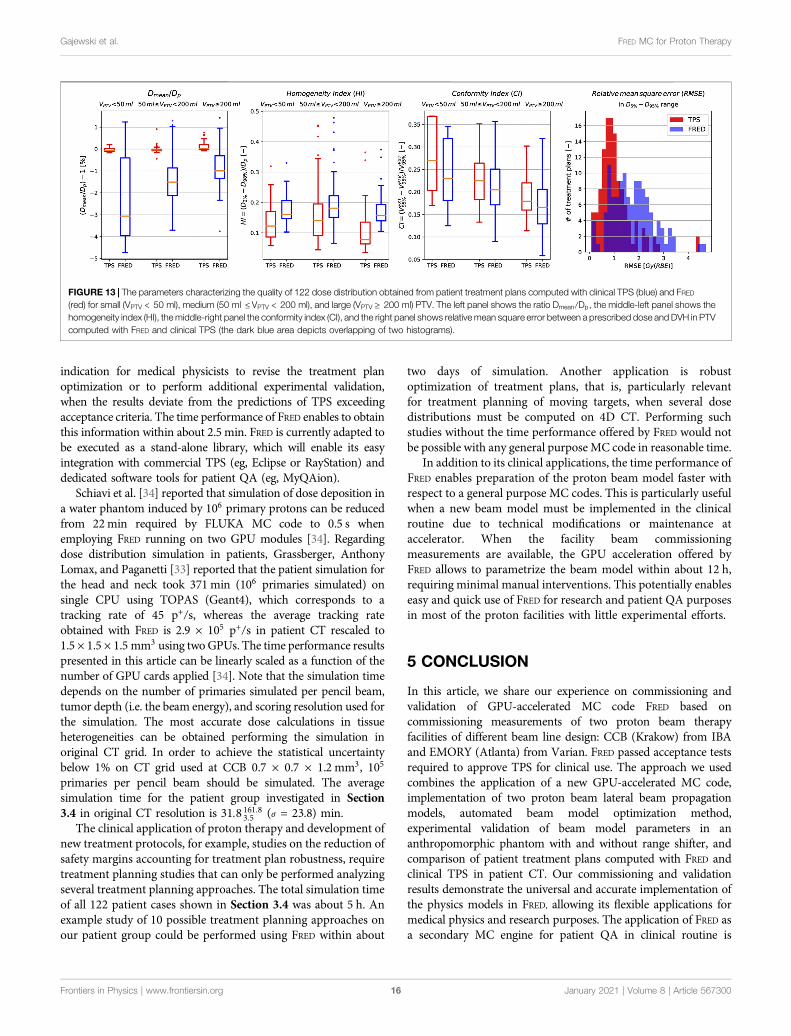
Analysis of 122 treatment plans of patients treated at CCB wasperformed to quantify the time performance and demonstrate theclinical applicability of FRED dose computations for patient QA.Comparing dose distributions in PTV, we observed that the ratio
Dmean/Dp obtained with FRED is more dispersed than the oneobtained with analytical TPS, while the effect is morepronounced for small targets. The average relative difference inmedian value ranges from 3% for small targets, through 1.5% formedium size target volumes, to 1% for large target volumes, asshown in Figure 13 (left panel). The analysis of HI in PTV is shownin Figure 13 (middle-left panel). On average, the median HI is 0.11and 0.16 for clinical TPS and FRED, respectively. Independently on
FIGURE 6 | Spot sizes in air in X (blue) and Y (red) directions for CCB and EMORY without range shifter and behind the range shifters used at facility (single rangeshifter (RS) of thickness 36.7 mm for CCB and RS2, RS3, and RS5 of thickness 20, 30, and 50 mm, respectively, for EMORY). The measured spot sizes are shown aspoints with error bars (± 0.1 mm), and the solid lines show the simulation results.
Frontiers in Physics | www.frontiersin.org January 2021 | Volume 8 | Article 56730011
Gajewski et al. FRED MC for Proton Therapy
the target volume, the HI in PTV calculated with FRED is higher, thatis, dose distribution is less homogeneous than the HI calculated withanalytical TPS. Figure 13 (middle-right panel) shows the CIdistributions, which present no substantial difference betweenboth, FRED and TPS calculations (median CI is 1.26 and 1.23 forTPS and FRED, respectively). In general, for both, FRED and TPScalculations, dose distributions of small PTV are less conformal withrespect to dose distributions for large PTV. The comparison of DVHin PTV by means of RMSE analysis confirms the conclusions fromDmean/Dp ratio and HI analysis. The histogram of RMSE for TPS
distribution is narrower with smaller mean value, whereas for FRED,the RMSE distribution is wider with slightly greatermean value. Thisis because the dose distributions calculated with FRED are lessuniform in PTV, as indicated by HI analysis, and the mean dosein PTV differs from the dose in PTV calculated with TPS, asindicated by Dmean/Dp ratio analysis.
For a treatment plan, the total simulation time varied dependingon the complexity of the plan, that is, the total number of pencil beamsand the presence of range shifter in the plan. For the simulations inCTgeometry rescaled to 1.5 × 1.5 × 1.5mm3 voxels, the computation
FIGURE 8 | Dose profiles of cubic volumes of SOBP obtained from FRED MC calculations (solid line) and measurements (dots) for CCB (top panel) and EMORY(bottom panel) facilities. The relative dose difference between the measurement and simulation is illustrated by crosses.
FIGURE 7 | The transverse shape evolution (σ) of proton pencil beam measured and simulated in water equivalent slab phantom.
Frontiers in Physics | www.frontiersin.org January 2021 | Volume 8 | Article 56730012
Gajewski et al. FRED MC for Proton Therapy

time ranged from 21 s to 6′26min (average value 2′28 (1′25) min(1σ)) with the average tracking rate of 2.9 (1.1)×105 p+/s (1σ).
4 DISCUSSION
We have built a proton beam model libraries for FRED MC codeaccording to the QA protocols, and we accomplished acceptance
tests required for beam model validation in a commercial TPS atproton therapy facilities. We performed MC commissioningavoiding the nozzle geometry modeling, similar to the workpresented by other groups [10, 32, 33]. The beam model libraryparameters containing the information on initial proton energy andenergy spread, lateral beam propagation, and dosimetric calibrationwere identified in 10MeV energy steps in the therapeutic energyrange to best fit the commissioning measurements of proton pencil
FIGURE 9 | A transversal 2D dose distribution layer measured with an array of ionization chambers in water phantom (left panel), obtained from FRED MCsimulations (middle panel) and a GI map computed comparing FRED simulation andmeasurement using GI (2%/2 mm) method (right panel). GI passing rate is 99.53%for the CCB case shown in the top panels and 95.95% for EMORY case shown in bottom panel.
FIGURE 10 | Evaluation of gamma index passing rate (%GP) for 2D dose maps obtained from patient QA of 1,077 layers measured in CCB (left and right panels)and of 52 layers measured in EMORY (middle panel). Red and blue box plots correspond to the distribution of %GP obtained from the comparison of measurements toTPS and FRED calculations, respectively. In the left andmiddle panels, we compared the layers planned with range shifter (RS) and without range shifter (NRS), whereas inthe right panel, small (VPTV < 50 ml), medium (50 ml ≤VPTV < 200 ml), and large (VPTV ≥ 200 ml) PTV volumes. Green numbers labeled as “pass” stand for thenumber of cases passing %GP>90% criterion, whereas “total” is the population of a given group.
Frontiers in Physics | www.frontiersin.org January 2021 | Volume 8 | Article 56730013
Gajewski et al. FRED MC for Proton Therapy
beams (cf. Section 3.1). A submillimeter agreement betweensimulated and measured Bragg peaks shape and range in waterand lateral beam sizes in air and in solid phantoms was obtainedwith and without range shifter for beam model of two facilities ofdifferent beam line design.
In the study, we assumed the uncertainty of single pencil beamand SOBP depth dose profile measurements to be ± 3%. Theuncertainty of positioning of the ionization chamber in the waterphantom is about 0.3 mm. The uncertainty of the lateral pencilbeam size measurement performed with scintillating screen(Lynx detector) in air and in the RW3/PMMA slab phantomis ± 0.1 mm, whereas the measurement with IC23 has 0.5 mmuncertainty [32]. We estimate the uncertainty of the slabphantom positioning at 1 mm, but it has negligible impact onthe beam lateral profile measurements.
We performed beam model commissioning and validationusing the proton per pencil beam statistics that it is required toassure no impact of the statistical uncertainty on these results.For single pencil beams, 108 protons per beam offer statisticaluncertainty below 1% in 3σ distance from the beam core, whensimulations are performed in 1 × 1 × 1 mm3 grid. Lowerstatistics can be used for recalculation of treatment plans inwater in the same 1 × 1 × 1 mm3 grid because dose distributionis obtained from superposition of hundreds of pencil beams.We found that for treatment plan recalculation in water, thestatistical uncertainty below 1% can be achieved using 105
protons per beam for small fields. For clinical application ofFRED, the limiting factor is the time of simulations. We foundthat for resampling the patient geometry in CT to 1.5 × 1.5 ×1.5 mm3, 104 primaries per pencil beams can be used,achieving statistical uncertainty of about 2%. We considerthis setting as a good compromise between simulation timeand simulation accuracy, allowing treatment planrecalculation in CT scan within a few minutes. Nostatistical uncertainty of the dose calculated with analyticalTPS used as CCB was considered, whereas the dose wascalculated with the statistical uncertainty of 0.5% in MC-based RayStation TPS on 2 × 2 × 2 mm3 grid in water phantomand 3×3×3 mm3 grid in patient CT.
The comparison of FRED simulations to QA measurements inwater presented in Section 3.2 indicates that, on average, FRED dosedistributions agree better with measurements than the predictionmade by TPS pencil beam algorithm used in CCB (Figure 9, leftpanel); however, FRED dose distributions are comparable topredictions of commercial MC-based TPS used in EMORY(Figure 9, middle panel). Analysis of CCB patient QA data showsthat for small, medium, and large PTV volumes, on average, the dosedistributions computed by FRED agree better with measurementswhen compared with dose distributions computed with pencil beamalgorithm (Figure 9, right panel). We have not observed substantialdifferences in FRED dose calculation accuracy between different PTVvolume categories. Note that small PTV volumes ranging from 28.5to 50ml were investigated for CCB. In Section 3.3, we presented theresults of end-to-end FRED validation of FRED simulations. For variousbeam energies, large air gaps, and setups with and without rangeshifter, we compared FRED simulations with measurements of 3Ddose distributions behind anthropomorphic CIRS head phantomcontaining high-density gradients on the boundary between headbones and nasal cavities. The high accuracy of the FRED dosecalculations was confirmed in the results of GI tests better than99% for all of the investigated cases.
Comparison of experimental results in homogeneous media andanthropomorphic phantom with FRED simulations (cf. Sections 3.2and 3.3 and Supplementary Materials) indicates that fast doserecalculations in patient CT performed with FRED (cf. Section 3.4)is a very accurate simulation of proton treatment. A retrospectivetreatment planning study and the statistical evaluation of DVHparameters are example of routine clinical application of FRED forpatient QA. The dose nonuniformities in PTV shown in an exampleCCBpatient case recalculatedwith FRED (Figure 12) are also observedin the analysis of Dmean/Dp and HI for 122 patient cases summarizedin Figure 13. The differences of the mean dose delivered to PTVstructures, calculated by FRED and predicted by TPS are morepronounced for small PTV volumes (Figure 13, left panel). FREDcalculations predict dose nonuniformity for small, medium, andlarge PTV volumes, which cannot be calculated with analytical TPSused in Krakow. In general, dose distributions are less conformal insmall targets than in large targets because it is predicted both by
FIGURE 11 | The experimental validation of FRED simulations in heterogeneous CIRS phantom. Panel (A): measurement of 3D dose distribution in water phantomperformed using MatriXX. Panel (B): FRED simulation of 3D dose distribution. Panel (C): 2D GI map (2%/2 mm) obtained comparing experiment to FRED simulations. Thecolor maps on panels A–C are overlaid on CT scan of CIRS and water phantom. Panels (D) and (E) show longitudinal and lateral profiles, respectively, obtained frommeasurements (dots) and simulations (solid line). See Supplementary Material for the complete report of the validation.
Frontiers in Physics | www.frontiersin.org January 2021 | Volume 8 | Article 56730014
Gajewski et al. FRED MC for Proton Therapy
FRED simulations and by TPS pencil beam algorithm calculations(Figure 13, right panel). Note that these clinical results, both fromTPS and FRED, include uncertainties related to acquisition ofcommissioning data, beam model implementation, CTcalibration, and the like. On the other hand, the distribution of
Dmean/Dp, HI, and CI indicate that overall, the dose distributioncalculations performed with both clinical TPS and FRED are withinthe clinically relevant acceptance.
In clinical practice, additional information about dose, LET andRBE-weighted dose distributions calculated with FRED can be an
FIGURE 12 | The evaluation of the treatment plan of patient treated at CCB (top panels) and at EMORY (bottom panels). On the left panels, dose distributionscomputed with clinical TPS and FRED are shown. PTV (black solid line) and 95% isodose (blue dashed line) are delineated. The corresponding dose profiles and DVHs areshown in top-right and bottom-right panels, respectively.
Frontiers in Physics | www.frontiersin.org January 2021 | Volume 8 | Article 56730015
Gajewski et al. FRED MC for Proton Therapy
indication for medical physicists to revise the treatment planoptimization or to perform additional experimental validation,when the results deviate from the predictions of TPS exceedingacceptance criteria. The time performance of FRED enables to obtainthis information within about 2.5 min. FRED is currently adapted tobe executed as a stand-alone library, which will enable its easyintegration with commercial TPS (eg, Eclipse or RayStation) anddedicated software tools for patient QA (eg, MyQAion).
Schiavi et al. [34] reported that simulation of dose deposition ina water phantom induced by 106 primary protons can be reducedfrom 22min required by FLUKA MC code to 0.5 s whenemploying FRED running on two GPU modules [34]. Regardingdose distribution simulation in patients, Grassberger, AnthonyLomax, and Paganetti [33] reported that the patient simulation forthe head and neck took 371 min (106 primaries simulated) onsingle CPU using TOPAS (Geant4), which corresponds to atracking rate of 45 p+/s, whereas the average tracking rateobtained with FRED is 2.9 × 10⁵ p+/s in patient CT rescaled to1.5 × 1.5 × 1.5 mm3 using twoGPUs. The time performance resultspresented in this article can be linearly scaled as a function of thenumber of GPU cards applied [34]. Note that the simulation timedepends on the number of primaries simulated per pencil beam,tumor depth (i.e. the beam energy), and scoring resolution used forthe simulation. The most accurate dose calculations in tissueheterogeneities can be obtained performing the simulation inoriginal CT grid. In order to achieve the statistical uncertaintybelow 1% on CT grid used at CCB 0.7 × 0.7 × 1.2 mm3, 105
primaries per pencil beam should be simulated. The averagesimulation time for the patient group investigated in Section3.4 in original CT resolution is 31.8161.8
3.5 (σ � 23.8) min.The clinical application of proton therapy and development of
new treatment protocols, for example, studies on the reduction ofsafety margins accounting for treatment plan robustness, requiretreatment planning studies that can only be performed analyzingseveral treatment planning approaches. The total simulation timeof all 122 patient cases shown in Section 3.4 was about 5 h. Anexample study of 10 possible treatment planning approaches onour patient group could be performed using FRED within about
two days of simulation. Another application is robustoptimization of treatment plans, that is, particularly relevantfor treatment planning of moving targets, when several dosedistributions must be computed on 4D CT. Performing suchstudies without the time performance offered by FRED would notbe possible with any general purpose MC code in reasonable time.
In addition to its clinical applications, the time performance ofFRED enables preparation of the proton beam model faster withrespect to a general purpose MC codes. This is particularly usefulwhen a new beam model must be implemented in the clinicalroutine due to technical modifications or maintenance ataccelerator. When the facility beam commissioningmeasurements are available, the GPU acceleration offered byFRED allows to parametrize the beam model within about 12 h,requiring minimal manual interventions. This potentially enableseasy and quick use of FRED for research and patient QA purposesin most of the proton facilities with little experimental efforts.
5 CONCLUSION
In this article, we share our experience on commissioning andvalidation of GPU-accelerated MC code FRED based oncommissioning measurements of two proton beam therapyfacilities of different beam line design: CCB (Krakow) from IBAand EMORY (Atlanta) from Varian. FRED passed acceptance testsrequired to approve TPS for clinical use. The approach we usedcombines the application of a new GPU-accelerated MC code,implementation of two proton beam lateral beam propagationmodels, automated beam model optimization method,experimental validation of beam model parameters in ananthropomorphic phantom with and without range shifter, andcomparison of patient treatment plans computed with FRED andclinical TPS in patient CT. Our commissioning and validationresults demonstrate the universal and accurate implementation ofthe physics models in FRED, allowing its flexible applications formedical physics and research purposes. The application of FRED asa secondary MC engine for patient QA in clinical routine is
FIGURE 13 | The parameters characterizing the quality of 122 dose distribution obtained from patient treatment plans computed with clinical TPS (blue) and FRED(red) for small (VPTV < 50 ml), medium (50 ml ≤VPTV < 200 ml), and large (VPTV ≥ 200 ml) PTV. The left panel shows the ratio Dmean/Dp, the middle-left panel shows thehomogeneity index (HI), themiddle-right panel the conformity index (CI), and the right panel shows relative mean square error between a prescribed dose and DVH in PTVcomputed with FRED and clinical TPS (the dark blue area depicts overlapping of two histograms).
Frontiers in Physics | www.frontiersin.org January 2021 | Volume 8 | Article 56730016
Gajewski et al. FRED MC for Proton Therapy
foreseen in Krakow proton facility. FRED is currently used fortreatment planning studies evaluating radiobiologically effectivedose using variable RBE.
DATA AVAILABILITY STATEMENT
The datasets generated during and/or analysed during the currentstudy are available from the corresponding author on reasonablerequest.
AUTHOR CONTRIBUTIONS
JG, MG, AS, ASc, and AR developed the beam model for CCB. JGdeveloped automated beam model library implementation methodand performed data analysis to validate the beam model. JG, MGand ASc developed the emittance and virtual point source modelsfor FRED. JG, NM and AR designed, while JG, MG, NM, AR, MRperformed validation experiments with proton beams at CCB. JGperformed data analysis of experiments. KC, NK and MPNsupported data analysis. RK provided access to beam modelcommissioning and validation data from CCB. JG participated incommissioning measurements in CCB. CC and LL providedcommissioning, validation, and patient data from EMORY. JGimplemented beam model for EMORY and performed analysisof validation and patient data. RK and EP provided access to patientdata from CCB. KK andMR exported the patient data from clinical
TPS. MG and JG performed simulations and analysis of patientdata. ASc and VP developed andmade substantial improvements inFRED source code required to enable presented studies. MD, IR, ES,and FT provided expertise in beam modeling and medical physics.JG prepared all figures. JG and AR designed the project and draftedthe manuscript. AR acquired funding. All the authors reviewed andapproved the manuscript.
ACKNOWLEDGMENTS
This project is carried out within the Reintegration program of theFoundation for Polish Science cofinanced by the EU under theEuropean Regional Development Fund—grant no. POIR.04.04.00-00-2475/16-00. MG acknowledge the support of InterDokMedproject no. POWR.03.02.00-00-I013/16. This research wassupported in part by computing resources of ACC CyfronetAGH. We acknowledge the support of NVIDIA Corporationwith the donation of the GPU used for this research. Weacknowledge Aleksander Krempa from CCB Krakow protontherapy center for IT support during implementation of this project.
SUPPLEMENTARY MATERIAL
The SupplementaryMaterial for this article can be found online at:https://www.frontiersin.org/articles/10.3389/fphy.2020.567300/full#supplementary-material.
REFERENCES
1. Paganetti H, Jiang H, Parodi K, Slopsema R, Engelsman M. Clinicalimplementation of full Monte Carlo dose calculation in proton beamtherapy. Phys Med Biol 53 (2008) 4825.
2. Saini J, Maes D, Egan A, Bowen SR, James SS, JansonM, et al. Dosimetric evaluationof a commercial proton spot scanning Monte-Carlo dose algorithm: comparisonsagainst measurements and simulations. Phys Med Biol 62 (2017) 7659.
3. Widesott L, Lorentini S, Fracchiolla F, Farace P, Schwarz M. Improvements inpencil beam scanning proton therapy dose calculation accuracy in brain tumorcases with a commercial Monte Carlo algorithm. Phys Med Biol 63 (2018)145016. doi:10.1088/1361-6560/aac279
4. Tommasino F, Fellin F, Lorentini S, Farace P. Impact of dose engine algorithmin pencil beam scanning proton therapy for breast cancer. Phys Med: Eur J MedPlants 50 (2018) 7–12. doi:10.1016/j.ejmp.2018.05.018
5. Paganetti H. Range uncertainties in proton therapy and the role of Monte Carlosimulations. Phys Med Biol 57 (2012) 99–117. doi:10.1088/0031-9155/57/11/R99
6. Langner UW, Mundis M, Strauss D, Zhu M, Mossahebi S. A comparison of twopencil beam scanning treatment planning systems for proton therapy. J ApplClin Med Phys 19 (2018) 156–63. doi:10.1002/acm2.12235
7. Chang CW, Huang S, Harms J, Zhou J, Zhang R, Dhabaan A, et al. Astandardized commissioning framework of Monte Carlo dose calculationalgorithms for proton pencil beam scanning treatment planning systems.Med Phys (2020) doi:10.1002/mp.14021
8. Trnková P, Knäusl B, Actis O, Bert C, Biegun AK, Boehlen TT, et al. Clinicalimplementations of 4D pencil beam scanned particle therapy: report on the 4Dtreatment planning workshop 2016 and 2017. Phys Med 54 (2018) 121–30.doi:10.1016/j.ejmp.2018.10.002
9. Guterres Marmitt G, Pin A, Ng Wei Siang K, Janssens G, Souris K, Cohilis M,et al. Platform for automatic patient quality assurance via Monte Carlo
simulations in proton therapy. Phys Med 70 (2020) 49–57. doi:10.1016/j.ejmp.2019.12.018
10. Fracchiolla F, Lorentini S, Widesott L, Schwarz M. Characterization andvalidation of a Monte Carlo code for independent dose calculation inproton therapy treatments with pencil beam scanning. Phys Med Biol 60(2015) 8601–19. doi:10.1088/0031-9155/60/21/8601
11. Winterhalter C, Fura E, Tian Y, Aitkenhead A, Bolsi A, Dieterle M, et al.Validating a Monte Carlo approach to absolute dose quality assurance forproton pencil beam scanning. Phys Med Biol 63 (2018) doi:10.1088/1361-6560/aad3ae
12. Johnson JE, Beltran C, Wan Chan Tseung H, Mundy DW, Kruse JJ, Whitaker TJ,et al. Highly efficient and sensitive patient-specific quality assurance for spot-scanned proton therapy. PloS One 14 (2019) doi:10.1371/journal.pone.0212412
13. Zhu XR, Li Y, Mackin D, Li H, Poenisch F, Lee AK, et al. Towards effective andefficient patient-specific quality assurance for spot scanning proton therapy.Cancers 7 (2015) 631–47. doi:10.3390/cancers7020631
14. Matter M, Nenoff L, Meier G, Weber DC, Lomax AJ, Albertini F. Alternativesto patient specific verification measurements in proton therapy: a comparativeexperimental study with intentional errors. Phys Med Biol 63 (2018) doi:10.1088/1361-6560/aae2f4
15. Battistoni G, Boehlen T, Cerutti F, Chin PW, Esposito LS, Fassò A, et al.Overview of the FLUKA code. Ann Nucl Energy 82 (2015) 10–8. doi:10.1016/j.anucene.2014.11.007
16. Allison J, Amako K, Apostolakis J, Araujo H, Dubois PA, Asai M, et al. Geant4developments and applications.Nuclear Science, IEEE Trans Nucl Sci 53 (2006)270–8. doi:10.1109/TNS.2006.869826
17. Jarlskog CZ, Paganetti H. Physics settings for using the Geant4 toolkit inproton therapy. Nuclear Science, IEEE Transactions on Nuclear Science 55(2008) 1018–25.
18. Henkner K, Sobolevsky N, Jäkel O, Paganetti H. Test of the nuclear interactionmodel in SHIELD-HIT and comparison to energy distributions fromGEANT4. Phys Med Biol 54 (2009) N509.
Frontiers in Physics | www.frontiersin.org January 2021 | Volume 8 | Article 56730017
Gajewski et al. FRED MC for Proton Therapy

19. Jan S, Santin G, Strul D, Staelens S, Assié K, Autret D, et al. GATE: a simulationtoolkit for PET and SPECT. Phys Med Biol 49 (2004) 4543.
20. Jan S, Benoit D, Becheva E, Carlier T, Cassol F, Descourt P, et al. Gate V6: amajor enhancement of the GATE simulation platform enabling modelling ofCT and radiotherapy. Phys Med Biol 56 (2011) 881.
21. Sarrut D, Bardiès M, Boussion N, Freud N, Jan S, Létang J, et al. A review of theuse and potential of the GATE Monte Carlo simulation code for radiationtherapy and dosimetry applications.Med Phys 41 (2014) 64301. doi:10.1118/1.4871617
22. Perl J, Shin J, Schumann J, Faddegon B, Paganetti H. TOPAS: an innovativeproton Monte Carlo platform for research and clinical applications. Med Phys39 (2012) 6818–37. doi:10.1118/1.4758060
23. Testa M, Schümann J, Lu HM, Shin J, Faddegon B, Perl J, et al. Experimentalvalidation of the TOPAS Monte Carlo system for passive scattering protontherapy. Med Phys 40 (2013) 121719. doi:10.1118/1.4828781
24. Jia X, Schümann J, Paganetti H, Jiang SB. GPU-based fast Monte Carlo dosecalculation for proton therapy. Phys Med Biol 57 (2012) 7783–97. doi:10.1088/0031-9155/57/23/7783
25. Qin N, Botas P, Giantsoudi D, Schuemann J, Tian Z, Jiang SB, et al. Recentdevelopments and comprehensive evaluations of a GPU-based Monte Carlopackage for proton therapy. Phys Med Biol 61 (2016) 7347.
26. Giantsoudi D, Schuemann J, Jia X, Dowdell S, Jiang S, Paganetti H. Validationof a GPU-based Monte Carlo code (gPMC) for proton radiation therapy:clinical cases study. Phys Med Biol 60 (2015) 2257.
27. Wan Chan Tseung H, Ma J, Beltran C. A fast GPU-based Monte Carlosimulation of proton transport with detailed modeling of nonelasticinteractions. Med Phys 42 (2015) 2967–78. doi:10.1118/1.4921046
28. Mein S, Choi K, Kopp B, Tessonnier T, Bauer J, Ferrari A, et al. Fast robust dosecalculation on GPU for high-precision 1H, 4He, 12C and 16O ion therapy: theFRoG platform. Sci Rep 8 (2018) 14829. doi:10.1038/s41598-018-33194-4
29. Choi K, Mein SB, Kopp B, Magro G, Molinelli S, Ciocca M, et al. FRoG - a newcalculation engine for clinical investigations with proton and carbon ion beamsat cnao. Cancers 10 (2018) doi:10.3390/cancers10110395
30. Ma CMC, Chetty IJ, Deng J, Faddegon B, Jiang SB, Li J, et al. Beam modelingand beam model commissioning for Monte Carlo dose calculation-basedradiation therapy treatment planning: report of AAPM Task Group 157.Med Phys 47 (2020) e1–e18. doi:10.1002/mp.13898
31. Parodi K, Mairani A, Brons S, Hasch BG, Sommerer F, Naumann J, et al.Monte Carlo simulations to support start-up and treatment planning ofscanned proton and carbon ion therapy at a synchrotron-based facility.Phys Med Biol 57 (2012) 3759.
32. Grevillot L, Bertrand D, Dessy F, Freud N, Sarrut D. A Monte Carlo pencilbeam scanning model for proton treatment plan simulation using GATE/GEANT4. Phys Med Biol 56 (2011) 5203.
33. Grassberger C, Lomax A, Paganetti H. Characterizing a proton beam scanningsystem for Monte Carlo dose calculation in patients. Phys Med Biol 60 (2015)633. doi:10.1088/0031-9155/60/2/633
34. Schiavi A, Senzacqua M, Pioli S, Mairani A, Magro G, Molinelli S, et al. Fred: aGPU-accelerated fast-Monte Carlo code for rapid treatment plan recalculationin ion beam therapy. Phys Med Biol 62 (2017) 7482–504. doi:10.1088/1361-6560/aa8134
35. Winterhalter C, Aitkenhead A, Oxley D, Richardson J, Weber DC, MacKay RI,et al. Pitfalls in the beam modelling process of Monte Carlo calculations forProton pencil beam scanning. Br J Radiol (2020) 20190919. doi:10.1259/bjr.20190919
36. Schneider U, Pedroni E, Lomax A. The calibration of CT Hounsfield units forradiotherapy treatment planning. Phys Med Biol 41 (1996) 111.
37. Varian Medical System Inc. Proton algorithm reference guide (Eclipse). Tech.Rep. August, Varian Medical Systems, Inc., Palo Alto (2013)
38. ICRU. Report 90: Key data for ionizing-radiation dosimetry: measurementstandards and applications. J Int Comm Radiation Units Measure 14 (2016)1–118. doi:10.1093/jicru/ndw029
39. Zhu RX, Poenisch F, Lii M, Sawakuchi GO, Titt U, Bues M, et al.Commissioning dose computation models for spot scanning proton beamsin water for a commercially available treatment planning system.Med Phys 40(2013) 041723. doi:10.1118/1.4798229
40. Langner UW, Eley JG, Dong L, Langen K. Comparison of multi-institutionalVarian ProBeam pencil beam scanning proton beam commissioning data.J Appl Clin Med Phys 18 (2017) 96–107. doi:10.1002/acm2.12078
41. Almhagen E, Boersma DJ, Nyström H, Ahnesjö A. A beam model for focusedproton pencil beams. Phys Med 52 (2018) 27–32. doi:10.1016/j.ejmp.2018.06.007
42. Twiss RQ, FrankNH. Orbital stability in a proton synchrotron. Rev Sci Instrum20 (1949) 1–17. doi:10.1063/1.1741343
43. Bortfeld T. An analytical approximation of the Bragg curve for therapeuticproton beams. Med Phys 24 (1997) 2024. doi:10.1118/1.598116
44. [Dataset]Gajewski J. Bragg peak analysis (2017)45. Nelder JA, Mead R. A simplex method for function minimization. Comput J 7
(1965) 308–13. doi:10.1093/comjnl/7.4.30846. Lin L, Ainsley CG, Mertens T, De Wilde O, Talla PT, McDonough JE. A novel
technique for measuring the low-dose envelope of pencil-beam scanning spotprofiles. Phys Med Biol 58 (2013) doi:10.1088/0031-9155/58/12/N171
47. Lin L, Huang S, Kang M, Solberg TD, McDonough JE, Ainsley CG. TechnicalNote: validation of halo modeling for proton pencil beam spot scanning using aquality assurance test pattern. Med Phys 42 (2015) 5138–43. doi:10.1118/1.4928157
48. Low DA, Harms WB, Mutic S, Purdy JA. A technique for the quantitativeevaluation of dose distributions. Med Phys 25 (1998) 656–61. doi:10.1118/1.598248
49. Biggs S, Jennings M. PyMedPhys python package (2019)50. Albertini F, Casiraghi M, Lorentini S, Rombi B, Lomax AJ. Experimental
verification of IMPT treatment plans in an anthropomorphic phantom in thepresence of delivery uncertainties. Phys Med Biol 56 (2011) 4415–31. doi:10.1088/0031-9155/56/14/012
51. ICRU. Report 83. Prescribing, recording, and reporting photon-beamintensity-modulated radiation therapy (IMRT). J Int Commission RadiationUnits Measure 10 (2010) 112.
52. Pathak P, Vashisht S. A quantitative analysis of intensity-modulated radiationtherapy plans and comparison of homogeneity indices for the treatment ofgynecological cancers. J Med Phys 38 (2013) 67–73. doi:10.4103/0971-6203.111309
Conflict of Interest: The authors declare that the research was conducted in theabsence of any commercial or financial relationships that could be construed as apotential conflict of interest.
Copyright © 2021 Gajewski, Garbacz, Chang, Czerska, Durante, Krah, Krzempek,Kopec, Lin, Mojzeszek, Patera, Pawlik-Niedzwiecka, Rinaldi, Rydygier, Pluta,Scifoni, Skrzypek, Tommasino, Schiavi and Rucinski. This is an open-accessarticle distributed under the terms of the Creative Commons Attribution License(CC BY). The use, distribution or reproduction in other forums is permitted,provided the original author(s) and the copyright owner(s) are credited and thatthe original publication in this journal is cited, in accordance with accepted academicpractice. No use, distribution or reproduction is permitted which does not complywith these terms.
Frontiers in Physics | www.frontiersin.org January 2021 | Volume 8 | Article 56730018
Gajewski et al. FRED MC for Proton Therapy