commodity economics division, economic research
TRANSCRIPT

Industrial Uses of Agricultural Materials Situation and Outlook. Commodity Economics Division, Economic Research Service, U.S. Department of Agriculture, December 1993, IUS-2.
Contents Page
. . . . . . . . . . . . . . . . . . . . . . . . . . . . . . . . . . . . . . . . . . . . . . . Introduction 4 Current Macroeconomic and Industrial Outlook . . . . . . . . . . . . . . . . . . . . 7 Starches and Sugars 10 Fats and Oils . . . . . . . . . . . . . . . . . . . . . . . . . . . . . . . . . . . . . . . . . . . . . . 13 Natural Fibers . . . . . . . . . . . . . . . . . . . . . . . . . . . . . . . . . . . . . . . . . . . . . 19 Animal Products . . . . . . . . . . . . . . . . . . . . . . . . . . . . . . . . . . . . . . . . . . . 22 Forest Products . . . . . . . . . . . . . . . . . . . . . . . . . . . . . . . . . . . . . . . . . . . . 24 Specialty Plant Products . . . . . . . . . . . . . . . . . . . . . . . . . . . . . . . . . . . . . . 28 Special Article:
The Feasibility of Producing Biodiesel in the United States Using a Community-Based Facility . . . . . . . . . . . . . . . . . . . . . . : . . . . . . . . . . . . . 30
List of Tables . . . . . . . . . . . . . . . . . . . . . . . . . . . . . . . . . . . . . . . . . . . . . . 35
Coordinators
Lewrene Glaser Douglas Beach
Voice (202) 219-0085, Fax (202) 219-0042
Contributors
Douglas Beach Gregory Gajewski David Torgerson Arthur Wiese Irshad Ahmed, Inst. for Local Self-Reliance Ronald Babula
Statistical Support David Johnson, (202) 219-0085
Graphics, Table Design, and Layout Wynnice P. Napper, (202) 219-0884
Lewrene Glaser David Pace, Univ. of Kentucky Alan Weber, Univ. of Missouri Donald Van Dyne, Univ. of Missouri David Harvey Thomas Marcin, Forest Service
Word Processing, Design, and Layout Diana L. Claytor, (202) 219-0085
Approved by the World Agricultural Outlook Board. 22, 1994. Summaries and text may be accessed electroni- Summary released December 15, 1993. The next cally through the USDA CID System; for details, call summary of Industrial Uses of Agricultural Materials (202) 720-5505. See back cover for subscription Situation and Outlook is scheduled for release on June information.
Acknowledgements
This report was made possible only through the active support of many people and organizations. The June and December 1993 issues were primarily funded by contributions from the Department of Energy's Office of Industrial Technologies, USDA's Alternative Agricultural Research and Commercialization Center, and USDA's Cooperative State Research Service, Office of Agricultural Materials. Thomas Marcin, an economist from USDA's Forest Service, wrote a section of the report. Donald Van Dyne, Professor of Economics at the University of Missouri, and Irshad Ahmed, Senior Research Engineer of Biochemical Technologies of tlle Institute for Local Self-Reliance (Washington, DC), made strong contributions to this report.
Mention of private f i r m sor products does not indicate endorsement by USDA.
Industrial Uses/IUS-2/December 19932

Summary
U.S. agriculture likely will have substantial excess capacity for the foreseeable future. However, technological break- throughs, heightened environmental awareness, and tougher environmental regulations are creating opportuni- ties to use this capacity to produce industrial products.
A host of Federal programs are working in partnership with the private sector to develop these opportunities. For example, scientists from USDA's Agricultural Research Service (ARS) have entered into Cooperative Research and Development Agreements with private firms t o commer- cialize ARS research. The newly created USDA Alterna- tive Agricultural Research and Commercialization Center provides seed capital to help private firms bridge the gap between research and commercialization. USDA's Cooperative State Research Service, Office of Agricultural Materials, helps develop and commercialize agriculturally based industrial products and processes by funding univer- sity research teams and forming product-oriented consortia designed to leverage Federal investments in biobased technologies. Biomass conversion and utilization efforts within the Department of Energy focus on the production of biofuels and related chemicals.
An accelerating but moderate recovery means solid U.S. economic growth in 1994. Most analysts expect that inflation-adjusted Gross Domestic Product will grow about 3 percent next year. Business spending on plant and equipment and, recently, consumer spending on housing and durable goods have led overall GDP growth. Eco- nomic growth in 1994 will give a lift to m'my agricultural producers selling to the industrial sector. Inflation and interest rates are expected to remain low, although picking up slightly.
The carbon monoxide provisions of the 1990 Clean Air Act Amendments were implemented last winter and the resulting demand for oxygenates, primarily corn-based fuel ethanol and natural gas-based methyl tertiary butyl ether, was much lower than expected. Nevertheless, oxygenate demand increased dramatically. Although cornstarch dominates the industrial starch market, wheat starch is also used to manufacture industrial products. Roughly 2 to 3 percent of the 2.5-billion-bushel domestic wheat crop will be used industrially.
The United States has imported castor oil since domestic production ceased in 1972. Because of widely fluctuating world supplies, major castor oil buyers have expressed an interest in U.S. production. In response, Browning Seed, Inc., and National Sun Industries are working with scien- tists and farmers to reestablish castor as a domestic crop. In addition, a consortium of industrial, university, and government organizations has come together to commer- cialize lesquerella, an experimental crop. Castor and lesquerella are sources of hydroxy fatty acids used by industry in a variety of applications, including cosmetics, waxes, nylons, plastics, coatings, and lubricants.
Glycerine is a byproduct of producing soaps, fatty acids, and fatty alcohols from vegetable oils and animal fats. It has over 1,500 commercial applications, including drugs, cosmetics, resins, polymers, and explosives. The world market for glycerine has fluctuated in recent years. In 1993, expected supplies did not develop while demand remained strong, causing producers to raise their prices. The outlook for the glycerine market is uncertain. Future supply increases may be met by an equally large growth in demand.
The 1993 kenaf harvest has been completed in Louisiana and is underway in California, Mississippi, and Texas. Harvested acreage is estimated at about 3,800 acres. Kenaf processors continue their search for new markets--promising areas include seeding mats and oil-absorbent materials.
In the United States, flax is the most extensively used nonwood fiber employed in papermaking, except for cotton. Because of its long slender fibers, flax pulp is ideal for the production of thin strong papers, such as cigarette, airmail, bible, and light-weight bond papers.
Animal byproducts are used to manufacture pharmaceutic- als with a wide range of applications. Advances in biotechnology have resulted in the development of transge- nic animals, which may be used as future sources of drugs and organs for human transplants. Chitin--whose most common source is the tough outer shell of shellfish--is used to treat sewage effluent and remove metals from waste water.
U.S. pulp manufacturing is dominated by the kraft process, which uses cllemicals in production and bleaching. However, chlorine use has come under scrutiny by the Environmental Protection Agency. Improvements in mechanical pulping, increased wastepaper utilization, and alternative pulping methods are options available to meet changing market and regulatory conditions.
Over 300 medical devices and more than 40,000 products contain hevea latex. Since the mid-1980's, many people have developed allergic reactions to hevea products. Guayule rubber latex has the potential to be a hypoallerge- nic alternative.
Biodiesel blended with petroleum diesel is being examined as a potential fuel in urban areas to met Clean Air Act standards. But what about using biodiesel on the farm? The special article examines a simulation model that evaluates the feasibility of a community-based 500,000- gallon biodiesel plant in the United States. Soybeans were found to be the most cost-effective feedstock, mainly because the meal is a useful coproduct. Biodiesel costs are heavily dependent upon both the prices paid for the beans and received for the meal. At present, the resulting biodiesel is not competitive with tlle price farmers pay for conventional diesel fuel.
Industrial Uses/IUS-2/December 1993
3
Introduction
Federal Programs Help Develop Biobased Industrial Uses
U.S. agriculture likely will have substantial excess capacity for the foreseeable future. However, technological breakthroughs, heightened environmental awareness, and tougher environmental regulations are creating opportunities to use this capacity to produce industrial products. A host of Federal programs are working to help the private sector take advantage of these opportunities.
In recent years, 15 to 20 percent of U.S. cropland is idled annually by Federal farm programs. At present, much of this land is tied up in the Conservation Reserve Program (CRP) and in rebuilding supplies from the effects of this year's poor harvest. But as supplies are restored and CRP ends, the long-term capacity dilemma will reassert itself. This dilemma involves both agriculture's natural resource endowment and productivity growth relative to demand.
The newly created Alternative Agricultural Research and Commercialization (AARC) Center is now helping a number of public-private ventures bridge the gap between research and commercialization of biobased industrial products. Unique to the AARC Center is a provision for repayment by successful projects. Repayment is typically linked to product sales, so if sales are slow, a firm not strapped for cash in order to meet its repayment obligation.
The United States has a well developed land base, with In its first call for suggested partnerships, the AARC over 340 million acres being cropped on a regular basis Center received more than 400 preproposals requesting and another 30 to 40 million acres readily available for $175 million. While many of the applicants were consid- conversion from less intensive uses, such as pasture, to ered worthy, the AARC Board had less than $10 million intensive cropping. The total number of arable acres has to invest, which limited the number of projects it could changed little over time. support. The funded projects include:
Productivity growth, 1.5 to 2 percent annually, exceeds Ethanol from grasses and other biomass sources-- increases in domestic demand for farm products associated three projects in California, Florida, and Texas; with income and population growth, possibly 1 to 1.5 percent per year. Without other sources of demand Paper pulp from straw--Oregon; growth, excess capacity may grow and resources will leave agriculture. Newsprint from kenaf and recycled fibers--Texas;
Rising exports are one source of demand growth. The North American Free Trade Agreement, the General Agreement on Tariffs and Trade, and U.S. export pro- grams are important efforts to boost demand through improving access to foreign markets. These offer the largest immediate gains in demand for U.S. agricultural products.
Over the long run, however, new uses for agricultural products also promise to expand both domestic and foreign demand for U.S. agriculture goods. Industry has developed some products from agricultural and forestry materials he., biobased feedstocks) over the years, but until recently successes have been few, mainly due to a lack of adequate cost-effective technology. Fortunately, there have been major advances in metabolic engineering, advanced fermen- tation, reactor development, and separations technology that were not available as recently as 5 years ago. These advances are creating new opportunities.
Industrial Uses Receive Attention at USDA
New opportunities for biobased products have received increased attention at USDA. Many agencies are involved. USDA's Office of Energy and Economic Research Service, together with the Colorado School of Mines, have initiated a major study to determine emission effects of ethanol-blended fuels.
Lawn mats from kenaf--California;
Structural composites from kenaf--California;
Furniture parts molded from flaked low-grade lum- ber--Michigan;
A granite-like composite board for furniture, tile, and structural use from soybeans and waste newspaper-- Minnesota;
On-farm composting utilizing animal manure, animal bedding, yard waste, and starch-based biodegradable polymers--Pennsylvania;
Biodegradable films and coatings from wheat starch--Kansas;
Cornstarch-encapsulated pesticides--two projects in Kansas and Missouri;
Nontoxic ethanol-based windshield washer fluid-- Missouri;
Three biodiesel projects: production and processing technology in Kansas, production from animal by- products in Florida, and performance standards in Washington, DC;
Industrial Uses/IUS-2/December 19934
Biodegradable lubricants from crambe and industrial rapeseed oils--Washington;
Biodegradable concrete-release agents from canola and industrial rapeseed oils--Illinois;
High-value industrial chemicals from corn--Washington;
Industrial booms, pads, socks, and other items to clean-up chemical spills from low-grade wool-- Texas;
Biodegradable specialty lubricants and cosmetics from lesquerella oil--California/Arizona; and
Insulation material using milkweed floss--Nebraska.
The third program is being sponsored by USDA's Agricul- tural Research Service (ARS). ARS strongly encourages its scientists to enter into Cooperative Research and Development Agreements (CRADA7s) with private f m s in order to commercialize technology based on their research. These agreements provide the cooperator with the right of first refusal to an exclusive license on patented inventions made under the project. Since the CRADA system was first established in 1986, ARS and the Depart- ment of Energy (DOE) have implemented over 800 agreements. Over the last 4 years, ARS has accounted for over 60 percent of USDA expenditures on new uses.
ARS also helped establish the Biotechnology Research and Development Corporation (BRDC). BRDC is a consor- tium involving ARS, the University of Illinois Biotechnol- ogy Center, and seven stockholders; Agricultural Research and Development Corp., American Cyanamid, Amoco Technology Co., The Dow Chemical Co., Allexion, Inc., Hewlett-Packard Co., and IMCERA. The consortium defines research projects that have market potential and enables industry to enter into high-risk ventures that might otherwise be too risky for a single firm to undertake.
BRDC has licensed ARS patents to encapsulate pesticides within a starch matrix. The resulting granule not only protects the active ingredient from deterioration due to handling or storage, but also provides for controlled release when the pesticide is applied. BRDC and four of its shareholders--American Cyanamid, Dow Chemical, ECOGEN, and Pitman-Moore--are investing $475,000 in the new encapsulation process and the AARC Center is investing an additional $500,000.
USDA's Cooperative State Research Service (CSRS), Office of Agricultural Materials, also sponsors biobased activities. Their mission is to foster the development and commercialization of industrial products and processes for the value-added utilization of agricultural raw materials. The Office of Agricultural Materials works with, and funds, university teams to develop processes to manufac- ture biobased industrial products. Two product-oriented consortia have been formed with non-Federal sources to leverage Federal investments. One is the High Erucic Acid Development Effort (HEADE), consisting of nine
States and ARS. HEADE's goal is to assist the develop- ment and commercial production of industrial rapeseed and crarnbe, crops high in emcic acid. The other is a consor- tium to develop technologies to produce natural rubber and other products from guayule.
CSRS also collaborates with the Department of Defense. In fiscal year 1993, 40 projects were funded under the Advanced Materials From Renewable Resources and the Biodegradable Packaging Programs, including:
Functional fluids--made from rapeseed, crambe, castor, lesquerella, and jojoba oils;
Oil-selective adsorbents--many plant materials, including kenaf, have a natural affinity for oils and can be used as oil-absorbent pillows and booms and in food processing equipment;
Vegetable oil epoxies--naturally occumng fatty acids in many plants can be converted to epoxies for use in high-temperature polymers and adhesives, biode- gradable adhesives, paints, and coatings;
Nylon--development of high performance nylons based on agricultural products;
Biodiesel fuels--facilitation of biodiesel use in selected niche markets;
Natural biocides and biocidal coatings--several natural sources of biocidal materials from present and new crops are being investigated; and
Biodegradable polymers from starch--the goal is to provide the Navy with biodegradable eating utensils and packaging materials for use aboard ships. This will help them comply with the MARPOL Treaty which requires, beginning in 1994, that all materials disposed of at sea be biodegradable.
DOE, NRC, and EPA Also Sponsor Activities
Biomass conversion and utilization research within DOE are centered in the Office of Transportation Technologies (OW, the Ofice of Utility Technologies (OUT), and the Office of Industrial Technologies (OIT). OTT focuses on the produc- tion of biofuels, such as ethanol and biocllesel from lignocel- lulosic feedstocks. OUT concentrates on biomass utilization for electricity generation. OIT focuses on the production of non-fuel related chemicals, such as organic acids and solvents.
One of DOE'S most ambitious efforts is the Alternative Feedstocks Program (AFP). AFP recognizes that world- wide use of biomass for food, feed, and fiber accounts for only 7 percent of total biomass production--a tremendous untapped source of energy. Therefore, this program is targeted at developing processes to produce high-volume chemicals from renewable resources. AFP is working with the agricultural and forestry industries and the research community to develop high-volume chemicals used to manufacture value-added products.
Industrial Uses/IUS-2/December 19935
Environmental considerations should increase the demand for renewable resources. For example, key international companies and industrial organizations recently met in Rotterdam to endorse a set of principles and a charter that will commit them to environmental protection into the 21st century. Also, the 1992 Earth Summit emphasized the need for developing partnerships between countries, industries, and governments to establish a stewardship over the planet's resources and environment.
Moreover, environmental legislation is increasing the costs of traditional processes and, consequently, boosting the attractiveness of biobased alternatives. The Chemical Manufacturer's Association estimated that in 1990, capital expenditures by the chemical industry for pollution abate- ment amounted to $1.68 billion and associated annualized operating expenditures were about $3.83 billion ( I ) . Needless to say, these capital investments coupled with administering applicable laws and regulations have in- creased product prices. Furthermore, there will likely be efforts to pass tougher environmental legislation.
Given these opportunities, the objective of AFP is to develop bio-processes that:
Enhance profitability and competitiveness of U.S. industry,
Give significant savings of energy and imported oil over present technology, and
Serve environmental goals to reduce emissions of greenhouse gases and discharges of hazardous waste.
An initial technical and economic assessment of project opportunities was recently completed through a joint collabo- ration of five DOE national laboratories and an industry panel. Several USDA scientists and managers contributed to the assessment and are providing suggestions on future analyses. Through various partnerships with industry, AFT will develop biobased processes for large-scale industrial production of high-volume intermediate chemicals. Partner- ship opportunities include industry solicitations and CRADA's between firms and DOE researchers.
AFP's first report is entitled The Alterative Feedstocks Program--Technical and Economic Assessment. It con- tains quantitative, comparative, and process analyses and an economic evaluation of the potential costs and benefits of making 70 chemical products from renewable resources. The report also suggests how these products will be incorporated into the chemical industry.
Another objective of AFP is to demonstrate through industry partnerships the commercial feasibility of bio- based processes. AFP managers recommend that two processes be added each year, resulting in a total of 12 under development by the year 2000. Ongoing assess- ments and program reviews will determine future targets- -those technologies of investment grade quality.
Classes of products that could have the biggest potential impact on commodity chemical production were chosen
and specific examples for further development within each class were considered. For example:
Organic acids--succinic acid will be processed from corn syrups, which provides an opportunity to demonstrate the feasibility of producing a commodity chemical from renewable resources, and
Cellulosic materials--the clean fractionation of bio- mass is a process being developed that allows sepa- rating lignocellulosic material into its three primary components--cellulose, hemicellulose, and lignin-- more cleanly than current technologies.
A complementary program within OIT is the Biological and Chemical Technologies Research Program. This applied research and development program provides enabling technology for new industrial chemical and biological processes. A primary focus of the research is to resolve process limitations in converting renewable resources to chemical feedstocks.
The National Research Council W C ) has recently begun an analysis of biobased industrial materials. NRC believes the lack of a realistic assessment of key research areas and their commercial viability is preventing the adoption and utilization of many biobased technologies. So, NRC has assembled a committee of experts to address key aspects of researching and commercializing biobased products. The committee is preparing a report designed to provide guidance for future actions by government, industry, and academia. The major sponsors of this study include DOE, USDA, and the National Science Foundation.
In addition, USDA, DOE, and the Environmental Protec- tion Agency entered into a memorandum of understanding in October to establish the AgSTAR program. AgSTAR, a voluntary program, encourages the widespread use of methane recovery technologies to increase livestock produ- cers' profits and demonstrate that industrial and environ- mental interests can work together to achieve common goals. AgSTAR participants will be able to cut their energy bills and get extra income from manure byproducts. The program will establish demonstration projects, work on improving technology transfer, and facilitate workable financial packages for participants.
To recap, there are a host of Federal efforts to develop biobased industrial products. The goal is to create de- mand-driven needs for farm-based industrial products that will enhance the profitability and competitiveness of U.S. agriculture and industry, save energy and cut use of imported oil, and serve environmental goals. Douglas Beach and Gregory Gajewski (202) 219-0085]
1. Bozell, Joseph J. and Ron Landucii, editors. The Alternative Feedstocks Program: Technical and Economic Assessment. Prepared for the U.S. Depart- ment of Energy, Office of Industrial Technologies by Argonne National Laboratory, Idaho National Labo- ratory, National Renewable Energy Laboratory, Oak Ridge National Laboratory, and Pacific Northwest Laboratory, July 1993.
Industrial Uses/IUS-2/December 19936

Current Macroeconomic and lndustrial Outlook
Modest U.S. Economic Growth Ahead for 1994
An accelerating but moderate recovery means solid U. S. economic growth for 1994. This will give a lift to many agricultural producers selling to the industrial sector--especially for goods going to housing, industrial equipment, and consumer durables. Inflation and interest rates are expected to remain low, although picking up slightly.
Most analysts expect that inflation-adjusted Gross Domes- tic Product (GDP) will grow at about a 3-percent annual rate in 1994. They have revised forecasts upward after seeing surprisingly good third quarter growth, 2.7 percent, even after adjusting for the impacts of the Midwestern flood. An improved fourth quarter, with GDP growth well above 3 percent, is foreseen. The strong growth in employment and industrial production in October and November have led many analysts to expect 4-percent GDP growth in the last quarter of 1993. Few anticipate growth as high as the 5.7-percent gain of 1992's fourth quarter, however.
Analysts see a slightly higher than 4-percent annual growth in industrial production (figure 1) for 1993. Although faster growth will increase employment, the unemployment rate will decline erratically as individuals are coaxed back into the labor force in particular months. Rural unemployment is likely to remain close to urban rates for the fourth quarter of 1993. Many analysts expect continued growth in manufacturing employment in Decem- ber and into 1994, consistent with strong growth in industrial production.
Moderate employment growth and low industrial-capacity use coupled with strong business investment have kept inflation near 2 percent for overall producer prices and under 3 percent for consumer prices for 1993. Despite some initial concern about the impact of the Midwestern
Figure 1
Industrial Production Percent change form previous year 8
flood on inflation, 1993 has been a year of low inflation. Interest rates are expected to rise slightly in the last quar- ter. They still remain very low by historical standards, leaving 1993 average rates well below those of 1992. Most analysts expect only a modest increase in inflation in 1994. A few analysts, however, are projecting lower inflation in 1994 due to the sharp drop in oil prices at the end of 1993.
Business spending on plant and equipment and, recently, consumer spending on housing and durable goods have led overall GDP growth during the last few months. In the third quarter of 1993, business investment rose over 10 percent from a year ago. Further, after starting slowly, housing starts are expected to be up 10 percent in 1993 over 1992 and then rise another 8 to 9 percent in 1994. Residential investment for the third quarter was up 5.4 percent from a year ago.
The growth in 1993 was hampered by two major factors: declining Federal spending, particularly on defense, and a sharply increasing trade deficit brought on by stagnant exports and the usual growth in imports as U.S. income increased. The stagnant Japanese economy, the Canadian recession, and a mild decline in the German economy accounted for weak exports, despite a weakening dollar.
The Key to 1994 Is Low Interest Rates
The key to the outlook for 1994 is higher, but still low, interest rates. The consensus has short-term rates rising from 60 to 100 basis points (10 basis points is 0.1 per- centage points) above 1993 and long-term rates rising between 40 to 80 basis points. As short-term rates have been flat and long-term rates have taken an unanticipated dive during August to October, most see an average T-bill rate of about 3.8 percent for 1994. Yle 10-year bond rate is forecast to be about 6 percent by the end of 1993. The 10-year bond yield will rise slightly to make the projected 6.5-percent yield average for 1994. By recent historical standards, these low rates will give strength to the contin- ued recovery.
-2 Why will interest rates remain low? Most analysts note that (1) inflation and inflation expectations have abated;
-4 (2) growth in Germany and Japan are expected to be about 1 and 2 percent, respectively; (3) the budget accord has
-6 credibly reduced out-year deficits and, thus, future demand 1986 87 88 89 90 91 92 93 for credit; and (4) while increasing more than in 1993,
Industrial Uses/IUS-2/December 19937

U.S. growth will not likely induce a sharp expansion in credit demand. Despite some concern about a resurgence of inflation, recent modest wage growth, low but increas- ing capacity utilization, strong business investment that indicates future productivity improvement, and slow world growth will likely keep inflation from accelerating.
While business investment was strong throughout 1993, consumer spending is likely to grow at the same rate as GDP, since consumers have used lower interest and mortgage rates to reduce monthly payments--leaving more spendable income. In recent months, consumers have been willing to take on additional non-mortgage debt, contrary to earlier in the recovery. This suggests moder- ate-to-good growth into 1994 for sales of consumer goods. Continued low interest rates lead most analysts to expect strong growth in consumer durables, with continued good- to-strong growth in auto sales and parts, consumer textiles, and furniture. Government purchases are expected to decline modestly in 1994. The trade deficit will be a drag on U.S. economic growth in 1994, exacerbated by an expected small appreciation of the dollar.
Cost increases are slated to be small in 1994. Low interest rates should keep interest expenses down, and will present opportunities to expand production cheaply. Wage increases have been modest, and with a relatively high unemployment rate, are not likely to accelerate. Unit labor costs in manu- facturing should be flat in 1994. The strong investment we have seen suggests good productivity growth in 1994.
Most analysts expect the downsizing of the last 2 years to continue, albeit at a slower pace, as large companies restructure to become more competitive. Industrial production and capacity should move up faster than in 1992 and early 1993. Employment in relatively high-wage manufacturing should continue to rise. So, the pace of the recovery will likely pick up.
With consumption picking up, investment will not have to be the major engine driving growth. The recovery up to mid-1993 had extremely strong growth in business plant and equipment investment. Since then, housing and consumer spending on durables have come in as secondary factors. The typical recovery would have housing starts and consumer durables leading the economy, with business investment picking up sometime thereafter. Most analysts expect to see a pattern more like this in 1994.
Declines in Government Spending and Exports Drag Down Growth?
From the third quarter of 1991 through the third quarter of 1993, spending on defense goods and services fell almost 14 percent (figure 2). while overall and Federal purchases declined 8.3 percent. Most analysts expect this drop to continue, albeit at a slower rate. They also anticipate that lower Federal government spending in 1994 will be the largest drag on economic growth.
This year, net exports have dropped dramatically through the first three quarters, leading some analysts to expect the trade deficit to severely hamper U.S. GDP growth in 1994.
Figure 2
Production of Defense and Space Equipment Percent change from previous year 15
The answer to their concern lies in world economic recov- ery. An expected modest recovery by our trading partners will likely raise U.S. exports enough to prevent the trade deficit from increasing as sharply as it did in 1993. Given the dollar's value, many American manufactured goods are priced very competitively relative to foreign goods of comparable quality. If foreign income increases, more U.S. goods will be exported. This will mitigate the expected rise in imports, which comes with growth in U.S. income.
U.S. export growth slowed in 1992 and stagnated in 1993. A large surge in imports led to a large trade deficit in the United States. Although the foreign-exchange value of the dollar remains low and has risen slightly since the begin- ning of the year--keeping U.S. exports competitive in foreign markets--economic growth abroad has slowed sub- stantially. The developed economies, excluding the United States, have hardly grown. So, were it not for some pickup in our exports to less-developed countries, U.S. exports would have declined instead of stagnated. Large growth in imports, because of strong growth in consumer demand, and no growth in exports has resulted in three consecutive quarters of rising trade deficits--starting with $60 billion in the first quarter of 1993 and expanding further to $80 billion in the third quarter.
The very modest growth expected in developed countries other than the United States implies a modest upturn in U.S. exports in -1994. This will likely be enough to keep the trade deficit from being as large a drag on U.S. growth as it was in 1993. But the deficit probably will be a drag, nonetheless. With growth in Japan expected up 2 percent and Germany expected up only 1 percent, U.S. export growth will likely be muted and, because of expected high imports, the trade deficit will increase moderately in 1994. Agricultural exports in 1993194 are forecast at $42.5 billion, virtually unchanged from a year earlier.
Outlook for Industries Using Agricultural Products
Construction governs the demand for many forestry products, particularly lumber. The housing market was hit
Industrial Uses/IUS-2/December 19938

significantly during the recession. Housing starts fell 13 percent in 1990 and 15 percent in 1991. In 1992, housing starts rose 18 percent, and most analysts expect them to rise an additional 10 percent by the end of 1993. Other indicators suggest a continued rebound in construction activity. For example, building permits--an indicator of future construction activity--rose 12 percent for the 12 months ending in September. Continued relatively low long-term interest rates should prove beneficial for further growth in the housing market, which will boost the demand for lumber and related forestry products. Most housing analysts forecast a continued 8- or 9-percent increase in housing starts in 1994.
This solid growth will fuel the demand for lumber and wood products, and hence the demand for timber. The residential construction industry uses 21 percent of the output from the nation's saw and planing mills. These mills used 89 percent of the timber harvested in 1987.
While the overall demand for petroleum products is forecast to grow at approximately 2 percent in 1994, the increased demand for lubricants is expected to exceed 5 percent. This presents opportunities for industrial oilseeds, such as castor, industrial rapeseed, and crambe. Wholesal- ing and retailing, construction, and domestic petroleum and natural gas production are major industrial users of lubricants (table 1). All but domestic petroleum produc- tion are expected to grow in 1994. Final demand elements also account for significant shares of lubricant use: 27 percent for personal consumption expenditures and 8.8 percent for gross exports. Light vehicle sales are expected to grow by 5.8 percent in 1994 from the previous year.
Plastics are produced from petrochemicals (natural gas liquids and aromatics produced during petroleum refining). Large amounts of plastic products are used in the packag- ing, building and construction, and automobile-parts industries. The pickup in housing construction forecast for 1994, fueled by low long-term interest rates, and the expected strong demand for domestic automobiles through- out 1994, translates into strong demand for plastic prod- ucts and, hence, the petrochemicals from which they are
made. These are market opportunities for businesses selling fats, vegetable oils, and starches as ingredients in or substitutes for plastics.
Petroleum Prices Are Declining
Energy markets are important for industrial markets and for industrial uses of agricultural materials. A sharp rise in the price of oil, for example, would stimulate production of alternatives to petroleum-based fuels and lubricants, includ- ing those derived from agricultural materials. However, the outlook is for lower petroleum prices in 1994.
The price of crude oil is the key determinant of petroleum- based product prices. Weather and world growth are important secondary factors. A common proxy for aggre- gate crude oil prices is the weighted-by-sales cost of crude oil imported into the United States--known as the refiner acquisition cost (RAC).
Table 1--Maior industrial users of lubricants and their projected 1994 growth1/
The most commonly reported prices, such as West Texas intermediate crude oil or the New York Mercantile Ex- change price, will often be $1 per barrel (42 U.S. gallons) more than the RAC. The Energy Information Admini- stration's (EIA) short-term forecast has the RAC averaging $17.13 per barrel in 1993 and $17.18 in 1994. The RAC was $18.20 in 1992 and, in the first half 1993, it was down to $17.67 per barrel.
The late-November OPEC meeting failed to halt the recent decline in crude oil prices. West Texas crude fell from $18.75 per barrel in mid-November. The oil markets either do not believe that OPEC will adhere to agreed upon quotas andor that the world recovery will gather enough momentum to greatly increase the amount of crude de- manded in 1994. As a result, most analysts are expecting that crude oil prices will be about 10 percent lower in 1994 than in 1993--corresponding to EIA's low-price scenario of the RAC averaging about $13 per barrel in 1994. If these analysts are correct, gasoline price should average about $1.20 per gallon and diesel fuel should average about $1.18 in 1994 despite the motor fuel tax increase. [David Torger- son and Arthur Wiese (202) 219-0782]
Industry Share of lubricant use 2/ Expected 1994 growth 31
Coal mining 3.4 +4.1 Crude petroleum
and natural gas 3.9 -4.9 for domestic crude
Construction Primary iron and steel Wholesale and retail trade
+2.0 for domestic natural gas +3.0+3.0 +2.2 for wholesale +2.5 for retail
Automobile repair and service 2.7 N.A. N.A. = Not avaikble. 1/ Based on the U.S. Department of Commerce's 1982 Input-Output Tables and U.S. Industrial Output 1993. 21 Industrial users only, does not include commercial or service industries. 31 From the 1993 base. 9
Industrial Uses/IUS-2/December 19939

Starches and Sugars
Future Demand for Ethanol and Adhesives Depend on Environmental Regulations
Producers are optimistic about ethanol's role in the 1990 Clean Air Act Amendments and are expanding their production capacities. The future of biodegradable polymers depends on government legislation and the development of a composting infrastructure. Given a stable 40-percent market share, natural adhesives and glues have great potential for environmentally friendly products. Roughly 2 to 3 percent of the total wheat crop will be used for industrial prod- ucts in 1993/94, with 1 - to 2-percent annual growth expected through 1996/97,
In the last issue of Industrial Uses of Agricultural Materi- creasing the volatility of gasoline, this could drive up the als Situation and Outlook Repon (June 1993). the com- relative price of ethanol blends, and make it more difficult bined demand for fuel-oxygenate additives (primarily corn- for ethanol to compete in the ozone non-attainment based fuel ethanol and natural gas-based methyl tertiary market. The Environmental Protection Agency (EPA) was butyl ether [MTBE])--as a result of the 1990 Clean Air scheduled to decide on December 15, 1993, whether to Act Amendments (CAM)--was estimated at 3.7 billion grant ethanol mixtures a waiver from the C A M volatility gallons of ethanol equivalent by 1995196, or more than requirements. At press time, the ruling had not been three times current ethanol production. Assuming that announced. corn-based ethanol captures 35 percent of the oxygenated fuels market, the demand for ethanol would reach 1.3 Fuel Ethanol Capacity Increases billion gallons. This would require an additional 123 million bushels of corn for fuel-ethanol production, thus Even with the possible problems facing biobased fuel raising the total use of corn for fuel ethanol to approxi- ethanol in ozone non-attainment markets, ethanol produc- mately 568 million bushels by 1995196. These estimates ers are optimistic about its future. A number of producers depend heavily on ethanol's role in the ozone prevention are raising their ethanol capacities. On July 24, Cargill provisions of the CAAA. broke ground for a $200 million wet-milling corn plant in
Blair, NE, that will go on line in 1995. The plant will The carbon monoxide (CO) provisions of the CAAA were produce a variety of corn products, including ethanol. The implemented last winter and the resulting demand for company already has an ethanol facility and will have a oxygenates was much lower than expected. Estimates of capacity of over 100 million gallons when both sites are MTBE use range between 1.02 and 1.14 billion gallons, operational. Also, last January, Midwest Grain Products far lower than the 1.40 billion-gallon minimum some announced a $40 million expansion in their Pekin, IL, industry sources had expected. There were various facility that will increase their ethanol capacity to over 90 reasons for the lower-than-expected demand. Fist, some million gallons per year%y 1997. cities that were expected to participate in the program did not--for example, Boston, MA; Duluth, MN; Memphis and Currently, over 32 companies produce ethanol through Nashville, TN. Second, most analysts believed that fermentation, with an annual capacity of over 1.37 billion refiners would supply towns and areas surrounding non- gallons. Archer Daniels-Midland is the nation's largest attainment cities with fuels to meet the CO provisions. ethanol producer with a capacity of 700 million gallons. Instead, refiners provided the outlying areas with cheaper Pekin Energy, the second largest fermentation producer, grades that did not meet the provisions. Third, the number has a capacity of 100 million gallons. Other large fermen- of towns surrounding non-attainment cities that voluntarily tation producers include New Energy, 70 million gallons; opted to join the program was much smaller than anticipat- Minnesota Corn Processors, 67 million gallons; South ed. Nevertheless, while total use fell short of expectations, Point, 65 million gallons; A.E. Staley, 50 million gallons; oxygenate demand did increase dramatically due to the and Midwest Grain Processing, 36 million gallons. program.
Biodegradable Polymer Use Depends on Legislation, The second stage of the CAAA is to be implemented in Improved Technology, and Cornposting Infrastructure 1995. It requires reformulated gasoline in the nine worst ground-level ozone areas. Because splash-blended ethanol In 1992, biodegradable polymer resins captured less than may increase evaporative emissions of volatile organic 5 million pounds of the plastics resin market. Provided compounds (VOC's) and ethers like MTBE and ETBE that Congress does not mandate increased biodegradable (ethyl tertiary butyl ether) do not, ethanol blends will polymer use, market penetration into the 8-billion-pound require lower volatility from the gasoline component than nonfood packaging market will likely be quite slow. The ether-gasoline mixtures. Depending on the cost of de- most conservative estimate of biopolymer consumption 0
Industrial Uses/IUS-2/December 199310

puts total demand at roughly 8.4 million pounds of resin in 1995196.
According to industry analysts, the rate of market penetra- tion of biodegradable polymers will depend upon three factors: the speed at which Federal, State, and local governments enact legislation requiring the use of degrada- bles; how quickly the technology is improved and upgrad- ed; and how quickly the industry can develop an adequate infrastructure for the collection and subsequent composting of organic waste materials.
On the legislative front, EPA recently issued guidelines stating that six-pack container rings must disintegrate within 35 days of placement in a marine environment. Also, a Florida law mandates that materials labeled as biodegradable do so within 120 days in a landfill. Howev- er, most of the legislative response has been aimed at funding increased biodegradable polymer research and development. In 1991, Congress passed an initiative mandating exploration of starch-based technologies and potential applications in biodegradable packaging materi- als. (See the Introduction.)
With respect to composting, most manufacturers believe that a composting infrastructure is key to the success of biodegradable packaging. Dr. Narayan at Michigan Biotechnology Institute (MBI) argues that the foodservice industry is especially appealing for biodegradable poly- mers. The industry uses a great deal of plastic packaging daily. Because the plastics are contaminated by food waste, it would require a lot of time and effort to sort and clean the plastics to recycle them. In comparison, food wastes and biodegradable packaging could be collected together, placed in a composting facility, and disposed of in an ecologically friendly way.
Accordingly, MBI created a consortium, Compost Tech, which includes Cargill, Novon, Ecochem, the Minnesota Corn Growers Association, Philip Environmental, and Michigan State University. USDA is providing some basic research funding. The consortium will involve about 17 Burger King restaurants in Grand Rapids, MI, to demonstrate the logistics and economics of composting restaurant waste.
There are two parallel technologies being developed for biobased polymers--one uses starches and the other sugars derived from starch. Currently, the starch-based polymers dominate the industry and are less expensive. Starches are converted to plastic-like materials using a hydraulic, pressurized, mechanical process. However, moisture sensitivity has been a major concern. In comparison, sugar-based polymers make use of a fermentation process to chemically change the sugar directly to a polymer like poly-hydroxbutyrate/valerate or indirectly to lactic acid, which can then be converted into the polymer polylactic acid (PLA). The advantages of sugar-based polymers
include high rigidity, long shelf life, and good moisture resistance.
Prices for most biodegradable resins range anywhere from $2 to $5 per pound. In comparison, petroleum-based alternatives cost between 30 and 50 cents per pound. By the most optimistic estimates, biobased polymers will be at least twice as expensive as their non-degradable coun- terparts in the foreseeable future. Therefore, in the short term, promoters and investors are counting on the envi- ronmental advantage of biodegradable polymers to help drive product demand.
Novon Products, a division of the pharmaceutical giant Warner-Lambert, was the leading U.S. producer of starch- based biopolymers, with the capacity to produce 100 million pounds per year. Novon closed its facility in November 1993 and is now using its equipment for other purposes.
Novon's closure could have an impact on the industry, but there are other manufacturers prepared to step into the market. For example, Archer Daniels-Midland has gone into full-scale production of PLA from corn fermentation and Cargill is planning an $8 million, 10-million-pound- per-year PLA plant that will be operational in February 1994. Cargill will produce polylactic acid from corn and other agricultural products. Ecochem, a partnership between DuPont and ConAgm, is also investing in PLA technology. Ecochem currently operates a $20 million lactic acid plant and is planning a $160 million addition to be built by 1995. Ecochem produces PLA from whey, a byproduct of cheese manufacturing.
A number of other companies are also producing biobased polymers. Uni-Star Industries produces a starch-based polymer that is currently used for loose-fill packaging. And American Excelsior produces a starch-based packag- ing material called Eco-Foam. The leading European producers of biodegradable polymers are Zeneca Bio Products in England (formerly ICI) and Novamont in Italy.
Environmental Concerns Drive the Adhesives Market
As stated in the June 1993 issue of this report, natural adhesives account for over 40 percent, or roughly 2 million tons annually, of total U.S. adhesives demand. Furthermore, the demand for natural adhesives was projected to exceed 2.2 million tons by 1995196. This translates to an additional 600 million pounds of starch by 1995196.
The main difference between natural and synthetic adhe- sives is in their applications. Synthetic adhesives are tougher and generally more water resistant than natural adhesives. However, current environmental concerns over synthetic adhesive systems and accompanying legislation have spurred new technologies using plant-derived starch.
Industrial Uses/IUS-2/December 199311
Many of these new systems are intended for the packaging market.
Continued governmental pressures to reduce VOC emis- sions in adhesives and sealants are driving manufacturers to use formulations containing 100-percent solids, water- borne materials, and other nonvolatile compounds. There is no current or anticipated Federal legislation to cause radical disruption in the market. However, regional and State regulatory agencies will add greater pressure on lowering VOC's in adhesive formulations in the coming years.
Currently, there are over 600 adhesiv~, manufacturers in the United States, producing a variety of both natural and synthetic adhesives and sealants with an estimated market value of over $2 billion annually. H.B. Fuller Company is the leading producer of synthetic adhesives in the United States, while National Starch and Chemical Corporation is the leading producer of natural adhesives. Given a stable 40-percent market share, natural adhesives and glues show great potential for environmentally friendly products.
Industrial Uses of Wheat Starch
Although cornstarch dominates the industrial starch market, wheat starch is also used in manufacturing industrial products, albeit at a much lower level While most of the 2.5-billion-bushel domestic wheat crop produced in 1993194 will be used for food, feed, and seed; the Institute for Local Self-Reliance (ILSR)--a Washing- ton, DC, based non-profit organization--estimates that 50 to 75 million bushels, or roughly 2 to 3 percent of the total crop, will be used for industrial products. ILSR expects a growth rate for existing industrial uses of 1 to 2 percent annually through 1996197.
Also according to ILSR, approximately 3 percent of all fermentation ethanol made in the United States comes from wheat, using about 12 million bushels of wheat each year. Since the late 1980's, industry has been using wheat starch to produce several special grades of biodegradable polymeric resins for plastic applications. Wheat starch is also used in adhesives, building insulations, fertilizers, pesticides, cosmetics, pulp and paper products, pharmaceu- ticals, and drugs. Other industrial opportunities include body powders, nasal sprays, aerogel insulation in refrigera- tors and greenhouses, and dish-washing detergents.
Examples of wheat-based industrial producers are:
Xylan, Inc. (Madison, WI) produces a wide spectrum of g d s from wheat components, including dietary fiber from wheat hulls, vital wheat gluten for the paper industry, and ethanol from the wheat kernel;
Croda (Pasippany, NJ) has recently introduced wheat-based skin care and cosmetic products;
Nature's Answer (Hauppauger, NY) supplies a line of wheat germ and avocado skin-care products. Specific products include wheat-germ body lotion and wheat-germ face cream;and
Midwest Grain Products produces fuel ethanol from wheat and is currently in the process of increasing their fermentation ethanol capacity to over 90 million gallons per year by 1997. The company is also expanding its wheat gluten production facility. Wheat gluten is a high-protein ingredient used extensively in bakery products, pet foods, cereals, and has shown promise for nonfood consumer end-products, Douglas Beach (202) 219-0085 and Irshad Ahmed (202)232-4108]
Industrial Uses/IUS-2/December 199312
Fats and Oils
Agriculture and Industry Explore New Crop and Market Opportunities
Castor and lesquerella, both potential U.S. oilseed crops, are sources of hydroxy fatty acids that are used by industry in a variety of applications. Glycerine markets are tight as expected supplies have not developed and demand remains strong. Biodiesel research and testing continues.
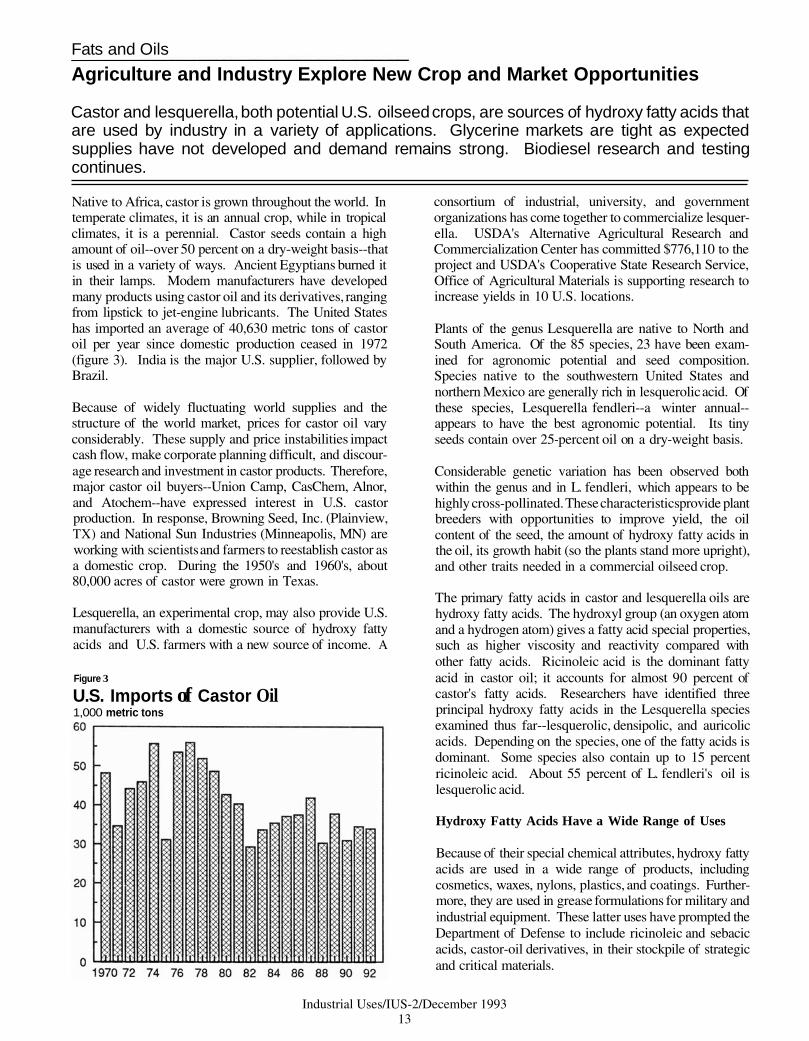
Native to Africa, castor is grown throughout the world. In temperate climates, it is an annual crop, while in tropical climates, it is a perennial. Castor seeds contain a high amount of oil--over 50 percent on a dry-weight basis--that is used in a variety of ways. Ancient Egyptians burned it in their lamps. Modem manufacturers have developed many products using castor oil and its derivatives, ranging from lipstick to jet-engine lubricants. The United States has imported an average of 40,630 metric tons of castor oil per year since domestic production ceased in 1972 (figure 3). India is the major U.S. supplier, followed by Brazil.
Because of widely fluctuating world supplies and the structure of the world market, prices for castor oil vary considerably. These supply and price instabilities impact cash flow, make corporate planning difficult, and discour- age research and investment in castor products. Therefore, major castor oil buyers--Union Camp, CasChem, Alnor, and Atochem--have expressed interest in U.S. castor production. In response, Browning Seed, Inc. (Plainview, TX) and National Sun Industries (Minneapolis, MN) are working with scientists and farmers to reestablish castor as a domestic crop. During the 1950's and 1960's, about 80,000 acres of castor were grown in Texas.
Lesquerella, an experimental crop, may also provide U.S. manufacturers with a domestic source of hydroxy fatty acids and U.S. farmers with a new source of income. A
Figure 3
U.S. Imports of Castor Oil 1,000 metric tons
consortium of industrial, university, and government organizations has come together to commercialize lesquer- ella. USDA's Alternative Agricultural Research and Commercialization Center has committed $776,110 to the project and USDA's Cooperative State Research Service, Office of Agricultural Materials is supporting research to increase yields in 10 U.S. locations.
Plants of the genus Lesquerella are native to North and South America. Of the 85 species, 23 have been exam- ined for agronomic potential and seed composition. Species native to the southwestern United States and northern Mexico are generally rich in lesquerolic acid. Of these species, Lesquerella fendleri--a winter annual-- appears to have the best agronomic potential. Its tiny seeds contain over 25-percent oil on a dry-weight basis.
Considerable genetic variation has been observed both within the genus and in L. fendleri, which appears to be highly cross-pollinated. These characteristics provide plant breeders with opportunities to improve yield, the oil content of the seed, the amount of hydroxy fatty acids in the oil, its growth habit (so the plants stand more upright), and other traits needed in a commercial oilseed crop.
The primary fatty acids in castor and lesquerella oils are hydroxy fatty acids. The hydroxyl group (an oxygen atom and a hydrogen atom) gives a fatty acid special properties, such as higher viscosity and reactivity compared with other fatty acids. Ricinoleic acid is the dominant fatty acid in castor oil; it accounts for almost 90 percent of castor's fatty acids. Researchers have identified three principal hydroxy fatty acids in the Lesquerella species examined thus far--lesquerolic, densipolic, and auricolic acids. Depending on the species, one of the fatty acids is dominant. Some species also contain up to 15 percent ricinoleic acid. About 55 percent of L. fendleri's oil is lesquerolic acid.
Hydroxy Fatty Acids Have a Wide Range of Uses
Because of their special chemical attributes, hydroxy fatty acids are used in a wide range of products, including cosmetics, waxes, nylons, plastics, and coatings. Further- more, they are used in grease formulations for military and industrial equipment. These latter uses have prompted the Department of Defense to include ricinoleic and sebacic acids, castor-oil derivatives, in their stockpile of strategic and critical materials.
Industrial Uses/IUS-2/December 199313
Castor oil is used directly in many products, such as trans- parent soaps, waxes and polishes, hydraulic fluids, inks, and metal drawing oils. However, most castor oil is further processed. The resulting derivatives are used in a wide range of applications. For example, hydrogenated castor fatty acids are an ingredient in lubricating greases for cars, trucks, boats, railcars, aircraft, and industrial equipment. Nylon-1 1 is used in engineering plastics and powder coatings. Dehydrated castor oil and its fatty acids are components of coatings, inks, and sealants. Polyurethanes are used in electrical and telecommunication casting resins and coatings.
Polymer scientists at the University of Southern Mississip- pi have used L. fendleri oil to make urethane foams, wood stains, and alkyd resins, a common component of paints and coatings. Polyurethane foams are frequently used in dashboards, car seats, and similar items.
In addition, the known properties of fatty acids indicate that lesquerella should be a good raw material in other applications. Ricinoleic and lesquerolic acids have similar chemical structures. This means that both common and different products may be derived from the two hydroxy acids. Where higher molecular weights are important for the chemical properties of the products, lesquerolic acid could be superior. For example, precursors for nylon-13 and nylon-1212 can be produced from lesquerolic acid. Nylon- 1212 now comes from petrochemicals, while nylon- 11 and sebacic acid are derived from ricinoleic acid.
The remainder of L. fendleri oil is composed of oleic, linoleic, and linolenic acids. These fatty acids are com- monly found in other fats and oils used for animal feeds and industrial raw materials. Scientists, processors, and manufacturers are faced with the challenge of finding uses that utilize the entire oil or ways to economically separate lesquerolic acid from these other fatty acids. Researchers at USDA's Agricultural Research Service (ARS), National Center for Agricultural Utilization Research (NCAUR) have developed two methods--enzymatic and physical--to concentrate lesquerolic acid to 85 to 90 percent. Another alternative, which is currently being investigated, is to increase the amount of hydroxy fatty acids in the oil.
Lesquerella meal and treated castor meal could be used as protein supplements in livestock rations, primarily for beef cattle. Feeding trials with lesquerella meal are currently underway, and preliminary results are encouraging. Treating lesquerella meal may not be necessary, depending upon the level used in the feed. Texas A&M University has devel- oped technology to detoxify castor meal, which has been proven commercially in Thailand. This process improves the feed value compared with the detoxified castor meal that was fed to Texas cattle during the 1960's and early 1970's.
The Next Steps for Castor and Lesquerella
With domestic production of both castor and lesquerella, U.S. supplies of hydroxy fatty acids would not depend on
Coconut and Castor Oil Prices Forecast to Rise
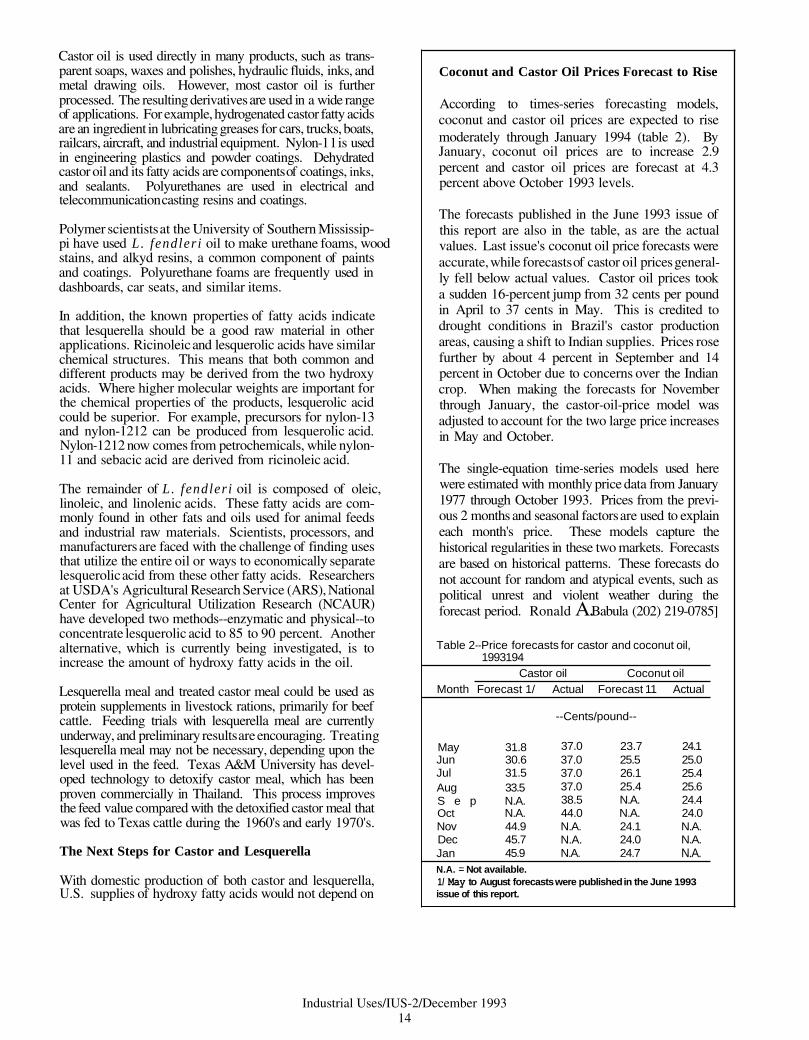
According to times-series forecasting models, coconut and castor oil prices are expected to rise moderately through January 1994 (table 2). By January, coconut oil prices are to increase 2.9 percent and castor oil prices are forecast at 4.3 percent above October 1993 levels.
The forecasts published in the June 1993 issue of this report are also in the table, as are the actual values. Last issue's coconut oil price forecasts were accurate, while forecasts of castor oil prices general- ly fell below actual values. Castor oil prices took a sudden 16-percent jump from 32 cents per pound in April to 37 cents in May. This is credited to drought conditions in Brazil's castor production areas, causing a shift to Indian supplies. Prices rose further by about 4 percent in September and 14 percent in October due to concerns over the Indian crop. When making the forecasts for November through January, the castor-oil-price model was adjusted to account for the two large price increases in May and October.
The single-equation time-series models used here were estimated with monthly price data from January 1977 through October 1993. Prices from the previ- ous 2 months and seasonal factors are used to explain each month's price. These models capture the historical regularities in these two markets. Forecasts are based on historical patterns. These forecasts do not account for random and atypical events, such as political unrest and violent weather during the forecast period. Ronald A.Babula (202) 219-0785]
Table 2--Price forecasts for castor and coconut oil, 1993194
Castor oil Coconut oil Month Forecast 1/ Actual Forecast 11 Actual
--Cents/pound--
May 31.8 37.0 23.7 24.1 Jun 30.6 37.0 25.5 25.0 Jul 31.5 37.0 26.1 25.4 Aug 33.5 37.0 25.4 25.6 S e p N.A. 38.5 N.A. 24.4 Oct N.A. 44.0 N.A. 24.0 Nov 44.9 N.A. 24.1 N.A. Dec 45.7 N.A. 24.0 N.A. Jan 45.9 N.A. 24.7 N.A. N.A. = Not available. 1/ May to August forecasts were published in the June 1993 issue of this report.
Industrial Uses/IUS-2/December 199314

a single commodity. The two crops would be grown in different seasons; lesquerella is planted in the fall and harvested in late spring, while castor is planted in the spring and harvested in late fall. Also, due to disparate requirements for water, temperature, and other climatic conditions, the crops will probably be grown in different parts of the country. Multiple production regions would provide a more reliable domestic supply. This in turn could encourage further product research and development, thus opening additional markets for both crops.
The lack of a crushing facility has been the major obstacle impeding domestic castor production. Plans to produce 10,000 metric tons of castor seed in the Texas High Plains in 1991 stalled when negotiations for crushing the crop failed. Some farmers in the area were also wary of growing castor because of the possibility of contaminating adjacent crops, particularly food-grade corn. However, plans are now underway to crush castor at National Sun's facility in western Kansas. The parties are exploring funding options.
Much work still needs to be done on lesquerella's crop and product development. The consortium, led by Myco- gen Corporation (San Diego, CA), has signed a Coopera- tive Research and Development Agreement with ARS's Water Conservation Laboratory (Phoenix, AZ) to explore lesquerella's growing requirements and other agronomic characteristics. The lab will also work on germplasm collection, evaluation, and enhancement. Mycogen will conduct plant breeding, variety development, and biotech- nology research. NCAUR (Peoria, IL) will evaluate a variety of potential applications. International Flora Technologies, Ltd. (Apache Junction, AZ) will develop oil processing technology and high-value applications for the cosmetic industry. The collaborators expect that it will take 5 to 7 years to develop a commercial variety for large-scale production.
Glycerine Markets Are Tight
Glycerine is a byproduct of producing soaps, fatty acids, and fatty alcohols from the triglycerides in vegetable oils and animal fats (figure 4). Lower cost synthetic glycerine has provided stiff competition since its development around the turn of the century. During the last decade, however, glycerine recovery has been a significant factor in the economics of producing soaps and surfactants from renewable resources. The glycerine credit from biodiesel production has similarly increased the competitiveness of that renewable fuel (see the special article).
End uses for glycerine include diverse products like drugs and cosmetics, resins, polymers, and explosives. Glycer- ine's chief end uses are drugs, cosmetics, toothpaste, alkyd resins, and tobacco (figure 5). However, it has over 1,500 commercial and industrial applications (table 3). The primary function of glycerine in many cases is that of a humectant (a substance for retaining moisture and, in turn,
Figure 4
World Production Sources of Glycerine by Primary Product or Process, 1992 11
Biodiesel 1% Other methyl esters 2%
Fany acids 34%
Fatty alcohol 13%
1 /1992 world production of glycerine is estimated at 1.2 billion pwnds. Source: Institute for Local Sell-Reliance. Washington. DC.
Figure 5
Estimated End Uses of Glycerine in the United States 1/
Miscellaneous 8%
toothpaste 23%
ood 8 beverages 13%
Tobacco humectant
Alkyd resins 16%
1/Annual consumption is estimated at 300 million pounds per year. Source: Institute for LocalSelf-Reliance. Washington. DC.
softness). It also acts as a solvent, sweetener, and preser- vative in food and beverages, and as a carrier and emol- lient in cosmetics. Glycerine's properties as a plasticizer and lubricant give it wide applicability, particularly for food processing machinery because it is nontoxic. Glycer- ine also is used in alkyd resin manufacture to assure flexibility. Alkyd resins find their way into products such as paints and inks where brittleness is undesirable.
Specific examples of glycerine based products that have recently been introduced into U.S. markets include a 100- percent glycerine bar soap that is marketed by Jason Natural Cosmetics (Culver, CA), under the brand name Jason Natural Aromatherapy. Wal-Mart has introduced its own line of glycerine liquid soap under the Sam's Ameri- can Choice label. And St. Ives Laboratories (Chatsworth, CA) is in the process of introducing a glycerine-based extra mild facial cleansing liquid under the brand name St. Ives Swiss Formula. 3
Industrial Uses/IUS-2/December 199315
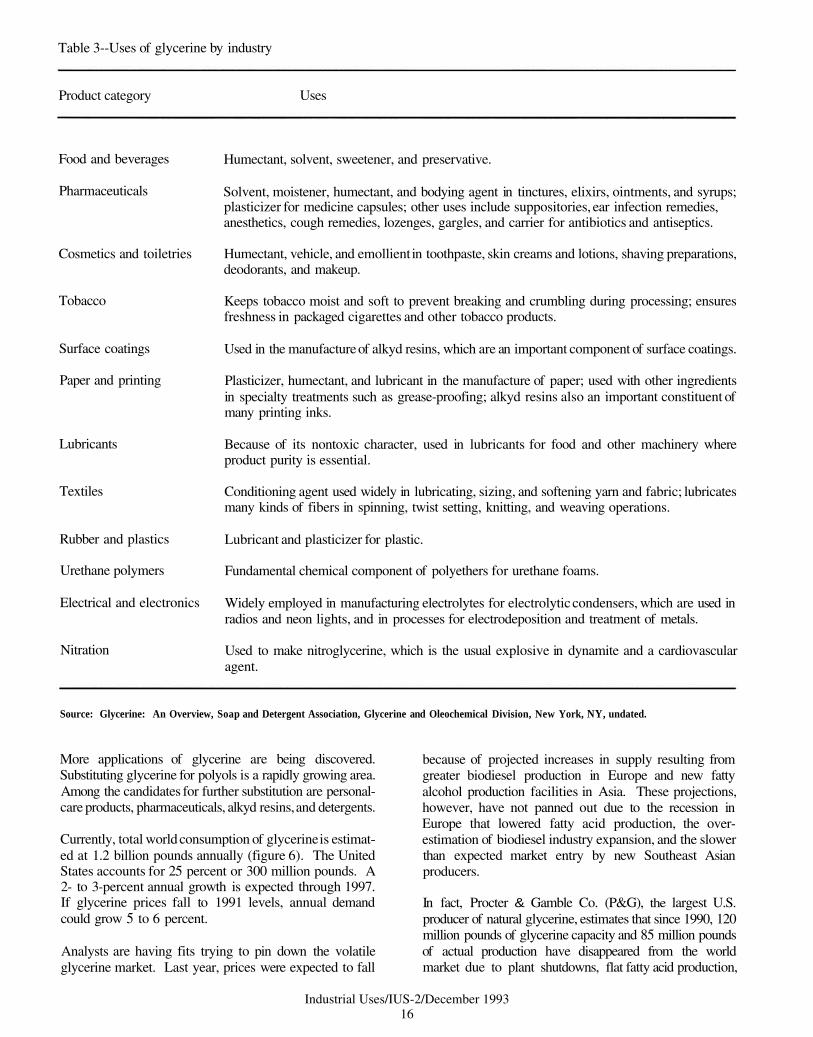
Table 3--Uses of glycerine by industry
Product category Uses
Food and beverages Humectant, solvent, sweetener, and preservative.
Pharmaceuticals Solvent, moistener, humectant, and bodying agent in tinctures, elixirs, ointments, and syrups; plasticizer for medicine capsules; other uses include suppositories, ear infection remedies, anesthetics, cough remedies, lozenges, gargles, and carrier for antibiotics and antiseptics.
Cosmetics and toiletries Humectant, vehicle, and emollient in toothpaste, skin creams and lotions, shaving preparations, deodorants, and makeup.
Tobacco Keeps tobacco moist and soft to prevent breaking and crumbling during processing; ensures freshness in packaged cigarettes and other tobacco products.
Surface coatings Used in the manufacture of alkyd resins, which are an important component of surface coatings.
Paper and printing Plasticizer, humectant, and lubricant in the manufacture of paper; used with other ingredients in specialty treatments such as grease-proofing; alkyd resins also an important constituent of many printing inks.
Lubricants Because of its nontoxic character, used in lubricants for food and other machinery where product purity is essential.
Textiles Conditioning agent used widely in lubricating, sizing, and softening yarn and fabric; lubricates many kinds of fibers in spinning, twist setting, knitting, and weaving operations.
Rubber and plastics Lubricant and plasticizer for plastic.
Urethane polymers Fundamental chemical component of polyethers for urethane foams.
Electrical and electronics Widely employed in manufacturing electrolytes for electrolytic condensers, which are used in radios and neon lights, and in processes for electrodeposition and treatment of metals.
Nitration Used to make nitroglycerine, which is the usual explosive in dynamite and a cardiovascular agent.
Source: Glycerine: An Overview, Soap and Detergent Association, Glycerine and Oleochemical Division, New York, NY, undated.
More applications of glycerine are being discovered. Substituting glycerine for polyols is a rapidly growing area. Among the candidates for further substitution are personal- care products, pharmaceuticals, alkyd resins, and detergents.
Currently, total world consumption of glycerine is estimat- ed at 1.2 billion pounds annually (figure 6). The United States accounts for 25 percent or 300 million pounds. A 2- to 3-percent annual growth is expected through 1997. If glycerine prices fall to 1991 levels, annual demand could grow 5 to 6 percent.
Analysts are having fits trying to pin down the volatile glycerine market. Last year, prices were expected to fall
because of projected increases in supply resulting from greater biodiesel production in Europe and new fatty alcohol production facilities in Asia. These projections, however, have not panned out due to the recession in Europe that lowered fatty acid production, the over- estimation of biodiesel industry expansion, and the slower than expected market entry by new Southeast Asian producers.
In fact, Procter & Gamble Co. (P&G), the largest U.S. producer of natural glycerine, estimates that since 1990, 120 million pounds of glycerine capacity and 85 million pounds of actual production have disappeared from the world market due to plant shutdowns, flat fatty acid production,
Industrial Uses/IUS-2/December 199316

Figure 6 Biodiesel Research and Testing Continues
World Glycerine Consumption 1 /
United States 25%
1/Worldwide use of glycerine is estimated at 1.2 billion pounds per year. Source: institute for Local Self-Reliance. Washington. DC.
and revised manufacturing processes. This sharp decline in supply prompted P&G to raise prices of glycerine 16 to 20 cents per pound this year. Although many industry experts doubted that the price increase would hold, most of the major producers followed P&G's lead and raised their prices.
The outlook for the glycerine market is still uncertain. Increased interest in natural sources for soaps and surfact- ants--driven by both cheap vegetable oil supplies and greater demand for "green" cleaners--has resulted in a greater supply of natural glycerine. And an upturn in the biodiesel industry worldwide, coupled with new fatty alcohol production in Malaysia and Indonesia, may further expand glycerine supplies.
These supply increases may be met by an equally large demand expansion. More glycerine uses are being devel- oped each year. And even with the recent price hikes, glycerine is less expensive than its main competitor, propylene glycol.
Government, industry, and trade associations continue to re- search and test biodiesel. For example, the National Institute for Petroleum Energy Research recently completed biodiesel engine exhaust emissions tests. Blends of diesel and biodie- sel-processed from soybean oil, beef tallow, and/or waste grease (used fats and oils discarded by foodservice opera- tions)--were run in diesel engines commonly found in buses and pickup trucks. The results indicate that the more biodie- sel used in the blend, the lower the emissions of hydrocarbons (HC) and carbon monoxide (CO) compared to low-sulfur diesel fuel. However, nitrousoxide (NOx) emissions rose as the amount of biodiesel in the blend increased.
ORTECH, an engine-testing laboratory in Canada, recently completed timing change tests on a Detroit Diesel 6V-92 engine using a diesel fuel blend containing 20-percent biodiesel. Previous research suggested that 20 percent may be the optimum biodiesel blend for city buses using the 6V- 92 engine. Results show that a 3-degree timing change decreased NOx exhaust emissions slightly and maintained lower emissions of CO, HC, and particulate matter (table 4).
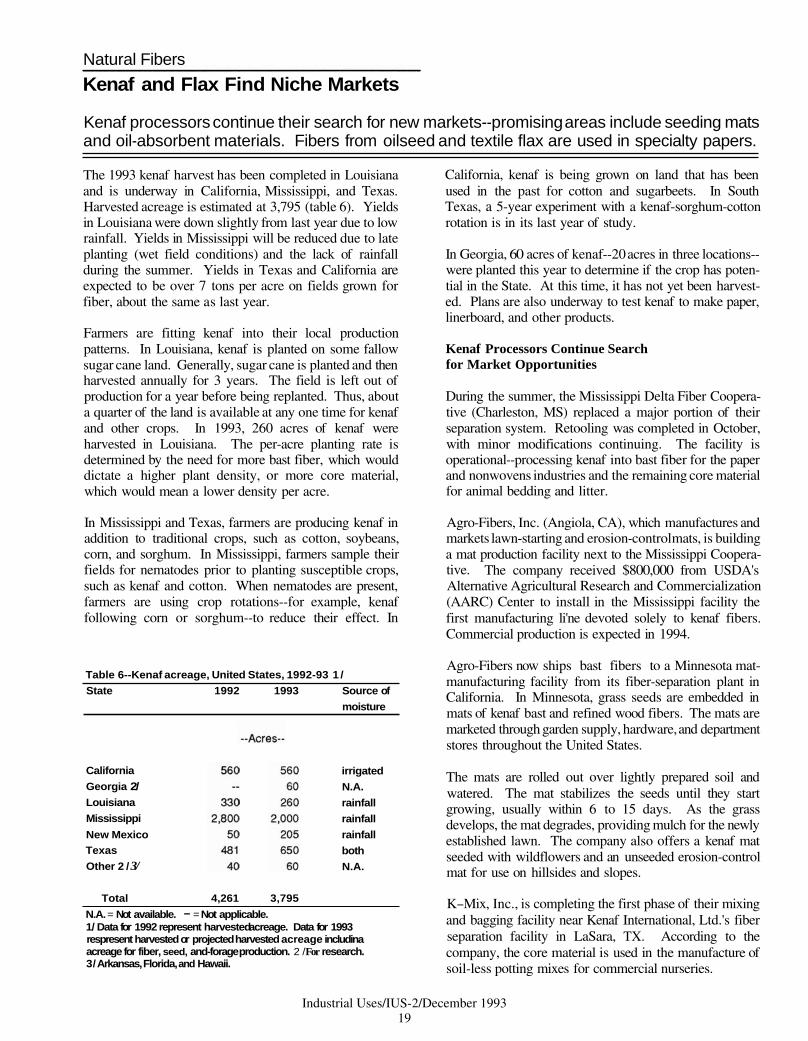
Numerous demonstration projects are underway in the United States. Most of the demonstrations are being conducted on mass transit fleets in major cities where meeting Clear Air Act standards may be an issue. Many are sponsored by the National SoyDiesel Development Board (table 5). In addi- tion, testing will soon begin at the U.S. Bureau of Mines Twin Cities Research Center (Minneapolis, MN). In order to meet pending regulations, the bureau has been researching strategies to reduce exhaust emissions in mines.
MFA Oil Company, Inc. (Columbia, MO) is the first com- mercial petroleum distributor to handle biodiesel in the United States. MFA oi l is marketing a biodiese/diese1 blend to four rural electric cooperatives in Missouri. The coopera- tives will use the fuel in their truck fleets. Eewrene Glaser (202) 219-0085, David Pace (606) 257-7272, Irshad Ahmed (202) 232-4108, and Alan Weber (3 14) 882-4512]
Industrial Uses/IUS-2/December 1993
17
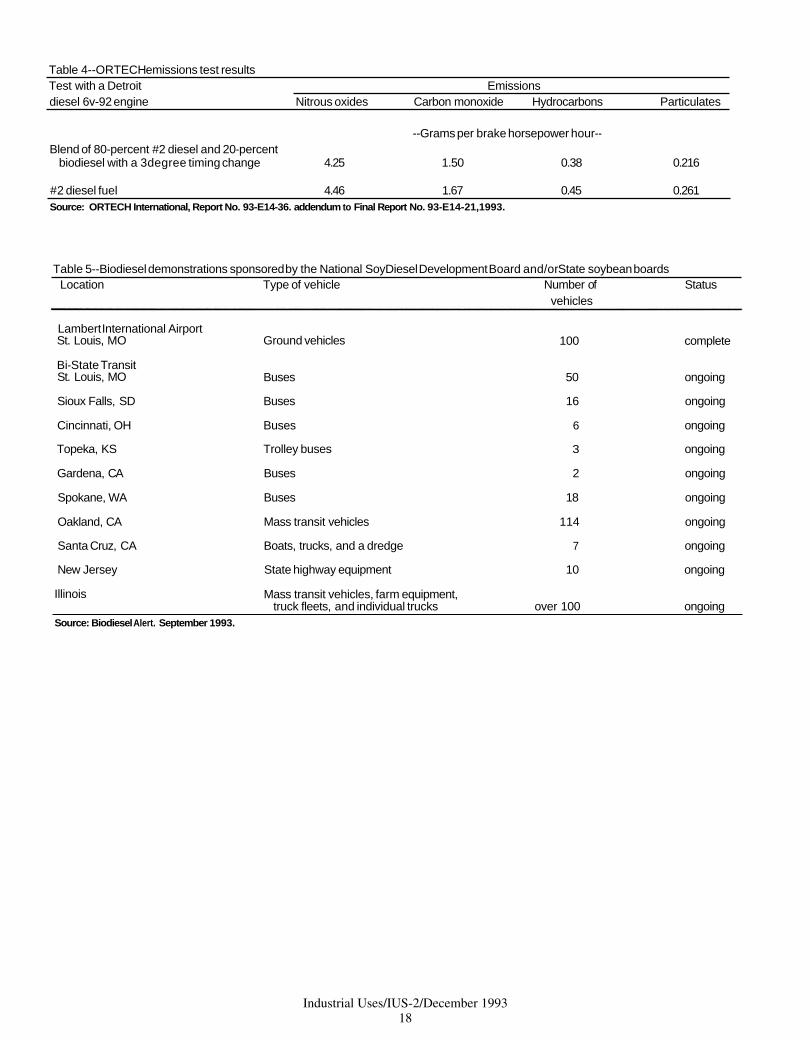
Table 4--ORTECH emissions test results Test with a Detroit Emissions diesel 6v-92 engine Nitrous oxides Carbon monoxide Hydrocarbons Particulates
--Grams per brake horsepower hour-- Blend of 80-percent #2 diesel and 20-percent
biodiesel with a 3degree timing change 4.25 1.50 0.38 0.216
#2 diesel fuel 4.46 1.67 0.45 0.261 Source: ORTECH International, Report No. 93-E14-36. addendum to Final Report No. 93-E14-21,1993.
Table 5--Biodiesel demonstrations sponsored by the National SoyDiesel Development Board and/orState soybean boards Location Type of vehicle Number of Status
vehicles
Lambert International Airport St. Louis, MO Ground vehicles 100 complete
Bi-State Transit St. Louis, MO Buses 50 ongoing
Sioux Falls, SD Buses 16 ongoing
Cincinnati, OH Buses 6 ongoing
Topeka, KS Trolley buses 3 ongoing
Gardena, CA Buses 2 ongoing
Spokane, WA Buses 18 ongoing
Oakland, CA Mass transit vehicles 114 ongoing
Santa Cruz, CA Boats, trucks, and a dredge 7 ongoing
New Jersey State highway equipment 10 ongoing
Illinois Mass transit vehicles, farm equipment, truck fleets, and individual trucks over 100 ongoing
Source: Biodiesel Alert. September 1993.
Industrial Uses/IUS-2/December 199318
Natural Fibers
Kenaf and Flax Find Niche Markets
Kenaf processors continue their search for new markets--promising areas include seeding mats and oil-absorbent materials. Fibers from oilseed and textile flax are used in specialty papers.
The 1993 kenaf harvest has been completed in Louisiana California, kenaf is being grown on land that has been and is underway in California, Mississippi, and Texas. used in the past for cotton and sugarbeets. In South Harvested acreage is estimated at 3,795 (table 6). Yields Texas, a 5-year experiment with a kenaf-sorghum-cotton in Louisiana were down slightly from last year due to low rotation is in its last year of study. rainfall. Yields in Mississippi will be reduced due to late planting (wet field conditions) and the lack of rainfall In Georgia, 60 acres of kenaf--20 acres in three locations-- during the summer. Yields in Texas and California are were planted this year to determine if the crop has poten- expected to be over 7 tons per acre on fields grown for tial in the State. At this time, it has not yet been harvest- fiber, about the same as last year. ed. Plans are also underway to test kenaf to make paper,
linerboard, and other products. Farmers are fitting kenaf into their local production patterns. In Louisiana, kenaf is planted on some fallow Kenaf Processors Continue Search sugar cane land. Generally, sugar cane is planted and then for Market Opportunities harvested annually for 3 years. The field is left out of production for a year before being replanted. Thus, about During the summer, the Mississippi Delta Fiber Coopera- a quarter of the land is available at any one time for kenaf tive (Charleston, MS) replaced a major portion of their and other crops. In 1993, 260 acres of kenaf were separation system. Retooling was completed in October, harvested in Louisiana. The per-acre planting rate is with minor modifications continuing. The facility is determined by the need for more bast fiber, which would operational--processing kenaf into bast fiber for the paper dictate a higher plant density, or more core material, and nonwovens industries and the remaining core material which would mean a lower density per acre. for animal bedding and litter.
In Mississippi and Texas, farmers are producing kenaf in Agro-Fibers, Inc. (Angiola, CA), which manufactures and addition to traditional crops, such as cotton, soybeans, markets lawn-starting and erosion-control mats, is building corn, and sorghum. In Mississippi, farmers sample their a mat production facility next to the Mississippi Coopera- fields for nematodes prior to planting susceptible crops, tive. The company received $800,000 from USDA's such as kenaf and cotton. When nematodes are present, Alternative Agricultural Research and Commercialization farmers are using crop rotations--for example, kenaf (AARC) Center to install in the Mississippi facility the following corn or sorghum--to reduce their effect. In first manufacturing li'ne devoted solely to kenaf fibers.
Commercial production is expected in 1994.
Agro-Fibers now ships bast fibers to a Minnesota mat- Table 6--Kenaf acreage, United States, 1992-93 1 /
1992 manufacturing facility from its fiber-separation plant in
State 1993 Source of California. In Minnesota, grass seeds are embedded in moisture mats of kenaf bast and refined wood fibers. The mats are
California
Georgia 2/Louisiana
Mississippi
New Mexico Texas
Other 2 /3/
irrigated
N.A.
rainfall
rainfall
rainfall
both
N.A.
marketed through garden supply, hardware, and department stores throughout the United States.
The mats are rolled out over lightly prepared soil and watered. The mat stabilizes the seeds until they start growing, usually within 6 to 15 days. As the grass develops, the mat degrades, providing mulch for the newly established lawn. The company also offers a kenaf mat seeded with wildflowers and an unseeded erosion-control mat for use on hillsides and slopes.
Total 4,261 3,795 K-Mix, Inc., is completing the first phase of their mixing N.A. = Not available. - = Not applicable. 1 / Data for 1992 represent harvestedacreage. Data for 1993 and bagging facility near Kenaf International, Ltd.'s fiber respresent harvested or projected harvested acreage includina separation facility in LaSara, TX. According to the acreage for fiber, seed, and-forage production. 2 /For research. company, the core material is used in the manufacture of 3/Arkansas, Florida, and Hawaii. soil-less potting mixes for commercial nurseries.
Industrial Uses/IUS-2/December 199319

Kenaf International is developing a strategic plan to establish a kenaf pulp and paper mill complex in South Texas, with the help of a $100,000 repayable cooperative agreement from the AARC Center. The assistance will enable the company to evaluate the project's current economic viability, prepare financing presentations, and execute implementation strategies.
In cooperation with Kenaf International, Gridcore Systems International Corporation (Carlsbad, CA) has carried out tests with Gridcore panels made from kenaf. T h ecompany will evaluate the kenaf-based panels for use in stage sets and trade-show displays. Longer term, Gridcore plans to expand portable applications and develop panels for use in the housing and construction industries. The AARC Center is supporting Gridcore's research program with a $50,000 investment. The company is testing different raw materials and manufacturing processes for various construction, arts-and-crafts, and sporting-goods applications.
Kenaf Exhibits Oil Absorption Properties
Harold and Christopher Willett of Natural Fibers of Louisi- ana, Inc. (Jeanerette, LA) have received notice that their application for a patent using separated kenaf bast fiber and core material for oil absorption from dry or oil-on-water surfaces has been granted. The patent also defines the method of action--the fiber attracts and holds the oil by adhesion while the core absorbs the oil.
Both natural and synthetic fibers can be used for oil absorption. The best materials have surfaces that attract oil and repel water. Natural fibers with wax-like com- pounds on their surface possess these properties. The porous, sponge-like nature of a material is also important for oil absorption. Kenaf, cotton, milkweed floss, and peat moss meet both these criteria (2).
Inorganic materials, mostly clays, and manufactured synthetic fabrics, predominantly polypropylene mats, have been the main types of sorbents used. Recently, however, natural organic materials have made inroads in specific markets. Several reasons are cited for such a shift, including the following:
They are biodegradable, which means the used prod- uct could be disposed of in a compost facility if the spilled/absorbed liquid could legally be discarded in such a manner.
They are mostly renewable resources, such as wool, corn cobs, wood byproducts. Peat moss, however, is mined from bogs.
They have lower per-unit costs than the polypropylene fabrics.
They have less of an impact on the environment if released or lost during spill clean-up operations.
They are perceived as environmentally friendly by the public ( I ) .
USDA's Cooperative State Research Service, Office of Agricultural Materials, in collaboration with the Department of Defense, is funding research at the University of Pittsburgh to compare the characteristics of organic oil absorbents and at the University of Houston to develop further uses of organic absorbents such as kenaf. USDA's Agricultural Research Service (ARS) is working with several universities on kenaf product research. Scientists at Mississippi and Louisiana State Universities are investigating chemical methods to process kenaf into a superior grade fiber for nonwoven applications. Kenaf, in combination with peat moss and/or vermiculite, has shown promise as a horticultural growth medium in tests at Mississippi State University and the University of Delaware. In addition, scientists at USDA's Forest Products Laboratory are developing resin composites based on kenaf and research- ers at ARS's Southern Regional Research Center are examin- ing various methods of forming nonwovens made from kenaf.
Flax Fibers Are Used in Specialty Papers
It is estimated that about 250,000 tons of nonwood fiber pulp is produced annually in the United States for use in paper, paperboard, and insulating board. According to Joseph E. Atchison, an expert in the use of nonwood fibers for paper production, these include pulp for specialty papers, such as staple cotton fiber for currency, cotton linters for high-quality letterhead paper, flax straw for cigarette paper, bagasse for insulating board, and abaca (manila hemp) and other specialty fiber pulps for tea bags, filter papers, and sausage casings.
In the United States, flax is the most extensively used nonwood fiber employed in papermaking, except for cotton. Because of its long slender fibers, flax pulp is ideal for the production of thin strong papers, such as cigarette, airmail, bible, and light-weight bond papers.
Two types of flax are grown throughout the world--fiber varieties for the long linen fibers and oilseed varieties for linseed oil and meal. The shorter fiber strands that are a byproduct of processing raw textile flax are known as flax tow. T h eplant material left in the field after oilseed varieties have been harvested is known as seed flax straw.
Oilseed flax is grown in North and South Dakota, Minnesota, and the prairie provinces of Canada. Two U.S. manufactur- ers--Ecusta Division of P.H. Glatfelter Company (Pisgah Forest, NC) and the Specialty Division of the Kimberly Clark Corporation (Spotswood, NJ)--buy baled flax straw that farmers deliver to portable decorticating rigs. The straw is processed, separating the long outer fibers from the inner core of the stem. The resulting fiber, called seed flax tow, is then shipped to the two paper mills. At this time, a majority of seed flax tow comes from Canada.
Seed flax tow is used as themain ingredient in cigarette paper pulp. According to Frank Riccio of Danforth International
Industrial Uses/IUS-2/December 199320

Trade Associates (Point Pleasant, NJ), more than 50,000 tons of seed flax tow are used annually in the North American market. In addition, flax tow and waste are imported to enhance the quality of the cigarette paper pulp. Such imports are estimated to average 7,000 to 10,000 tons per year. The use of flax in cigarette paper may be declining, however. Recent trends indicate that cigarette companies may be moving away from flax-based paper to wood-based paper because it is less expensive.
Noils, a byproduct of linen spinning, is also imported for currency paper. Standard U.S. currency is 80 percent cotton
and 20 percent flax. Riccio estimates that about 6,000 tons are imported per year. Most of the high quality flax fiber and yam imported into this country is shipped to spinners and weavers. Upholstery and draperies are the major uses of the resulting linen fabric. Lewrene Glaser (202) 219-0085]
1. Schrader, Edward L. "A Practical Comparison of Organ- ic, Synthetic, and Inorganic Sorbents." Paper presented at Clean Gulf '93 and the American Chemical Society: Emerging Technology in Hazardous Waste Management.
2. Tiler, Frank M. Department of Chemical Engineering, University of Houston.
Industrial Uses/IUS-2/December 199321

Animal Products
Livestock Byproducts and Seafood Wastes Contain Valuable Ingredients
Animal byproducts are used to manufacture pharmaceuticals with a wide range of applications. Advances in biotechnology have resulted in the development of transgenic animals, which may be used in the future as a source of drugs and organs for human transplants. Chitin, isolated from seafood waste, has numerous industrial and food applications.
Many animal byproducts have a vast range of human and industrial applications, which are unknown to most people. In addition, scientific advances, especially biotechnology, are increasing potential uses.
Animal Glands and Byproducts Have Medicinal Value
Numerous pharmaceuticals derived from animal byprod- ucts aid in the treatment of diseases and injuries and facilitate patient recovery. For example, the thyroid gland produces thyroxine, which controls the rate of chemical reactions in the body. Thyroxine from animals is often used to regulate chemical reactions in humans with damaged or diseased thyroid glands. Shortages of thyrox- ine can bring on lymphatic swellings known as myxedema. Excess secretions can cause r e s o u r c e s insomnia, tachycardia, loss of weight, and digestive disturbances.
The pituitary gland produces adrenocorticotrophic hormone (ACTH). ACTH from animals is used to treat rheumatic disorders such as arthritis, rheumatoid arthritisand rheumatic heart disease; collagen diseases like lupus erytheinatosus; various skin diseases; allergic conditions such as bronchial asthma and chronic bronchial asthma; and ulcerative colitis.
Insulin is probably the most well known pharmaceutical derived from animal byproducts. In 1921, Dr. Banting (University of Toronto) established that the failure of the pancreas to supply insulin leads to diabetes, a disease causing damage to blood vessels, eyes, kidneys, and other organs. Two years later, Banting and Dr. Best discovered a method of mass-producing insulin. Since then, progress has been made to improve and develop new sources of insulin from animals. Currently, it requires on average the pancreases of 35 beef cattle or 130 hogs to provide enough insulin for one diabetic for one year.
Animal byproducts are also used to treat circulatory ailments. For example, heparin prevents blood clot formation, growth, and movement. It is extracted from cow lungs and pig intestines. Discovered in 1915 and used since 1938, heparin is essential in open heart surgery, kidney dialysis, and catheterization. And, hog heart valves are widely used to replace defective valves in hum'an hearts. It is estimated that over 30,000 heart valves from pigs have been implanted into humans.
Blood albumin is used as a reagent in testing for Rh factor, as a nutrient in tissue culture media, and as a stabilizer in vaccines. Albumin is generally made from "edible" blood. Edible blood comes from the carcasses of wholesome animals that havepassed USDA inspection, and the blood is collected and stored in a sanitary manner. Two percent salt is usually added to the blood to preserve and keep it from thickening.
Blood plasma is obtained by centrifuging whole-beef blood and adding an anti-coagulate to prevent clotting. After centrifuging, the plasma is frozen to manufacture thrombin. Thrombin is a concentrated plasma, capable of clotting bloodin a matter of seconds. It is supplied as a sterile, dry powder and applied to bleeding areas in a saline solution. It is used in several types of surgery, skin grafting, and dentistry.
In comparison, "inedible" blood is used in the manufacture of shoe polish and in the sizing of leather. Furthermore, it is used as a feedstock for glues and in animal feeds. Dried blood contains about 87-percent protein. It can also be used by cal ico c printers in fixing certain pigment colors in cloth.
Other pharmaceutical uses of animal byproducts include:
Pepsin is a digestive ferment obtained from the lining of the pyloric end of pig stomachs and used to aid protein digestion;
Rennin is a digestive ferment obtained from the fourth stomach of suckling calves, which is used extensively as a milk coagulant in cheese making;
Peptones of different kinds are prepared from lean muscle tissue and are easily assimilated as proteins or are used in culture media; and
Thromboplastin is made from the brains of cattle and is used as a blood coagulant.
Genetically Engineered Animals Are a Future Trend
Some of the first animals to be genetically manipulated were mice and rats. More recently, research has been conducted on pigs. Scientific study of these animals is useful because they have physiologies very similar to our own. Thus, they can be used to test potential cures for various diseases, such as AIDS, sickle cell anemia, cystic fibrosis, heart disease, and many other human ailments. Moreover, scientists believe that in the future they will be able to genetically alter animals to supply transplant organs for humans.
Around the world, genetic modification of rodents has become commonplace. Modifications have become so frequent 'and widespread that a system for cataloging each of the various traits is being established at Oak Ridge National Laboratory. When completed, a scientist can locate rodents with a particularhuman gene or set of genes.
The United States Patent and Trademark Office issued patents in December 1992 to three organizations for their discoveries on "transgenic" mice. Transgenic animals incorporate a gene from another organism and are able to
Industrial Uses/IUS-2/December 199322

pass that gene to offspring. This is invaluable for studying how normal genes function and how defective genes cause inherited diseases or lead to other diseases, such as cancer and AIDS. These patents were issued to Harvard Univer- sity for a mouse that develops an enlarged prostate, a common problem in older men; Gen Pharm for a mouse without a working immune system, developed primarily for AIDS research; and Ohio University for a virus- resistant mouse for use in developing agricultural livestock that are less vulnerable to disease.
Some scientists believe that therapeutics from transgenic animals could be available as soon as 1996. Between 1983 and 1985, researchers showed that transgenic animals could be produced. In 1988 and 1989, transgenic produc- tion of livestock was proved possible. Clinical trials began in 1993. Examples of transgenic animals include:
Genetically engineered pigs are yielding milk con- taining a complex human protein that prevents blood clotting. With this source, large supplies can be attained more quickly and less expensively than from human sources.
DNX Corporation (Princeton, NJ) has created pigs with human hemoglobin, which they hope to begin testing in humans as a blood substitute next year. This new supply of human-quality blood will help reduce the cost of collecting blood from humans and eliminate potential disease problems in the blood supply.
A new blood substitute, called Hemopure, has been developed by Biopure Corporation (Boston, MA) from an extract of cow's blood.
Chitin--A Versatile Product from Seafood Waste
Chitin is a naturally occurring biopolymer, whose most common source is the tough outer shell of crustaceans, such as crabs, shrimp, and crawfish. Chitosan is the deacetylated derivative of chitin, which is a linear polymer of acetyla- mino-D-glucose. While chitin is used in some applications, chitosan is the preferred material for most uses.
Chitin is the second most commonly occurring organic compound next to cellulose. Even tllough it is found in plankton and mushrooms, commercial applications will most likely come from shellfish wastes.
The United States is a major harvester of crustaceans. In 1992, over 624 million pounds of various crab species were landed. The biggest proportion of these were snow crabs, 350 million pounds, and blue crabs, 192 million pounds. Another large source of chitin would be the 338 million pounds of marine shrimp landed domestically in 1992. A third domestic source would be the fresh water crawfish industry. Louisiana annually produces approxi- mately 100 million pounds of crawfish. Over half of this is farm-raised and the rest comes from wild harvests.
The tonnage of domestic crustacean shells available for chitin extraction would be considerably less than the 1 billion plus pounds of landings noted for crabs, shrimp, and crawfish. First, shells are a relatively small portion of
the total landed weight. Second, a fairly large percentage of these species are sold to retail markets and restaurants with the shell intact.
The only economic and logistically viable source of chitin would be from facilities where crustaceans are processed in large quantities for meat. While the domestic supply of crustacean shells for chitin extraction is considerably less than total landings, there would still be a substantial amount of raw material available. Since the shells are normally considered a waste product, acquisition costs should be relatively low. Plants would likely be located close to the raw material source because of transportation costs, perishability, and bulk.
To produce chitin, the raw shells are first coarsely ground and then treated with sodium hydroxide to remove pro- teins. Next, the shells are demineralized in hydrochloric acid. The demineralized shells are dried and ground to the desired size. Chitosan is derived by treating chitin with a strong caustic solution. After this procedure the material is rinsed, ph-adjusted, and dehydrated.
Due to its chemical versatility, chitin or chitosan is used or is being tested for a wide variety of applications. Powdered chitin is used in waste water treatment, while most chitosan is used in food and medicinal applications.
In the industrial area, the major use for chitosan is as a flocculating agent. Chitosan greatly increases the rate at which materials precipitate out of waste water. It is used to treat sewage effluent and the waste water from paper mills. In textile plants, powdered chitosan is being tested to see if it can absorb dyes before the waste water is discharged.
Another major industrial use takes advantage of chitosan's chelating properties. It is used to remove metals from waste materials at metal-finishing facilities. The ability to chelate iron, combined with its flocculating properties, make chitosan especially well suited for use in water- treatment applications.
Moreover, films of chitosan are being evaluated as edible food coatings to prolong the shelf life of fruit products and to keep food ingredients separate during storage. The Army has also evaluated chitosan coatings as a biodegrad- able packaging wrap.
Currently, the largest agricultural use for chitosan is as a seed coating, primarily wheat. Chitosan protects the seed by activating the seed's natural defenses. Chitosan is also being used to recover soluble proteins from agricultural processing wastes. Still another use is as a binder in pelletized fish feeds.
Developing new uses for chitin and chitosan could also help solve waste problems in the seafood industry. The raw material for chitin production has traditionally been a waste product that was either dumped at sea or disposed of in a landfill. By developing these new uses, shellfish processors will be able to greatly reduce their waste disposal costs. [Donald Van Dyne (314) 882-4512 and David Harvey (202) 219-0085]
Industrial Uses/IUS-2/December 199323
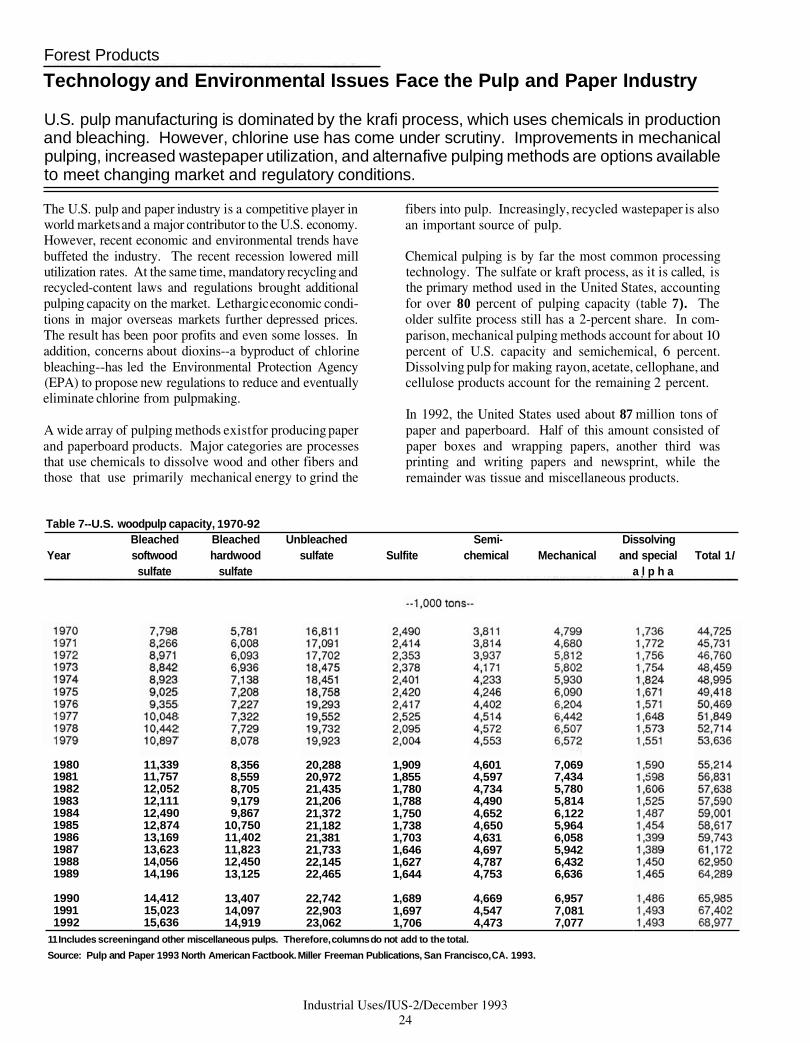
Forest Products
Technology and Environmental Issues Face the Pulp and Paper Industry
U.S. pulp manufacturing is dominated by the krafi process, which uses chemicals in production and bleaching. However, chlorine use has come under scrutiny. Improvements in mechanical pulping, increased wastepaper utilization, and alterna five pulping methods are options available to meet changing market and regulatory conditions.
The U.S. pulp and paper industry is a competitive player in world markets and a major contributor to the U.S. economy. However, recent economic and environmental trends have buffeted the industry. The recent recession lowered mill utilization rates. At the same time, mandatory recycling and recycled-content laws and regulations brought additional pulping capacity on the market. Lethargic economic condi- tions in major overseas markets further depressed prices. The result has been poor profits and even some losses. In addition, concerns about dioxins--a byproduct of chlorine bleaching--has led the Environmental Protection Agency (EPA) to propose new regulations to reduce and eventually eliminate chlorine from pulpmaking.
A wide array of pulping methods existfor producing paper and paperboard products. Major categories are processes that use chemicals to dissolve wood and other fibers and those that use primarily mechanical energy to grind the
fibers into pulp. Increasingly, recycled wastepaper is also an important source of pulp.
Chemical pulping is by far the most common processing technology. The sulfate or kraft process, as it is called, is the primary method used in the United States, accounting for over 80 percent of pulping capacity (table 7). The older sulfite process still has a 2-percent share. In com- parison, mechanical pulping methods account for about 10 percent of U.S. capacity and semichemical, 6 percent. Dissolving pulp for making rayon, acetate, cellophane, and cellulose products account for the remaining 2 percent.
In 1992, the United States used about 87 million tons of paper and paperboard. Half of this amount consisted of paper boxes and wrapping papers, another third was printing and writing papers and newsprint, while the remainder was tissue and miscellaneous products.
Table 7--U.S. woodpulp capacity, 1970-92 Bleached Bleached Unbleached Semi- Dissolving
Year softwood hardwood sulfate Sulfite chemical Mechanical and special Total 1/sulfate sulfate a l p h a
1980 11,339 8,356 20,288 1,909 4,601 7,069 1981 11,757 8,559 20,972 1,855 4,597 7,434 1982 12,052 8,705 21,435 1,780 4,734 5,780 1983 12,111 9,179 21,206 1,788 4,490 5,814 1984 12,490 9,867 21,372 1,750 4,652 6,122 1985 12,874 10,750 21,182 1,738 4,650 5,964 1986 13,169 11,402 21,381 1,703 4,631 6,058 1987 13,623 11,823 21,733 1,646 4,697 5,942 1988 14,056 12,450 22,145 1,627 4,787 6,432 1989 14,196 13,125 22,465 1,644 4,753 6,636
1990 14,412 13,407 22,742 1,689 4,669 6,957 1991 15,023 14,097 22,903 1,697 4,547 7,081 1992 15,636 14,919 23,062 1,706 4,473 7,077
11 Includes screeningand other miscellaneous pulps. Therefore, columns do not add to the total.
Source: Pulp and Paper 1993 North American Factbook. Miller Freeman Publications, San Francisco, CA. 1993.
Industrial Uses/IUS-2/December 199324

Chemical Pulping Popular With Industry
Chemical pulps are distinguished by cooking woodchips or other fiber sources in a digester that separates the cellulose fibers from the hemicellulose, lignin, and other compo- nents. Lignin--a brown, organic material that accounts for about 20 to 30 percent of wood--tends to discolor and weaken paper products over time. Chemical treatments usually remove most of the lignin, while mechanical processes leave much of it.
Kraft pulping can use many wood species and yield strong, easily bleached fibers. The spent cooking liquor (a residual black liquid) also can be washed from the pulp, concentrated, and used for chemical recovery or burnt for fuel in the pulp mill. Bleached haf t pulp possesses strength and whiteness, which are preferred for most grades of paper, particularly printing and writing papers. Because of its strength, unbleached kraft pulp is used for brown paper bags, wrapping paper, and shipping sacks.
One of the chief advantages of the kraft process is its economies of scale. Since it is based upon liquid vessels, enlarging their size increases the volume of production faster than the associated variable costs. Therefore, new kraft pulp mills have grown larger over time. A new mill may require $1 billion or more to build. However, few new kraft mills have been built in recent years. Most capacity expansion has been incremental additions to existing mills.
The disadvantages of haf t pulping include:
Low pulp yields of about 45 to 55 percent of wood input;
Corrosiveness that requires special metals and equipment;
Potential safety hazards, such as those associated with sulfur compounds; and
Adverse environmental impacts, such as bleaching waste water discharged into lakes and rivers, which might contain traces of dioxin and other undesirable chlorinated organics, as well as reduce the amount of dissolved oxygen in the water.
Bleaching Techniques Under Scrutiny
Pulp is often bleached to improve purity and brightness. Pulp brightness is measured by optical test instruments using an index of brightness points. Bleached chemical pulps have brightness indices of 85 to 90, semi-bleached chemical pulps of 70 to 80, and groundwood pulps of 55 to 65.
Various methods and chemicals are used for bleaching. One of the most common methods used with kraft pulps employs pure chlorine to remove the remaining lignin.
The use of this process has been called into question because of the possible production of dioxins, which have been associated with some forms of cancer. In response, industry has greatly reduced unwanted dioxin byproducts, and new technology makes it possible to detect even minute amounts. EPA has issued proposed regulations that would virtually eliminate discharges of dioxin into rivers by 1998 through the use of chlorine-free technology and/or reduced chlorine use. The agency estimates these changes would cost at least $4 billion, while industry puts the price tag at up to $10 billion. Industry has proposed chlorine dioxide as an alternative to free chlorine.
Mechanical pulping processes use chemicals such as sodium hypochlorite, hydrogen peroxide, or sodium hydrosulfite that typically are not associated with dioxin problems. Totally chlorine free (TCF) pulps can be made with the sulfite and bleached chemi-thermomechanical methods. However, only a few producers--several compa- nies in Sweden and Finland--are now capable of making TCF kraft pulp that is bleached with chemicals such as peroxide, ozone, and oxygen. USDA's Forest Products Laboratory is seeking to establish a consortium with industry to study the potential of an oxygen-and-metal- catalyst bleaching process it has patented with Clark Atlanta University. Research also has been conducted using enzymes for bleaching.
An alternative to bleaching would be to change the standards and preferences of paper users. High-quality business printing and writing papers typically contain chemical pulps bleached for high brightness. Nearly half of all paper and paperboard products use some bleached pulp. The Environmental Defense Fund has established a taskforce of major business users of high grade paper to study and define environmentally preferable papers and to promote these papers to meet personal and business needs. One problem is the large investment U.S. companies have in existing technology--kraft pulping and chlorine-based bleaching.
Technology Improving Mechanical Pulping and Related Processes
The mechanical energy used to convert pulpwood or woodchips to pulp is the distinguishing feature of the mechanical pulping process. The traditional groundwood (GW) grinding process has been only marginally improved since its invention a century ago. The process, which uses short logs, has been declining in popularity in recent decades, but still has a residual capacity of about 8 million tons per day in North America. Pressurized groundwood (PGW) uses a process developed in Finland that makes pulp by grinding logs in a pressurized atmosphere with a conventional grinder. This process improves the strength of the pulp ( 1 ) .
Refiner mechanical pulp (RMP) is made by fiberizing wood chips in large non-pressurized disc refiners. RMP
Industrial Uses/IUS-2/December 199325

typically uses sawmill residues and is especially popular Figure 7
in the Pacific Northwest. Thermomechanical pulping Thermomechanical and Chemi- - - -
(TMP) improved the RMP process by prestreaming thechips and fiberizing them in a pressurized refiner. This method has been particularly successful in the southern United States. A further modification of the TMP process chemically pretreats chips prior to their exposure to steam heat. This method, called chemi-thennomechanical pulping (CTMP), was developed in Scandinavia in the late 1970's and is particularly popular in Canada.
The principal advantage of mechanical pulping methods are higher yields, 90 to 95 percent, compared to chemical yields of 45 to 55 percent (table 8). Mechanical pulping mills are also less expensive to build and can be economi- cal on a smaller scale. However, the pulping requires more energy. The pulps have lower strength and bright- ness compared to chemical pulps, but higher opacity. Chemical pretreatment of wood chips enhances fiber strength properties and slightly lowers the pulp yield. TMP and CTMP capacity has been growing rapidly in recent years and now exceeds groundwood capacity in North America (figure 7). Major uses for TMP and CTMP pulp include newsprint, uncoated groundwood, and coated publication papers.
A bleached chemi-thermomechanical pulp (BCTMP) mill, on a per ton basis, costs less than one half as much as a new kraft pulpmill and uses about half as much wood as a kraft mill, plus it does not use chlorine compounds for bleaching. Aspen and spruce BCTMP have brightness indexes comparable to chemical pulps. These levels combined with enhancing fillers and coating bring BCTMP close to the brightness of bleached kraft pulps. Switching to neutral alkaline sizing would further improve its smoothness and brightness. Demand for BCTMP is strong in the Far East and growing in Europe. In the United States, it has been restrained by established printing and writing standards that limit mechanical pulp content to 10 percent in free-sheet grades.
Thermomechanical Pulping Capacity in the United States and Canada Million metric tons
Source: Pulp and Paper 1993 Factbook, Miller Freeman Publications, San Francisco. CA. 1993.
Deinking and Wastepaper Utilization on the Rise
Wastepaper recycling is a growing part of the paper industry. High-grade papers, newspapers, magazines, and corrugated boxes are recycled in large quantities. Typi- cally, wastepaper goes through a deinking process to remove printing inks, paper coatings, and other contami- nates to produce secondary pulp. Washing, screening, and flotation are used alone or in various combinations.
Deinking capacity has grown rapidly in the last 5 years. Overall wastepaper utilization by U.S. mills has increased from 18.7 million tons in 1987 to 26.1 million tons in 1992 (table 9). Further gains are an industry priority. The American Forest and Paper association recently an- nounced a new goal of increasing wastepaper recovery rates by 25 percent by 2000. The principal uses of deinked pulp are newsprint, tissue, and paperboard grades for making boxes, bags, and wrapping paper.
Table 8--Comparison of kraft and mechancial pulp properties 1/Pulp Yield Burst Tear Tensile Opacity Density type index 2/ index 2/ index 2/
Percent Percent Kg/m3
Kraft 45-55 7.1 0 6.40 116 82 773 Groundwood pulp 95 0.91 1.90 28 97 42 1 Refiner mechanical pulp 95 0.92 2.00 30 92 389 Thermomechanical pulp 95 1 .00 3.80 28 92 41 7 Chemi-thermomechanical pulp 94 2.1 0 6.70 47 84 499 Biomechanical pulp 84-95 1.3-1.6 2.5-4.0 30-35 95 402 1 / All measurements standardized to 100 ml Canadian Standard Freeness. 2/ Measures the strength of paper in international system units.
Source: Mary Beth Wall, Analysis ofBiopulping, a preliminary report submitted in partial fulfillment of Ph.D., 1990, on file at USDA Forest Products Laboratory, Madison. WI.
Industrial Uses/IUS-2/December 199326

Table 9--Utilization of wastepaper by U.S. paper and paperboard mills, 1970-92
Paper and Year Wastepaper paperboard Utilization
produced rate
Percent
22.8 22.8 22.5 23.5 23.7 23.0 23.4 23.4 23.8 23.9
23.5 23.4 23.7 23.4 23.8 23.8 24.7 24.6 25.2 25.8
27.1 29.4 31.3
Source: Pulp and Paper 1993 North American Factbook. Miller Freeman.
One important and growing concept in wastepaper utiliza- tion is mini-mills, which are smaller mills located near wastepaper sources and end-use markets. They typically use existing technology and discharge little or no effluent into waterways because they use either a closed system or send it directly to a municipal sewer system. At least 35 wastepaper mills are operating or proposed for construc- tion. They most often produce corrugated medium and linerboard for container board and boxes (2). They may also make tissue, newsprint, and fine grade papers.
Mini-mills provide an alternative where raw material avail- ability and cost, environmental constraints, and/or market demand do not justify larger mills. The economic viability of mini-mills depends upon:
An efficient design that minimizes capital investment and operating costs;
A location that minimizes freight charges for rawmaterials and products, thus offsetting labor and other operating cost advantages that traditional mills may possess; and
Dependable, low-cost raw materials, which may be encouraged by tax incentives and cooperative programs with municipalities.
Various Technologies Offer Alternatives
The concept of organosolv pulping, which uses organic solvents such as ethanol and methanol to remove lignin, was first proposed in the 1930's, but only recently has a serious attempt been made to commercialize it. In 1989, Repap Enterprises, Inc., began operating a 33-ton-per-day demonstration project in Newcastle, New Brunswick, with the assistance of the Canadian government. The company is looking for a site for a 250-ton-per-day commercial-size mill. Another variation has been developed in Germany and is being commercialized by MD Papier Organocell. A third organosolv process has been investigated by researchers at the University of Alabama.
Advantages of organosolv pulping include lower capital costs, diminished environmental impacts (because byproducts are recovered), and no chlorine. The disadvantages are the complex technology required to wash the pulp and recover the volatile chemicals used in the process and a possible fire or explosion. The chemicals are best used on certain types of hardwoods and may not work with mixed wood species.
A number of processes using various chemicals to improve bleaching or pulping have also been developed. Andritz Sprout-Bauer of Germany has introduced an alkaline peroxide mechanical pulping process to improve bleaching and reduce energy use by as much as 35 percent. C-I-L, Inc. (Montreal, Canada) uses anthraquinone to enhance the kraft process by reducing cooking time and alkali con- sumption while increasing pulp yields. Kraftanlagen Heidelberg and Feldmuhle AG of Germany are developing an alkali-sulfite-anthraquinone-methanol (AS AM) process to produce a chlorine-free, kraft-like pulp with high brightness and improved yields. The ASAM method also does not produce the sulfur compounds responsible for the pungent odors associated with pulp mills.
Biopulping involves modifying the cell wall in wood by highly specialized white-rot fungi leaving the cellulose for pulping. The organisms soften up the chips for easier delignification by either mechanical or chemical methods. Research on biopulping has been conducted by a number of companies and institutions in the United States and Sweden during the last 40 years. In 1987, a biopulping consortium was established involving the USDA Forest Products Laboratory, the University of Wisconsin, and industry participants to study biomechanical pulping.
Biopulping provides an opportunity to reduce the energy required to refine wood chips and increase the refiner throughputfor mechanical pulping. In addition, organisms would replace chemicals used in the CTMPprocess. Biopul- ping may also be used in conjunction with chemical pulping processes to pretreat wood chips and reduce chemical use.
Two promising fungi have been found for aspen and loblolly pine. In laboratory experiments, using the organ- isms reduced electricity consumption in subsequent processing, which resulted in energy savings of 25 to 50 percent. The pulp also had better strength properties than GW, RMP, and TMP. [Thomas Marcin (608) 231-9366]
1. Pulp and Paper I993 Fact Book. San Francisco, CA; Miller Freeman Publications; 1993.
2. "Will Mini-Mills Play a Maxi-Role in the Future of U.S. Papermaking?" Pulp and Paper, 67(1993): 39-47.
Industrial Uses/IUS-2/December 1993
27
Specialty Plant Products
Guayule, Neem, and Genetically Altered Tobacco Search for Niche Markets
Guayule rubber latex has the potential to be a hypoallergenic alternative to hevea latex. Neem pesticides are highly effective against target species, yet do not harm beneficial insects or animals. Researchers are beginning to tap into the tobacco plant's protein-producing capacity to make pharmaceutical and industrial compounds.
As stated in the June 1993 issue of this report, guayule rubber presently cannot compete with hevea rubber on price in traditional rubber markets. Establishing premium rubber-product markets, reducing agricultural production costs, and developing value-added products for guayule's other polymer and fiber materials are essential to its commercialization.
Due to the upsurge in demand for latex products in the mid to late 1980's, many foreign manufacturers increased output by cutting "washing" time, which removes proteins and other cell constituents from the latex. As a result, some people experienced allergic reactions to hevea latex products. Health care professionals who routinely wear rubber gloves and patients who undergo multiple surgeries are particularly susceptible. In 1992, more than 500,000 people in the United States were affected by this allergy. Recent studies of these allergic reactions confirm that several hevea proteins are the primary allergens. Since allergic reactions to these proteins can be severe, even fatal, and the number of sensitive people is increasing, alternatives are needed.
These proteins are not found in guayule. Therefore, people allergic to hevea latex could safely use guayule products. In two different clinical studies, a total of 62 hevea-sensitive individuals showed no allergic response to guayule rubber particles. However, they continued to be allergic to purified hevea latex. So, even if hevea-product manufacturers reduce the quantity of these proteins during processing, the small amount remaining would still cause allergic reactions in hevea-sensitive people.
To help commercialize guayule, researchers at USDA's Agricultural Research Service (ARS) have developed a continuous flow extraction process, amenable to industrial scale up, to isolate guayule rubber latex from the rest of the plant. ARS's research recently was supplemented by funding from the Advanced Materials From Renewable Resources Program, a cooperative effort by USDA and the Department of Defense for industrial product development.
The potential for guayule expansion into conventional latex products is promising. Over 300 medical devices and more than 40,000 products contain hevea latex. Surgical rubber gloves and condoms are just two exam- ples. U.S. sales of surgical rubber gloves rose from $234.5 million in 1987 to $2.8 billion in 1992. The U.S.
retail market for condoms rose from $103.3 million in 1987 to approximately $500 million in 1992. Considering the small portion of a condom's retail value attributable to higher the latex, higher priced guayule latex should be cost competitive with hevea latex. Furthermore, since manu- facturers could market guayule condoms as hypoallergenic, they should be able to charge a higher price and possibly have a greater profit margin.
When guayule is processed for extraction of high-molecu- lar-weight rubber (HMWR), the major coproducts are resin and low-molecular-weight rubber (LMWR). While HMWR could be used for aircraft and land-vehicle tires and other traditional rubber products, value-added uses for resin and LMWR need to be developed. Polymer scien- tists at the University of Southern Mississippi have investigated several industrial uses for both coproducts. A marine coating that keeps barnacles from attaching to ships and a high-performance adhesive are two of the most promising prospects for guayule resin. Guayule LMWR can be used in high-quality polyurethane coatings, wood fillers, and wood finishes.
Scientists in Arizona, Texas, and California continue to improve agronomic practices for commercial guayule farming--soil nutrients, rainfall/irrigation, and planting and harvesting times, for example--in the hopes of improving yields and reducing costs. Plant breeding and genetic engineering approaches are also being used to improve guayule's natural rubber yields.
Neem Is a "Soft" Pesticide
Native to India and Burma, the neem tree has long been revered as "the village pharmacy" in many Asian cultures. However, some scientific work needs to be done before commercially successful products from neem can be used on U.S. food crops. Proponents of neem claim that the tree contains a powerful pesticide and repellent; is useful for cleaning teeth; is a natural contraceptive; and can heal wounds, infections, skin diseases, and fevers.
Neem-based pesticides are produced in many developing countries by crushing the seeds in a cloth bag and soaking the bag in a barrel of water. The water is then filtered and used as a spray. More modem refining processes can produce pesticides from neem seeds that can be applied as sprays, powders, or diluents in irrigation water.
Industrial Uses/IUS-2/December 199328

Currently, neem-derived pesticides are being used in the United States on nursery and landscaping plants. Agri- Dyne Technologies and W.R. Grace have each released neem-based bioinsecticides and expect to enter the fruit and vegetable market once the Environmental Protection Agency approves neem derivatives for food crops.
Most promising is neem's potential to provide a "soft" pesticide--effective against target species and benign to most beneficial insects. Derivatives appear to be extremely effective antifeedants (feeding inhibitors), growth regulators, and repellents. Extracts appear to affect many different pests because of the wide variety of active compounds in the seed. In addition, neem derivatives appear to be completely benign to warm-blooded animals, including humans.
Many plants are able to absorb neem derivatives and trans- port them throughout the plant. Once absorbed, the pesticide cannot be washed off, the length of protection is often in- creased, beneficial insects that do not eat the plant tissue are not harmed, and new growth after application is protected.
Azadirachtin, the primary weapon found in neem, is responsible for about 90 percent of the tree's effect on insects and other pests. The chemical does not kill insects immediately--it repels them and disrupts their normal growth cycle. Affected insects often do not mature properly. For example, they do not reach advanced stages of the life cycle, certain features never develop (such as the wings or proboscis), and larvae never emerge from eggs. In addition, the compound repels females from laying eggs on sprayed plants and, in some cases, reduces the number of eggs that they lay. Azadirachtin also appears to be one of the strongest repellents ever found; thesmallest amount of the compound will cause insects to starve to death rather than eat the affected plant. Neem seeds contain 2 to 10 milligrams of azadirachtin per gram.
Meliantriol, vilasinin, and salannin are powerful antifeedants found in neem seeds. Small concentrations of these com- pounds can cause insects to stop eating altogether. Locusts and grasshoppers, California red scale, most beetles and flies, numerous destructive larva, weevils, fire ants, and several moth species are all greatly affected by these compounds. Other substances in neem apparently paralyze the "swallowing mechanism," thus causing the pest to die.
Neem seeds also contain two antiviral compounds, nirnbin and nimbidin. These are the first virus-inhibiting chemi- cals found in plants. They seem to be most effective against plant viruses carried by insects. The tobacco mosaic virus, which affects tobacco and some vegetable crops, has been susceptible to neem extracts in early trials. Further testing of neem's antiviral activity is needed before any strong conclusions can be made.
In tropical and sub-tropical climates, neem holds considerable potential as a plantation crop with numerous high-value products. The tree grows well in poor soils under extremely
high temperatures and low rainfall. But it cannot withstand freezing, extended cold, or excessive amounts of water. Currently, almost all neem used in the United States comes from India, Africa, and Indonesia. Experimental plots have been planted in southern Florida, California, and Arizona.
Tobacco as a Protein and Drug Factory
Tobacco, long considered one of the major causes of cancer, may play a significant role in fighting that disease as well as other human ailments. Scientists at North Carolina State University (NCSU), along with RJ Reynolds Tobacco Company and Biosource Genetics, have field tested strains of tobacco and tobacco viruses that harness the plant's energy for production of anti-cancer and anti-AIDS drugs, human blood proteins, food-grade protein, and other pharmaceutical and industrial compounds.
According to Raymond J. Long, professor of Crop Science at NCSU, tobacco is readily amenable to genetic manipu- lation--"it's the white mouse of the plant world." The plant is ideal for producing large quantities of protein and protein products because the bulk of the plant's resources are aimed at developing leaves, not seed, fruit, or flowers as is the case with most food crops. Typical protein yields from tobacco are 2,200 to 2,600 pounds per acre.
Tobacco protein has been used to make an anti-AIDS drug and human serum albumin, a blood protein used to replace blood lost during surgery. Human antibodies and anti-cancer drugs are among the compounds being tested. Preliminary estimates suggest that production of such chemicals in tobacco could gross up to $12,000 per acre. However, farmers would probably not receive this entire amount. Current U.S. tobacco production grosses about $3,500 per acre. In addition, pharmaceuticals from genetically modified plants would have to compete with similarly modified bacteria and animals (see the animal products section).
Permanent gene transfer and the use of genetically altered viruses are two methods used to turn tobacco plants into chemical factories. Permanent gene transfer involves inserting a gene with the desired trait into a tobacco cell's DNA. The cell is then grown into an entire tobacco plant with the new genetic material. This plant is able to produce large quantities of the target chemical and can pass its newfound productive capability to its progeny.
At Biosource Genetics, biotechnologists have spliced into the tobacco mosaic virus and inserted instructions to make an anti-AIDS drug, human hemoglobin, and two enzymes. The altered virus was then sprayed onto a special field of tobacco and the infected plants began running the virus' genetic program. After harvest, the leaves were ground up and the target chemicals were extracted. Commercial use of this technology could occur by 1995. However, none of these new methods of protein production have been approved for commercial use by the Food and Drug Administration. [David Pace (606) 257-7272]
Industrial Uses/IUS-2/December 199329

Special Article
The Feasibility of Producing Biodiesel in the United States Using a Community-Based Facility
J. Alan Weber'
Abstract: Biodiesel fuel can be made from vegetable oils, animal fats, and waste grease from the food industry. Biodiesel blended with petroleum diesel is being examined as a potential fuel in urban areas to meet Clean Air Act standards. But what about using biodiesel on the farm? Farmer cooperatives in Austria are producing biodiesel for their members. A simulation model was developed to evaluate the feasibility of a community-based 500,000-gallon biodiesel plant in the United States. Soybeans were found to be the most cost-effective feedstock, mainly because the meal is a useful coproduct. Biodiesel costs were heavily dependent upon the prices paid for the beans and received for the meal. The resulting biodiesel is not competitive with the price farmers pay for conventional diesel fuel.
Keywords: Biodiesel, renewable fuels, diesel fuel, soybeans.
The idea of chemically altering vegetable oils for use as fuel was noted even before World War 11. For example, Walton wrote in 1938, "...to get the utmost value from vegetable oils as fuels it is academically necessary to split off the glycerides and to run on the residual fatty acid" (I). The glycerides are likely to cause excess carbon deposits in comparison with petroleum diesel.
Although not studied extensively until later, animal fats can also be converted into biodiesel. The chemical process used to transform vegetable oils, animal fats, and/or waste grease into usable energy is called "esterifi- cation." Esterification changes the large triglyceride molecules in fats and oils into three smaller molecules. The resulting biodiesel has performance characteristics similar to petroleum-based diesel fuel. Biodiesel can be burned in unmodified diesel engines either in pure form or blended with conventional diesel fuel. Extrusion and esterification also yield usable coproducts, like oilseed meal and glycerine.
U.S. Farms Are Significant Users of Diesel Fuel
Real diesel prices for agricultural production declined markedly between 1981 and 1986, stabilized in 1987 and 1988, and then rose slightly in 1989 and 1990 (figure A-1) (2). During this period, on-farm diesel use did not move opposite price as is generally expected. As shown in figure 1, on-farm diesel use trended downward between 1982 and 1989. The two primary reasons for the decrease are greater fuel-efficiency, due to improved technology and a shift toward larger, more fuel-efficient equipment,
'Agricultural Economist, Department of Agricultural Economics, University of Missouri, Columbia, MO.
Figure A-1
Diesel-Fuel Consumption and Price for Agriculture Billion gallons $ per gallon 4.0 1.4
3.5 Deflated price (1 987 $1
and dramatic changes in cropping practices, particularly the widespread adoption of no-till and conservation-till.
Since 1989, however, diesel consumption has moved upwards, even though real diesel prices have fluctuated. Greater on-farm use is most likely due to the depletion of agricultural stocks following the drought of the late 1980's, the subsequent lower acreage reduction require- ments of Federal commodity programs, and the low price of diesel fuel relative to other energy sources (2).
Potential Demand for Biodiesel
With the increasingly stringent environmental regulations specified in the Clean Air Act Amendments of 1990, biodiesel is being examined as a possible alternative to
Industrial Uses/IUS-2/December 199330

petroleum-based diesel fuel. Biodiesel is biodegradable and produces less carbon monoxide, sulfur oxides, hydro- carbons, smoke, and particulate matter compared to petroleum-based diesel. (See the fats and oils section for more details.)
Testing suggests that engine power and fuel efficiency of biodiesel and conventional diesel are similar. Biodiesel's viscosity (flow resistance of liquid) is approximately twice that of petroleum-based diesel fuel. Increases in viscosity may cause injector spray problems in some diesel engines. Moreover, the pour point and cloud point of biodiesel are a few degrees higher than regular diesel. Consequently, as with conventional diesel, additives will be necessary to prevent fuel-gelling and/or storage problems in cold weather. On the up side, the higher flash point of bio- diesel means safer handling. And biodiesel's cetane rating, which measures a fuel's igniting ability, is greater than that of petroleum-based diesel fuel.
Non-Price Factors Spur Growth of Biodiesel Industry
There are two main forces affecting the biodiesel industry in the United States. Environmentalbenefits are creating increased interest and research, but poor economics is inhibiting production and use. In Europe, biodiesel is considered environmentally friendly and, in some areas, government incentives are being used to encourage biodiesel production and use. Testing in the United States also supports the claim that biodiesel will decrease engine exhaust emissions.
However, in the United States, refined vegetable oils, which are potential feedstocks for biodiesel production, are currently more expensive than petroleum-based diesel fuel. Lower cost inedible tallow and waste grease from restau- rants and fast-food establishments may be cheaper feed- stocks, but the resulting biodiesel would still be more expensive than standard diesel.
Nevertheless, because of clean air regulations, many users of diesel fuel--such as urban transit agencies--view biodiesel as a potential option. Some industry experts believe a blend of diesel and biodiesel may be the least expensive way to meet the new air quality standards. It may be less costly to purchase slightly more expensive biodiesel-diesel blends than to retrofit or purchase engines that bum other types of fuel, such as compressed natural gas or methanol. In addition, biodiesel can be used in existing handling facilities, unlike some other alternatives.
Until the Clean Air Act provisions are fully implemented, biodiesel cannot compete on price with petroleum-based diesel fuel in urban areas. But what about on farms? Some have argued that if farmers retain ownership of their oilseeds and eliminate some of the typical marketing charges paid to processors and transporters, then biodiesel may be an eco- nomically viable alternative for some agricultural producers.
Biodiesel Production and Use in Austria
Such a program is already underway in several Austrian communities. Austrian farmers grow oilseeds and have them processed into biodiesel and high-quality meal for livestock. Of particular interest is a cooperative arrange- ment in Neulangbach, Austria. They employ a closed-loop system that eliminates the additional costs that normally accrue to feed manufacturers, feed dealers, and transporta- tion companies. Producers retain ownership of their crop and the resulting products during the entire process, and the cooperative charges a processing fee that covers capital and operating costs.
The cooperative has approximately 290 farmer-members. Production from the 1,235 acres of oilseeds--rapeseed and sunflower--amounts to about 150,000 gallons of biodiesel each year. In addition, around 1,000 metric tons of meal are used by the farmers as a protein source in livestock feed.
Labor requirements are relatively small due to the highly automated plant. Only 4 to 5 man-hours are required each day. The process is totally automated, except when the potassium hydroxide catalyst must be mixed with the alcohol to initiate the esterification process. Strict quality control procedures ensure a consistent product that meets proposed Austrian fuel standards. The plant has been in operation since 1990, producing high-quality biodiesel for use in approximately 700 machines owned by cooperative members. The farmers have recently doubled plant capacity .
Many of the components of this system could be trans- ferred to the United States. However, there are policy differences between the two countries that influence its viability. For example, Austrian farmers receive subsidies to convert acreage from cereal grains to oilseeds. Further- more, biodiesel is exempt from most of the taxes imposed on petroleum-based diesel fuel in Austria. Neither form of government assistance is currently available in the United States.
Evaluating a U.S. Community-Based System
Dedicated biodiesel plants do not presently exist in the United States. Current production is limited to industries that esterify oils for other products. Therefore, in order to analyze the economic feasibility of producing fuel at the community level, information was gathered from private firms that manufacture equipment that could be used for biodiesel production. This study uses a spreadsheet format to simulate potential economic changes resulting from various scenarios including different feedstocks, input costs, and coproduct values. The simulation model was created in an effort to allow farmers to evaluate potential profits of investing in a community-based biodiesel facility.
Industrial Uses/IUS-2/December 199331

The model plant for this study closely parallels the Austrian cooperative. The facility is a closed-loop system, operated as a cooperative, in which farmer-members retain ownership of their oilseeds and processed products. Oilseed crushing and biodiesel production occur at the plant. The cooperative charges a processing fee that covers capital and operating costs. Because any triglycer- ide can be processed into biodiesel, several feedstock options exist. Oilseeds--like soybeans, canola, and sunflower-as well as animal fats and waste grease can be used.
Biodiesel and oilseed meal are intended for use by the farmer-members. However, either of these products can be sold on the open market. The glycerine coproduct can also be sold on the open market as a commodity chemical (see the fats and oils section).
The extrusion and expelling equipment used in this study is a mechanical-press-based system manufactured by Triple "F," Inc. (DesMoines, IA). The extruders/expellers were first developed in the mid-1960's and accurate operating information is available. The continuous-flow esterification unit is designed by Stratco, Inc. (Leawood, KS). Thistechnology has been evaluated only in a pilot plant. All product input and output data, costs of equip- ment purchase and operation, repairs, utility usage, and other important cost information were provided by Triple "F" and Stratco for use in this analysis.
The biodiesel facility is assumed to be installed in an existing grain handling facility or feed mill, thus eliminat- ing excessive capital costs. Presently, many small or private grain handling facilities and feed mills are experi- encing excess capacity. By utilizing existing facilities overhead costs are minimized. Equipment costs represent the primary capital investment. The annual capacity of the plant is assumed to be 500,000 gallons of biodiesel per year. The unit is highly automated to minimize labor costs.
In order to simplify the analysis, it is assumed thatthe farmer-members have similar characteristics. They are diversified crop and livestock producers, each able to grow oilseeds and have a need for the meal. They also receive similar prices for their crops and pay similar prices for inputs. Because the model includes the feedstock costs and coproduct values of individual farmers, this assump- tion is important in order to examine the overall feasibility of the plant. In reality, farmers face various conditions, and individual circumstances would dictate the final residual cost of biodiesel fuels.
As an initial reference point, it is assumed that farmer- members value their oilseeds and meal at the following prices:
Oilseed prices represent the June 1993 spot market price in central Missouri: $5.60 per bushel for soy-
beans, $4.25 per bushel for canola, and 11 cents per pound for sunflowers; and
Two values for soybean meal (44-percent protein) are used: (1) the average 1992 wholesale price ($172 per ton) and (2) the midpoint between the average 1992 wholesale and retail prices (approximately $220 per ton); canola meal (38-percent protein) is valued at $190 per ton; and sunflower meal (28-percent protein) at $140 per ton.2
The extrusion/expelling equipment used to simulate a community-based facility is too small to produce 500,000 gallons of soybean-based biodiesel per year. If a higher- content oilseed were used, like canola or sunflower, then the esterification equipment would be fully utilized without purchasing additional extrusion/expelling equipment.
The following additional assumptions were made for this model:
Utility hookups are available and on-site;
The extrusion/expelling equipment operates 300 days per year, 24 hours a day;
Oil yields from crushing are 10 percent for soybeans and 27 percent for canola and sunflowers;3
Esterification equipment operates 330 days per year, 24 hours a day;
Crude glycerine is valued at 30 cents per pound; and
Electricity is purchased at 7 cents per kilowatt hour.
The simulation model was designed to consider multiple feedstocks. Soybeans, canola, sunflower, and tallow were evaluated as potential feedstocks (table A-1).
Using Soybeans as the Primary Feedstock
Capital costs for the extrusion and esterification equipment were amortized over 15 years. Under the scenario using soybeans as the primary feedstock, this resulted in an annual cost of $352,109 (table A-2). Soybean and canola purchases account for 79 percent of operating costs. Total annual costs equal $4,288,047.
In 1992, farmers paid approximately $260 per ton for soybean meal, while the average wholesale price was $172--a difference of $88 per ton. Included in this price
2/The meal values for canola and sunflowers are based on a protein content similar to that for soybean meal.
'Mechanical presses remove less oil than solvent extraction. In addition, according to representatives from Triple "F," Inc., leaving some residual oil in the meal creates a higher energy protein source for animal feeds.
Industrial Uses/IUS-2/December 199332
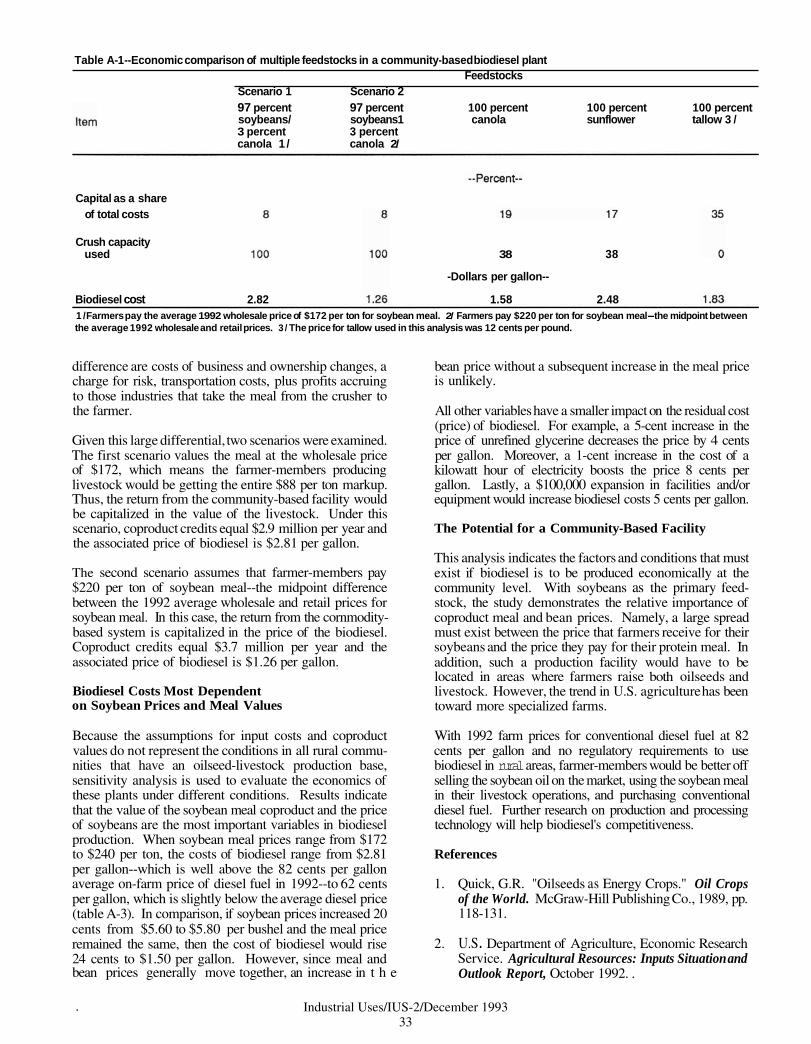
Table A-1 --Economic comparison of multiple feedstocks in a community-based biodiesel plant Feedstocks
Scenario 1 Scenario 2 97 percent 97 percent 100 percent 100 percent 100 percent soybeans/ soybeans1 canola sunflower tallow 3 /3 percent 3 percent canola 1 / canola 2/
Capital as a share of total costs
Crush capacity used
Biodiesel cost 2.82
38 38
-Dollars per gallon--
1.58 2.48 1 /Farmers pay the average 1992 wholesale price of $172 per ton for soybean meal. 2/ Farmers pay $220 per ton for soybean meal-the midpoint between the average 1992 wholesale and retail prices. 3 / The price for tallow used in this analysis was 12 cents per pound.
difference are costs of business and ownership changes, a charge for risk, transportation costs, plus profits accruing to those industries that take the meal from the crusher to the farmer.
Given this large differential, two scenarios were examined. The first scenario values the meal at the wholesale price of $172, which means the farmer-members producing livestock would be getting the entire $88 per ton markup. Thus, the return from the community-based facility would be capitalized in the value of the livestock. Under this scenario, coproduct credits equal $2.9 million per year and the associated price of biodiesel is $2.81 per gallon.
The second scenario assumes that farmer-members pay $220 per ton of soybean meal--the midpoint difference between the 1992 average wholesale and retail prices for soybean meal. In this case, the return from the cornmodity- based system is capitalized in the price of the biodiesel. Coproduct credits equal $3.7 million per year and the associated price of biodiesel is $1.26 per gallon.
Biodiesel Costs Most Dependent on Soybean Prices and Meal Values
Because the assumptions for input costs and coproduct values do not represent the conditions in all rural commu- nities that have an oilseed-livestock production base, sensitivity analysis is used to evaluate the economics of these plants under different conditions. Results indicate that the value of the soybean meal coproduct and the price of soybeans are the most important variables in biodiesel production. When soybean meal prices range from $172 to $240 per ton, the costs of biodiesel range from $2.81 per gallon--which is well above the 82 cents per gallon average on-farm price of diesel fuel in 1992--to 62 cents per gallon, which is slightly below the average diesel price (table A-3). In comparison, if soybean prices increased 20 cents from $5.60 to $5.80 per bushel and the meal price remained the same, then the cost of biodiesel would rise 24 cents to $1.50 per gallon. However, since meal and bean prices generally move together, an increase in t h e
bean price without a subsequent increase in the meal price is unlikely.
All other variables have a smaller impact on the residual cost (price) of biodiesel. For example, a 5-cent increase in the price of unrefined glycerine decreases the price by 4 cents per gallon. Moreover, a 1-cent increase in the cost of a kilowatt hour of electricity boosts the price 8 cents per gallon. Lastly, a $100,000 expansion in facilities and/or equipment would increase biodiesel costs 5 cents per gallon.
The Potential for a Community-Based Facility
This analysis indicates the factors and conditions that must exist if biodiesel is to be produced economically at the community level. With soybeans as the primary feed- stock, the study demonstrates the relative importance of coproduct meal and bean prices. Namely, a large spread must exist between the price that farmers receive for their soybeans and the price they pay for their protein meal. In addition, such a production facility would have to be located in areas where farmers raise both oilseeds and livestock. However, the trend in U.S. agriculture has been toward more specialized farms.
With 1992 farm prices for conventional diesel fuel at 82 cents per gallon and no regulatory requirements to use biodiesel in rural areas, farmer-members would be better off selling the soybean oil on the market, using the soybean meal in their livestock operations, and purchasing conventional diesel fuel. Further research on production and processing technology will help biodiesel's competitiveness.
References
1. Quick, G.R. "Oilseeds as Energy Crops." Oil Crops of the World. McGraw-Hill Publishing Co., 1989, pp. 118-131.
2. U.S . Department of Agriculture, Economic Research Service. Agricultural Resources: Inputs Situation and Outlook Report, October 1992. .
. Industrial Uses/IUS-2/December 199333

Table A2--Costs and coproduct credits for a 500,000-gallon communitv-based biodiesel olant in Missouri. 1993
ltem Scenario 1 Scenario 2 wholesale midpoint
price 1 / price 2/
Amortized annual capital costs 3/Extrusion & expelling 102,559 1 02,559 Esterification 249,550 249,550
Total 352,109 352,109
Annual operating costs Feedstocks
Soybeans 3,333,455 3,333,455 Canola 34,775 34,775
Oilseed pressing 329,849 329,849 Esterification 4 / 144,894 144,894 Sales and administration 83,408 83,408 Maintainence and other associated costs 9,557 9,557
Total 3,935,938 3,935,938
Total annual costs 4,288,047 4,288,047
Coproduct credits Soybean meal Canola meal Glycerine
Total
Net cost of biodiesel per year 1,387,355 61 0,078
Net cost per gallon Transportation costs 5/Final biodiesel cost 6/1/Farmers pay the average 1992 wholesale price of $172 per ton for soybean meal. 2/ Farmers pay $220 per ton for soybean meal--the midpoint between the average 1992 wholesale and retail prices. 31 The capital costs provided by Triple "F"and Stratco were amortized assuming a 15-year book life, non-regulated firm with 30 percent equity and 10 percent debt, and no tax preferences. These data were developed based on methodology used in a report published by JACOR (a consulting firm in Arlington, VA). which was based on biomass cost estimates developed at Argonne National Laboratory. 41 Esterification costs include labor and materials, such as methanol and the catalyst. The methanol was valued at 50 cents per gallon and the catalyst at 30 cents per pound. 5/Transpotiation costs (TC) were approximated by utilizing the following equation: TC = 7 + 0.623 D1. Dl equals the distance traveled. Raw material transportation costs were found to be approximately 4 cents for each gallon of soybean oil. Because biodiesel and soybean oil have approximately the same weight. their per-gallon transportation costs are the same. 61 Does not include profit margins ebove and beyond the returns to resources assumed needed to bring and hold the resources into use.
Table A-3--Estimated cost of biodiesel from a 500,000-gallon biodiesel plant with varying prices for soybeans and soybean meal
Item Price Biodiesel cost
Dollars Dollars per bushel per gallon
Soybeans 5.25 0.85 5.50 1.1 4 5.60 1.26 5.80 1.50
Dollars per ton
Soybean meal 172 2.81 200 1.91 220 1.26 240 0.62
Industrial Uses/IUS-2/December 199334

List of Tables
Tables Page
Major industrial users of lubricants and their projected 1994 growth . . . . . . . . . . . . . . . . . . . . . . . . . . . . . 9 Price forecasts for castor and coconut oil. 1993194 . . . . . . . . . . . . . . . . . . . . . . . . . . . . . . . . . . . . . . . . . 14 Uses of glycerine by industry . . . . . . . . . . . . . . . . . . . . . . . . . . . . . . . . . . . . . . . . . . . . . . . . . . . . . . . . 16 ORTECH emissions test results . . . . . . . . . . . . . . . . . . . . . . . . . . . . . . . . . . . . . . . . . . . . . . . . . . . . . . 18 Biodiesel demonstrations sponsored by the National SoyDiesel
Development Board and/or State soybean boards . . . . . . . . . . . . . . . . . . . . . . . . . . . . . . . . . . . . . . . . . 18 Kenaf acreage. United States. 1992-93 . . . . . . . . . . . . . . . . . . . . . . . . . . . . . . . . . . . . . . . . . . . . . . . . . 19 U.S. woodpulp capacity. 1970-92 . . . . . . . . . . . . . . . . . . . . . . . . . . . . . . . . . . . . . . . . . . . . . . . . . . . . . 24 Comparison of kraft and mechanical pulp properties . . . . . . . . . . . . . . . . . . . . . . . . . . . . . . . . . . . . . . . . 26 Utilization of wastepaper by U.S. paper and paperboard mills. 1970-92 . . . . . . . . . . . . . . . . . . . . . . . . . . . 27 Industrial rapeseed oil. crude and refined. imports. by country. 1989-92 . . . . . . . . . . . . . . . . . . . . . . . . . . 36 Linseed oil. crude and refined, imports. by country. 1989-92 . . . . . . . . . . . . . . . . . . . . . . . . . . . . . . . . . . 36 Linseed oil. crude and refined, exports. by country. 1989-92 . . . . . . . . . . . . . . . . . . . . . . . . . . . . . . . . . . 36 Castor oil. crude and refined. imports. by country. 1989-92 . . . . . . . . . . . . . . . . . . . . . . . . . . . . . . . . . . . 36 Tung oil. imports. by country. 1989-92 . . . . . . . . . . . . . . . . . . . . . . . . . . . . . . . . . . . . . . . . . . . . . . . . . 37 Tung oil. exports. by country. 1989-92 . . . . . . . . . . . . . . . . . . . . . . . . . . . . . . . . . . . . . . . . . . . . . . . . . 37 Jojoba oil. imports. by country. 1989-92 . . . . . . . . . . . . . . . . . . . . . . . . . . . . . . . . . . . . . . . . . . . . . . . . 37 Jojoba oil. exports. by country. 1989-92 . . . . . . . . . . . . . . . . . . . . . . . . . . . . . . . . . . . . . . . . . . . . . . . . 37 Raw and processed flax. imports. by country. 1989-92 . . . . . . . . . . . . . . . . . . . . . . . . . . . . . . . . . . . . . . 38 Raw and processed flax. exports. by country. 1989-92 . . . . . . . . . . . . . . . . . . . . . . . . . . . . . . . . . . . . . . 38 Flax yarn. imports. by country. 1989-92 . . . . . . . . . . . . . . . . . . . . . . . . . . . . . . . . . . . . . . . . . . . . . . . . 38 Flax yarn. exports. by country. 1989-92 . . . . . . . . . . . . . . . . . . . . . . . . . . . . . . . . . . . . . . . . . . . . . . . . 38 Raw and processed jute and other textile bast fibers. imports. by country. 1989-92 . . . . . . . . . . . . . . . . . . . 39 Raw and processed jute and other textile bast fibers. exports. by country. 1989-92 . . . . . . . . . . . . . . . . . . . 39 Yarns of jute and other textile bast fibers. imports. by country. 1989-92 . . . . . . . . . . . . . . . . . . . . . . . . . . 39 Yarns of jute and other textile bast fibers. exports. by country. 1989-92 . . . . . . . . . . . . . . . . . . . . . . . . . . 39 Raw and processed sisal. imports. by country. 1989-92 . . . . . . . . . . . . . . . . . . . . . . . . . . . . . . . . . . . . . . 40 Raw and processed sisal. exports. by country. 1989-92 . . . . . . . . . . . . . . . . . . . . . . . . . . . . . . . . . . . . . . 40 Raw and processed abaca. imports. by country. 1989-92 . . . . . . . . . . . . . . . . . . . . . . . . . . . . . . . . . . . . . 40 Raw and processed abaca. exports. by country. 1989-92 . . . . . . . . . . . . . . . . . . . . . . . . . . . . . . . . . . . . . 40 Raw and processed coir. imports. by country. 1989-92 . . . . . . . . . . . . . . . . . . . . . . . . . . . . . . . . . . . . . . 41 Raw and processed coir. exports. by country. 1989-92 . . . . . . . . . . . . . . . . . . . . . . . . . . . . . . . . . . . . . . 41 Coir yarn. imports. by country. 1989-92 . . . . . . . . . . . . . . . . . . . . . . . . . . . . . . . . . . . . . . . . . . . . . . . . 41 Coir yarn. exports. by country. 1989-92 . . . . . . . . . . . . . . . . . . . . . . . . . . . . . . . . . . . . . . . . . . . . . . . . 41 Natural rubber latex. whether or not prevulcanized. imports. by country. 1989-92 . . . . . . . . . . . . . . . . . . . 42 Natural rubber latex. whether or not prevulcanized exports. by country. 1989.92 *. . . . . . . . . . . . . . . . . . . . 42 Natural rubber in smoked sheets. exports. by country. 1989-92 . . . . . . . . . . . . . . . . . . . . . . . . . . . . . . . . 42 Technically specified natural rubber. exports. by country. 1989-92 . . . . . . . . . . . . . . . . . . . . . . . . . . . . . . 42 Other natural rubber. imports. by country. 1989-92 . . . . . . . . . . . . . . . . . . . . . . . . . . . . . . . . . . . . . . . . . 43 Other natural rubber. exports. by country. 1989-92 . . . . . . . . . . . . . . . . . . . . . . . . . . . . . . . . . . . . . . . . . 43 Other forms and aflicles of unvulcanized natural rubber. imports. by country. 1989-92 . . . . . . . . . . . . . . . . 43
Article tables A1 . Economic comparison of multiple feedstocks in a community-based biodiesel plant . . . . . . . . . . . . . . . . . . 33 A.2 . Costs and coproduct credits for a 500,OO 0.gallon community-based biodiesel plant in
. . . . . . . . . . . . . . . . . . . . . . . . . . . . . . . . . . . . . . . . . . . . . . . . . . . . . . . . . . . . . . . . . Missouri, 1993 34 A.3 . Estimated costs of biodiesel from a 500,OO 0.gallon biodiesel plant with varying prices for
soybeans and soybean meal . . . . . . . . . . . . . . . . . . . . . . . . . . . . . . . . . . . . . . . . . . . . . . . . . . . . . . . . 34
The United States Department of Agriculture (USDA) prohibits discrimination in Its programs on the basis of race. cdor. national origin. sex. religion. age. disabll- ity. political beliefs and marital or familial status . (Not all prohibited bases apply to all programs) . Persons with disabilities who require alternative means for communication of program information (braille. large print. audiotape. etc.) should contact the USDA Office of Communications at (202) 720-5881 (voice) or (202) 720-7808 (TDD) . To file a complaint. write the Secretary of Agriculture. U.S. Department of Agriculture. Washington. D.C., 20250. or call (202) 720-7327 (voice) or (202) 720-1 127 (TDD) . USDA is an equal opportunity en-ployer .
Industrial Uses/IUS-2/December 199335

Table 10--Industrial rapeseed oil, crude and refined, imports, by country, 1989-92 1/Country 1989 1990 1991 1992 4-yr avg
--Kilograms--
Canada 7,131,254 4,593,176 4,475,384 3,578,674 4,944,622 Germany, West 1,005,137 2,402,960 0 0 852,024 Germany, East 1,546,041 519,765 0 0 51 6,452 Netherlands 0 2,000,884 0 0 500,221 Sweden 0 2,000,375 0 0 500,094 France 0 1,797,600 0 0 449,400
Total 9.682.432 13.31 4.760 4,475,384 3,578,674 7,762,813 1 / Includes colza and mustard oils for industrial uses.
Source: Bureau d Census, Department of Commerce.
Table 11--Linseed oil, crude and refined, imports, by country, 1989-92 1/ Countrv 1989 1990 1991 1992 4-vr ava
Canada United Kingdom Japan Germany, West Italy Spain Netherlands France
Total 11 Not chemically modified.
Source: Bureau ofCensus. Department of Commerce.
Table 12--Linseed oil. crude and refined. exports. bv countrv. 1989-92 1/. . . . , . Countrv 1989 1990 1991 1992 4-vr ava
Mexico Canada Netherlands Korea, South Jamaica United Kingdom Aruba Australia Japan France Trinidad and Tobago Other
Total 1 /Not chemically modified.
Source: Bureau d Census. Department of Commerce.
Table 13--Castor oil, crude and refined, imports, by country, 1989-92 1/Country 1989 1990 1991 1992 4-yr avg
India Brazil Ecuador Thailand Philippines Mexico Other
Total 37,835,000 1/Not chemically modified.
Source: Bureau d Census. Department of Commerce.
Industrial Uses/IUS-2/December 199336

Table 14-Tung oil, imports, by country, 1989-92 11 Country 1989 1990 1991 1992 4-yr avg
Argentina Paraguay China Other
Total 6,474,302 4,045,054 5,644,761 4,996,197 5,290,079 1 /Whether or not refined. Not chemically modified.
Source: Bureau d Census, Department of Commerce.
Table 15--Tung oil, exports, by country, 1989-92 11 Country 1989 1990 1991 1992 4-yr avg
Canada 139,997 238,302 330,185 199,769 227,063
Mexico 43,286 48,443 103,250 106,437 75,354 Colombia 19,712 19,414 26,122 2,859 17,027 Chile 0 0 29,628 0 7,407 Trinidad and Tobago 0 0 0 14,270 3,568 Other 14,904 4,143 9,370 6,712 8,782
Total 21 7.899 31 0.302 498.555 330.047 339.201 11 Whether or not refined. Not chemically modified.
Source: Bureau d Census, Department of Commerce.
Table 16--Jojoba oil. imports. bv countrv. 1989-92 1/Country 1989 1990 1991 1992 4-yr avg
--Kilograms--
Mexico Israel Japan
Total 21 4.524 180.999 385.957 234,074 253.889 1 /Whether or not refined. Not chemically modified.
Source: Bureau of Census. Department of Commerce.
Table 17--Jojoba oil, exports, by country, 1989-92 11 Country 1989 1990 1991 1992 4-vr ava
Germany, West Japan France Netherlands Korea, South United Kingdom Mexico Spain Australia Other
Total 21 2.571 282.522 323,827 21 3,633 258.1 38 11 Whether or not refined. Not chemically modified.
Source: Bureau d Census, Department of Commerce.
Industrial Uses/IUS-2/December 199337

Table 18--Raw and processed flax. imports,bv countrv. 1989-92 1/. , , . . Countrv 1989 1990 1991 1992 4-vr ava
Canada Belgium Egypt France China - Mainland Romania U.S.S.R. Hungary Other
Total 159,221,154 149,166,016 121,358,633 106.1 91.61 0 133,984,357 1/ Processed but not spun. Includes flax tow and waste.
Source: Bureau of Census, Department of Commerce.
Table 19--Raw and processed flax. exports. bv countrv. 1989-92 1 /. . . . . . Countrv 1989 1990 1991 1992 4-vr avg
Canada Mexico Brazil South Korea Japan Other
Total 343,135 356,531 1,238,069 8,134,914 2.51 8,165 1 /Processed but not spun. Includes flax tow and waste.
Source: Bureau d Census. Department of Commerce.
Table 20--Flax yarn, imports, by country, 1989-92 Countrv 1989 1990 1991 1992 4-vr avg
Belgium United Kingdom Hungary Ireland Canada West Germany China - Mainland Other
Total Source: Bureau d Census, Department of Commerce.
Table 21 --Flax varn. exports,bv countrv. 1989-92 . . , , . , . Country 1989 1990 1991 1992 4-yr avg
--Kilograms--
Australia Brazil United Kingdom France Finland Canada Hong Kong Other
Total 69,767 484,592 271,461 461,249 321,775
Source: Bureau of Census. Department of Commerce.
Industrial Uses/IUS-2/December 199338

Table 22--Raw and processed jute and other textile bast fibers, imports, by country, 1989-92 1 /Country 1989 1990 1991 1992 4-yr avg
--Kilograms--
lndia Bangladesh China - Mainland Canada Belgium Mexico Netherlands Thailand Other
Total 15.068.71 9 8.672.289 12.052.228 13.763.343 12.389.1471 /Processed but not spun. Excludes flax, hemp, and ramie. Includes tow and waste.
Source: Bureau d Census, Department of Commerce.
Table 23--Raw and processed jute and other textile bast fibers, exports, by country, 1989-92 1/Country 1989 1990 1991 1992 4-yr avg
--Kilograms--
Mexico Greece Belgium United Kingdom West Germany Portugal China - Mainland Canada Other
Total 12.948.357 7,808,336 6,900,322 3,382,436 7,759,871 1 /Processed but not spun. Excludes flax, hemp, and ramie. Includes tow and waste.
Source: Bureau d Census, Department of Commerce.
Table 24--Yarns of jute and other textile bast fibers, imports, by country, 1989-92 Country 1989 1990 1991 1992 4-yr avg
--Kilograms--
Bangladesh Thailand lndia United Kingdom Canada Belgium Taiwan Philippines Other
Total 17,402,073 12,692,544 16,512,137 1 1,862,037 14,617,200 Source: Bureau of Census. Department of Commerce.
Table 25--Yarns of iute and other textile bast fibers. exports. bv countrv. 1989-92 Country 1989 1990 1991 1992 4-yr avg
--Kilograms--
United Kingdom Mexico Canada Other
Total 1,766,981 1,381,992 1,332,505 1,304,836 1,446,582
Source: Bureau of Census, Depatlment of Commerce.
Industrial Uses/IUS-2/December 199339

Table 26--Raw and processed sisal, imports, by country, 1989-92 1 /Country 1989 1990 1991 1992 4-yr avg
--Kilograms--
Mexico Tanzania Brazil India Kenya Haiti Portugal Canada Philippines Other
Total 2,327,001 1,311,929 1,000,384 445,211 1,271,134 1 /Processed but not spun. Includes other textile fibers of the genus Agave and tow and waste of these fibers.
Source: Bureau d Census. Department of Commerce.
Table 27--Raw and processed sisal, exports, by country, 1989-92 1 /Country 1989 1990 1991 1992 4-yr avg
--Kilograms--
Canada Mexico United Kingdom South Korea Colombia France Other
Total 909,168 735,996 3,228,550 1 /Processed but not spun. lncludes other textile fibers of the genus Agave and tow and waste of these fibers
Source: Bureau ofCensus. Department of Commerce.
Table 28--Raw and processedabaca. i m p o r t sbv countrv. 1989-92 1 /Country 1989 1990 1991 1992 4-yr avg
--Kilograms--
Philippines Ecuador United Kingdom Chile Brazil Other
Total 24,791,853 24,012,847 26,407,881 20,501,520 23,928,526 11 Processed but not spun. Includes tow and waste.
Source: Bureau d Census, Department of Commerce.
Table 29--Raw and processed abaca, exports, by country, 1989-92 1/Country 1989 1990 1991 1992 4-vr ava
Spain Yeman (Sana) United Kingdom Other
Total 11 Processed but not spun. Includes tow and waste.
Source: Bureau d Census. Department of Commerce.
Industrial Uses/IUS-2/December 199340

Table 30--Raw and processed coir, imports, by country, 1989-92 1 /Country 1989 1990 1991 1992 4-yr avg
Sri Lanka Mexico lndia West Germany Philippines Dominican Republic Other
Total 1 /Processed but not spun. Includes tow and waste.
Source: Bureau ofCensus, Department of Commerce.
Table 31--Raw and processed coir, exports, by country, 1989-92 1/Country 1989 1990 1991 1992 4-yr avg
--Kilograms--
Canada Japan United Kingdom Argentina Jamaica Other
Total 675,933 76,272 432,364 1,124,369 577,235 1 /Processed but not spun. Includes tow and waste.
Source: Bureau d Census. Department of Commerce.
Table 32--Coir yarn, imports, by country, 1989-92 Countrv 1989 1990 1991 , 1992 4-vr avg
Sri Lanka lndia
Total 3,319,062 5,954,863 7,048,042 6,458,840 5,695,202 Source: Bureau ofCensus. Department of Commerce.
Table 33--Coir yam, exports, by country, 1989-92 Countrv 1989 1990 1991 1992 4-vr ava
United Kingdom Canada Other
Total 22,145 584 1,940 789 6,364 Source: Bureau of Census. Department of Commerce.
Industrial Uses/IUS-2/December 199341
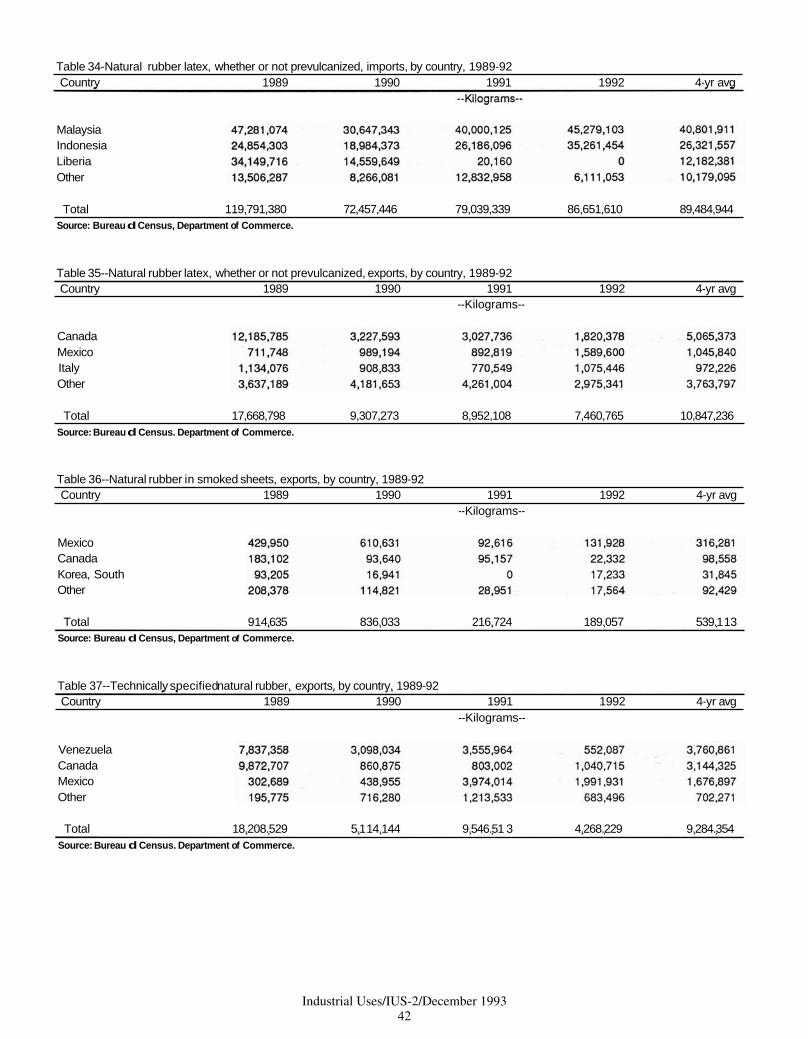
Table 34-Natural rubber latex, whether or not prevulcanized, imports, by country, 1989-92 Country 1989 1990 1991 1992 4-yr avg
Malaysia Indonesia Liberia Other
Total 1 19,791,380 72,457,446 79,039,339 86,651,610 89,484,944 Source: Bureau d Census, Department of Commerce.
Table 35--Natural rubber latex, whether or not prevulcanized, exports, by country, 1989-92 Country 1989 1990 1991 1992 4-yr avg
--Kilograms--
Canada Mexico Italy Other
Total 17,668,798 9,307,273 8,952,108 7,460,765 10,847,236 Source: Bureau d Census. Department of Commerce.
Table 36--Natural rubber in smoked sheets, exports, by country, 1989-92 Country 1989 1990 1991 1992 4-yr avg
--Kilograms--
Mexico Canada Korea, South Other
Total 91 4.635 836.033 216.724 189.057 539.1 13 Source: Bureau d Census, Department of Commerce.
Table 37--Technically specified natural rubber. exports. bv countrv. 1989-92 Country 1989 1990 1991 1992 4-yr avg
--Kilograms--
Venezuela Canada Mexico Other
Total 18.208.529 5.1 14.144 9.546.51 3 4.268.229 9.284.354 Source: Bureau d Census. Department of Commerce.
Industrial Uses/IUS-2/December 199342

Table 38--0ther natural rubber, imports, by country, 1989-92 1/Countrv 1989 1990 1991 1992 4-vr avg
Indonesia Malaysia Thailand Other
Total 20,870,787 19,540,976 42,442,477 65,000,585 36,963,707 1 /Natural rubber other than smoked sheets and technically specified natural rubber.
Source: Bureau of Census. Department of Commerce.
Table 39--Other natural rubber, exports, by country, 1989-92 11 Countrv 1989 1990 1991 1992 4-vr ava
Canada Mexico Venezuela Other
Total 1,174,247 1,689,938 1,438,010 1,045,456 1,336,913 1 /Natural rubber other than smoked sheets and technically specified natural rubber.
Source: Bureau d Census, Department of Commerce.
Table 40--Other forms and articles of unvulcanized natural rubber, imports, by country, 1989-92 11 Countrv 1989 1990 1991 1992 4-vr avg
Thailand Canada Taiwan Malaysia Japan Italy United Kingdom Brazil Sri Lanka Other
Total 7.485.741 2.1 31.425 2.01 0.563 2.453.063 3.520.1 99 11 Rods, tubes, and profile shapes are examples of other forms. Discs and rings are examples of other arlicles.
Source: Bureau of Census. Department of Commerce.
Industrial Uses/IUS-2/December 199343