common nondestructive testing ndt fundamentals part 2 · common nondestructive testing – ndt...
TRANSCRIPT

An Approved Continuing Education Provider
PDHonline Course M469 (8 PDH) _______________________________________________________________________________
Common Nondestructive Testing – NDT Fundamentals – Part 2
Jurandir Primo, PE
2013
PDH Online | PDH Center
5272 Meadow Estates Drive
Fairfax, VA 22030-6658
Phone & Fax: 703-988-0088
www.PDHonline.org
www.PDHcenter.com
www.PDHcenter.com PDH Course M469 www.PDHonline.org
©2013 Jurandir Primo Page 2 of 87
CONTENTS:
1. Ultrasonic Testing (UT):
1. History of Ultrasonics:
2. Present State of Ultrasonics:
3. Sound Wave Propagation:
4. Wavelength, Frequency and Velocity:
5. Defects Detection:
6. Reflection and Transmission Coefficients:
7. Refraction and Snell's Law:
8. Piezoelectric Transducers:
9. Characteristics of Piezoelectric Transducers:
10. Transducer Efficiency, Bandwidth &Frequency:
11. Radiated Fields of Ultrasonic Transducers:
12. Transducer Beam Spread:
13. Transducer Types:
14. Other Contact Transducers:
15. Angle Beams I:
16. Angle Beams II:
17. Crack Tip Diffraction:
18. Transducer Operations:
19. Couplants:
20. Pulser-Receivers:
21. Impedance Matching and Termination:
22. Data Presentation:
23. Crack Tip Diffraction:
24. Automated Scanning:
25. Calibration Methods:
26. Distance/Area Amplitude Blocks:
27. Rail Inspection:
28. Welded Joints Inspection:
29. References & Standards:
30. Practical Examples:
2. Eddy Current Inspection (ET):
1. History of Eddy Current Testing:
2. Present State of Eddy Current Inspection:
3. Eddy Current Measurements:
4. Basic Electricity:
5. Induction and Inductance:
6. Lenz's Law:
7. Basis for Eddy Current Inspection:
8. Mutual Induction:
9. Circuits and Phase:
10. Impedance:
11. Depth of Penetration & Current Density:
12. Phase Lag:
13. Eddy Current Instruments:
14. Practical Examples:
3. Radiographic Inspection (RT):
1. History of Radiography:
2. Present State of Radiography:
3. Nature of Penetrating Radiation:
4. Geometric Unsharpness:
5. Filters in Radiography:
6. Scatter Radiation and Undercut Control:
7. X-ray Generators:
8. Radioactive Sources:
9. Radiographic Film:
10. Exposure Vaults & Cabinets:
11. Film and Screen Factors:
12. Radiographic Density:
13. Exposure Evaluations:
14. Controlling Radiographic Quality:
15. Processing and Exposing Films:
16. Welding – General Radiographic
Interpretations:
20. Radiography of Casting Repair Welds:
21. Real-Time Radiography:
22. Computed Tomography (CT):
23. Radiation and Health Safety:
24. Practical Examples:
25. NDT Method Summary:
26. Choices for Quality Control:
References.
www.PDHcenter.com PDH Course M469 www.PDHonline.org
©2013 Jurandir Primo Page 3 of 87
1. Ultrasonic Testing (UT):
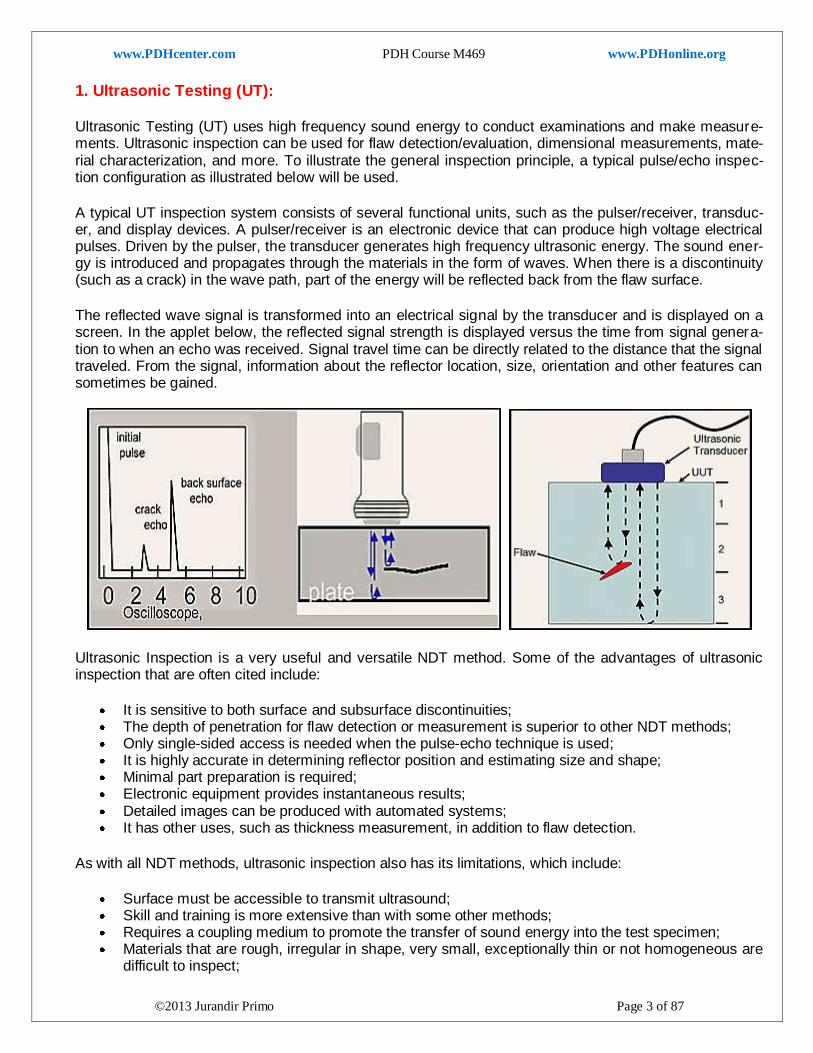
Ultrasonic Testing (UT) uses high frequency sound energy to conduct examinations and make measure-ments. Ultrasonic inspection can be used for flaw detection/evaluation, dimensional measurements, mate-rial characterization, and more. To illustrate the general inspection principle, a typical pulse/echo inspec-tion configuration as illustrated below will be used.
A typical UT inspection system consists of several functional units, such as the pulser/receiver, transduc-er, and display devices. A pulser/receiver is an electronic device that can produce high voltage electrical pulses. Driven by the pulser, the transducer generates high frequency ultrasonic energy. The sound ener-gy is introduced and propagates through the materials in the form of waves. When there is a discontinuity (such as a crack) in the wave path, part of the energy will be reflected back from the flaw surface.
The reflected wave signal is transformed into an electrical signal by the transducer and is displayed on a screen. In the applet below, the reflected signal strength is displayed versus the time from signal genera-tion to when an echo was received. Signal travel time can be directly related to the distance that the signal traveled. From the signal, information about the reflector location, size, orientation and other features can sometimes be gained.
Ultrasonic Inspection is a very useful and versatile NDT method. Some of the advantages of ultrasonic inspection that are often cited include:
It is sensitive to both surface and subsurface discontinuities; The depth of penetration for flaw detection or measurement is superior to other NDT methods; Only single-sided access is needed when the pulse-echo technique is used; It is highly accurate in determining reflector position and estimating size and shape; Minimal part preparation is required; Electronic equipment provides instantaneous results; Detailed images can be produced with automated systems; It has other uses, such as thickness measurement, in addition to flaw detection.
As with all NDT methods, ultrasonic inspection also has its limitations, which include:
Surface must be accessible to transmit ultrasound; Skill and training is more extensive than with some other methods; Requires a coupling medium to promote the transfer of sound energy into the test specimen; Materials that are rough, irregular in shape, very small, exceptionally thin or not homogeneous are
difficult to inspect;
www.PDHcenter.com PDH Course M469 www.PDHonline.org
©2013 Jurandir Primo Page 4 of 87
Cast iron and other coarse grained materials are difficult to inspect due to low sound transmission and high signal noise;
Linear defects oriented parallel to the sound beam may go undetected; Reference standards are required for both equipment calibration and the characterization of flaws.
The above introduction provides a simplified introduction to the method of Ultrasonic Testing. However, to effectively perform an inspection using ultrasonics, much more about the method needs to be known. The following pages present information on the science involved in ultrasonic inspection, the equipment that is commonly used, some of the measurement techniques used, as well as other information.
1. History of Ultrasonics:
Prior to World War II, sonar, the technique of sending sound waves through water and observing the re-turning echoes to characterize submerged objects, inspired early ultrasound investigators to explore ways to apply the concept to medical diagnosis. In 1929 and 1935, Sokolov studied the use of ultrasonic waves in detecting metal objects. Mulhauser, in 1931, obtained a patent for using ultrasonic waves, using two transducers to detect flaws in solids. Firestone (1940) and Simons (1945) developed pulsed ultrasonic testing using a pulse-echo technique.
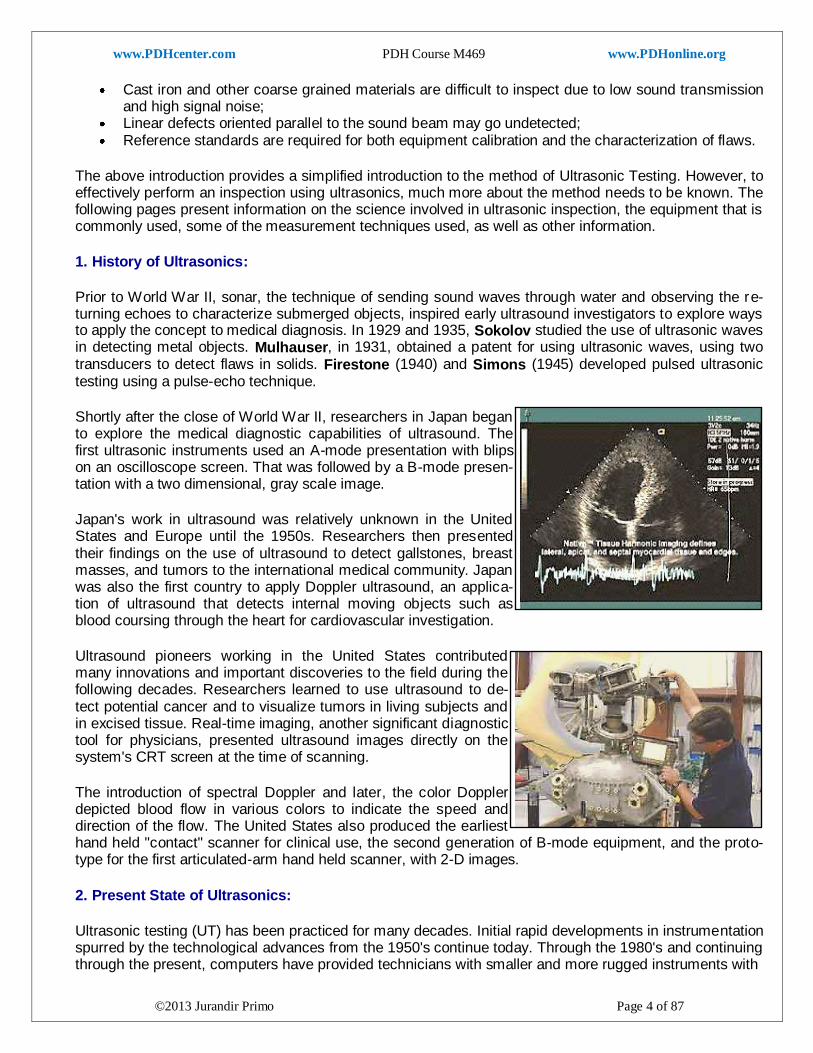
Shortly after the close of World War II, researchers in Japan began to explore the medical diagnostic capabilities of ultrasound. The first ultrasonic instruments used an A-mode presentation with blips on an oscilloscope screen. That was followed by a B-mode presen-tation with a two dimensional, gray scale image.
Japan's work in ultrasound was relatively unknown in the United States and Europe until the 1950s. Researchers then presented their findings on the use of ultrasound to detect gallstones, breast masses, and tumors to the international medical community. Japan was also the first country to apply Doppler ultrasound, an applica-tion of ultrasound that detects internal moving objects such as blood coursing through the heart for cardiovascular investigation.
Ultrasound pioneers working in the United States contributed many innovations and important discoveries to the field during the following decades. Researchers learned to use ultrasound to de-tect potential cancer and to visualize tumors in living subjects and in excised tissue. Real-time imaging, another significant diagnostic tool for physicians, presented ultrasound images directly on the system's CRT screen at the time of scanning.
The introduction of spectral Doppler and later, the color Doppler depicted blood flow in various colors to indicate the speed and direction of the flow. The United States also produced the earliest hand held "contact" scanner for clinical use, the second generation of B-mode equipment, and the proto-type for the first articulated-arm hand held scanner, with 2-D images.
2. Present State of Ultrasonics:
Ultrasonic testing (UT) has been practiced for many decades. Initial rapid developments in instrumentation spurred by the technological advances from the 1950's continue today. Through the 1980's and continuing through the present, computers have provided technicians with smaller and more rugged instruments with

www.PDHcenter.com PDH Course M469 www.PDHonline.org
©2013 Jurandir Primo Page 5 of 87
greater capabilities. Thickness gauging is an example application where instruments have been refined make data collection easier and better. Built-in data logging capabilities allow thousands of measurements to be recorded and eliminate the need for a "scribe."
Some instruments have the capability to capture waveforms as well as thickness readings. The waveform option allows an operator to view or review the A-scan signal of thickness measurement long after the completion of an inspection. Also, some instruments are capable of modifying the measurement based on the surface conditions of the material. For example, the signal from a pitted or eroded inner surface of a pipe would be treated differently than a smooth surface. This has led to more accurate and repeatable field measurements.
Many ultrasonic flaw detectors have a trigonometric function that allows for fast and accurate location de-termination of flaws when performing shear wave inspections. Cathode ray tubes, for the most part, have been replaced with LED or LCD screens. These screens, in most cases, are extremely easy to view in a wide range of ambient lighting. Bright or low light working conditions encountered by technicians have little effect on the technician's ability to view the screen. Screens can be adjusted for brightness, contrast,
and on some instruments even the color of the screen and signal can be selected. Transducers can be programmed with predetermined instrument settings.
The operator only has to connect the transducer and the instrument will set variables such as frequency and probe drive. Along with computers, motion control and robotics have contributed to the advancement of ultrasonic inspec-tions. Early on, the advantage of a stationary platform was recognized and used in industry. Computers can be pro-grammed to inspect large, complex shaped components,
with one or multiple transducers collecting information.
Automated systems typically consisted of an immersion tank, scanning system, and recording system for a printout of the scan. The immersion tank can be replaced with a squirted system, which allows the sound to be transmitted through a water column. The resultant C-scan provides a plan or top view of the component. Scanning of components is considerably faster than contact hand scanning; the coupling is much more consistent. The scan information is collected by a computer for evaluation, transmission to a customer, and archiving. Today, quantitative theories have been developed to describe the interaction of the interrogating fields with flaws. Models incorporating the results have been integrated with solid model descriptions of real-part geometries to simulate practical inspections.
Related tools allow NDE to be considered during the design process on an equal footing with other failure-related engineering disciplines. Quantitative descriptions of NDE performance, such as the probability of detection (POD), have become an integral part of statistical risk assessment.
Measurement procedures initially developed for metals have been extended to engineered materials such as composites, where anisotropy and inhomogeneity have become important issues. The rapid advances in digitization and computing capabilities have totally changed the faces of many instruments and the type of algorithms that are used in processing the resulting data.
High-resolution imaging systems and multiple measurement modalities for characterizing a flaw have emerged. Interest is increasing not only in detecting, characterizing, and sizing defects, but also in charac-terizing the materials. Goals range from the determination of fundamental microstructural characteristics such as grain size, porosity, and texture (preferred grain orientation), to material properties related to such
www.PDHcenter.com PDH Course M469 www.PDHonline.org
©2013 Jurandir Primo Page 6 of 87
failure mechanisms as fatigue, creep, and fracture toughness. As technology continues to advance, appli-cations of ultrasound also advance. The high-resolution imaging systems in the laboratory today will be tools of the technician tomorrow.
3. Sound Wave Propagation:
In air, sound travels by the compression and rarefaction of air molecules in the direction of travel. How ever, in solids, molecules can support vibrations in other directions, hence; a number of different types of sound waves are possible. Waves can be characterized in space by oscillatory patterns that are capable of maintaining their shape and propagating in a stable manner. The propagation of waves is often de-scribed in terms of what are called “wave modes.”
As described previously, the longitudinal and transverse (shear) waves are most often used in Ultrasonic inspection. Although, at surfaces and interfaces, various types of elliptical or complex vibrations of the particles make other waves possible. Some of these wave modes such as Rayleigh and Lamb waves are also useful for ultrasonic inspection. The table below summarizes many, but not all, of the wave modes possible in solids:
Wave Types in Solids Particle Vibrations
Longitudinal Parallel to wave direction
Transverse (Shear) Perpendicular to wave direction
Surface - Rayleigh Elliptical orbit - symmetrical mode
Plate Wave - Lamb Component perpendicular to surface (extensional wave)
Plate Wave - Love Parallel to plane layer, perpendicular to wave direction
Stoneley (Leaky Rayleigh Waves) Wave guided along interface
Sezawa Antisymmetric mode
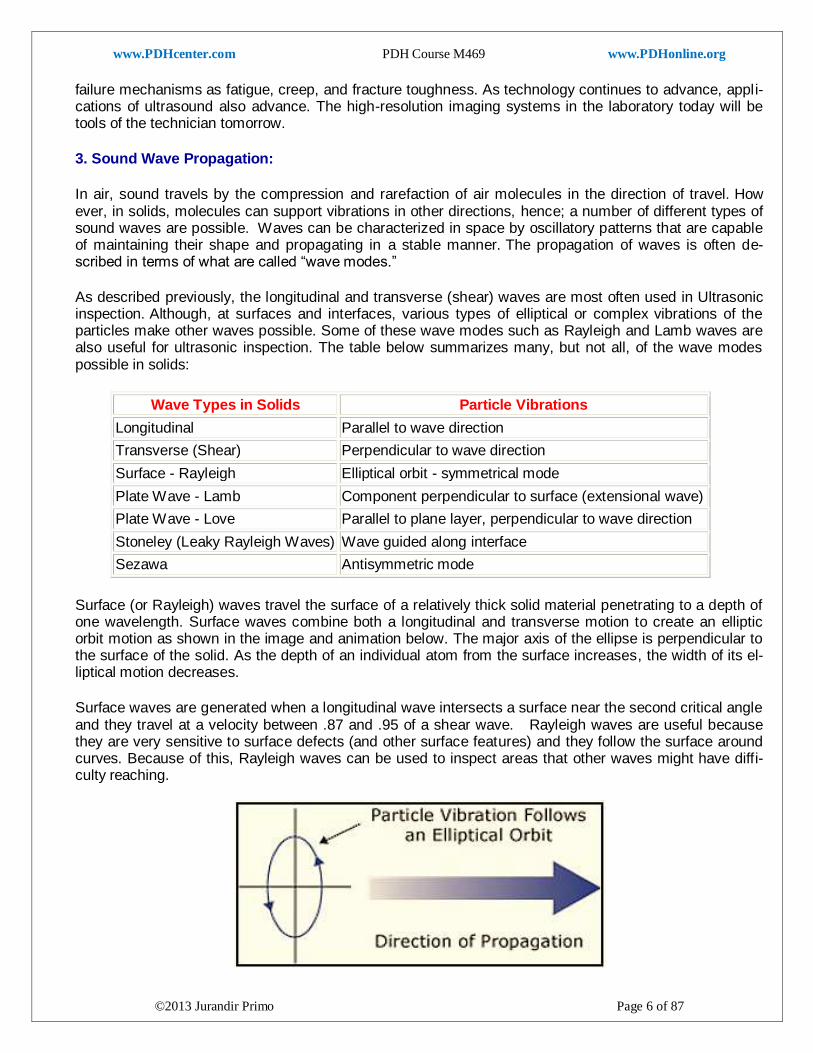
Surface (or Rayleigh) waves travel the surface of a relatively thick solid material penetrating to a depth of one wavelength. Surface waves combine both a longitudinal and transverse motion to create an elliptic orbit motion as shown in the image and animation below. The major axis of the ellipse is perpendicular to the surface of the solid. As the depth of an individual atom from the surface increases, the width of its el-liptical motion decreases.
Surface waves are generated when a longitudinal wave intersects a surface near the second critical angle and they travel at a velocity between .87 and .95 of a shear wave. Rayleigh waves are useful because they are very sensitive to surface defects (and other surface features) and they follow the surface around curves. Because of this, Rayleigh waves can be used to inspect areas that other waves might have diffi-culty reaching.
www.PDHcenter.com PDH Course M469 www.PDHonline.org
©2013 Jurandir Primo Page 7 of 87
4. Wavelength, Frequency and Velocity:
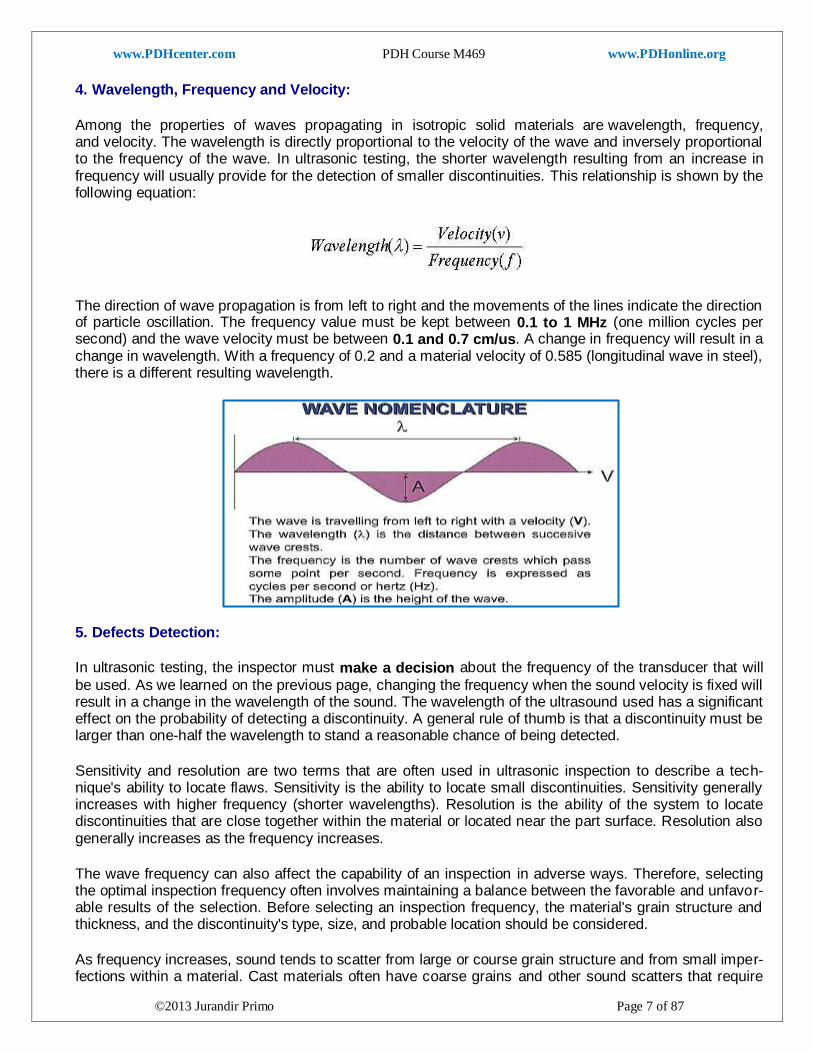
Among the properties of waves propagating in isotropic solid materials are wavelength, frequency, and velocity. The wavelength is directly proportional to the velocity of the wave and inversely proportional to the frequency of the wave. In ultrasonic testing, the shorter wavelength resulting from an increase in frequency will usually provide for the detection of smaller discontinuities. This relationship is shown by the following equation:
The direction of wave propagation is from left to right and the movements of the lines indicate the direction of particle oscillation. The frequency value must be kept between 0.1 to 1 MHz (one million cycles per second) and the wave velocity must be between 0.1 and 0.7 cm/us. A change in frequency will result in a change in wavelength. With a frequency of 0.2 and a material velocity of 0.585 (longitudinal wave in steel), there is a different resulting wavelength.
5. Defects Detection:
In ultrasonic testing, the inspector must make a decision about the frequency of the transducer that will
be used. As we learned on the previous page, changing the frequency when the sound velocity is fixed will result in a change in the wavelength of the sound. The wavelength of the ultrasound used has a significant effect on the probability of detecting a discontinuity. A general rule of thumb is that a discontinuity must be larger than one-half the wavelength to stand a reasonable chance of being detected.
Sensitivity and resolution are two terms that are often used in ultrasonic inspection to describe a tech-nique's ability to locate flaws. Sensitivity is the ability to locate small discontinuities. Sensitivity generally increases with higher frequency (shorter wavelengths). Resolution is the ability of the system to locate discontinuities that are close together within the material or located near the part surface. Resolution also generally increases as the frequency increases.
The wave frequency can also affect the capability of an inspection in adverse ways. Therefore, selecting the optimal inspection frequency often involves maintaining a balance between the favorable and unfavor-able results of the selection. Before selecting an inspection frequency, the material's grain structure and thickness, and the discontinuity's type, size, and probable location should be considered.
As frequency increases, sound tends to scatter from large or course grain structure and from small imper-fections within a material. Cast materials often have coarse grains and other sound scatters that require
www.PDHcenter.com PDH Course M469 www.PDHonline.org
©2013 Jurandir Primo Page 8 of 87
lower frequencies to be used for evaluations of these products. Wrought and forged products with direc-tional and refined grain structure can usually be inspected with higher frequency transducers. Since more things in a material are likely to scatter a portion of the sound energy at higher frequencies, the penetrat-ing power (or the maximum depth in a material that flaws can be located) is also reduced.
Frequency also has an effect on the shape of the ultrasonic beam. Beam spread, or the divergence of the beam from the center axis of the transducer, and how it is affected by frequency will be discussed later. Other variables will also affect the ability of ultrasound to locate defects. These include the pulse length, type and voltage applied to the crystal, properties of the crystal, backing material, transducer diameter, and the receiver circuitry of the instrument.
6. Reflection and Transmission Coefficients:
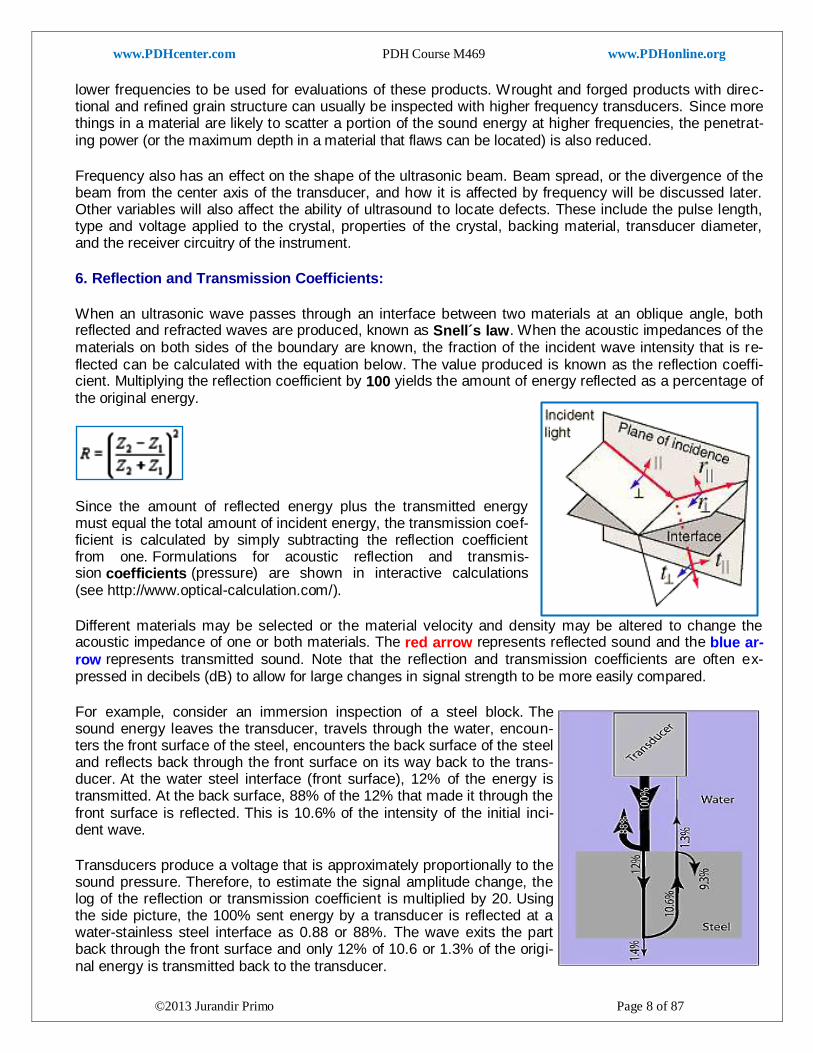
When an ultrasonic wave passes through an interface between two materials at an oblique angle, both reflected and refracted waves are produced, known as Snell´s law. When the acoustic impedances of the materials on both sides of the boundary are known, the fraction of the incident wave intensity that is re-flected can be calculated with the equation below. The value produced is known as the reflection coeffi-cient. Multiplying the reflection coefficient by 100 yields the amount of energy reflected as a percentage of the original energy.
Since the amount of reflected energy plus the transmitted energy must equal the total amount of incident energy, the transmission coef-ficient is calculated by simply subtracting the reflection coefficient from one. Formulations for acoustic reflection and transmis-sion coefficients (pressure) are shown in interactive calculations (see http://www.optical-calculation.com/).
Different materials may be selected or the material velocity and density may be altered to change the acoustic impedance of one or both materials. The red arrow represents reflected sound and the blue ar-row represents transmitted sound. Note that the reflection and transmission coefficients are often ex-pressed in decibels (dB) to allow for large changes in signal strength to be more easily compared.
For example, consider an immersion inspection of a steel block. The sound energy leaves the transducer, travels through the water, encoun-ters the front surface of the steel, encounters the back surface of the steel and reflects back through the front surface on its way back to the trans-ducer. At the water steel interface (front surface), 12% of the energy is transmitted. At the back surface, 88% of the 12% that made it through the front surface is reflected. This is 10.6% of the intensity of the initial inci-dent wave.
Transducers produce a voltage that is approximately proportionally to the sound pressure. Therefore, to estimate the signal amplitude change, the log of the reflection or transmission coefficient is multiplied by 20. Using the side picture, the 100% sent energy by a transducer is reflected at a water-stainless steel interface as 0.88 or 88%. The wave exits the part back through the front surface and only 12% of 10.6 or 1.3% of the origi-nal energy is transmitted back to the transducer.
www.PDHcenter.com PDH Course M469 www.PDHonline.org
©2013 Jurandir Primo Page 9 of 87
Then, the amount of energy transmitted into the second material is left to 0.12 or 12%. Calculating the amount of reflection and transmission energy in dB terms is found: -1.1 dB and -18.2 dB respectively. The negative sign indicates that individually, the amount of reflected and transmitted energy is smaller than the incident energy. If reflection and transmission at interfaces is followed through the component, only a small percentage of the original energy makes it back to the transducer, when loss by attenuation is ig-nored.
7. Refraction and Snell's Law:
When an ultrasonic wave passes through an interface between two materials at an oblique angle, and the materials have different indices of refraction, both reflected and refracted waves are produced. This also occurs with light, which is why objects seen across an interface appear to be shifted relative to where they really are. For example, if you look straight down at an object at the bottom of a glass of water, it looks closer than it really is. A good way to visualize how light and sound refract is to shine a flashlight into a bowl of slightly cloudy water noting the refraction angle with respect to the incident angle.
Refraction takes place at an interface due to the different velocities of the acoustic waves within the two materials. The velocity of sound in each material is determined by the material properties (elastic mod-ulus and density) for that material. When a longitudinal wave moves from a slower to a faster material, there is an incident angle that makes the angle of refraction for the wave 90o. This is known as the first critical angle. The first critical angle can be found from Snell's law by putting in an angle of 90° for the an-gle of the refracted ray.
At the critical angle of incidence, much of the acoustic energy is in the form of an inhomogeneous com-pression wave, which travels along the interface and decays exponentially with depth from the interface. This wave is sometimes referred to as a "creep wave." Because of their inhomogeneous nature and the fact that they decay rapidly, creep waves are not used as extensively as Rayleigh surface waves in NDT. However, creep waves are sometimes more useful than Rayleigh waves because they suffer less from surface irregularities and coarse material microstructure due to their longer wavelengths.
8. Piezoelectric Transducers:
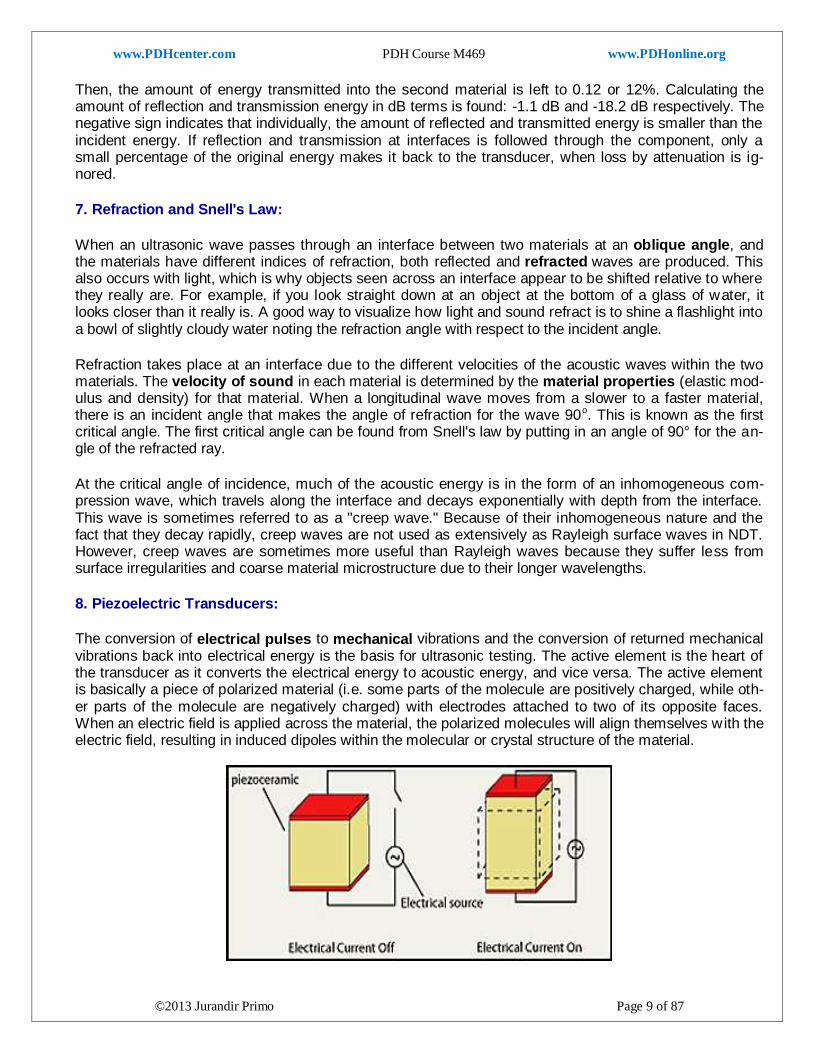
The conversion of electrical pulses to mechanical vibrations and the conversion of returned mechanical vibrations back into electrical energy is the basis for ultrasonic testing. The active element is the heart of the transducer as it converts the electrical energy to acoustic energy, and vice versa. The active element is basically a piece of polarized material (i.e. some parts of the molecule are positively charged, while oth-er parts of the molecule are negatively charged) with electrodes attached to two of its opposite faces. When an electric field is applied across the material, the polarized molecules will align themselves with the electric field, resulting in induced dipoles within the molecular or crystal structure of the material.
www.PDHcenter.com PDH Course M469 www.PDHonline.org
©2013 Jurandir Primo Page 10 of 87
This alignment of molecules will cause the material to change dimensions. This phenomenon is known as electrostriction. In addition, a permanently-polarized material such as quartz (SiO2) or barium titanate (BaTiO3) will produce an electric field when the material changes dimensions as a result of an imposed mechanical force. This phenomenon is known as the piezoelectric effect.
The active element of most acoustic transducers used today is a piezoelectric ceramic, which can be cut in various ways to produce different wave modes. A large piezoelectric ceramic element can be seen in the image of a sectioned low frequency transducer. Preceding the advent of piezoelectric ceramics in the early 1950's, piezoelectric crystals made from quartz crystals and magneto-strictive materials were pri-marily used. The active element is still sometimes referred to as the crys-tal by old timers in the NDT field.
When piezoelectric ceramics were introduced, they soon became the dominant material for transducers due to their good piezoelectric prop-
erties and their ease of manufacture into a variety of shapes and sizes. They also operate at low voltage and are usable up to about 300oC.
The first piezoceramic in general use was barium titanate, and that was followed during the 1960's by lead zirconate titanate compositions, which are now the most commonly employed ceramic for making transducers. New materials such as piezo-polymers and composites are also being used in some applications.
The thickness of the active element is determined by the desired frequen-cy of the transducer. A thin wafer element vibrates with a wavelength that is twice its thickness. Therefore, piezoelectric crystals are cut to a thickness that is 1/2 the desired radiated wavelength. The higher the frequency of the transducer, the thinner is the active element. The primary reason that high frequency contact transducers are not produced is because the element is very thin and too fragile.
9. Characteristics of Piezoelectric Transducers:
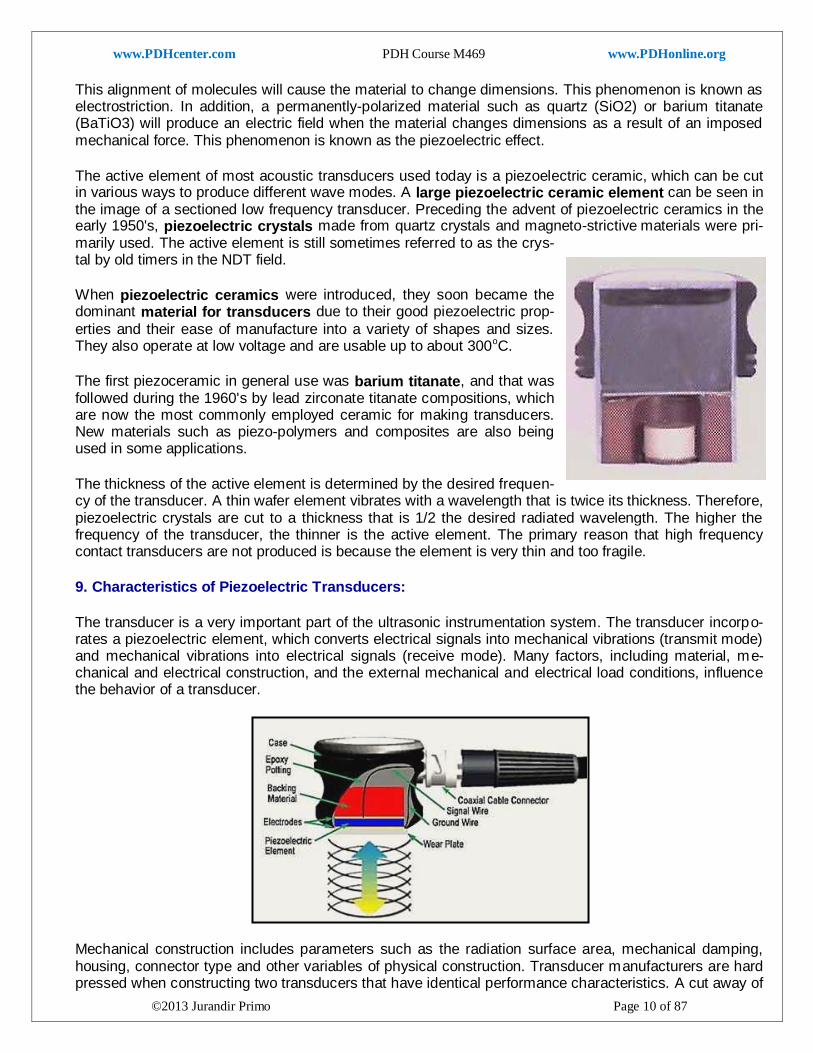
The transducer is a very important part of the ultrasonic instrumentation system. The transducer incorpo-rates a piezoelectric element, which converts electrical signals into mechanical vibrations (transmit mode) and mechanical vibrations into electrical signals (receive mode). Many factors, including material, me-chanical and electrical construction, and the external mechanical and electrical load conditions, influence the behavior of a transducer.
Mechanical construction includes parameters such as the radiation surface area, mechanical damping, housing, connector type and other variables of physical construction. Transducer manufacturers are hard pressed when constructing two transducers that have identical performance characteristics. A cut away of
www.PDHcenter.com PDH Course M469 www.PDHonline.org
©2013 Jurandir Primo Page 11 of 87
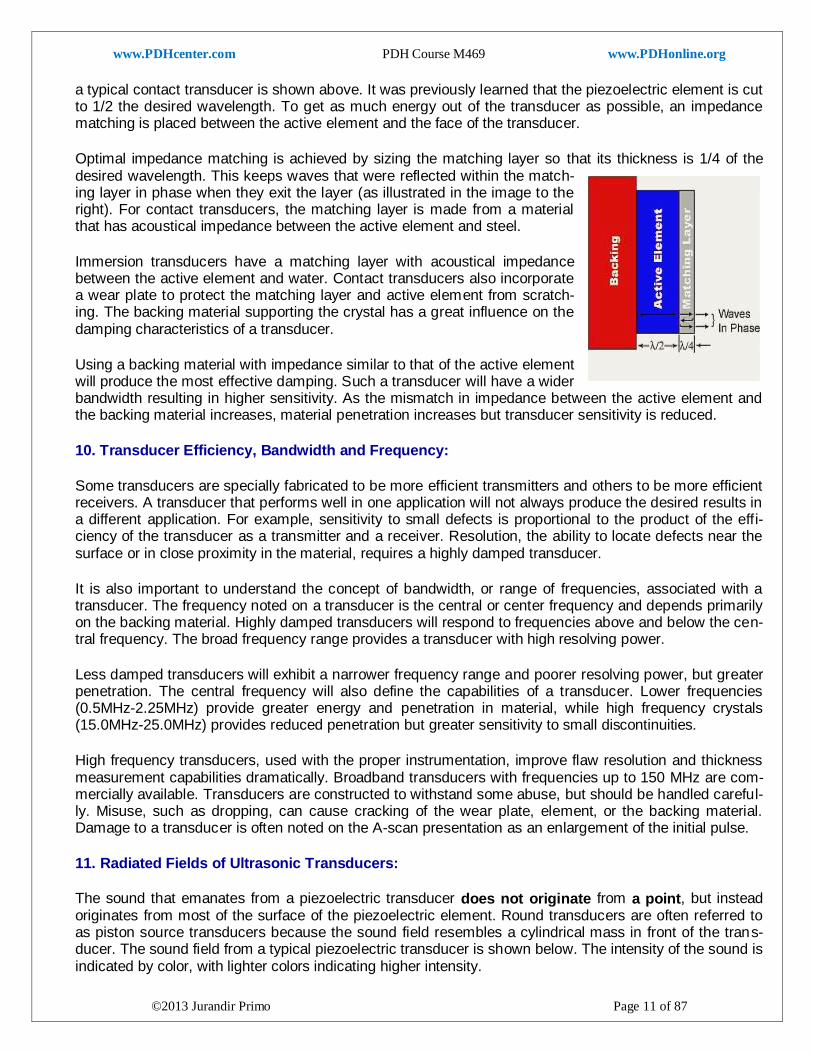
a typical contact transducer is shown above. It was previously learned that the piezoelectric element is cut to 1/2 the desired wavelength. To get as much energy out of the transducer as possible, an impedance matching is placed between the active element and the face of the transducer.
Optimal impedance matching is achieved by sizing the matching layer so that its thickness is 1/4 of the desired wavelength. This keeps waves that were reflected within the match-ing layer in phase when they exit the layer (as illustrated in the image to the right). For contact transducers, the matching layer is made from a material that has acoustical impedance between the active element and steel.
Immersion transducers have a matching layer with acoustical impedance between the active element and water. Contact transducers also incorporate a wear plate to protect the matching layer and active element from scratch-ing. The backing material supporting the crystal has a great influence on the damping characteristics of a transducer.
Using a backing material with impedance similar to that of the active element will produce the most effective damping. Such a transducer will have a wider bandwidth resulting in higher sensitivity. As the mismatch in impedance between the active element and the backing material increases, material penetration increases but transducer sensitivity is reduced.
10. Transducer Efficiency, Bandwidth and Frequency:
Some transducers are specially fabricated to be more efficient transmitters and others to be more efficient receivers. A transducer that performs well in one application will not always produce the desired results in a different application. For example, sensitivity to small defects is proportional to the product of the effi-ciency of the transducer as a transmitter and a receiver. Resolution, the ability to locate defects near the surface or in close proximity in the material, requires a highly damped transducer.
It is also important to understand the concept of bandwidth, or range of frequencies, associated with a transducer. The frequency noted on a transducer is the central or center frequency and depends primarily on the backing material. Highly damped transducers will respond to frequencies above and below the cen-tral frequency. The broad frequency range provides a transducer with high resolving power.
Less damped transducers will exhibit a narrower frequency range and poorer resolving power, but greater penetration. The central frequency will also define the capabilities of a transducer. Lower frequencies (0.5MHz-2.25MHz) provide greater energy and penetration in material, while high frequency crystals (15.0MHz-25.0MHz) provides reduced penetration but greater sensitivity to small discontinuities.
High frequency transducers, used with the proper instrumentation, improve flaw resolution and thickness measurement capabilities dramatically. Broadband transducers with frequencies up to 150 MHz are com-mercially available. Transducers are constructed to withstand some abuse, but should be handled careful-ly. Misuse, such as dropping, can cause cracking of the wear plate, element, or the backing material. Damage to a transducer is often noted on the A-scan presentation as an enlargement of the initial pulse.
11. Radiated Fields of Ultrasonic Transducers:
The sound that emanates from a piezoelectric transducer does not originate from a point, but instead originates from most of the surface of the piezoelectric element. Round transducers are often referred to as piston source transducers because the sound field resembles a cylindrical mass in front of the trans-ducer. The sound field from a typical piezoelectric transducer is shown below. The intensity of the sound is indicated by color, with lighter colors indicating higher intensity.
www.PDHcenter.com PDH Course M469 www.PDHonline.org
©2013 Jurandir Primo Page 12 of 87
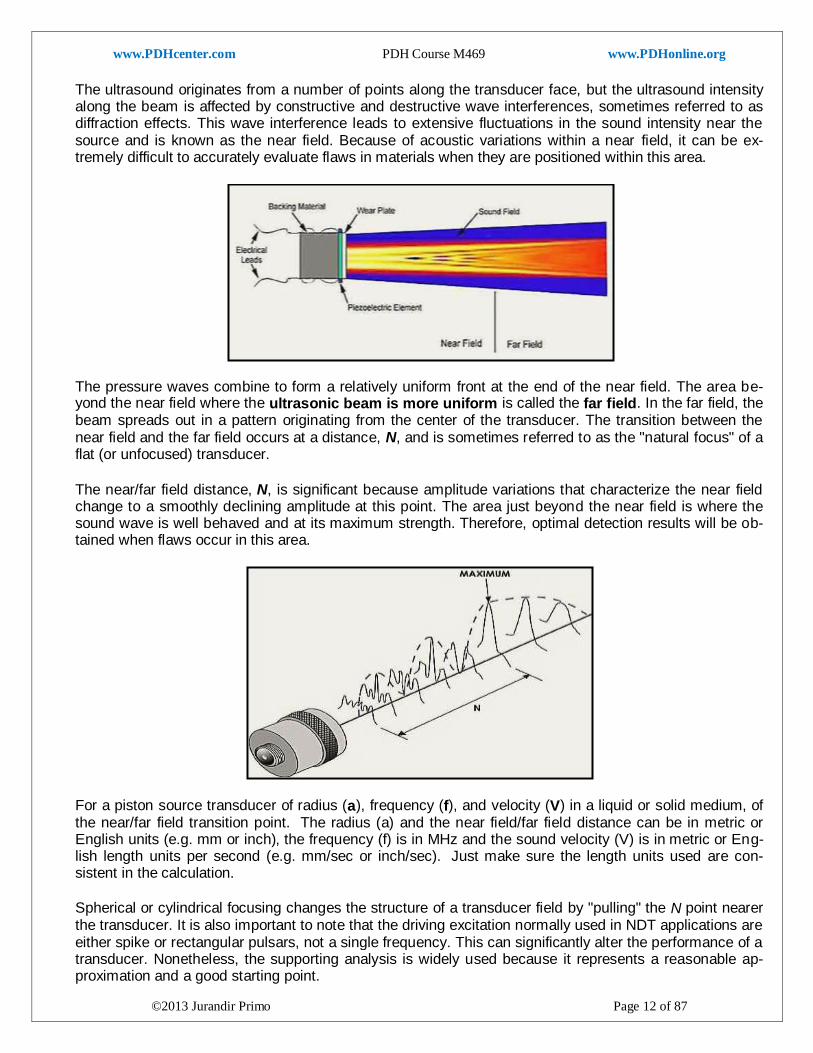
The ultrasound originates from a number of points along the transducer face, but the ultrasound intensity along the beam is affected by constructive and destructive wave interferences, sometimes referred to as diffraction effects. This wave interference leads to extensive fluctuations in the sound intensity near the source and is known as the near field. Because of acoustic variations within a near field, it can be ex-tremely difficult to accurately evaluate flaws in materials when they are positioned within this area.
The pressure waves combine to form a relatively uniform front at the end of the near field. The area be-yond the near field where the ultrasonic beam is more uniform is called the far field. In the far field, the beam spreads out in a pattern originating from the center of the transducer. The transition between the near field and the far field occurs at a distance, N, and is sometimes referred to as the "natural focus" of a flat (or unfocused) transducer.
The near/far field distance, N, is significant because amplitude variations that characterize the near field change to a smoothly declining amplitude at this point. The area just beyond the near field is where the sound wave is well behaved and at its maximum strength. Therefore, optimal detection results will be ob-tained when flaws occur in this area.
For a piston source transducer of radius (a), frequency (f), and velocity (V) in a liquid or solid medium, of the near/far field transition point. The radius (a) and the near field/far field distance can be in metric or English units (e.g. mm or inch), the frequency (f) is in MHz and the sound velocity (V) is in metric or Eng-lish length units per second (e.g. mm/sec or inch/sec). Just make sure the length units used are con-sistent in the calculation.
Spherical or cylindrical focusing changes the structure of a transducer field by "pulling" the N point nearer the transducer. It is also important to note that the driving excitation normally used in NDT applications are either spike or rectangular pulsars, not a single frequency. This can significantly alter the performance of a transducer. Nonetheless, the supporting analysis is widely used because it represents a reasonable ap-proximation and a good starting point.
www.PDHcenter.com PDH Course M469 www.PDHonline.org
©2013 Jurandir Primo Page 13 of 87
12. Transducer Beam Spread:
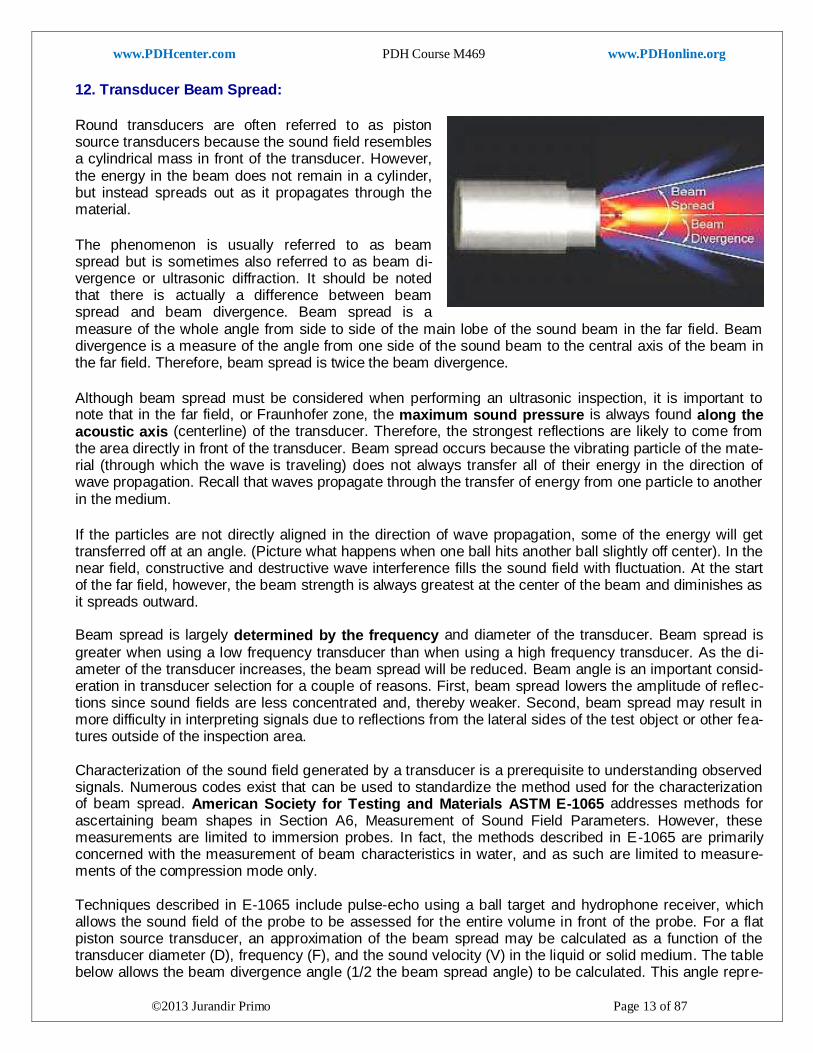
Round transducers are often referred to as piston source transducers because the sound field resembles a cylindrical mass in front of the transducer. However, the energy in the beam does not remain in a cylinder, but instead spreads out as it propagates through the material.
The phenomenon is usually referred to as beam spread but is sometimes also referred to as beam di-vergence or ultrasonic diffraction. It should be noted that there is actually a difference between beam spread and beam divergence. Beam spread is a measure of the whole angle from side to side of the main lobe of the sound beam in the far field. Beam divergence is a measure of the angle from one side of the sound beam to the central axis of the beam in the far field. Therefore, beam spread is twice the beam divergence.
Although beam spread must be considered when performing an ultrasonic inspection, it is important to note that in the far field, or Fraunhofer zone, the maximum sound pressure is always found along the acoustic axis (centerline) of the transducer. Therefore, the strongest reflections are likely to come from the area directly in front of the transducer. Beam spread occurs because the vibrating particle of the mate-rial (through which the wave is traveling) does not always transfer all of their energy in the direction of wave propagation. Recall that waves propagate through the transfer of energy from one particle to another in the medium.
If the particles are not directly aligned in the direction of wave propagation, some of the energy will get transferred off at an angle. (Picture what happens when one ball hits another ball slightly off center). In the near field, constructive and destructive wave interference fills the sound field with fluctuation. At the start of the far field, however, the beam strength is always greatest at the center of the beam and diminishes as it spreads outward. Beam spread is largely determined by the frequency and diameter of the transducer. Beam spread is
greater when using a low frequency transducer than when using a high frequency transducer. As the di-ameter of the transducer increases, the beam spread will be reduced. Beam angle is an important consid-eration in transducer selection for a couple of reasons. First, beam spread lowers the amplitude of reflec-tions since sound fields are less concentrated and, thereby weaker. Second, beam spread may result in more difficulty in interpreting signals due to reflections from the lateral sides of the test object or other fea-tures outside of the inspection area. Characterization of the sound field generated by a transducer is a prerequisite to understanding observed signals. Numerous codes exist that can be used to standardize the method used for the characterization of beam spread. American Society for Testing and Materials ASTM E-1065 addresses methods for ascertaining beam shapes in Section A6, Measurement of Sound Field Parameters. However, these measurements are limited to immersion probes. In fact, the methods described in E-1065 are primarily concerned with the measurement of beam characteristics in water, and as such are limited to measure-ments of the compression mode only. Techniques described in E-1065 include pulse-echo using a ball target and hydrophone receiver, which allows the sound field of the probe to be assessed for the entire volume in front of the probe. For a flat piston source transducer, an approximation of the beam spread may be calculated as a function of the transducer diameter (D), frequency (F), and the sound velocity (V) in the liquid or solid medium. The table below allows the beam divergence angle (1/2 the beam spread angle) to be calculated. This angle repre-
www.PDHcenter.com PDH Course M469 www.PDHonline.org
©2013 Jurandir Primo Page 14 of 87
sents a measure from the center of the acoustic axis to the point where the sound pressure has de-creased by one half (-6 dB) to the side of the acoustic axis in the far field. This table uses the equation:
Where: θ = Beam divergence angle from centerline to point where signal is at half strength;
V = Sound velocity in the material. (inch/sec or cm/sec)1
a = Radius of the transducer. (inch or cm)1
F = Frequency of the transducer. (cycles/second).
Note 1: Units must be consistent throughout calculation (i.e. inch or cm but not both). An equal, but perhaps more common version of the formula is:
Where: θ = Beam divergence angle from centerline to point where signal is at half strength.
V = Sound velocity in the material. (inch/sec or cm/sec)
D = Diameter of the transducer. (inch or cm)
F = Frequency of the transducer. (cycles/second)
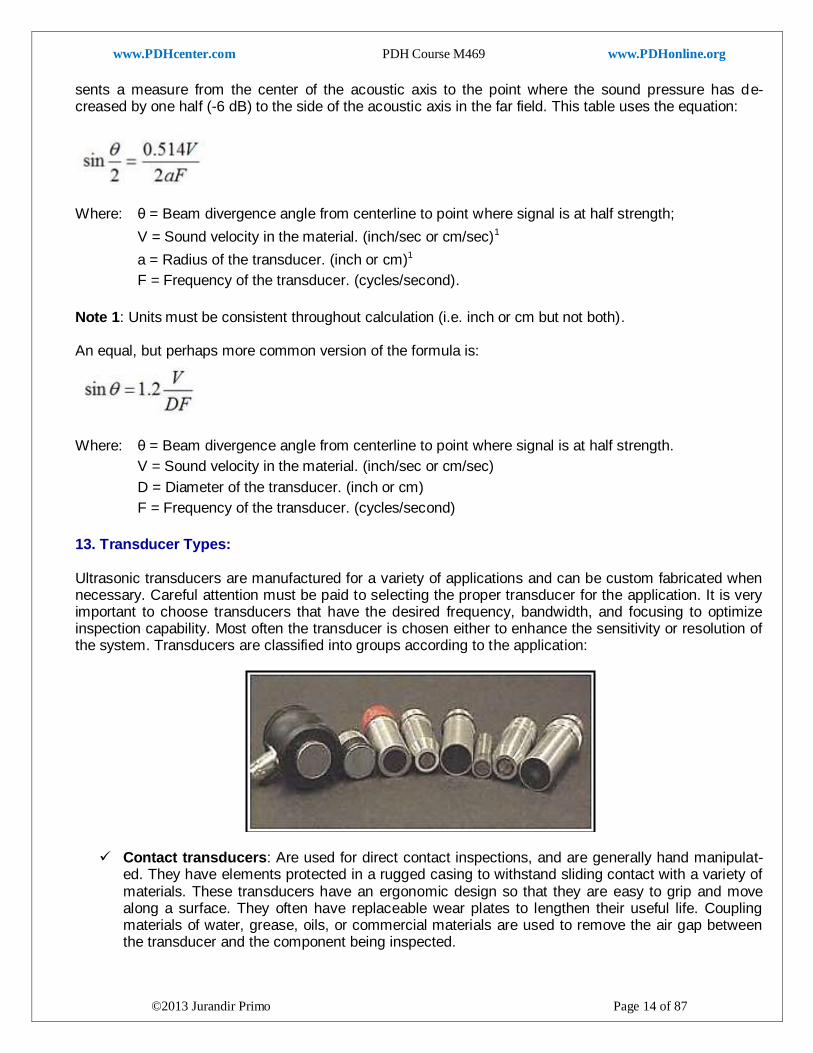
13. Transducer Types: Ultrasonic transducers are manufactured for a variety of applications and can be custom fabricated when necessary. Careful attention must be paid to selecting the proper transducer for the application. It is very important to choose transducers that have the desired frequency, bandwidth, and focusing to optimize inspection capability. Most often the transducer is chosen either to enhance the sensitivity or resolution of the system. Transducers are classified into groups according to the application:
Contact transducers: Are used for direct contact inspections, and are generally hand manipulat-ed. They have elements protected in a rugged casing to withstand sliding contact with a variety of materials. These transducers have an ergonomic design so that they are easy to grip and move along a surface. They often have replaceable wear plates to lengthen their useful life. Coupling materials of water, grease, oils, or commercial materials are used to remove the air gap between the transducer and the component being inspected.
www.PDHcenter.com PDH Course M469 www.PDHonline.org
©2013 Jurandir Primo Page 15 of 87
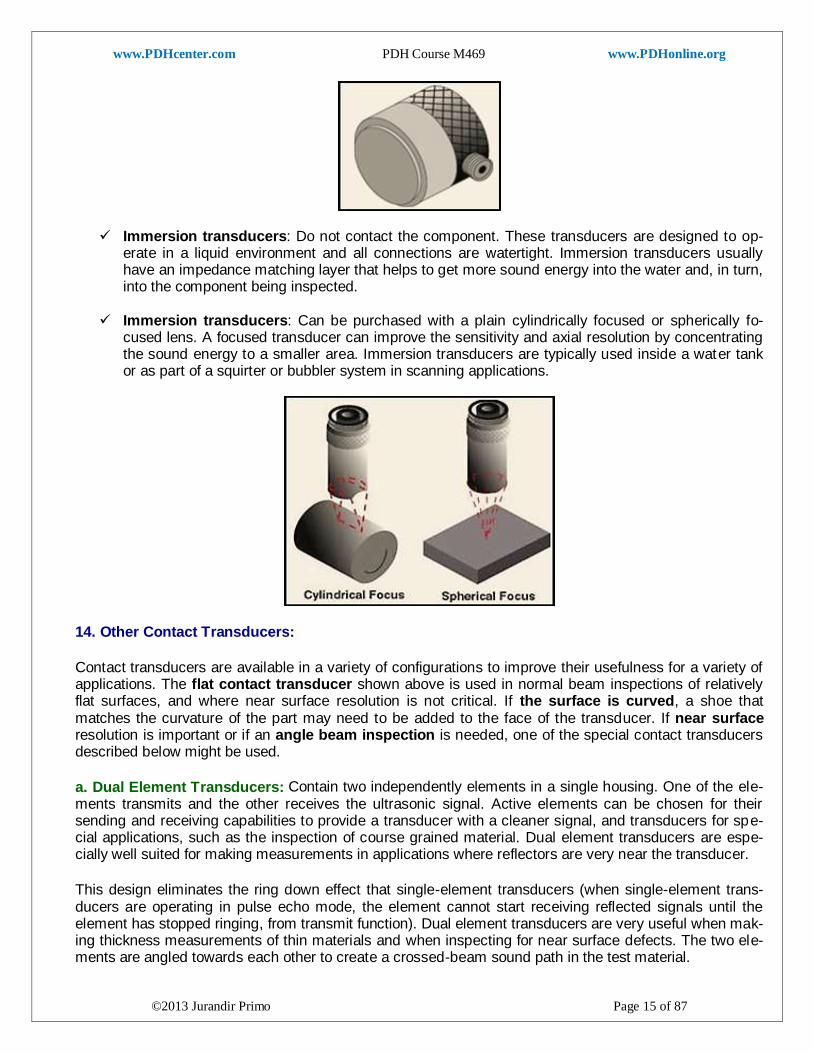
Immersion transducers: Do not contact the component. These transducers are designed to op-erate in a liquid environment and all connections are watertight. Immersion transducers usually have an impedance matching layer that helps to get more sound energy into the water and, in turn, into the component being inspected.
Immersion transducers: Can be purchased with a plain cylindrically focused or spherically fo-
cused lens. A focused transducer can improve the sensitivity and axial resolution by concentrating the sound energy to a smaller area. Immersion transducers are typically used inside a water tank or as part of a squirter or bubbler system in scanning applications.
14. Other Contact Transducers:
Contact transducers are available in a variety of configurations to improve their usefulness for a variety of applications. The flat contact transducer shown above is used in normal beam inspections of relatively flat surfaces, and where near surface resolution is not critical. If the surface is curved, a shoe that matches the curvature of the part may need to be added to the face of the transducer. If near surface resolution is important or if an angle beam inspection is needed, one of the special contact transducers described below might be used.
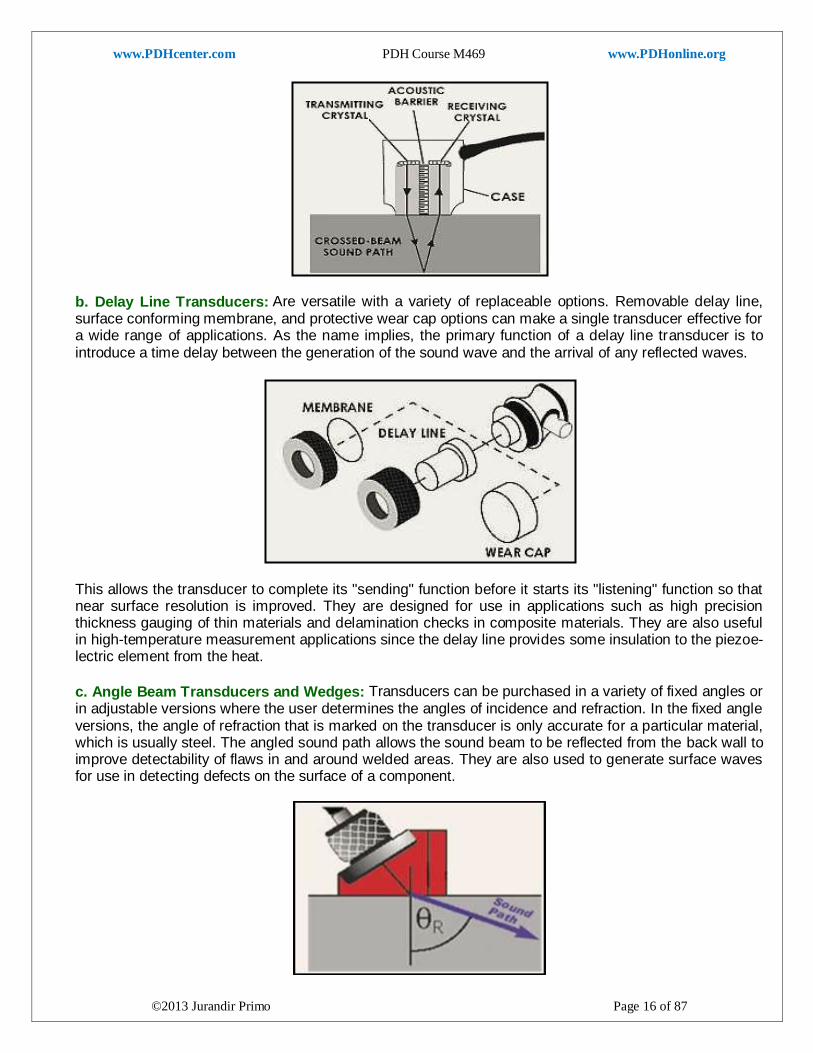
a. Dual Element Transducers: Contain two independently elements in a single housing. One of the ele-ments transmits and the other receives the ultrasonic signal. Active elements can be chosen for their sending and receiving capabilities to provide a transducer with a cleaner signal, and transducers for spe-cial applications, such as the inspection of course grained material. Dual element transducers are espe-cially well suited for making measurements in applications where reflectors are very near the transducer.
This design eliminates the ring down effect that single-element transducers (when single-element trans-ducers are operating in pulse echo mode, the element cannot start receiving reflected signals until the element has stopped ringing, from transmit function). Dual element transducers are very useful when mak-ing thickness measurements of thin materials and when inspecting for near surface defects. The two ele-ments are angled towards each other to create a crossed-beam sound path in the test material.
www.PDHcenter.com PDH Course M469 www.PDHonline.org
©2013 Jurandir Primo Page 16 of 87
b. Delay Line Transducers: Are versatile with a variety of replaceable options. Removable delay line, surface conforming membrane, and protective wear cap options can make a single transducer effective for a wide range of applications. As the name implies, the primary function of a delay line transducer is to introduce a time delay between the generation of the sound wave and the arrival of any reflected waves.
This allows the transducer to complete its "sending" function before it starts its "listening" function so that near surface resolution is improved. They are designed for use in applications such as high precision thickness gauging of thin materials and delamination checks in composite materials. They are also useful in high-temperature measurement applications since the delay line provides some insulation to the piezoe-lectric element from the heat.
c. Angle Beam Transducers and Wedges: Transducers can be purchased in a variety of fixed angles or in adjustable versions where the user determines the angles of incidence and refraction. In the fixed angle versions, the angle of refraction that is marked on the transducer is only accurate for a particular material, which is usually steel. The angled sound path allows the sound beam to be reflected from the back wall to improve detectability of flaws in and around welded areas. They are also used to generate surface waves for use in detecting defects on the surface of a component.
www.PDHcenter.com PDH Course M469 www.PDHonline.org
©2013 Jurandir Primo Page 17 of 87
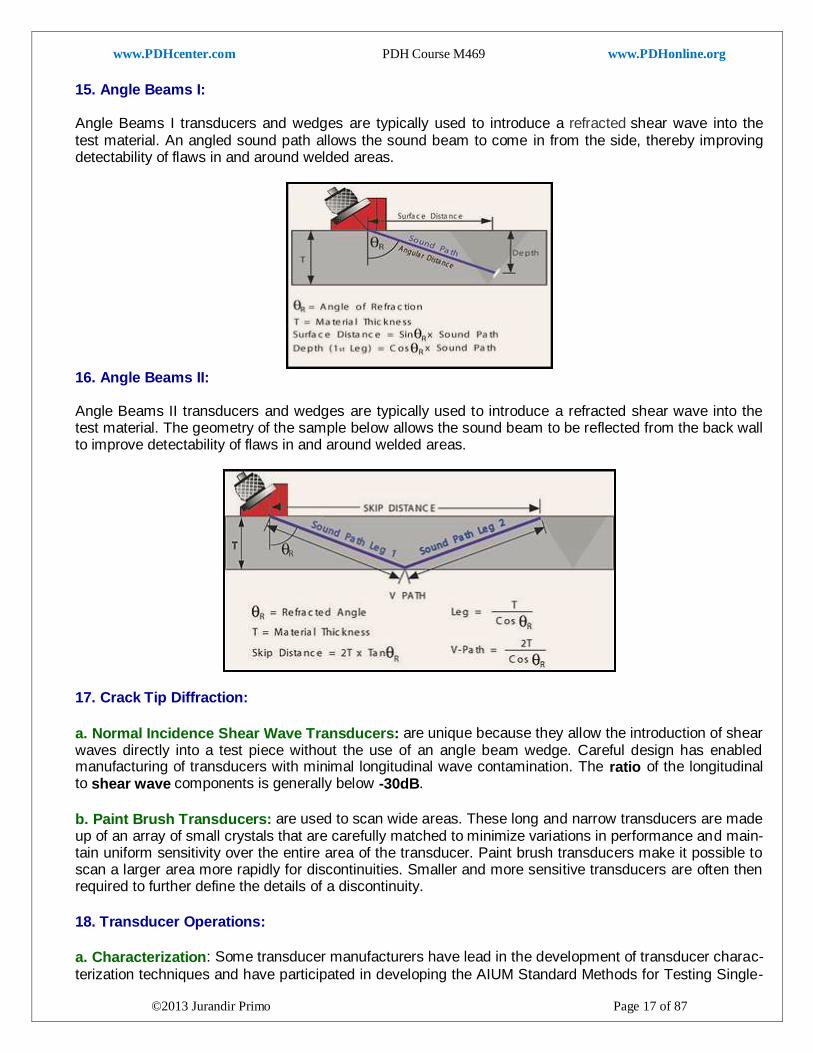
15. Angle Beams I: Angle Beams I transducers and wedges are typically used to introduce a refracted shear wave into the test material. An angled sound path allows the sound beam to come in from the side, thereby improving detectability of flaws in and around welded areas.
16. Angle Beams II: Angle Beams II transducers and wedges are typically used to introduce a refracted shear wave into the test material. The geometry of the sample below allows the sound beam to be reflected from the back wall to improve detectability of flaws in and around welded areas.
17. Crack Tip Diffraction:
a. Normal Incidence Shear Wave Transducers: are unique because they allow the introduction of shear waves directly into a test piece without the use of an angle beam wedge. Careful design has enabled manufacturing of transducers with minimal longitudinal wave contamination. The ratio of the longitudinal to shear wave components is generally below -30dB.
b. Paint Brush Transducers: are used to scan wide areas. These long and narrow transducers are made up of an array of small crystals that are carefully matched to minimize variations in performance and main-tain uniform sensitivity over the entire area of the transducer. Paint brush transducers make it possible to scan a larger area more rapidly for discontinuities. Smaller and more sensitive transducers are often then required to further define the details of a discontinuity.
18. Transducer Operations:
a. Characterization: Some transducer manufacturers have lead in the development of transducer charac-
terization techniques and have participated in developing the AIUM Standard Methods for Testing Single-
www.PDHcenter.com PDH Course M469 www.PDHonline.org
©2013 Jurandir Primo Page 18 of 87
Element Pulse-Echo Ultrasonic Transducers as well as ASTM-E 1065 Standard Guide for Evaluating Characteristics of Ultrasonic Search Units. Other manufacturers perform characterizations according to AWS, ESI, and many other industrial and military standards. Often, equipment in test labs is maintained in compliance with MIL-C-45662A Calibration System Requirements. As part of the documentation process, an extensive database containing records of the waveform and spectrum of each transducer is maintained and can be accessed for comparative or statistical studies of transducer characteristics.
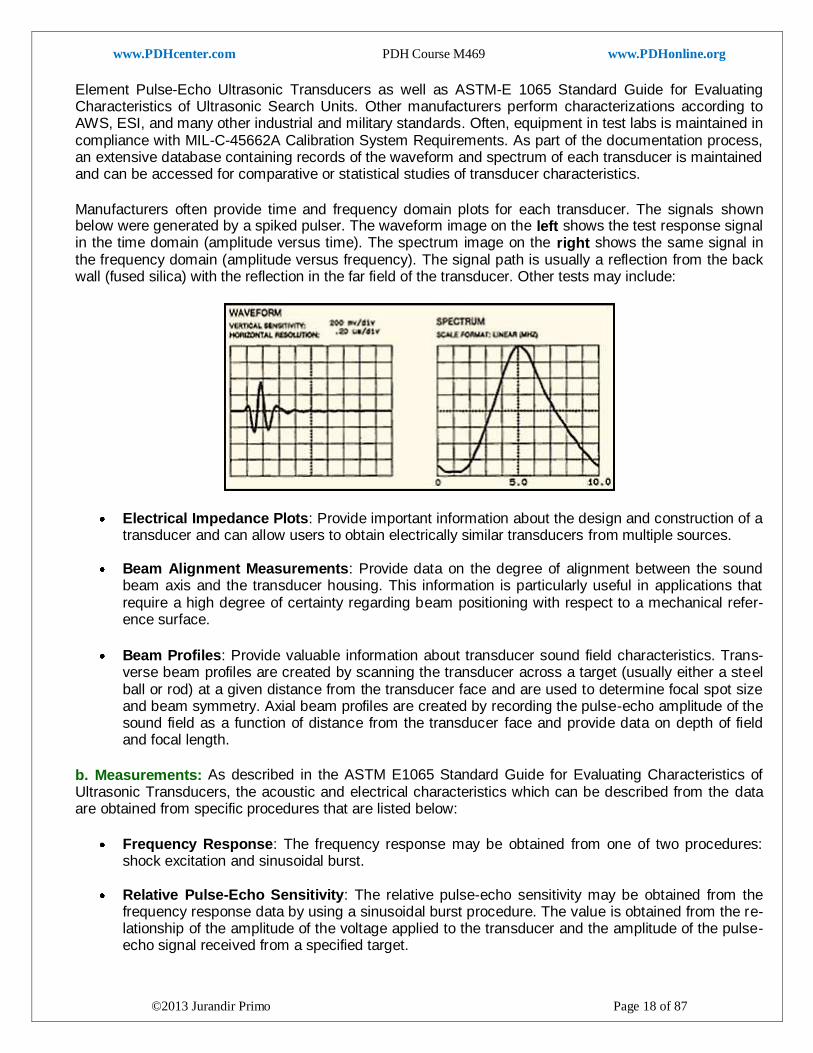
Manufacturers often provide time and frequency domain plots for each transducer. The signals shown below were generated by a spiked pulser. The waveform image on the left shows the test response signal in the time domain (amplitude versus time). The spectrum image on the right shows the same signal in the frequency domain (amplitude versus frequency). The signal path is usually a reflection from the back wall (fused silica) with the reflection in the far field of the transducer. Other tests may include:
Electrical Impedance Plots: Provide important information about the design and construction of a transducer and can allow users to obtain electrically similar transducers from multiple sources.
Beam Alignment Measurements: Provide data on the degree of alignment between the sound beam axis and the transducer housing. This information is particularly useful in applications that require a high degree of certainty regarding beam positioning with respect to a mechanical refer-ence surface.
Beam Profiles: Provide valuable information about transducer sound field characteristics. Trans-verse beam profiles are created by scanning the transducer across a target (usually either a steel ball or rod) at a given distance from the transducer face and are used to determine focal spot size and beam symmetry. Axial beam profiles are created by recording the pulse-echo amplitude of the sound field as a function of distance from the transducer face and provide data on depth of field and focal length.
b. Measurements: As described in the ASTM E1065 Standard Guide for Evaluating Characteristics of Ultrasonic Transducers, the acoustic and electrical characteristics which can be described from the data are obtained from specific procedures that are listed below:
Frequency Response: The frequency response may be obtained from one of two procedures: shock excitation and sinusoidal burst.
Relative Pulse-Echo Sensitivity: The relative pulse-echo sensitivity may be obtained from the frequency response data by using a sinusoidal burst procedure. The value is obtained from the re-lationship of the amplitude of the voltage applied to the transducer and the amplitude of the pulse-echo signal received from a specified target.
www.PDHcenter.com PDH Course M469 www.PDHonline.org
©2013 Jurandir Primo Page 19 of 87
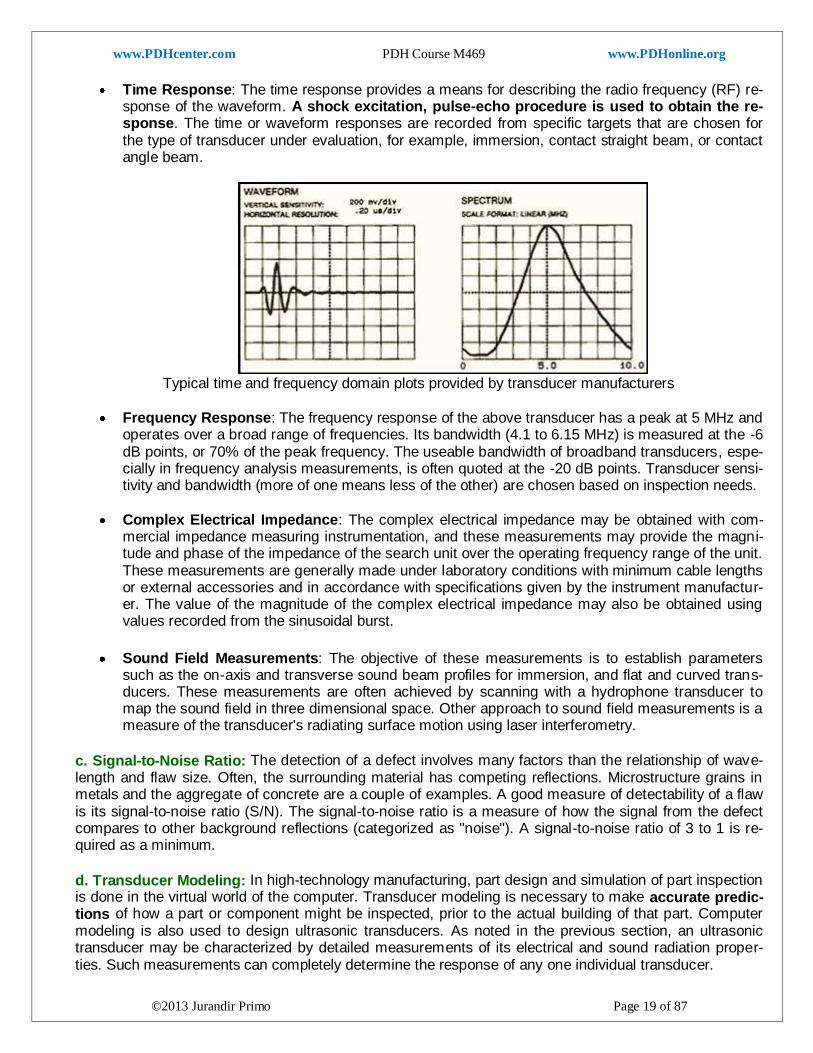
Time Response: The time response provides a means for describing the radio frequency (RF) re-sponse of the waveform. A shock excitation, pulse-echo procedure is used to obtain the re-sponse. The time or waveform responses are recorded from specific targets that are chosen for the type of transducer under evaluation, for example, immersion, contact straight beam, or contact angle beam.
Typical time and frequency domain plots provided by transducer manufacturers
Frequency Response: The frequency response of the above transducer has a peak at 5 MHz and operates over a broad range of frequencies. Its bandwidth (4.1 to 6.15 MHz) is measured at the -6 dB points, or 70% of the peak frequency. The useable bandwidth of broadband transducers, espe-cially in frequency analysis measurements, is often quoted at the -20 dB points. Transducer sensi-tivity and bandwidth (more of one means less of the other) are chosen based on inspection needs.
Complex Electrical Impedance: The complex electrical impedance may be obtained with com-mercial impedance measuring instrumentation, and these measurements may provide the magni-tude and phase of the impedance of the search unit over the operating frequency range of the unit. These measurements are generally made under laboratory conditions with minimum cable lengths or external accessories and in accordance with specifications given by the instrument manufactur-er. The value of the magnitude of the complex electrical impedance may also be obtained using values recorded from the sinusoidal burst.
Sound Field Measurements: The objective of these measurements is to establish parameters such as the on-axis and transverse sound beam profiles for immersion, and flat and curved trans-ducers. These measurements are often achieved by scanning with a hydrophone transducer to map the sound field in three dimensional space. Other approach to sound field measurements is a measure of the transducer's radiating surface motion using laser interferometry.
c. Signal-to-Noise Ratio: The detection of a defect involves many factors than the relationship of wave-length and flaw size. Often, the surrounding material has competing reflections. Microstructure grains in metals and the aggregate of concrete are a couple of examples. A good measure of detectability of a flaw is its signal-to-noise ratio (S/N). The signal-to-noise ratio is a measure of how the signal from the defect compares to other background reflections (categorized as "noise"). A signal-to-noise ratio of 3 to 1 is re-quired as a minimum.
d. Transducer Modeling: In high-technology manufacturing, part design and simulation of part inspection is done in the virtual world of the computer. Transducer modeling is necessary to make accurate predic-tions of how a part or component might be inspected, prior to the actual building of that part. Computer modeling is also used to design ultrasonic transducers. As noted in the previous section, an ultrasonic transducer may be characterized by detailed measurements of its electrical and sound radiation proper-ties. Such measurements can completely determine the response of any one individual transducer.
www.PDHcenter.com PDH Course M469 www.PDHonline.org
©2013 Jurandir Primo Page 20 of 87
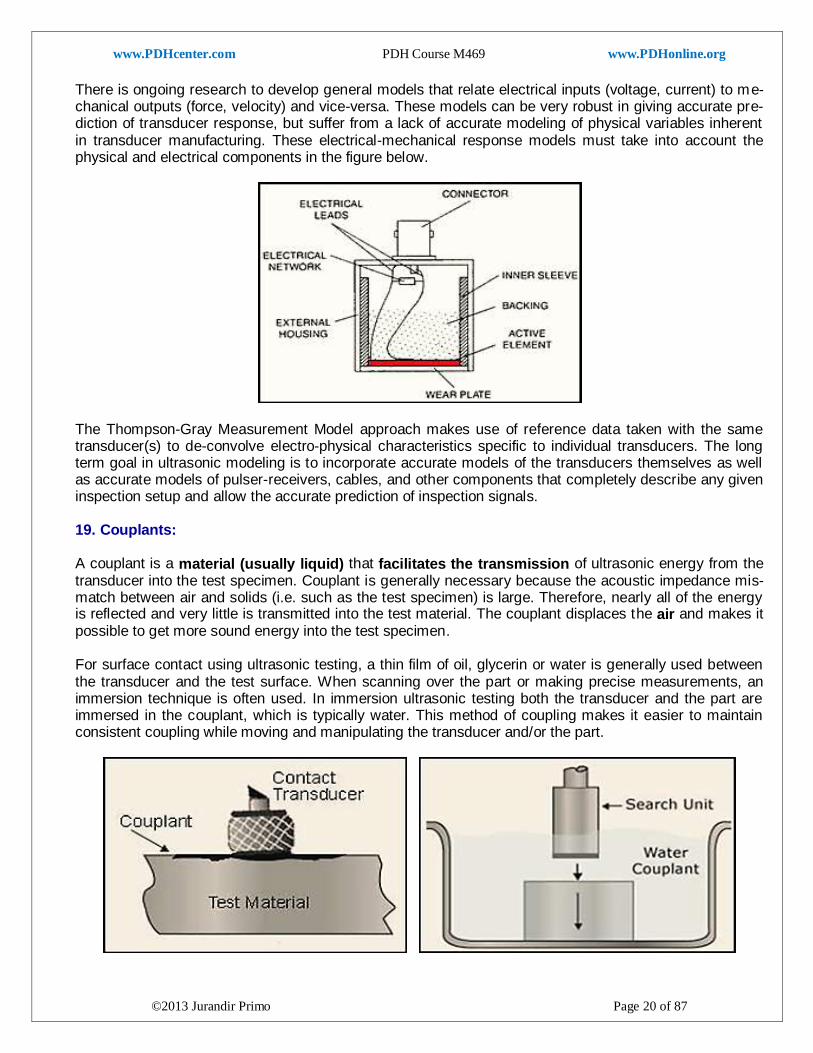
There is ongoing research to develop general models that relate electrical inputs (voltage, current) to me-chanical outputs (force, velocity) and vice-versa. These models can be very robust in giving accurate pre-diction of transducer response, but suffer from a lack of accurate modeling of physical variables inherent in transducer manufacturing. These electrical-mechanical response models must take into account the physical and electrical components in the figure below.
The Thompson-Gray Measurement Model approach makes use of reference data taken with the same transducer(s) to de-convolve electro-physical characteristics specific to individual transducers. The long term goal in ultrasonic modeling is to incorporate accurate models of the transducers themselves as well as accurate models of pulser-receivers, cables, and other components that completely describe any given inspection setup and allow the accurate prediction of inspection signals. 19. Couplants:
A couplant is a material (usually liquid) that facilitates the transmission of ultrasonic energy from the transducer into the test specimen. Couplant is generally necessary because the acoustic impedance mis-match between air and solids (i.e. such as the test specimen) is large. Therefore, nearly all of the energy is reflected and very little is transmitted into the test material. The couplant displaces the air and makes it possible to get more sound energy into the test specimen. For surface contact using ultrasonic testing, a thin film of oil, glycerin or water is generally used between the transducer and the test surface. When scanning over the part or making precise measurements, an immersion technique is often used. In immersion ultrasonic testing both the transducer and the part are immersed in the couplant, which is typically water. This method of coupling makes it easier to maintain consistent coupling while moving and manipulating the transducer and/or the part.
www.PDHcenter.com PDH Course M469 www.PDHonline.org
©2013 Jurandir Primo Page 21 of 87
20. Pulser-Receivers:
Ultrasonic pulser-receivers are well suited to general purpose ultrasonic testing. Along with appropriate transducers and an oscilloscope, they can be used for flaw detection and thickness gauging in a wide variety of metals, plastics, ceramics, and composites. Ultrasonic pulser-receivers provide a unique, low-cost ultrasonic measurement capability.
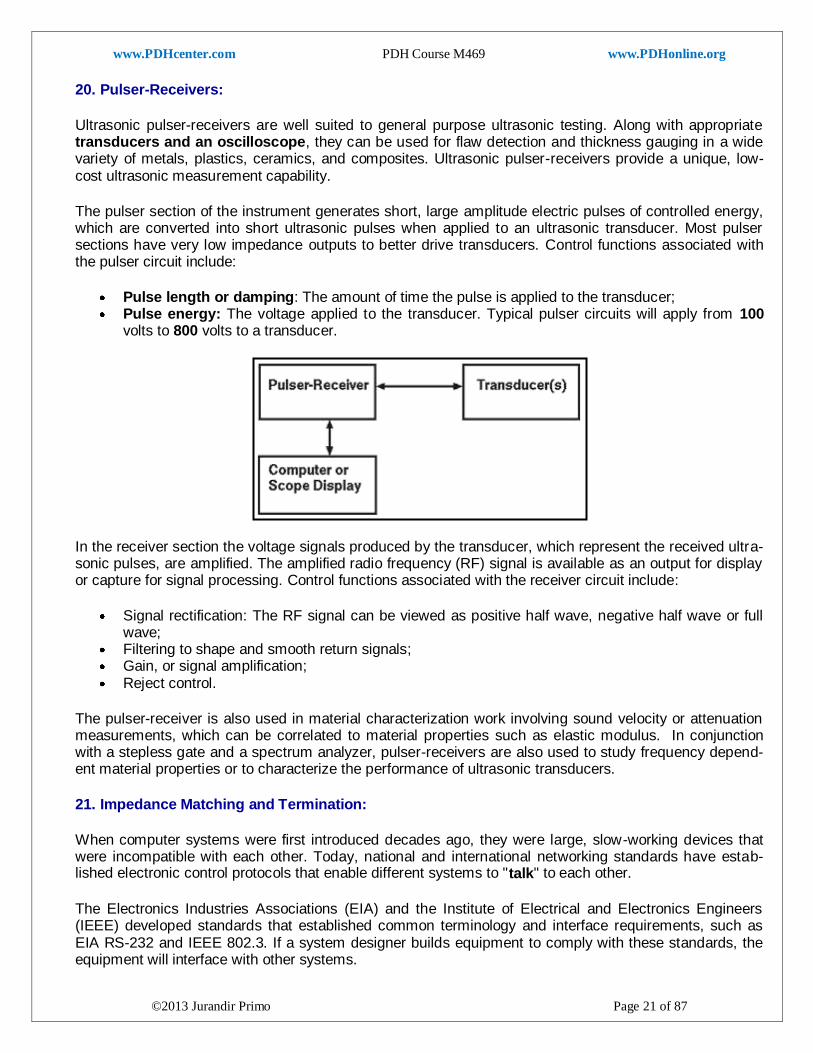
The pulser section of the instrument generates short, large amplitude electric pulses of controlled energy, which are converted into short ultrasonic pulses when applied to an ultrasonic transducer. Most pulser sections have very low impedance outputs to better drive transducers. Control functions associated with the pulser circuit include:
Pulse length or damping: The amount of time the pulse is applied to the transducer; Pulse energy: The voltage applied to the transducer. Typical pulser circuits will apply from 100
volts to 800 volts to a transducer.
In the receiver section the voltage signals produced by the transducer, which represent the received ultra-sonic pulses, are amplified. The amplified radio frequency (RF) signal is available as an output for display or capture for signal processing. Control functions associated with the receiver circuit include:
Signal rectification: The RF signal can be viewed as positive half wave, negative half wave or full wave;
Filtering to shape and smooth return signals; Gain, or signal amplification; Reject control.
The pulser-receiver is also used in material characterization work involving sound velocity or attenuation measurements, which can be correlated to material properties such as elastic modulus. In conjunction with a stepless gate and a spectrum analyzer, pulser-receivers are also used to study frequency depend-ent material properties or to characterize the performance of ultrasonic transducers.
21. Impedance Matching and Termination:
When computer systems were first introduced decades ago, they were large, slow-working devices that were incompatible with each other. Today, national and international networking standards have estab-lished electronic control protocols that enable different systems to "talk" to each other.
The Electronics Industries Associations (EIA) and the Institute of Electrical and Electronics Engineers (IEEE) developed standards that established common terminology and interface requirements, such as EIA RS-232 and IEEE 802.3. If a system designer builds equipment to comply with these standards, the equipment will interface with other systems.
www.PDHcenter.com PDH Course M469 www.PDHonline.org
©2013 Jurandir Primo Page 22 of 87
22. Data Presentation:
Ultrasonic data can be collected and displayed in a number of different formats. The three most common formats are known in the NDT world as A-scan, B-scan and C-scan presentations. Each presentation mode provides a different way of looking at and evaluating the region of material being inspected. Modern computerized ultrasonic scanning systems can display data in all three presentation forms simultaneously.
a. A-Scan Images: The A-scan presentation displays the amount of received ultrasonic energy as a func-tion of time. The relative amount of received energy is plotted along the vertical axis and the elapsed time (which may be related to the sound ener-gy travel time within the material) is displayed along the horizontal axis.
Most instruments with an A-scan display allow the signal to be displayed in its natural radio frequency form (RF), as a fully rectified RF signal, or as ei-ther the positive or negative half of the RF signal. In the A-scan presenta-tion, relative discontinuity size can be estimated by comparing the signal amplitude obtained from an unknown reflector to that from a known reflector. Reflector depth can be determined by the position of the signal on the hori-zontal sweep.
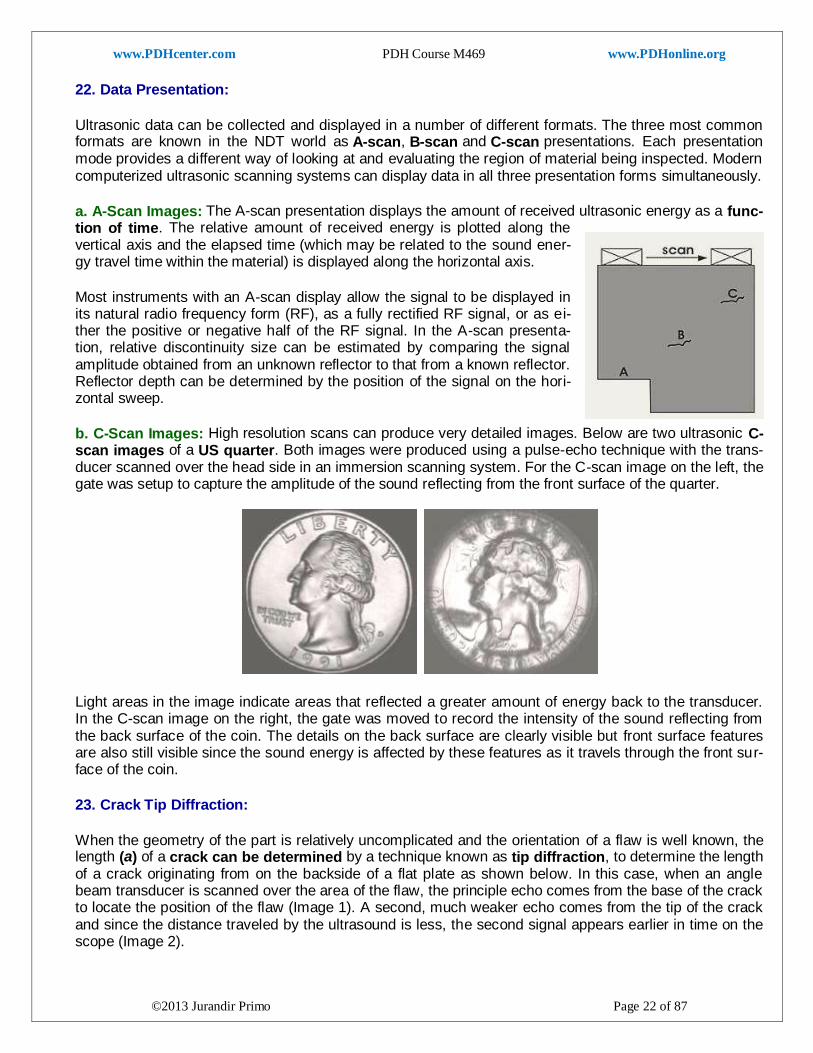
b. C-Scan Images: High resolution scans can produce very detailed images. Below are two ultrasonic C-scan images of a US quarter. Both images were produced using a pulse-echo technique with the trans-ducer scanned over the head side in an immersion scanning system. For the C-scan image on the left, the gate was setup to capture the amplitude of the sound reflecting from the front surface of the quarter.
Light areas in the image indicate areas that reflected a greater amount of energy back to the transducer. In the C-scan image on the right, the gate was moved to record the intensity of the sound reflecting from the back surface of the coin. The details on the back surface are clearly visible but front surface features are also still visible since the sound energy is affected by these features as it travels through the front sur-face of the coin.
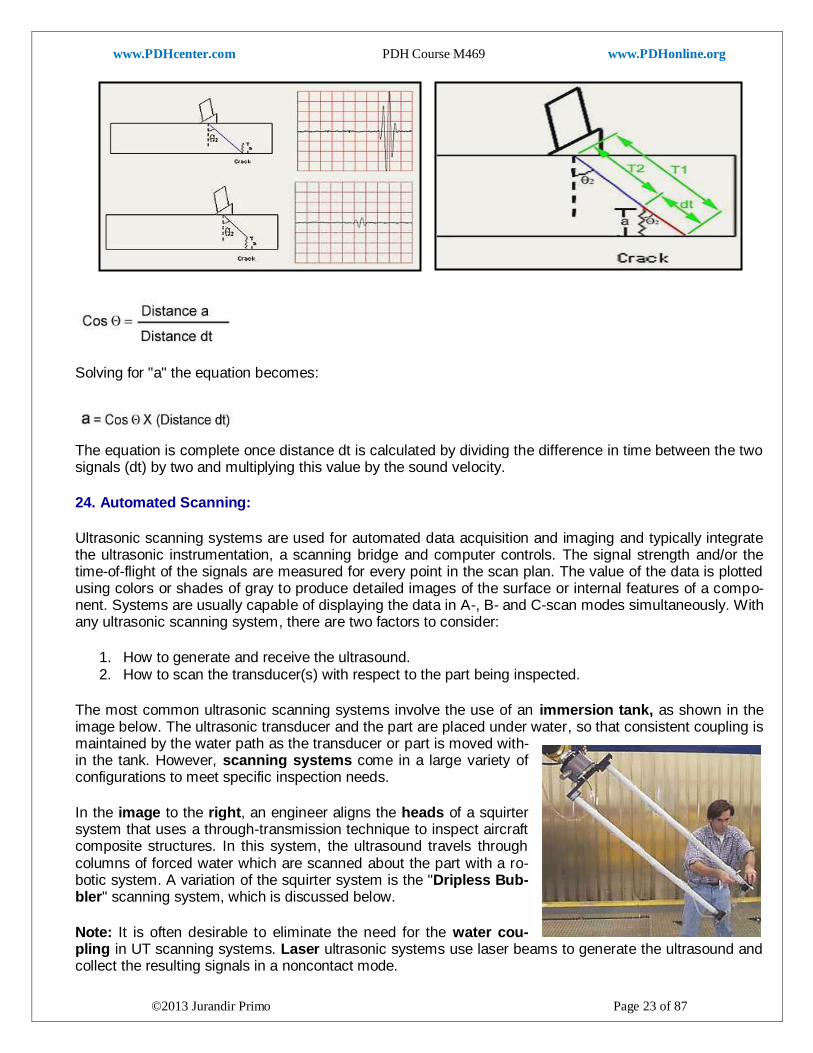
23. Crack Tip Diffraction:
When the geometry of the part is relatively uncomplicated and the orientation of a flaw is well known, the length (a) of a crack can be determined by a technique known as tip diffraction, to determine the length of a crack originating from on the backside of a flat plate as shown below. In this case, when an angle beam transducer is scanned over the area of the flaw, the principle echo comes from the base of the crack to locate the position of the flaw (Image 1). A second, much weaker echo comes from the tip of the crack and since the distance traveled by the ultrasound is less, the second signal appears earlier in time on the scope (Image 2).
www.PDHcenter.com PDH Course M469 www.PDHonline.org
©2013 Jurandir Primo Page 23 of 87
Solving for "a" the equation becomes:
The equation is complete once distance dt is calculated by dividing the difference in time between the two signals (dt) by two and multiplying this value by the sound velocity.
24. Automated Scanning:
Ultrasonic scanning systems are used for automated data acquisition and imaging and typically integrate the ultrasonic instrumentation, a scanning bridge and computer controls. The signal strength and/or the time-of-flight of the signals are measured for every point in the scan plan. The value of the data is plotted using colors or shades of gray to produce detailed images of the surface or internal features of a compo-nent. Systems are usually capable of displaying the data in A-, B- and C-scan modes simultaneously. With any ultrasonic scanning system, there are two factors to consider:
1. How to generate and receive the ultrasound. 2. How to scan the transducer(s) with respect to the part being inspected.
The most common ultrasonic scanning systems involve the use of an immersion tank, as shown in the image below. The ultrasonic transducer and the part are placed under water, so that consistent coupling is maintained by the water path as the transducer or part is moved with-in the tank. However, scanning systems come in a large variety of configurations to meet specific inspection needs.
In the image to the right, an engineer aligns the heads of a squirter system that uses a through-transmission technique to inspect aircraft composite structures. In this system, the ultrasound travels through columns of forced water which are scanned about the part with a ro-botic system. A variation of the squirter system is the "Dripless Bub-bler" scanning system, which is discussed below.
Note: It is often desirable to eliminate the need for the water cou-pling in UT scanning systems. Laser ultrasonic systems use laser beams to generate the ultrasound and collect the resulting signals in a noncontact mode.
www.PDHcenter.com PDH Course M469 www.PDHonline.org
©2013 Jurandir Primo Page 24 of 87
Advances in transducer technology have led to the development of an inspection technique known as air-coupled ultrasonic inspection. This system is capable of sending ultrasonic energy through air and getting enough energy into the part to have a useable signal, which typically use a through-transmission tech-nique since reflected energy from discontinuities is too weak to detect.
The second main consideration is how to scan the transducer(s) considering the part being inspected. When the inspected sample has a flat surface, a simple raster-scan can be used. If the sample is cylin-drical, a turntable can be used to turn the sample while the transducer is held stationary or scanned in the axial direction of the cylinder. When the sample is irregular shaped, scanning becomes more difficult. The curved surface can steer, focus and defocus the ultrasonic beam. For applications involving parts having complex curvatures, scanning systems capable of performing contours are usually necessary.
25. Calibration Methods:
Calibration refers to the act of evaluating and adjusting the precision and accuracy of measurement equipment. In ultrasonic testing, several forms of calibration must occur. First, the electronics of the equipment must be calibrated to ensure that they are performing as designed. This operation is usually performed by the equipment manufacturer and will not be discussed further in this material. It is also usu-ally necessary for the operator to perform a "user calibration" of the equipment.
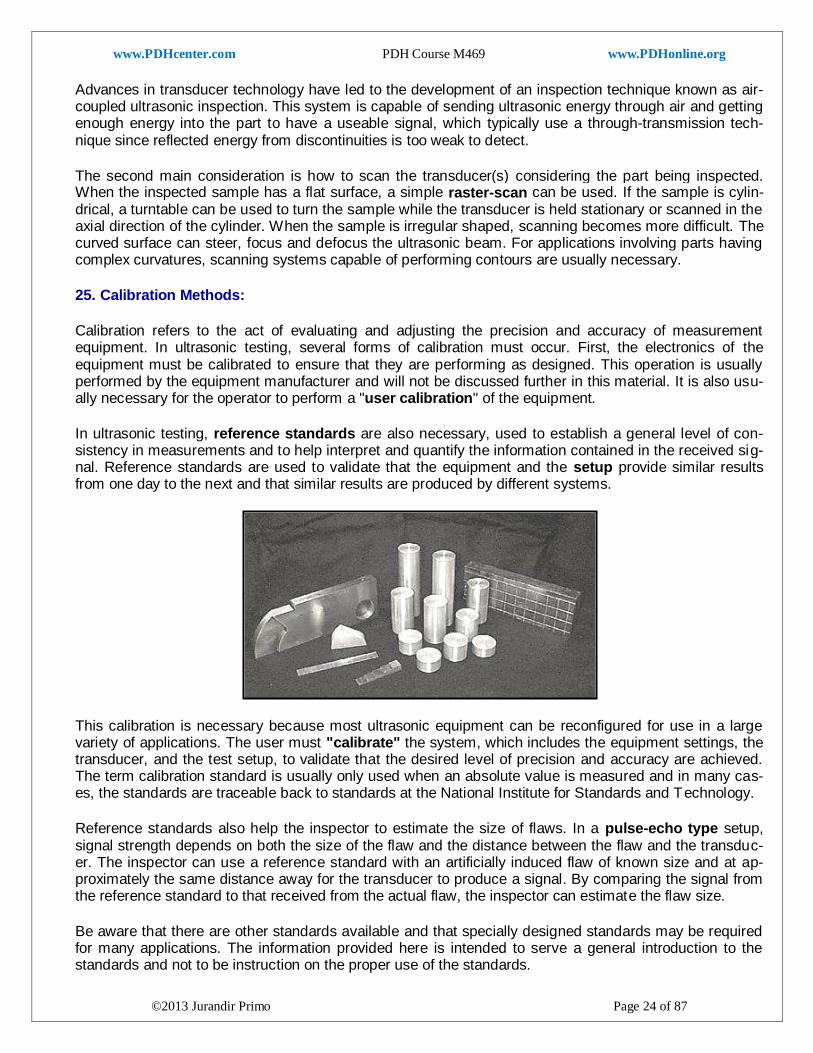
In ultrasonic testing, reference standards are also necessary, used to establish a general level of con-sistency in measurements and to help interpret and quantify the information contained in the received sig-nal. Reference standards are used to validate that the equipment and the setup provide similar results from one day to the next and that similar results are produced by different systems.
This calibration is necessary because most ultrasonic equipment can be reconfigured for use in a large variety of applications. The user must "calibrate" the system, which includes the equipment settings, the transducer, and the test setup, to validate that the desired level of precision and accuracy are achieved. The term calibration standard is usually only used when an absolute value is measured and in many cas-es, the standards are traceable back to standards at the National Institute for Standards and Technology.
Reference standards also help the inspector to estimate the size of flaws. In a pulse-echo type setup, signal strength depends on both the size of the flaw and the distance between the flaw and the transduc-er. The inspector can use a reference standard with an artificially induced flaw of known size and at ap-proximately the same distance away for the transducer to produce a signal. By comparing the signal from the reference standard to that received from the actual flaw, the inspector can estimate the flaw size.
Be aware that there are other standards available and that specially designed standards may be required for many applications. The information provided here is intended to serve a general introduction to the standards and not to be instruction on the proper use of the standards.
www.PDHcenter.com PDH Course M469 www.PDHonline.org
©2013 Jurandir Primo Page 25 of 87
a. Calibration and Reference Standards: Calibration and reference standards for ultrasonic testing come in many shapes and sizes. The type of standard used is dependent on the NDE application and the form and shape of the object being evaluated. The material of the reference standard should be the same as the material being inspected and the artificially induced flaw should closely resemble that of the actual flaw. This second requirement is a major limitation of most standard reference samples.
Most use drilled holes and notches that do not closely represent real flaws. In most cases the artificially induced defects in reference standards are better reflectors of sound energy (due to their flatter and smoother surfaces) and produce indications that are larger than those that a similar sized flaw would pro-duce. Producing more "realistic" defects is cost prohibitive in most cases and, therefore, the inspector can only make an estimate of the flaw size.
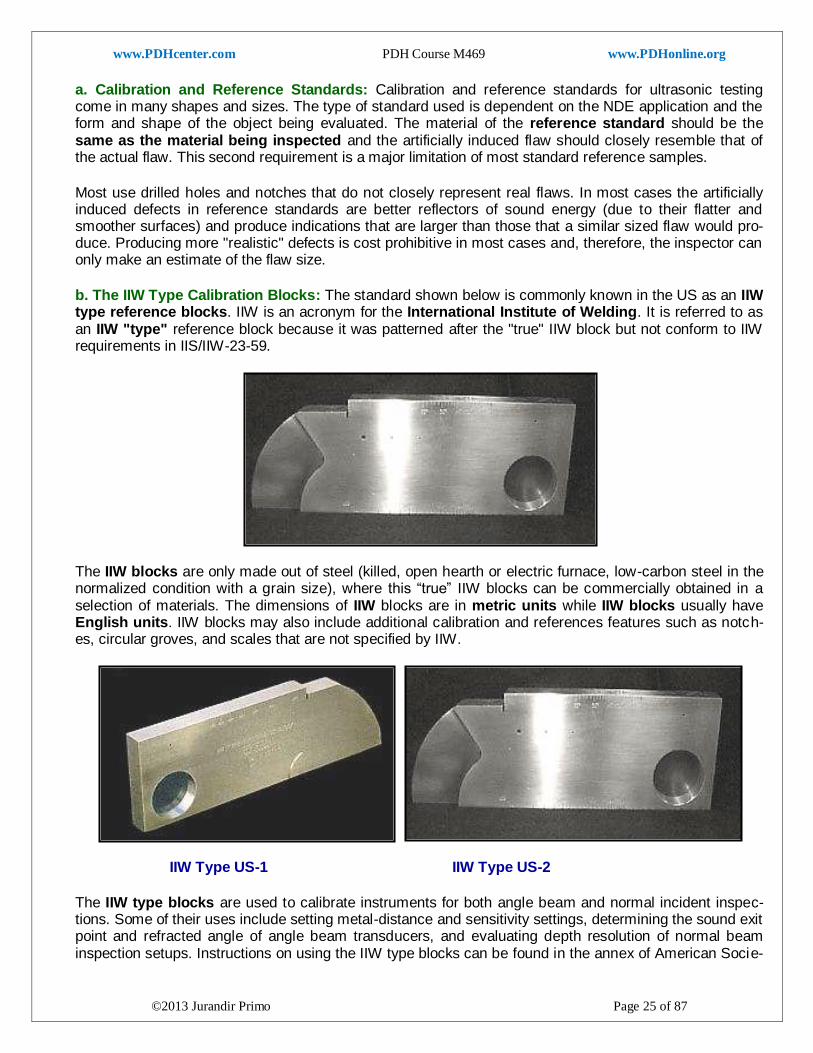
b. The IIW Type Calibration Blocks: The standard shown below is commonly known in the US as an IIW type reference blocks. IIW is an acronym for the International Institute of Welding. It is referred to as an IIW "type" reference block because it was patterned after the "true" IIW block but not conform to IIW requirements in IIS/IIW-23-59.
The IIW blocks are only made out of steel (killed, open hearth or electric furnace, low-carbon steel in the normalized condition with a grain size), where this “true” IIW blocks can be commercially obtained in a selection of materials. The dimensions of IIW blocks are in metric units while IIW blocks usually have English units. IIW blocks may also include additional calibration and references features such as notch-es, circular groves, and scales that are not specified by IIW.
IIW Type US-1 IIW Type US-2
The IIW type blocks are used to calibrate instruments for both angle beam and normal incident inspec-tions. Some of their uses include setting metal-distance and sensitivity settings, determining the sound exit point and refracted angle of angle beam transducers, and evaluating depth resolution of normal beam inspection setups. Instructions on using the IIW type blocks can be found in the annex of American Socie-
www.PDHcenter.com PDH Course M469 www.PDHonline.org
©2013 Jurandir Primo Page 26 of 87
ty for Testing and Materials Standard E164, Standard Practice for Ultrasonic Contact Examination of Weldments.
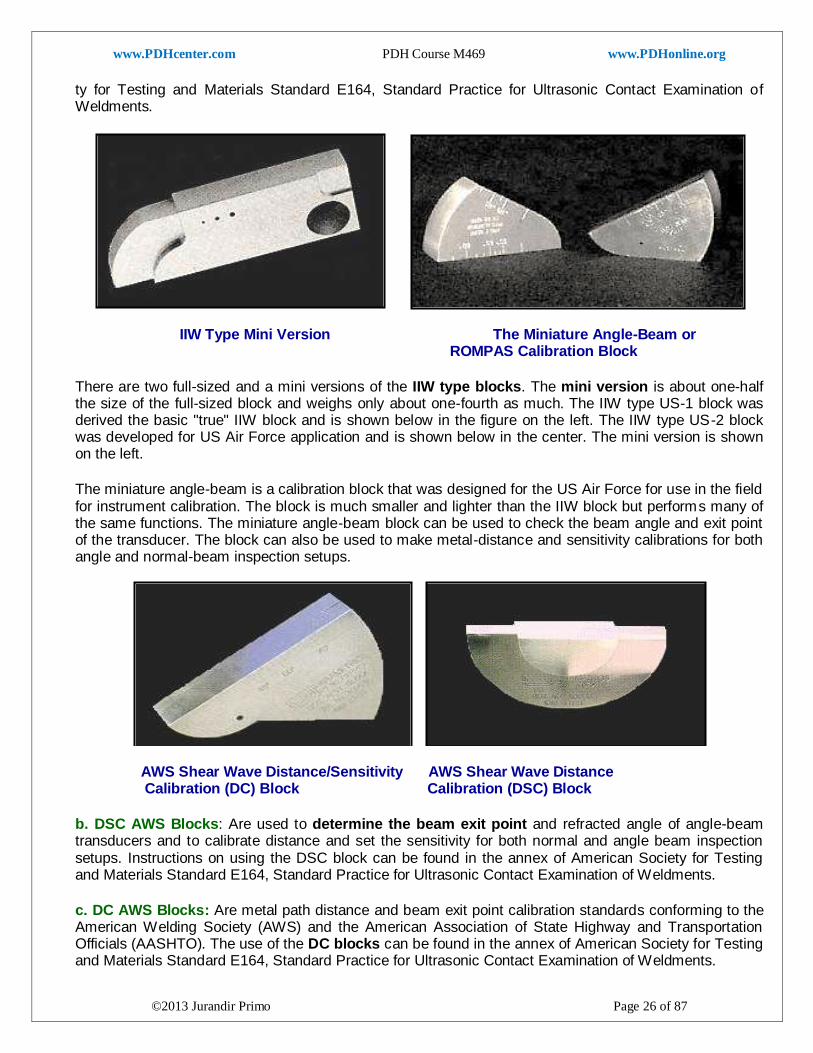
IIW Type Mini Version The Miniature Angle-Beam or ROMPAS Calibration Block
There are two full-sized and a mini versions of the IIW type blocks. The mini version is about one-half the size of the full-sized block and weighs only about one-fourth as much. The IIW type US-1 block was derived the basic "true" IIW block and is shown below in the figure on the left. The IIW type US-2 block was developed for US Air Force application and is shown below in the center. The mini version is shown on the left.
The miniature angle-beam is a calibration block that was designed for the US Air Force for use in the field for instrument calibration. The block is much smaller and lighter than the IIW block but performs many of the same functions. The miniature angle-beam block can be used to check the beam angle and exit point of the transducer. The block can also be used to make metal-distance and sensitivity calibrations for both angle and normal-beam inspection setups.
AWS Shear Wave Distance/Sensitivity AWS Shear Wave Distance Calibration (DC) Block Calibration (DSC) Block
b. DSC AWS Blocks: Are used to determine the beam exit point and refracted angle of angle-beam transducers and to calibrate distance and set the sensitivity for both normal and angle beam inspection setups. Instructions on using the DSC block can be found in the annex of American Society for Testing and Materials Standard E164, Standard Practice for Ultrasonic Contact Examination of Weldments.
c. DC AWS Blocks: Are metal path distance and beam exit point calibration standards conforming to the American Welding Society (AWS) and the American Association of State Highway and Transportation Officials (AASHTO). The use of the DC blocks can be found in the annex of American Society for Testing and Materials Standard E164, Standard Practice for Ultrasonic Contact Examination of Weldments.
www.PDHcenter.com PDH Course M469 www.PDHonline.org
©2013 Jurandir Primo Page 27 of 87
AWS Resolution Calibration (RC) Block 30 FBH Resolution Reference Block
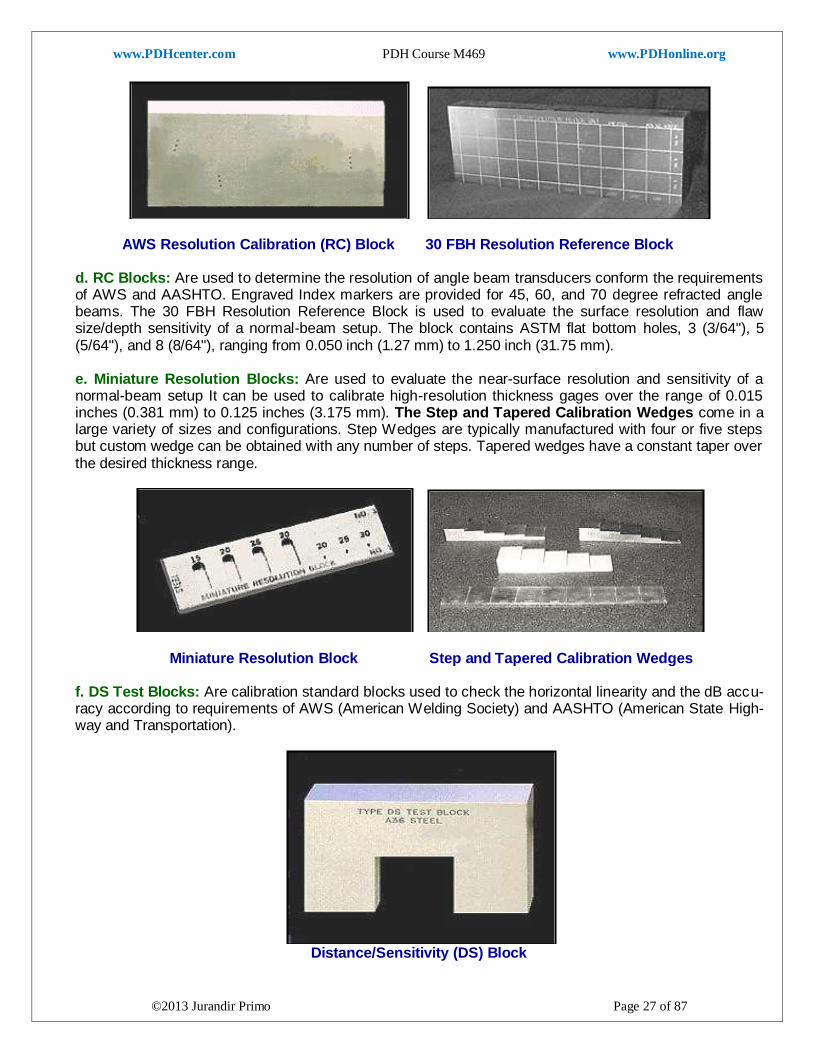
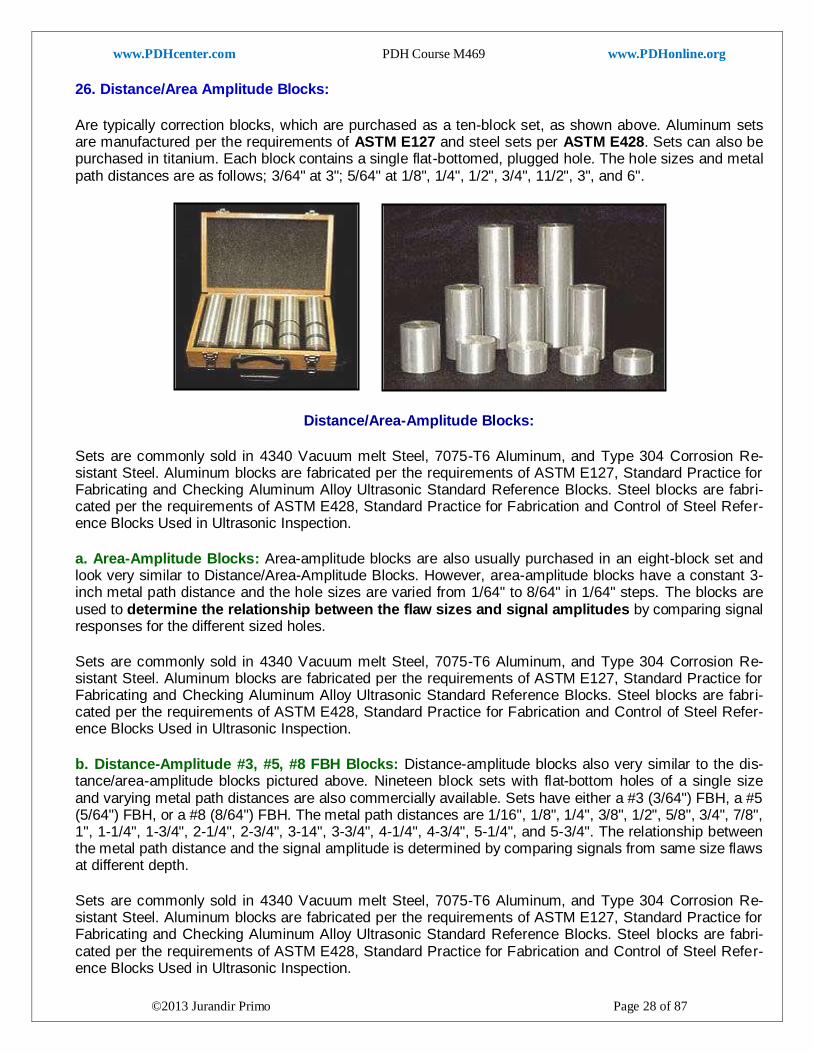
d. RC Blocks: Are used to determine the resolution of angle beam transducers conform the requirements of AWS and AASHTO. Engraved Index markers are provided for 45, 60, and 70 degree refracted angle beams. The 30 FBH Resolution Reference Block is used to evaluate the surface resolution and flaw size/depth sensitivity of a normal-beam setup. The block contains ASTM flat bottom holes, 3 (3/64"), 5 (5/64"), and 8 (8/64"), ranging from 0.050 inch (1.27 mm) to 1.250 inch (31.75 mm). e. Miniature Resolution Blocks: Are used to evaluate the near-surface resolution and sensitivity of a normal-beam setup It can be used to calibrate high-resolution thickness gages over the range of 0.015 inches (0.381 mm) to 0.125 inches (3.175 mm). The Step and Tapered Calibration Wedges come in a large variety of sizes and configurations. Step Wedges are typically manufactured with four or five steps but custom wedge can be obtained with any number of steps. Tapered wedges have a constant taper over the desired thickness range.
Miniature Resolution Block Step and Tapered Calibration Wedges
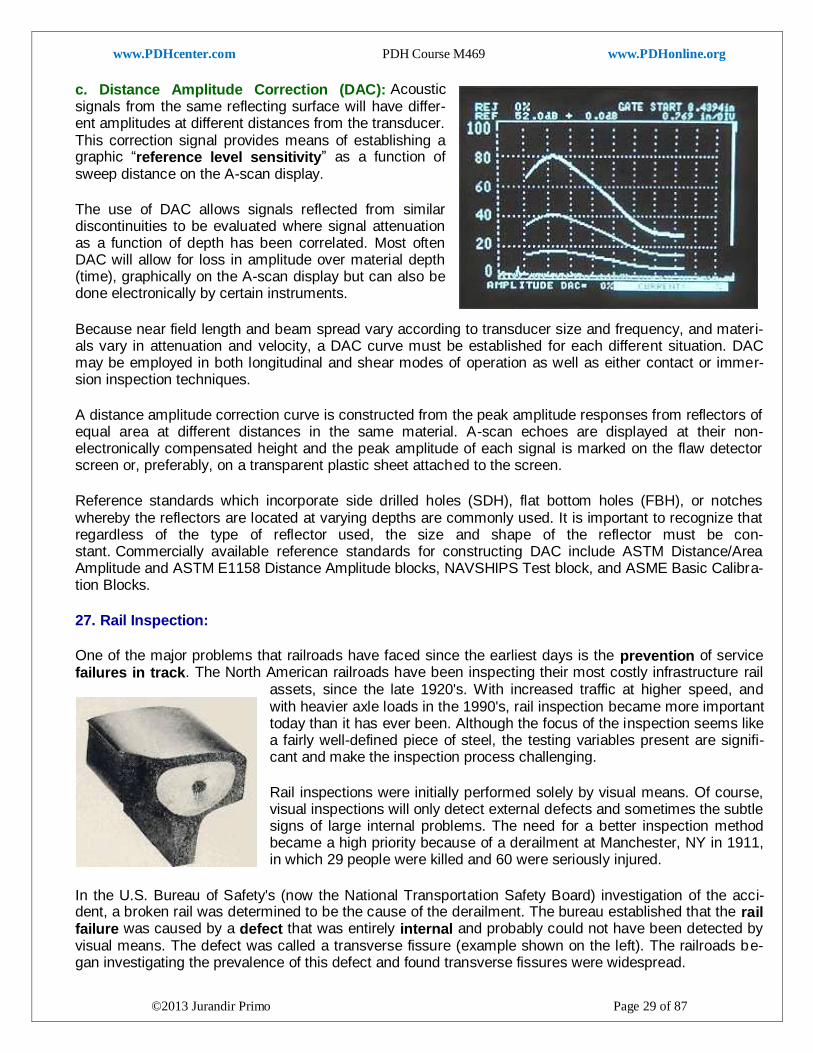
f. DS Test Blocks: Are calibration standard blocks used to check the horizontal linearity and the dB accu-racy according to requirements of AWS (American Welding Society) and AASHTO (American State High-way and Transportation).
Distance/Sensitivity (DS) Block
www.PDHcenter.com PDH Course M469 www.PDHonline.org
©2013 Jurandir Primo Page 28 of 87
26. Distance/Area Amplitude Blocks:
Are typically correction blocks, which are purchased as a ten-block set, as shown above. Aluminum sets are manufactured per the requirements of ASTM E127 and steel sets per ASTM E428. Sets can also be purchased in titanium. Each block contains a single flat-bottomed, plugged hole. The hole sizes and metal path distances are as follows; 3/64" at 3"; 5/64" at 1/8", 1/4", 1/2", 3/4", 11/2", 3", and 6".
-----
Distance/Area-Amplitude Blocks:
Sets are commonly sold in 4340 Vacuum melt Steel, 7075-T6 Aluminum, and Type 304 Corrosion Re-sistant Steel. Aluminum blocks are fabricated per the requirements of ASTM E127, Standard Practice for Fabricating and Checking Aluminum Alloy Ultrasonic Standard Reference Blocks. Steel blocks are fabri-cated per the requirements of ASTM E428, Standard Practice for Fabrication and Control of Steel Refer-ence Blocks Used in Ultrasonic Inspection.
a. Area-Amplitude Blocks: Area-amplitude blocks are also usually purchased in an eight-block set and look very similar to Distance/Area-Amplitude Blocks. However, area-amplitude blocks have a constant 3-inch metal path distance and the hole sizes are varied from 1/64" to 8/64" in 1/64" steps. The blocks are used to determine the relationship between the flaw sizes and signal amplitudes by comparing signal responses for the different sized holes.
Sets are commonly sold in 4340 Vacuum melt Steel, 7075-T6 Aluminum, and Type 304 Corrosion Re-sistant Steel. Aluminum blocks are fabricated per the requirements of ASTM E127, Standard Practice for Fabricating and Checking Aluminum Alloy Ultrasonic Standard Reference Blocks. Steel blocks are fabri-cated per the requirements of ASTM E428, Standard Practice for Fabrication and Control of Steel Refer-ence Blocks Used in Ultrasonic Inspection.
b. Distance-Amplitude #3, #5, #8 FBH Blocks: Distance-amplitude blocks also very similar to the dis-tance/area-amplitude blocks pictured above. Nineteen block sets with flat-bottom holes of a single size and varying metal path distances are also commercially available. Sets have either a #3 (3/64") FBH, a #5 (5/64") FBH, or a #8 (8/64") FBH. The metal path distances are 1/16", 1/8", 1/4", 3/8", 1/2", 5/8", 3/4", 7/8", 1", 1-1/4", 1-3/4", 2-1/4", 2-3/4", 3-14", 3-3/4", 4-1/4", 4-3/4", 5-1/4", and 5-3/4". The relationship between the metal path distance and the signal amplitude is determined by comparing signals from same size flaws at different depth.
Sets are commonly sold in 4340 Vacuum melt Steel, 7075-T6 Aluminum, and Type 304 Corrosion Re-sistant Steel. Aluminum blocks are fabricated per the requirements of ASTM E127, Standard Practice for Fabricating and Checking Aluminum Alloy Ultrasonic Standard Reference Blocks. Steel blocks are fabri-cated per the requirements of ASTM E428, Standard Practice for Fabrication and Control of Steel Refer-ence Blocks Used in Ultrasonic Inspection.
www.PDHcenter.com PDH Course M469 www.PDHonline.org
©2013 Jurandir Primo Page 29 of 87
c. Distance Amplitude Correction (DAC): Acoustic signals from the same reflecting surface will have differ-ent amplitudes at different distances from the transducer. This correction signal provides means of establishing a graphic “reference level sensitivity” as a function of sweep distance on the A-scan display.
The use of DAC allows signals reflected from similar discontinuities to be evaluated where signal attenuation as a function of depth has been correlated. Most often DAC will allow for loss in amplitude over material depth (time), graphically on the A-scan display but can also be done electronically by certain instruments.
Because near field length and beam spread vary according to transducer size and frequency, and materi-als vary in attenuation and velocity, a DAC curve must be established for each different situation. DAC may be employed in both longitudinal and shear modes of operation as well as either contact or immer-sion inspection techniques.
A distance amplitude correction curve is constructed from the peak amplitude responses from reflectors of equal area at different distances in the same material. A-scan echoes are displayed at their non-electronically compensated height and the peak amplitude of each signal is marked on the flaw detector screen or, preferably, on a transparent plastic sheet attached to the screen.
Reference standards which incorporate side drilled holes (SDH), flat bottom holes (FBH), or notches whereby the reflectors are located at varying depths are commonly used. It is important to recognize that regardless of the type of reflector used, the size and shape of the reflector must be con-stant. Commercially available reference standards for constructing DAC include ASTM Distance/Area Amplitude and ASTM E1158 Distance Amplitude blocks, NAVSHIPS Test block, and ASME Basic Calibra-tion Blocks.
27. Rail Inspection:
One of the major problems that railroads have faced since the earliest days is the prevention of service failures in track. The North American railroads have been inspecting their most costly infrastructure rail
assets, since the late 1920's. With increased traffic at higher speed, and with heavier axle loads in the 1990's, rail inspection became more important today than it has ever been. Although the focus of the inspection seems like a fairly well-defined piece of steel, the testing variables present are signifi-cant and make the inspection process challenging.
Rail inspections were initially performed solely by visual means. Of course, visual inspections will only detect external defects and sometimes the subtle signs of large internal problems. The need for a better inspection method became a high priority because of a derailment at Manchester, NY in 1911, in which 29 people were killed and 60 were seriously injured.
In the U.S. Bureau of Safety's (now the National Transportation Safety Board) investigation of the acci-dent, a broken rail was determined to be the cause of the derailment. The bureau established that the rail failure was caused by a defect that was entirely internal and probably could not have been detected by visual means. The defect was called a transverse fissure (example shown on the left). The railroads be-gan investigating the prevalence of this defect and found transverse fissures were widespread.

www.PDHcenter.com PDH Course M469 www.PDHonline.org
©2013 Jurandir Primo Page 30 of 87
One of the methods used to inspect rail is ultrasonic inspection. Both normal- and angle-beam techniques are used, as are both pulse-echo and pitch-catch techniques. The different transducer arrangements offer different inspection capabilities. Manual contact testing is done to evaluate small sections of rail but the ultrasonic inspection has been automated to allow inspection of large amounts of rail. Fluid filled wheels or sleds are often used to couple the transducers to the rail. Sperry Rail Services, one of the companies that perform rail inspection, uses Roller Search Units (RSU's) with a combination of dif-ferent transducer angles to achieve the best inspection possible. A schematic of an RSU is shown below.
28. Welded Joints Inspection: The most commonly occurring defects in welded joints are porosity, slag inclusions, lack of side-wall fusion, lack of inter-run fusion, lack of root penetration, undercutting, and longitudinal or trans-verse cracks. With the exception of single gas pores all the defects listed are usually well detectable by ultrasonics. Most applications are on low-alloy construction quality steels, however, welds in aluminum can also be tested. Ultrasonic flaw detection has long been the preferred method for nondestructive testing in welding appli-cations. This safe, accurate, and simple technique has pushed ultrasonics to the forefront of inspection technology. Ultrasonic weld inspections are typically performed using a straight beam transducer in
conjunction with an angle beam transducer and wedge. A straight beam transducer, producing a longitu-dinal wave at normal incidence into the test piece, is first used to locate any laminations in or near the heat-affected zone. This is important because an angle beam transducer may not be able to provide a return signal from a laminar flaw.
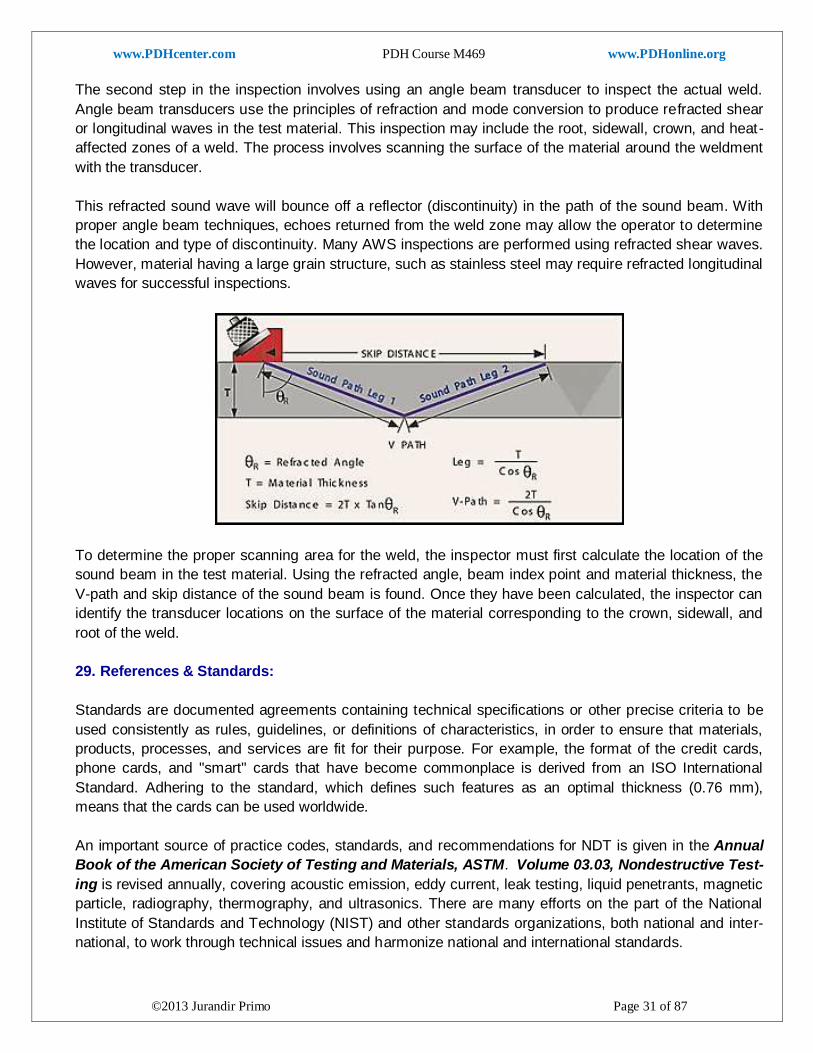
www.PDHcenter.com PDH Course M469 www.PDHonline.org
©2013 Jurandir Primo Page 31 of 87
The second step in the inspection involves using an angle beam transducer to inspect the actual weld.
Angle beam transducers use the principles of refraction and mode conversion to produce refracted shear
or longitudinal waves in the test material. This inspection may include the root, sidewall, crown, and heat-
affected zones of a weld. The process involves scanning the surface of the material around the weldment
with the transducer.
This refracted sound wave will bounce off a reflector (discontinuity) in the path of the sound beam. With
proper angle beam techniques, echoes returned from the weld zone may allow the operator to determine
the location and type of discontinuity. Many AWS inspections are performed using refracted shear waves.
However, material having a large grain structure, such as stainless steel may require refracted longitudinal
waves for successful inspections.
To determine the proper scanning area for the weld, the inspector must first calculate the location of the
sound beam in the test material. Using the refracted angle, beam index point and material thickness, the
V-path and skip distance of the sound beam is found. Once they have been calculated, the inspector can
identify the transducer locations on the surface of the material corresponding to the crown, sidewall, and
root of the weld.
29. References & Standards:
Standards are documented agreements containing technical specifications or other precise criteria to be
used consistently as rules, guidelines, or definitions of characteristics, in order to ensure that materials,
products, processes, and services are fit for their purpose. For example, the format of the credit cards,
phone cards, and "smart" cards that have become commonplace is derived from an ISO International
Standard. Adhering to the standard, which defines such features as an optimal thickness (0.76 mm),
means that the cards can be used worldwide.
An important source of practice codes, standards, and recommendations for NDT is given in the Annual
Book of the American Society of Testing and Materials, ASTM. Volume 03.03, Nondestructive Test-
ing is revised annually, covering acoustic emission, eddy current, leak testing, liquid penetrants, magnetic
particle, radiography, thermography, and ultrasonics. There are many efforts on the part of the National
Institute of Standards and Technology (NIST) and other standards organizations, both national and inter-
national, to work through technical issues and harmonize national and international standards.
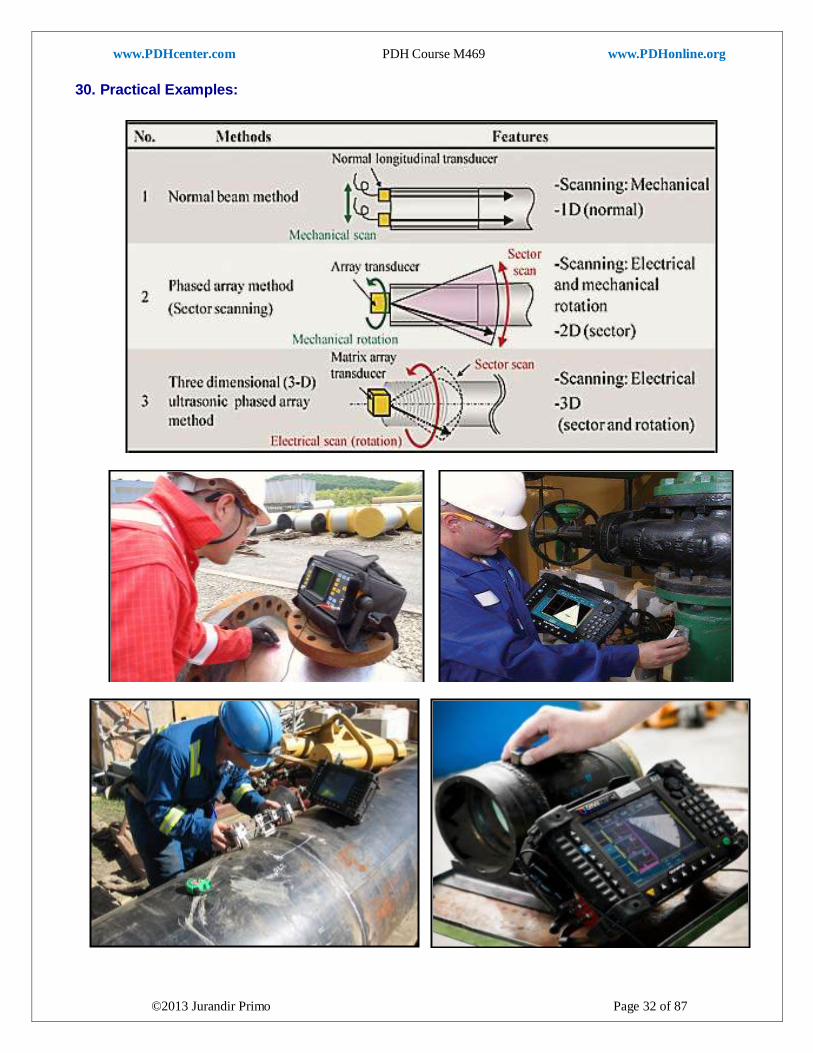
www.PDHcenter.com PDH Course M469 www.PDHonline.org
©2013 Jurandir Primo Page 32 of 87
30. Practical Examples:

www.PDHcenter.com PDH Course M469 www.PDHonline.org
©2013 Jurandir Primo Page 33 of 87

www.PDHcenter.com PDH Course M469 www.PDHonline.org
©2013 Jurandir Primo Page 34 of 87
2. Eddy Current Inspection (ET):
Eddy current inspection is one of several NDT methods that use the principal of “electromagnetism” as the basis for conducting examinations. Several other methods such as Remote Field Testing (RFT), Flux
Leakage and Barkhausen Noise also use this principle. Eddy current testing is widely used in the aero-space industry and in other manufacturing that require inspection of thin metal for potential safety-related problems. Crack detection in metal sheets and tubing, can be used for certain metal thickness measure-ments, identifying corrosion under aircraft skin, monitoring the effects of heat treatment, and to determine the thickness of nonconductive coatings over conductive substrates, like paint on metal parts.
Eddy currents are created through a process called electromagnetic induction. When alternating current is applied to the conductor, such as copper wire, a magnetic field develops in and around the conductor. This magnetic field expands as the alternating current rises to maximum and collapses as the current is reduced to zero. If another electrical conductor is brought into the close proximity to this changing magnetic field, current will be induced in this second conductor. Eddy currents are induced electrical currents that flow in a circular path. They get their name from “eddies” that are formed when a liquid or gas flows in a circular path around obstacles when conditions are right.
One of the major advantages of eddy current as an NDT tool is the variety of inspections and measure-ments that can be performed. In the proper circumstances, eddy currents can be used for:
Crack detection; Material thickness measurements; Coating thickness measurements; Conductivity measurements for:
o Material identification; o Heat damage detection; o Case depth determination; o Heat treatment monitoring.
a. Advantages of Eddy Current Inspection:
Sensitive to small cracks and other defects; Detects surface and near surface defects; Inspection gives immediate results; Equipment is very portable; Method can be used for much more than flaw detection; Minimum part preparation is required; Test probe does not need to contact the part; Inspects complex shapes and sizes of conductive materials.
b. Limitations of Eddy Current Inspection:
Only conductive materials can be inspected; Surface must be accessible to the probe; Skill and training required is more extensive than other techniques; Surface finish and roughness may interfere; Reference standards needed for setup; Depth of penetration is limited; Flaws such as delaminations that lie parallel to the probe coil winding; Probe scan direction are undetectable.
www.PDHcenter.com PDH Course M469 www.PDHonline.org
©2013 Jurandir Primo Page 35 of 87
1. History of Eddy Current Testing:
Eddy current testing has its origins with Michael Faraday's discovery of electromagnetic induction in 1831. Faraday was a chemist in England during the early 1800's and is credited with the discovery of electromagnetic induc-tion, electromagnetic rotations, the magneto-optical effect, diamagnetism, and other phenomena. In 1879, another scientist named Hughes recorded changes in the properties of a coil when placed in contact with metals of di f-ferent conductivity and permeability.
However, it was not until the Second World War that these effects were put to practical use for testing materials. Much work was done in the 1950's and 60's, particularly in the aircraft and nuclear industries. Eddy current testing is now a widely used and well-understood inspection technique.
2. Present State of Eddy Current Inspection:
Eddy current inspection is used in a variety of industries to find defects and make measurements. One of the primary uses of eddy current testing is for defect detection when the nature of the defect is well under-stood. In general, the technique is used to inspect a relatively small area and the probe design and test parameters must be established with a good understanding of the flaw that is to be detected. Since eddy currents tend to concentrate at the surface of a material, they can only be used to detect surface and near surface defects.
In thin materials such as tubing and sheet stock, eddy currents can be used to measure the thickness of the material. This makes eddy current a useful tool for detecting corrosion damage and other damage that causes a thinning of the material. The technique is used to make corrosion thinning measurements on aircraft skins and in the walls of tubing used in assemblies such as heat exchangers. Eddy current testing is also used to measure the thickness of paints and other coatings.
Eddy currents are also affected by the electrical conductivity and magnetic permeability of materials. Therefore, eddy current measurements can be used to sort materials and to tell if a material has seen high temperatures or been heat treated, which changes the conduc-tivity of some materials.
Eddy current equipment and probes can be purchased in a wide variety of configurations. Eddy scopes and a conductivity tester come packaged in very small and battery operated units for easy portability. Computer based systems are also available that pro-vide easy data manipulation features for the laboratory.
Signal processing software has also been developed for trend removal, background subtraction, and noise reduction. Imped-ance analyzers are also sometimes used to allow improved quantitative eddy-current measurements.
Some laboratories have multidimensional scanning capabilities that are used to produce images of the scan regions. A few portable scanning systems also exist for special applications, such as scanning re-gions of aircraft fuselages. The major advantage is that Eddy current can examine large areas very quick-ly, and it does not require use of coupling liquids.
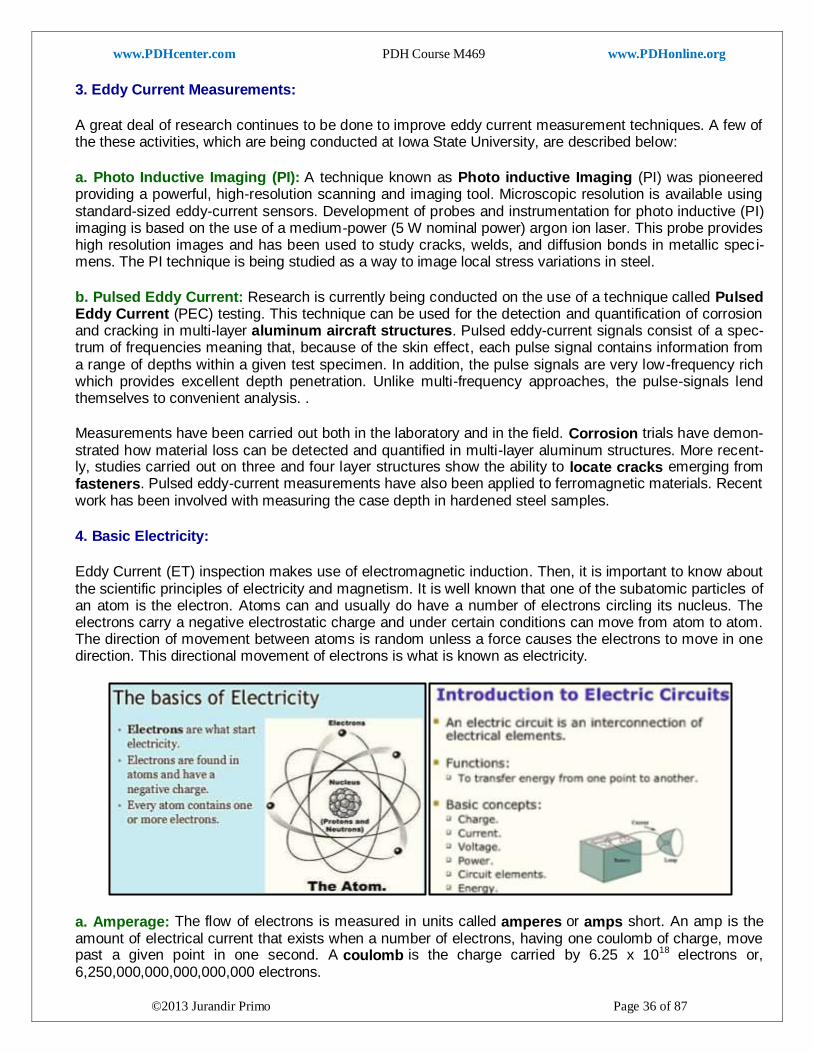
www.PDHcenter.com PDH Course M469 www.PDHonline.org
©2013 Jurandir Primo Page 36 of 87
3. Eddy Current Measurements:
A great deal of research continues to be done to improve eddy current measurement techniques. A few of the these activities, which are being conducted at Iowa State University, are described below:
a. Photo Inductive Imaging (PI): A technique known as Photo inductive Imaging (PI) was pioneered providing a powerful, high-resolution scanning and imaging tool. Microscopic resolution is available using standard-sized eddy-current sensors. Development of probes and instrumentation for photo inductive (PI) imaging is based on the use of a medium-power (5 W nominal power) argon ion laser. This probe provides high resolution images and has been used to study cracks, welds, and diffusion bonds in metallic speci-mens. The PI technique is being studied as a way to image local stress variations in steel.
b. Pulsed Eddy Current: Research is currently being conducted on the use of a technique called Pulsed Eddy Current (PEC) testing. This technique can be used for the detection and quantification of corrosion and cracking in multi-layer aluminum aircraft structures. Pulsed eddy-current signals consist of a spec-trum of frequencies meaning that, because of the skin effect, each pulse signal contains information from a range of depths within a given test specimen. In addition, the pulse signals are very low-frequency rich which provides excellent depth penetration. Unlike multi-frequency approaches, the pulse-signals lend themselves to convenient analysis. .
Measurements have been carried out both in the laboratory and in the field. Corrosion trials have demon-strated how material loss can be detected and quantified in multi-layer aluminum structures. More recent-ly, studies carried out on three and four layer structures show the ability to locate cracks emerging from fasteners. Pulsed eddy-current measurements have also been applied to ferromagnetic materials. Recent work has been involved with measuring the case depth in hardened steel samples.
4. Basic Electricity:
Eddy Current (ET) inspection makes use of electromagnetic induction. Then, it is important to know about the scientific principles of electricity and magnetism. It is well known that one of the subatomic particles of an atom is the electron. Atoms can and usually do have a number of electrons circling its nucleus. The electrons carry a negative electrostatic charge and under certain conditions can move from atom to atom. The direction of movement between atoms is random unless a force causes the electrons to move in one direction. This directional movement of electrons is what is known as electricity.
a. Amperage: The flow of electrons is measured in units called amperes or amps short. An amp is the amount of electrical current that exists when a number of electrons, having one coulomb of charge, move past a given point in one second. A coulomb is the charge carried by 6.25 x 10¹⁸ electrons or, 6,250,000,000,000,000,000 electrons.
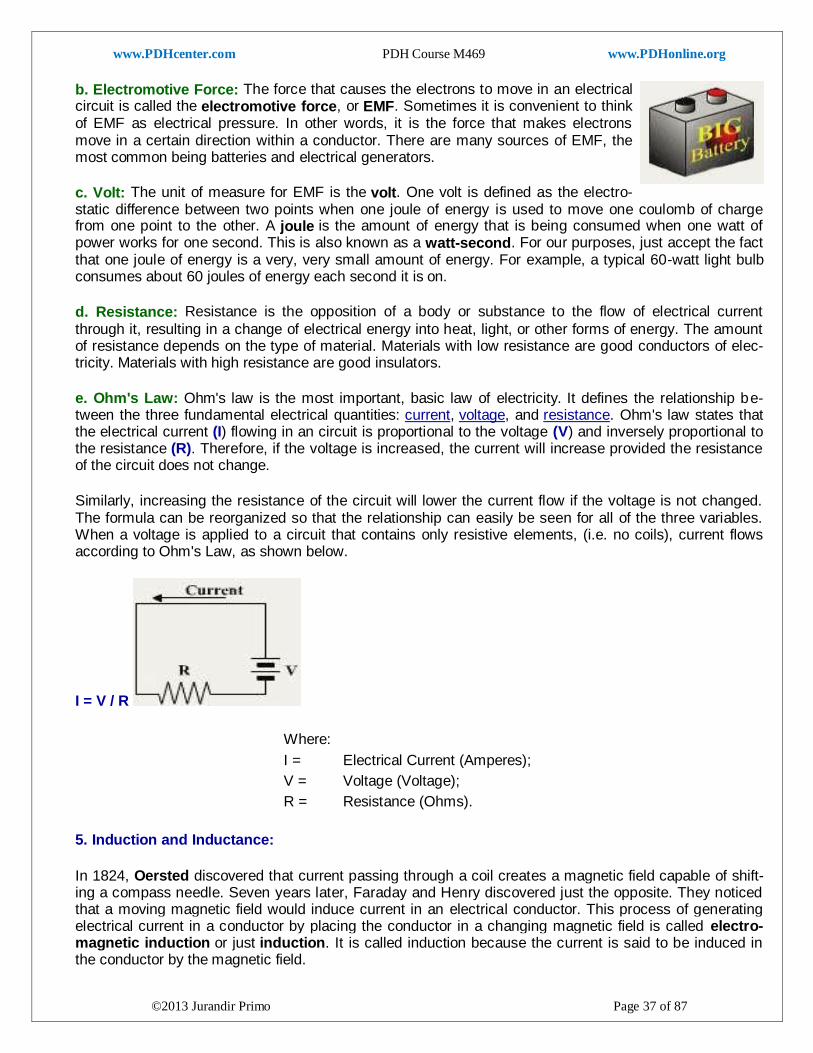
www.PDHcenter.com PDH Course M469 www.PDHonline.org
©2013 Jurandir Primo Page 37 of 87
b. Electromotive Force: The force that causes the electrons to move in an electrical circuit is called the electromotive force, or EMF. Sometimes it is convenient to think of EMF as electrical pressure. In other words, it is the force that makes electrons move in a certain direction within a conductor. There are many sources of EMF, the most common being batteries and electrical generators.
c. Volt: The unit of measure for EMF is the volt. One volt is defined as the electro-static difference between two points when one joule of energy is used to move one coulomb of charge from one point to the other. A joule is the amount of energy that is being consumed when one watt of power works for one second. This is also known as a watt-second. For our purposes, just accept the fact that one joule of energy is a very, very small amount of energy. For example, a typical 60-watt light bulb consumes about 60 joules of energy each second it is on.
d. Resistance: Resistance is the opposition of a body or substance to the flow of electrical current
through it, resulting in a change of electrical energy into heat, light, or other forms of energy. The amount of resistance depends on the type of material. Materials with low resistance are good conductors of elec-tricity. Materials with high resistance are good insulators.
e. Ohm's Law: Ohm's law is the most important, basic law of electricity. It defines the relationship be-tween the three fundamental electrical quantities: current, voltage, and resistance. Ohm's law states that the electrical current (I) flowing in an circuit is proportional to the voltage (V) and inversely proportional to the resistance (R). Therefore, if the voltage is increased, the current will increase provided the resistance of the circuit does not change.
Similarly, increasing the resistance of the circuit will lower the current flow if the voltage is not changed. The formula can be reorganized so that the relationship can easily be seen for all of the three variables. When a voltage is applied to a circuit that contains only resistive elements, (i.e. no coils), current flows according to Ohm's Law, as shown below.
I = V / R
Where:
I = Electrical Current (Amperes);
V = Voltage (Voltage);
R = Resistance (Ohms).
5. Induction and Inductance:
In 1824, Oersted discovered that current passing through a coil creates a magnetic field capable of shift-ing a compass needle. Seven years later, Faraday and Henry discovered just the opposite. They noticed that a moving magnetic field would induce current in an electrical conductor. This process of generating electrical current in a conductor by placing the conductor in a changing magnetic field is called electro-magnetic induction or just induction. It is called induction because the current is said to be induced in the conductor by the magnetic field.
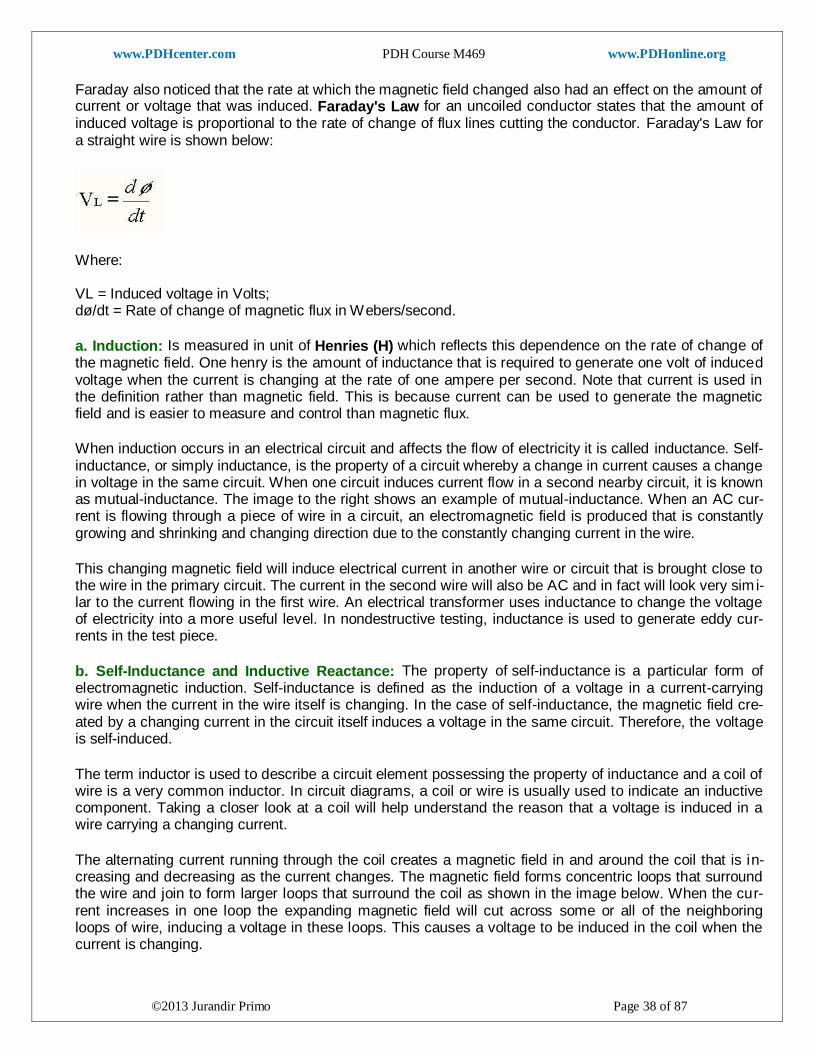
www.PDHcenter.com PDH Course M469 www.PDHonline.org
©2013 Jurandir Primo Page 38 of 87
Faraday also noticed that the rate at which the magnetic field changed also had an effect on the amount of current or voltage that was induced. Faraday's Law for an uncoiled conductor states that the amount of induced voltage is proportional to the rate of change of flux lines cutting the conductor. Faraday's Law for a straight wire is shown below:
Where: VL = Induced voltage in Volts; dø/dt = Rate of change of magnetic flux in Webers/second.
a. Induction: Is measured in unit of Henries (H) which reflects this dependence on the rate of change of the magnetic field. One henry is the amount of inductance that is required to generate one volt of induced voltage when the current is changing at the rate of one ampere per second. Note that current is used in the definition rather than magnetic field. This is because current can be used to generate the magnetic field and is easier to measure and control than magnetic flux.
When induction occurs in an electrical circuit and affects the flow of electricity it is called inductance. Self-inductance, or simply inductance, is the property of a circuit whereby a change in current causes a change in voltage in the same circuit. When one circuit induces current flow in a second nearby circuit, it is known as mutual-inductance. The image to the right shows an example of mutual-inductance. When an AC cur-rent is flowing through a piece of wire in a circuit, an electromagnetic field is produced that is constantly growing and shrinking and changing direction due to the constantly changing current in the wire.
This changing magnetic field will induce electrical current in another wire or circuit that is brought close to the wire in the primary circuit. The current in the second wire will also be AC and in fact will look very sim i-lar to the current flowing in the first wire. An electrical transformer uses inductance to change the voltage of electricity into a more useful level. In nondestructive testing, inductance is used to generate eddy cur-rents in the test piece.
b. Self-Inductance and Inductive Reactance: The property of self-inductance is a particular form of electromagnetic induction. Self-inductance is defined as the induction of a voltage in a current-carrying wire when the current in the wire itself is changing. In the case of self-inductance, the magnetic field cre-ated by a changing current in the circuit itself induces a voltage in the same circuit. Therefore, the voltage is self-induced.
The term inductor is used to describe a circuit element possessing the property of inductance and a coil of wire is a very common inductor. In circuit diagrams, a coil or wire is usually used to indicate an inductive component. Taking a closer look at a coil will help understand the reason that a voltage is induced in a wire carrying a changing current.
The alternating current running through the coil creates a magnetic field in and around the coil that is in-creasing and decreasing as the current changes. The magnetic field forms concentric loops that surround the wire and join to form larger loops that surround the coil as shown in the image below. When the cur-rent increases in one loop the expanding magnetic field will cut across some or all of the neighboring loops of wire, inducing a voltage in these loops. This causes a voltage to be induced in the coil when the current is changing.
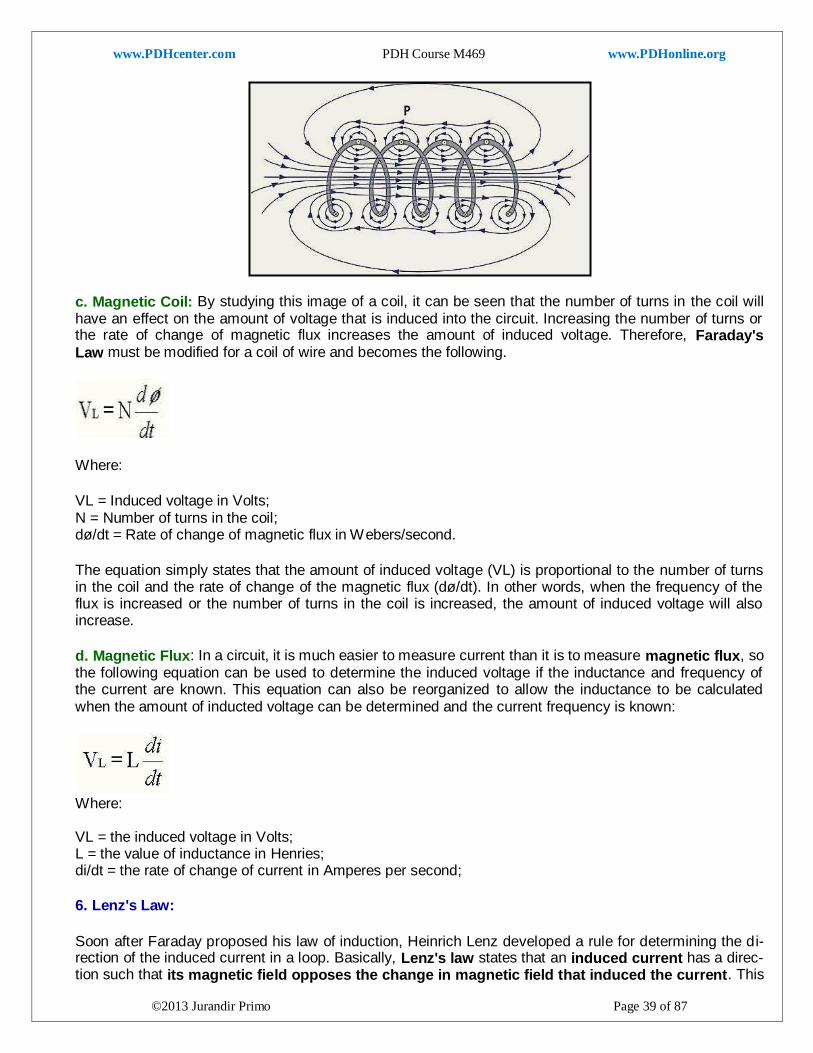
www.PDHcenter.com PDH Course M469 www.PDHonline.org
©2013 Jurandir Primo Page 39 of 87
c. Magnetic Coil: By studying this image of a coil, it can be seen that the number of turns in the coil will have an effect on the amount of voltage that is induced into the circuit. Increasing the number of turns or the rate of change of magnetic flux increases the amount of induced voltage. Therefore, Faraday's Law must be modified for a coil of wire and becomes the following.
Where:
VL = Induced voltage in Volts; N = Number of turns in the coil; dø/dt = Rate of change of magnetic flux in Webers/second.
The equation simply states that the amount of induced voltage (VL) is proportional to the number of turns in the coil and the rate of change of the magnetic flux (dø/dt). In other words, when the frequency of the flux is increased or the number of turns in the coil is increased, the amount of induced voltage will also increase.
d. Magnetic Flux: In a circuit, it is much easier to measure current than it is to measure magnetic flux, so the following equation can be used to determine the induced voltage if the inductance and frequency of the current are known. This equation can also be reorganized to allow the inductance to be calculated when the amount of inducted voltage can be determined and the current frequency is known:
Where: VL = the induced voltage in Volts; L = the value of inductance in Henries; di/dt = the rate of change of current in Amperes per second;
6. Lenz's Law:
Soon after Faraday proposed his law of induction, Heinrich Lenz developed a rule for determining the di-rection of the induced current in a loop. Basically, Lenz's law states that an induced current has a direc-tion such that its magnetic field opposes the change in magnetic field that induced the current. This
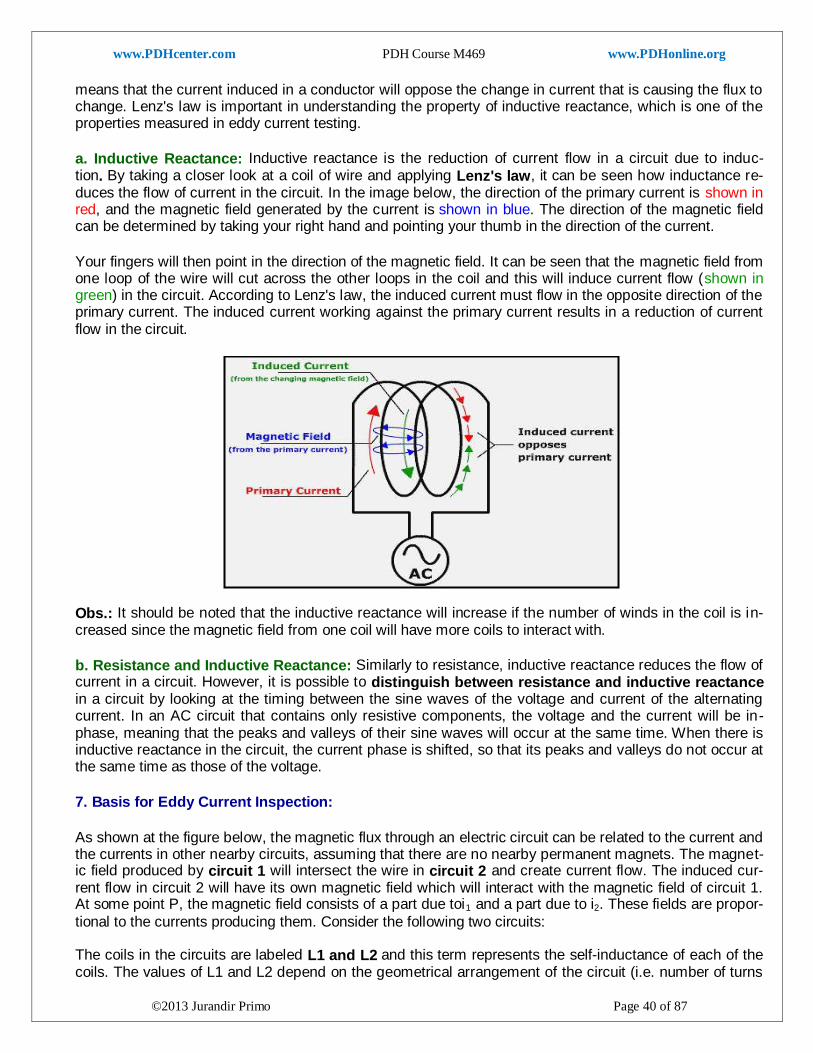
www.PDHcenter.com PDH Course M469 www.PDHonline.org
©2013 Jurandir Primo Page 40 of 87
means that the current induced in a conductor will oppose the change in current that is causing the flux to change. Lenz's law is important in understanding the property of inductive reactance, which is one of the properties measured in eddy current testing.
a. Inductive Reactance: Inductive reactance is the reduction of current flow in a circuit due to induc-tion. By taking a closer look at a coil of wire and applying Lenz's law, it can be seen how inductance re-duces the flow of current in the circuit. In the image below, the direction of the primary current is shown in red, and the magnetic field generated by the current is shown in blue. The direction of the magnetic field can be determined by taking your right hand and pointing your thumb in the direction of the current.
Your fingers will then point in the direction of the magnetic field. It can be seen that the magnetic field from one loop of the wire will cut across the other loops in the coil and this will induce current flow (shown in green) in the circuit. According to Lenz's law, the induced current must flow in the opposite direction of the primary current. The induced current working against the primary current results in a reduction of current flow in the circuit.
Obs.: It should be noted that the inductive reactance will increase if the number of winds in the coil is in-creased since the magnetic field from one coil will have more coils to interact with.
b. Resistance and Inductive Reactance: Similarly to resistance, inductive reactance reduces the flow of current in a circuit. However, it is possible to distinguish between resistance and inductive reactance in a circuit by looking at the timing between the sine waves of the voltage and current of the alternating current. In an AC circuit that contains only resistive components, the voltage and the current will be in-phase, meaning that the peaks and valleys of their sine waves will occur at the same time. When there is inductive reactance in the circuit, the current phase is shifted, so that its peaks and valleys do not occur at the same time as those of the voltage.
7. Basis for Eddy Current Inspection:
As shown at the figure below, the magnetic flux through an electric circuit can be related to the current and the currents in other nearby circuits, assuming that there are no nearby permanent magnets. The magnet-ic field produced by circuit 1 will intersect the wire in circuit 2 and create current flow. The induced cur-rent flow in circuit 2 will have its own magnetic field which will interact with the magnetic field of circuit 1. At some point P, the magnetic field consists of a part due toi1 and a part due to i2. These fields are propor-
tional to the currents producing them. Consider the following two circuits: The coils in the circuits are labeled L1 and L2 and this term represents the self-inductance of each of the coils. The values of L1 and L2 depend on the geometrical arrangement of the circuit (i.e. number of turns
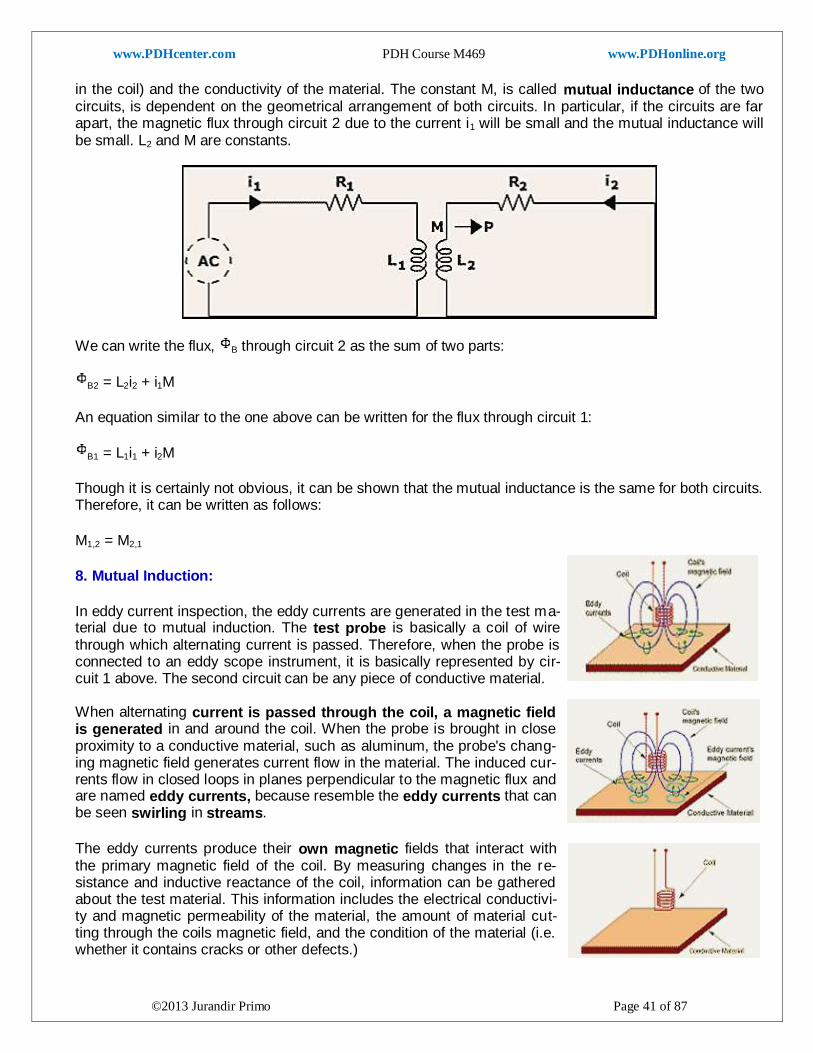
www.PDHcenter.com PDH Course M469 www.PDHonline.org
©2013 Jurandir Primo Page 41 of 87
in the coil) and the conductivity of the material. The constant M, is called mutual inductance of the two circuits, is dependent on the geometrical arrangement of both circuits. In particular, if the circuits are far apart, the magnetic flux through circuit 2 due to the current i1 will be small and the mutual inductance will be small. L2 and M are constants.
We can write the flux, B through circuit 2 as the sum of two parts:
B2 = L2i2 + i1M
An equation similar to the one above can be written for the flux through circuit 1:
B1 = L1i1 + i2M
Though it is certainly not obvious, it can be shown that the mutual inductance is the same for both circuits. Therefore, it can be written as follows:
M1,2 = M2,1
8. Mutual Induction:
In eddy current inspection, the eddy currents are generated in the test ma-terial due to mutual induction. The test probe is basically a coil of wire through which alternating current is passed. Therefore, when the probe is connected to an eddy scope instrument, it is basically represented by cir-cuit 1 above. The second circuit can be any piece of conductive material. When alternating current is passed through the coil, a magnetic field is generated in and around the coil. When the probe is brought in close proximity to a conductive material, such as aluminum, the probe's chang-ing magnetic field generates current flow in the material. The induced cur-rents flow in closed loops in planes perpendicular to the magnetic flux and are named eddy currents, because resemble the eddy currents that can be seen swirling in streams.
The eddy currents produce their own magnetic fields that interact with the primary magnetic field of the coil. By measuring changes in the re-sistance and inductive reactance of the coil, information can be gathered about the test material. This information includes the electrical conductivi-ty and magnetic permeability of the material, the amount of material cut-ting through the coils magnetic field, and the condition of the material (i.e. whether it contains cracks or other defects.)
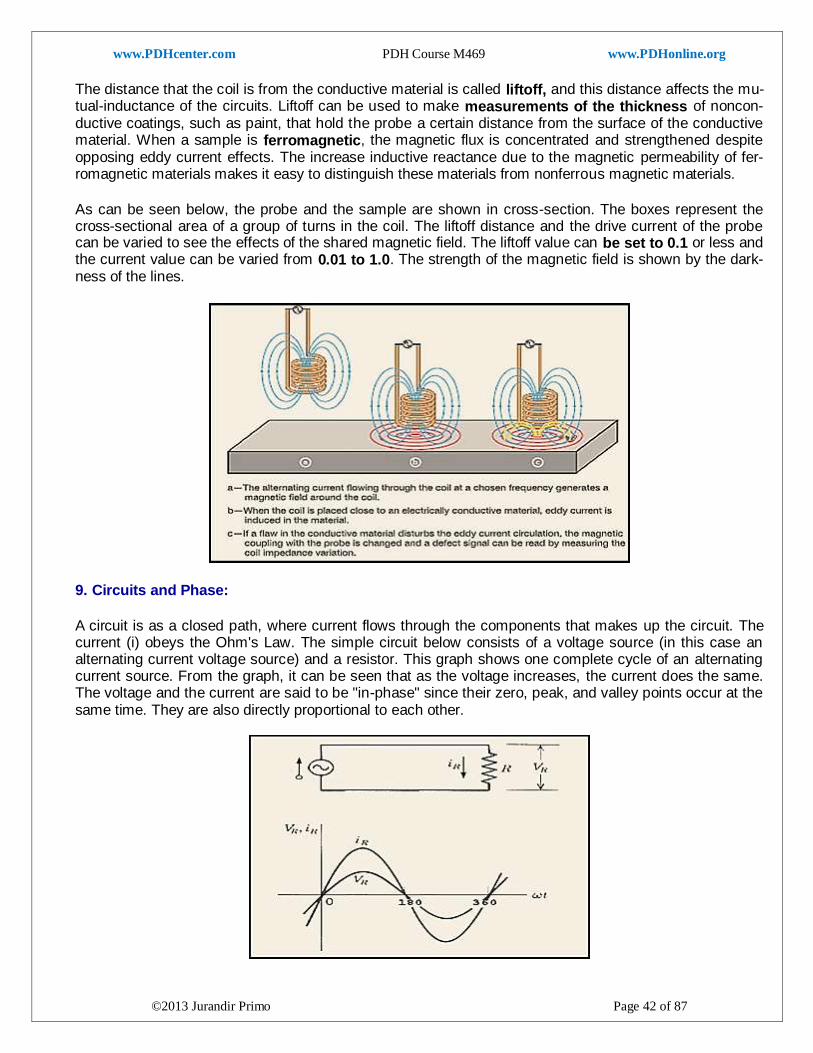
www.PDHcenter.com PDH Course M469 www.PDHonline.org
©2013 Jurandir Primo Page 42 of 87
The distance that the coil is from the conductive material is called liftoff, and this distance affects the mu-tual-inductance of the circuits. Liftoff can be used to make measurements of the thickness of noncon-ductive coatings, such as paint, that hold the probe a certain distance from the surface of the conductive material. When a sample is ferromagnetic, the magnetic flux is concentrated and strengthened despite opposing eddy current effects. The increase inductive reactance due to the magnetic permeability of fer-romagnetic materials makes it easy to distinguish these materials from nonferrous magnetic materials.
As can be seen below, the probe and the sample are shown in cross-section. The boxes represent the cross-sectional area of a group of turns in the coil. The liftoff distance and the drive current of the probe can be varied to see the effects of the shared magnetic field. The liftoff value can be set to 0.1 or less and the current value can be varied from 0.01 to 1.0. The strength of the magnetic field is shown by the dark-ness of the lines.
9. Circuits and Phase:
A circuit is as a closed path, where current flows through the components that makes up the circuit. The current (i) obeys the Ohm's Law. The simple circuit below consists of a voltage source (in this case an alternating current voltage source) and a resistor. This graph shows one complete cycle of an alternating current source. From the graph, it can be seen that as the voltage increases, the current does the same. The voltage and the current are said to be "in-phase" since their zero, peak, and valley points occur at the same time. They are also directly proportional to each other.
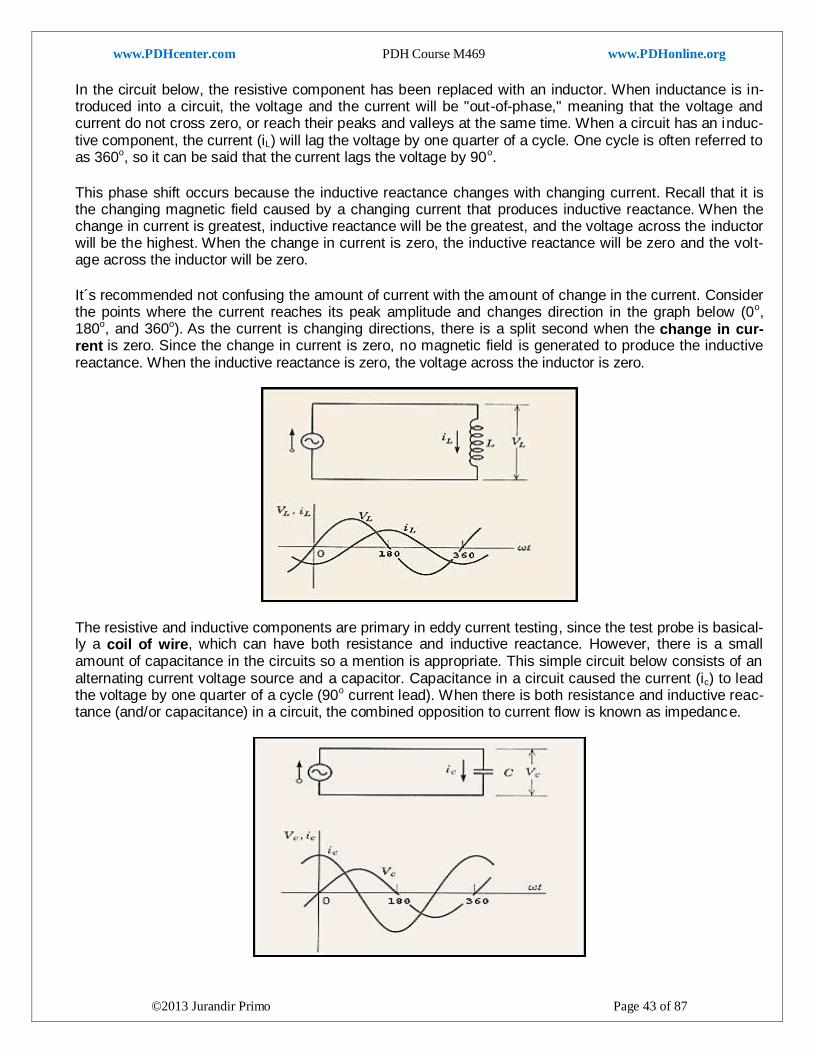
www.PDHcenter.com PDH Course M469 www.PDHonline.org
©2013 Jurandir Primo Page 43 of 87
In the circuit below, the resistive component has been replaced with an inductor. When inductance is in-troduced into a circuit, the voltage and the current will be "out-of-phase," meaning that the voltage and current do not cross zero, or reach their peaks and valleys at the same time. When a circuit has an induc-tive component, the current (iL) will lag the voltage by one quarter of a cycle. One cycle is often referred to as 360o, so it can be said that the current lags the voltage by 90o.
This phase shift occurs because the inductive reactance changes with changing current. Recall that it is the changing magnetic field caused by a changing current that produces inductive reactance. When the change in current is greatest, inductive reactance will be the greatest, and the voltage across the inductor will be the highest. When the change in current is zero, the inductive reactance will be zero and the volt-age across the inductor will be zero.
It´s recommended not confusing the amount of current with the amount of change in the current. Consider the points where the current reaches its peak amplitude and changes direction in the graph below (0o, 180o, and 360o). As the current is changing directions, there is a split second when the change in cur-rent is zero. Since the change in current is zero, no magnetic field is generated to produce the inductive reactance. When the inductive reactance is zero, the voltage across the inductor is zero.
The resistive and inductive components are primary in eddy current testing, since the test probe is basical-ly a coil of wire, which can have both resistance and inductive reactance. However, there is a small amount of capacitance in the circuits so a mention is appropriate. This simple circuit below consists of an alternating current voltage source and a capacitor. Capacitance in a circuit caused the current (ic) to lead the voltage by one quarter of a cycle (90o current lead). When there is both resistance and inductive reac-tance (and/or capacitance) in a circuit, the combined opposition to current flow is known as impedance.
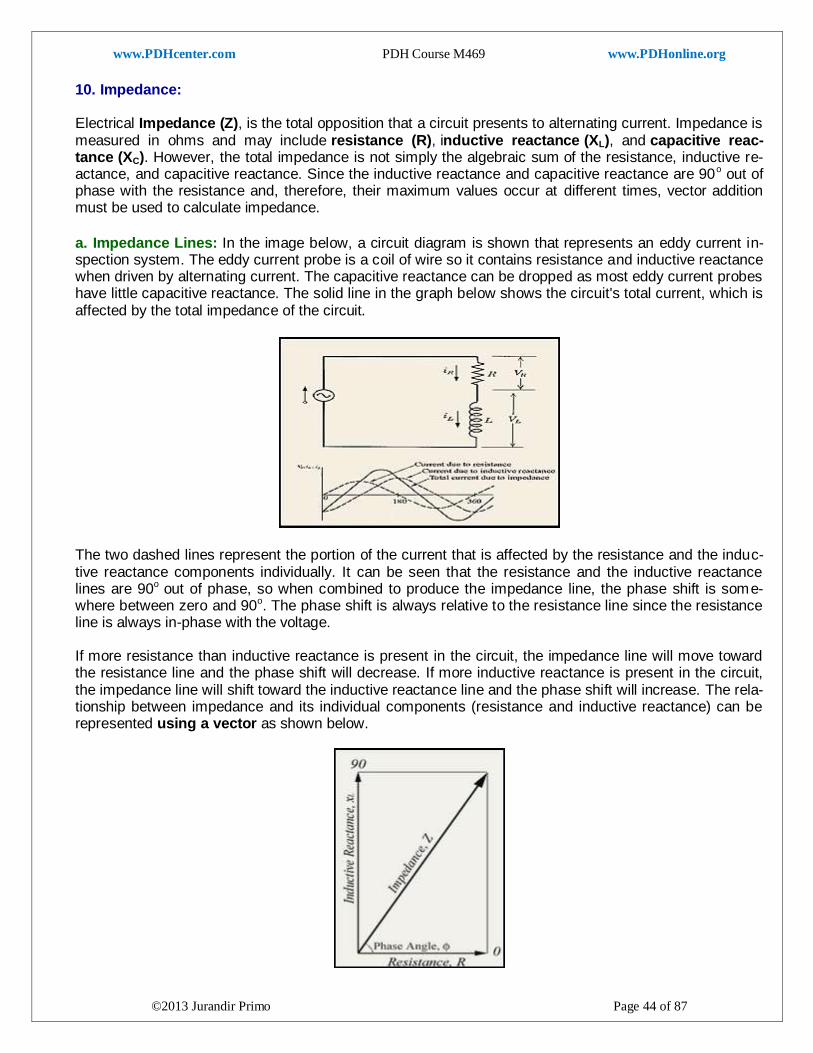
www.PDHcenter.com PDH Course M469 www.PDHonline.org
©2013 Jurandir Primo Page 44 of 87
10. Impedance: Electrical Impedance (Z), is the total opposition that a circuit presents to alternating current. Impedance is measured in ohms and may include resistance (R), inductive reactance (XL), and capacitive reac-tance (XC). However, the total impedance is not simply the algebraic sum of the resistance, inductive re-actance, and capacitive reactance. Since the inductive reactance and capacitive reactance are 90o out of phase with the resistance and, therefore, their maximum values occur at different times, vector addition must be used to calculate impedance.
a. Impedance Lines: In the image below, a circuit diagram is shown that represents an eddy current in-spection system. The eddy current probe is a coil of wire so it contains resistance and inductive reactance when driven by alternating current. The capacitive reactance can be dropped as most eddy current probes have little capacitive reactance. The solid line in the graph below shows the circuit's total current, which is affected by the total impedance of the circuit.
The two dashed lines represent the portion of the current that is affected by the resistance and the induc-tive reactance components individually. It can be seen that the resistance and the inductive reactance lines are 90o out of phase, so when combined to produce the impedance line, the phase shift is some-where between zero and 90o. The phase shift is always relative to the resistance line since the resistance line is always in-phase with the voltage. If more resistance than inductive reactance is present in the circuit, the impedance line will move toward the resistance line and the phase shift will decrease. If more inductive reactance is present in the circuit, the impedance line will shift toward the inductive reactance line and the phase shift will increase. The rela-tionship between impedance and its individual components (resistance and inductive reactance) can be represented using a vector as shown below.
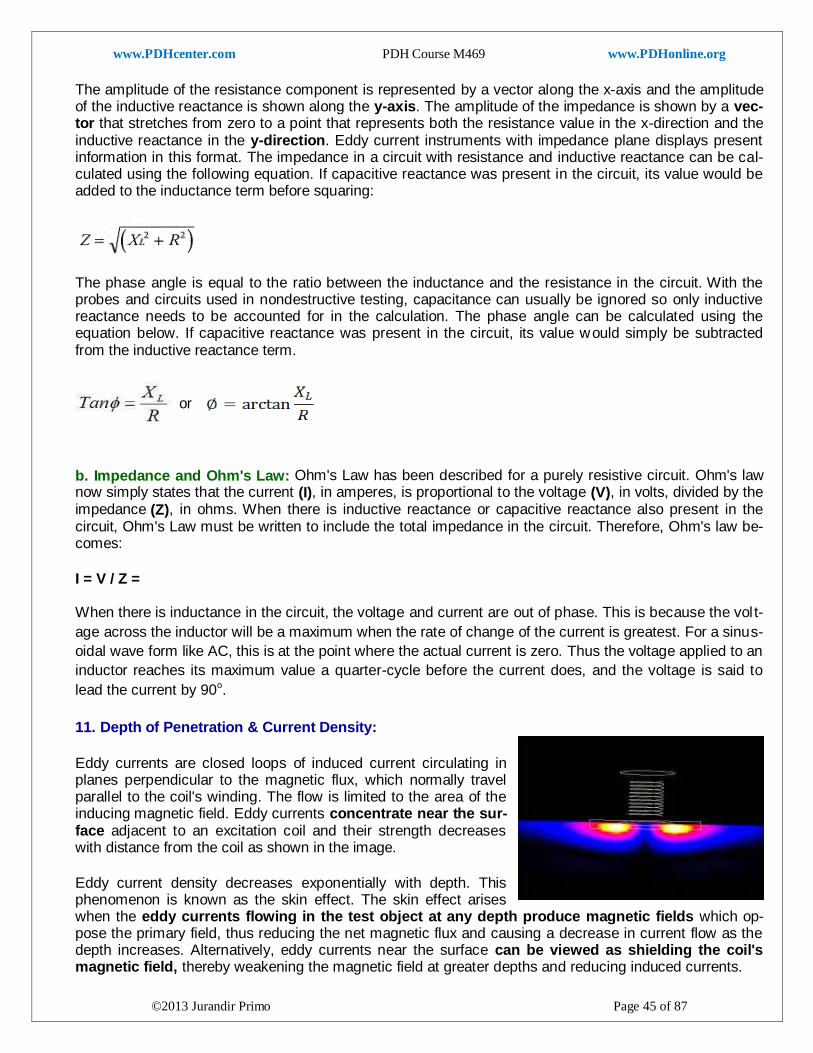
www.PDHcenter.com PDH Course M469 www.PDHonline.org
©2013 Jurandir Primo Page 45 of 87
The amplitude of the resistance component is represented by a vector along the x-axis and the amplitude of the inductive reactance is shown along the y-axis. The amplitude of the impedance is shown by a vec-tor that stretches from zero to a point that represents both the resistance value in the x-direction and the inductive reactance in the y-direction. Eddy current instruments with impedance plane displays present information in this format. The impedance in a circuit with resistance and inductive reactance can be cal-culated using the following equation. If capacitive reactance was present in the circuit, its value would be added to the inductance term before squaring:
The phase angle is equal to the ratio between the inductance and the resistance in the circuit. With the probes and circuits used in nondestructive testing, capacitance can usually be ignored so only inductive reactance needs to be accounted for in the calculation. The phase angle can be calculated using the equation below. If capacitive reactance was present in the circuit, its value would simply be subtracted from the inductive reactance term.
or
b. Impedance and Ohm's Law: Ohm's Law has been described for a purely resistive circuit. Ohm's law now simply states that the current (I), in amperes, is proportional to the voltage (V), in volts, divided by the impedance (Z), in ohms. When there is inductive reactance or capacitive reactance also present in the circuit, Ohm's Law must be written to include the total impedance in the circuit. Therefore, Ohm's law be-comes:
I = V / Z = When there is inductance in the circuit, the voltage and current are out of phase. This is because the vol t-
age across the inductor will be a maximum when the rate of change of the current is greatest. For a sinus-
oidal wave form like AC, this is at the point where the actual current is zero. Thus the voltage applied to an
inductor reaches its maximum value a quarter-cycle before the current does, and the voltage is said to
lead the current by 90o.
11. Depth of Penetration & Current Density:
Eddy currents are closed loops of induced current circulating in planes perpendicular to the magnetic flux, which normally travel parallel to the coil's winding. The flow is limited to the area of the inducing magnetic field. Eddy currents concentrate near the sur-face adjacent to an excitation coil and their strength decreases with distance from the coil as shown in the image.
Eddy current density decreases exponentially with depth. This phenomenon is known as the skin effect. The skin effect arises when the eddy currents flowing in the test object at any depth produce magnetic fields which op-pose the primary field, thus reducing the net magnetic flux and causing a decrease in current flow as the depth increases. Alternatively, eddy currents near the surface can be viewed as shielding the coil's magnetic field, thereby weakening the magnetic field at greater depths and reducing induced currents.
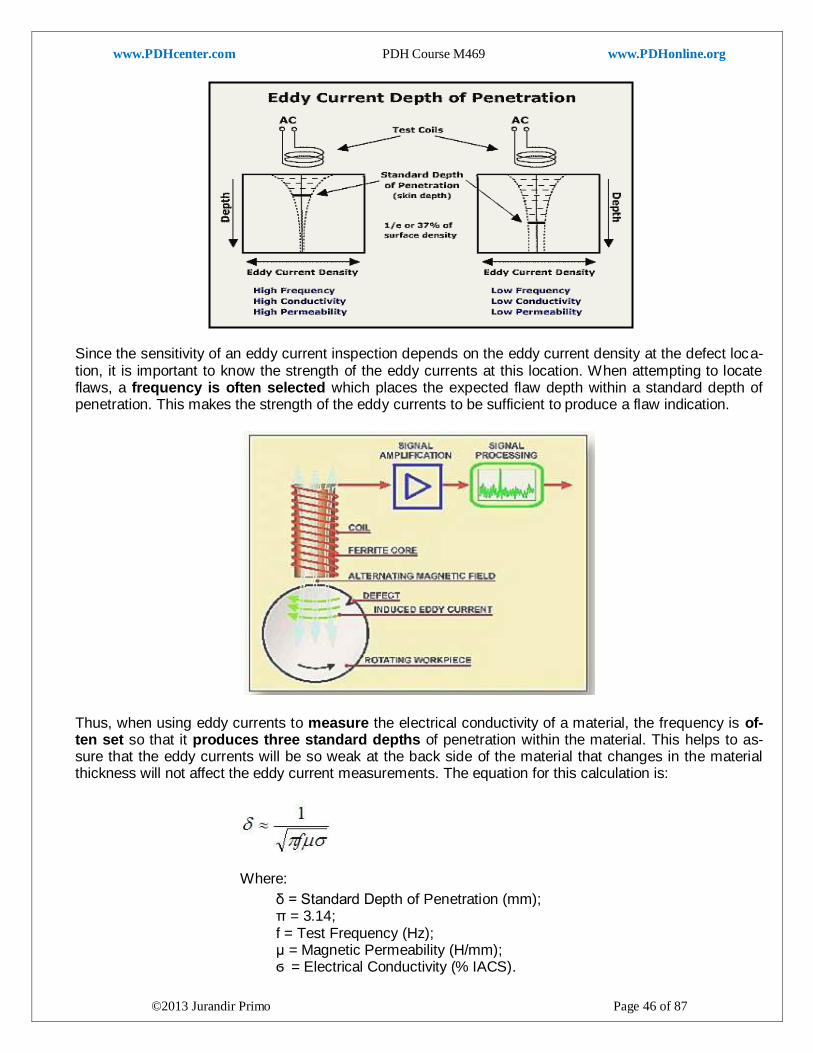
www.PDHcenter.com PDH Course M469 www.PDHonline.org
©2013 Jurandir Primo Page 46 of 87
Since the sensitivity of an eddy current inspection depends on the eddy current density at the defect loca-tion, it is important to know the strength of the eddy currents at this location. When attempting to locate flaws, a frequency is often selected which places the expected flaw depth within a standard depth of penetration. This makes the strength of the eddy currents to be sufficient to produce a flaw indication.
Thus, when using eddy currents to measure the electrical conductivity of a material, the frequency is of-ten set so that it produces three standard depths of penetration within the material. This helps to as-sure that the eddy currents will be so weak at the back side of the material that changes in the material thickness will not affect the eddy current measurements. The equation for this calculation is:
Where:
δ = Standard Depth of Penetration (mm); π = 3.14; f = Test Frequency (Hz); μ = Magnetic Permeability (H/mm); ϭ = Electrical Conductivity (% IACS).
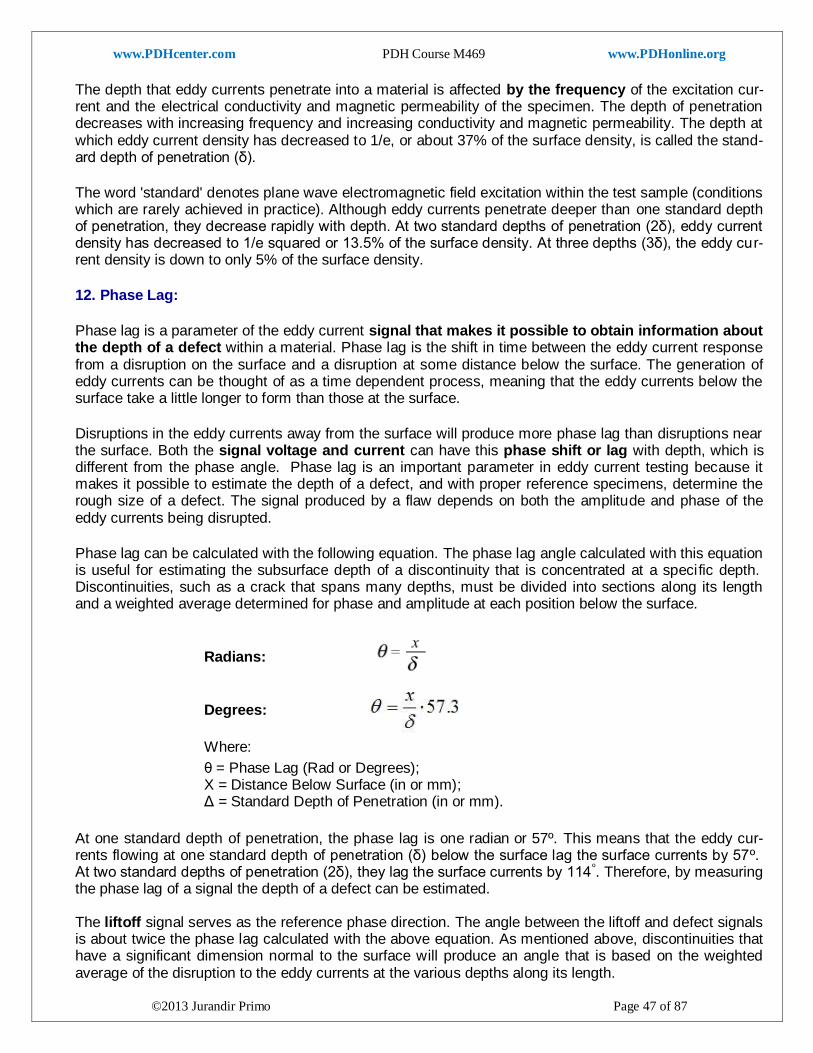
www.PDHcenter.com PDH Course M469 www.PDHonline.org
©2013 Jurandir Primo Page 47 of 87
The depth that eddy currents penetrate into a material is affected by the frequency of the excitation cur-rent and the electrical conductivity and magnetic permeability of the specimen. The depth of penetration decreases with increasing frequency and increasing conductivity and magnetic permeability. The depth at which eddy current density has decreased to 1/e, or about 37% of the surface density, is called the stand-ard depth of penetration (δ).
The word 'standard' denotes plane wave electromagnetic field excitation within the test sample (conditions which are rarely achieved in practice). Although eddy currents penetrate deeper than one standard depth of penetration, they decrease rapidly with depth. At two standard depths of penetration (2δ), eddy current density has decreased to 1/e squared or 13.5% of the surface density. At three depths (3δ), the eddy cur-rent density is down to only 5% of the surface density.
12. Phase Lag:
Phase lag is a parameter of the eddy current signal that makes it possible to obtain information about the depth of a defect within a material. Phase lag is the shift in time between the eddy current response from a disruption on the surface and a disruption at some distance below the surface. The generation of eddy currents can be thought of as a time dependent process, meaning that the eddy currents below the surface take a little longer to form than those at the surface.
Disruptions in the eddy currents away from the surface will produce more phase lag than disruptions near the surface. Both the signal voltage and current can have this phase shift or lag with depth, which is different from the phase angle. Phase lag is an important parameter in eddy current testing because it makes it possible to estimate the depth of a defect, and with proper reference specimens, determine the rough size of a defect. The signal produced by a flaw depends on both the amplitude and phase of the eddy currents being disrupted.
Phase lag can be calculated with the following equation. The phase lag angle calculated with this equation is useful for estimating the subsurface depth of a discontinuity that is concentrated at a specific depth. Discontinuities, such as a crack that spans many depths, must be divided into sections along its length and a weighted average determined for phase and amplitude at each position below the surface.
Radians:
Degrees:
Where:
θ = Phase Lag (Rad or Degrees); X = Distance Below Surface (in or mm); Δ = Standard Depth of Penetration (in or mm).
At one standard depth of penetration, the phase lag is one radian or 57º. This means that the eddy cur-rents flowing at one standard depth of penetration (δ) below the surface lag the surface currents by 57º. At two standard depths of penetration (2δ), they lag the surface currents by 114º. Therefore, by measuring the phase lag of a signal the depth of a defect can be estimated. The liftoff signal serves as the reference phase direction. The angle between the liftoff and defect signals is about twice the phase lag calculated with the above equation. As mentioned above, discontinuities that have a significant dimension normal to the surface will produce an angle that is based on the weighted average of the disruption to the eddy currents at the various depths along its length.
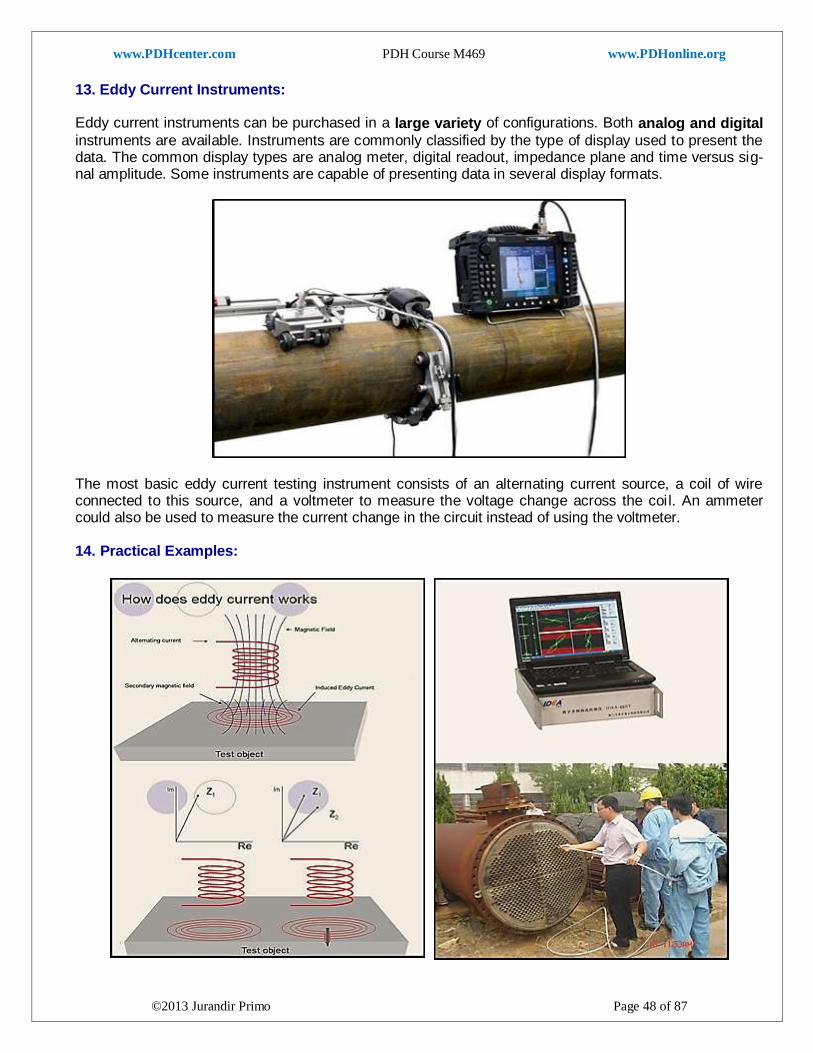
www.PDHcenter.com PDH Course M469 www.PDHonline.org
©2013 Jurandir Primo Page 48 of 87
13. Eddy Current Instruments: Eddy current instruments can be purchased in a large variety of configurations. Both analog and digital
instruments are available. Instruments are commonly classified by the type of display used to present the data. The common display types are analog meter, digital readout, impedance plane and time versus sig-nal amplitude. Some instruments are capable of presenting data in several display formats.
The most basic eddy current testing instrument consists of an alternating current source, a coil of wire connected to this source, and a voltmeter to measure the voltage change across the coil. An ammeter could also be used to measure the current change in the circuit instead of using the voltmeter. 14. Practical Examples:

www.PDHcenter.com PDH Course M469 www.PDHonline.org
©2013 Jurandir Primo Page 49 of 87
Dual Frequency Eddy Current to inspect for cracks in Boeing 737
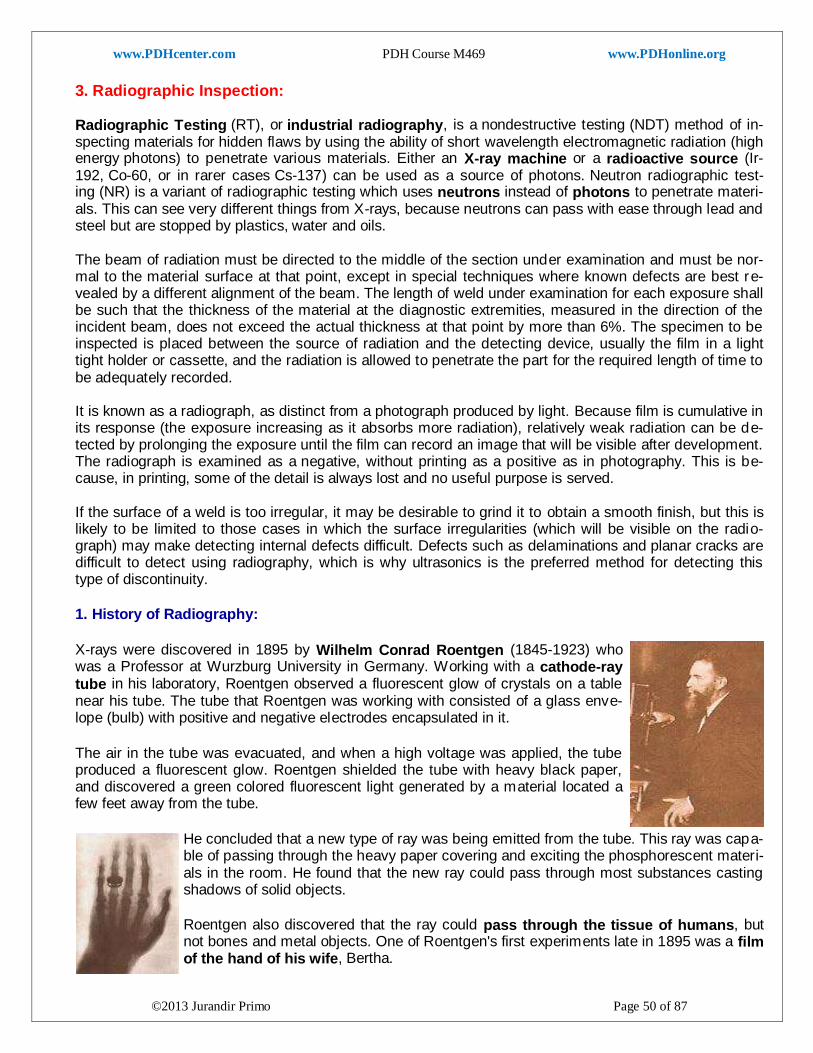
www.PDHcenter.com PDH Course M469 www.PDHonline.org
©2013 Jurandir Primo Page 50 of 87
3. Radiographic Inspection: Radiographic Testing (RT), or industrial radiography, is a nondestructive testing (NDT) method of in-specting materials for hidden flaws by using the ability of short wavelength electromagnetic radiation (high energy photons) to penetrate various materials. Either an X-ray machine or a radioactive source (Ir-192, Co-60, or in rarer cases Cs-137) can be used as a source of photons. Neutron radiographic test-ing (NR) is a variant of radiographic testing which uses neutrons instead of photons to penetrate materi-als. This can see very different things from X-rays, because neutrons can pass with ease through lead and steel but are stopped by plastics, water and oils. The beam of radiation must be directed to the middle of the section under examination and must be nor-mal to the material surface at that point, except in special techniques where known defects are best re-vealed by a different alignment of the beam. The length of weld under examination for each exposure shall be such that the thickness of the material at the diagnostic extremities, measured in the direction of the incident beam, does not exceed the actual thickness at that point by more than 6%. The specimen to be inspected is placed between the source of radiation and the detecting device, usually the film in a light tight holder or cassette, and the radiation is allowed to penetrate the part for the required length of time to be adequately recorded. It is known as a radiograph, as distinct from a photograph produced by light. Because film is cumulative in its response (the exposure increasing as it absorbs more radiation), relatively weak radiation can be de-tected by prolonging the exposure until the film can record an image that will be visible after development. The radiograph is examined as a negative, without printing as a positive as in photography. This is be-cause, in printing, some of the detail is always lost and no useful purpose is served. If the surface of a weld is too irregular, it may be desirable to grind it to obtain a smooth finish, but this is likely to be limited to those cases in which the surface irregularities (which will be visible on the radio-graph) may make detecting internal defects difficult. Defects such as delaminations and planar cracks are difficult to detect using radiography, which is why ultrasonics is the preferred method for detecting this type of discontinuity.
1. History of Radiography:
X-rays were discovered in 1895 by Wilhelm Conrad Roentgen (1845-1923) who was a Professor at Wurzburg University in Germany. Working with a cathode-ray tube in his laboratory, Roentgen observed a fluorescent glow of crystals on a table near his tube. The tube that Roentgen was working with consisted of a glass enve-lope (bulb) with positive and negative electrodes encapsulated in it.
The air in the tube was evacuated, and when a high voltage was applied, the tube produced a fluorescent glow. Roentgen shielded the tube with heavy black paper, and discovered a green colored fluorescent light generated by a material located a few feet away from the tube.
He concluded that a new type of ray was being emitted from the tube. This ray was capa-ble of passing through the heavy paper covering and exciting the phosphorescent materi-als in the room. He found that the new ray could pass through most substances casting shadows of solid objects.
Roentgen also discovered that the ray could pass through the tissue of humans, but not bones and metal objects. One of Roentgen's first experiments late in 1895 was a film of the hand of his wife, Bertha.
www.PDHcenter.com PDH Course M469 www.PDHonline.org
©2013 Jurandir Primo Page 51 of 87
The first use of X-rays was for an industrial (not medical) application, as Roentgen produced a radiograph of a set of weights in a box to show his colleagues. Roentgen's discovery was a scientific bombshell, and was received with extraordinary interest by both scientist and laymen. Scientists everywhere could dupli-cate his experiment because the cathode tube was very well known during this period.
Many scientists dropped other lines of research to pursue the mysterious rays. Newspapers and maga-zines of the day provided the public with numerous stories, some true, others fanciful, about the properties of the newly discovered rays. This invisible ray with the ability to pass through solid matter, and, in con-junction with a photographic plate, provide a picture of bones and interior body parts. Scientific fancy was captured by the demonstration of a wavelength shorter than light. This generated new possibilities in phys-ics, and for investigating the structure of matter.
Much enthusiasm was generated about potential applications of rays as an aid in medicine and surgery. Within a month after the announcement of the discovery, several medical radiographs had been made in Europe and the United States, which were used by surgeons to guide them in their work. In June 1896, only 6 months after Roentgen announced his discovery, X-rays were being used by battlefield physi-cians to locate bullets in wounded soldiers.
Prior to 1912, X-rays were used little outside the realms of medicine and dentistry, though some X-ray pictures of metals were produced. The reason that X-rays were not used in industrial application before this date was because the X-ray tubes (the source of the X-rays) broke down under the voltages required to produce rays of satisfactory penetrating power for industrial purposes. However, that changed in 1913 when the high vacuum X-ray tubes designed by Coolidge became available. The high vacuum tubes were an intense and reliable X-ray source, operating at energies up to 100,000 volts.
In 1922, industrial radiography took another step with the advent of the 200,000-volt X-ray tube that al-lowed radiographs of thick steel parts to be produced in a reasonable amount of time. In 1931, General Electric Company developed 1,000,000 volt X-ray generators, providing an effective tool for industrial ra-diography. That same year, the American Society of Mechanical Engineers (ASME) permitted X-ray ap-proval of fusion welded pressure vessels that further opened the door to industrial acceptance and use.
2. Present State of Radiography:
In many ways, radiography has changed little from the early days of its use. We still capture a shadow image on film using similar procedures and processes technicians were using in the late 1800's. Today, however, we are able to generate images of higher quality and greater sensitivity through the use of high-er quality films with a larger variety of film grain sizes. Film processing has evolved to an automated state, producing more consistent film quality by removing manual processing variables. Electronics and comput-ers allow technicians to now capture images digitally.
The use of "filmless radiography" provides a means of capturing an image, digitally enhancing, send-ing the image anywhere in the world, and archiving an image that will not deteriorate with time. Technolog-ical advances have provided industry with smaller, lighter, and very portable equipment that produce high quality X-rays. The use of linear accelerators provide a means of generating extremely short wave-length, highly penetrating radiation, a concept dreamed of only a few short years ago.
There is no consensus for a definition distinguishing between X-rays and gamma rays. X-rays are emit-
ted by electrons, while gamma rays are emitted by the atomic nucleus. While the process has changed,
this technology has evolved allowing radiography to be widely used in numerous areas of industrial and medicine inspections. Radiography has seen expanded usage in industry to inspect not only welds and castings, but to radiographically inspect items, such as airbags and canned food products. Radiography has found use in metallurgical material identification and security systems at airports and other facilities.

www.PDHcenter.com PDH Course M469 www.PDHonline.org
©2013 Jurandir Primo Page 52 of 87
The gamma ray inspection has also changed considerably since the Curies' discovery of radium. Man-made isotopes of today are far stronger and offer the technician a wide range of energy levels and half-lives. The technician can select Co-60 which will effectively penetrate very thick materials, or select a low-er energy isotope, such as Tm-170, which can be used to inspect plastics and very thin or low density materials. Today gamma rays find wide application in industries such as petrochemical, casting, weld-ing, and aerospace.
3. Nature of Penetrating Radiation:
X-rays and gamma rays differ only in their source of origin. X-rays are produced by an x-ray genera-tor and gamma radiation is the product of radioactive atoms. They are both part of the electromagnet-ic spectrum. They are waveforms, as are light rays, microwaves, and radio waves. X-rays and gamma rays cannot been seen, felt, or heard. They possess no charge and no mass and, therefore, are not influ-enced by electrical and magnetic fields and will generally travel in straight lines. However, they can be diffracted (bent) in a manner similar to light.
Both X-rays and gamma rays can be characterized by frequency, wavelength, and velocity. However, they act somewhat like a particle at times in that they occur as small "packets" of energy and are referred to as "photons." Electromagnetic radiation has also been described in terms of a stream of photons (massless particles) each traveling in a wave-like pattern and moving at the speed of light.
Each photon contains a certain amount (or bundle) of energy, and all electromagnetic radiation consists of these photons. The only difference between the various types of electromagnetic radiation is the amount of energy found in the photons. Due to their short wavelength they have more energy to pass through mat-ter than do the other forms of energy in the electromagnetic spectrum. As they pass through matter, they are scattered and absorbed and the degree of penetration depends on the kind of matter and the energy of the rays.
a. Properties of X-Rays and Gamma Rays: Mainly cannot be detected by human senses and cannot be seen, heard, felt, etc. Both travel in straight lines at the speed of light, and:
Their paths cannot be changed by electrical or magnetic fields. They can be diffracted to a small degree at interfaces between two different materials. They pass through matter until they have a chance encounter with an atomic particle. Their degree of penetration depends on their energy and the matter they are traveling through. They have enough energy to ionize matter and can damage or destroy living cells.
b. Concepts of X-Radiation: X-rays are just like any other kind of electromagnetic radiation, which can be produced in parcels of energy called photons, just like the light. There are two different atomic pro-cesses that can produce X-ray photons. One is called Bremsstrahlung and is a German term meaning "braking radiation" and the other is called K-shell emission. They can both occur in the heavy atoms of tungsten. Tungsten is often the material chosen for the target or anode of the x-ray tube.
Both ways of making X-rays involve a change in the state of electrons. However, Bremsstrahlung is easier to understand using the classical idea that radiation is emitted when the velocity of the electron shot at the tungsten changes. The negatively charged electron slows down after swinging around the nucleus of a positively charged tungsten atom. This energy loss produces X-radiation. Electrons are scattered elastical-ly and inelastically by the positively charged nucleus.
The inelastically scattered electron loses energy, which appears as Bremsstrahlung. Elastically scattered electrons (which include backscattered electrons) are generally scattered through larger angles. In the interaction, many photons of different wavelengths are produced, but none of the photons have more en-
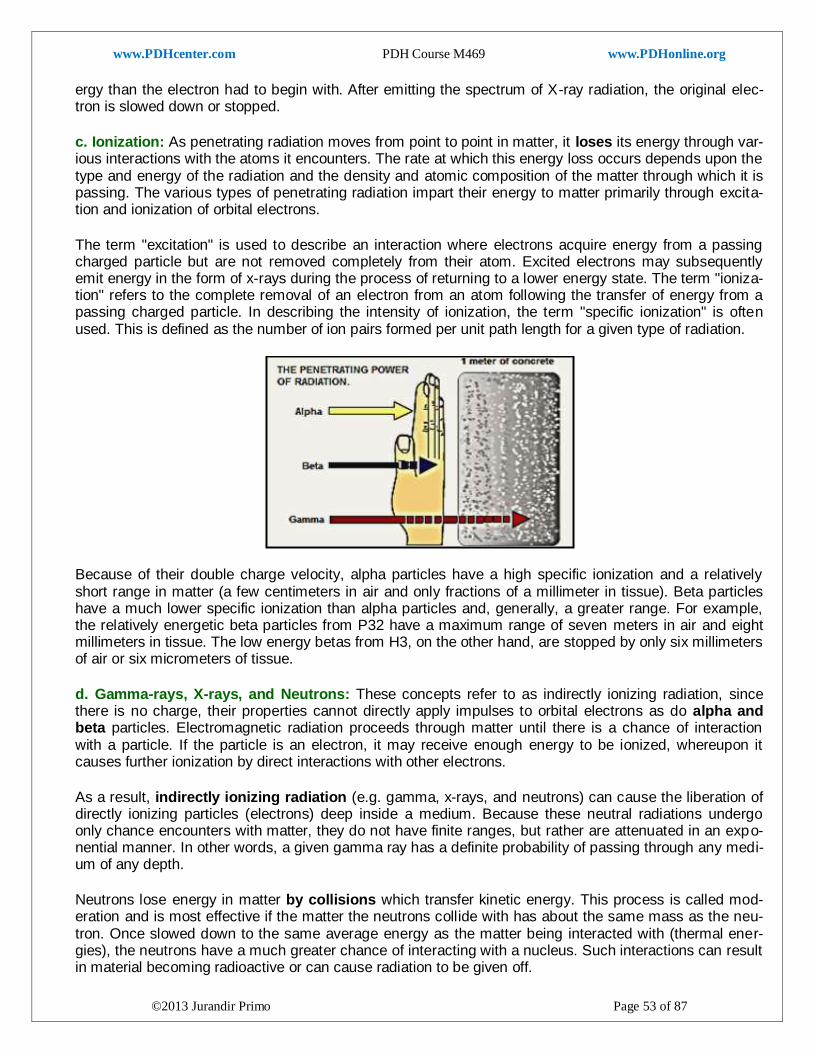
www.PDHcenter.com PDH Course M469 www.PDHonline.org
©2013 Jurandir Primo Page 53 of 87
ergy than the electron had to begin with. After emitting the spectrum of X-ray radiation, the original elec-tron is slowed down or stopped.
c. Ionization: As penetrating radiation moves from point to point in matter, it loses its energy through var-ious interactions with the atoms it encounters. The rate at which this energy loss occurs depends upon the type and energy of the radiation and the density and atomic composition of the matter through which it is passing. The various types of penetrating radiation impart their energy to matter primarily through excita-tion and ionization of orbital electrons.
The term "excitation" is used to describe an interaction where electrons acquire energy from a passing charged particle but are not removed completely from their atom. Excited electrons may subsequently emit energy in the form of x-rays during the process of returning to a lower energy state. The term "ioniza-tion" refers to the complete removal of an electron from an atom following the transfer of energy from a passing charged particle. In describing the intensity of ionization, the term "specific ionization" is often used. This is defined as the number of ion pairs formed per unit path length for a given type of radiation.
Because of their double charge velocity, alpha particles have a high specific ionization and a relatively short range in matter (a few centimeters in air and only fractions of a millimeter in tissue). Beta particles have a much lower specific ionization than alpha particles and, generally, a greater range. For example, the relatively energetic beta particles from P32 have a maximum range of seven meters in air and eight millimeters in tissue. The low energy betas from H3, on the other hand, are stopped by only six millimeters of air or six micrometers of tissue.
d. Gamma-rays, X-rays, and Neutrons: These concepts refer to as indirectly ionizing radiation, since there is no charge, their properties cannot directly apply impulses to orbital electrons as do alpha and beta particles. Electromagnetic radiation proceeds through matter until there is a chance of interaction with a particle. If the particle is an electron, it may receive enough energy to be ionized, whereupon it causes further ionization by direct interactions with other electrons.
As a result, indirectly ionizing radiation (e.g. gamma, x-rays, and neutrons) can cause the liberation of directly ionizing particles (electrons) deep inside a medium. Because these neutral radiations undergo only chance encounters with matter, they do not have finite ranges, but rather are attenuated in an expo-nential manner. In other words, a given gamma ray has a definite probability of passing through any medi-um of any depth.
Neutrons lose energy in matter by collisions which transfer kinetic energy. This process is called mod-eration and is most effective if the matter the neutrons collide with has about the same mass as the neu-tron. Once slowed down to the same average energy as the matter being interacted with (thermal ener-gies), the neutrons have a much greater chance of interacting with a nucleus. Such interactions can result in material becoming radioactive or can cause radiation to be given off.
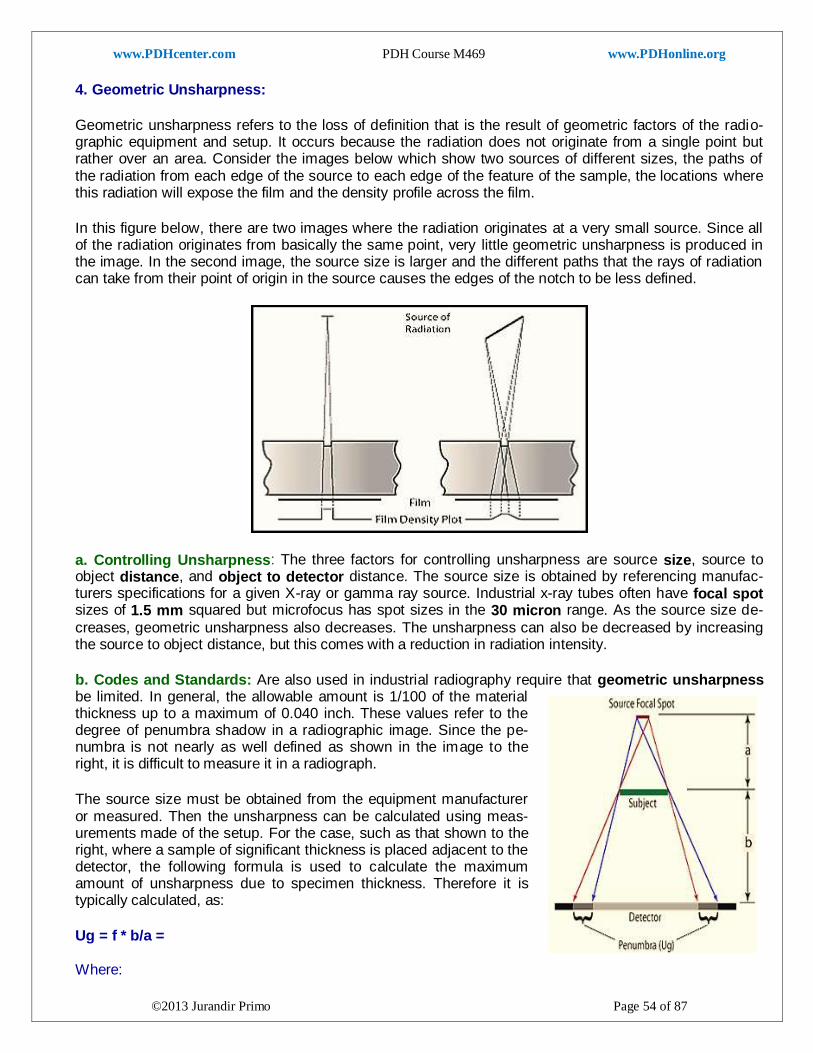
www.PDHcenter.com PDH Course M469 www.PDHonline.org
©2013 Jurandir Primo Page 54 of 87
4. Geometric Unsharpness:
Geometric unsharpness refers to the loss of definition that is the result of geometric factors of the radio-graphic equipment and setup. It occurs because the radiation does not originate from a single point but rather over an area. Consider the images below which show two sources of different sizes, the paths of the radiation from each edge of the source to each edge of the feature of the sample, the locations where this radiation will expose the film and the density profile across the film.
In this figure below, there are two images where the radiation originates at a very small source. Since all of the radiation originates from basically the same point, very little geometric unsharpness is produced in the image. In the second image, the source size is larger and the different paths that the rays of radiation can take from their point of origin in the source causes the edges of the notch to be less defined.
a. Controlling Unsharpness: The three factors for controlling unsharpness are source size, source to object distance, and object to detector distance. The source size is obtained by referencing manufac-turers specifications for a given X-ray or gamma ray source. Industrial x-ray tubes often have focal spot sizes of 1.5 mm squared but microfocus has spot sizes in the 30 micron range. As the source size de-
creases, geometric unsharpness also decreases. The unsharpness can also be decreased by increasing the source to object distance, but this comes with a reduction in radiation intensity.
b. Codes and Standards: Are also used in industrial radiography require that geometric unsharpness be limited. In general, the allowable amount is 1/100 of the material thickness up to a maximum of 0.040 inch. These values refer to the degree of penumbra shadow in a radiographic image. Since the pe-numbra is not nearly as well defined as shown in the image to the right, it is difficult to measure it in a radiograph.
The source size must be obtained from the equipment manufacturer or measured. Then the unsharpness can be calculated using meas-urements made of the setup. For the case, such as that shown to the right, where a sample of significant thickness is placed adjacent to the detector, the following formula is used to calculate the maximum amount of unsharpness due to specimen thickness. Therefore it is typically calculated, as:
Ug = f * b/a = Where:
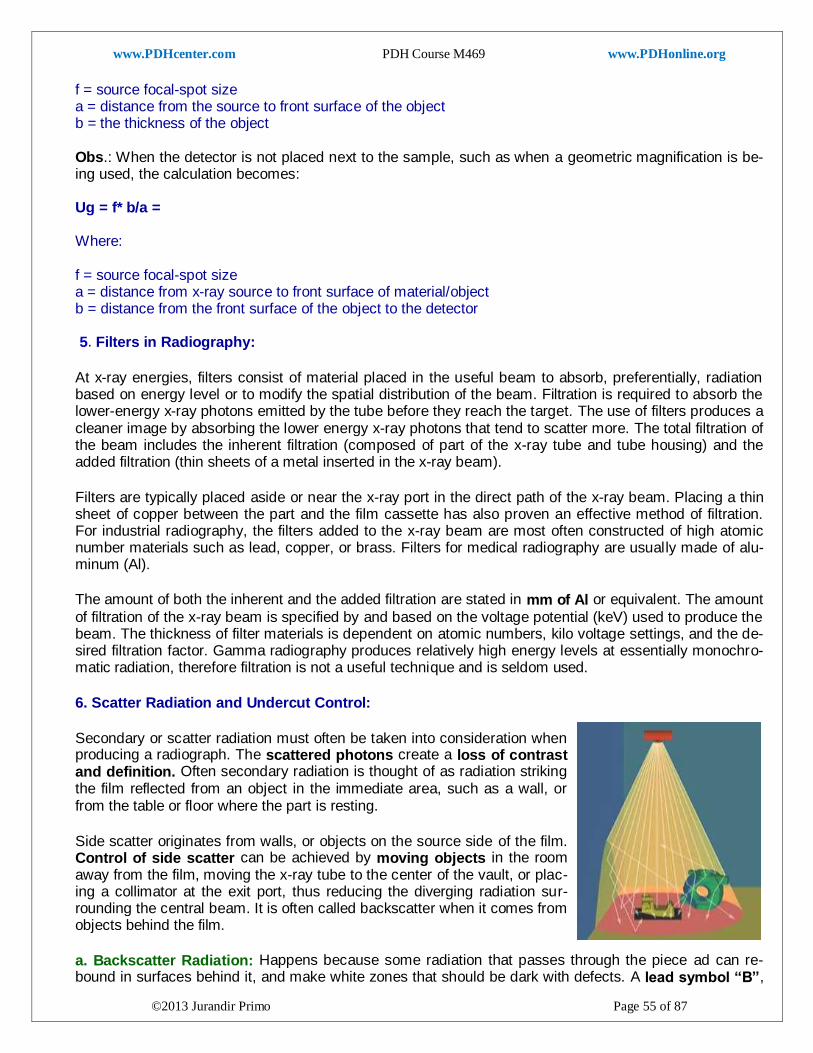
www.PDHcenter.com PDH Course M469 www.PDHonline.org
©2013 Jurandir Primo Page 55 of 87
f = source focal-spot size a = distance from the source to front surface of the object b = the thickness of the object Obs.: When the detector is not placed next to the sample, such as when a geometric magnification is be-ing used, the calculation becomes: Ug = f* b/a = Where: f = source focal-spot size a = distance from x-ray source to front surface of material/object b = distance from the front surface of the object to the detector 5. Filters in Radiography:
At x-ray energies, filters consist of material placed in the useful beam to absorb, preferentially, radiation based on energy level or to modify the spatial distribution of the beam. Filtration is required to absorb the lower-energy x-ray photons emitted by the tube before they reach the target. The use of filters produces a cleaner image by absorbing the lower energy x-ray photons that tend to scatter more. The total filtration of the beam includes the inherent filtration (composed of part of the x-ray tube and tube housing) and the added filtration (thin sheets of a metal inserted in the x-ray beam).
Filters are typically placed aside or near the x-ray port in the direct path of the x-ray beam. Placing a thin sheet of copper between the part and the film cassette has also proven an effective method of filtration. For industrial radiography, the filters added to the x-ray beam are most often constructed of high atomic number materials such as lead, copper, or brass. Filters for medical radiography are usually made of alu-minum (Al).
The amount of both the inherent and the added filtration are stated in mm of Al or equivalent. The amount
of filtration of the x-ray beam is specified by and based on the voltage potential (keV) used to produce the beam. The thickness of filter materials is dependent on atomic numbers, kilo voltage settings, and the de-sired filtration factor. Gamma radiography produces relatively high energy levels at essentially monochro-matic radiation, therefore filtration is not a useful technique and is seldom used.
6. Scatter Radiation and Undercut Control:
Secondary or scatter radiation must often be taken into consideration when producing a radiograph. The scattered photons create a loss of contrast and definition. Often secondary radiation is thought of as radiation striking the film reflected from an object in the immediate area, such as a wall, or from the table or floor where the part is resting.
Side scatter originates from walls, or objects on the source side of the film. Control of side scatter can be achieved by moving objects in the room away from the film, moving the x-ray tube to the center of the vault, or plac-ing a collimator at the exit port, thus reducing the diverging radiation sur-rounding the central beam. It is often called backscatter when it comes from objects behind the film.
a. Backscatter Radiation: Happens because some radiation that passes through the piece ad can re-bound in surfaces behind it, and make white zones that should be dark with defects. A lead symbol “B”,
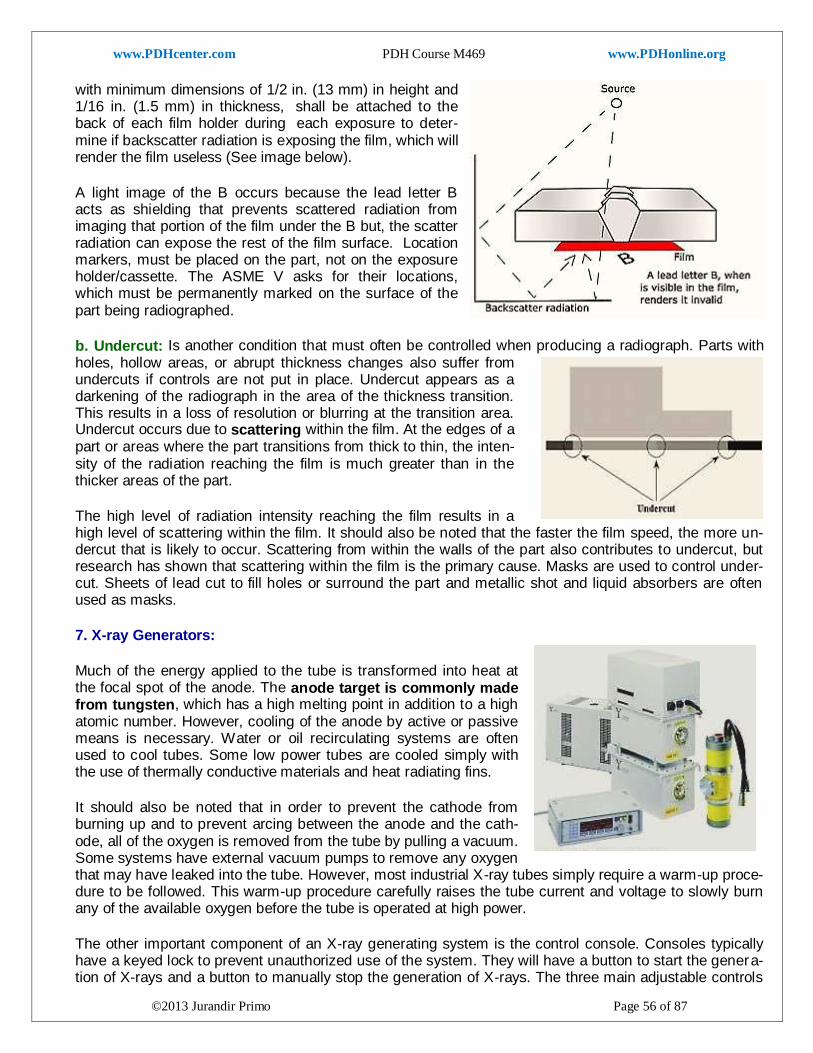
www.PDHcenter.com PDH Course M469 www.PDHonline.org
©2013 Jurandir Primo Page 56 of 87
with minimum dimensions of 1/2 in. (13 mm) in height and 1/16 in. (1.5 mm) in thickness, shall be attached to the back of each film holder during each exposure to deter-mine if backscatter radiation is exposing the film, which will render the film useless (See image below).
A light image of the B occurs because the lead letter B acts as shielding that prevents scattered radiation from imaging that portion of the film under the B but, the scatter radiation can expose the rest of the film surface. Location markers, must be placed on the part, not on the exposure holder/cassette. The ASME V asks for their locations, which must be permanently marked on the surface of the part being radiographed.
b. Undercut: Is another condition that must often be controlled when producing a radiograph. Parts with holes, hollow areas, or abrupt thickness changes also suffer from undercuts if controls are not put in place. Undercut appears as a darkening of the radiograph in the area of the thickness transition. This results in a loss of resolution or blurring at the transition area. Undercut occurs due to scattering within the film. At the edges of a part or areas where the part transitions from thick to thin, the inten-sity of the radiation reaching the film is much greater than in the thicker areas of the part.
The high level of radiation intensity reaching the film results in a high level of scattering within the film. It should also be noted that the faster the film speed, the more un-dercut that is likely to occur. Scattering from within the walls of the part also contributes to undercut, but research has shown that scattering within the film is the primary cause. Masks are used to control under-cut. Sheets of lead cut to fill holes or surround the part and metallic shot and liquid absorbers are often used as masks.
7. X-ray Generators:
Much of the energy applied to the tube is transformed into heat at the focal spot of the anode. The anode target is commonly made from tungsten, which has a high melting point in addition to a high atomic number. However, cooling of the anode by active or passive means is necessary. Water or oil recirculating systems are often used to cool tubes. Some low power tubes are cooled simply with the use of thermally conductive materials and heat radiating fins.
It should also be noted that in order to prevent the cathode from burning up and to prevent arcing between the anode and the cath-ode, all of the oxygen is removed from the tube by pulling a vacuum. Some systems have external vacuum pumps to remove any oxygen that may have leaked into the tube. However, most industrial X-ray tubes simply require a warm-up proce-dure to be followed. This warm-up procedure carefully raises the tube current and voltage to slowly burn any of the available oxygen before the tube is operated at high power.
The other important component of an X-ray generating system is the control console. Consoles typically have a keyed lock to prevent unauthorized use of the system. They will have a button to start the genera-tion of X-rays and a button to manually stop the generation of X-rays. The three main adjustable controls
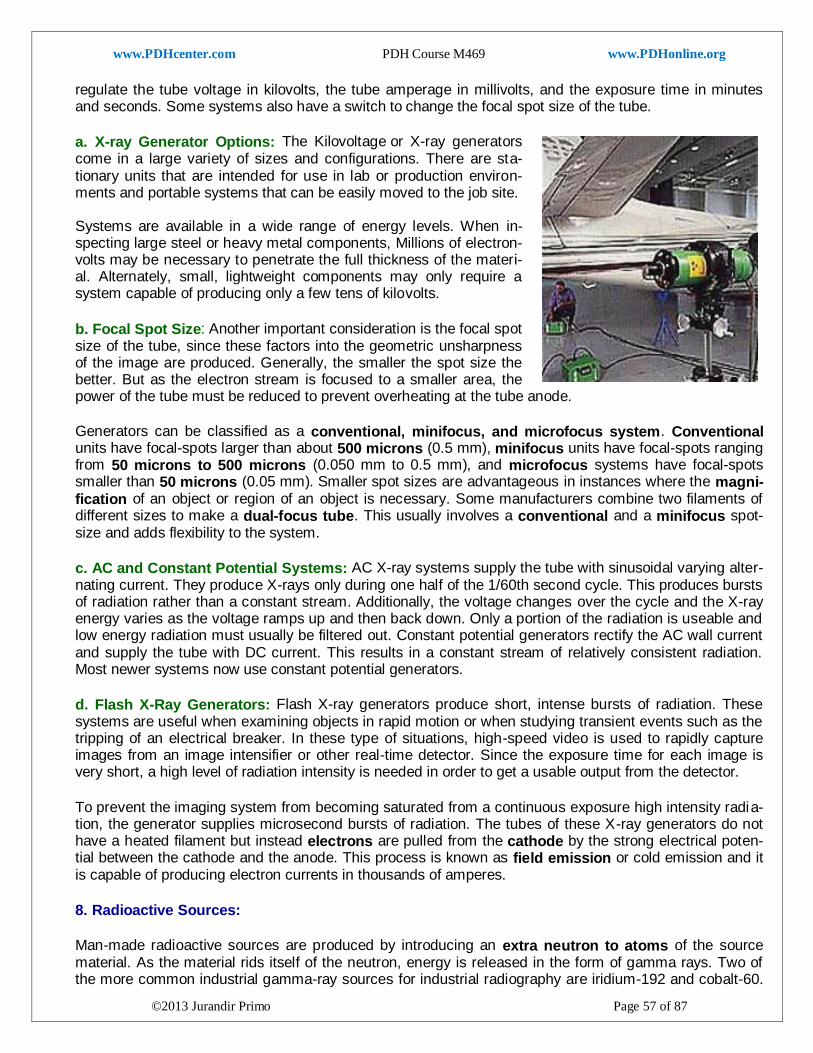
www.PDHcenter.com PDH Course M469 www.PDHonline.org
©2013 Jurandir Primo Page 57 of 87
regulate the tube voltage in kilovolts, the tube amperage in millivolts, and the exposure time in minutes and seconds. Some systems also have a switch to change the focal spot size of the tube.
a. X-ray Generator Options: The Kilovoltage or X-ray generators come in a large variety of sizes and configurations. There are sta-tionary units that are intended for use in lab or production environ-ments and portable systems that can be easily moved to the job site. Systems are available in a wide range of energy levels. When in-specting large steel or heavy metal components, Millions of electron-volts may be necessary to penetrate the full thickness of the materi-al. Alternately, small, lightweight components may only require a system capable of producing only a few tens of kilovolts.
b. Focal Spot Size: Another important consideration is the focal spot size of the tube, since these factors into the geometric unsharpness of the image are produced. Generally, the smaller the spot size the better. But as the electron stream is focused to a smaller area, the power of the tube must be reduced to prevent overheating at the tube anode.
Generators can be classified as a conventional, minifocus, and microfocus system. Conventional units have focal-spots larger than about 500 microns (0.5 mm), minifocus units have focal-spots ranging from 50 microns to 500 microns (0.050 mm to 0.5 mm), and microfocus systems have focal-spots smaller than 50 microns (0.05 mm). Smaller spot sizes are advantageous in instances where the magni-fication of an object or region of an object is necessary. Some manufacturers combine two filaments of different sizes to make a dual-focus tube. This usually involves a conventional and a minifocus spot-size and adds flexibility to the system.
c. AC and Constant Potential Systems: AC X-ray systems supply the tube with sinusoidal varying alter-nating current. They produce X-rays only during one half of the 1/60th second cycle. This produces bursts of radiation rather than a constant stream. Additionally, the voltage changes over the cycle and the X-ray energy varies as the voltage ramps up and then back down. Only a portion of the radiation is useable and low energy radiation must usually be filtered out. Constant potential generators rectify the AC wall current and supply the tube with DC current. This results in a constant stream of relatively consistent radiation. Most newer systems now use constant potential generators.
d. Flash X-Ray Generators: Flash X-ray generators produce short, intense bursts of radiation. These systems are useful when examining objects in rapid motion or when studying transient events such as the tripping of an electrical breaker. In these type of situations, high-speed video is used to rapidly capture images from an image intensifier or other real-time detector. Since the exposure time for each image is very short, a high level of radiation intensity is needed in order to get a usable output from the detector.
To prevent the imaging system from becoming saturated from a continuous exposure high intensity radia-tion, the generator supplies microsecond bursts of radiation. The tubes of these X-ray generators do not have a heated filament but instead electrons are pulled from the cathode by the strong electrical poten-tial between the cathode and the anode. This process is known as field emission or cold emission and it is capable of producing electron currents in thousands of amperes.
8. Radioactive Sources:
Man-made radioactive sources are produced by introducing an extra neutron to atoms of the source material. As the material rids itself of the neutron, energy is released in the form of gamma rays. Two of the more common industrial gamma-ray sources for industrial radiography are iridium-192 and cobalt-60.
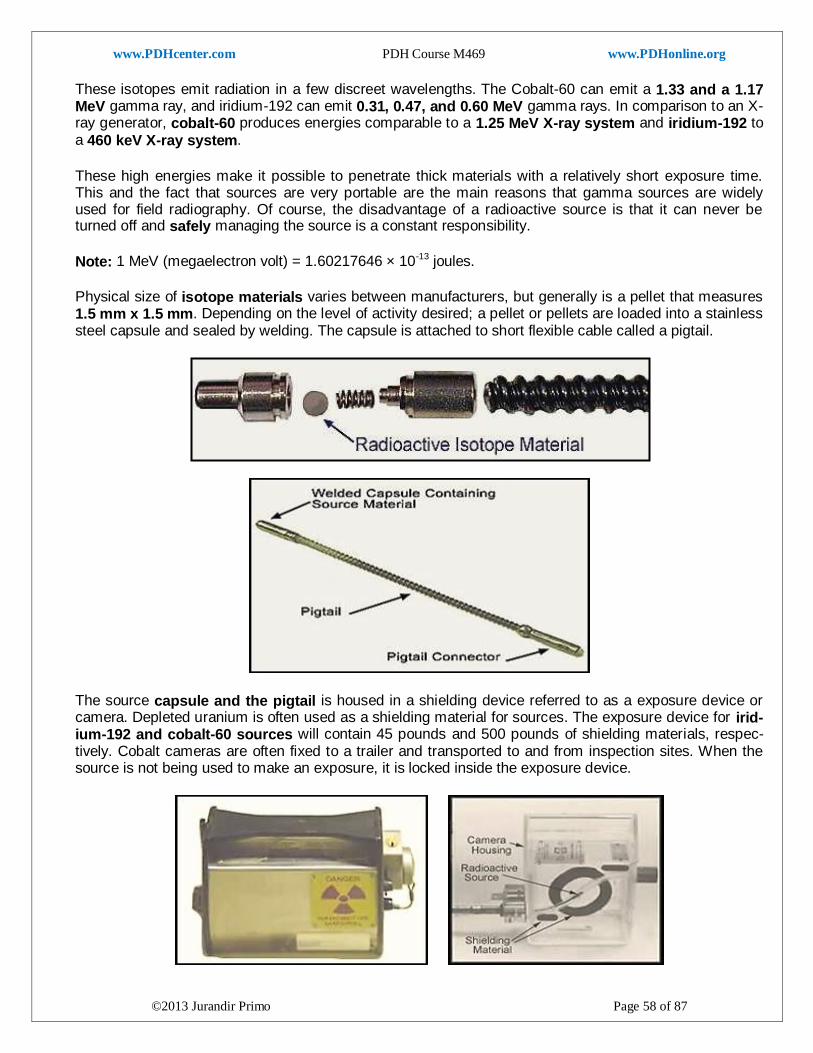
www.PDHcenter.com PDH Course M469 www.PDHonline.org
©2013 Jurandir Primo Page 58 of 87
These isotopes emit radiation in a few discreet wavelengths. The Cobalt-60 can emit a 1.33 and a 1.17 MeV gamma ray, and iridium-192 can emit 0.31, 0.47, and 0.60 MeV gamma rays. In comparison to an X-ray generator, cobalt-60 produces energies comparable to a 1.25 MeV X-ray system and iridium-192 to a 460 keV X-ray system.
These high energies make it possible to penetrate thick materials with a relatively short exposure time. This and the fact that sources are very portable are the main reasons that gamma sources are widely used for field radiography. Of course, the disadvantage of a radioactive source is that it can never be turned off and safely managing the source is a constant responsibility.
Note: 1 MeV (megaelectron volt) = 1.60217646 × 10⁻¹³ joules.
Physical size of isotope materials varies between manufacturers, but generally is a pellet that measures 1.5 mm x 1.5 mm. Depending on the level of activity desired; a pellet or pellets are loaded into a stainless steel capsule and sealed by welding. The capsule is attached to short flexible cable called a pigtail.
The source capsule and the pigtail is housed in a shielding device referred to as a exposure device or camera. Depleted uranium is often used as a shielding material for sources. The exposure device for irid-ium-192 and cobalt-60 sources will contain 45 pounds and 500 pounds of shielding materials, respec-tively. Cobalt cameras are often fixed to a trailer and transported to and from inspection sites. When the source is not being used to make an exposure, it is locked inside the exposure device.
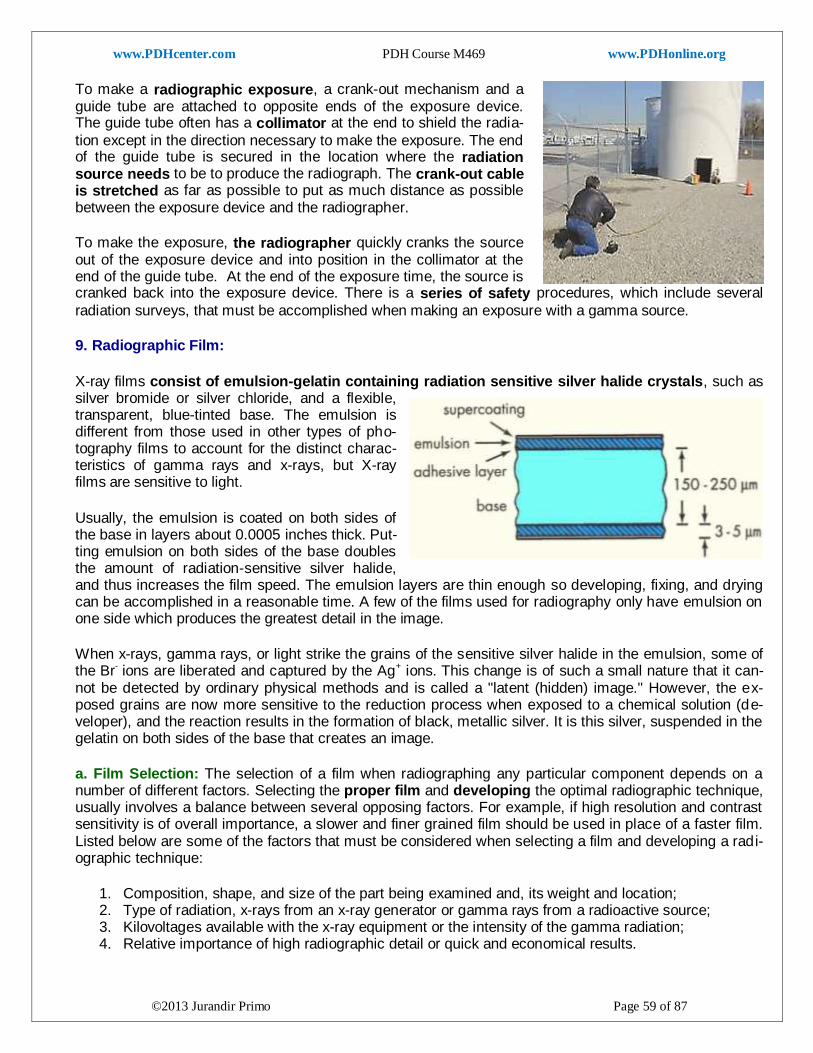
www.PDHcenter.com PDH Course M469 www.PDHonline.org
©2013 Jurandir Primo Page 59 of 87
To make a radiographic exposure, a crank-out mechanism and a guide tube are attached to opposite ends of the exposure device. The guide tube often has a collimator at the end to shield the radia-
tion except in the direction necessary to make the exposure. The end of the guide tube is secured in the location where the radiation source needs to be to produce the radiograph. The crank-out cable is stretched as far as possible to put as much distance as possible between the exposure device and the radiographer.
To make the exposure, the radiographer quickly cranks the source out of the exposure device and into position in the collimator at the end of the guide tube. At the end of the exposure time, the source is cranked back into the exposure device. There is a series of safety procedures, which include several
radiation surveys, that must be accomplished when making an exposure with a gamma source.
9. Radiographic Film:
X-ray films consist of emulsion-gelatin containing radiation sensitive silver halide crystals, such as silver bromide or silver chloride, and a flexible, transparent, blue-tinted base. The emulsion is different from those used in other types of pho-tography films to account for the distinct charac-teristics of gamma rays and x-rays, but X-ray films are sensitive to light.
Usually, the emulsion is coated on both sides of the base in layers about 0.0005 inches thick. Put-ting emulsion on both sides of the base doubles the amount of radiation-sensitive silver halide, and thus increases the film speed. The emulsion layers are thin enough so developing, fixing, and drying can be accomplished in a reasonable time. A few of the films used for radiography only have emulsion on one side which produces the greatest detail in the image.
When x-rays, gamma rays, or light strike the grains of the sensitive silver halide in the emulsion, some of the Br- ions are liberated and captured by the Ag+ ions. This change is of such a small nature that it can-not be detected by ordinary physical methods and is called a "latent (hidden) image." However, the ex-posed grains are now more sensitive to the reduction process when exposed to a chemical solution (de-veloper), and the reaction results in the formation of black, metallic silver. It is this silver, suspended in the gelatin on both sides of the base that creates an image.
a. Film Selection: The selection of a film when radiographing any particular component depends on a number of different factors. Selecting the proper film and developing the optimal radiographic technique, usually involves a balance between several opposing factors. For example, if high resolution and contrast sensitivity is of overall importance, a slower and finer grained film should be used in place of a faster film. Listed below are some of the factors that must be considered when selecting a film and developing a radi-ographic technique:
1. Composition, shape, and size of the part being examined and, its weight and location; 2. Type of radiation, x-rays from an x-ray generator or gamma rays from a radioactive source; 3. Kilovoltages available with the x-ray equipment or the intensity of the gamma radiation; 4. Relative importance of high radiographic detail or quick and economical results.

www.PDHcenter.com PDH Course M469 www.PDHonline.org
©2013 Jurandir Primo Page 60 of 87
b. Film Packaging: Radiographic films can be purchased in a num-ber of different packaging options. The most basic form is as individ-ual sheets in a box. For use, each sheet must be loaded into a cas-sette or film holder in the darkroom to protect it from exposure to light. The sheets are available in a variety of sizes and can be purchased with or without interleaving paper.
The interleaving paper is removed before the film is loaded into the film holder. Many users find the interleaving paper useful in separat-ing the sheets of film and offer some protection against scratches and dirt during handling. Industrial x-ray films are also available in a form in which each sheet is enclosed in a light-tight envelope. The film can be exposed from either side without removing it from the protective packaging. A rip strip makes it easy to remove the film in the darkroom for processing.
This form of packaging has the advantage of eliminating the process of loading the film holders in the darkroom. The film is completely protected from finger marks and dirt until the time the film is removed from the envelope for processing. Packaged film is also available in rolls, which allows the radiographer to cut the film to any length. The ends of the packaging are sealed with elec-trical tape in the darkroom. In applications such as the radiography of cir-cumferential welds and the examination of long joints on an aircraft fuse-lage, long lengths of film offer great economic advantage.
The film is wrapped around the outside of a structure and the radiation source is positioned on axis inside, allowing for examination of a large area with a single exposure. Envelope packaged film can be purchased with the film sandwiched between two lead oxide screens. The screens function to reduce scatter radiation at energy levels below 150keV and as intensifica-tion screens above 150 keV.
c. Film Handling: X-ray film should always be handled carefully to avoid physical strains, such as pres-sure, creasing, buckling, friction, etc. Whenever films are loaded in semi-flexible holders and external clamping devices are used, care should be taken to be sure pressure is uniform. If a film holder bears against a few high spots, such as on an un-ground weld, the pressure may be great enough to produce desensitized areas in the radiograph. This precaution is particularly important when using envelope-packed films.
Marks resulting from contact with fingers that are moist or contaminated with processing chemicals, as well as crimp marks, are avoided if large films are always grasped by the edges and allowed to hang free. A supply of clean towels should be kept close at hand as an incentive to dry the hands often and well. Use of envelope-packed films avoids many of these problems until the envelope is opened for processing. An-other important precaution is to avoid drawing film rapidly from cartons, exposure holders, or cassettes. Such care will help to eliminate circular or treelike black markings in the radiograph that sometimes result due to static electric discharges.
10. Exposure Vaults & Cabinets:
Exposure vaults and cabinets allow personnel to work safely in the area while exposures are taking place. Exposure vaults tend to be larger walk in rooms with shielding provided by high-density concrete block and lead. Exposure cabinets are often self-contained units with integrated x-ray equipment and are typi-cally shielded with steel and lead to absorb x-ray radiation. Exposure vaults and cabinets are equipped with protective interlocks that disable the system if anything interrupts the integrity of the enclosure. Addi-
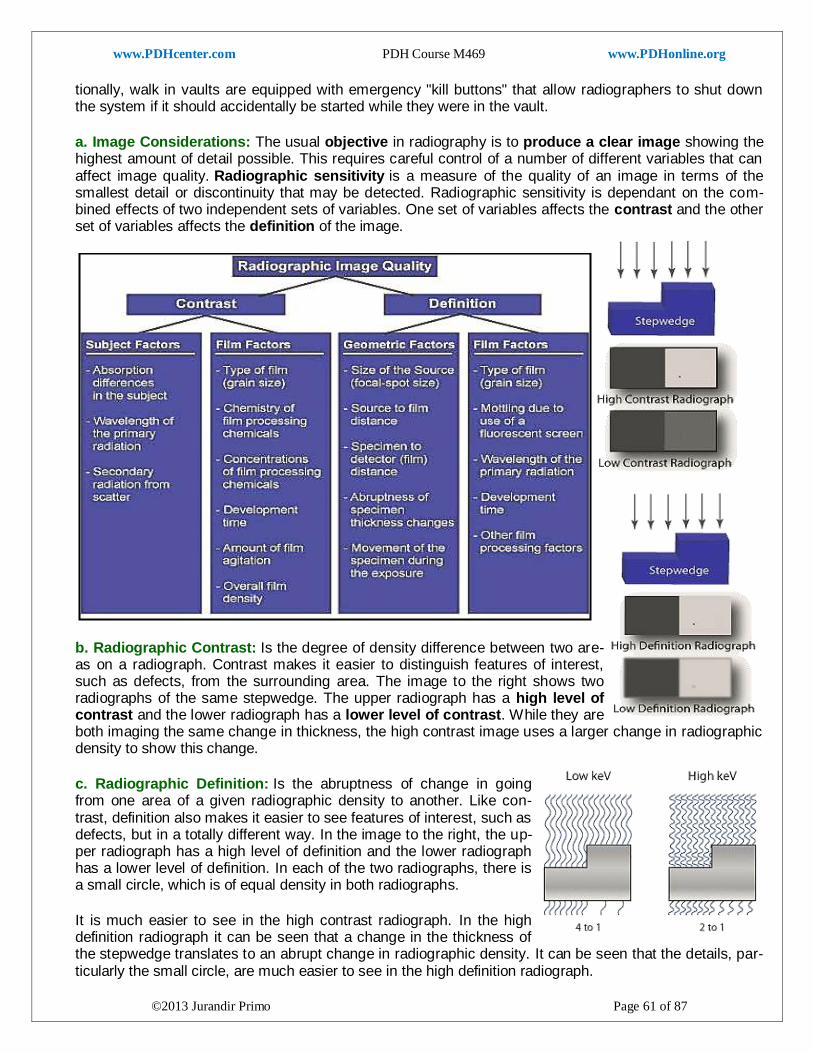
www.PDHcenter.com PDH Course M469 www.PDHonline.org
©2013 Jurandir Primo Page 61 of 87
tionally, walk in vaults are equipped with emergency "kill buttons" that allow radiographers to shut down the system if it should accidentally be started while they were in the vault.
a. Image Considerations: The usual objective in radiography is to produce a clear image showing the highest amount of detail possible. This requires careful control of a number of different variables that can affect image quality. Radiographic sensitivity is a measure of the quality of an image in terms of the smallest detail or discontinuity that may be detected. Radiographic sensitivity is dependant on the com-bined effects of two independent sets of variables. One set of variables affects the contrast and the other set of variables affects the definition of the image.
b. Radiographic Contrast: Is the degree of density difference between two are-as on a radiograph. Contrast makes it easier to distinguish features of interest, such as defects, from the surrounding area. The image to the right shows two radiographs of the same stepwedge. The upper radiograph has a high level of contrast and the lower radiograph has a lower level of contrast. While they are both imaging the same change in thickness, the high contrast image uses a larger change in radiographic density to show this change.
c. Radiographic Definition: Is the abruptness of change in going from one area of a given radiographic density to another. Like con-trast, definition also makes it easier to see features of interest, such as defects, but in a totally different way. In the image to the right, the up-per radiograph has a high level of definition and the lower radiograph has a lower level of definition. In each of the two radiographs, there is a small circle, which is of equal density in both radiographs.
It is much easier to see in the high contrast radiograph. In the high definition radiograph it can be seen that a change in the thickness of the stepwedge translates to an abrupt change in radiographic density. It can be seen that the details, par-ticularly the small circle, are much easier to see in the high definition radiograph.
www.PDHcenter.com PDH Course M469 www.PDHonline.org
©2013 Jurandir Primo Page 62 of 87
It can be said that the detail portrayed in the radiograph is equivalent to the physical change present in the stepwedge. In other words, a faithful visual reproduction of the stepwedge was produced. In the lower image, the radiographic setup did not produce a faithful visual reproduction. The edge line between the steps is blurred. Since radiographic contrast and definition are not dependent upon the same set of fac-tors, it is possible to produce radiographs with the following qualities:
Low contrast and poor definition; High contrast and poor definition; Low contrast and good definition; High contrast and good definition.
11. Film and Screen Factors:
The last set of factors concern the film and the use of fluorescent screens. A fine grain film is capable of producing an image with a higher level of definition than is a coarse grain film. Wavelength of the radiation will influence apparent graininess. As the wavelength shortens and penetration increases, the apparent graininess of the film will increase. Also, increased development of the film will increase the apparent graininess of the radiograph.
The use of fluorescent screens also results in lower definition. This occurs for a couple of different rea-sons. The reason that fluorescent screens are sometimes used is because incident radiation causes them to give off light that helps to expose the film. However, the light they produce spreads in all directions, ex-posing the film in adjacent areas, as well as in the areas which are in direct contact with the incident radia-tion. Fluorescent screens also produce screen mottle on radiographs. Screen mottle is associated with the statistical variation in the numbers of photons that interact with the screen from one area to the next.
12. Radiographic Density:
Radiographic density (AKA optical, photographic, or film density) is a measure of the degree of film dark-ening. Technically it should be called "transmitted density" when associated with transparent-base film since it is a measure of the light transmitted through the film. Radiographic density is the logarithm of two
measurements: the intensity of light incident on the film (I0) and the intensity of light transmitted
through the film (It). This ratio is the inverse of transmittance.
Similar to the decibel, using the log of the ratio allows ratios of significantly different sizes to be de-scribed using easy to work with numbers. The following table shows the relationship between the amount of transmitted light and the calculated film density. From this table, it can be seen that a density reading of 2.0 is the result of only one percent of the incident light making it through the film. At a density of 4.0 only 0.01% of transmitted light reaches the far side of the film. Industrial codes and standards typically require a radiograph to have a density between 2.0 and 4.0 for acceptable viewing with common film viewers.
Above 4.0, (extremely bright) is necessary for evaluation. Contrast within a film increases with increasing density, so in general, the higher the density the better. When radiographs will be digitized, densities above 4.0 are often used since digitization systems can capture and redisplay for easy viewing information from densities up to 6.0. Film density is measured with a densitometer. A densitometer simply has a photoelectric sensor that measures the amount of light transmitted through a piece of film. The film is placed between the light source and the sensor and a density reading is produced by the instrument.
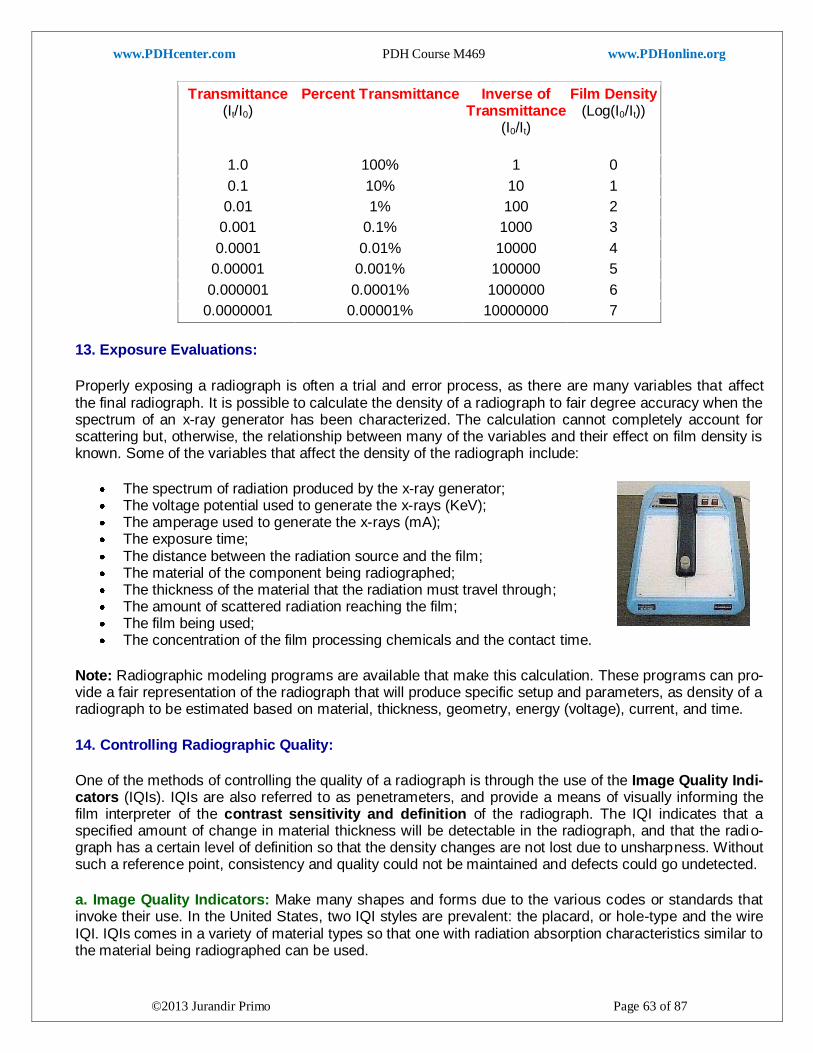
www.PDHcenter.com PDH Course M469 www.PDHonline.org
©2013 Jurandir Primo Page 63 of 87
Transmittance (It/I0)
Percent Transmittance Inverse of Transmittance
(I0/It)
Film Density (Log(I0/It))
1.0 100% 1 0
0.1 10% 10 1
0.01 1% 100 2
0.001 0.1% 1000 3
0.0001 0.01% 10000 4
0.00001 0.001% 100000 5
0.000001 0.0001% 1000000 6
0.0000001 0.00001% 10000000 7
13. Exposure Evaluations:
Properly exposing a radiograph is often a trial and error process, as there are many variables that affect the final radiograph. It is possible to calculate the density of a radiograph to fair degree accuracy when the spectrum of an x-ray generator has been characterized. The calculation cannot completely account for scattering but, otherwise, the relationship between many of the variables and their effect on film density is known. Some of the variables that affect the density of the radiograph include:
The spectrum of radiation produced by the x-ray generator; The voltage potential used to generate the x-rays (KeV); The amperage used to generate the x-rays (mA); The exposure time; The distance between the radiation source and the film; The material of the component being radiographed; The thickness of the material that the radiation must travel through; The amount of scattered radiation reaching the film; The film being used; The concentration of the film processing chemicals and the contact time.
Note: Radiographic modeling programs are available that make this calculation. These programs can pro-vide a fair representation of the radiograph that will produce specific setup and parameters, as density of a radiograph to be estimated based on material, thickness, geometry, energy (voltage), current, and time.
14. Controlling Radiographic Quality:
One of the methods of controlling the quality of a radiograph is through the use of the Image Quality Indi-cators (IQIs). IQIs are also referred to as penetrameters, and provide a means of visually informing the film interpreter of the contrast sensitivity and definition of the radiograph. The IQI indicates that a specified amount of change in material thickness will be detectable in the radiograph, and that the radio-graph has a certain level of definition so that the density changes are not lost due to unsharpness. Without such a reference point, consistency and quality could not be maintained and defects could go undetected.
a. Image Quality Indicators: Make many shapes and forms due to the various codes or standards that invoke their use. In the United States, two IQI styles are prevalent: the placard, or hole-type and the wire IQI. IQIs comes in a variety of material types so that one with radiation absorption characteristics similar to the material being radiographed can be used.
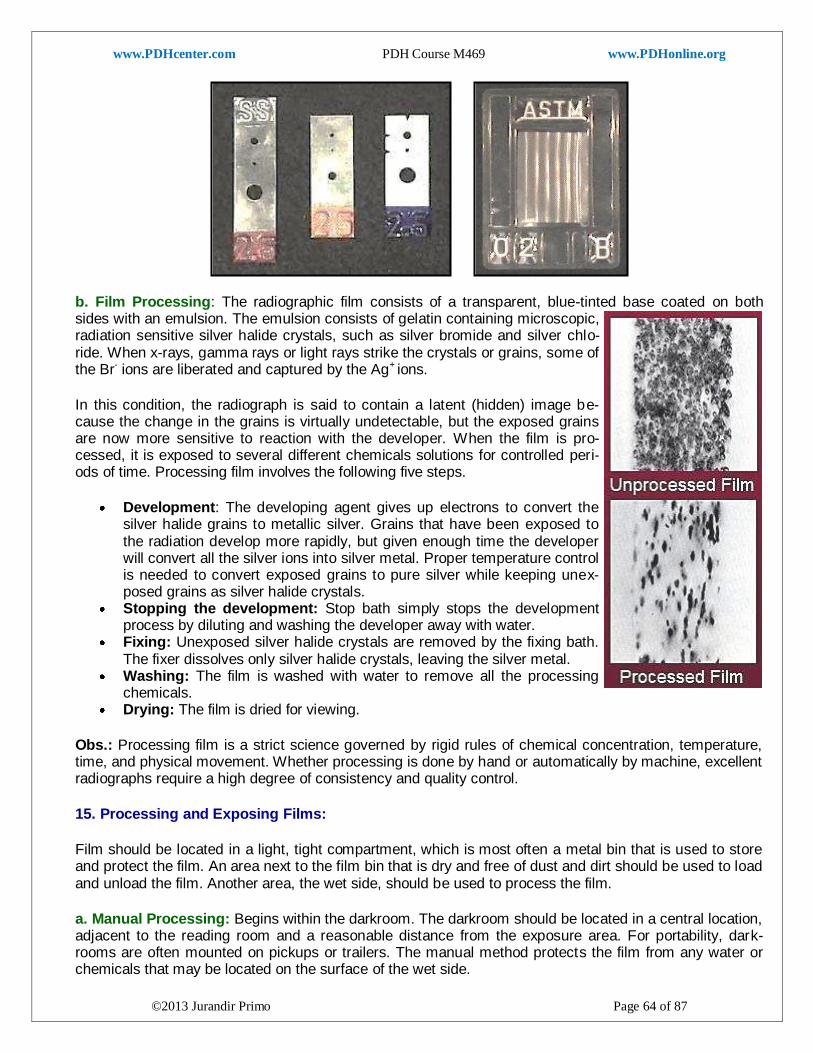
www.PDHcenter.com PDH Course M469 www.PDHonline.org
©2013 Jurandir Primo Page 64 of 87
b. Film Processing: The radiographic film consists of a transparent, blue-tinted base coated on both sides with an emulsion. The emulsion consists of gelatin containing microscopic, radiation sensitive silver halide crystals, such as silver bromide and silver chlo-ride. When x-rays, gamma rays or light rays strike the crystals or grains, some of the Br- ions are liberated and captured by the Ag+ ions.
In this condition, the radiograph is said to contain a latent (hidden) image be-cause the change in the grains is virtually undetectable, but the exposed grains are now more sensitive to reaction with the developer. When the film is pro-cessed, it is exposed to several different chemicals solutions for controlled peri-ods of time. Processing film involves the following five steps.
Development: The developing agent gives up electrons to convert the silver halide grains to metallic silver. Grains that have been exposed to the radiation develop more rapidly, but given enough time the developer will convert all the silver ions into silver metal. Proper temperature control is needed to convert exposed grains to pure silver while keeping unex-posed grains as silver halide crystals.
Stopping the development: Stop bath simply stops the development process by diluting and washing the developer away with water.
Fixing: Unexposed silver halide crystals are removed by the fixing bath. The fixer dissolves only silver halide crystals, leaving the silver metal.
Washing: The film is washed with water to remove all the processing chemicals.
Drying: The film is dried for viewing.
Obs.: Processing film is a strict science governed by rigid rules of chemical concentration, temperature, time, and physical movement. Whether processing is done by hand or automatically by machine, excellent radiographs require a high degree of consistency and quality control.
15. Processing and Exposing Films:
Film should be located in a light, tight compartment, which is most often a metal bin that is used to store and protect the film. An area next to the film bin that is dry and free of dust and dirt should be used to load and unload the film. Another area, the wet side, should be used to process the film.
a. Manual Processing: Begins within the darkroom. The darkroom should be located in a central location, adjacent to the reading room and a reasonable distance from the exposure area. For portability, dark-rooms are often mounted on pickups or trailers. The manual method protects the film from any water or chemicals that may be located on the surface of the wet side.
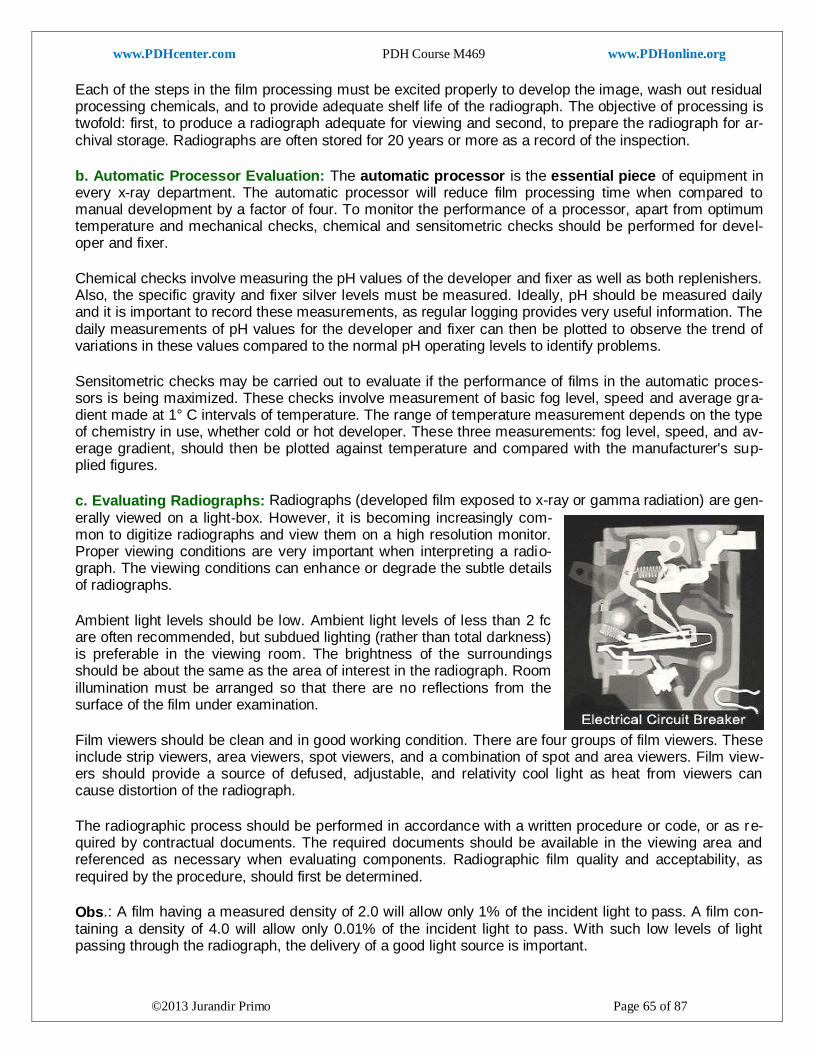
www.PDHcenter.com PDH Course M469 www.PDHonline.org
©2013 Jurandir Primo Page 65 of 87
Each of the steps in the film processing must be excited properly to develop the image, wash out residual processing chemicals, and to provide adequate shelf life of the radiograph. The objective of processing is twofold: first, to produce a radiograph adequate for viewing and second, to prepare the radiograph for ar-chival storage. Radiographs are often stored for 20 years or more as a record of the inspection.
b. Automatic Processor Evaluation: The automatic processor is the essential piece of equipment in every x-ray department. The automatic processor will reduce film processing time when compared to manual development by a factor of four. To monitor the performance of a processor, apart from optimum temperature and mechanical checks, chemical and sensitometric checks should be performed for devel-oper and fixer.
Chemical checks involve measuring the pH values of the developer and fixer as well as both replenishers. Also, the specific gravity and fixer silver levels must be measured. Ideally, pH should be measured daily and it is important to record these measurements, as regular logging provides very useful information. The daily measurements of pH values for the developer and fixer can then be plotted to observe the trend of variations in these values compared to the normal pH operating levels to identify problems.
Sensitometric checks may be carried out to evaluate if the performance of films in the automatic proces-sors is being maximized. These checks involve measurement of basic fog level, speed and average gra-dient made at 1° C intervals of temperature. The range of temperature measurement depends on the type of chemistry in use, whether cold or hot developer. These three measurements: fog level, speed, and av-erage gradient, should then be plotted against temperature and compared with the manufacturer's sup-plied figures.
c. Evaluating Radiographs: Radiographs (developed film exposed to x-ray or gamma radiation) are gen-
erally viewed on a light-box. However, it is becoming increasingly com-mon to digitize radiographs and view them on a high resolution monitor. Proper viewing conditions are very important when interpreting a radio-graph. The viewing conditions can enhance or degrade the subtle details of radiographs.
Ambient light levels should be low. Ambient light levels of less than 2 fc are often recommended, but subdued lighting (rather than total darkness) is preferable in the viewing room. The brightness of the surroundings should be about the same as the area of interest in the radiograph. Room illumination must be arranged so that there are no reflections from the surface of the film under examination.
Film viewers should be clean and in good working condition. There are four groups of film viewers. These include strip viewers, area viewers, spot viewers, and a combination of spot and area viewers. Film view-ers should provide a source of defused, adjustable, and relativity cool light as heat from viewers can cause distortion of the radiograph.
The radiographic process should be performed in accordance with a written procedure or code, or as re-quired by contractual documents. The required documents should be available in the viewing area and referenced as necessary when evaluating components. Radiographic film quality and acceptability, as required by the procedure, should first be determined.
Obs.: A film having a measured density of 2.0 will allow only 1% of the incident light to pass. A film con-taining a density of 4.0 will allow only 0.01% of the incident light to pass. With such low levels of light passing through the radiograph, the delivery of a good light source is important.
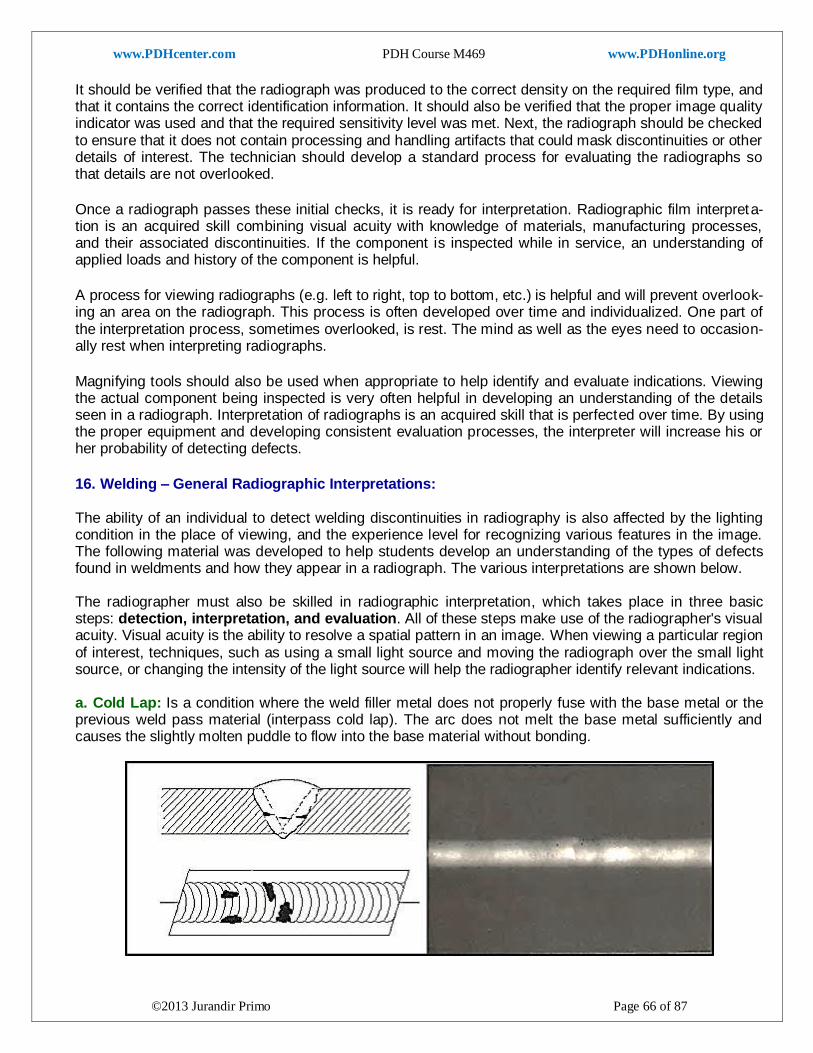
www.PDHcenter.com PDH Course M469 www.PDHonline.org
©2013 Jurandir Primo Page 66 of 87
It should be verified that the radiograph was produced to the correct density on the required film type, and that it contains the correct identification information. It should also be verified that the proper image quality indicator was used and that the required sensitivity level was met. Next, the radiograph should be checked to ensure that it does not contain processing and handling artifacts that could mask discontinuities or other details of interest. The technician should develop a standard process for evaluating the radiographs so that details are not overlooked.
Once a radiograph passes these initial checks, it is ready for interpretation. Radiographic film interpreta-tion is an acquired skill combining visual acuity with knowledge of materials, manufacturing processes, and their associated discontinuities. If the component is inspected while in service, an understanding of applied loads and history of the component is helpful.
A process for viewing radiographs (e.g. left to right, top to bottom, etc.) is helpful and will prevent overlook-ing an area on the radiograph. This process is often developed over time and individualized. One part of the interpretation process, sometimes overlooked, is rest. The mind as well as the eyes need to occasion-ally rest when interpreting radiographs.
Magnifying tools should also be used when appropriate to help identify and evaluate indications. Viewing the actual component being inspected is very often helpful in developing an understanding of the details seen in a radiograph. Interpretation of radiographs is an acquired skill that is perfected over time. By using the proper equipment and developing consistent evaluation processes, the interpreter will increase his or her probability of detecting defects.
16. Welding – General Radiographic Interpretations: The ability of an individual to detect welding discontinuities in radiography is also affected by the lighting condition in the place of viewing, and the experience level for recognizing various features in the image. The following material was developed to help students develop an understanding of the types of defects found in weldments and how they appear in a radiograph. The various interpretations are shown below. The radiographer must also be skilled in radiographic interpretation, which takes place in three basic steps: detection, interpretation, and evaluation. All of these steps make use of the radiographer's visual acuity. Visual acuity is the ability to resolve a spatial pattern in an image. When viewing a particular region of interest, techniques, such as using a small light source and moving the radiograph over the small light source, or changing the intensity of the light source will help the radiographer identify relevant indications. a. Cold Lap: Is a condition where the weld filler metal does not properly fuse with the base metal or the previous weld pass material (interpass cold lap). The arc does not melt the base metal sufficiently and causes the slightly molten puddle to flow into the base material without bonding.
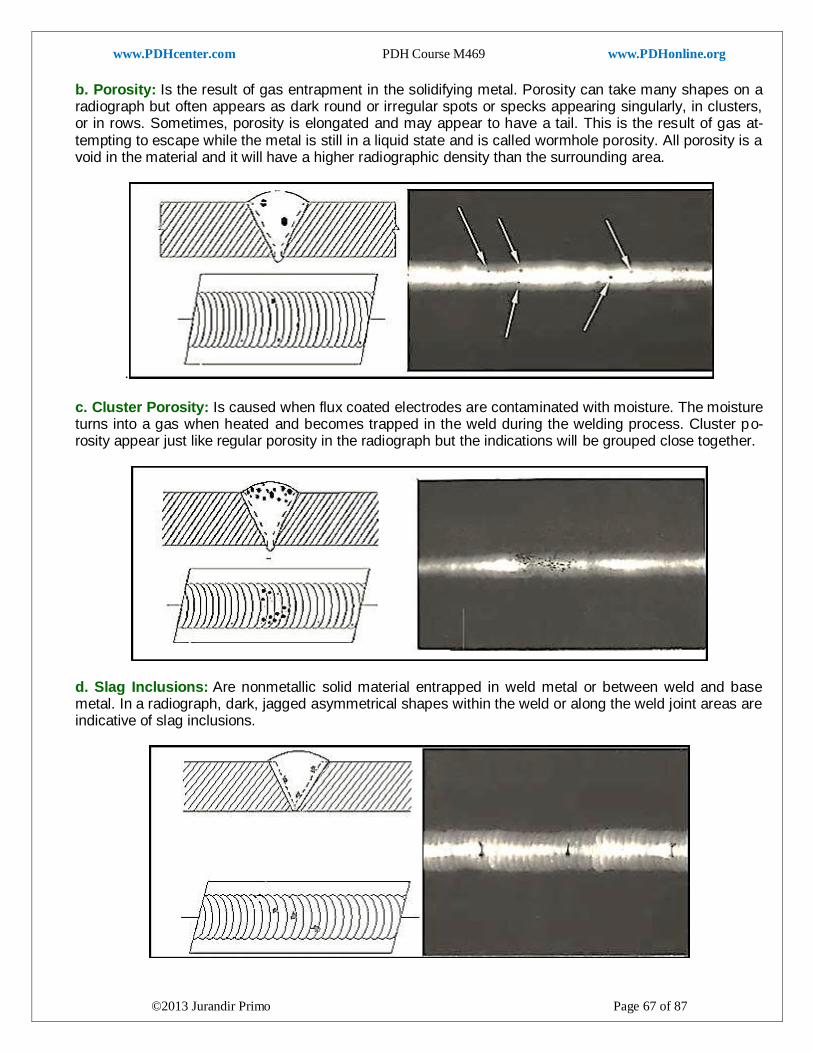
www.PDHcenter.com PDH Course M469 www.PDHonline.org
©2013 Jurandir Primo Page 67 of 87
b. Porosity: Is the result of gas entrapment in the solidifying metal. Porosity can take many shapes on a radiograph but often appears as dark round or irregular spots or specks appearing singularly, in clusters, or in rows. Sometimes, porosity is elongated and may appear to have a tail. This is the result of gas at-tempting to escape while the metal is still in a liquid state and is called wormhole porosity. All porosity is a void in the material and it will have a higher radiographic density than the surrounding area.
. c. Cluster Porosity: Is caused when flux coated electrodes are contaminated with moisture. The moisture turns into a gas when heated and becomes trapped in the weld during the welding process. Cluster po-rosity appear just like regular porosity in the radiograph but the indications will be grouped close together.
d. Slag Inclusions: Are nonmetallic solid material entrapped in weld metal or between weld and base metal. In a radiograph, dark, jagged asymmetrical shapes within the weld or along the weld joint areas are indicative of slag inclusions.
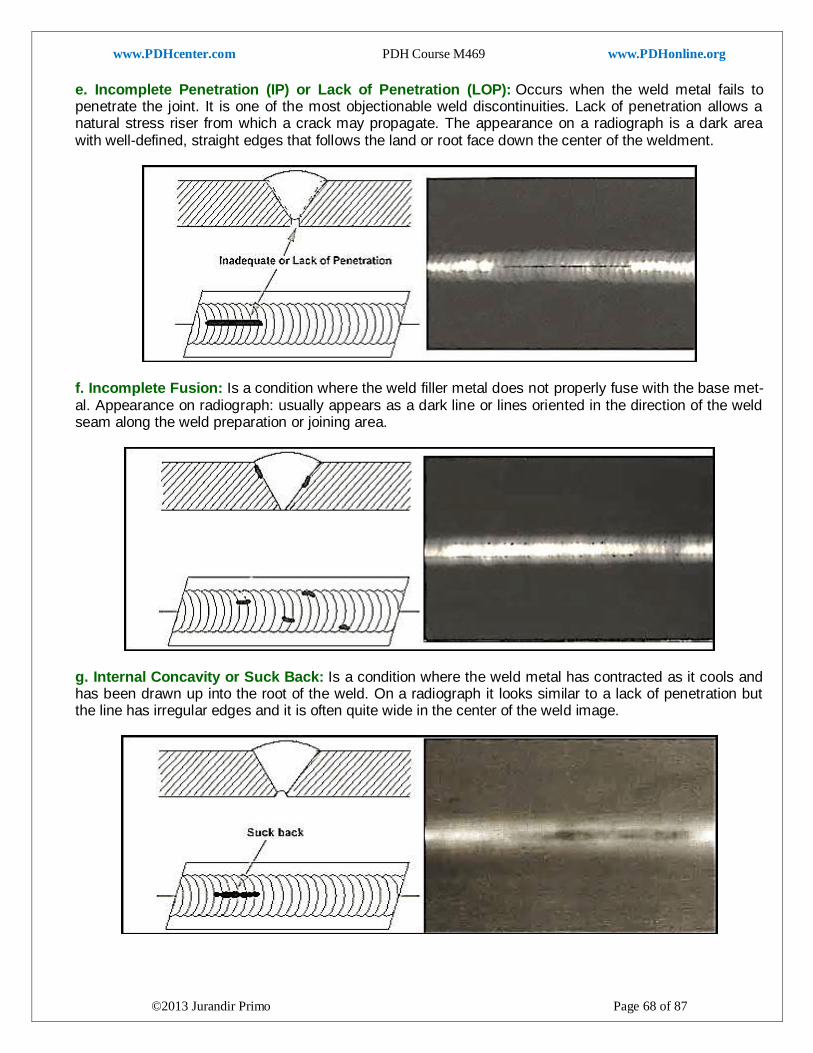
www.PDHcenter.com PDH Course M469 www.PDHonline.org
©2013 Jurandir Primo Page 68 of 87
e. Incomplete Penetration (IP) or Lack of Penetration (LOP): Occurs when the weld metal fails to penetrate the joint. It is one of the most objectionable weld discontinuities. Lack of penetration allows a natural stress riser from which a crack may propagate. The appearance on a radiograph is a dark area with well-defined, straight edges that follows the land or root face down the center of the weldment.
f. Incomplete Fusion: Is a condition where the weld filler metal does not properly fuse with the base met-al. Appearance on radiograph: usually appears as a dark line or lines oriented in the direction of the weld seam along the weld preparation or joining area.
g. Internal Concavity or Suck Back: Is a condition where the weld metal has contracted as it cools and has been drawn up into the root of the weld. On a radiograph it looks similar to a lack of penetration but the line has irregular edges and it is often quite wide in the center of the weld image.
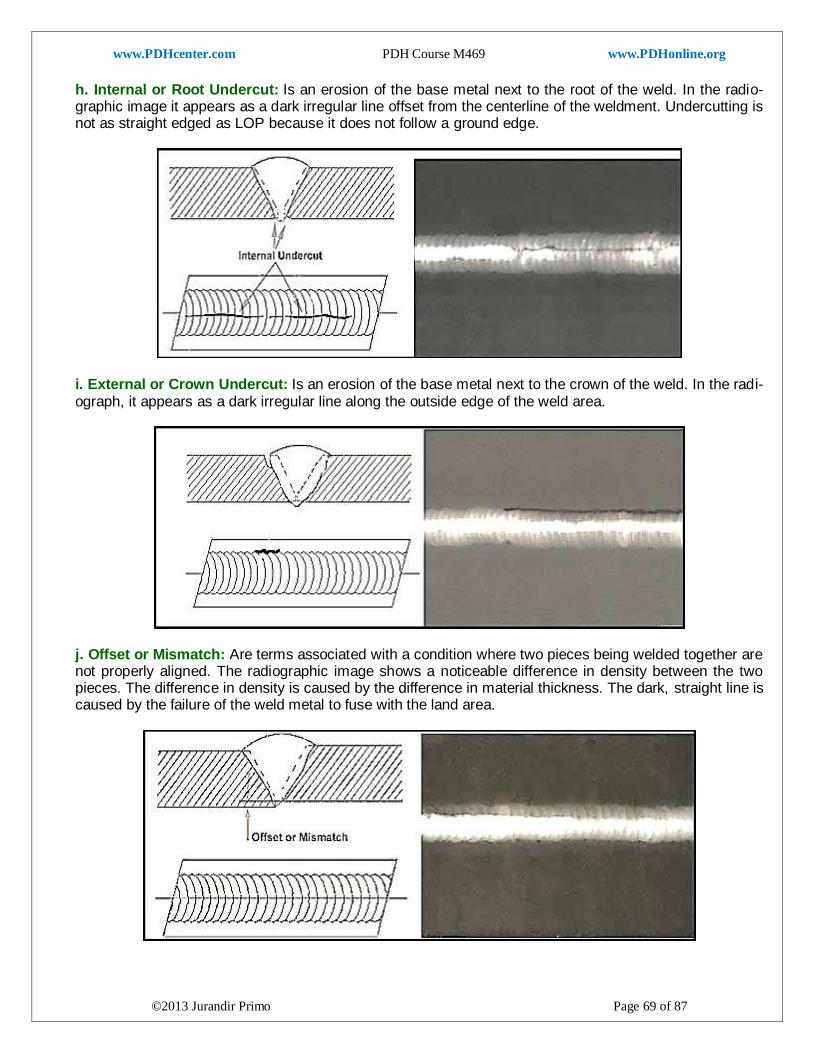
www.PDHcenter.com PDH Course M469 www.PDHonline.org
©2013 Jurandir Primo Page 69 of 87
h. Internal or Root Undercut: Is an erosion of the base metal next to the root of the weld. In the radio-graphic image it appears as a dark irregular line offset from the centerline of the weldment. Undercutting is not as straight edged as LOP because it does not follow a ground edge.
i. External or Crown Undercut: Is an erosion of the base metal next to the crown of the weld. In the radi-ograph, it appears as a dark irregular line along the outside edge of the weld area.
j. Offset or Mismatch: Are terms associated with a condition where two pieces being welded together are not properly aligned. The radiographic image shows a noticeable difference in density between the two pieces. The difference in density is caused by the difference in material thickness. The dark, straight line is caused by the failure of the weld metal to fuse with the land area.
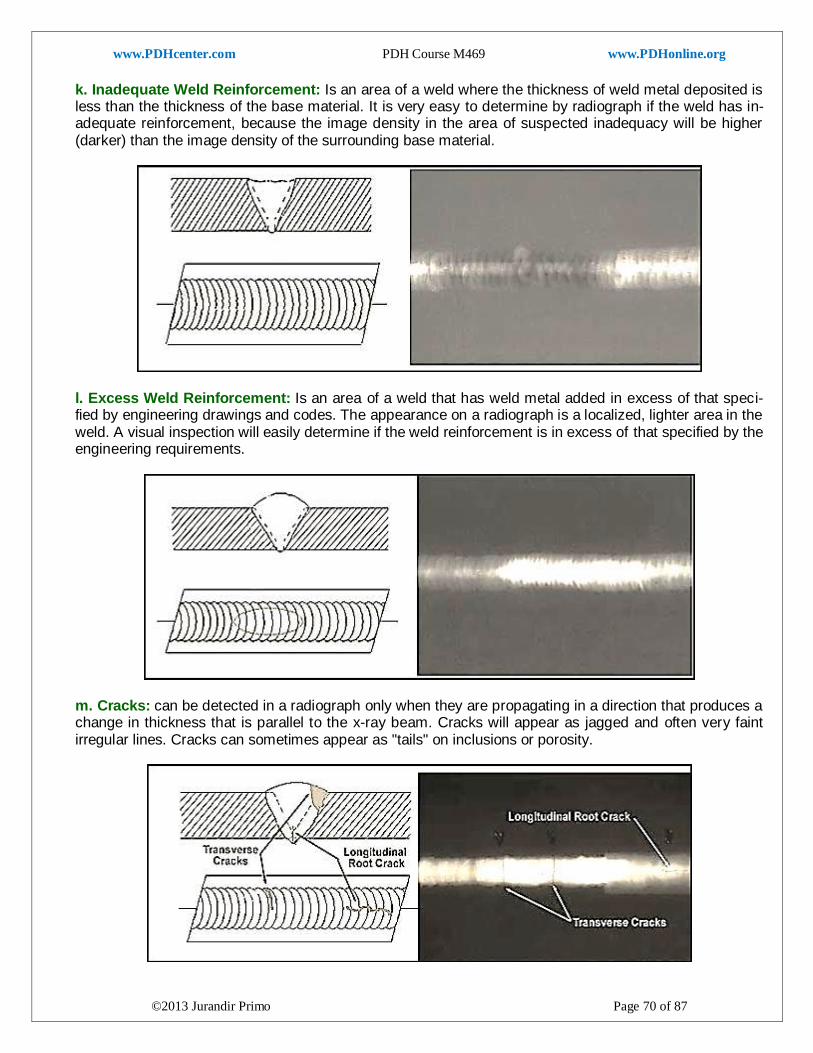
www.PDHcenter.com PDH Course M469 www.PDHonline.org
©2013 Jurandir Primo Page 70 of 87
k. Inadequate Weld Reinforcement: Is an area of a weld where the thickness of weld metal deposited is less than the thickness of the base material. It is very easy to determine by radiograph if the weld has in-adequate reinforcement, because the image density in the area of suspected inadequacy will be higher (darker) than the image density of the surrounding base material.
l. Excess Weld Reinforcement: Is an area of a weld that has weld metal added in excess of that speci-fied by engineering drawings and codes. The appearance on a radiograph is a localized, lighter area in the weld. A visual inspection will easily determine if the weld reinforcement is in excess of that specified by the engineering requirements.
m. Cracks: can be detected in a radiograph only when they are propagating in a direction that produces a change in thickness that is parallel to the x-ray beam. Cracks will appear as jagged and often very faint irregular lines. Cracks can sometimes appear as "tails" on inclusions or porosity.
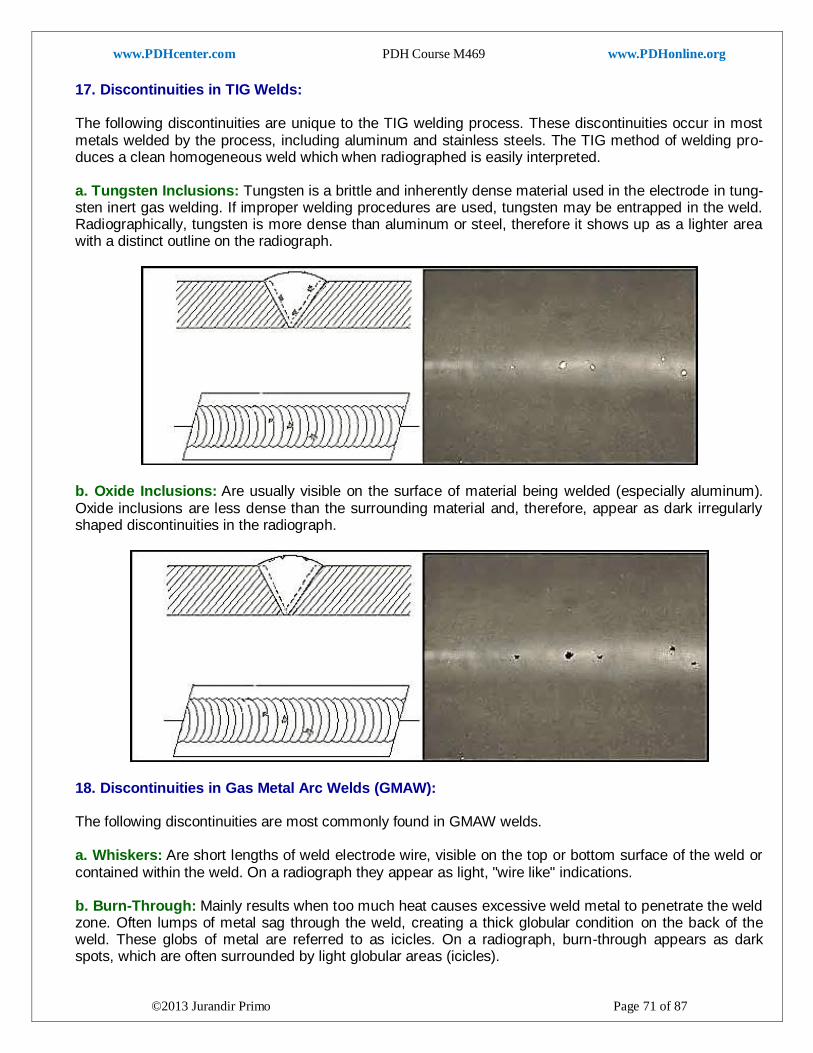
www.PDHcenter.com PDH Course M469 www.PDHonline.org
©2013 Jurandir Primo Page 71 of 87
17. Discontinuities in TIG Welds: The following discontinuities are unique to the TIG welding process. These discontinuities occur in most metals welded by the process, including aluminum and stainless steels. The TIG method of welding pro-duces a clean homogeneous weld which when radiographed is easily interpreted. a. Tungsten Inclusions: Tungsten is a brittle and inherently dense material used in the electrode in tung-sten inert gas welding. If improper welding procedures are used, tungsten may be entrapped in the weld. Radiographically, tungsten is more dense than aluminum or steel, therefore it shows up as a lighter area with a distinct outline on the radiograph.
b. Oxide Inclusions: Are usually visible on the surface of material being welded (especially aluminum). Oxide inclusions are less dense than the surrounding material and, therefore, appear as dark irregularly shaped discontinuities in the radiograph.
18. Discontinuities in Gas Metal Arc Welds (GMAW): The following discontinuities are most commonly found in GMAW welds. a. Whiskers: Are short lengths of weld electrode wire, visible on the top or bottom surface of the weld or contained within the weld. On a radiograph they appear as light, "wire like" indications. b. Burn-Through: Mainly results when too much heat causes excessive weld metal to penetrate the weld zone. Often lumps of metal sag through the weld, creating a thick globular condition on the back of the weld. These globs of metal are referred to as icicles. On a radiograph, burn-through appears as dark spots, which are often surrounded by light globular areas (icicles).
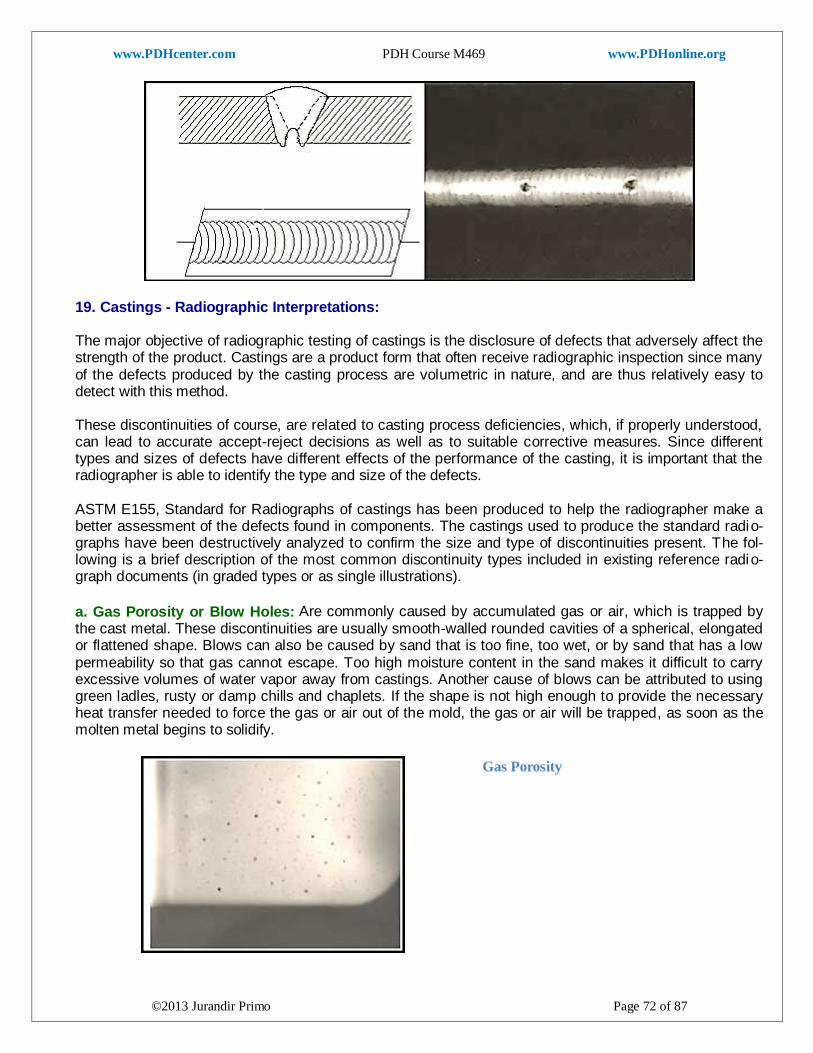
www.PDHcenter.com PDH Course M469 www.PDHonline.org
©2013 Jurandir Primo Page 72 of 87
19. Castings - Radiographic Interpretations: The major objective of radiographic testing of castings is the disclosure of defects that adversely affect the strength of the product. Castings are a product form that often receive radiographic inspection since many of the defects produced by the casting process are volumetric in nature, and are thus relatively easy to detect with this method. These discontinuities of course, are related to casting process deficiencies, which, if properly understood, can lead to accurate accept-reject decisions as well as to suitable corrective measures. Since different types and sizes of defects have different effects of the performance of the casting, it is important that the radiographer is able to identify the type and size of the defects. ASTM E155, Standard for Radiographs of castings has been produced to help the radiographer make a better assessment of the defects found in components. The castings used to produce the standard radio-graphs have been destructively analyzed to confirm the size and type of discontinuities present. The fol-lowing is a brief description of the most common discontinuity types included in existing reference radio-graph documents (in graded types or as single illustrations).
a. Gas Porosity or Blow Holes: Are commonly caused by accumulated gas or air, which is trapped by the cast metal. These discontinuities are usually smooth-walled rounded cavities of a spherical, elongated or flattened shape. Blows can also be caused by sand that is too fine, too wet, or by sand that has a low permeability so that gas cannot escape. Too high moisture content in the sand makes it difficult to carry excessive volumes of water vapor away from castings. Another cause of blows can be attributed to using green ladles, rusty or damp chills and chaplets. If the shape is not high enough to provide the necessary heat transfer needed to force the gas or air out of the mold, the gas or air will be trapped, as soon as the molten metal begins to solidify.
Gas Porosity
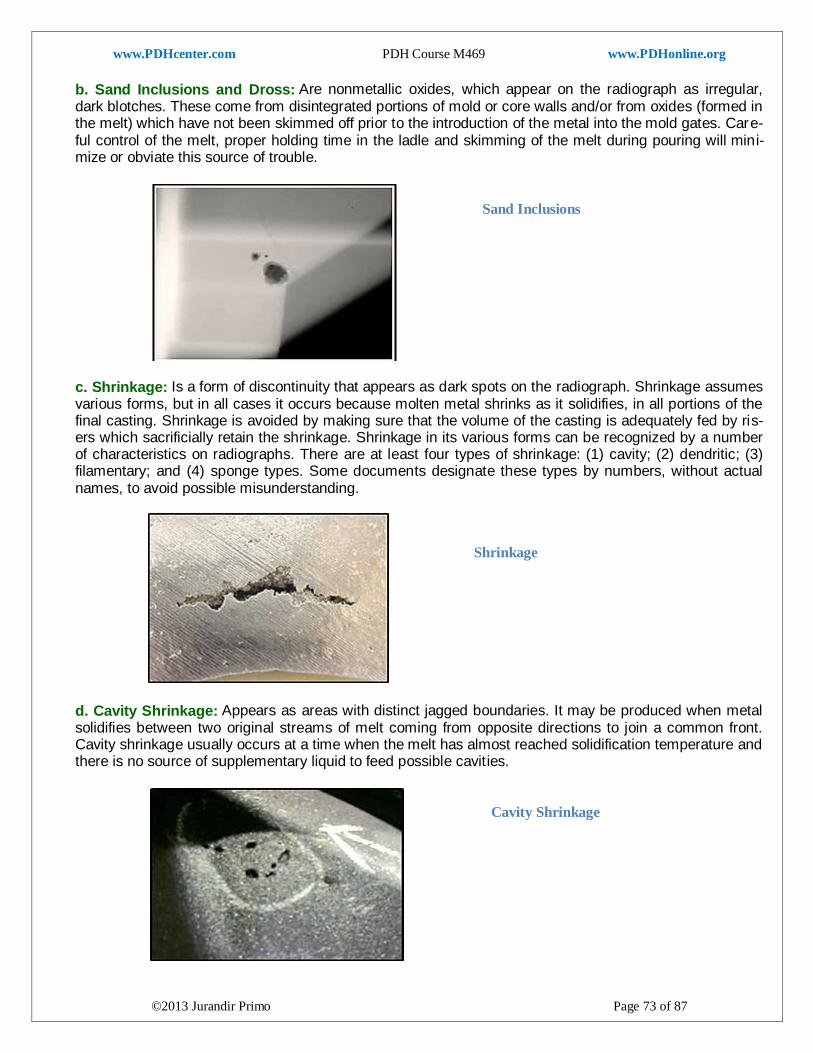
www.PDHcenter.com PDH Course M469 www.PDHonline.org
©2013 Jurandir Primo Page 73 of 87
b. Sand Inclusions and Dross: Are nonmetallic oxides, which appear on the radiograph as irregular, dark blotches. These come from disintegrated portions of mold or core walls and/or from oxides (formed in the melt) which have not been skimmed off prior to the introduction of the metal into the mold gates. Care-ful control of the melt, proper holding time in the ladle and skimming of the melt during pouring will mini-mize or obviate this source of trouble.
c. Shrinkage: Is a form of discontinuity that appears as dark spots on the radiograph. Shrinkage assumes various forms, but in all cases it occurs because molten metal shrinks as it solidifies, in all portions of the final casting. Shrinkage is avoided by making sure that the volume of the casting is adequately fed by ris-ers which sacrificially retain the shrinkage. Shrinkage in its various forms can be recognized by a number of characteristics on radiographs. There are at least four types of shrinkage: (1) cavity; (2) dendritic; (3) filamentary; and (4) sponge types. Some documents designate these types by numbers, without actual names, to avoid possible misunderstanding.
d. Cavity Shrinkage: Appears as areas with distinct jagged boundaries. It may be produced when metal solidifies between two original streams of melt coming from opposite directions to join a common front. Cavity shrinkage usually occurs at a time when the melt has almost reached solidification temperature and there is no source of supplementary liquid to feed possible cavities.
Sand Inclusions
Cavity Shrinkage
Shrinkage
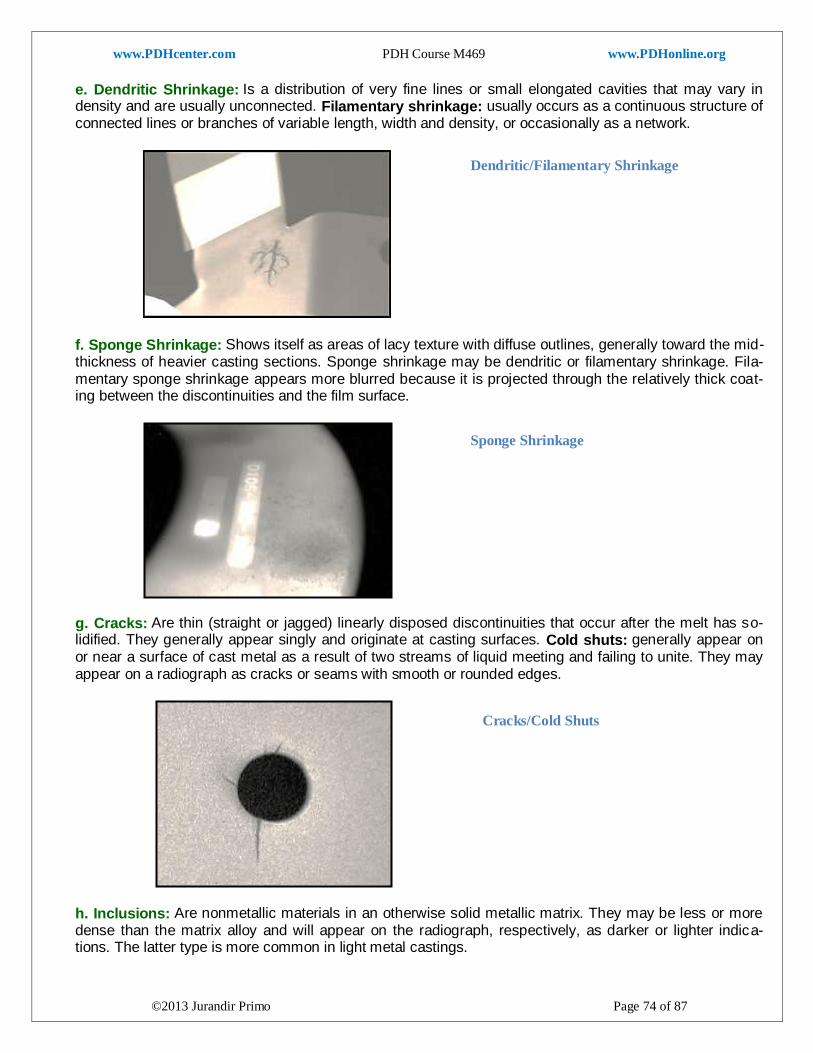
www.PDHcenter.com PDH Course M469 www.PDHonline.org
©2013 Jurandir Primo Page 74 of 87
e. Dendritic Shrinkage: Is a distribution of very fine lines or small elongated cavities that may vary in density and are usually unconnected. Filamentary shrinkage: usually occurs as a continuous structure of connected lines or branches of variable length, width and density, or occasionally as a network.
f. Sponge Shrinkage: Shows itself as areas of lacy texture with diffuse outlines, generally toward the mid-thickness of heavier casting sections. Sponge shrinkage may be dendritic or filamentary shrinkage. Fila-mentary sponge shrinkage appears more blurred because it is projected through the relatively thick coat-ing between the discontinuities and the film surface.
g. Cracks: Are thin (straight or jagged) linearly disposed discontinuities that occur after the melt has so-lidified. They generally appear singly and originate at casting surfaces. Cold shuts: generally appear on or near a surface of cast metal as a result of two streams of liquid meeting and failing to unite. They may appear on a radiograph as cracks or seams with smooth or rounded edges.
h. Inclusions: Are nonmetallic materials in an otherwise solid metallic matrix. They may be less or more dense than the matrix alloy and will appear on the radiograph, respectively, as darker or lighter indica-tions. The latter type is more common in light metal castings.
Cracks/Cold Shuts
Dendritic/Filamentary Shrinkage
Sponge Shrinkage
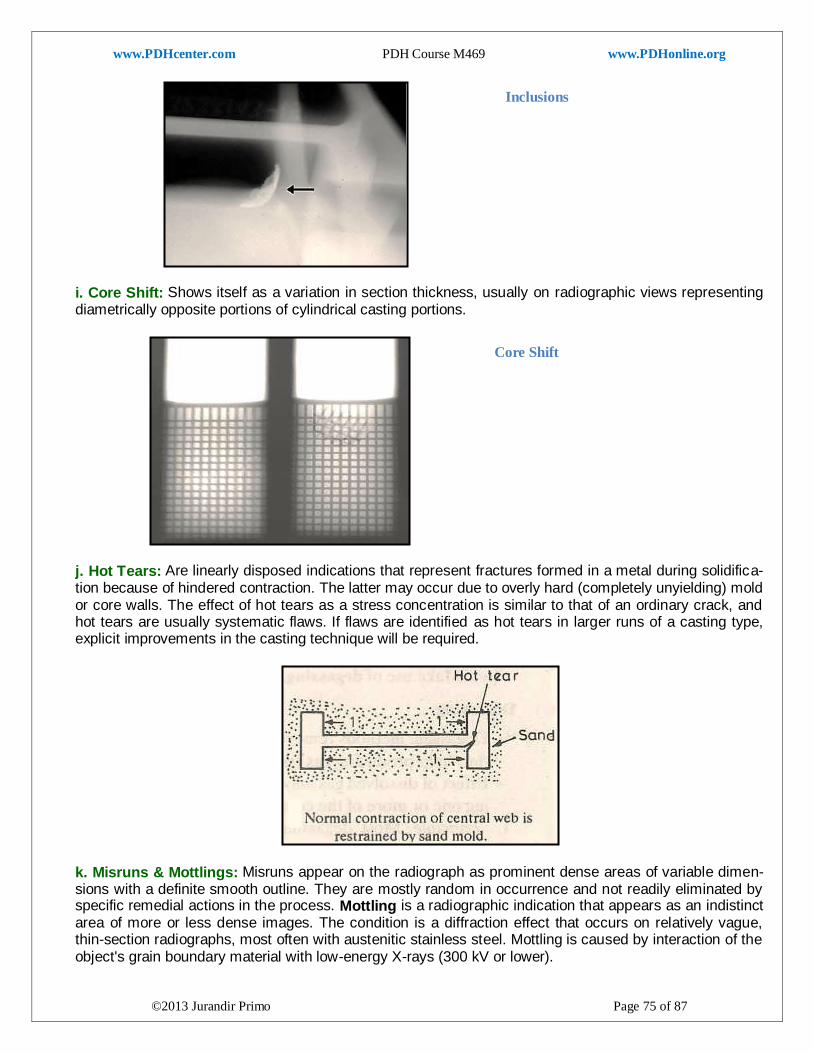
www.PDHcenter.com PDH Course M469 www.PDHonline.org
©2013 Jurandir Primo Page 75 of 87
i. Core Shift: Shows itself as a variation in section thickness, usually on radiographic views representing diametrically opposite portions of cylindrical casting portions.
j. Hot Tears: Are linearly disposed indications that represent fractures formed in a metal during solidifica-tion because of hindered contraction. The latter may occur due to overly hard (completely unyielding) mold or core walls. The effect of hot tears as a stress concentration is similar to that of an ordinary crack, and hot tears are usually systematic flaws. If flaws are identified as hot tears in larger runs of a casting type, explicit improvements in the casting technique will be required.
k. Misruns & Mottlings: Misruns appear on the radiograph as prominent dense areas of variable dimen-sions with a definite smooth outline. They are mostly random in occurrence and not readily eliminated by specific remedial actions in the process. Mottling is a radiographic indication that appears as an indistinct area of more or less dense images. The condition is a diffraction effect that occurs on relatively vague, thin-section radiographs, most often with austenitic stainless steel. Mottling is caused by interaction of the object's grain boundary material with low-energy X-rays (300 kV or lower).
Inclusions
Core Shift
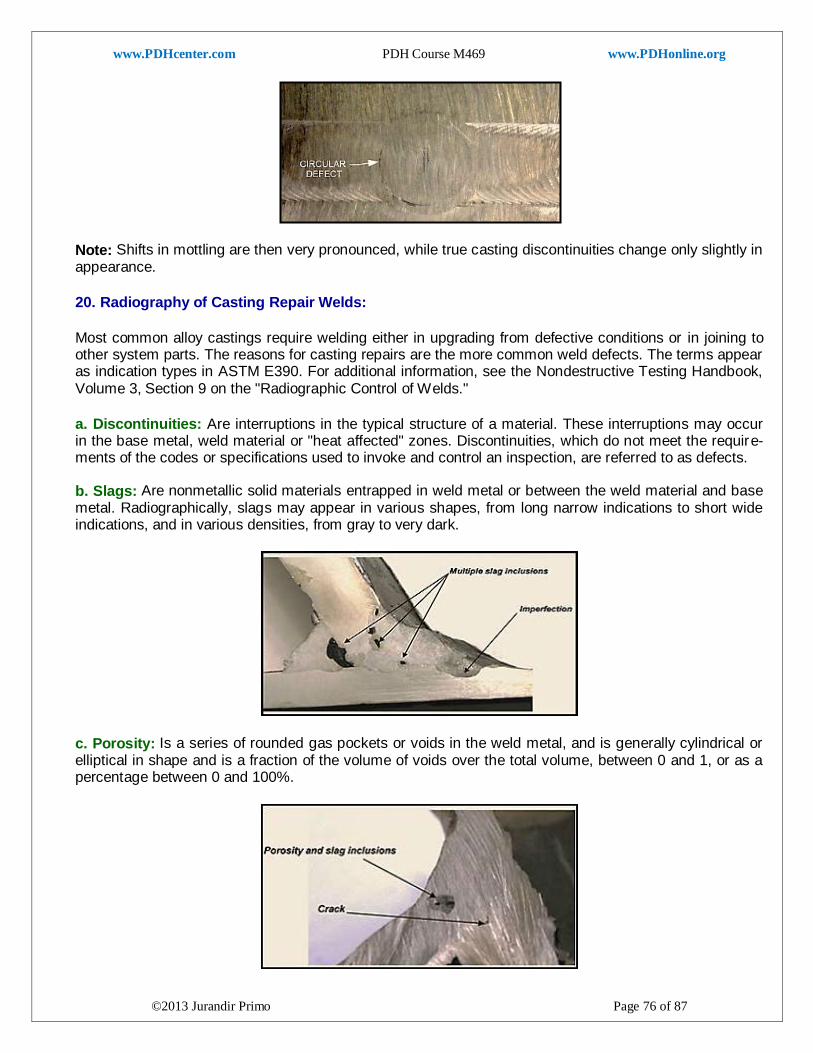
www.PDHcenter.com PDH Course M469 www.PDHonline.org
©2013 Jurandir Primo Page 76 of 87
Note: Shifts in mottling are then very pronounced, while true casting discontinuities change only slightly in appearance.
20. Radiography of Casting Repair Welds:
Most common alloy castings require welding either in upgrading from defective conditions or in joining to other system parts. The reasons for casting repairs are the more common weld defects. The terms appear as indication types in ASTM E390. For additional information, see the Nondestructive Testing Handbook, Volume 3, Section 9 on the "Radiographic Control of Welds."
a. Discontinuities: Are interruptions in the typical structure of a material. These interruptions may occur in the base metal, weld material or "heat affected" zones. Discontinuities, which do not meet the require-ments of the codes or specifications used to invoke and control an inspection, are referred to as defects. b. Slags: Are nonmetallic solid materials entrapped in weld metal or between the weld material and base metal. Radiographically, slags may appear in various shapes, from long narrow indications to short wide indications, and in various densities, from gray to very dark.
c. Porosity: Is a series of rounded gas pockets or voids in the weld metal, and is generally cylindrical or elliptical in shape and is a fraction of the volume of voids over the total volume, between 0 and 1, or as a percentage between 0 and 100%.
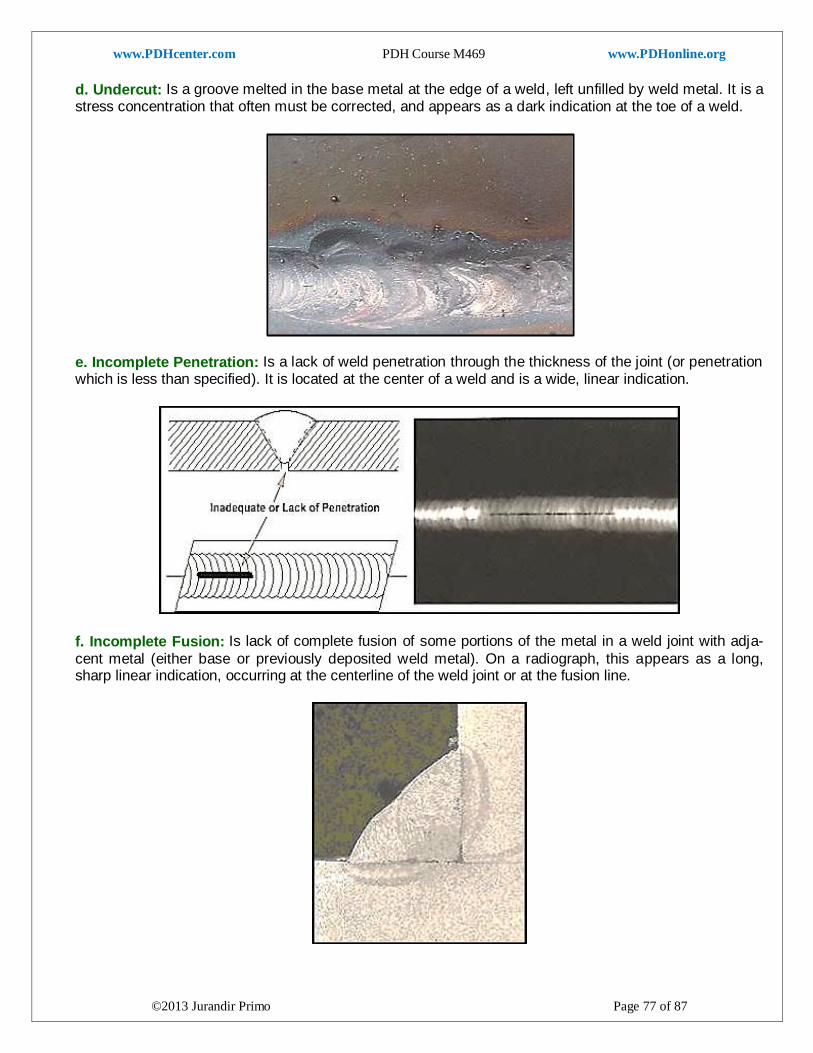
www.PDHcenter.com PDH Course M469 www.PDHonline.org
©2013 Jurandir Primo Page 77 of 87
d. Undercut: Is a groove melted in the base metal at the edge of a weld, left unfilled by weld metal. It is a stress concentration that often must be corrected, and appears as a dark indication at the toe of a weld.
e. Incomplete Penetration: Is a lack of weld penetration through the thickness of the joint (or penetration which is less than specified). It is located at the center of a weld and is a wide, linear indication.
f. Incomplete Fusion: Is lack of complete fusion of some portions of the metal in a weld joint with adja-
cent metal (either base or previously deposited weld metal). On a radiograph, this appears as a long, sharp linear indication, occurring at the centerline of the weld joint or at the fusion line.
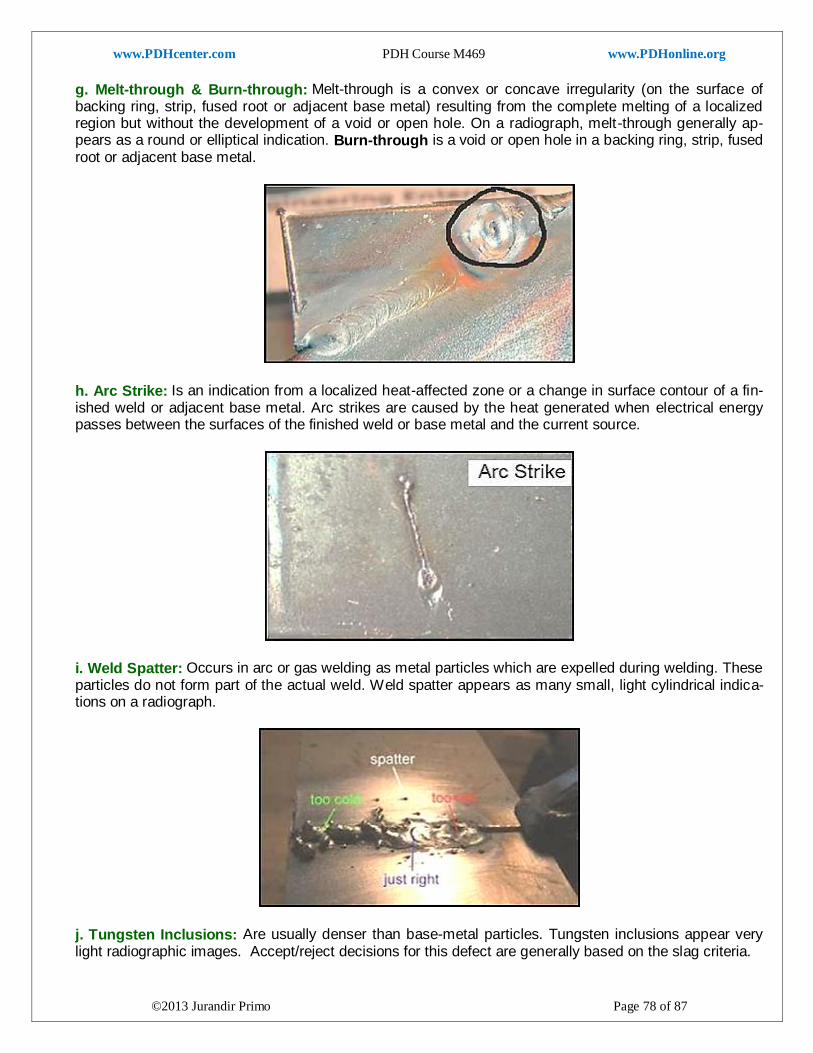
www.PDHcenter.com PDH Course M469 www.PDHonline.org
©2013 Jurandir Primo Page 78 of 87
g. Melt-through & Burn-through: Melt-through is a convex or concave irregularity (on the surface of backing ring, strip, fused root or adjacent base metal) resulting from the complete melting of a localized region but without the development of a void or open hole. On a radiograph, melt-through generally ap-pears as a round or elliptical indication. Burn-through is a void or open hole in a backing ring, strip, fused root or adjacent base metal.
h. Arc Strike: Is an indication from a localized heat-affected zone or a change in surface contour of a fin-ished weld or adjacent base metal. Arc strikes are caused by the heat generated when electrical energy passes between the surfaces of the finished weld or base metal and the current source.
i. Weld Spatter: Occurs in arc or gas welding as metal particles which are expelled during welding. These particles do not form part of the actual weld. Weld spatter appears as many small, light cylindrical indica-tions on a radiograph.
j. Tungsten Inclusions: Are usually denser than base-metal particles. Tungsten inclusions appear very light radiographic images. Accept/reject decisions for this defect are generally based on the slag criteria.
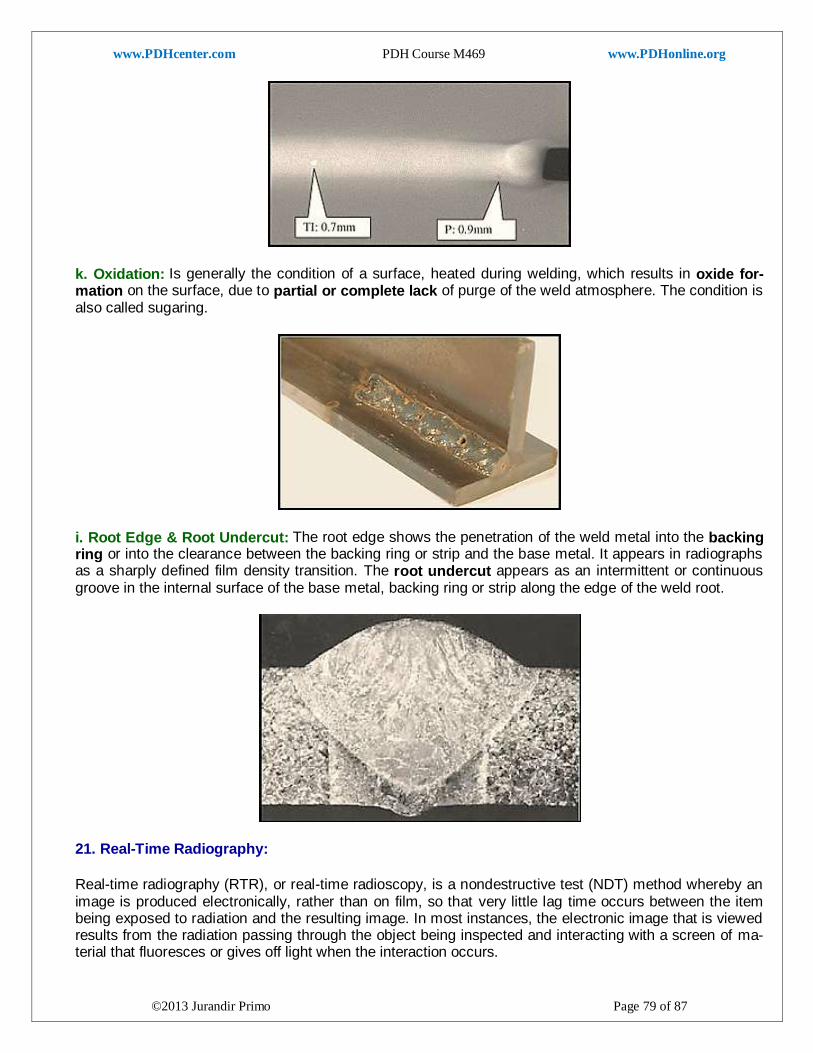
www.PDHcenter.com PDH Course M469 www.PDHonline.org
©2013 Jurandir Primo Page 79 of 87
k. Oxidation: Is generally the condition of a surface, heated during welding, which results in oxide for-mation on the surface, due to partial or complete lack of purge of the weld atmosphere. The condition is also called sugaring.
i. Root Edge & Root Undercut: The root edge shows the penetration of the weld metal into the backing ring or into the clearance between the backing ring or strip and the base metal. It appears in radiographs as a sharply defined film density transition. The root undercut appears as an intermittent or continuous groove in the internal surface of the base metal, backing ring or strip along the edge of the weld root.
21. Real-Time Radiography:
Real-time radiography (RTR), or real-time radioscopy, is a nondestructive test (NDT) method whereby an image is produced electronically, rather than on film, so that very little lag time occurs between the item being exposed to radiation and the resulting image. In most instances, the electronic image that is viewed results from the radiation passing through the object being inspected and interacting with a screen of ma-terial that fluoresces or gives off light when the interaction occurs.
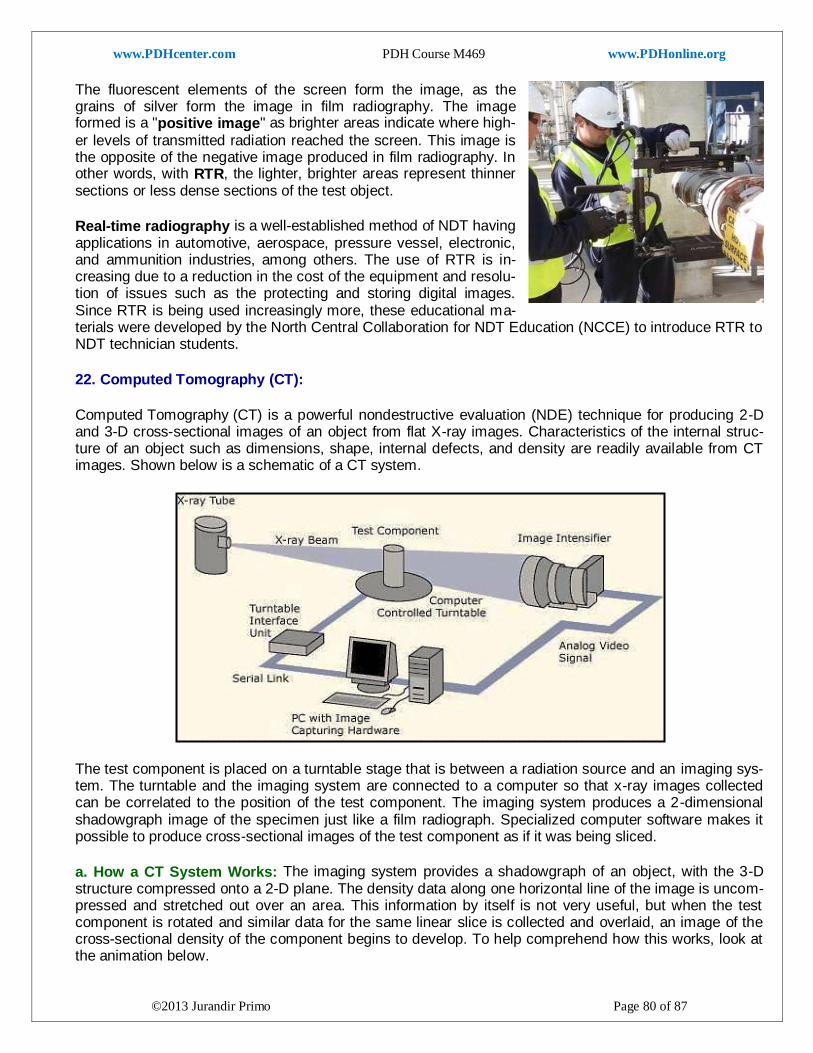
www.PDHcenter.com PDH Course M469 www.PDHonline.org
©2013 Jurandir Primo Page 80 of 87
The fluorescent elements of the screen form the image, as the grains of silver form the image in film radiography. The image formed is a "positive image" as brighter areas indicate where high-
er levels of transmitted radiation reached the screen. This image is the opposite of the negative image produced in film radiography. In other words, with RTR, the lighter, brighter areas represent thinner sections or less dense sections of the test object.
Real-time radiography is a well-established method of NDT having applications in automotive, aerospace, pressure vessel, electronic, and ammunition industries, among others. The use of RTR is in-creasing due to a reduction in the cost of the equipment and resolu-tion of issues such as the protecting and storing digital images. Since RTR is being used increasingly more, these educational ma-terials were developed by the North Central Collaboration for NDT Education (NCCE) to introduce RTR to NDT technician students.
22. Computed Tomography (CT):
Computed Tomography (CT) is a powerful nondestructive evaluation (NDE) technique for producing 2-D and 3-D cross-sectional images of an object from flat X-ray images. Characteristics of the internal struc-ture of an object such as dimensions, shape, internal defects, and density are readily available from CT images. Shown below is a schematic of a CT system.
The test component is placed on a turntable stage that is between a radiation source and an imaging sys-tem. The turntable and the imaging system are connected to a computer so that x-ray images collected can be correlated to the position of the test component. The imaging system produces a 2-dimensional shadowgraph image of the specimen just like a film radiograph. Specialized computer software makes it possible to produce cross-sectional images of the test component as if it was being sliced.
a. How a CT System Works: The imaging system provides a shadowgraph of an object, with the 3-D structure compressed onto a 2-D plane. The density data along one horizontal line of the image is uncom-pressed and stretched out over an area. This information by itself is not very useful, but when the test component is rotated and similar data for the same linear slice is collected and overlaid, an image of the cross-sectional density of the component begins to develop. To help comprehend how this works, look at the animation below.
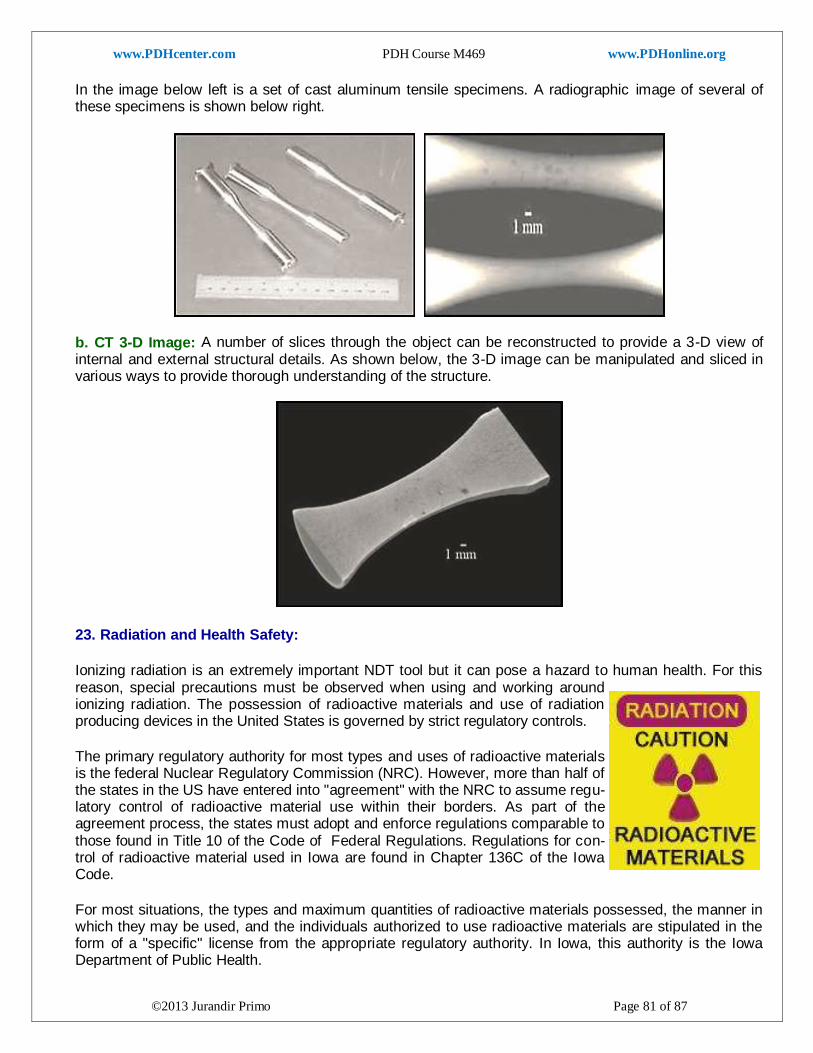
www.PDHcenter.com PDH Course M469 www.PDHonline.org
©2013 Jurandir Primo Page 81 of 87
In the image below left is a set of cast aluminum tensile specimens. A radiographic image of several of these specimens is shown below right.
b. CT 3-D Image: A number of slices through the object can be reconstructed to provide a 3-D view of internal and external structural details. As shown below, the 3-D image can be manipulated and sliced in various ways to provide thorough understanding of the structure.
23. Radiation and Health Safety:
Ionizing radiation is an extremely important NDT tool but it can pose a hazard to human health. For this reason, special precautions must be observed when using and working around ionizing radiation. The possession of radioactive materials and use of radiation producing devices in the United States is governed by strict regulatory controls.
The primary regulatory authority for most types and uses of radioactive materials is the federal Nuclear Regulatory Commission (NRC). However, more than half of the states in the US have entered into "agreement" with the NRC to assume regu-latory control of radioactive material use within their borders. As part of the agreement process, the states must adopt and enforce regulations comparable to those found in Title 10 of the Code of Federal Regulations. Regulations for con-trol of radioactive material used in Iowa are found in Chapter 136C of the Iowa Code.
For most situations, the types and maximum quantities of radioactive materials possessed, the manner in which they may be used, and the individuals authorized to use radioactive materials are stipulated in the form of a "specific" license from the appropriate regulatory authority. In Iowa, this authority is the Iowa Department of Public Health.
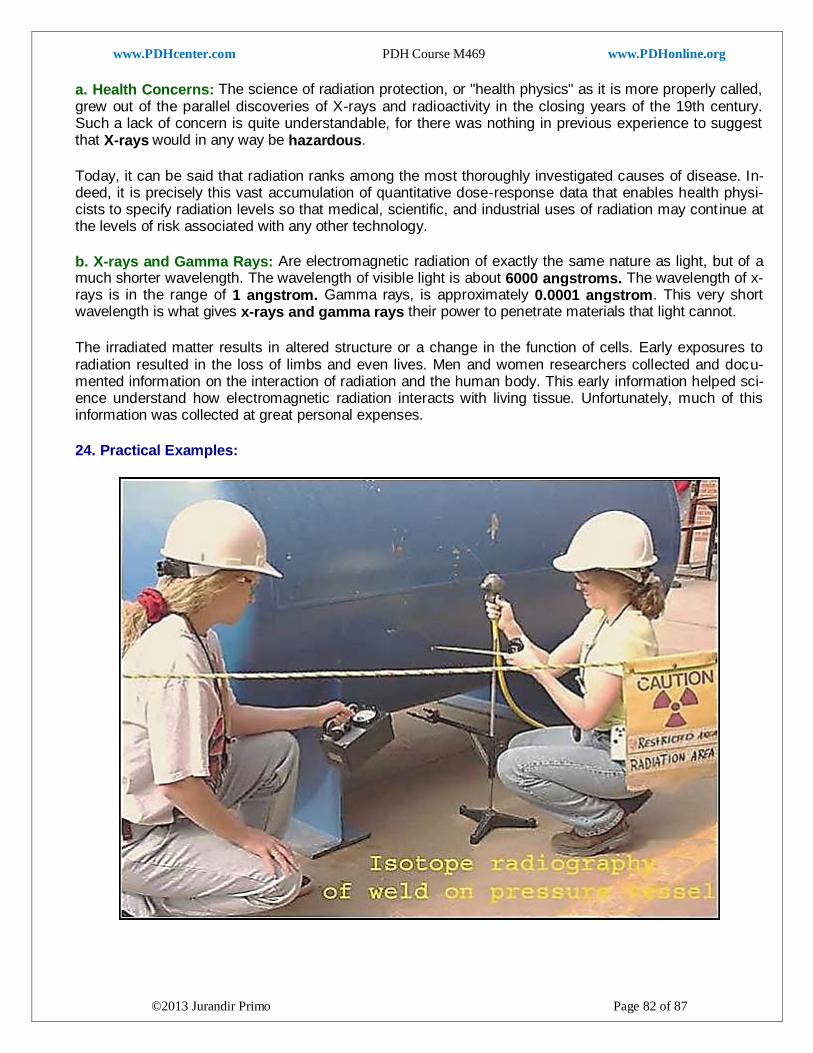
www.PDHcenter.com PDH Course M469 www.PDHonline.org
©2013 Jurandir Primo Page 82 of 87
a. Health Concerns: The science of radiation protection, or "health physics" as it is more properly called, grew out of the parallel discoveries of X-rays and radioactivity in the closing years of the 19th century. Such a lack of concern is quite understandable, for there was nothing in previous experience to suggest that X-rays would in any way be hazardous.
Today, it can be said that radiation ranks among the most thoroughly investigated causes of disease. In-deed, it is precisely this vast accumulation of quantitative dose-response data that enables health physi-cists to specify radiation levels so that medical, scientific, and industrial uses of radiation may cont inue at the levels of risk associated with any other technology.
b. X-rays and Gamma Rays: Are electromagnetic radiation of exactly the same nature as light, but of a much shorter wavelength. The wavelength of visible light is about 6000 angstroms. The wavelength of x-rays is in the range of 1 angstrom. Gamma rays, is approximately 0.0001 angstrom. This very short wavelength is what gives x-rays and gamma rays their power to penetrate materials that light cannot.
The irradiated matter results in altered structure or a change in the function of cells. Early exposures to radiation resulted in the loss of limbs and even lives. Men and women researchers collected and docu-mented information on the interaction of radiation and the human body. This early information helped sci-ence understand how electromagnetic radiation interacts with living tissue. Unfortunately, much of this information was collected at great personal expenses.
24. Practical Examples:

www.PDHcenter.com PDH Course M469 www.PDHonline.org
©2013 Jurandir Primo Page 83 of 87
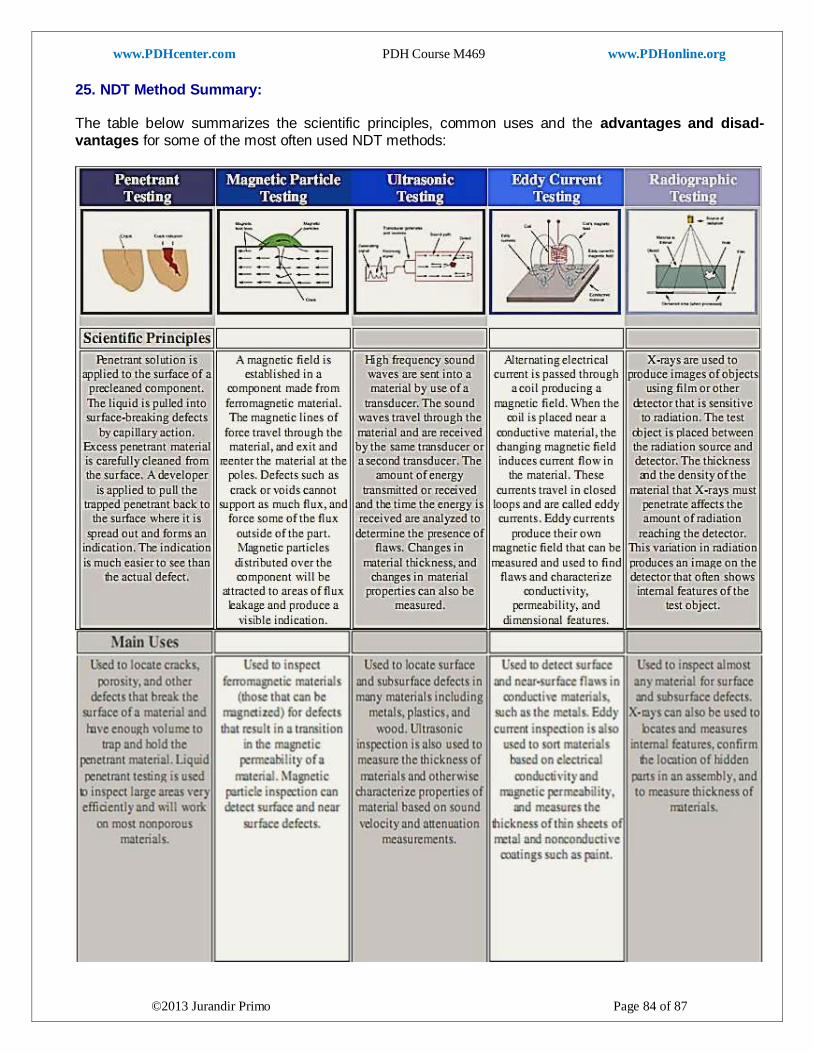
www.PDHcenter.com PDH Course M469 www.PDHonline.org
©2013 Jurandir Primo Page 84 of 87
25. NDT Method Summary: The table below summarizes the scientific principles, common uses and the advantages and disad-vantages for some of the most often used NDT methods:
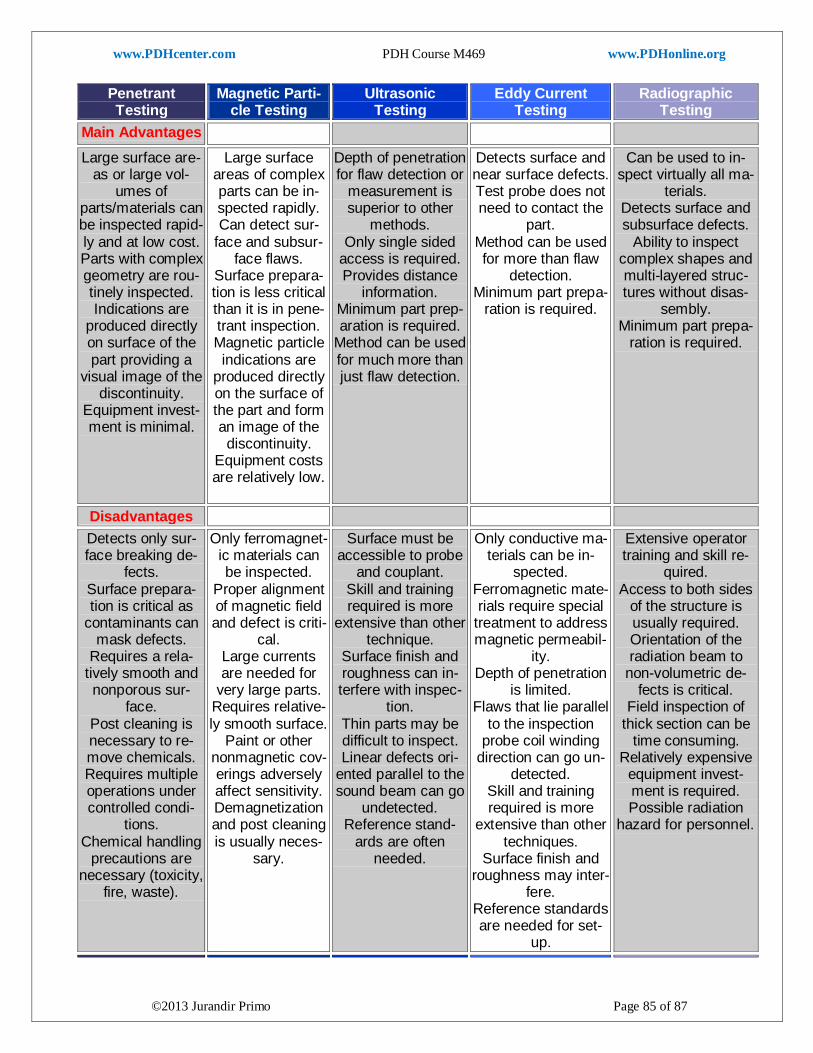
www.PDHcenter.com PDH Course M469 www.PDHonline.org
©2013 Jurandir Primo Page 85 of 87
Penetrant Testing
Magnetic Parti-cle Testing
Ultrasonic Testing
Eddy Current Testing
Radiographic Testing
Main Advantages
Large surface are-as or large vol-
umes of parts/materials can be inspected rapid-ly and at low cost. Parts with complex geometry are rou-tinely inspected. Indications are
produced directly on surface of the part providing a
visual image of the discontinuity.
Equipment invest-ment is minimal.
Large surface areas of complex parts can be in-spected rapidly. Can detect sur-
face and subsur-face flaws.
Surface prepara-tion is less critical than it is in pene-trant inspection. Magnetic particle indications are
produced directly on the surface of the part and form an image of the discontinuity.
Equipment costs are relatively low.
Depth of penetration for flaw detection or
measurement is superior to other
methods. Only single sided
access is required. Provides distance
information. Minimum part prep-aration is required.
Method can be used for much more than just flaw detection.
Detects surface and near surface defects. Test probe does not need to contact the
part. Method can be used for more than flaw
detection. Minimum part prepa-
ration is required.
Can be used to in-spect virtually all ma-
terials. Detects surface and subsurface defects.
Ability to inspect complex shapes and multi-layered struc-tures without disas-
sembly. Minimum part prepa-
ration is required.
Disadvantages
Detects only sur-face breaking de-
fects. Surface prepara-tion is critical as
contaminants can mask defects.
Requires a rela-tively smooth and nonporous sur-
face. Post cleaning is necessary to re-move chemicals. Requires multiple operations under controlled condi-
tions. Chemical handling
precautions are necessary (toxicity,
fire, waste).
Only ferromagnet-ic materials can be inspected.
Proper alignment of magnetic field and defect is criti-
cal. Large currents are needed for
very large parts. Requires relative-ly smooth surface.
Paint or other nonmagnetic cov-erings adversely affect sensitivity. Demagnetization and post cleaning is usually neces-
sary.
Surface must be accessible to probe
and couplant. Skill and training required is more
extensive than other technique.
Surface finish and roughness can in-terfere with inspec-
tion. Thin parts may be difficult to inspect. Linear defects ori-
ented parallel to the sound beam can go
undetected. Reference stand-
ards are often needed.
Only conductive ma-terials can be in-
spected. Ferromagnetic mate-rials require special
treatment to address magnetic permeabil-
ity. Depth of penetration
is limited. Flaws that lie parallel
to the inspection probe coil winding
direction can go un-detected.
Skill and training required is more
extensive than other techniques.
Surface finish and roughness may inter-
fere. Reference standards are needed for set-
up.
Extensive operator training and skill re-
quired. Access to both sides
of the structure is usually required. Orientation of the radiation beam to
non-volumetric de-fects is critical.
Field inspection of thick section can be
time consuming. Relatively expensive
equipment invest-ment is required. Possible radiation
hazard for personnel.
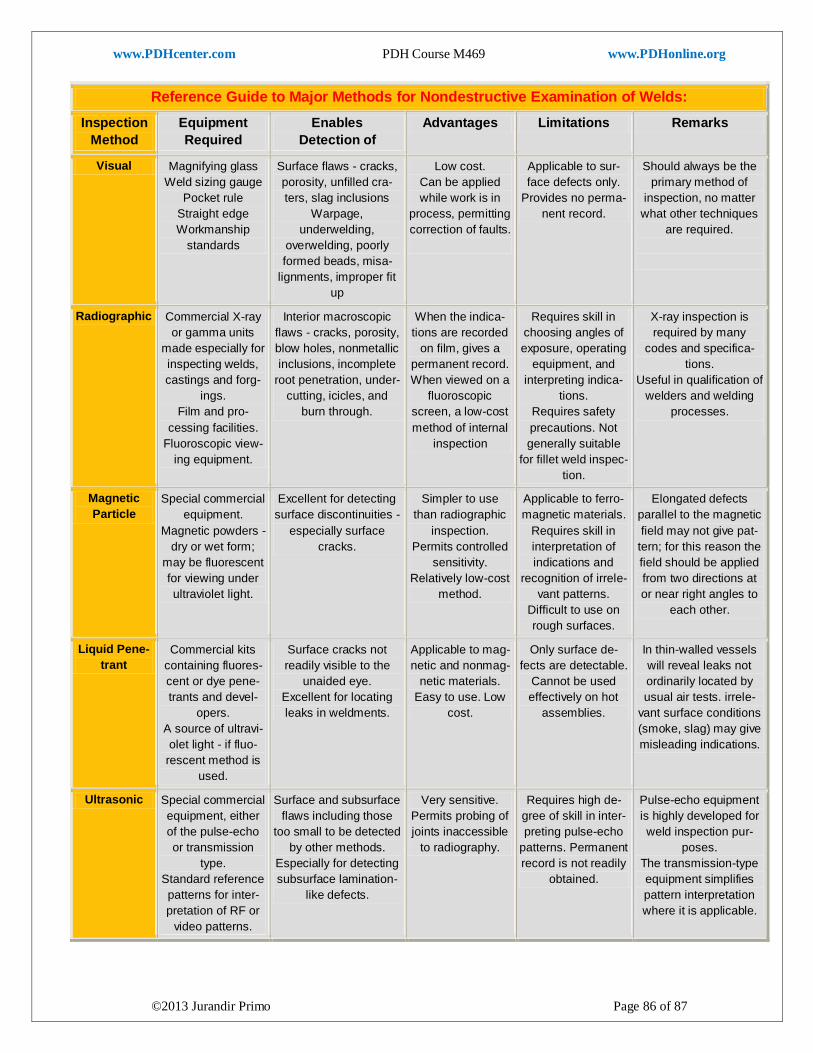
www.PDHcenter.com PDH Course M469 www.PDHonline.org
©2013 Jurandir Primo Page 86 of 87
Reference Guide to Major Methods for Nondestructive Examination of Welds:
Inspection
Method
Equipment
Required
Enables
Detection of
Advantages Limitations Remarks
Visual Magnifying glass
Weld sizing gauge
Pocket rule
Straight edge
Workmanship
standards
Surface flaws - cracks,
porosity, unfilled cra-
ters, slag inclusions
Warpage,
underwelding,
overwelding, poorly
formed beads, misa-
lignments, improper fit
up
Low cost.
Can be applied
while work is in
process, permitting
correction of faults.
Applicable to sur-
face defects only.
Provides no perma-
nent record.
Should always be the
primary method of
inspection, no matter
what other techniques
are required.
Radiographic Commercial X-ray
or gamma units
made especially for
inspecting welds,
castings and forg-
ings.
Film and pro-
cessing facilities.
Fluoroscopic view-
ing equipment.
Interior macroscopic
flaws - cracks, porosity,
blow holes, nonmetallic
inclusions, incomplete
root penetration, under-
cutting, icicles, and
burn through.
When the indica-
tions are recorded
on film, gives a
permanent record.
When viewed on a
fluoroscopic
screen, a low-cost
method of internal
inspection
Requires skill in
choosing angles of
exposure, operating
equipment, and
interpreting indica-
tions.
Requires safety
precautions. Not
generally suitable
for fillet weld inspec-
tion.
X-ray inspection is
required by many
codes and specifica-
tions.
Useful in qualification of
welders and welding
processes.
Magnetic
Particle
Special commercial
equipment.
Magnetic powders -
dry or wet form;
may be fluorescent
for viewing under
ultraviolet light.
Excellent for detecting
surface discontinuities -
especially surface
cracks.
Simpler to use
than radiographic
inspection.
Permits controlled
sensitivity.
Relatively low-cost
method.
Applicable to ferro-
magnetic materials.
Requires skill in
interpretation of
indications and
recognition of irrele-
vant patterns.
Difficult to use on
rough surfaces.
Elongated defects
parallel to the magnetic
field may not give pat-
tern; for this reason the
field should be applied
from two directions at
or near right angles to
each other.
Liquid Pene-
trant
Commercial kits
containing fluores-
cent or dye pene-
trants and devel-
opers.
A source of ultravi-
olet light - if fluo-
rescent method is
used.
Surface cracks not
readily visible to the
unaided eye.
Excellent for locating
leaks in weldments.
Applicable to mag-
netic and nonmag-
netic materials.
Easy to use. Low
cost.
Only surface de-
fects are detectable.
Cannot be used
effectively on hot
assemblies.
In thin-walled vessels
will reveal leaks not
ordinarily located by
usual air tests. irrele-
vant surface conditions
(smoke, slag) may give
misleading indications.
Ultrasonic Special commercial
equipment, either
of the pulse-echo
or transmission
type.
Standard reference
patterns for inter-
pretation of RF or
video patterns.
Surface and subsurface
flaws including those
too small to be detected
by other methods.
Especially for detecting
subsurface lamination-
like defects.
Very sensitive.
Permits probing of
joints inaccessible
to radiography.
Requires high de-
gree of skill in inter-
preting pulse-echo
patterns. Permanent
record is not readily
obtained.
Pulse-echo equipment
is highly developed for
weld inspection pur-
poses.
The transmission-type
equipment simplifies
pattern interpretation
where it is applicable.

www.PDHcenter.com PDH Course M469 www.PDHonline.org
©2013 Jurandir Primo Page 87 of 87
26. Choices for Quality Control:
A good NDE inspection program must recognize the inherent limitations of each process. For example, both radiography and ultrasound have distinct orientation factors that may guide the choice of which pro-cess to use for a particular job.
Whatever inspection techniques are used, paying attention to the "Five P's" of weld quality will help re-duce subsequent inspection to a routine checking activity. Then, the proper use of NDE methods will serve as a check to keep variables in line and weld quality within standards.
The Five P's are:
1. Process Selection. The process must be right for the job. 2. Preparation. The joint configuration must be right and
compatible with the welding process. 3. Procedures. The procedures must be spelled out in detail
and followed religiously during welding. 4. Pretesting. Full-scale mockups or simulated specimens
should be used to prove that the process and procedures give the desired standard of quality.
5. Personnel. Qualified people must be assigned to the job.
Staff personnel involved in activities with X-rays and Gamma must be very well trained and qualified (radio protection). The company shall be responsible for the facilities and the personnel involved with the activi-ties with radiation. The operator and personnel involved with radiography should carry during the activities:
Monitor/individual alarm
Dosimeter Pen
Periodic medical examinations.
The facilities must receive the design of future plants for the use of X-Rays or Gamma radiation sources, as well as a plan of radiation protection. The facilities will only be approved for operation after a careful project evaluation. Among the items required for the operation of a laboratory for testing by x-ray are:
Monitoring and classification of shielding walls;
Insulation areas of signaling;
Switches doors inside the room (to stop irradiation in case of emergency);
Interlock on the doors (interrupts the irradiation if the port is open) area;
Monitors radiation meters (sound);
Signaling for radiation protection plan. References: http://www.ndt-ed.org http://www.inspection-for-industry.com http://www.ndt.net http://ndttestquestions.com https://www.asnt.org http://nondestructivetestingcertification.com