communication in the aftermath of the boston marathon …330082/... · communication in the...
TRANSCRIPT
Communication in the aftermath of the Boston Marathon Bombing
David Lazer
Ryan Kennedy
Drew Margolin
August 16, 2013
132 Nightingale Hall
Northeastern University
Boston, Massachusetts 02115
Northeastern study examines responses to Boston Marathon bombing
Executive Summary:
Researchers at Northeastern University conducted a survey June 27 to July 5, 2013 to see how people found out about the Boston Marathon bombing, how they attempted to get information about those they feared were physically affected by the bombing, and where they heard incorrect information about the situation. Notable findings include:
• Television is still the dominant means of finding out about the emergency, with about 47% of respondents finding out about the bombings through this medium. Cell phones and electronic media, however, are rapidly increasing in popularity. During the 9/11 attacks only about 5% of respondents reported receiving information from cell phones, computers or tablets. Nearly 30% reported using these media after the Boston Marathon bombing. Learning of the event via cell phone went from about 2% after 9/11 to almost 10% after the Marathon bombing.
• Respondents closer to the emergency event were more likely to find out from their cell phones. Younger people were also much more likely to find out information from their cell phones. Of those who learned of the situation by cell phone, 52% were under age 40 and 94% were under 60. Interestingly, African Americans are less affected by this trend than other groups. They were almost 12% more likely to learn about the events through TV than other groups, and were 14% less likely than other groups to learn from a cell phone, computer, or tablet.
• Cell phones are the dominant means for gathering information about people about whom respondents were concerned might have been physically affected. Those further from the incident were more likely to use e-mail or Facebook, while people within Boston tended to prefer texting over calling.
• Television was also the primary means by which people heard false information (e.g. the JFK Library had been bombed) in the wake of the bombing. Those closer to the bombing were more likely to hear false information from face-to-face contact, but they were also the most likely to subsequently hear that the rumor was false. For example, 48% of residents of Massachusetts heard that there was no bombing of the JFK Library, while only 24% of people from other states heard that this rumor was false.
• People in Massachusetts responded much more emotionally than residents of other states. For example, 60% of Massachusetts residents reported being “very angry” and 51% reported being “very frightened” or “somewhat frightened,” versus 45% and 28% for the rest of the country.
A second report will be issued in the Fall based on data collected from smartphones. Volunteers with Android phones are still being sought to take survey on their phone usage during the week of the Marathon bombing.
People can volunteer for the study at VolunteerScience.com.
Introduction:
On April 15, two bombs exploded near the finish line of the Boston Marathon. This report addresses a number of questions that were raised about the flow of information related to the attack. From which sources do people learn about terrorist attacks? Who do they call when an attack occurs? How do they get information about friends and loved ones physically affected by the attack? And how do rumors spread in the wake of tragedy?
As part of our ongoing research on the way that people use communication technology and social networks to respond to disasters, researchers at Northeastern University have collected several datasets related to the bombings at the Boston Marathon. Highlighted below are analyses from a national and local survey in which people were asked to recall their use of communication technology in response to the bombings. The survey was conducted by YouGov, from June 27 to July 5, 2013, and collected responses from 1,000 people with 500 of those respondents from Massachusetts, and 500 from a representative national sample. The following pages summarize the findings of an initial analysis from the data.
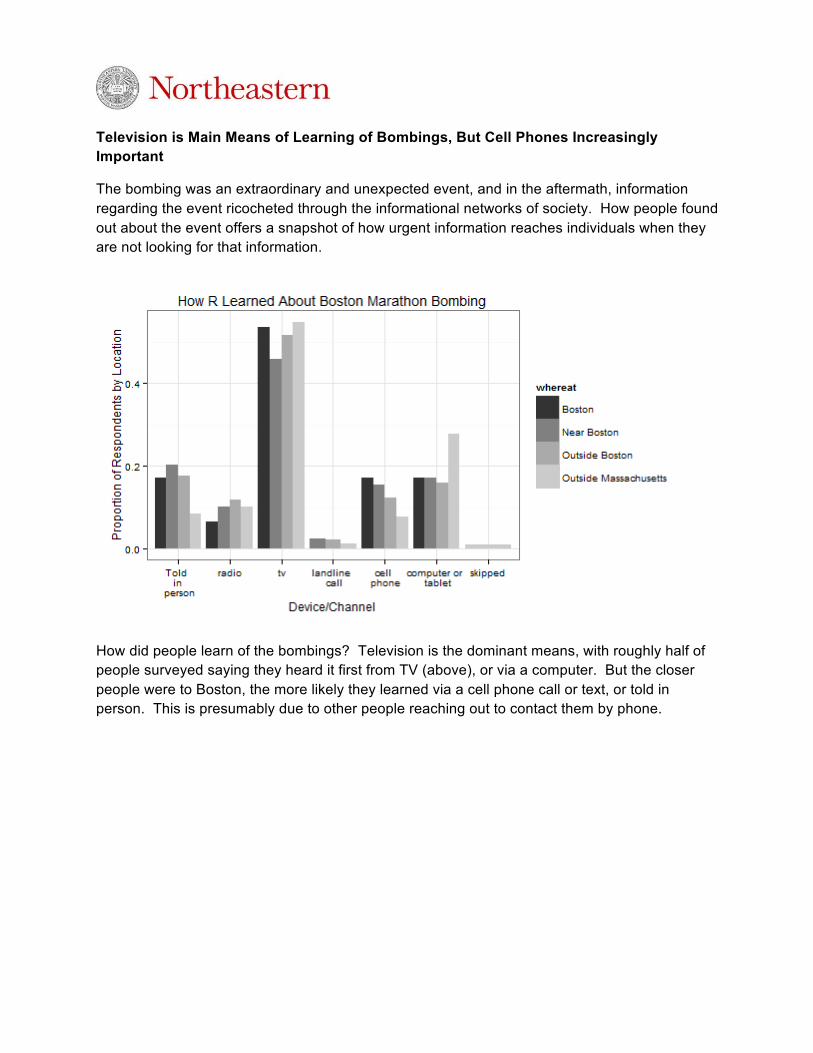
Television is Main Means of Learning of Bombings, But Cell Phones Increasingly Important
The bombing was an extraordinary and unexpected event, and in the aftermath, information regarding the event ricocheted through the informational networks of society. How people found out about the event offers a snapshot of how urgent information reaches individuals when they are not looking for that information.
How did people learn of the bombings? Television is the dominant means, with roughly half of people surveyed saying they heard it first from TV (above), or via a computer. But the closer people were to Boston, the more likely they learned via a cell phone call or text, or told in person. This is presumably due to other people reaching out to contact them by phone.
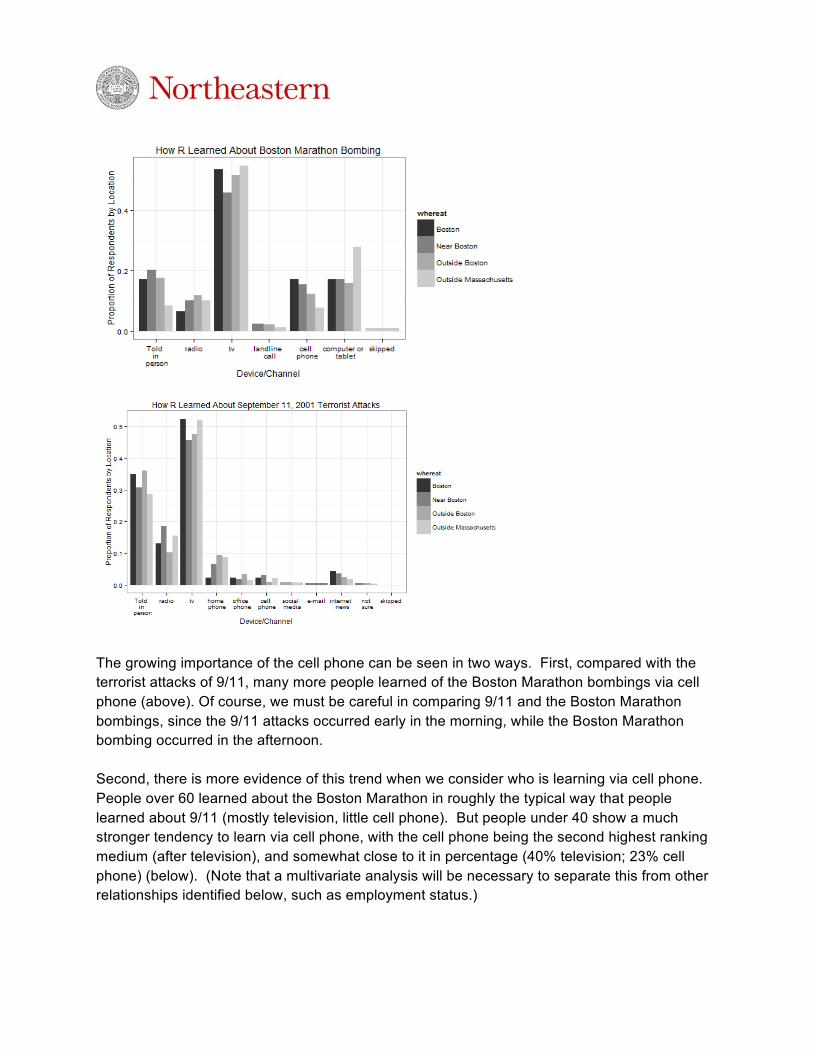
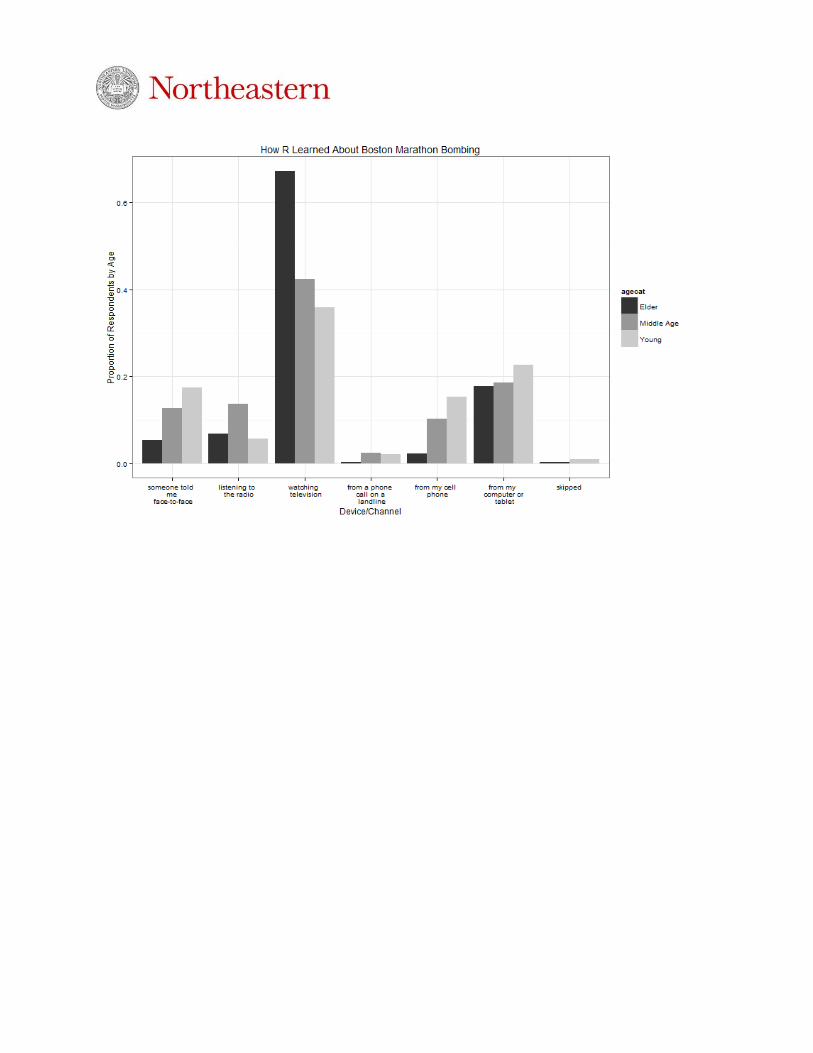
The growing importance of the cell phone can be seen in two ways. First, compared with the terrorist attacks of 9/11, many more people learned of the Boston Marathon bombings via cell phone (above). Of course, we must be careful in comparing 9/11 and the Boston Marathon bombings, since the 9/11 attacks occurred early in the morning, while the Boston Marathon bombing occurred in the afternoon. Second, there is more evidence of this trend when we consider who is learning via cell phone. People over 60 learned about the Boston Marathon in roughly the typical way that people learned about 9/11 (mostly television, little cell phone). But people under 40 show a much stronger tendency to learn via cell phone, with the cell phone being the second highest ranking medium (after television), and somewhat close to it in percentage (40% television; 23% cell phone) (below). (Note that a multivariate analysis will be necessary to separate this from other relationships identified below, such as employment status.)
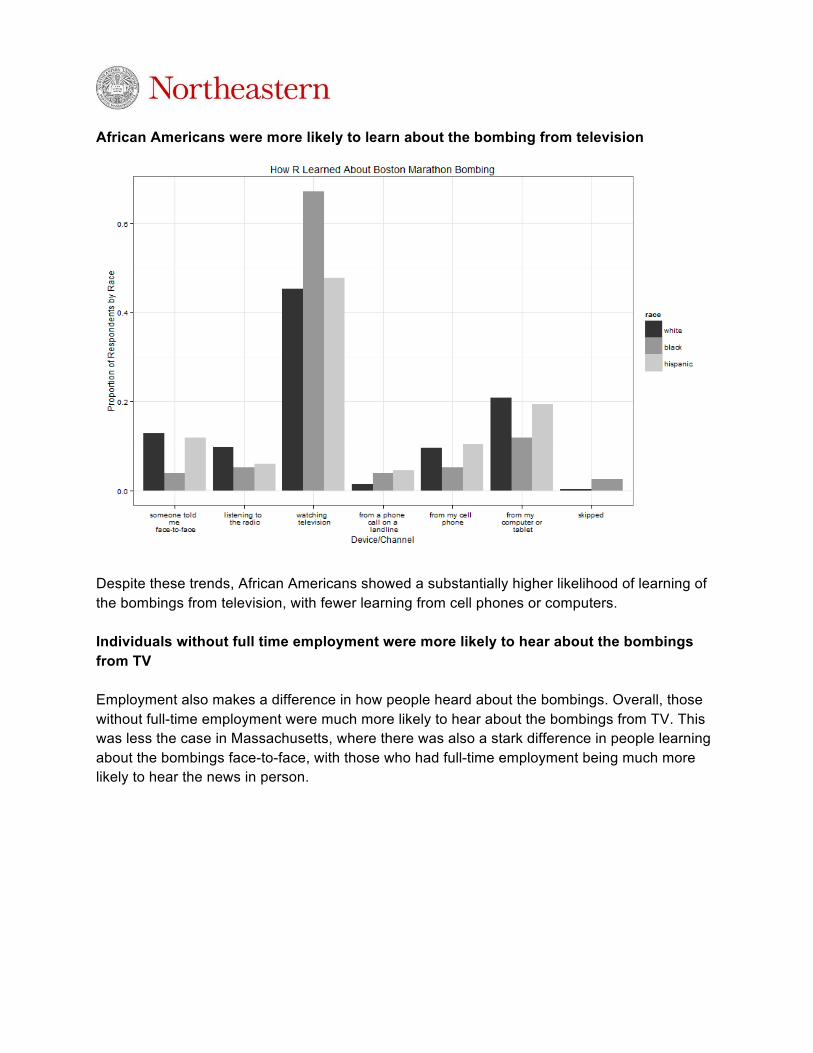
African Americans were more likely to learn about the bombing from television
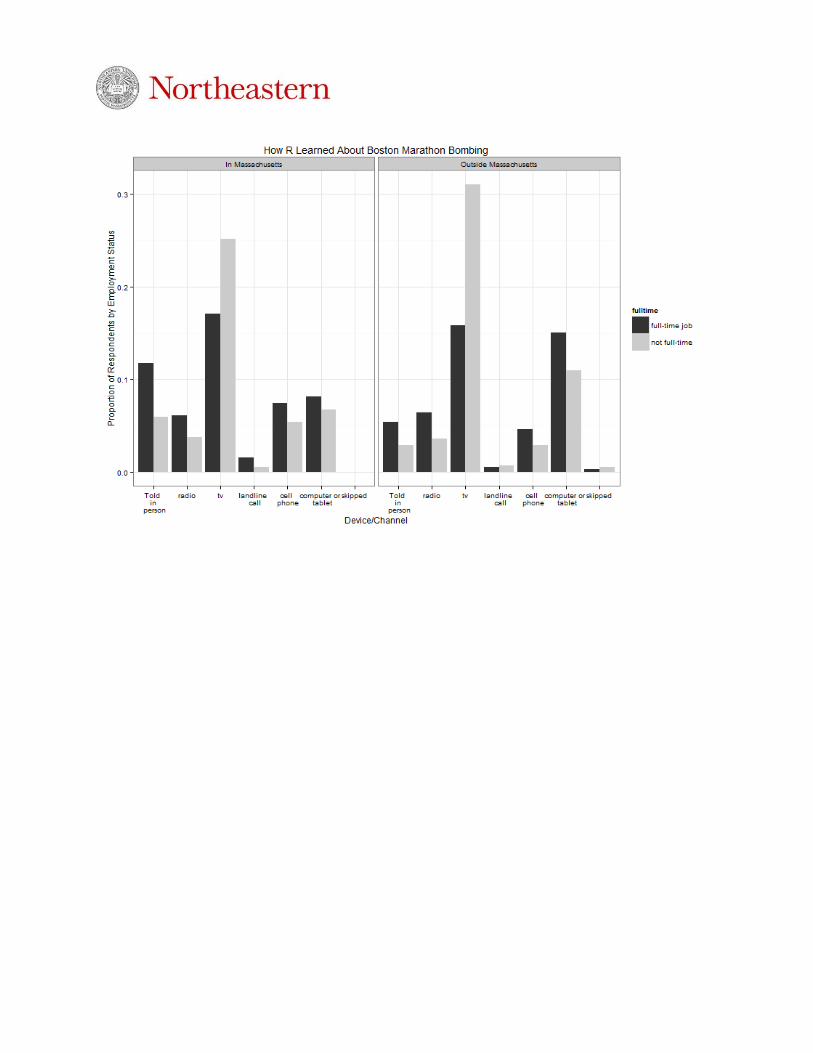
Despite these trends, African Americans showed a substantially higher likelihood of learning of the bombings from television, with fewer learning from cell phones or computers. Individuals without full time employment were more likely to hear about the bombings from TV Employment also makes a difference in how people heard about the bombings. Overall, those without full-time employment were much more likely to hear about the bombings from TV. This was less the case in Massachusetts, where there was also a stark difference in people learning about the bombings face-to-face, with those who had full-time employment being much more likely to hear the news in person.
People Turn to Personal Networks for Information
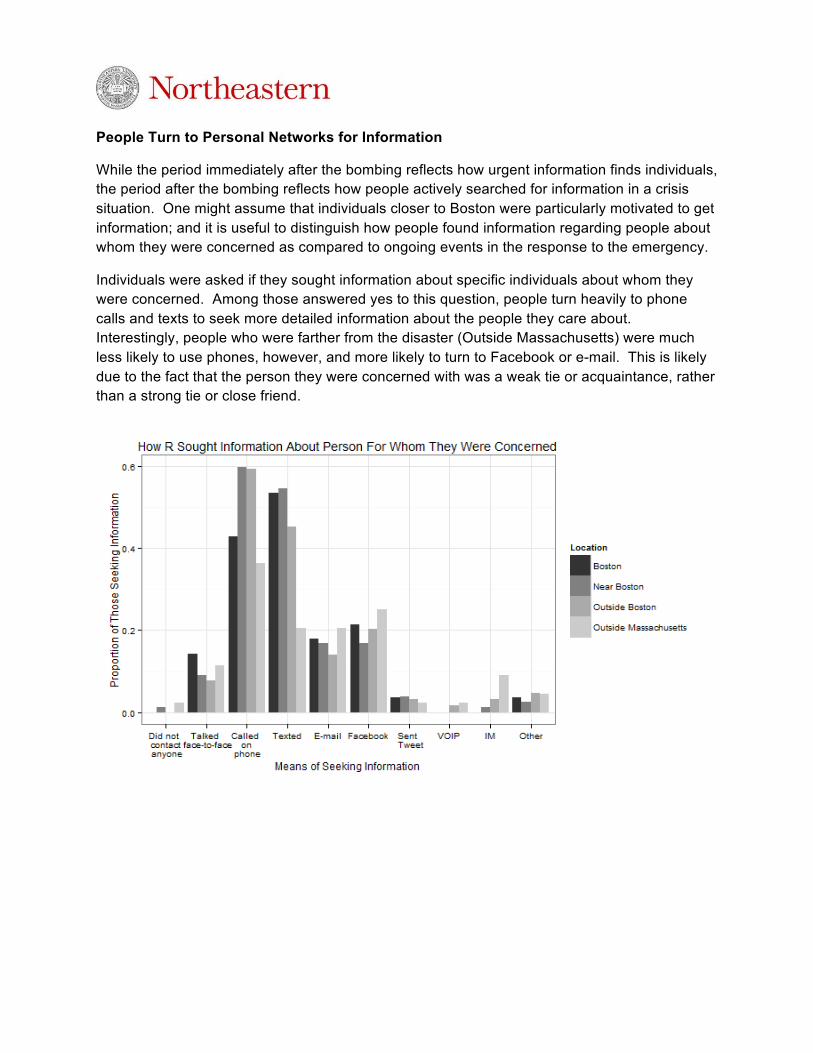
While the period immediately after the bombing reflects how urgent information finds individuals, the period after the bombing reflects how people actively searched for information in a crisis situation. One might assume that individuals closer to Boston were particularly motivated to get information; and it is useful to distinguish how people found information regarding people about whom they were concerned as compared to ongoing events in the response to the emergency.
Individuals were asked if they sought information about specific individuals about whom they were concerned. Among those answered yes to this question, people turn heavily to phone calls and texts to seek more detailed information about the people they care about. Interestingly, people who were farther from the disaster (Outside Massachusetts) were much less likely to use phones, however, and more likely to turn to Facebook or e-mail. This is likely due to the fact that the person they were concerned with was a weak tie or acquaintance, rather than a strong tie or close friend.
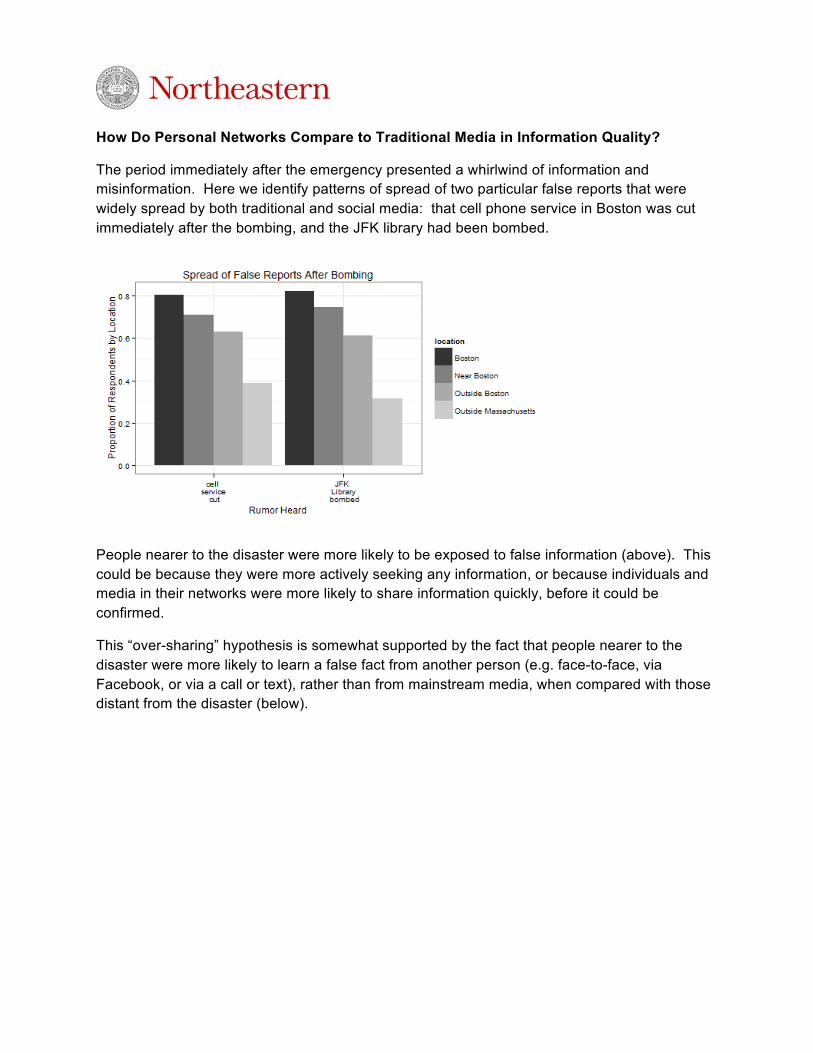
How Do Personal Networks Compare to Traditional Media in Information Quality?
The period immediately after the emergency presented a whirlwind of information and misinformation. Here we identify patterns of spread of two particular false reports that were widely spread by both traditional and social media: that cell phone service in Boston was cut immediately after the bombing, and the JFK library had been bombed.
People nearer to the disaster were more likely to be exposed to false information (above). This could be because they were more actively seeking any information, or because individuals and media in their networks were more likely to share information quickly, before it could be confirmed.
This “over-sharing” hypothesis is somewhat supported by the fact that people nearer to the disaster were more likely to learn a false fact from another person (e.g. face-to-face, via Facebook, or via a call or text), rather than from mainstream media, when compared with those distant from the disaster (below).
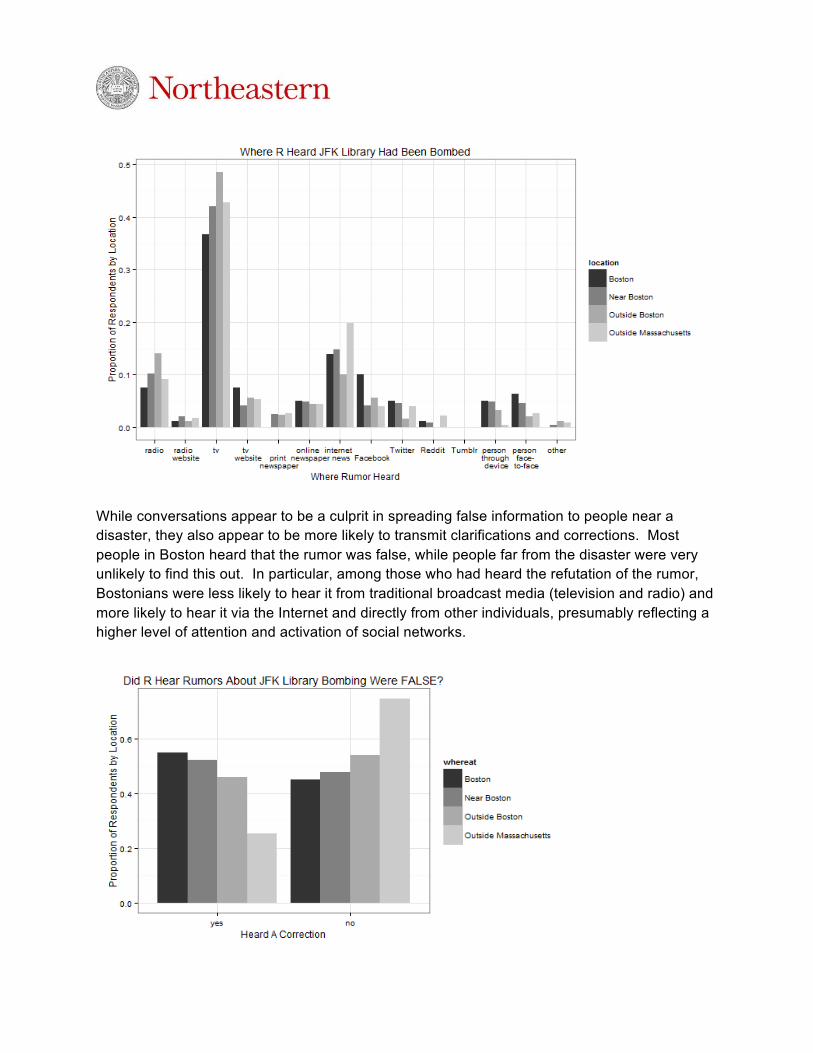
While conversations appear to be a culprit in spreading false information to people near a disaster, they also appear to be more likely to transmit clarifications and corrections. Most people in Boston heard that the rumor was false, while people far from the disaster were very unlikely to find this out. In particular, among those who had heard the refutation of the rumor, Bostonians were less likely to hear it from traditional broadcast media (television and radio) and more likely to hear it via the Internet and directly from other individuals, presumably reflecting a higher level of attention and activation of social networks.
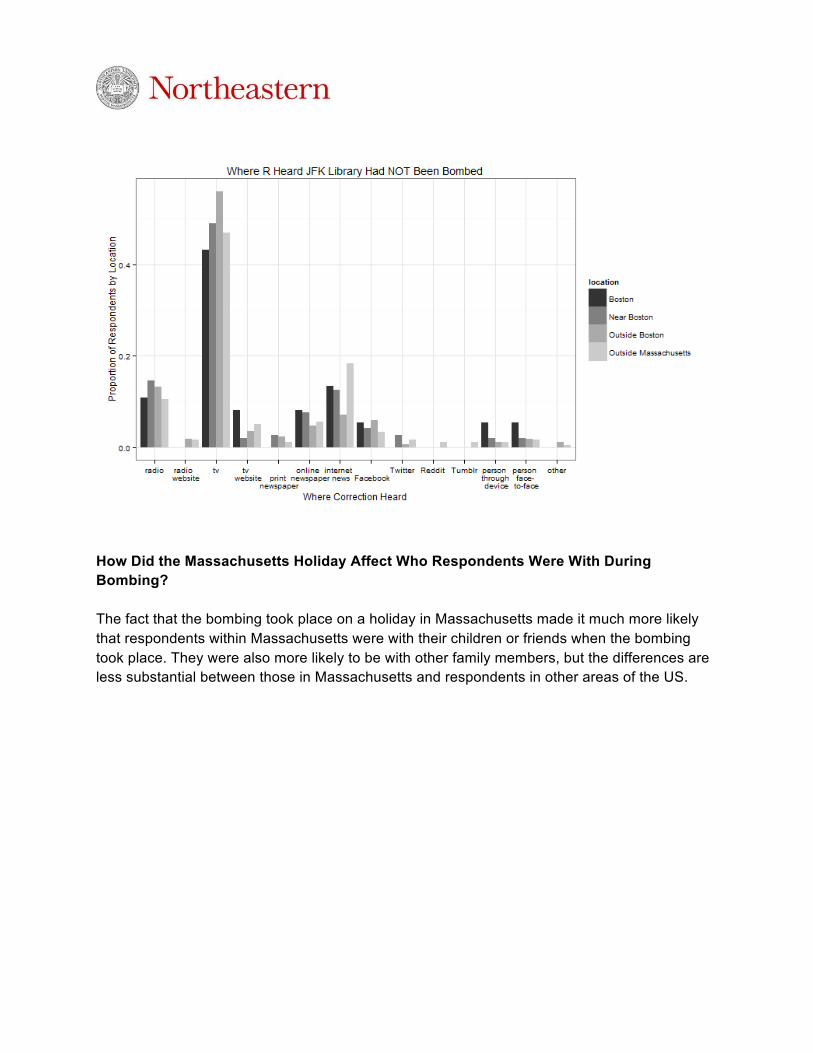
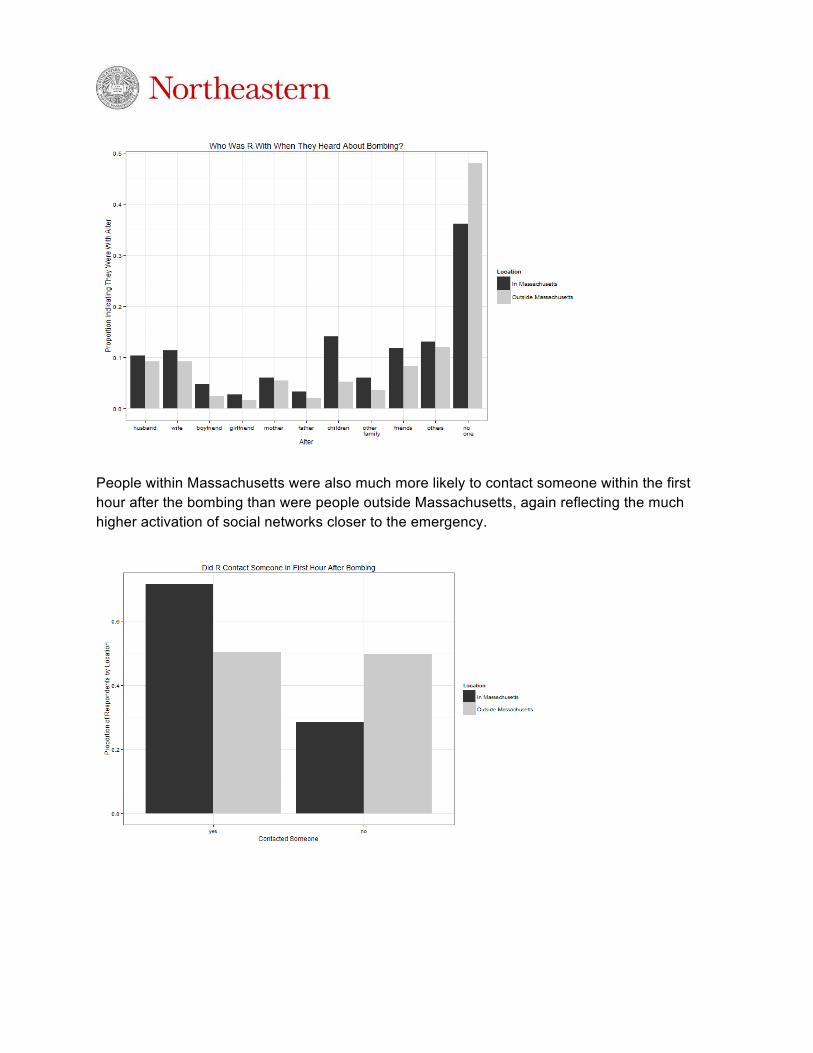
How Did the Massachusetts Holiday Affect Who Respondents Were With During Bombing? The fact that the bombing took place on a holiday in Massachusetts made it much more likely that respondents within Massachusetts were with their children or friends when the bombing took place. They were also more likely to be with other family members, but the differences are less substantial between those in Massachusetts and respondents in other areas of the US.
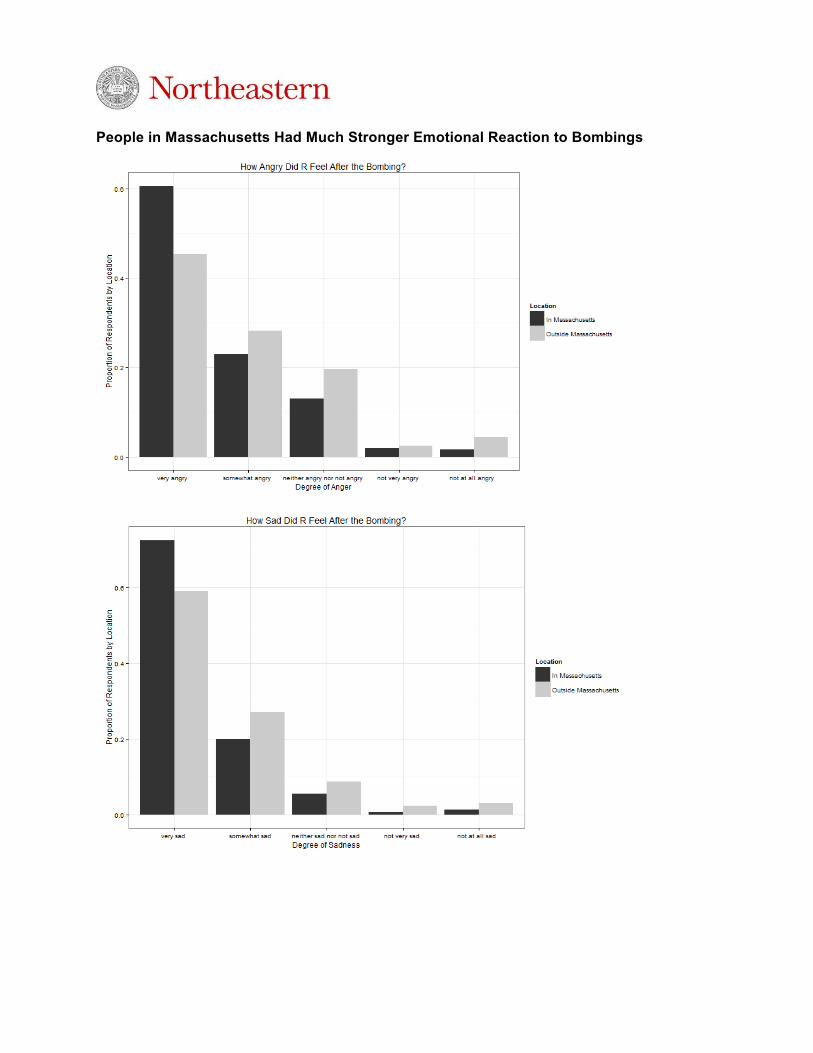
People within Massachusetts were also much more likely to contact someone within the first hour after the bombing than were people outside Massachusetts, again reflecting the much higher activation of social networks closer to the emergency.
People in Massachusetts Had Much Stronger Emotional Reaction to Bombings
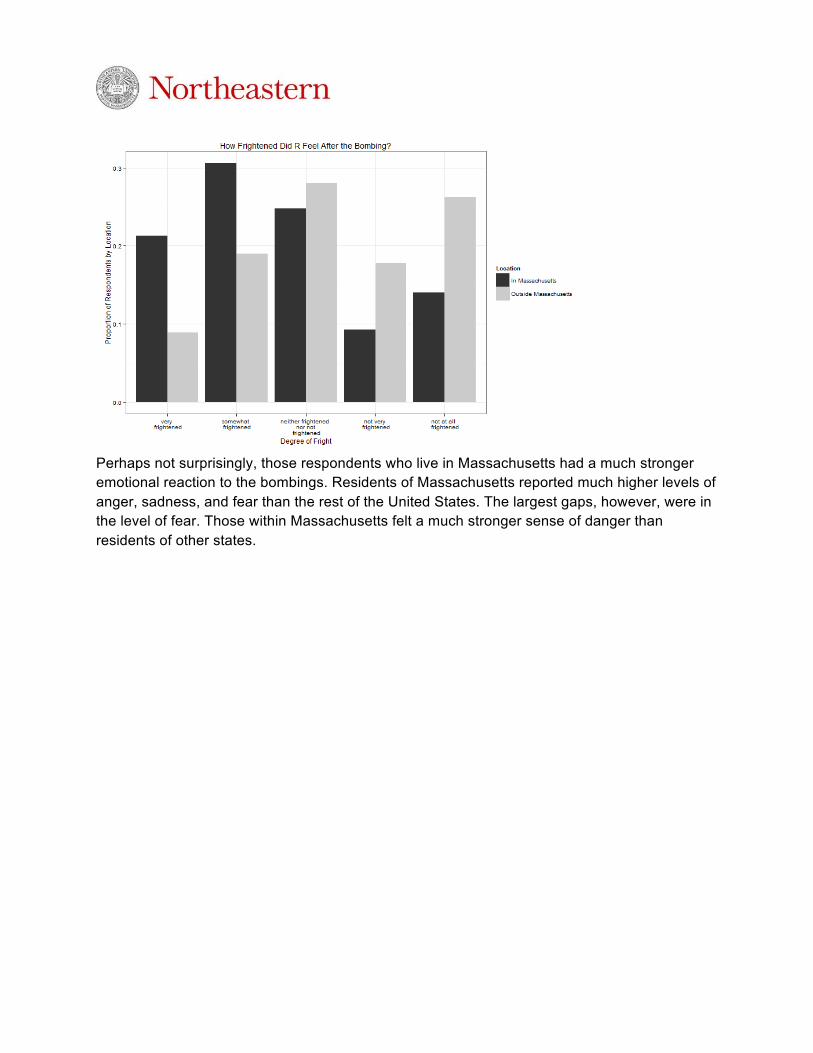
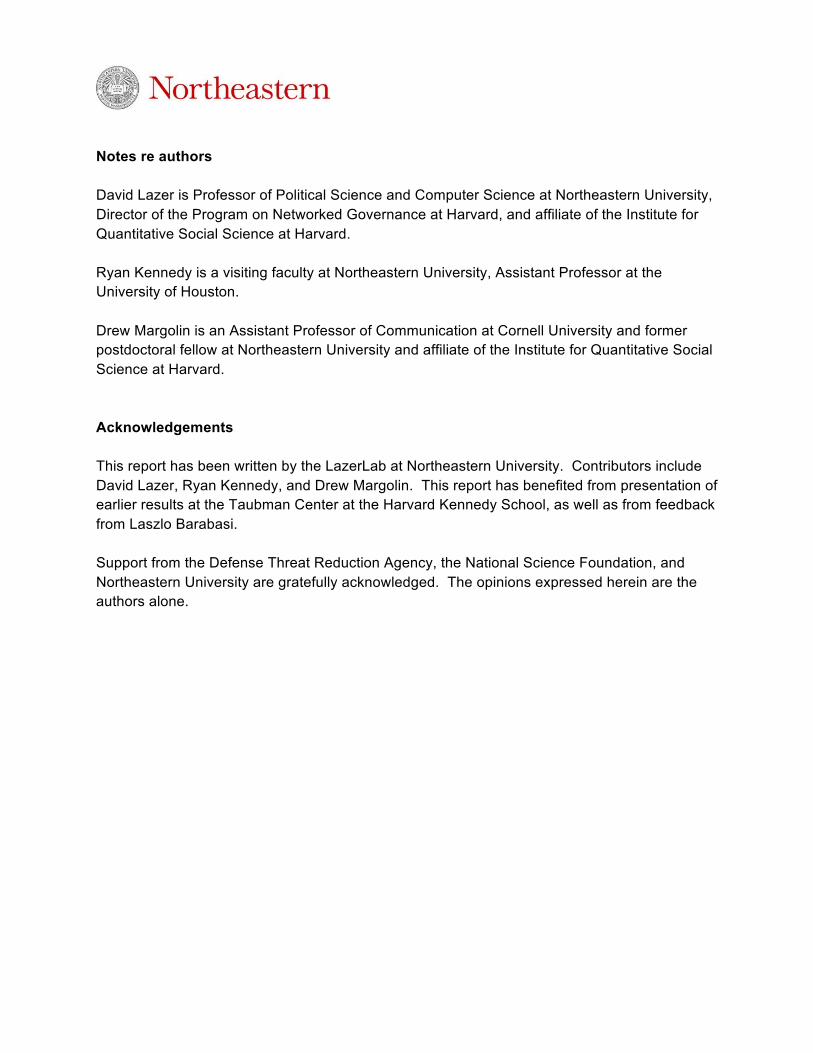
Perhaps not surprisingly, those respondents who live in Massachusetts had a much stronger emotional reaction to the bombings. Residents of Massachusetts reported much higher levels of anger, sadness, and fear than the rest of the United States. The largest gaps, however, were in the level of fear. Those within Massachusetts felt a much stronger sense of danger than residents of other states.
Notes re authors David Lazer is Professor of Political Science and Computer Science at Northeastern University, Director of the Program on Networked Governance at Harvard, and affiliate of the Institute for Quantitative Social Science at Harvard. Ryan Kennedy is a visiting faculty at Northeastern University, Assistant Professor at the University of Houston. Drew Margolin is an Assistant Professor of Communication at Cornell University and former postdoctoral fellow at Northeastern University and affiliate of the Institute for Quantitative Social Science at Harvard. Acknowledgements This report has been written by the LazerLab at Northeastern University. Contributors include David Lazer, Ryan Kennedy, and Drew Margolin. This report has benefited from presentation of earlier results at the Taubman Center at the Harvard Kennedy School, as well as from feedback from Laszlo Barabasi. Support from the Defense Threat Reduction Agency, the National Science Foundation, and Northeastern University are gratefully acknowledged. The opinions expressed herein are the authors alone.
Technical appendix The survey was conducted by YouGov from June 27 to July 5, 2013. YouGov interviewed 1,104 respondents who were then matched down to a sample of 1000 produce the final dataset. Subjects were recruited through web advertising campaigns, permission-based e-mail campaigns, partner sponsored solicitations, telephone-to-Web recruitment, and mail-to-web recruitment. The respondents were matched to a sampling frame on gender, age, race, education, party identification, ideology, and political interest. The frame was constructed by stratified sampling from the full 2010 ACS sample with selection within strata by weighted sampling with replacements (using the person weights on the public use file). Data on voter registration status and turnout were matched to this frame using the November 2008 Current Population Survey. Data on interest in politics and party identification were then matched to this frame from the 2007 Pew Religious Life survey.
The matched cases were weighted to the sampling frame using propensity scores. The matched cases and the frame were combined and a logistic regression was estimated for inclusion in the frame. The propensity score function included years of education, gender, race/ethnicity, news interest and ideology. The propensity scores were grouped into deciles of the estimated propensity score in the frame and post-stratified according to these deciles. Weights larger than 7 were trimmed and the final weights normalized to equal the sample size.
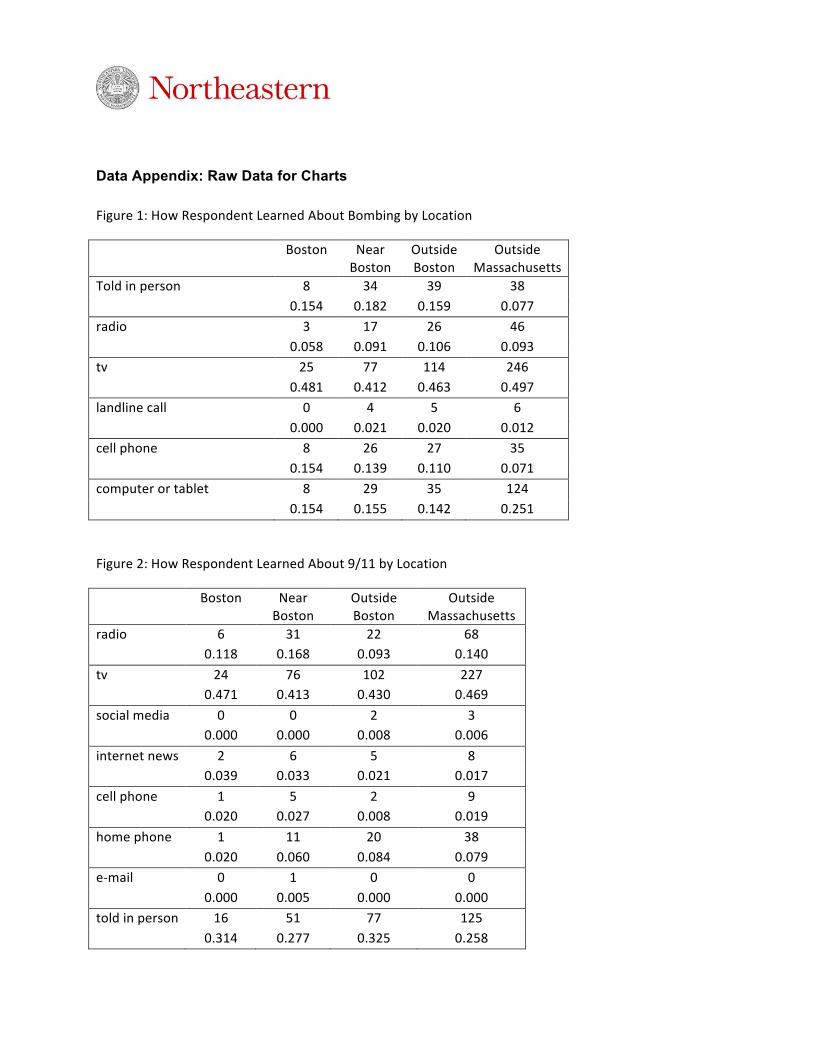
Data Appendix: Raw Data for Charts Figure 1: How Respondent Learned About Bombing by Location
Boston Near Boston
Outside Boston
Outside Massachusetts
Told in person 8 34 39 38 0.154 0.182 0.159 0.077 radio 3 17 26 46 0.058 0.091 0.106 0.093 tv 25 77 114 246 0.481 0.412 0.463 0.497 landline call 0 4 5 6 0.000 0.021 0.020 0.012 cell phone 8 26 27 35 0.154 0.139 0.110 0.071 computer or tablet 8 29 35 124 0.154 0.155 0.142 0.251
Figure 2: How Respondent Learned About 9/11 by Location
Boston Near Boston
Outside Boston
Outside Massachusetts
radio 6 31 22 68 0.118 0.168 0.093 0.140 tv 24 76 102 227 0.471 0.413 0.430 0.469 social media 0 0 2 3 0.000 0.000 0.008 0.006 internet news 2 6 5 8 0.039 0.033 0.021 0.017 cell phone 1 5 2 9 0.020 0.027 0.008 0.019 home phone 1 11 20 38 0.020 0.060 0.084 0.079 e-‐mail 0 1 0 0 0.000 0.005 0.000 0.000 told in person 16 51 77 125 0.314 0.277 0.325 0.258
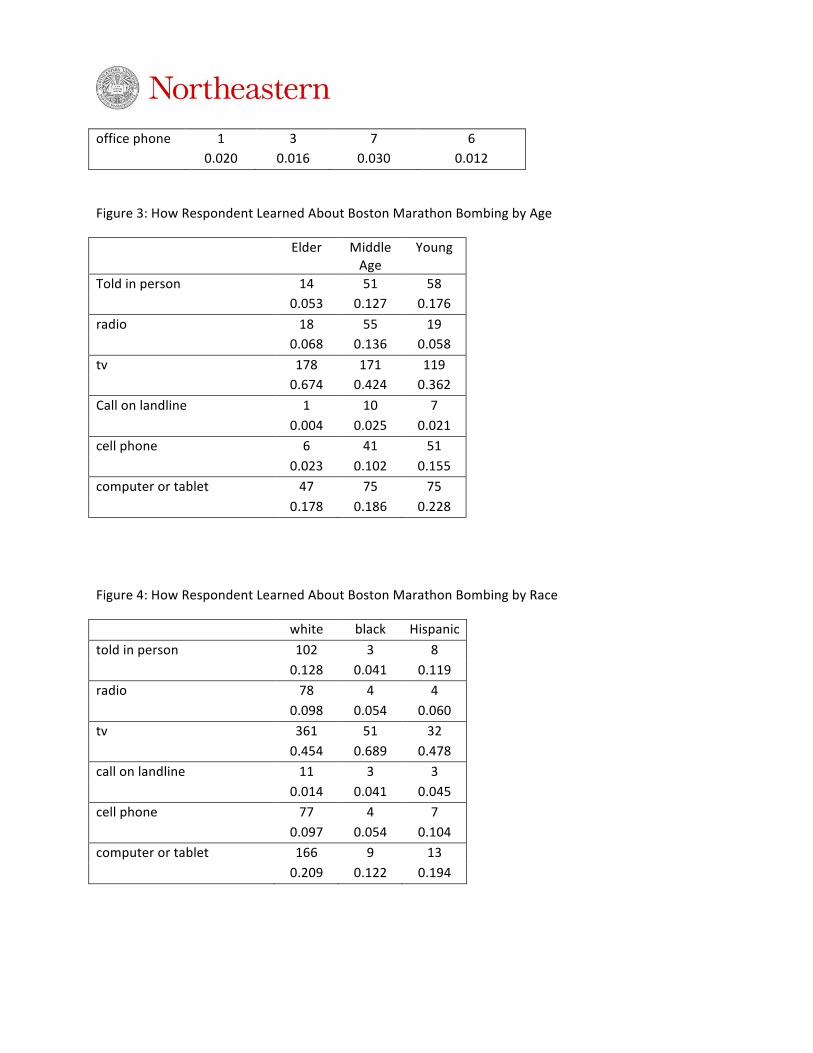
office phone 1 3 7 6 0.020 0.016 0.030 0.012
Figure 3: How Respondent Learned About Boston Marathon Bombing by Age
Elder Middle Age
Young
Told in person 14 51 58 0.053 0.127 0.176 radio 18 55 19 0.068 0.136 0.058 tv 178 171 119 0.674 0.424 0.362 Call on landline 1 10 7 0.004 0.025 0.021 cell phone 6 41 51 0.023 0.102 0.155 computer or tablet 47 75 75 0.178 0.186 0.228
Figure 4: How Respondent Learned About Boston Marathon Bombing by Race
white black Hispanic told in person 102 3 8 0.128 0.041 0.119 radio 78 4 4 0.098 0.054 0.060 tv 361 51 32 0.454 0.689 0.478 call on landline 11 3 3 0.014 0.041 0.045 cell phone 77 4 7 0.097 0.054 0.104 computer or tablet 166 9 13 0.209 0.122 0.194
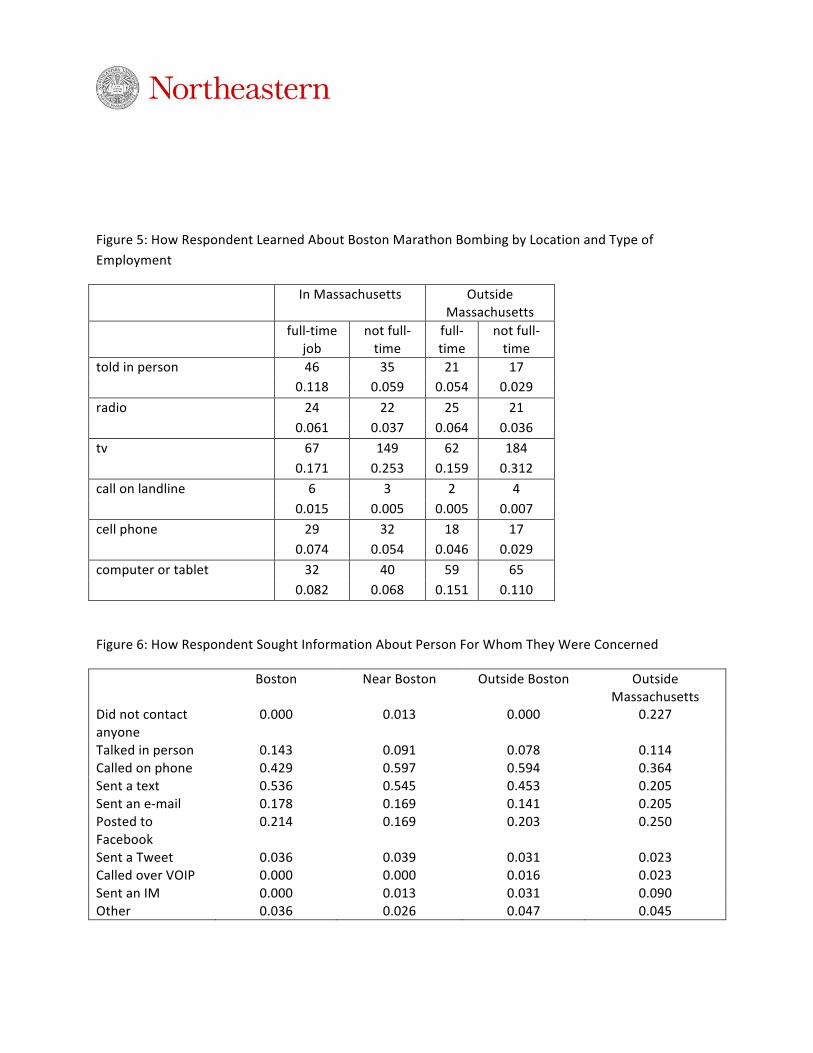
Figure 5: How Respondent Learned About Boston Marathon Bombing by Location and Type of Employment
In Massachusetts Outside Massachusetts
full-‐time job
not full-‐time
full-‐time
not full-‐time
told in person 46 35 21 17 0.118 0.059 0.054 0.029 radio 24 22 25 21 0.061 0.037 0.064 0.036 tv 67 149 62 184 0.171 0.253 0.159 0.312 call on landline 6 3 2 4 0.015 0.005 0.005 0.007 cell phone 29 32 18 17 0.074 0.054 0.046 0.029 computer or tablet 32 40 59 65 0.082 0.068 0.151 0.110
Figure 6: How Respondent Sought Information About Person For Whom They Were Concerned
Boston Near Boston Outside Boston Outside Massachusetts
Did not contact anyone
0.000 0.013 0.000 0.227
Talked in person 0.143 0.091 0.078 0.114 Called on phone 0.429 0.597 0.594 0.364 Sent a text 0.536 0.545 0.453 0.205 Sent an e-‐mail 0.178 0.169 0.141 0.205 Posted to Facebook
0.214 0.169 0.203 0.250
Sent a Tweet 0.036 0.039 0.031 0.023 Called over VOIP 0.000 0.000 0.016 0.023 Sent an IM 0.000 0.013 0.031 0.090 Other 0.036 0.026 0.047 0.045
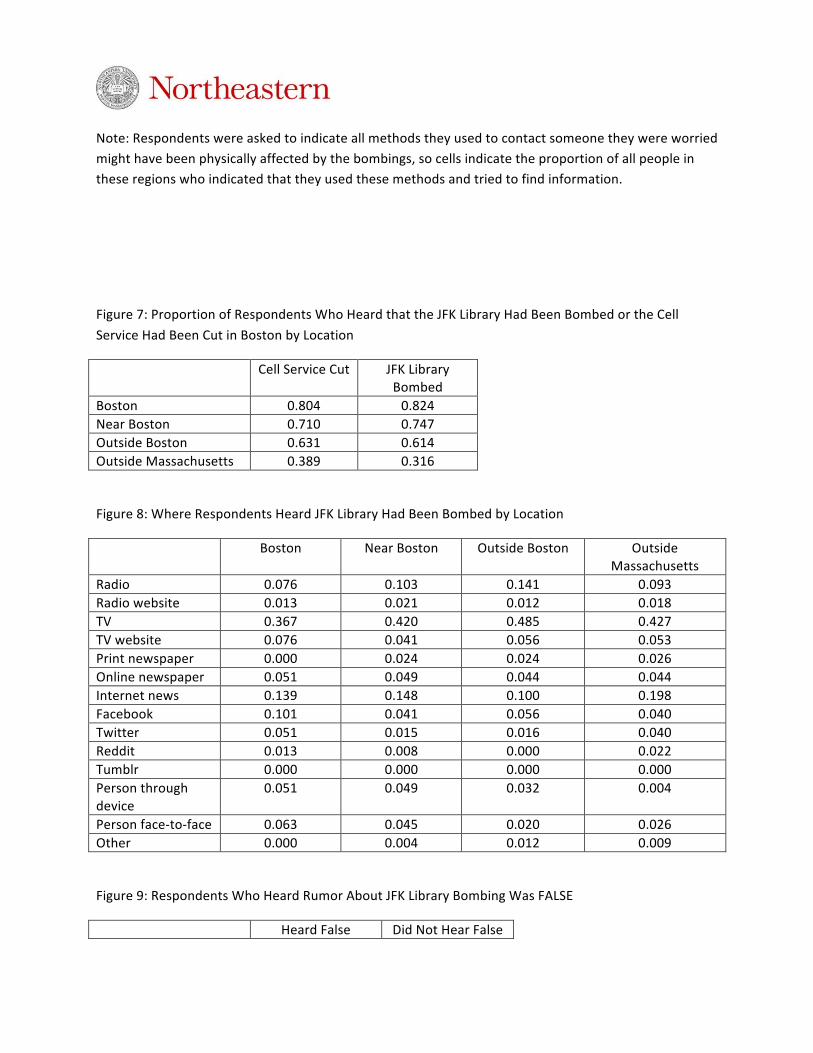
Note: Respondents were asked to indicate all methods they used to contact someone they were worried might have been physically affected by the bombings, so cells indicate the proportion of all people in these regions who indicated that they used these methods and tried to find information.
Figure 7: Proportion of Respondents Who Heard that the JFK Library Had Been Bombed or the Cell Service Had Been Cut in Boston by Location
Cell Service Cut JFK Library Bombed
Boston 0.804 0.824 Near Boston 0.710 0.747 Outside Boston 0.631 0.614 Outside Massachusetts 0.389 0.316
Figure 8: Where Respondents Heard JFK Library Had Been Bombed by Location
Boston Near Boston Outside Boston Outside Massachusetts
Radio 0.076 0.103 0.141 0.093 Radio website 0.013 0.021 0.012 0.018 TV 0.367 0.420 0.485 0.427 TV website 0.076 0.041 0.056 0.053 Print newspaper 0.000 0.024 0.024 0.026 Online newspaper 0.051 0.049 0.044 0.044 Internet news 0.139 0.148 0.100 0.198 Facebook 0.101 0.041 0.056 0.040 Twitter 0.051 0.015 0.016 0.040 Reddit 0.013 0.008 0.000 0.022 Tumblr 0.000 0.000 0.000 0.000 Person through device
0.051 0.049 0.032 0.004
Person face-‐to-‐face 0.063 0.045 0.020 0.026 Other 0.000 0.004 0.012 0.009
Figure 9: Respondents Who Heard Rumor About JFK Library Bombing Was FALSE
Heard False Did Not Hear False
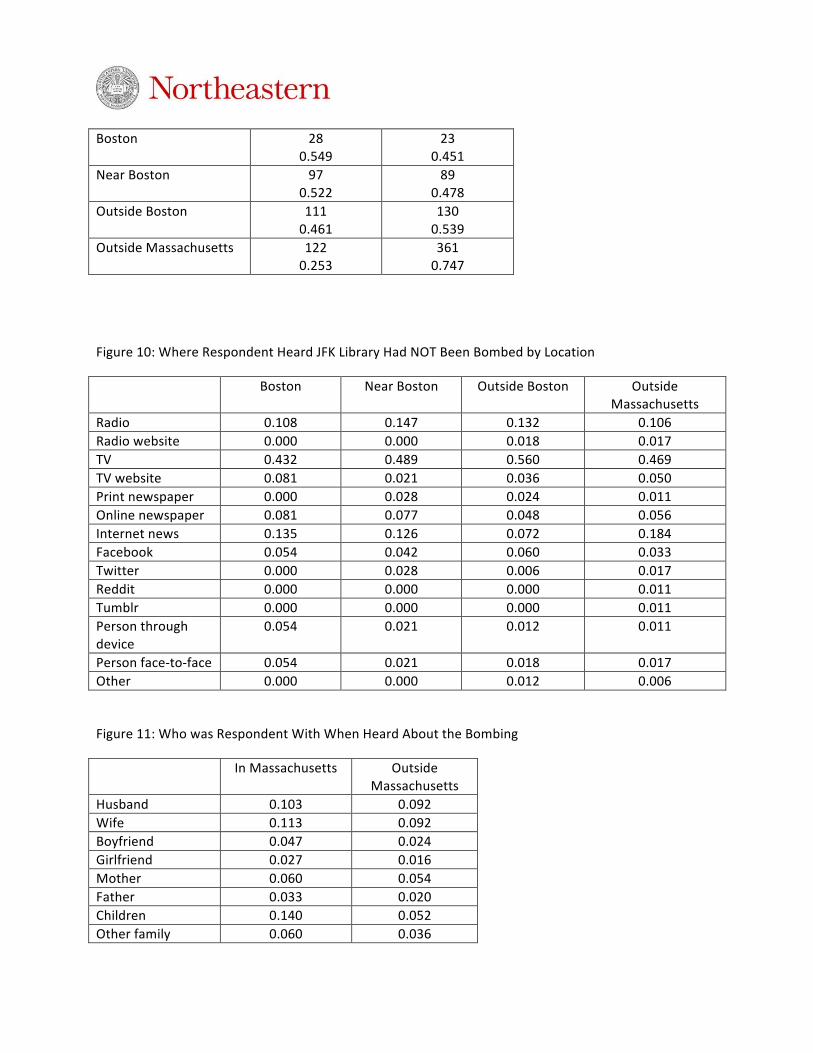
Boston 28
0.549 23
0.451 Near Boston 97
0.522 89
0.478 Outside Boston 111
0.461 130 0.539
Outside Massachusetts 122 0.253
361 0.747
Figure 10: Where Respondent Heard JFK Library Had NOT Been Bombed by Location
Boston Near Boston Outside Boston Outside Massachusetts
Radio 0.108 0.147 0.132 0.106 Radio website 0.000 0.000 0.018 0.017 TV 0.432 0.489 0.560 0.469 TV website 0.081 0.021 0.036 0.050 Print newspaper 0.000 0.028 0.024 0.011 Online newspaper 0.081 0.077 0.048 0.056 Internet news 0.135 0.126 0.072 0.184 Facebook 0.054 0.042 0.060 0.033 Twitter 0.000 0.028 0.006 0.017 Reddit 0.000 0.000 0.000 0.011 Tumblr 0.000 0.000 0.000 0.011 Person through device
0.054 0.021 0.012 0.011
Person face-‐to-‐face 0.054 0.021 0.018 0.017 Other 0.000 0.000 0.012 0.006
Figure 11: Who was Respondent With When Heard About the Bombing
In Massachusetts Outside Massachusetts
Husband 0.103 0.092 Wife 0.113 0.092 Boyfriend 0.047 0.024 Girlfriend 0.027 0.016 Mother 0.060 0.054 Father 0.033 0.020 Children 0.140 0.052 Other family 0.060 0.036
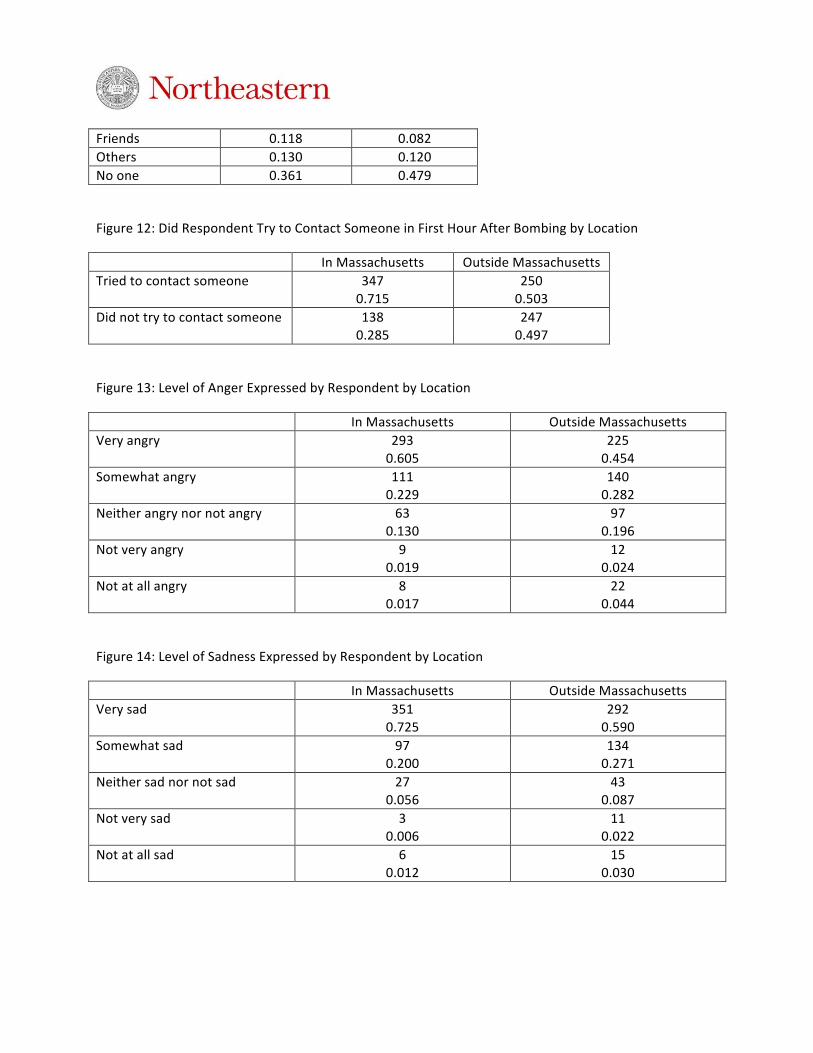
Friends 0.118 0.082 Others 0.130 0.120 No one 0.361 0.479
Figure 12: Did Respondent Try to Contact Someone in First Hour After Bombing by Location
In Massachusetts Outside Massachusetts Tried to contact someone 347
0.715 250 0.503
Did not try to contact someone 138 0.285
247 0.497
Figure 13: Level of Anger Expressed by Respondent by Location
In Massachusetts Outside Massachusetts Very angry 293
0.605 225 0.454
Somewhat angry 111 0.229
140 0.282
Neither angry nor not angry 63 0.130
97 0.196
Not very angry 9 0.019
12 0.024
Not at all angry 8 0.017
22 0.044
Figure 14: Level of Sadness Expressed by Respondent by Location
In Massachusetts Outside Massachusetts Very sad 351
0.725 292 0.590
Somewhat sad 97 0.200
134 0.271
Neither sad nor not sad 27 0.056
43 0.087
Not very sad 3 0.006
11 0.022
Not at all sad 6 0.012
15 0.030
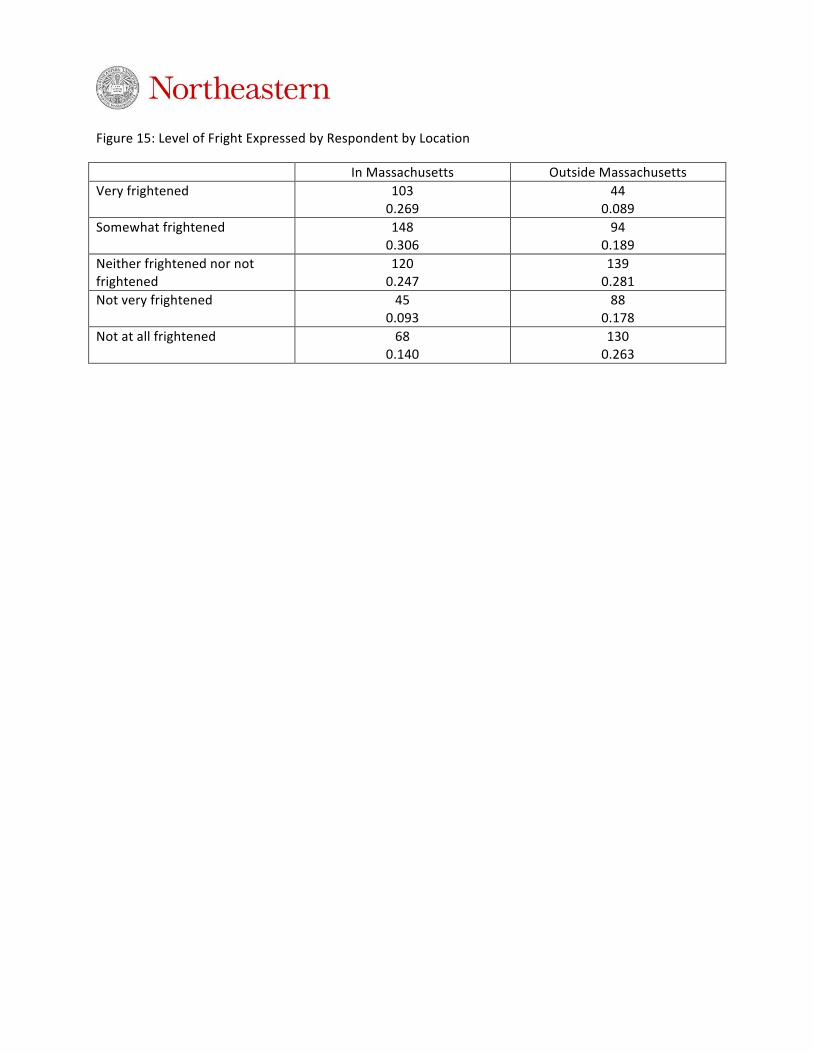
Figure 15: Level of Fright Expressed by Respondent by Location
In Massachusetts Outside Massachusetts Very frightened 103
0.269 44
0.089 Somewhat frightened 148
0.306 94
0.189 Neither frightened nor not frightened
120 0.247
139 0.281
Not very frightened 45 0.093
88 0.178
Not at all frightened 68 0.140
130 0.263