community attitudes towards renewable energy
TRANSCRIPT

Community Attitudes toRenewable Energy in NSW

The Office of Environment and Heritage (OEH) has compiled this document in good faith, exercising all due care and attention. No representation is made about the accuracy, completeness or suitability of the information in this publication for any particular purpose. OEH shall not be liable for any damage which may occur to any person or organisation taking action or not on the basis of this publication. Readers should seek appropriate advice when applying the information to their specific needs.
Published by:Office of Environment and Heritage59 Goulburn Street, Sydney NSW 2000PO Box A290, Sydney South NSW 1232Phone: (02) 9995 5000 (switchboard)Phone: 131 555 (environment information and publications requests)Phone: 1300 361 967 (national parks, general environmental enquiries, and publications requests)Fax: (02) 9995 5999TTY users: phone 133 677, then ask for 131 555Speak and listen users: phone 1300 555 727, then ask for 131 555Email: [email protected]: www.environment.nsw.gov.au
Report pollution and environmental incidentsEnvironment Line: 131 555 (NSW only) or [email protected] also www.environment.nsw.gov.au
ISBN 978 1 74359 041 9OEH 2015/0419November 2015

iii
Contents
List of tables iv
List of figures vi
Executive summary viii
1 Introduction 1
1.1 Background 1
1.2 Research purpose 1
1.3 Research methods 1
1.4 Statistical significance testing 2
2 Findings 3
2.1 Community awareness and knowledge of renewable energy technologies 3
2.2 Attitudes towards renewable energy technologies 10
2.3 Attitudes towards local wind and solar farms 24
3 Regional summaries 43
3.1 North East Region 43
3.2 Hunter/Central Coast Region 49
3.3 North West Region 55
3.4 South East Region 61
3.5 South West Region 67
3.6 Illawarra Region 73
3.7 Greater Sydney Region 77

iv
List of tables
Table 1.1: Region and number of people sampled for survey 1Table 2.1: Survey results showing regional variation in awareness/self-assessed
knowledge of renewable energy technologies 5Table 2.2: Survey results showing demographic variation in awareness/self-assessed
knowledge of renewable energy technologies 6Table 2.3: Exposure to wind turbines 8Table 2.4: Survey results showing regional variation in awareness/self-assessed
knowledge/exposure to wind and solar farms 8Table 2.5: Survey results showing demographic variation in awareness/self-assessed
knowledge/exposure to wind farms and solar farms 9Table 2.6: Survey results showing regional variation in overall support of renewable
energy and its expansion in NSW 11Table 2.7: Survey results showing demographic variation in overall support of renewable
energy and its expansion in NSW 12Table 2.8: Survey respondents’ reasons for the cost of renewable energy technologies
being both an advantage and a disadvantage. 15Table 2.9: Perceived advantages of using renewables (unprompted) provided by survey
respondents who supported or opposed renewable energy technologies 17Table 2.10: Perceived disadvantages of using renewables (unprompted) provided by
respondents who supported or opposed renewable energy technologies 18Table 2.11: Survey results showing regional variation in perceived advantages and
disadvantages of generating electricity from renewable sources (unprompted) 19Table 2.12: Survey results showing demographic variation in perceived advantages and
disadvantages of generating electricity from renewable sources (unprompted) 20Table 2.13: Personal cost as a mitigating factor on support for renewable energy
technologies – by region 21Table 2.14: Personal cost as a mitigating factor on support for renewable energy technologies –
by demographics 22Table 2.15: Support for building wind and solar farms in NSW – by region 23Table 2.16: Support for building wind and solar farms in NSW – by demographic 23Table 2.17: Regional variation in responses to building wind and solar farms in NSW,
in local region, and within 1–2 kilometres of residence 26Table 2.18: Demographic variation in responses to building wind and solar farms in
NSW, in local region, and within 1–2 kilometres of where they lived 28Table 2.19: Regional variation in reasons for supporting wind or solar farms within
1–2 kilometres of where they lived (unprompted) 32Table 2.20: Demographic variation in reasons for supporting a wind or solar farm
within 1–2 kilometres of residence (unprompted) 33Table 2.21: Regional variation in concerns of those opposed to a wind or solar farm
within 1–2 kilometres of where they lived (unprompted) 38Table 2.22: Demographic variation in concerns about a wind or solar farm within
1–2 kilometres of where they lived (unprompted) 39Table 2.23: Regional variation in perceived impact on local community of a wind
farm within 1–2 kilometres of residence (prompted) 42Table 2.24: Demographic variation in perceived impact on local community of a
wind farm within 1–2 kilometres of residence (prompted) 42

v
Table 3.1: Perceived advantages and disadvantages of using renewable energy technologies (unprompted) 46
Table 3.2: Reasons for supporting a wind/solar farm located within 1–2 kilometres of where a survey respondent lived (unprompted) 47
Table 3.3: Concerns about building a wind/solar farm within 1–2 kilometres of where survey respondents lived (unprompted) 48
Table 3.4: Perceived impact of wind farms on property value and visual appeal (prompted) 48Table 3.5: Level of concern about noise and health issues caused by wind farms (prompted) 48Table 3.6: Perceived advantages and disadvantages of using renewable energy
technologies (unprompted) 52Table 3.7: Reasons for supporting a wind/solar farm located within 1–2 kilometres
of where a survey respondent lived (unprompted) 53Table 3.8: Concerns about building a wind/solar farm within 1–2 kilometres
of where survey respondents lived (unprompted) 54Table 3.9: Perceived impact of wind farms on property value and visual appeal (prompted) 54Table 3.10: Level of concern about noise and health issues caused by wind farms (prompted) 54Table 3.11: Perceived advantages and disadvantages of using renewable energy
technologies (unprompted) 58Table 3.12: Reasons for supporting a wind/solar farm located within 1–2 kilometres of
where a survey respondent lived (unprompted). 59Table 3.13: Concerns about building a wind/solar farm within 1–2 kilometres of
where survey respondents lived (unprompted). 60Table 3.14: Perceived impact of wind farms on property value and visual appeal (prompted). 60Table 3.15: Level of concern about noise and health issues caused by wind farms (prompted). 60Table 3.16: Perceived advantages and disadvantages of using renewable energy technologies
(unprompted). 64Table 3.17: Reasons for supporting a wind/solar farm located within 1–2 kilometres
of where a survey respondent lived (unprompted) 65Table 3.18: Concerns about building a wind/solar farm within 1–2 kilometres
of where survey respondents lived (unprompted) 66Table 3.19: Perceived impact of wind farms on property value and visual appeal (prompted) 66Table 3.20: Level of concern about noise and health issues caused by wind farms (prompted) 66Table 3.21: Perceived advantages and disadvantages of using renewable energy technologies
(unprompted) 70Table 3.22: Reasons for supporting a wind/solar farm located within 1–2 kilometres
of where a survey respondent lived (unprompted) 71Table 3.23: Concerns about building a wind/solar farm within 1–2 kilometres
of where survey respondents lived (unprompted) 72Table 3.24: Perceived impact of wind farms on property value and visual appeal (prompted) 72Table 3.25: Level of concern about noise and health issues caused by wind farms (prompted) 72Table 3.26: Perceived advantages and disadvantages of using renewable energy
technologies (unprompted) 76Table 3.27: Perceived advantages and disadvantages of using renewable energy
technologies (unprompted) 80

vi
List of figures
Figure 2.1: Community awareness of renewable energy technologies 3Figure 2.2: Self-assessed knowledge of renewable energy technologies 4Figure 2.3: Awareness and self-assessed knowledge of wind farms and solar farms 7Figure 2.4: Overall support for generating electricity in NSW using renewable energy technologies 10Figure 2.5: Use of renewable energy to produce electricity in NSW over the next five years 10Figure 2.6: Perceived advantages/disadvantages of using renewable energy to generate
electricity (unprompted) 13Figure 2.7: Perceptions about the cost of renewable energy 14Figure 2.8: Overall views about using renewable energy to produce electricity in NSW 21Figure 2.9: Support for building wind farms and solar farms in NSW 22Figure 2.10: Support for and opposition to building a wind/solar farm in three proximities –
in NSW, the local region, and within 1–2 kilometres of where they lived 24Figure 2.11: Reasons for supporting a wind/solar farm within 1–2 kilometres
of where the respondent lived (unprompted) 30Figure 2.12: Concerns about wind and solar farms located 1–2 kilometres
from where the respondent lived (unprompted) 35Figure 2.13: Concerns, after prompting, about the impact of wind farms located
1–2 kilometres of where the respondent lived on property value and visual appeal 40Figure 2.14: Concerns, after prompting, about the noise and health impacts of wind
farms located 1–2 kilometres from where they lived 40Figure 2.15: Concerns about a wind farm within 1–2 kilometres of where the
respondent lived– unprompted versus prompted 41Figure 3.1: Awareness/self-assessed knowledge of renewable energy technologies
by survey respondents 44Figure 3.2: Support for using renewable energy technologies to generate electricity in NSW 45Figure 3.3: Use of renewable energy technologies to produce electricity in NSW
over the next 5 years 45Figure 3.4: Overall views about using renewable energy to produce electricity
in NSW and its cost 46Figure 3.5: Support for and opposition to building solar/wind farms in three proximities – in NSW,
in the local region, and within 1–2 kilometres of where survey respondents lived 47Figure 3.6: Awareness/self-assessed knowledge of renewable energy technologies
by survey respondents 50Figure 3.7: Support for using renewable energy technologies to generate electricity in NSW 51Figure 3.8: Use of renewable energy technologies to produce electricity in NSW
over the next 5 years 51Figure 3.9: Overall views about using renewable energy to produce electricity in NSW and its cost 52Figure 3.10: Support for and opposition to building solar/wind farms in three proximities – in NSW,
in the local region, and within 1–2 kilometres of where survey respondents lived 53Figure 3.11: Awareness/self-assessed knowledge of renewable energy technologies by
survey respondents 56Figure 3.12: Support for using renewable energy technologies to generate electricity in NSW 57Figure 3.13: Use of renewable energy technologies to produce electricity in NSW
over the next 5 years 57
vii
Figure 3.14: Overall views about using renewable energy to produce electricity in NSW and its cost 58
Figure 3.15: Support for and opposition to building solar/wind farms in three proximities – in NSW, in the local region, and within 1–2 kilometres of where survey respondents lived 59
Figure 3.16: Awareness/self-assessed knowledge of renewable energy technologies by survey respondents 62
Figure 3.17: Support for using renewable energy technologies to generate electricity in NSW 63Figure 3.18: Use of renewable energy technologies to produce electricity in NSW
over the next 5 years 63Figure 3.19: Overall views about using renewable energy to produce electricity in NSW and its cost 64Figure 3.20: Support for and opposition to building solar/wind farms in three proximities –
in NSW, in the local region, and within 1–2 kilometres of where survey respondents lived 65Figure 3.21: Awareness/self-assessed knowledge of renewable energy technologies
by survey respondents 68Figure 3.22: Support for using renewable energy technologies to generate electricity in NSW 69Figure 3.23: Use of renewable energy technologies to produce electricity in NSW
over the next 5 years 69Figure 3.24: Overall views about using renewable energy to produce electricity in NSW and its cost 70Figure 3.25: Support for and opposition to building solar/wind farms in three proximities –
in NSW, in the local region, and within 1–2 kilometres of where survey respondents lived 71Figure 3.26: Awareness/self-assessed knowledge of renewable energy technologies
by survey respondents 74Figure 3.27: Support for using renewable energy technologies to generate electricity in NSW 75Figure 3.28: Use of renewable energy technologies to produce electricity in NSW
over the next 5 years 75Figure 3.29: Overall views about using renewable energy to produce electricity
in NSW and its cost 76Figure 3.30: Support for and opposition to building solar/wind farms in NSW 76Figure 3.31: Awareness/self-assessed knowledge of renewable energy technologies by
survey respondents 78Figure 3.32: Support for using renewable energy technologies to generate electricity in NSW 79Figure 3.33: Use of renewable energy technologies to produce electricity in NSW
over the next 5 years 79Figure 3.34: Overall views about using renewable energy to produce electricity in
NSW and its cost 80Figure 3.35: Support for and opposition to building solar/wind farms in NSW 80

viii
Executive summary
The Office of Environment and Heritage (OEH) commissioned research from Newspoll on community attitudes to renewable energy in general, self-assessed knowledge of renewable energy and wind and solar farms in New South Wales. The aims of the research were to:
• provide a comprehensive picture of community awareness, knowledge and attitudes to renewable energy technologies
• provide an understanding of community attitudes to local wind and solar farms and perceived benefits and impacts
• establish a baseline measure of community attitudes on which to base evaluation of the activities of the Regional Clean Energy Program.
A representative sample of 2000 people aged 18 years and over from across NSW was surveyed by telephone from late August to mid-September 2014. This report presents the findings of this survey at a state level and in six regional areas.
Awareness and self-assessed knowledge of renewable energy technologiesWhen asked to name types of renewable energy, 76% of survey respondents thought of solar and 64% thought of wind. After prompting, virtually all respondents said they had heard of solar (99%) and wind (98%). Many people reported they knew ‘a lot’ or ‘a moderate amount’ about solar power (74%) and wind power (57%).
Awareness of other renewable energy technologies was lower. Unprompted awareness of hydroelectric power by survey respondents was 31%, for bioenergy 3% and geothermal power 9%. After prompting people were fairly confident of their knowledge of hydroelectric power, but most admitted they knew little about bioenergy and geothermal power.
There was almost universal awareness (97%) of the concept of wind farms, wind turbines or windmills being used to generate electricity. Fewer respondents (66%) said they had heard of the idea of commercial solar farms. About half of survey respondents who had heard of wind farms and solar farms said they knew ‘a lot’ or ‘a moderate amount’ about these technologies.
Men and university-educated people reported knowing more about renewable energy, wind and solar farms than women and people without a university education.
The research also considered differences in awareness and self-assessed knowledge between regions. This analysis found that while the essential substance of people’s responses was the same there were some regional differences, such as:
• people in the North East Region of NSW had the highest awareness and self-assessed knowledge of renewable energy
• wind power was more top-of-mind for people in the South East Region and awareness and self-assessed knowledge of both wind and solar farms was higher in this area than in other regions
• Sydney residents tended to have lower top-of-mind awareness of wind and solar power, and lower awareness and self-assessed knowledge of solar farms.
Attitudes to renewable energy technologiesWhilst 88% of people identified advantages with renewables, 62% also saw disadvantages. In weighing up the pros and cons, the vast majority of people (91%) supported the use of renewables to generate electricity in NSW. There was also a widely held view that NSW should be producing more of its electricity in this way (83%), rather than less (3%), or maintaining current levels (11%). Most people surveyed supported the use of both wind farms (81%) and solar farms (89%).

ix
The principal advantages people saw in renewables were:
• benefits to the environment (80%) – cleaner/creating less ‘pollution’ or fewer greenhouse gases (52%) – more sustainable, reducing reliance on non-renewable resources such as coal (39%)• lower cost, or at least the potential for reduced cost in the long run (37%).
The principal disadvantages people saw in renewables were:
• higher cost (39%), particularly in the set-up phase• concerns about efficiency and reliability (18%).
About four-in-ten people believed there were no disadvantages to renewables, or could not think of any.
The perceived cost of renewables is a complex and multi-dimensional issue. Some people were aware of the competing priorities of higher cost now versus lower cost in the long run, were wary of the potential for higher domestic electricity costs, and some were willing to pay more to support renewable energy technologies.
Regional attitudes to local wind and solar farmsPeople living in non-metropolitan regions of NSW – North East, Hunter/Central Coast (excluding Newcastle), North West, South East and South West – were asked for their views about siting wind and solar farms in their local region and within 1 to 2 kilometres of where they lived. The closer to peoples’ homes wind or solar farms were located, the lower the level of support for them (see table).
Within NSW Within local region Within 1–2 kilometres of peoples’ homes
Wind 81% 73% 59%
Solar 91% 84% 78%
The main benefits identified by people who supported locating solar farms within 1–2 kilometres of their homes were the environment (62%) and cost (29%). The same benefits were identified by people who supported locating wind farms close to their homes (69% and 23%, respectively).
When asked if a solar or wind farm was located within 1–2 kilometres of where people lived, 17% opposed solar farms and 37% opposed wind farms. The main unprompted reasons people opposed having wind farms this close to their homes were noise (61%), visual impact (38%) and health (23%). Some supporters of wind farms expressed similar concerns (32%, 11% and 8%, respectively).
The number of supporters or opponents of solar or wind farms who raised unprompted concerns about noise, visual impact, health and property values varied from negligible to just over 40%. When survey respondents were prompted about these concerns, these figures changed to between 45% to 77%. This rise after prompting suggests that the in-principle majority support for wind farms, subject to communication about these issues, could be a fragile one.
ConclusionsIt is clear there is widespread in-principle support for using renewable energy in NSW and most people do not need convincing about its environmental benefits. There are mixed views about the costs, efficiency and reliability of renewable energy. Reasoned arguments about the long term financial payoff from investing in renewable infrastructure are important for those who have concerns.
The proximity to peoples’ homes is important with the location of large-scale renewable energy projects. This is particularly relevant to wind farms.

x

Community Attitudes to Renewable Energy in NSW 1
1 Introduction1.1 BackgroundIn 2013 the NSW Government released the Renewable Energy Action Plan (REAP) which outlines three goals, comprising 24 specific actions, designed to grow the use of renewable energy in NSW to 20% by 2020. These three goals are:
• Goal 1: to attract renewable energy investments and projects• Goal 2: to build community support for renewable energy• Goal 3: to attract and grow expertise in renewable energy technology.
The Regional Clean Energy Program (RCEP) has responsibilities under Goal 2, Actions 11 and 12, to build an informed and engaged community and support for renewable energy.
The RCEP is a four-year program that builds on the Renewable Energy Precincts (REP) program which was established in 2010. It involves the equivalent of six full-time regionally-based coordinators engaging and informing communities about renewable energy and supporting the development of community-owned renewable energy projects.
1.2 Research purposeThe Office of Environment and Heritage (OEH) commissioned research to develop an understanding of its customers both at a statewide and regional level. The specific aims of the research were to:
• provide a comprehensive picture of community awareness, knowledge and attitudes to renewable energy technologies
• provide an understanding of community attitudes to local wind and solar farms, along with perceived benefits and impacts
• establish a baseline measure of community attitudes which, through comparison with future surveys, will help evaluate the impact of programs.
In 2010, the then NSW Department of Environment, Climate Change and Water commissioned a survey relating to community attitudes to wind farms. This differed from the current survey in scope and geographic coverage. The 2010 survey was undertaken in areas of NSW designated as Renewable Energy Precincts. The current survey has statewide coverage and is stratified by RCEP regions that do not align with the Renewable Energy Precincts. Where the same or similar questions were asked in the two surveys, the report contains some (appropriately qualified) comparisons.
1.3 Research methodsBetween 27 August 2014 and 11 September 2014 a NSW-wide telephone survey of 2000 people aged 18 years and over was conducted. The sample was geographically stratified across seven regions (Table 1.1).
Table 1.1: Region and number of people sampled for the survey.
Region Sample size
Greater Sydney 500
North East 250
Hunter/Central Coast 250
North West 250
Illawarra 250
South East 250
South West 250
Total 2000

2
Within each region the results were post-weighted by an interlocking matrix of sex and age within five age ranges (18–24, 25–34, 35–49, 50–64 and 65+ years). The results within each region were also weighted by the highest level of education achieved, and then all regions were recombined in their correct population proportions.
Preliminary qualitative research was conducted to assist with the design of the quantitative research rather than act as a standalone piece of research. The report draws on elements of the preliminary research to expand on issues raised in the survey. The preliminary research comprised four focus groups of mixed sex and age, with one group being held in Sydney and three in regional NSW.The survey questionnaire was piloted to test survey flow and comprehension. This identified the need for changes which were implemented in the final survey.
1.4 Statistical significance testingStatistically significant differences between regions or demographic segments are identified throughout the report. Statistical significance testing was undertaken, at the 95% level of confidence, by comparing a particular segment or group with its complement. For example:
• for a test of significance by region, respondents residing in a given region were compared with all people who were not residing in that region
• for a test by age, respondents in a given age group (for example people aged 65 and over) were compared with all people who were not in that age group (in this example, people under the age of 65)
• for a test of significance by gender, men were compared with women.
In tables throughout this report segments that are significantly higher than others are indicated with an asterisk (*) and segments that are significantly lower than others are indicated with the symbol †.

Community Attitudes to Renewable Energy in NSW 3
2 Findings2.1 Community awareness and knowledge
of renewable energy technologies
2.1.1 Overall awareness and self-assessed knowledge of renewable energy technologies
The following results were obtained when survey participants were asked about their awareness of renewable technologies (Figure 2.1).
General awareness
• Solar and wind power were the dominant technologies people associated with ‘renewable energy’. When asked to name types of renewable energy, unprompted 76% of NSW adults mentioned solar and 64% mentioned wind. After prompting, virtually everyone said they had heard of them both (solar 99%, wind 98%).
• Although most people had also heard of hydroelectric power (89% after prompting), far fewer thought of it unprompted as a source of renewable energy (31%).
• Unprompted awareness of bioenergy or geothermal power was limited to a small minority, (bioenergy including biomass or biofuel 3%; geothermal 9%). Unprompted, a few others (2%) mentioned something that could be classified as bioenergy, although they did not refer to the terms ‘bioenergy’, ‘biomass’ or ‘biofuel’. This included things such as methane, ethanol, manure, sugar cane, crops/plants or using waste/garbage. After prompting, about 60% of people claimed to have heard of bioenergy and geothermal power.
60
3
4
17
76 9923
64 98
31 89
263
51
34
58
603
9
solar
Percentage of respondents
wind
hydroelectric
bioenergy
geothermal
promptedunprompted other bioenergy related
Ren
ewab
le e
nerg
y te
chno
logi
es
wave/tidal*
nuclear*
natural gas/*gas/CSG
Figure 2.1: Community awareness of renewable energy technologies. Question A1. What types of renewable energy can you think of that can be used to generate electricity?Question A2. Which of these types of renewable energy have you heard of before? ‘Prompted’ refers to the answers survey respondents gave after being prompted with suggested answers. ‘Unprompted’ refers to the answers survey respondents voluntarily gave to survey questions. *Prompted awareness of these technologies was not measured.Number of survey respondents = 2000. CSG = coal seam gas.

4
Beyond the five renewable energy sources shown in Figure 2.1, the survey also captured unprompted mentions of:
• wave or tidal power (17%)• nuclear power (4%), and• gas/natural gas or coal seam gas (CSG; 3%).
Some people (16%) were unable to nominate any type of renewable energy.
Self-assessed knowledge
Self-assessed knowledge of renewable technologies varied amongst survey respondents (Figure 2.2). For example:
• many survey respondents believed they knew ‘a lot’ or ‘a moderate amount’ about solar power (74%), wind power (57%) and hydroelectric power (49%)
• a small number of respondents felt they knew ‘a lot’ or ‘a moderate amount’ about bioenergy (15%) or geothermal power (18%)
• for solar, wind and hydroelectric power, many survey respondents felt they knew ‘a little’ about it, or it was something they had heard of (solar 25%, wind 41%, hydroelectric 40%); this was also the case for bioenergy (46%) or geothermal power (41%).
6311 30 16 2
6014 27 14 1
9944 22 3
9840 34 7
8931 27 12
solar
Percentage of respondents
wind
know a lot know a moderate amount know a little don’t knowjust heard the name
geothermal
bioenergy
hydroelectric
Ren
ewab
le e
nerg
y te
chno
logi
es
4
4
30
16
18 1
Figure 2.2: Self-assessed knowledge of renewable energy technologies. Question A4. For each of the following types of renewable energy, please tell me how much you feel you know about it. Would you say you know a lot about it, a moderate amount, a little, or you’ve just heard the name?Number of survey respondents = 2000.

Community Attitudes to Renewable Energy in NSW 5
2.1.2 Awareness and knowledge of renewable energy technologies among demographic segments
Regional variation
Regional variation in awareness of renewable technologies occurred (Table 2.1)1. For example:
• unprompted awareness of solar and wind power was higher among people living in regional NSW (82%, 69%) than people living in Sydney (71%, 60%)
• survey respondents living in regional NSW were a little more likely to have heard of hydroelectric power than those living in Sydney (92% total awareness in regional NSW versus 86% total awareness in Sydney)
• people from the North East Region appeared most knowledgeable about renewable energy technologies, with higher levels of unprompted awareness and self-assessed knowledge of solar, wind and hydroelectric power, and a higher awareness of bioenergy and geothermal power
• unprompted awareness of wind power was highest in the South East Region (82%).
Table 2.1: Survey results showing regional variation in awareness/self-assessed knowledge of renewable energy technologies.
Total surveyed
Greater Sydney
Regional NSW
North East
Hunter/ Central Coast
North West Illawarra South
EastSouth West
Number of respondents 2000 500 1500 250 250 250 250 250 250
Numbers below are shown as percentages.
SolarTotal awareness 99 99† 100* 100 100 99 100 100 100
Unprompted awareness 76 71† 82*‡ 88* 77 86* 84* 86* 79
Know a lot/moderate amount 74 73 75 85* 72 73 72 75 73
WindTotal awareness 98 98 98 99 99 97 97 99 98
Unprompted awareness 64 60† 69*‡ 74* 67 70 63 82* 61
Know a lot/moderate amount 57 58 56 64* 51 51 56 68* 54
HydroelectricTotal awareness 89 86† 92* 93* 91 91 94* 89 95*
Unprompted awareness 31 31 31‡ 38* 28 30 28 28 32
Know a lot/moderate amount 49 49 48 56* 44 45 44 54 50
BioenergyTotal awareness 63 61 65 71* 61 64 62 67 67
Unprompted awareness 3 3 2 5 1† 2 2 3 2
Know a lot/moderate amount 15 16 13 18 11 12 13 16 16
GeothermalTotal awareness 60 58 63 69* 61 56 66 69* 60
Unprompted awareness 9 8 10 8 14* 9 6 15* 8
Know a lot/moderate amount 18 18 17 23* 15 15 16 19 14
Notes: * † Indicates statistically significant difference at the 95% level of confidence; * indicates a result was higher and † indicates a result was lower when than compared with other regions.
‡ The 2010 ‘Community Attitudes to Wind Farms’ survey measured unprompted awareness of ‘clean’ energy sources (as opposed to ‘renewable’ energy sources that can be used to generate electricity) in people residing within regional NSW areas designated as Renewable Energy Precincts. The survey found the unprompted level of awareness among respondents was 74% for solar, 59% for wind and 18% for hydroelectric. The current survey found higher levels of unprompted awareness in survey respondents across all NSW regional areas: 82% for solar,69% for wind and 31% for hydroelectric. Because of differences in geographic coverage and questions asked, it is not clear whether the different survey results was driven by real change or by methodological differences.
‘Total awareness’ represents the sum of unprompted and prompted responses. ‘Unprompted awareness’ refers to responses voluntarily given to survey questions. ‘Know a lot/moderate amount’ refers to self-assessed knowledge respondents reported about renewable energy technology.
1 See ‡ in table notes

6
Demographic variations
Awareness of renewable technologies also varied among demographic segments of the population surveyed (Table 2.2). The following two clear patterns emerged among demographic segments:
• men had higher levels of awareness and self-assessed knowledge than women on nearly all measures• university-educated people showed greater awareness and self-assessed knowledge across most
technologies, whereas people with no post-school qualifications recorded the lowest on these measures.
No striking patterns were observed when different age groups were assessed, although the following reasonably consistent patterns emerged:
• people aged 50 to 64 years had a significantly higher awareness or self-assessed knowledge, or both, of each technology
• for each technology, the level of unprompted awareness was lower among people aged 65+ years than other people
• for four out of five technologies (solar, wind, hydroelectric and geothermal) the level of self-assessed knowledge was lower among people aged 25 to 34 years than people in the other age groups surveyed, as was unprompted awareness of wind and solar power.
Table 2.2: Survey results showing demographic.
Total surveyed
Gender Age (years) Highest education level
Men Women 18 –24 25–34 35–49 50–64 65+ Uni degree
TAFE/appren-ticeship
School only
Number of respondents 2000 998 1002 166 216 575 491 552 680 753 567
Numbers below are shown as percentages.
Solar
Total awareness 99 99 99 99 97† 100 100 99 100 99 98
Unprompted awareness 76 83* 69† 73 68† 85* 79 68† 87* 78 67†
Know lot/moderate amount 74 78* 70† 77 64† 76 80* 70 83* 76 67†
Wind
Total awareness 98 99 98 98 97 99 99 98 99 98 98
Unprompted awareness 64 73* 55† 64 56† 68 74* 53† 75* 64 56†
Know lot/moderate amount 57 65* 49† 57 44† 56 66* 60 69* 59 48†
Hydroelectric
Total awareness 89 92* 85† 86 71† 93* 94* 93* 96* 88 85†
Unprompted awareness 31 36* 26† 42* 30 38* 28 19† 39* 31 25†
Know lot/moderate amount 49 62* 36† 36† 25† 51 64* 55* 63* 52 37†
Bioenergy
Total awareness 63 69* 57† 65 62 65 63 59 72* 62 58†
Unprompted awareness 3 4* 1† 5 4 3 4 0† 5* 2 2
Know lot/moderate amount 15 21* 9† 15 12 14 20* 12 24* 14 10†
Geothermal
Total awareness 60 71* 49† 58 53 60 69* 57 73* 58 53†
Unprompted awareness 9 15* 4† 15* 10 10 9 5† 16* 7† 7
Know lot/moderate amount 18 27* 9† 18 11† 17 26* 15 28* 18 11†
Notes: * † indicates statistically significant difference at the 95% level of confidence. * indicates a result was higher and † indicates a result was lower compared to other groups.
‘Total awareness’ represents the sum of unprompted and prompted responses. ‘Unprompted awareness’ refers to responses voluntarily given to survey questions. ‘Know a lot/moderate amount’ refers to self-assessed knowledge respondents reported.

Community Attitudes to Renewable Energy in NSW 7
2.1.3 Specific awareness and self-assessed knowledge of wind farms and solar farms
Having looked at community understanding of the broader category of renewable energy, this section looks at specific awareness and self-assessed knowledge survey respondents had about wind farms and solar farms (Figure 2.3). The following provides an overview of the findings:
• nearly all survey respondents (97%) had heard about the use of wind farms, wind turbines or windmills to generate electricity
• nearly all survey respondents (97%) knew what a wind turbine looked like – about 80% had seen a wind turbine in ‘the distance’ or ‘up close’, and 89% had seen them in pictures or on television (Table 2.3)
• fewer people (66%) said they had heard of commercial solar farms being used to generate electricity• about half the survey respondents who had heard of wind farms and solar farms said they knew
‘a lot’ or ‘a moderate amount’ about these technologies, and others said they knew ‘a little’ or had heard of them.
wind farms
Percentage of respondents
solar farms
97
66
9741 36
6626 27
wind farms
Self-assesedknowledge
Percentage of respondents
solar farms
Awareness
know a lot know a moderate amount know a little just heard the name
14 5
8 5
Figure 2.3: Awareness and self-assessed knowledge of wind farms and solar farms. Question E1/F2. [Wind farms are groups of wind turbines or windmills used to generate electricity. / A commercial solar farm is about the size of a football field, with a large number of solar panels that generate electricity. The electricity is then fed into the national power grid.] Before today, had you heard about the use of wind farms or wind turbines or windmills/ the idea of solar farms being used to generate electricity? Question E2/F3. Before this survey, how much did you know about wind/solar farms? Number of survey respondents = 2000.

8
Table 2.3: Exposure to wind turbines.
Survey response Percentage of respondents
Total seen turbine in some way 97
Total seen ‘in distance’/‘up close’ 83
Seen in distance 78
Seen up close 50
Seen on TV 89
Seen pictures 89
Seen some other way 42
Note: Number of respondents = 2000
2.1.4 Awareness, self-assessed knowledge and exposure to wind and solar farms among demographic segments
Regional variation
Survey results about awareness, self-assessed knowledge and exposure to renewable technologies varied between regional NSW and Sydney as well as between regions (Table 2.4). For example:
• overall awareness of wind (98%) and solar farms (70%), and exposure to wind farms (98%), particularly having seen wind turbines ‘up close’ (59%), was higher in regional NSW than in Sydney
• survey respondents from the South East region were more likely to know a lot/moderate amount about wind farms (67%), and be aware of (84%) and know a lot/moderate amount (44%) about solar farms compared to other regions
• survey respondents from the South East region had the highest level of exposure to wind turbines (99%, including 66% ‘up close’) and those from the Illawarra (63%) and Hunter/Central Coast (68%) regions were also more likely to have seen a wind turbine ‘up close’.
Table 2.4: Survey results showing regional variation in awareness/self-assessed knowledge/exposure to wind and solar farms.
Total surveyed
Greater Sydney
Regional NSW
North East
Hunter/ Central Coast
North West Illawarra South
EastSouth West
Number of respondents 2000 500 1500 250 250 250 250 250 250
Numbers below are shown as percentages.
Wind farms
Total awareness 97 96† 98* 99* 99 95 98 99 99* Know a lot/moderate amount 55 56 54 55 51 48† 56 67* 52
Total seen turbine 97 95† 98* 99 99 95 98 99 99* Total seen ‘in distance /‘up close’ 83 80† 87* 73† 90* 83 93* 99* 93*
Seen ‘up close’ 50 44† 59* 47 68* 50 63* 66* 52
Solar farms
Total awareness 66 63† 70* 72 68 73* 63 84* 64Know a lot/moderate amount 34 33 36 38 32 38 35 44* 36
Notes: * † indicates statistically significant difference at the 95% level of confidence; * indicates a result was higher and † indicates a result was lower when regions were compared.
‘Total awareness’ represents the sum of unprompted and prompted survey responses. ‘Know a lot/moderate amount’ refers to self-assessed knowledge survey respondents reported.

Community Attitudes to Renewable Energy in NSW 9
Demographic variations
Demographic trends were in line with overall awareness/self-assessed knowledge of wind and solar power (section 2.1.1; Table 2.5). For example:
• men were more aware of and believed they knew ‘a lot/moderate amount’ about wind farms (99% and 64%, respectively) and solar farms (78% and 48%, respectively), and had seen wind turbines (99%, including 57% ‘up close’), compared with women
• survey respondents who had university degrees were more likely to know a lot/moderate amount about wind farms (64%) and solar farms (43%), and to have seen wind turbines in the distance/up close (90%), compared with survey respondents with no post-school education
• compared with other age groups, self-assessed knowledge of these technologies was a little lower among 25–34 year olds (40% and 25% reported they knew ‘a lot/moderate amount’ about wind and solar farms respectively) and higher among 50–64 year olds (64% and 41% reported they knew a lot/moderate amount about wind and solar farms respectively).
Table 2.5: Survey results showing demographic variation in awareness/self-assessed knowledge/exposure to wind farms and solar farms.
Total surveyed
Gender Age (years) Highest education level
Men Women 18 –24 25–34 35–49 50–64 65+ Uni degree
TAFE/appren-ticeship
School only
Number of respondents 2000 998 1002 166 216 575 491 552 680 753 567
Numbers below are shown as percentages.
Wind farms
Total awareness 97 99* 95† 98 91† 97 98 99* 98 97 96
Know a lot/moderate amount 55 64* 46† 55 40† 55 64* 57 64* 58 47†
Total seen turbine 97 99* 94† 98 91† 97 97 99* 98 97 96
Total seen ‘in distance/‘up close’ 83 86* 80† 84 76† 86 85 84 90* 84 78†
Seen ‘up close’ 50 57* 44† 47 44 54 52 50 60* 54 41†
Solar farms
Total awareness 66 78* 55† 66 54† 67 74* 66 73* 67 61†
Know a lot/moderate amount 34 48* 21† 33 25† 35 41* 34 43* 36 27†
Notes: * † indicates statistically significant difference at the 95% level of confidence; * indicates a result was higher and † indicates a result was lower when regions were compared.
‘Total awareness’ represents the sum of unprompted and prompted survey responses. ‘Know a lot/moderate amount’ refers to self-assessed knowledge survey respondents reported about wind and solar farms.

10
5%neither support
or oppose/don’t know
2%strongly oppose
49%strongly support
43%support
91% support
2%oppose
Figure 2.4: Overall support for generating electricity in NSW using renewable energy technologies.Question A5. Most electricity in NSW is generated by coal-fired power stations. Some of it is generated from renewable energy. To what extent do you support or oppose (strongly oppose, oppose, neither support or oppose/don’t know, support, strongly support) using renewable energy for at least some of the electricity in NSW? Number of survey respondents = 2000.
Most people surveyed (83%) also believed that over the next five years, NSW should produce more of its electricity from renewable energy (Figure 2.5). A small percentage of people believed the use of renewables should be reduced (3%).
2.2 Attitudes towards renewable energy technologies
2.2.1 Support for the use of renewable energy in NSWThe survey results showed that nine-in-ten people supported the use of renewable energy to generate electricity in NSW. About half of survey respondents strongly supported it (Figure 2.4). The rest of respondents were divided equally between a small number who opposed it (4%) and those who were uncommitted (5%).
10011 3 3
Percentage of respondents
more stay the same less don’t know
83
Figure 2.5: Support for use of renewable energy to produce electricity in NSW over the next five years. Question A6. And over the next five years, do you think NSW should be trying to produce… more of its electricity from renewable energy, less, or should it stay the same as now? Number of survey respondents = 2000.

Community Attitudes to Renewable Energy in NSW 11
Support for use of renewable energy technologies in NSW among regions and demographic segments
Support for the use of renewables, and for an increase in their use over the next five years, was prevalent across all regions and demographic groups. There were some differences in the degree of support, for example:
• survey respondents who lived in the North East region (59%), university educated people (68%) and those aged 35–49 years (55%) were more likely than others to strongly support the use of renewables
• university educated survey respondents were more likely to support increased use of renewables over the next five years (90%)
• fewer people living in the Hunter/Central Coast and South West regions strongly supported the use of renewables (around 40%)
• overall support for renewables was lower among people aged 65+ years (85%) and those with no post-school qualifications (88%)
• slightly fewer people aged 65+ years (71%) and those with no post-school qualifications (80%) believed that use of renewables should be increased over the next five years.
Table 2.6: Survey results showing regional variation in overall support of renewable energy and its expansion in NSW
Total surveyed
Greater Sydney
Regional NSW
North East
Hunter/ Central Coast
North West Illawarra South
EastSouth West
Number of respondents 2000 500 1500 250 250 250 250 250 250
Numbers below are shown as percentages.
Use renewable energy to produce some electricity
Total support 91 91 92 93 93 94 91 90 91
Strongly support 49 50 46 59* 41† 43 49 49 38†
Total oppose 4 4 4 4 4 4 5 5 5
Over next 5 years
Produce more electricity from renewables 83 83 85 86 85 81 89 82 79
Stay the same as now 11 10 12 10 12 17* 9 11 15
Produce less electricity from renewables 3 3 2 1 2 2 1 2 3
Notes: * † indicates statistically significant difference at the 95% level of confidence; * indicates a result was higher and † indicates a result was lower when regions were compared.

12
Table 2.7: Survey results showing demographic variation in overall support of renewable energy and its expansion in NSW
Total surveyed
Gender Age (years) Highest education level
Men Women 18 –24 25–34 35–49 50–64 65+ Uni degree
TAFE/appren-ticeship
School only
Number of respondents 2000 998 1002 166 216 575 491 552 680 753 567
Numbers below are shown as percentages.
Use renewable energy to produce some electricity
Total support 91 92 91 95 92 95* 91 85† 95* 93 88†
Strongly support 49 52 46 52 49 55* 50 35† 68* 45 40†
Total oppose 4 5 3 2 3 2 5 8* 3 3 6*
Over next 5 years
Produce more electricity from renewables 83 83 84 90* 89 86 83 71† 90 83 80†
Stay the same as now 11 13 9 6† 6 8† 12 22* 5† 12 14*
Produce less electricity from renewables 3 3 2 4 1 2 4 3 2 3 3
Notes: * † indicates statistically significant difference at the 95% level of confidence; * indicates a result was higher and † indicates a result was lower when regions were compared.

Community Attitudes to Renewable Energy in NSW 13
2.2.2 Perceived advantages and disadvantages of generating electricity from renewable sources (unprompted)
When survey respondents were asked to describe the advantages and disadvantages of using renewable energy to generate electricity they answered in a variety of ways. The issues raised can be divided into a few broad categories (Figure 2.6).
There were two key responses about the advantages of using renewable energy to generate electricity:
1. benefits to the environment (80%)2. lower cost (37%).
There were three key responses about the disadvantages of using renewable energy to generate electricity
1. higher cost (39%)2. lack of efficiency and/or reliability (18%)3. no disadvantages to renewables, or unable to think of any (38%).
6
4
5
5
2
4
3
3
2
80
37
18
8
12
Pecentage of respondents
5
39
8
38
environment
cost
efficiency/reliability
employment
health
build energy sector / skills
noise
visual impact
takes a lot of space
lack existing infrastructure
other
none / don’t know
disavantagesadvantages
Figure 2.6: Perceived advantages/disadvantages of using renewable energy to generate electricity (unprompted). Questions A7/8. What would you say are the advantages/disadvantages of generating electricity from renewable sources? Number of survey respondents = 2000

14
Advantage 37% Disadvantage 39%
13% 27%24%
64% of survey respondents mentioned cost
There were other broad categories of opinion, but all were much smaller than the key responses shown in Figure 2.6. In some cases, different people saw the same issue from different perspectives. For example, some people saw cost as an advantage, while others saw it as a disadvantage, and some simultaneously saw it as both (discussed further below).
The environment
Environmental benefits were clearly the dominant perceived advantage of renewable energy technologies. For example:
• many survey respondents said that renewables were cleaner or created less ‘pollution’ or fewer greenhouse gases (52%)
• some (39%) mentioned sustainability and reduced reliance on non-renewables such as coal • some said renewables would help ‘save the planet’ for future generations (7%)• others saw benefits in the preservation of the landscape and agricultural land, e.g. by not digging up the
landscape (5%).
In comparison with the 80% who saw environmental benefits of using renewable energy technologies, a very small proportion (5%) saw renewables as harmful to the environment. For example:
• some respondents (1%) saw renewables as destroying the landscape rather than preserving it (e.g. taking land to build wind farms, or dams for hydroelectricity resulting in flooding valleys)
• other respondents (1%) were concerned about potential impacts on animals or wildlife, including the impact of wind turbines on bird life
• others (1%) said renewables generated pollution/carbon; this included the belief that the harm caused to the environment in manufacturing the required equipment (e.g. solar panels, wind turbines) outweighed other environmental benefits, in other cases it appeared to be based on confusion about what ‘renewable’ meant.
Cost
Cost is one of the more complex issues around renewable energy. The results of the survey showed that almost as many people saw cost as an advantage of renewables (37%) as a disadvantage (39%). This was more than a simple case of opposing points of view (Figure 2.7), and for some people cost could simultaneously be an advantage and a disadvantage (13%).
Number of survey respondents = 2000 Figure 2.7: Perceptions about the cost of renewable energy.
The type of logic or contexts that underpinned people’s thinking on each side of the cost equation were many and varied. Below are some examples of the logic behind some of the responses generated in the survey.

Community Attitudes to Renewable Energy in NSW 15
Lower cost as an advantage
Domestic solar panels:
• ‘The ones on the roof are the ones I’m talking about. So no more electricity bills once I’ve paid off the ones on the roof’
• ‘Less cost/households can produce their own electricity.’• ‘We have solar. We get a small rebate that we make.’
It’s free energy:
• ‘It’s not costing us anything, it’s coming from nature.’• ‘Wind costs nothing.’• ‘And it’s free harvesting the wind, the sun and water flow.’
It will become cheaper eventually (if we stick with it):
• ‘Ultimately it should be cheaper.’• ‘The more that we generate the cheaper it will become.’• ‘In the long term it’s going to be cheaper.’
People usually did not explain why they believed renewable energy would be cheaper. The language people used in saying renewable energy was cheaper was not always definitive; sometimes it was speculative, or merely hopeful. For example:
• ‘Maybe cost?’• ‘Possibly cheaper in the long run.’• ‘In theory, apart from capital costs, it will be cheaper for the end user.’• ‘I hope it would be cheaper.’• ‘Hopefully it’s cheaper.’
Lower cost as a disadvantage
The set-up cost/equipment costs are high:
• ‘There’s no disadvantages that I’m aware of other than cost – the expensive equipment.’• ‘In some instances at the moment the capital cost.’• ‘Have to spend a lot of money setting up the initial infrastructure and the technology.’ • ‘The cost of setting it up.’
At the moment it costs more:
• ‘Cost at the moment.’• ‘At this stage cost.’• ‘It’s a bit more expensive at the moment but I think with time it’ll come down.’• ‘I think probably in the short term it’s more expensive.’
Again, people did not always explain why they believed renewable energy was more costly.
Those who saw both cost advantages and disadvantages typically distinguished between cost now versus cost later, or set-up costs versus (longer-term) operating costs (Table 2.8).
Table 2.8: Survey respondents’ reasons for the cost of renewable energy technologies being both an advantage and a disadvantage.
Advantages Disadvantages
Saving money in the long run. The initial cost.
Eventually once you work out the technology it should end up being cheaper.
The technology isn’t up to scratch yet to do it as efficiently as coal fire stations, etc so it’s probably a little more expensive.
In the long run I’d imagine it’d be cheaper. Initial costs.
It saves more money I guess because it’s using the energy from the sun. It can cost a bit of money to set up.
Well, in the long term it would be cheaper. The cost to set up the infrastructure

16
Efficiency/reliability
Almost one in five people surveyed said renewable technologies lacked efficiency/reliability of supply (18%). Some viewed these technologies as not yet advanced or efficient enough (7%) for electricity generation and unable to provide base-load power (3%). Solar and wind power, in particular, were perceived as dependent on the right weather conditions: people assumed that no daylight/sunshine or no wind equated to no electricity supply. This contributed to the view that it was hard to achieve reliable or sufficient levels of electricity supply from renewables (9%).
Other advantages/disadvantages
Survey respondents gave other unprompted reasons why renewable energy technologies could be advantageous or disadvantageous. For example:
• Employment – 6% of people believed renewable energy would create jobs and employment, but just as many (5%) believed it would cost jobs in existing electricity generation industries or coal mining.
• Long-term national benefits – these responses related to favourable views on job creation, some people saw an opportunity to encourage innovation, investment and development in the renewable energy sector to benefit Australia’s future energy needs and for export opportunities (5%).
• Health – some people saw renewables as having positive health benefits through a healthier environment, such as cleaner air and oceans/waterways, reduced greenhouse gases/carbon emissions, etc. (4%). Others had potential health concerns (2%), principally wind turbines causing ill health among people living in nearby communities.
• Noise and visual impact – noise issues (4%) and visual impact (3%) were disadvantages people mainly associated with wind turbines. Some believed that noise (‘humming’) from wind turbines was a problem for nearby communities and the large size, overall look (‘ugliness’), and number of wind turbines grouped together could ‘ruin the natural skyline’. Others also saw solar panels as ‘eyesores’.
• Infrastructure and space needed – new/additional infrastructure needed to capture, convert and store energy from different renewable energy types (2%), and the amount of land required for wind turbines, solar panels or hydroelectric dams (3%), were viewed as other disadvantages of renewable energy technologies.
2.2.3 Perceived advantages/disadvantages among those who support and those who oppose renewables (unprompted)
The vast majority of people surveyed (91%) supported the use of renewable energy technologies. Most could see advantages and disadvantages but thought advantages outweighed disadvantages (Tables 2.9 and 2.10).
Those who supported renewable energy were significantly more likely than the small number who opposed it to see both environmental benefits (84%) and cost benefits (38%). Of those who opposed (4%) some could also see these advantages (33%, 20%), and about half of them could not think of any advantages.
Perceptions about the disadvantages of renewable energy among the two groups were similar. About 40% of each group saw a cost disadvantage, but supporters of renewables were more likely to identify higher set-up cost (17%), whereas those who opposed them identified higher cost generally (40%). Those who opposed renewables were more likely to see disadvantages for the environment (17%) and in relation to health (14%).
Interestingly, there were some people who did not appear to base their support or opposition on anything concrete. For example, 8% of supporters did not cite advantages for using renewables, and 29% of those who opposed them did not cite a disadvantage. It was unclear what was driving these opinions. It could be a vague sense that renewables are ‘good’ or ‘bad’, or that people were reflecting opinions they had heard without knowing why.

Community Attitudes to Renewable Energy in NSW 17
Table 2.9: Perceived advantages of using renewables (unprompted) provided by survey respondents who supported or opposed renewable energy technologies.
Total surveyed
Support renewables
Oppose renewables
Number of respondents 2000 1844 86
Numbers below are shown as percentages.
Environmental issues 80 84* 33†
It’s better/less harmful for the environment/environmentally friendly 31 33* 4†
Cleaner/less pollution/greenhouse gases 52 55* 20†
Less emissions of greenhouse gases/carbon dioxide/contribute less to global warming 21 22* 8†
Its cleaner/not dirty 15 16* 5†
Less/no (air) pollution 22 24* 7†
Safer/Less (toxic) waste/by products being produced 6 7* 0
Less water pollution/better or cleaner water quality 1 1 0
Sustainability 39 41* 13†
Sustainable/can be reused/won’t run out 23 25* 7†
Less reliant on/won’t use up/limited supply of coal/fossil fuels/non-renewable resources 16 17* 6†
Making use of available (renewable) resources (solar/wind/water) 7 7 1†
Save the planet/won’t destroy the earth for future generations 7 7 1†
Preserve landscape/farm/agricultural land 5 6* 2
Won’t damage the landscape (from digging)/destroy the land/the beautiful countryside 5 5* 2
Better use of land for agriculture/farming/won’t destroy agricultural land 1 1 0
Better for/less impact on ozone layer 2 2 3
Lower cost 37 38* 20†
Cheaper energy bills/cost less for consumers 7 7 2†
Cost less to generate/run/maintain (in the long run) 1 1* 0
The cost/savings/cheaper – other cost mentioned and no further information provided 29 30* 17
Other issues
Healthier/good for our health/better quality of living 4 5* 1
Build long term energy sector/technological advancement/skills 5 5* 0†
Create more jobs 6 7 5
Other 8 8 11
None/don’t know 12 8† 49*
Notes: * † indicates statistically significant difference at the 95% level of confidence; * indicates a result was higher and † indicates a result was lower when the two groups (support or oppose renewables) were compared.

18
Table 2.10: Perceived disadvantages of using renewables (unprompted) provided by respondents who supported or opposed renewable energy technologies.
Total surveyed
Support renewables
Oppose renewables
Number of respondents 2000 1844 86
Numbers below are shown as percentages.
Cost 39 40 42
High start-up/set-up costs/installation/infrastructure/capital cost 15 17* 4†
Expensive to run/maintain 1 1 1
Very expensive/high cost/cost/price other/cost mentioned and no further information provided 26 26 40*
Efficiency/reliability 18 18 20
Difficult to generate/produce/supply as subject to sun/wind conditions 9 10 5
Cannot provide enough/base load power 3 3 3
Inefficient technology/not fully developed/not advanced enough 7 7 13
Environment 5 5 17*Generate air pollution/carbon emissions/gas emissions/impacts ozone layer 1 1 1
Landscape damage/destruction 1 1 4
Impact on/dangerous to animals mentioned and no further information required 1 1 7*
Not good for the environment and no further information provided 2 2 4
Other issues
Job losses/unemployment/people will lose their jobs 5 6 1†
Generate noise/noisy/noise pollution 4 4 4Visually unpleasant/distracting/impacting/unsightly/eye sore/ visual pollution 3 3 5
Takes up a lot of land space/need space/large area 3 3* 0†
Health concerns 2 2† 14*
No existing infrastructure/need to build it (includes mentions of building dams) 2 2* 0†
Other 8 8 18*
None/don’t know 38 37 29
Notes: * † indicates statistically significant difference at the 95% level of confidence; * indicates a result was higher and † indicates a result was lower when the two groups (support or oppose renewables) were compared.
Community Attitudes to Renewable Energy in NSW 19
2.2.4 Perceived advantages and disadvantages of generating electricity from renewable sources (unprompted) among demographic segments
Regional variation
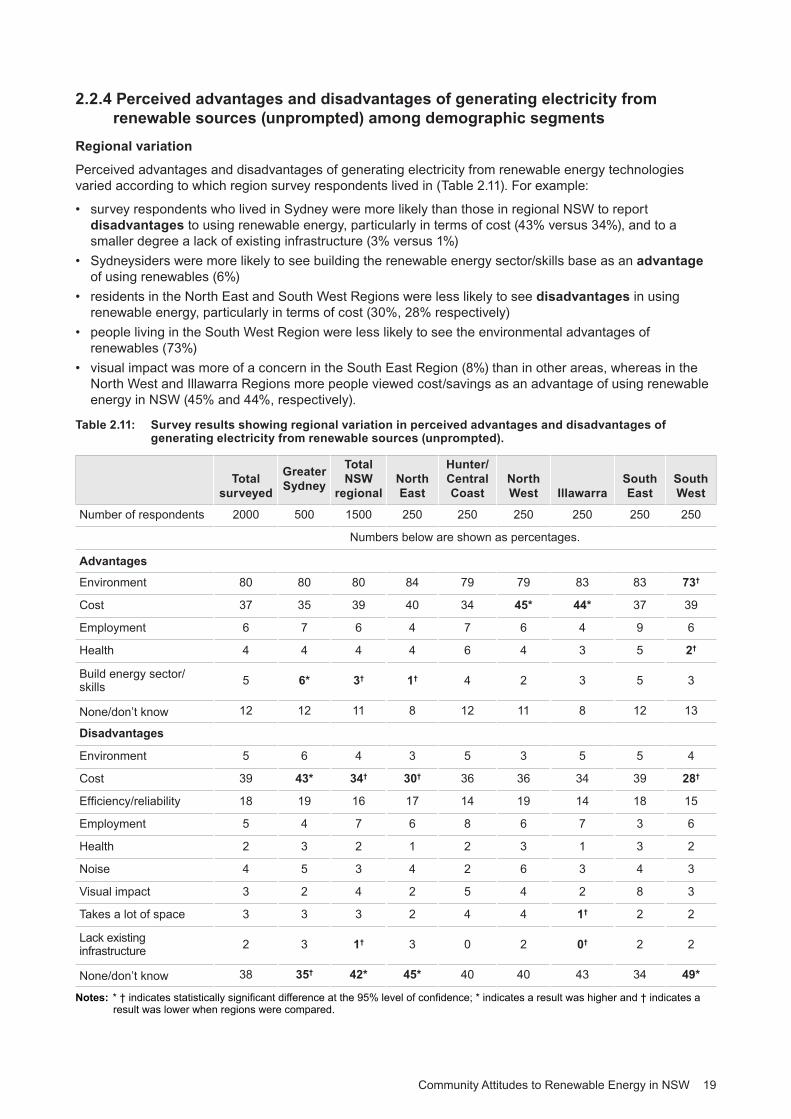
Perceived advantages and disadvantages of generating electricity from renewable energy technologies varied according to which region survey respondents lived in (Table 2.11). For example:
• survey respondents who lived in Sydney were more likely than those in regional NSW to report disadvantages to using renewable energy, particularly in terms of cost (43% versus 34%), and to a smaller degree a lack of existing infrastructure (3% versus 1%)
• Sydneysiders were more likely to see building the renewable energy sector/skills base as an advantage of using renewables (6%)
• residents in the North East and South West Regions were less likely to see disadvantages in using renewable energy, particularly in terms of cost (30%, 28% respectively)
• people living in the South West Region were less likely to see the environmental advantages of renewables (73%)
• visual impact was more of a concern in the South East Region (8%) than in other areas, whereas in the North West and Illawarra Regions more people viewed cost/savings as an advantage of using renewable energy in NSW (45% and 44%, respectively).
Table 2.11: Survey results showing regional variation in perceived advantages and disadvantages of generating electricity from renewable sources (unprompted).
Totalsurveyed
GreaterSydney
TotalNSW
regionalNorthEast
Hunter/CentralCoast
NorthWest Illawarra
SouthEast
SouthWest
Number of respondents 2000 500 1500 250 250 250 250 250 250
Numbers below are shown as percentages.
Advantages
Environment 80 80 80 84 79 79 83 83 73†
Cost 37 35 39 40 34 45* 44* 37 39
Employment 6 7 6 4 7 6 4 9 6
Health 4 4 4 4 6 4 3 5 2†
Build energy sector/skills 5 6* 3† 1† 4 2 3 5 3
None/don’t know 12 12 11 8 12 11 8 12 13
Disadvantages
Environment 5 6 4 3 5 3 5 5 4
Cost 39 43* 34† 30† 36 36 34 39 28†
Efficiency/reliability 18 19 16 17 14 19 14 18 15
Employment 5 4 7 6 8 6 7 3 6
Health 2 3 2 1 2 3 1 3 2
Noise 4 5 3 4 2 6 3 4 3
Visual impact 3 2 4 2 5 4 2 8 3
Takes a lot of space 3 3 3 2 4 4 1† 2 2
Lack existing infrastructure 2 3 1† 3 0 2 0† 2 2
None/don’t know 38 35† 42* 45* 40 40 43 34 49*
Notes: * † indicates statistically significant difference at the 95% level of confidence; * indicates a result was higher and † indicates a result was lower when regions were compared.

20
Demographic variation
Demographic variation occurred when survey participants were asked about perceived advantages and disadvantages of generating electricity from renewable energy technologies (Table 2.12).
Some key trends that appeared in different demographic segments were:
• Men appear to be more knowledgeable about renewables, with more being able to list advantages and disadvantages of these technologies than women. Men were more likely to have perceived advantages/disadvantages. For example, they cited environmental (84%) and employment (8%), and building the renewable energy sector/skills base (7%) as advantages and areas such as cost (44%) and problems with efficiency/reliability (21%) as disadvantages.
• Survey participants who had university degrees also self-assessed their knowledge higher than others. A large majority of this segment named advantages and disadvantages of renewables and they were more likely to mention advantages (e.g. environment 93%, employment 12%, building sector/skills 10%) and disadvantages (e.g. cost 53%, efficiency/reliability 25%). Survey participants with no post-school qualifications self-assessed their knowledge about renewables the lowest, with the TAFE/apprenticeship group sitting in between. An interesting exception was the higher proportion among the TAFE/apprenticeship group who viewed cost as an advantage of renewables (43%).
• By age group, older people (65+ years) were less likely than younger people to name advantages or disadvantages of renewable technologies. The older age group was less likely to mention advantages and disadvantages such as environmental advantages (66%), high costs/prices (25%) and problems with efficiency/reliability (11%). Although their self-assessed knowledge matched the state average, the youngest age group (18–24 years) was much less likely than other age groups to see cost/savings as an advantage (23%) and much more likely see efficiency/reliability as a disadvantage of using renewables (32%).
Table 2.12: Survey results showing demographic variation in perceived advantages and disadvantages of generating electricity from renewable sources (unprompted).
Total surveyed
Gender Age (years) Highest education level
Men Women 18–24 25–34 35–49 50–64 65+ Unidegree
TAFE/appren-ticeship
Schoolonly
Number of respondents 2000 998 1002 166 216 575 491 552 680 753 567
Numbers below are shown as percentages.
Advantages
Environment 80 84* 76† 89* 79 86* 81 66† 93* 82 71†
Cost 37 36 37 23† 37 41 40 35 35 43* 33
Employment 6 8* 5† 7 8 7 6 4† 12* 5 4†
Health 4 3 5 6 4 4 5 4 4 3 6
Build energy sector/skills 5 7* 2† 8 8 4 4 1† 10* 3 3†
None/don’t know 12 8† 14* 3† 12 7† 11 23* 4† 8† 19*
Disadvantages
Environment 5 6 4 4 9* 5 4 3 6 6 4
Cost 39 44* 35† 46 40 46* 41 25† 53* 40 31†
Efficiency/reliability 18 21* 14† 32* 18 17 16 11† 25* 17 14†
Employment 5 6 4 6 6 6 6 3† 5 5 6
Health 2 2 3 3 1 1† 5* 1 2 3 2
Noise 4 4 5 2 1† 3 7* 5 4 5 3
Visual impact 3 4 2 3 1 3 4 4 4 3 2
Takes a lot of space 3 4 2 5 3 2 2 2 4 2 2
Lack existing infrastructure 2 3 1 4 2 2 2 2 3 2 2
None/don’t know 38 30† 45* 28† 32 35 37 55* 22† 38 48*
Notes: * † indicates statistically significant difference at the 95% level of confidence; * indicates a result was higher and † indicates a result was lower when demographics were compared.

Community Attitudes to Renewable Energy in NSW 21
3 264 101*32
a good idea, and you’re prepared to pay more for your electricity to support it
Percentage of respondents
a good idea, as long as you don’t have to pay anything more for your electricity
it’s just not a good idea to use renewable energy at all
don’t know
* rounding error
2.2.5 Personal cost as a mitigating factor on support for renewablesIt was clear that along with the environment, cost was a pivotal element in community thinking about renewables. The most prevalent community view was that renewable energy was a good idea ‘provided I don’t have to pay more for my electricity’ (64%; Figure 2.8).
Even so, 32% of survey respondents said that renewables were not only a good idea, but they were also prepared to pay more for their electricity to support them. Only 3% of people said ‘it’s just not a good idea to use renewable energy at all’.
* numbers have been rounded up. Number of survey respondents = 2000.
Figure 2.8: Overall views about using renewable energy to produce electricity in NSW. Question A9. Overall, which one of the following best describes your view about renewable energy to produce electricity? Do you think it’s... ?
Personal cost as a mitigating factor on support for renewables
Survey respondents from Sydney (34%), those with a university education (49%) and 18–24 year olds (41%) were more likely to say that renewable energy was something they were prepared to pay more to support. Conversely, respondents with no post-school qualifications (72%) and those living in country/regional areas (68%), particularly the North West and South West Regions (74% each), were more inclined to say that renewables were a good idea provided they didn’t have to pay more to support them (Table 2.13).
Table 2.13: Personal cost as a mitigating factor on support for renewable energy technologies – by region.
Totalsurveyed
GreaterSydney
TotalNSW
regionalNorthEast
Hunter/CentralCoast
NorthWest Illawarra
SouthEast
SouthWest
Number of respondents 2000 500 1500 250 250 250 250 250 250
Numbers below are shown as percentages.
Using renewable energy to produce electricity in NSW is:
A good idea 95 95 96 97 95 96 98† 96 94
Prepared to pay more for electricity to support it 32 34* 28† 35 30 22† 29 26 20†
If don’t have to pay more for electricity 64 61† 68* 63 65 74* 69 70 74*
Not a good idea 3 3 2 0† 3 2 2 2 5
Notes: * † indicates statistically significant difference at the 95% level of confidence; * indicates a result was higher and † indicates a result was lower when other regions were compared.

22
Table 2.14: Personal cost as a mitigating factor on support for renewable energy technologies – by demographics.
Totalsurveyed
Gender Age (years) Highest education level
Men Women 18–24 25–34 35–49 50–64 65+ Unidegree
TAFE/appren-ticeship
Schoolonly
Number of respondents 2000 998 1002 166 216 575 491 552 680 753 567
Numbers below are shown as percentages.
Using renewable energy to produce electricity in NSW is:
A good idea 95 95 95 98* 96 96 95 92† 97 94 95
Prepared to pay more for electricity to support it 32 33 30 41* 29 35 30 25† 49* 28† 24†
If don’t have to pay more for electricity 64 63 65 57 66 62 65 67 48† 66 72*
Not a good idea 3 3 2 2 1 1 4 6* 2 3 3
Notes: * † indicates statistically significant difference at the 95% level of confidence; * indicates a result was higher and † indicates a result was lower when demographics were compared.
2.2.6 Community support for building wind farms and solar farms
There was substantial majority support for building wind farms in NSW (81%)2 , and even more support for solar farms (89%). The number of survey respondents who strongly supported the idea of solar farms (43%) was also somewhat higher than the number who strongly supported wind farms (34%; Figure 2.9).
146 8
62 4
8147
8946
wind farms
Percentage of respondents
solar farms
strongly support support strongly oppose oppose
34
43
Figure 2.9: Support for building wind farms and solar farms in NSW. Question E4/F4. Now thinking specifically about wind/solar farms in NSW. Overall, to what extent do you support or oppose wind/solar farms being built in NSW? Number of survey respondents = 2000.
Regional variations in support for building wind and solar farms in NSW
There was not a lot of variation in support for building wind and solar farms by region (Table 2.15).
Overall support for both wind and solar farms was slightly higher in the Illawarra Region (87% and 95% respectively), and for solar farms in the North West Region (95%). People in the South West Region were a little less likely than others to strongly support wind farms (26%). The small level of opposition to solar farms was slightly higher in Sydney (8%) than in regional NSW (4%).
2 The 2010 ‘Community Attitudes to Wind Farms’ survey measured support for wind farms in NSW among people living in regional NSW areas designated as Renewable Energy Precincts. That survey reported support of 85%, a similar result to the 81% support across regional NSW reported in the current survey.

Community Attitudes to Renewable Energy in NSW 23
Table 2.15: Support for building wind and solar farms in NSW – by region.
Notes: * † indicates statistically significant difference at the 95% level of confidence; * indicates a result was higher and † indicates a result was lower when regions were compared.
Demographic variation
Patterns in support were more distinct within demographic groups compared to regional areas (Table 2.16). For example:
• men were more likely to support solar farms (93%) and strongly supported wind (39%) and solar (49%) farms
• support for wind and solar farms was higher (89% and 94% respectively) and stronger (52% and 60% respectively) among survey participants who were university educated
• support for wind farms was higher among people under 35 (around nine in 10) whereas opposition to wind farms was higher among people aged 50 and over (two in 10)
• opposition to solar farms was highest among people aged 65 and over, although it was relatively small (12%).
Table 2.16: Support for building wind and solar farms in NSW – by demographics.
Wind farms Total support
Strongly support
Total oppose
Solar farmsTotal support
Strongly support
Total oppose
2000
81
34
14
89
43
6
500
81
36
15
87†
43
8*
1500
82
33
13
91*
44
4†
250
81
35
13
91
48
4
250
80
32
15
89
42
4
250
86
28
10
95*
46
3
250
87*
38
10
95*
42
3
250
79
35
16
88
46
5
250
77
26†
15
93
39
3
Number of respondents Numbers below are shown as percentages.
Totalsurveyed
GreaterSydney
TotalNSW
regionalNorthEast
Hunter/CentralCoast
NorthWest Illawarra
SouthEast
SouthWest
Wind farms Total support
Strongly support
Total oppose
Solar farmsTotal support
Strongly support
Total oppose
2000
81
34
14
89
43
6
998
82
39*
15
93*
49*
5
1002
81
31†
13
86†
37†
7
166
94*
44*
5†
96*
45
2†
216
88*
37
5†
92
47
3
575
84
36
13
91
45
5
491
77†
34
18*
89
46
8
552
69†
25†
24*
80†
31†
12*
680
89*
52*
7†
94*
60*
3†
753
78
29†
15
89
39
5
567
79
29†
17*
86†
36†
9*
TotalSurveyed
Unidegree
TAFE/appren-ticeship
SchoolonlyMen 18–24 25–34 35–49 50–64 65+Women
Gender Age (years) Highest education level
Number of respondents Numbers below are shown as percentages.
Notes: * † indicates statistically significant difference at the 95% level of confidence; * indicates a result was higher and † indicates a result was lower when demographics were compared.

24
2.3 Attitudes towards local wind and solar farms
2.3.1 Responses to building wind and solar farms in NSW, local regions and within 1–2 kilometres of where they lived
Along with measuring opinions about locating wind and solar farms within NSW, the survey also sought people’s attitudes to having them in their local region and even closer, within 1–2 kilometres of where they lived (Figure 2.10).
People who lived outside of the Sydney and Newcastle metropolitan areas and Illawarra region were asked about their responses to building wind and solar farms in NSW, in their local region and within 1–2 kilometres of where they lived. Some of the survey findings were:
• the level of support for having wind farms3 in NSW closely reflected statewide sentiment (81%) • support for having wind farms in the local region was (73%) but remained a fairly solid majority• a majority supported having a wind farm within 1–2 kilometres of their home (59%) and 37%
opposed it• solar farms were preferred over wind farms for the three proximities • although support dropped progressively from 91% for solar farms in NSW, to 84% in the local region, to 78%
within 1–2 kilometres of where they lived, this drop was not as sharp as the drop in support for wind farms• there was substantial majority support for having a solar farm within 1–2 kilometres of where they lived
(78%), and relatively little opposition to it (17%); at this proximity to where they lived, more people would strongly support a solar farm (33%) than a wind farm (18%).
Percentage of respondents
strongly support support strongly oppose oppose
11 12
19
2 8
9 12
7325
59
91
8438
78
81
48
41
46
46
45
49326 8
18
1 3
23
5 12 17
37
10
14
4
18
45
33
NSW
local region
1-2km
NSW
Solar farms
1-2km
local region
Wind farms
Figure 2.10: Support for and opposition to building a wind/solar farm in three proximities – in NSW, the local region, and within 1–2 kilometres of where they lived.Question E4/F4 Overall, to what extent do you support or oppose wind/solar farms being built in NSW? Question E5/F5. To what extent do you support or oppose wind/solar farms being built in your local region? Question E8a,b/F6a,b. To what extent do you support or oppose a wind/solar farm being built within 1 to 2 kilometres of where you live? Number of survey respondents (adults in non-metropolitan areas) = 1200.

Community Attitudes to Renewable Energy in NSW 25
Responses to building wind and solar farms in NSW, local regions, and within 1–2 kilometres of where they lived, excluding the Sydney and Newcastle metropolitan areas and Illawarra region4
Regional variations
Attitudes to wind and solar farms at the three geographic proximities were largely consistent across the non-metropolitan areas (Table 2.17). There were a few significant differences, such as the:
• North East region showed a higher level of strong support for solar farms in the local region (44%) compared to other regions
• Hunter/Central Coast region showed a slightly higher level of strong opposition to wind farms in NSW (10%) and within the local region (15%) compared to other regions
• overall support in the North West region for wind farms in NSW (86%) and support for wind farms (79%) and solar farms (92%) in the local region was higher than other regions.
3 The 2010 ‘Community Attitudes to Wind Farms’ survey measured support for wind farms in NSW among people living in regional NSW areas designated as Renewable Energy Precincts. This found support of 60% at 1–2 kilometres, which is almost identical to the current survey, at 59%. Compared with the current survey, the 2010 survey found a similar, but slightly higher level of support for wind farms in NSW (85% versus 81%) and within the local region (80% versus 73%)
4 In Tables 2.17 and 2.18, patterns in statistically significant differences concerning support for local wind and solar farms in NSW may differ from the patterns in support for local wind and solar farms shown in Tables 2.15 and 2.16. This is because the significance calculations in Tables 2.17 and 2.18 were based on survey participants living in outside of the Sydney, Newcastle and Illawarra metropolitan areas, whereas Tables 2.15 and 2.16 were based on the full NSW sample of 2000 respondents.

26
Table 2.17: Regional variation in responses to building wind and solar farms in NSW, in local region, and within 1–2 kilometres of residence.
Total non-metroploitan
areasNorthEast
Hunter/CentralCoast**
NorthWest
SouthEast
SouthWest
Wind farms in NSW4
Total support
Strongly support
Total oppose
Strongly oppose
Wind farms in local regionTotal support
Strongly support
Total oppose
Strongly oppose
Wind farms within 1–2 kmTotal support
Strongly support
Total oppose
Strongly oppose
Solar farms in NSW4
Total support
Strongly support
Total oppose
Solar farms in local regionTotal support
Strongly support
Total oppose
Solar farms within 1–2 kmTotal support
Strongly support
Total oppose
1210
%
81
32
14
6
73
25
23
11
59
18
37
18
91
45
4
84
38
10
78
33
17
250
%
81
35
13
4
72
27
21
8
61
17
33
16
91
48
4
82
44*
11
80
38
16
250
%
79
32
17
10*
71
24
27
15*
57
18
39
21
89
43
4
80
31†
12
76
30
18
250
%
86*
28
10
4
79*
24
17†
6†
64
18
34
15
95
46
3
92*
45
5†
84
33
13
250
%
79
35
16
6
72
31
24
10
56
24
41
22
88
46
5
85
42
10
74
36
21
250
%
77
26
15
4
71
21
23
9
53
16
41
17
93
39
3
85
36
7
77
32
17
Number of respondents
Numbers below are shown as percentages.
Notes: * † indicates statistically significant difference at the 95% level of confidence; * indicates a result was higher and † indicates a result was lower when regions were compared.
** excluding Newcastle.
Numbers below are shown as percentages.

Community Attitudes to Renewable Energy in NSW 27
Demographic variations
Survey responses to wind and solar farms at the three geographic proximities varied across the State excluding the Sydney and Newcastle metropolitan areas and Illawarra region (Table 2.18). Key themes within the different demographic groups were as follows:
• men were more supportive of solar farms than women at each of the three geographic proximities• men were more likely to strongly support (36%) and oppose (17%) wind farms in NSW, and to strongly
support a wind farm within 1–2 kilometres (23%) of where they lived• people aged 50 years and over were more likely to oppose wind farms at each geographic proximity• within the 50–64 years and 65+ years age groups, opinion about a wind farm within 1–2 kilometres of
a residence was almost equally divided between those who supported it (around 50%) and those who opposed it (45%)
• university educated respondents were more likely than others to support (and strongly support) solar farms at each geographic proximity
• university educated respondents were more likely to support wind farms within NSW, and to strongly support them at each geographic proximity.
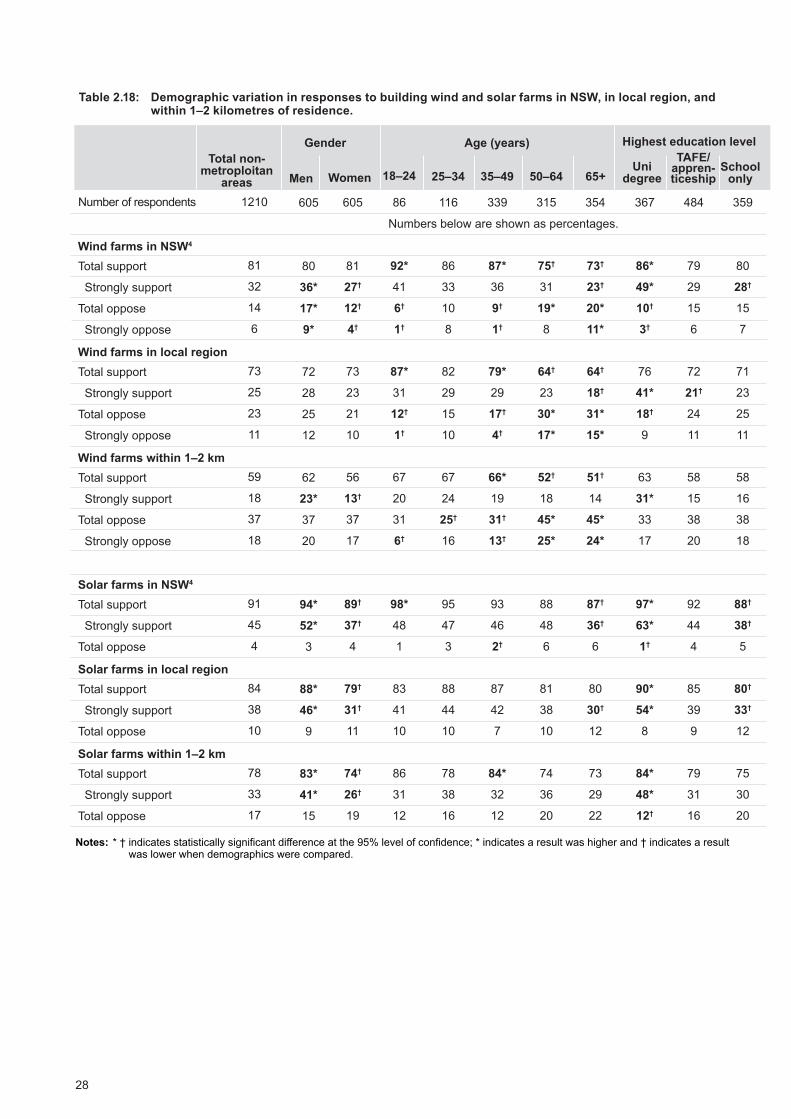
28
Table 2.18: Demographic variation in responses to building wind and solar farms in NSW, in local region, and within 1–2 kilometres of residence.
1210
81
32
14
6
73
25
23
11
59
18
37
18
91
45
4
84
38
10
78
33
17
605
80
36*
17*
9*
72
28
25
12
62
23*
37
20
94*
52*
3
88*
46*
9
83*
41*
15
605
81
27†
12†
4†
73
23
21
10
56
13†
37
17
89†
37†
4
79†
31†
11
74†
26†
19
86
92*
41
6†
1†
87*
31
12†
1†
67
20
31
6†
98*
48
1
83
41
10
86
31
12
116
86
33
10
8
82
29
15
10
67
24
25†
16
95
47
3
88
44
10
78
38
16
339
87*
36
9†
1†
79*
29
17†
4†
66*
19
31†
13†
93
46
2†
87
42
7
84*
32
12
315
75†
31
19*
8
64†
23
30*
17*
52†
18
45*
25*
88
48
6
81
38
10
74
36
20
354
73†
23†
20*
11*
64†
18†
31*
15*
51†
14
45*
24*
87†
36†
6
80
30†
12
73
29
22
367
86*
49*
10†
3†
76
41*
18†
9
63
31*
33
17
97*
63*
1†
90*
54*
8
84*
48*
12†
484
79
29
15
6
72
21†
24
11
58
15
38
20
92
44
4
85
39
9
79
31
16
359
80
28†
15
7
71
23
25
11
58
16
38
18
88†
38†
5
80†
33†
12
75
30
20
Wind farms in NSW4
Total support
Strongly support
Total oppose
Strongly oppose
Wind farms in local regionTotal support
Strongly support
Total oppose
Strongly oppose
Wind farms within 1–2 kmTotal support
Strongly support
Total oppose
Strongly oppose
Solar farms in NSW4
Total support
Strongly support
Total oppose
Solar farms in local regionTotal support
Strongly support
Total oppose
Solar farms within 1–2 kmTotal support
Strongly support
Total oppose
Unidegree
TAFE/appren-ticeship
SchoolonlyMen 18–24 25–34 35–49 50–64 65+Women
Gender Age (years) Highest education levelTotal non-
metroploitan areas
Number of respondents
Numbers below are shown as percentages.
Notes: * † indicates statistically significant difference at the 95% level of confidence; * indicates a result was higher and † indicates a result was lower when demographics were compared.

Community Attitudes to Renewable Energy in NSW 29
2.3.2 Reasons for supporting (and perceived benefits of) a wind or solar farm within 1–2 kilometres of where they lived (unprompted)
Survey participants who supported the location of a wind farm within 1–2 kilometres of where they lived were asked why they supported this. Participants who opposed a wind farm being located within 1–2 kilometres of where they lived were asked what benefits, if any, they could identify. The same questions were asked to those who supported and opposed locating solar farms within 1–2 kilometres of where they lived.
Participants who supported the location of a wind or solar farm within 1–2 kilometres of where they lived, gave largely the same unprompted reasons for wind and solar. Principal among them were:
1. environmental benefits (69% wind/62% solar)2. lower cost (23% wind/29% solar)3. benefits to the local economy (14% for both wind and solar).
Most people surveyed who opposed a wind or solar farm being located within 1–2 kilometres of their residence could not identify any benefits (about 70% for wind and solar). Those who identified benefits principally related them to the environment (12% wind, 9% solar), cost (9%, 14%) and the local economy (8%, 7%). Around one in 10 of those who supported and those who opposed the concept also said the infrastructure would increase electricity-generating capacity.

30
5
4
3
2
5
12
239
148
812
6
7
1
0.2
13
69
67
environment
cost
local economy
more electricity
better than coal
visual
noise
suited for area/Australia
good alternative source
health
way of the future
other
none / don’t know
Figure 2.11: Reasons support (benefits in) wind / solar farms 1–2 km from where live (unprompted)
Solar farms Percentage of respondents
Wind farmsPercentage of respondents
benefits identified by those who oppose wind or solar farms within 1–2 kilometres
benefits identified by those who support wind or solar farms within 1–2 kilometres
3
9
14
147
87
12
7
6
6
4
2
4
137
3
62
29
73
Benefits identified
Figure 2.11: Reasons for supporting a wind/solar farm within 1–2 kilometres of where the respondent lived (unprompted).Question E9a/F9a. For what particular reason would you support it? Question E10b/F10b. What benefits, if any, would there be in having a wind/solar farm within 1-2 kilometres from where you live? Survey respondents included adults in non-metropolitan areas; number in support of solar farms = 960; number in opposition to solar farms = 194; number in support of wind farms = 702; number in opposition to wind farms = 458.

Community Attitudes to Renewable Energy in NSW 31
Respondents raised a wide variety of reasons why a wind or solar farm within 1–2 kilometres of their residence would benefit them or the wider community. For example:
• Environment – Reflecting the perceived advantages of using renewables in general, the two key reasons for supporting local wind and solar farms on environmental grounds were (i) they were cleaner/created less ‘pollution’ or fewer greenhouse gases, and (ii) sustainability.
• Cost – Supporters also believed (or hoped) that local wind and solar farms would (eventually) reduce the cost of electricity, or at least in some way be cheaper.
• Local economy – The perceived benefit to the local economy included creating jobs. For wind farms, a small proportion of supporters (2%) also mentioned the potential financial benefit to property owners who hosted a wind farm, and 1% said wind farm could be a potential tourist attraction.
• More electricity – Some respondents believed the infrastructure would add to the supply of electricity. (This included some who may have misconstrued that the idea of a local wind or solar farm would be to supply electricity for the local area, but they appeared to be few in number. The potential for this confusion was noted in the pilot study and to alleviate this, the words ‘The electricity would be fed into the national power grid’ were included in relevant questions.)
• Better than coal – This included reducing reliance on coal, not burning coal or fossil fuels, or simply that wind or solar was better than using coal or coal-fired power stations.
• Visual and noise – There was an interesting contrast in opinion on these issues. Some people supported solar farms because they perceived them as less visually unappealing or noisy than a wind farm – they were more acceptable because they were perceived as relatively unobtrusive. In contrast, some people who supported wind farms found them visually appealing, and a few said ‘they’re not that noisy anyway’.
• Suited for the area/Australia – Some people who supported solar farms saw the inherent logic of using solar in an area with an abundance of sunshine, whether it be Australia (‘Australia is one of the sunniest places in the world’) or the local area (‘We’re in a relatively open farming area and we do cop a lot of sun throughout the year’). In some cases solar’s suitability for the local area related to the available space (‘I live in a small country town and there’s paddocks available for it to be set up’).
• Good alternative source of energy – This refers to people saying that wind and solar were a better alternative to ‘traditional’ energy sources – which they also linked with the environmental and cost benefits.
• Health – These responses fell into two broad categories: (i) the perception that local wind and solar farms had no negative health impacts, or none the respondent was aware of, or (ii) local wind and solar farms were healthier because they were cleaner and safer (e.g. no air pollution, nuclear waste).
• The way of the future – Some people saw local wind and solar farms as part of ‘the way forward’ on energy, in terms of addressing the limited supply of non-renewables and also moving toward greater use of cleaner, low impact (environmentally), renewable sources.
• Need to be built somewhere – Among other reasons for supporting local wind and solar farms was the view that they ‘need to be built somewhere’ and local communities should support this (‘Someone should have it in their backyard and, if I’m in the area which has the right conditions for it, I should be prepared to support it’).
• Simply a good idea – Some supporters of local wind and solar farms held the general view that they were a good idea (‘It’s [wind farms] absolutely doing good and anything we can do to help the natural is much better’), or have no reason to oppose them (‘Well, I don’t think it’s going to harm anyone’). Others had a desire to support renewable energy technologies generally (‘Because I endorse renewable energy’).

32
NorthEast
Hunter/CentralCoast**
NorthWest
SouthEast
SouthWest
Wind farmsNumber of respondents
Environment
Cost
Local economy
More electricity
Better than coal
Visual
Noise
Suited for area/Australia
Good alternative source
Health
Way of the future
Solar farmsNumber of respondents
Environment
Cost
Local economy
More electricity
Better than coal
Visual
Noise
Suited for area/Australia
Good alternative source
Health
Way of the future
702
69
23
14
8
6
7
1
0
5
4
3
960
62
29
14
8
12
7
6
6
4
3
4
150
69
20
13
7
6
5
0
0
7
6
5
199
62
27
15
7
14
6
10*
9*
4
3
2
122
76*
22
12
5
10
6
0
0
4
3
3
165
66
32
8†
7
16*
7
4
2†
5
4
4
153
60†
29
16
15*
5
9
3*
1*
4
3
0†
205
56
30
21*
11
9
6
5
5
3
2
4
145
66
20
16
5
2
12*
4*
0
5
1†
4
196
63
23
18
7
6†
9
6
6
2
4
4
132
62
28
19
10
3
6
1
0
7
2
5
195
56
30
16
9
5†
7
6
11*
2
1
3
Numbers below are shown as percentages.
Numbers below are shown as percentages.
Total non-metroploitan
areas
Notes: * † indicates statistically significant difference at the 95% level of confidence; * indicates a result was higher and † indicates a result was lower when regions were compared.
** excluding Newcastle.
Reasons for supporting wind and solar farms within 1–2 kilometres of where they lived (unprompted) among demographic segments
Regional variations
The reasons for supporting local wind and solar farms within 1–2 kilometres of where the respondent lived were generally quite consistent across regions (Table 2.19). However, there were some differences in degree; for example:
• respondents from the Hunter/Central Coast region (excluding Newcastle) were slightly more likely than respondents from other areas to support wind farms for environmental reasons (76%) and view solar farms to be better than coal (16%), and less likely to see the local economic benefits of solar farms (8%)
• respondents from the North West region were less likely to nominate environmental factors as a reason to support wind farms (60%), particularly in terms of sustainability, but they were more likely to see wind farms feeding energy into the national grid (15%) and saw the potential for solar power to benefit their local economy (21%).
Table 2.19: Regional variation in reasons for supporting wind or solar farms within 1–2 kilometres of a residence (unprompted).

Community Attitudes to Renewable Energy in NSW 33
Demographic variations
Variation in the reasons for supporting local wind and solar farms within 1–2 kilometres of where respondents lived occurred across the different demographic groups (Table 2.20). For example:
• respondents in the 25–34 year old age group were more likely than those in other age groups to view local wind and solar farms as benefiting the local economy (about 25%)
• about four in 10 respondents in age groups 50 years and over were more likely to view local wind and solar farms as lower cost energy options
• respondents with a university education were more likely to support local wind and solar farms for environmental reasons (nearly 80%)
• respondents with no post-school education were less likely to support wind and solar farms within 1–2 kilometres of where they lived (61%, 55% respectively).
Table 2.20: Demographic variation in reasons for supporting a wind or solar farm within 1–2 kilometres of residence (unprompted)
702
69
23
14
8
6
7
1
0
5
4
3
960
62
29
14
8
12
7
6
6
4
3
4
370
70
24
17
8
7
8
2*
0
5
4
3
494
58
26
17
9
13
9
6
5
3
4
5*
332
67
22
12
8
6
6
0†
0
5
3
4
466
66
33
12
7
11
5
7
7
4
2
2†
64
62
11†
9
8
2
15*
2
0
6
2
0
76
53
19
14
8
3†
12
3
8
4
4
2
75
76
15
25*
13
5
7
1
0
4
0
3
94
57
15†
27*
8
17
4
6
8
6
1
3
209
69
16†
16
8
7
8
2
0
6
5
3
280
67
26
16
8
13
9
5
6
3
3
4
169
73
42*
11
7
6
5
1
1
4
2
2
243
64
36*
10†
7
13
7
9
6
2
5
2
185
62
24
10
5
9
5
0
0
6
7 *
7 *
267
59
39*
9†
9
12
3†
6
3†
4
1
5
225
79*
18
18
7
7
12*
1
0
8
2
5
308
78*
24
20*
7
16
8
7
8
4
3
3
272
73
21
14
10
5
6
2
0
5
3
3
380
62
26
15
7
13
7
7
6
3
2
2
205
61†
27
13
7
7
7
0
0
4
5
3
272
55†
34*
11
9
10
6
5
5
4
4
5
Environment
Cost
Local economy
More electricity
Better than coal
Visual
Noise
Suited for area/Australia
Good alternative source
Health
Way of the future
Solar farmsNumber of respondents
Environment
Cost
Local economy
More electricity
Better than coal
Visual
Noise
Suited for area/Australia
Good alternative source
Health
Way of the future
Unidegree
TAFE/appren-ticeship
SchoolonlyMen 18–24 25–34 35–49 50–64 65+Women
Gender Age (years) Highest education level
Number of respondents
Numbers below are shown as percentages.
Numbers below are shown as percentages.
Total non-metroploitan
areas
Wind farms
Notes: * † number of survey respondents. Indicates statistically significant difference at the 95% level of confidence; * indicates a result was higher and † indicates a result was lower when demographics were compared.

34
2.3.3 Concerns about a wind or solar farm within 1–2 kilometres of where they lived (unprompted)
Mirroring the questions asked of those who supported wind farms in their local area, survey respondents who opposed this were asked what concerns they had. Similarly, those who supported wind farms near their place of residence were also asked what concerns, if any, they had. Parallel questions were also asked about solar farms.
• For those who opposed wind farms being located near their place of residence, the most commonly raised concerns were about noise (61%), visual impact (38%) and health (23%). These concerns were also expressed, although at a lower rate, by people who supported wind farms (32%, 11% and 8% respectively).
• The small group of survey respondents who opposed solar farms being located near their place of residence gave a cluster of reasons for this such as the lack of suitability of a solar farm for their area (33%), the amount of space required (16%), environmental impacts (16%), and visual impacts (20%).
• Most respondents who supported solar farms in their local area had no concerns (59%).• Some respondents reported that lack of information or knowledge about solar farms was a barrier to
acceptance (13%). • For wind and solar farms, few people unprompted raised concerns about negative impacts on property
values (1–3%).

Community Attitudes to Renewable Energy in NSW 35
13
16
noise
visual
health
location issues
environment
efficiency / reliability
cost
takes lot of space
not enough info
property values
use land for agriculture
other
none / don’t know
3261
1138
823
524
6
1
2
1211
413
concerns identified by those who oppose wind or solar farms within 1–2 kilometres
concerns identified by those who support wind or solar farms within 1–2 kilometres
14
9
8
1
Solar farmsPercentage of respondents
Wind farms Percentage of respondents
42
920
37
533
3
4
12
3
1411
593
3
616
80.5
16
13
8
Concerns identified
Figure 2.12: Concerns about wind and solar farms located 1–2 kilometres from where the respondent lived (unprompted). Question E10a/F10a. What concerns do you have with it? Question E9b/F9b. What concerns, if any, would you have with a wind/solar farm within 1–2 kilometres from where you live?Survey respondents included adults in non-metropolitan areas: number in support of solar farms = 960; number in opposition to solar farms = 194; number in support of wind farms = 702; number in opposition to wind farms = 458.Number of respondents = 1200.

36
NoiseSome survey respondents raised concerns about nearby communities hearing noise from turning wind turbines, especially at night, and particularly when there was a ‘farm’ of them (‘They put them in Victoria on farming land and on hillsides and the people who live there are nearly driven crazy by the sound of them’; ‘They are in big groups and when they are in action you get some low frequency humming or buzzing’).
There was also some overlap with health concerns, with specific mention of the impact of low frequency noise or ‘humming’ on human health (e.g. causing migraines, sleep problems) and animal health (‘it affects wildlife and birds and it’s because of the pitch of the turbines and the blades’).
For the small proportion of respondents who mentioned noise in relation to solar farms, issues raised included noise at the construction phase; noise because it was ‘industrial’, and in some cases people queried whether solar farms were noisy or not (‘Are they noisy?’; ‘Could be workmen and humming noises or whatever it is that creates the power’).
Visual impact
Some people did not like the general look of wind and solar farms (‘wind farms are ugly’), or commented on their impact on the look of a specific local area (‘They ruin the look of the landscape, there’s no hiding them’; ‘We are in a residential setting, it wouldn’t suit the aesthetics of the area’; ‘I do think that would have a big impact on tourism because it is a very pretty area’).
HealthFor solar farms, rather than mentioning specific adverse health effects, people said there may be associated health issues. However, survey respondents reported a range of specific problems believed to affect those living near wind farms, such as:
• ‘because of the vibrations [the wind farm] gives off, people in Goulburn have a lot of trouble with their inner ear… it affects your balance, affects your mood, the noise has been linked to increased anxiety and stress in patients with pre-existing psychiatric imbalances… also nausea.’
• ‘I’ve read a lot about people living near wind farms getting illness… certain types of cancers.’• ‘I heard a lot of people get headaches and that sort of stuff.’• ‘There’s been asthma, a lot of respiratory problems, what I’ve only heard from talking to people’.
Location issues
A number of issues were raised about the general suitability of local communities as locations for solar or wind farms. These included:
• population density (‘We are in a residential area and it could not be built 1–2 kilometres from where we live’, ‘It’s just not in the right area… close to people, in built up areas.’)
• local industry (‘I live in a small country town which is all agricultural… [a solar farm] wouldn’t fit in with the industry… it’s more for in the country where it’s not heavily populated’, ‘would not be suitable for wind farms… it’s a heavily orcharded area.’)
• local features (‘I am surrounded by national parks and forests. You are not going to cut down a national park to build a solar farm, are you?’, ‘[Our town is] heritage listed so there’s older buildings and older houses so it wouldn’t suit this area.’)
• weather conditions (‘[local community] would be a terrible place to put the solar farm – it’s cold and miserable’, ‘I don’t think we get a reliable amount of wind here… we’re in a small local valley’).
EnvironmentPeople were concerned about general environmental damage such as destruction of habitat/loss of landscape due to land clearing for the infrastructure associated with wind and solar farms. The impact on animal life was also a key concern – the impact of wind farm noise on the general health of local farm animals, wildlife and birdlife (‘there is a lot of talk about wildlife and cows etc. being disturbed by them’), as well as the danger to birds flying over solar and wind farms (‘Birds think [the solar farm] is a lake therefore dive into it and kill themselves’, ‘[wind farms] have a good habit of killing birds which fly into them’).
Efficiency/reliabilitySome concerns were raised about the efficiency of wind farms and the reliability of energy supply (‘How can you say that they’re viable if you don’t get wind. You’d have to revert to some other means’, ‘They’re not viable – you need a thousand of them to run a torch, they don’t generate enough power’). To a lesser degree there were reliability concerns about solar, on the premise that no sunlight equalled no electricity.

Community Attitudes to Renewable Energy in NSW 37
Cost
There were concerns about high set-up and ongoing costs (including the level of government subsidy), as well as the overall cost-effectiveness of using these technologies versus current non-renewable options. For example:
• ‘Their [wind farms] operating and capital cost is too high, requiring too much subsidy.’• ‘When there is not wind, they don’t work, and there’s no value for money – and if it’s too windy, they have
to be turned off, there’s no value for money.’• ‘They’re not cost-effective, sun doesn’t always shine so sometimes they will not be generating any power
at all.’ • ‘We’ve got heaps of coal and it’s very cheap to produce and we should be using it instead of the over-
costed renewable stuff.’
Need a lot of space
There were comments made on the amount of space needed for the infrastructure for local wind and solar farms (‘you need so much more space in collecting [wind, solar energy] than you do for an existing power station’).
Not enough info
Some people said they didn’t have enough information about solar farms or did not know enough about them to support one being located in their area. In some cases this linked with concerns about dangers that may be connected with the technologies, including health issues (‘I’d have to research it. I’d oppose if it gave off any bad sort of energies to human beings’; ‘I guess I don’t know enough about it and therefore there are concerns in my mind on whether it is dangerous’; ‘there is not enough known about the effects solar farms can have on health’).
Property values
A small number of survey respondents raised concerns about decreased land/house values and often mentioned this in conjunction with the visual impact they perceived local wind and solar farms would have (‘Could be ugly and decrease land value’; ‘Visual impact - impact on property prices arising from that visual impact’).
Use land for agricultureSome people had the view that solar farms should not be built on ‘good agricultural land’ that is, or could be, used for farming crops or cattle grazing.
Other issues
Other concerns raised included wind turbines falling over, parts falling off or catching fire, as well as problems with glare/reflection and bushfire risk from solar panels.
2.3.4 Concerns of those opposed to wind and solar farms within 1–2 kilometres of where they lived among regional and demographic segments (unprompted)
Regional variations
The reasons survey respondents gave for opposing wind and solar farms in their local area were largely consistent across different regions (Table 2.21). However, there were some differences; for example:
• people living in the Hunter/Central Coast (excluding Newcastle) region were more likely to be concerned about visual appeal (47%) and the amount of space wind farms would require (10%)
• property values were more likely to be a concern for people living in the South East region in relation to both wind and solar farms (12%/13%), and visual impact for solar farms (36%).
• along with visual impact (36%).

38
Table 2.21: Regional variation in concerns of those opposed to a wind or solar farm within 1–2 kilometres of residence (unprompted).
Total non-metropolitan
areaNorthEast
Hunter/CentralCoast**
NorthWest
SouthEast
SouthWest
Wind farmsNumber of respondents 458 88# 81# 89# 98# 102
Numbers below are shown as percentages.
Noise 61 59 58 69 56 66
Visual 38 31 47* 28 39 35
Health 23 29 20 23 27 20
Location issues 24 29 21 30 19 20
Environment 14 15 13 17 11 13
Efficiency/reliability 9 12 6 14 7 10
Cost 8 9 8 8 10 8
Takes a lot of space 6 1† 10* 5 5 1†
Property values 3 1 2 3 12* 4
Solar farmsNumber of respondents 194 41 35 35 42 41
Numbers below are shown as percentages.
Noise 2 0 2 3 3 3
Visual 20 24 13 21 36* 17
Health 7 11 5 3 10 6
Location issues 33 36 34 28 28 29
Environment 16 15 19 18 8 13
Efficiency/reliability 3 0 2 4 8 4
Cost 8 4 9 11 7 6
Takes a lot of space 16 6† 25 20 4 16
Not enough information 13 9 20 15 3† 7
Property values 2 0 0† 3 13* 4
Use land for agriculture 8 8 5 7 11 17
Notes: # note the small to very small sample sizes implies these results have a low level of statistical confidence and should be interpreted with caution.
* † indicates statistically significant difference at the 95% level of confidence; * indicates a result was higher and † indicates a result was lower when regions were compared.
** excluding Newcastle.
Demographic variations
The reasons survey respondents gave for opposing wind and solar farms within 1–2 kilometres of where they lived varied across different demographic groups (Table 2.22). For example:
• Opposition to wind farms on the grounds of visual impact (47%) and cost (12%) was higher among men, whereas women were concerned about health issues (28%) and the amount of space required (9%).
• With solar farms, men were more concerned about the suitability of the location (43%), whereas women were more interested in sourcing more information about them (20%).
• In regard to age group, health concerns about wind farms (32%) and visual impacts for solar farms (30%) were higher among people aged 50–64 years.
• Survey respondents aged 65 years and over were more likely to oppose local wind and solar farms (16% and 8%, respectively) due to a perceived lack of efficiency/reliability compared with other age groups.
• University educated people were concerned about negative impacts on property values in regard to wind farms (10%), and the amount of space required in relation to solar farms (32%).

Community Attitudes to Renewable Energy in NSW 39
Table 2.22: Demographic variation in concerns about a wind or solar farm within 1–2 km of residence (unprompted).
Total non-metropolitan
area
Gender Age (years) Highest education level
Men Women 18–34 35–49 50–64 65+ Unidegree
TAFE/appren-ticeship
Schoolonly
Wind farms
Number of respondents 458 226 232 54# 114 133 157 126 191 141
Numbers below are shown as percentages.
Noise 61 64 58 54 63 66 57 66 59 61
Visual 38 47* 30† 40 43 43 28† 43 45 31†
Health 23 17† 28* 12† 19 32* 23 31 22 22
Location issues 24 24 23 22 24 19 30 25 24 23
Environment 14 13 15 7 14 19 13 19 12 14
Efficiency/reliability 9 12 7 1† 4† 11 16* 13 10 8
Cost 8 12* 5† 5 4 10 12 4† 12 7
Takes a lot of space 6 2† 9* 21* 4 1† 3 8 7 4
Property values 3 4 3 2 6 4 2 10* 4 1†
Total non-metropolitan
area
Gender Age (years) Highest education level
Men Women 18–49 50–64 65+ Unidegree
TAFE/appren-ticeship
Schoolonly
Solar farms
Number of respondents 194 94 100 67§ 56§ 71§ 44§ 79§ 71§
Numbers below are shown as percentages.
Noise 2 1 2 2 0 4 4 3 1
Visual 20 22 18 15 30* 15 31 21 16
Health 7 4 8 5 5 9 0 10 6
Location issues 33 43* 25† 36 33 27 25 34 34
Environment 16 20 14 20 15 13 5 15 19
Efficiency/reliability 3 5 1 0 1 8* 0 5 2
Cost 8 11 5 2† 12 10 8 17* 1†
Takes a lot of space 16 10 21 22 9 17 32* 10 18
Not enough information 13 5† 20* 11 13 17 12 11 15
Property values 2 4 1 3 2 2 3 2 2
Use land for agriculture 8 7 9 9 5 9 11 6 9
Notes: * † indicates statistically significant difference at the 95% level of confidence; * indicates a result was higher and † indicates a result was lower when demographics were compared.
§ the small to very small sample size implies these results have low statistical power and should be interpreted with caution. # due to small sample sizes, age groups were combined in this table: for wind farms, the age groups 18–24 and 25–34 years
were combined, and for solar farms, the age groups 18–24, 25–34 and 35–49 years were combined.

40
2.3.5 Focus on wind farms – perceived impact on local community of a wind farm within 1–2 kilometres of where the respondent lived (prompted)
Survey respondents were asked a series of questions to further explore their views on wind farms being built within 1–2 kilometres of where they lived. This was to test whether concerns they had not previously thought of about the wind farms arose after prompting (Figures 2.13 and 2.14). The results showed:
• About half felt that a wind farm within 1–2 kilometres of where they lived would negatively impact on property values (54%), or negatively impact on the visual appeal (51%) of the local area.
• After prompting, 58% said that noise would be of great or some concern to them, and 42% that health issues would be of great or some concern to them.
16 29 551 101*
10 24 54 11 99Property values
Percentage of respondents
Visual appeal
a postitive impact no impact a negative impact none / don’t know
* numbers have been rounded
Res
pons
es
Figure 2.13: Concerns, after prompting, about the impact of wind farms located 1–2 kilometres of where the respondent lived on property value and visual appeal.Question J1b/J2. What impact would a wind farm 1 to 2 kilometres from where you live have on the property values/visual appeal of your local area? Number of survey respondents = 1200.
22 20 18 60
3118 5 23
37 4 41
27 19 77
Percentage of respondents
great concern some concern little concern no concern don’t know
noise
health issues
Con
cern
s
Figure 2.14: Concerns, after prompting, about the noise and health impacts of wind farms located 1–2 kilometres from where they lived.Question J3/4. To what extent, if any, would noise/health issues be a concern for you living within 1 to 2 kilometres of a wind farm? Number of respondents = 1200.
The number of respondents who perceived negative impacts or had some concerns about these issues increased with prompting. This was the same among those who supported and those who opposed wind farms within 1–2 kilometres of where they lived (Figure 2.15).

Community Attitudes to Renewable Energy in NSW 41
Figure 2.15: Concerns about a wind farm within 1–2 kilometres of where the respondent lived– unprompted versus prompted.Question E9b/E10a. What concerns, if any, would you have with a wind farm being within 1 to 2 kilometres from where you live? Question J1b/J2. What impact would a wind farm, 1 to 2 kilometres from where you live, have on the property values/visual appeal of your local area? Questions J3/J4. To what extent if any, would noise/health issues be a concern for you living within 1 to 2 kilometres of a wind farm? Survey respondents included adults in non-metropolitan areas who supported (702) or opposed (458) wind farms.
In the context of a real proposal to place a wind farm within 1–2 kilometres of a community, people will most likely make up their minds based on its exact location relative to their home or community. The location may immediately allay concerns people have, or it could have the opposite effect.
An important factor to note about the difference between the unprompted and prompted level of concern about these issues, however, is that they suggest the in-principle majority support of 59% for a local wind farm may be a fragile majority, subject to communication about these issues in a real-world situation.
Perceived impact on local community of a wind farm within 1–2 kilometres of where the respondent lived among segments (prompted)
There were few significant differences between regions or demographic groups when survey respondents were prompted about concerns they may not previously thought of about the wind farms. Some differences included:
• women were more likely to have great/some concerns about noise (65%) and health issues (48%), than men
• people living in the South East region were more likely than others to have great/some concerns about health (49%), and believe that a wind farm would have a negative impact on property values (66%).

42
Table 2.23: Regional variation in perceived impact on local community of a wind farm within 1–2 kilometres of residence (prompted).
Total non-metropolitan
areasNorthEast
Hunter/CentralCoast**
NorthWest
SouthEast
SouthWest
Property valuesPositive impact
No impact
Negative impact
Visual appealPositive impact
No impact
Negative impact
NoiseLittle/no concern
Some/great concern
Health issuesLittle/no concern
Some/great concern
1210
10
24
54
16
29
51
37
58
54
41
250
12
20
56
19
23†
53
36
59
52
42
210
10
27
51
13
28
51
36
56
60*
36
250
11
28
50
20
36*
43†
43
54
52
43
250
5†
21
66*
12
29
56
38
60
48
49*
250
9
21
58
16
30
50
31
64
47†
48
Number of respondents
Numbers below are shown as percentages.
Notes: * † indicates statistically significant difference at the 95% level of confidence; * indicates a result was higher and † indicates a result was lower when demographics were compared.
** excluding Newcastle.
Table 2.24: Demographic variation in perceived impact on local community of a wind farm within 1–2 km of residence (prompted).
1210
10
24
54
16
29
51
37
58
54
41
605
8
25
58
16
29
52
46*
50†
62*
35†
605
11
23
51
15
28
49
28†
65*
47†
48*
86
18*
28
48
23
34
41
45
47
70*
29
116
13
29
50
21
32
43
43
52
62
33
339
10
28
50
15
29
48
35
62
55
42
315
7
19†
64*
14
26
56
31†
63
47†
50*
354
8
22
54
13
27
55
38
55
51
41
367
5†
26
58
13
32
50
40
54
61*
36
484
9
24
57
13
28
53
34
61
54
41
359
12
24
51
20*
28
49
38
56
52
43
Property valuesPositive impact
No impact
Negative impact
Visual appealPositive impact
No impact
Negative impact
NoiseLittle/no concern
Some/great concern
Health issuesLittle/no concern
Some/great concern
UniDegree
TAFE/appren-ticeship
SchoolonlyMen 18–24 25–34 35–49 50–64 65+Women
Gender Age (years) Highest education levelTotal non-
metropolitan areas
Number of respondents Numbers below are shown as percentages.
Notes: * † indicates statistically significant difference at the 95% level of confidence; * indicates a result was higher and † indicates a result was lower when demographics were compared.

Community Attitudes to Renewable Energy in NSW 43
3 Regional summaries
This section of the report provides bullet point and graphic summary of the key survey results about renewable energy technologies for the seven regions in NSW. They are not intended to be a report on how people in each region differ from each other in relation to awareness, knowledge and attitudes.
3.1 North East Region(Number of respondents = 250)
Key factsRenewable energy
• dominant technologies associated with renewable energy were solar 88% and wind 74%• 93% supported using renewables to generate electricity in NSW• 86% believed NSW should increase the use of renewables over the next five years• most common perceived advantages of renewables (unprompted) were:
- environmental benefits 84% - lower cost 40%
• most common perceived disadvantages (unprompted): - higher cost 30% - concerns about efficiency and reliability 17% - no disadvantages 45%
• 63% were prepared to use renewables ‘provided I don’t have to pay more for my electricity’, and 35% were prepared to pay more to support them.
Solar and wind farms in NSW
• solar: 91% supported the use of solar farms in NSW, 82% in their local region, and 80% within 1–2 kilometres of where they lived
• wind: 81% supported the use of wind farms in NSW, 72% in their local region, and 61% within 1–2 kilometres of where they lived
• among the 33% who opposed a wind farm within 1–2 kilometres of where they lived, the unprompted concerns most commonly raised were noise (59%), visual impact (31%), health issues (29%) and location suitability (29%).

44
Renewable energy – awareness, knowledge and attitudes
88100
85
64
7499
3893
56
7118
23
5
869
solar
wind
hydroelectric
bioenergy
geothermal
unprompted prompted know a lot/moderate amount
Ren
ewab
le e
nerg
y te
chno
logy
Percentage of respondents
Figure 3.1: North East Region ‒ awareness/self-assessed knowledge of renewable energy technologies by survey respondents.
‘Prompted’ refers to answers survey respondents gave after being prompted with suggested answers. ‘Unprompted’ refers to answers survey respondents voluntarily gave to survey questions. ‘Know a lot/moderate amount’ refers to the level of knowledge survey respondents reported they had about each renewable technology.

Community Attitudes to Renewable Energy in NSW 45
3%strongly oppose
59%strongly support
34%support
93% support
0%oppose
3%neither support or oppose/don’t know
Figure 3.2: North East Region ‒ support for using renewable energy technologies to generate electricity in NSW.
Survey respondents were asked to what extent they supported or opposed renewable energy technologies for producing at least some of the electricity in NSW.
86 10010 1
Percentage of respondents
stay the samemore less don’t know
3
Figure 3.3: North East Region ‒ use of renewable energy technologies to produce electricity in NSW over the next 5 years.
Survey respondents were asked whether, over the next five years, they thought NSW should try to produce more of its electricity from renewable energy, less, or it should stay the same as now.

46
35 10063
Percentage of respondents
a good idea, and you’re prepare to pay more for your electricity to support it
a good idea, as long as you don’t have to pay anything more for your electricity
don’t know
2
Figure 3.4: North East Region ‒ overall views about using renewable energy to produce electricity in NSW and its cost.
Note that no survey respondents answered ‘it’s just not a good idea to use renewable energy at all’.
Table 3.1: North East Region ‒ perceived advantages and disadvantages of using renewable energy technologies (unprompted).
Advantage DisadvantageNumber of respondents 250 250
Numbers below are shown as percentages.
Environment 84 3Cost 40 30Efficiency/reliability 0 17Employment 4 6Health 4 1Build energy sector/skills 1 0Noise 0 4Visual impact 0 2Takes a lot of space 0 2Lack existing infrastructure 0 3Other 9 8None/don’t know 8 45

Community Attitudes to Renewable Energy in NSW 47
Attitudes to wind or solar farms
21
33
1 3
2 9 11
6 10 16
45 7227
6144
91
8238
8042
46 8135NSW
local region
1-2kms
NSW
Solar farms
1-2kms
local region
13
Wind farms
17
4
44
38
Percentage of respondents
strongly support it support it oppose it strongly oppose it
4 9
8 13
16 17
4348
Figure 3.5: North East Region ‒ support for and opposition to building wind or solar farms in three proximities – in NSW, in the local region, and within 1–2 kilometres of where survey respondents lived.
Table 3.2: North East Region ‒ reasons for supporting a wind or solar farm located within 1–2 kilometres of where a survey respondent lived (unprompted).
Reasons for support Solar farm Wind farmNumber of respondents 199 150
Numbers below are shown as percentages.
Environment 62 69Cost 27 20Local economy 15 13More electricity 7 7Better than coal 14 6Visual 6 5Noise 10 0Suited for area/Australia 9 0Good alternative source 4 7Health 3 6Way of the future 2 5Other 9 12None/don’t know 2 5

48
Table 3.3: North East Region ‒ unprompted concerns of respondents who oppose a wind or solar farm within 1–2 kilometres of where survey respondents lived.
Solar farm Wind farmNumber of respondents 411 88
Numbers below are shown as percentages.
Noise 0 59Visual 24 31Health 11 29Location issues 36 29Environment 15 15Efficiency/reliability 0 12Cost 4 9Takes a lot of space 6 1Not enough information 9 0Property values 0 1Use of land for agriculture 8 0Other 20 9None/don't know 1 2
Notes: 1. Caution interpreting results because of small sample size.
Table 3.4: North East Region ‒ perceived impact of wind farms on property value and visual appeal (prompted).
Positive Negative No impact Don’t knowNumbers below are shown as percentages.
Property values 12 56 20 12Visual appeal of area 19 53 23 5
Note: Number of respondents = 250.
Table 3.5: North East Region ‒ level of concern about noise and health issues caused by wind farms (prompted).
Great/ some concern
Little/ no concern Don’t know
Numbers below are shown as percentages.
Noise 59 36 5Health 42 52 6
Note: Number of respondents = 250.

Community Attitudes to Renewable Energy in NSW 49
3.2 Hunter/Central Coast Region
This is a bullet point and graphic summary of key survey results about renewable energy technologies for the Hunter/Central Coast Region of NSW. It is not intended to be a report on how people in this region differ from people in other regions in relation to awareness, knowledge and attitudes.
Note: People living in Newcastle were not asked questions in relation to local wind and solar farms. Consequently, results about renewable energy were based on the entire region and results concerning local wind and solar farms in the Hunter/Central Coast region do not include Newcastle.
(Number of respondents = 210)
Key facts
Renewable energy
• dominant technologies associated with renewable energy were solar 77% and wind 67%• 93% supported using renewables to generate electricity in NSW• 85% believed NSW should increase the use of renewables over the next five years• most common perceived advantages of renewables (unprompted):
- environmental benefits 79% - lower cost 34%
• most common perceived disadvantages (unprompted): - higher cost 36% - concerns about efficiency and reliability 14% - no disadvantages 40%
• 65% were prepared to use renewables ‘provided I don’t have to pay more for my electricity’ and 30% were prepared to pay more to support them.
Solar and wind farms in NSW• solar: 89% supported the use of solar farms in NSW, 80% in their local region,
and 76% within 1–2 kilometres of where they lived.• wind: 79% supported the use of wind farms in NSW, 71% in their local region,
and 57% within 1–2 kilometres of where they lived• among the 39% who opposed a wind farm within 1–2 kilometres of where they lived,
the unprompted concerns most commonly raised were noise (58%), visual impact (47%), health issues (20%) and location suitability (21%).

50
Renewable energy – awareness, knowledge and attitudes
77100
6799
2891
611
1461
72
51
44
11
15
solar
wind
hydroelectric
bioenergy
geothermal
Ren
ewab
le e
nerg
y te
chno
logy
Percentage of respondents
unprompted prompted know a lot/moderate amount
Figure 3.6: Hunter/Central Coast Region ‒ awareness/self-assessed knowledge of renewable energy technologies by survey respondents.
‘Prompted’ refers to answers survey respondents gave after being prompted with suggested answers. ‘Unprompted’ refers to answers survey respondents voluntarily gave to survey questions. ‘Know a lot/moderate amount’ refers to the level of knowledge survey respondents reported they had about each renewable technology.

Community Attitudes to Renewable Energy in NSW 51
3%neither support
or oppose/don’t know
1%strongly oppose
41%strongly support
51%support
92% support
3%oppose
Figure 3.7: Hunter/Central Coast Region ‒ support for using renewable energy technologies to generate electricity in NSW.
Survey respondents were asked to what extent they supported or opposed renewable energy technologies for producing at least some of the electricity in NSW.
85 100
2
12
Percentage of respondents
stay the samemore less don’t know
1
Figure 3.8: Hunter/Central Coast Region ‒ use of renewable energy technologies to produce electricity in NSW over the next 5 years.
Survey respondents were asked whether, over the next five years, they thought NSW should try to produce more of its electricity from renewable energy, less, or it should stay the same as now.

52
30 9965
Percentage of respondents
a good idea, and you’re prepare to pay more for your electricity to support it
a good idea, as long as you don’t have to pay anything more for your electricity
don’t know
1
3
it’s just not a good idea to use renewable energy at all
Figure 3.9: Hunter/Central Coast Region ‒ overall views about using renewable energy to produce electricity in NSW and its cost.
Table 3.6: Hunter/Central Coast Region ‒ perceived advantages and disadvantages of using renewable energy technologies (unprompted).
Advantage DisadvantageNumber of respondents 250 250
Numbers below are shown as percentages.
Environment 79 5Cost 34 36Efficiency/reliability 0 14Employment 7 8Health 6 2Build energy sector/skills 4 0Noise 0 2Visual impact 0 5Takes a lot of space 0 4Lack existing infrastructure 0 0Other 7 9None/don’t know 12 40

Community Attitudes to Renewable Energy in NSW 53
Attitudes to wind or solar farms
*Respondents living in Newcastle were not asked these questions (number of respondents =210)
Figure 3.10: Hunter/Central Coast Region ‒ support for and opposition to building wind or solar farms in three proximities – in NSW, in the local region, and within 1–2 kilometres of where survey respondents lived.*
Table 3.7: Hunter/Central Coast Region ‒ reasons for supporting a wind or solar farm located within 1–2 kilometres of where a survey respondent lived (unprompted).
Solar farm Wind farmNumber of respondents 165 122
Numbers below are shown as percentages.
Environment 66 76Cost 32 22Local economy 8 12More electricity 7 5Better than coal 16 10Visual 7 6Noise 4 0Suited for area/Australia 2 0Good alternative source 5 4Health 4 3Way of the future 4 3Other 16 14None/don’t know 2 3
27
39
1 3
2 10 12
4 14 18
47 7124
5739
89
8049
7646
47 7932NSW
local region
1-2kms
NSW
Solar farms
1-2kms
local region
17
Wind farms
18
4
31
30
Percentage of respondents
strongly support it support it oppose it strongly oppose it
10 7
15 12
21 18
4643

54
Table 3.8: Hunter/Central Coast Region ‒ unprompted concerns of respondents who oppose a wind or solar farm within 1–2 kilometres of where survey respondents lived.
Solar farm Wind farmNumber of respondents 351 81
Numbers below are shown as percentages.
Noise 2 58Visual 13 47Health 5 20Location issues 34 21Environment 19 13Efficiency/reliability 2 6Cost 9 8Takes a lot of space 25 10Not enough information 20 0Property values 0 2Use of land for agriculture 5 0Other 1 11None/don't know 4 5
1. Caution interpreting results because of small sample size
Table 3.9: Hunter/Central Coast Region ‒ perceived impact of wind farms on property value and visual appeal (prompted).
Positive Negative No impact Don’t knowNumbers below are shown as percentages.
Property values 10 51 27 12Visual appeal of area 13 51 28 8
Note: Number of respondents = 210.
Table 3.10: Hunter/Central Coast Region ‒ level of concern about noise and health issues caused by wind farms (prompted).
Great/ some concern
Little/ no concern Don’t know
Numbers below are shown as percentages.
Noise 56 36 8Health 36 60 3
*Respondents living in Newcastle were not asked these questions. Note: Number of respondents = 210.

Community Attitudes to Renewable Energy in NSW 55
3.3 North West Region
This is a bullet point and graphic summary of key survey results about renewable energy technologies for the North West Region of NSW. It is not intended to be a report on how people in this region differ from people in other regions in relation to awareness, knowledge and attitudes.
(Number of respondents = 250)
Key facts
Renewable energy
• dominant technologies associated with renewable energy were solar 86% and wind 70%• 94% supported using renewables to generate electricity in NSW• 81% believed NSW should increase the use of renewables over the next five years• most common perceived advantages of renewables (unprompted):
- environmental benefits 79% - lower cost 45%
• most common perceived disadvantages (unprompted): - higher cost 36% - concerns about efficiency and reliability 19% - no disadvantages 40%
• 74% were prepared to use renewables ‘provided I don’t have to pay more for my electricity’ and 22% were prepared to pay more to support them.
Solar and wind farms in NSW• solar: 95% supported the use of solar farms in NSW, 92% in their local region,
and 84% within 1–2 kilometres of where they lived• wind: 86% supported the use of wind farms in NSW, 79% in their local region,
and 64% within 1–2 kilometres of where they lived• among the 34% who opposed a wind farm within 1–2 kilometres of where they lived,
the unprompted concerns most commonly raised were noise (69%), location suitability (30%), visual impact (28%) and health issues (23%).

56
Renewable energy – awareness, knowledge and attitudes
73
51
45
12
15
8699
7097
3091
642
956
solar
wind
hydroelectric
bioenergy
geothermal
Ren
ewab
le e
nerg
y te
chno
logy
Percentage of respondents
unprompted prompted know a lot/moderate amount
Figure 3.11: North West Region ‒ awareness/self-assessed knowledge of renewable energy technologies by survey respondents.
‘Prompted’ refers to answers survey respondents gave after being prompted with suggested answers. ‘Unprompted’ refers to answers survey respondents voluntarily gave to survey questions. ‘Know a lot/moderate amount’ refers to the level of knowledge survey respondents reported they had about each renewable technology.

Community Attitudes to Renewable Energy in NSW 57
2%strongly oppose
43%strongly support
51%support
94% support
2%oppose
2%neither support or oppose/don’t know
Figure 3.12: North West Region ‒ support for using renewable energy technologies to generate electricity in NSW.
Survey respondents were asked to what extent they supported or opposed renewable energy technologies for producing at least some of the electricity in NSW.
81 99
2
17
Percentage of respondents
stay the samemore less don’t know
1
Figure 3.13: North West Region ‒ use of renewable energy technologies to produce electricity in NSW over the next 5 years.
Survey respondents were asked whether, over the next five years, they thought NSW should try to produce more of its electricity from renewable energy, less, or it should stay the same as now.

58
22 10074
Percentage of respondents
a good idea, and you’re prepare to pay more for your electricity to support it
a good idea, as long as you don’t have to pay anything more for your electricity
don’t know
2 2
it’s just not a good idea to use renewable energy at all
Figure 3.14: North West Region ‒ overall views about using renewable energy to produce electricity in NSW and its cost.
Table 3.11: North West Region ‒ perceived advantages and disadvantages of using renewable energy technologies (unprompted).
Advantage DisadvantageNumber of respondents 250 250
Numbers below are shown as percentages.
Environment 79 3Cost 45 36Efficiency/reliability 0 19Employment 6 6Health 4 3Build energy sector/skills 2 0Noise 0 6Visual impact 0 4Takes a lot of space 0 4Lack existing infrastructure 0 2Other 9 4None/don’t know 11 40

Community Attitudes to Renewable Energy in NSW 59
Attitudes to wind or solar farms
17
39
1 2
1 2 3
5 8 13
55 7124
6446
95
9247
8451
58 8628NSW
local region
1-2kms
NSW
Solar farms
1-2kms
local region
10
Wind farms
18
3
45
33
Percentage of respondents
strongly support it support it oppose it strongly oppose it
4 6
6 11
15 19
4946
Figure 3.15: North West Region ‒ support for and opposition to building wind or solar farms in three proximities – in NSW, in the local region, and within 1–2 kilometres of where survey respondents lived.
Table 3.12: North West Region ‒ reasons for supporting a wind or solar farm located within 1–2 kilometres of where a survey respondent lived (unprompted).
Solar farm Wind farmNumber of respondents 205 153
Numbers below are shown as percentages.
Environment 56 60Cost 30 29Local economy 21 16More electricity 11 15Better than coal 9 5Visual 6 9Noise 5 3Suited for area/Australia 5 1Good alternative source 3 4Health 2 3Way of the future 4 0Other 16 12None/don’t know 4 8

60
Table 3.13: North West Region ‒ concerns about building a wind or solar farm within 1–2 kilometres of where survey respondents lived (unprompted).
Solar farm Wind farmNumber of respondents 351 89
Numbers below are shown as percentages.
Noise 3 69Visual 21 28Health 3 23Location issues 28 30Environment 18 17Efficiency/reliability 4 14Cost 11 8Takes a lot of space 20 5Not enough information 15 0Property values 3 3Use of land for agriculture 7 0Other 17 14None/don't know 0 0
1. Caution interpreting results because of small sample size
Table 3.14: North West Region ‒ perceived impact of wind farms on property value and visual appeal (prompted).
Positive Negative No impact Don’t knowNumbers below are shown as percentages.
Property values 11 50 28 11Visual appeal of area 20 43 36 1
Note: Number of respondents = 250.
Table 3.15: North West Region ‒ level of concern about noise and health issues caused by wind farms (prompted).
Great/ some concern
Little/ no concern Don’t know
Numbers below are shown as percentages.
Noise 54 43 3Health 43 52 5
Note: Number of respondents = 250.
Community Attitudes to Renewable Energy in NSW 61
3.4 South East Region
This is a bullet point and graphic summary of key survey results about renewable energy technologies for the South East Region of NSW. It is not intended to be a report on how people in this region differ from people in other regions in relation to awareness, knowledge and attitudes.
(Number of respondents = 250)
Key facts
Renewable energy
• dominant technologies associated with renewable energy were solar 86% and wind 82%• 90% supported using renewables to generate electricity in NSW• 82% believed NSW should increase the use of renewables over the next five years• most common perceived advantages of renewables (unprompted):
- environmental benefits 83% - lower cost 37%
• most common perceived disadvantages (unprompted): - higher cost 39% - concerns about efficiency and reliability 18% - no disadvantages 34%
• 70% were prepared to use renewables ‘provided I don’t have to pay more for my electricity’ and 26% were prepared to pay more to support them.
Solar and wind farms in NSW
• solar: 88% supported the use of solar farms in NSW, 85% in their local region, and 74% within 1–2 kilometres of where they lived
• wind: 79% supported the use of wind farms in NSW, 72% in their local region, and 56% within 1–2 kilometres of where they lived
• among the 41% who opposed a wind farm within 1–2 kilometres of where they lived, the unprompted concerns most commonly raised were noise (56%), visual impact (39%) and health issues (27%).

62
Renewable energy – awareness, knowledge and attitudes
86100
8299
2889
673
1569
75
68
54
16
19
solar
wind
hydroelectric
bioenergy
geothermal
Ren
ewab
le e
nerg
y te
chno
logy
Percentage of respondents
unprompted prompted know a lot/moderate amount
Figure 3.16: South East Region ‒ Awareness/self-assessed knowledge of renewable energy technologies by survey respondents.
‘Prompted’ refers to answers survey respondents gave after being prompted with suggested answers. ‘Unprompted’ refers to answers survey respondents voluntarily gave to survey questions. ‘Know a lot/moderate amount’ refers to the level of knowledge survey respondents reported they had about each renewable technology.

Community Attitudes to Renewable Energy in NSW 63
3%strongly oppose
49%strongly support
41%support
90% support
2%oppose 5%
neither support or oppose/don’t know
Figure 3.17: South East Region ‒ support for using renewable energy technologies to generate electricity in NSW.
Survey respondents were asked to what extent they supported or opposed renewable energy technologies for producing at least some of the electricity in NSW.
82 100211
Percentage of respondents
stay the samemore less don’t know
5
Figure 3.18: South East Region ‒ use of renewable energy technologies to produce electricity in NSW over the next 5 years.
Survey respondents were asked whether, over the next five years, they thought NSW should try to produce more of its electricity from renewable energy, less, or it should stay the same as now.

64
26 10170
Percentage of respondents
a good idea, and you’re prepare to pay more for your electricity to support it
a good idea, as long as you don’t have to pay anything more for your electricity
don’t know
2
it’s just not a good idea to use renewable energy at all
3
Figure 3.19: South East Region ‒ overall views about using renewable energy to produce electricity in NSW and its cost.
Note. Numbers may not sum to 100 due to rounding.
Table 3.16: South East Region ‒ perceived advantages and disadvantages of using renewable energy technologies (unprompted).
Advantage DisadvantageNumber of respondents 250 250
Numbers below are shown as percentages.
Environment 83 5Cost 37 39Efficiency/reliability 0 18Employment 9 3Health 5 3Build energy sector/skills 5 0Noise 0 4Visual impact 0 8Takes a lot of space 0 2Lack existing infrastructure 0 2Other 6 14None/don’t know 12 34

Community Attitudes to Renewable Energy in NSW 65
Attitudes to wind or solar farms
24
41
1 4
5 5 10
9 12 21
41 7231
5632
88
8543
7438
44 7935NSW
local region
1-2kms
NSW
Solar farms
1-2kms
local region
16
Wind farms
24
5
42
36
Percentage of respondents
strongly support it support it oppose it strongly oppose it
6 10
10 14
22 19
4246
Figure 3.20: South East Region ‒ support for and opposition to building wind or solar farms in three proximities – in NSW, in the local region, and within 1–2 kilometres of where survey respondents lived.
Table 3.17: South East Region ‒ reasons for supporting a wind or solar farm located within 1–2 kilometres of where a survey respondent lived (unprompted).
Solar farm Wind farmNumber of respondents 196 145
Numbers below are shown as percentages.
Environment 63 66Cost 23 20Local economy 18 16More electricity 7 5Better than coal 6 2Visual 9 12Noise 6 4Suited for area/Australia 6 0Good alternative source 2 5Health 4 1Way of the future 4 4Other 13 7None / don’t know 3 3

66
Table 3.18: South East Region ‒ concerns about building a wind or solar farm within 1–2 kilometres of where survey respondents lived (unprompted).
Solar farm Wind farmNumber of respondents 421 98
Numbers below are shown as percentages.
Noise 3 56Visual 36 39Health 10 27Location issues 28 19Environment 8 11Efficiency/ reliability 8 7Cost 7 10Takes a lot of space 4 5Not enough information 3 0Property values 13 12Use of land for agriculture 11 0Other 21 13None / don't know 4 4
1. Caution interpreting results because of small sample size
Table 3.19: South East Region ‒ perceived impact of wind farms on property value and visual appeal (prompted).
Positive Negative No impact Don’t knowNumbers below are shown as percentages.
Property values 5 66 21 8Visual appeal of area 12 56 29 2
Note: Number of respondents = 250.
Table 3.20: South East Region ‒ level of concern about noise and health issues caused by wind farms (prompted).
Great/ some concern
Little/ no concern Don’t know
Numbers below are shown as percentages.
Noise 60 38 2Health 49 48 3
Note: Number of respondents = 250.

Community Attitudes to Renewable Energy in NSW 67
3.5 South West Region
This is a bullet point and graphic summary of key survey results about renewable energy technologies for the South West Region of NSW. It is not intended to be a report on how people in this region differ from people in other regions in relation to awareness, knowledge and attitudes.
(Number of respondents = 250)
Key facts
Renewable energy
• dominant technologies associated with renewable energy were solar 79% and wind 61%• 91% supported using renewables to generate electricity in NSW• 79% believed NSW should increase the use of renewables over the next five years• most common perceived advantages of renewables (unprompted):
- environmental benefits 73% - lower cost 39%
• most common perceived disadvantages (unprompted): - higher cost 28% - concerns about efficiency and reliability 15% - no disadvantages 49%
• 74% were prepared to used renewables ‘provided I don’t have to pay more for my electricity’ and 20% were prepared to pay more to support them.
Solar and wind farms in NSW
• solar: 93% supported the use of solar farms in NSW, 85% in their local region, and 77% within 1–2 kilometres of where they lived
• wind: 77% supported the use of wind farms in NSW, 71% in their local region, and 53% within 1–2 kilometres of where they lived
• among the 41% who opposed a wind farm within 1–2 kilometres of where they lived, the unprompted concerns most commonly raised were noise (66%), visual impact (35%), health issues and location suitability (20% each).

68
Renewable energy – awareness, knowledge and attitudes
79100
6198
3295
672
860
73
54
50
16
14
solar
wind
hydroelectric
bioenergy
geothermal
Ren
ewab
le e
nerg
y te
chno
logy
Percentage of respondents
unprompted prompted know a lot/moderate amount
Figure 3.21: South West Region ‒ awareness/self-assessed knowledge of renewable energy technologies by survey respondents.
‘Prompted’ refers to answers survey respondents gave after being prompted with suggested answers. ‘Unprompted’ refers to answers survey respondents voluntarily gave to survey questions. ‘Know a lot/moderate amount’ refers to the level of knowledge survey respondents reported they had about each renewable technology.

Community Attitudes to Renewable Energy in NSW 69
1%strongly oppose
38%strongly support
52%support
90% support
4%oppose 5%
neither support or oppose/don’t know
Figure 3.22: South West Region ‒ support for using renewable energy technologies to generate electricity in NSW.
Survey respondents were asked to what extent they supported or opposed renewable energy technologies for producing at least some of the electricity in NSW.
79 1003 315
Percentage of respondents
stay the samemore less don’t know
Figure 3.23: South West Region ‒ use of renewable energy technologies to produce electricity in NSW over the next 5 years.
Survey respondents were asked whether, over the next five years, they thought NSW should try to produce more of its electricity from renewable energy, less, or it should stay the same as now.

70
20 10074 5
Percentage of respondents
a good idea, and you’re prepare to pay more for your electricity to support it
a good idea, as long as you don’t have to pay anything more for your electricity
don’t know
1
it’s just not a good idea to use renewable energy at all
Figure 3.24: South West Region ‒ overall views about using renewable energy to produce electricity in NSW and its cost.
Table 3.21: South West Region ‒ perceived advantages and disadvantages of using renewable energy technologies (unprompted).
Advantage DisadvantageNumber of respondents 250 250
Numbers below are shown as percentages.
Environment 73 4Cost 39 28Efficiency/reliability 0 15Employment 6 6Health 2 2Build energy sector/skills 3 0Noise 0 3Visual impact 0 3Takes a lot of space 0 2Lack existing infrastructure 0 2Other 11 8None/don’t know 13 49

Community Attitudes to Renewable Energy in NSW 71
Attitudes to wind or solar farms
24
41
3
1 6 7
4 13 17
50 7121
5337
93
8549
7745
51 7726NSW
local region
1-2kms
NSW
Solar farms
1-2kms
local region
15
Wind farms
16
3
36
32
Percentage of respondents
strongly support it support it oppose it strongly oppose it
4 11
9 14
17 24
5439
Figure 3.25: Support for and opposition to building wind or solar farms in three proximities – in NSW, in the local region, and within 1–2 kilometres of where survey respondents lived.
Table 3.22: South West Region ‒ reasons for supporting a wind or solar farm located within 1–2 kilometres of where a survey respondent lived (unprompted).
Solar farm Wind farmNumber of respondents 195 132
Numbers below are shown as percentages.
Environment 56 62Cost 30 28Local economy 16 19More electricity 9 10Better than coal 5 3Visual 7 6Noise 6 1Suited for area/Australia 11 0Good alternative source 2 7Health 1 2Way of the future 3 5Other 9 16None/don’t know 4 6

72
Table 3.23: South West Region ‒ concerns about building a wind and solar farm within 1–2 kilometres of where survey respondents lived (unprompted).
Solar farm Wind farmNumber of respondents 411 102
Numbers below are shown as percentages.
Noise 3 66Visual 17 35Health 6 20Location issues 29 20Environment 13 13Efficiency/reliability 4 10Cost 6 8Takes a lot of space 16 1Not enough information 7 0Property values 4 4Use of land for agriculture 17 0Other 14 7None/don't know 4 3
1. Caution interpreting results because of small sample size
Table 3.24: South West Region ‒ perceived impact of wind farms on property value and visual appeal (prompted).
Positive Negative No impact Don’t knowNumbers below are shown as percentages.
Property values 9 58 21 12Visual appeal of area 16 50 30 3
Note: Number of respondents = 250.
Table 3.25: South West Region ‒ level of concern about noise and health issues caused by wind farms (prompted).
Great/ some concern
Little/ no concern Don’t know
Numbers below are shown as percentages.
Noise 64 31 5Health 48 47 5
Note: Number of respondents = 250.
Community Attitudes to Renewable Energy in NSW 73
3.6 Illawarra Region
This is a bullet point and graphic summary of key survey results about renewable energy technologies for the Illawarra Region of NSW. It is not intended to be a report on how people in this region differ from people in other regions in relation to awareness, knowledge and attitudes.
Note: This summary does not contain information about attitudes to local wind and solar farms because these issues were not explored in this region.
(Number of respondents = 250)
Key facts
Renewable energy
• dominant technologies associated with ‘renewable energy’ were solar 84% and wind 63%• 91% supported using renewables to generate electricity in NSW• 89% believed NSW should increase the use of renewables over the next five years• most common perceived advantages of renewables (unprompted):
- environmental benefits 83% - lower cost 44%
• most common perceived disadvantages (unprompted): - higher cost 34% - concerns about efficiency and reliability 14% - no disadvantages 43%
• 69% were prepared to use renewables ‘provided I don’t have to pay more for my electricity’ and 29% were prepared to pay more to support them.
Solar and wind farms in NSW
• solar: 95% supported and 42% strongly supported the use of solar farms in NSW• wind: 87% supported and 38% strongly supported the use of wind farms in NSW.

74
Renewable energy – awareness, knowledge and attitudes
72
56
44
13
16
84100
6397
2894
622
666
solar
Percentage of respondents
wind
hydroelectric
bioenergy
geothermal
Ren
ewab
le e
nerg
y te
chno
logy
unprompted prompted know a lot/moderate amount
Figure 3.26: Illawarra Region ‒ awareness/self-assessed knowledge of renewable energy technologies by survey respondents.
‘Prompted’ refers to answers survey respondents gave after being prompted with suggested answers. ‘Unprompted’ refers to answers survey respondents voluntarily gave to survey questions. ‘Know a lot/moderate amount’ refers to the level of knowledge survey respondents reported they had about each renewable technology.

Community Attitudes to Renewable Energy in NSW 75
3%strongly oppose
49%strongly support
42%support
91% support
2%oppose 4%
neither support or oppose/don’t know
Figure 3.27: Illawarra Region ‒ support for using renewable energy technologies to generate electricity in NSW.
Survey respondents were asked to what extent they supported or opposed renewable energy technologies for producing at least some of the electricity in NSW.
89 1009
Percentage of respondents
stay the samemore less don’t know
11
Figure 3.28: Illawarra Region ‒ use of renewable energy technologies to produce electricity in NSW over the next 5 years.
Survey respondents were asked whether, over the next five years, they thought NSW should try to produce more of its electricity from renewable energy, less, or it should stay the same as now.

76
29 10069
Percentage of respondents
a good idea, and you’re prepare to pay more for your electricity to support it
a good idea, as long as you don’t have to pay anything more for your electricity
it’s just not a good idea to use renewable energy at all
2
Figure 3.29: Illawarra Region ‒ overall views about using renewable energy to produce electricity in NSW and its cost.
Table 3.26: Illawarra Region ‒ perceived advantages and disadvantages of using renewable energy technologies (unprompted).
Advantage DisadvantageNumber of respondents 250 250
Numbers below are shown as percentages.
Environment 83 5Cost 44 34Efficiency/reliability 0 14Employment 4 7Health 3 1Build energy sector/skills 3 0Noise 0 3Visual impact 0 2Takes a lot of space 0 1Lack existing infrastructure 0 0Other 9 10None/don’t know 8 43
Community attitudes to wind and solar farms
353 9542
49 8738
Solar farms
10Wind farms
Percentage of respondents
strongly support it support it oppose it strongly oppose it
4 6
1 2
Figure 3.30: Illawarra Region ‒ support for and opposition to building wind or solar farms in NSW.

Community Attitudes to Renewable Energy in NSW 77
3.7 Greater Sydney Region
This is a bullet point and graphic summary of key survey results about renewable energy technologies for the Greater Sydney Region of NSW. It is not intended to be a report on how people in this region differ from people in other regions in relation to awareness, knowledge and attitudes.
Note: This summary does not contain information about attitudes to local wind and solar farms because these issues were not explored in this region.
(Number of respondents = 500)
Key facts
Renewable energy
• dominant technologies associated with renewable energy were solar 71% and wind 60%• 91% supported using renewables to generate electricity in NSW• 83% believed NSW should increase the use of renewables over the next five years• most common perceived advantages of renewables (unprompted):
- environmental benefits 80% - lower cost 35%
• most common perceived disadvantages (unprompted): - higher cost 43% - concerns about efficiency and reliability 19% - no disadvantages 35%
• 61% were prepared to use renewables ‘provided I don’t have to pay more for my electricity’ and 34% were prepared to pay more to support them.
Solar and wind farms in NSW
• solar: 87% supported and 43% strongly supported the use of solar farms in NSW • wind: 81% supported and 36% strongly supported the use of wind farms in NSW.

78
Renewable energy – awareness, knowledge and attitude
73
58
49
16
18
7199
6098
3186
613
858
solar
wind
hydroelectric
bioenergy
geothermal
unprompted prompted know a lot/moderate amount
Ren
ewab
le e
nerg
y te
chno
logy
Percentage of respondents
Figure 3.31: Greater Sydney Region ‒ awareness/self-assessed knowledge of renewable energy technologies by survey respondents.
‘Prompted’ refers to answers survey respondents gave after being prompted with suggested answers. ‘Unprompted’ refers to answers survey respondents voluntarily gave to survey questions. ‘Know a lot/moderate amount’ refers to the level of knowledge survey respondents reported they had about each renewable technology.

Community Attitudes to Renewable Energy in NSW 79
2%strongly oppose
50%strongly support
41%support
91% support
2%oppose 3%
neither support or oppose/don’t know
Figure 3.32: Greater Sydney Region ‒ support for using renewable energy technologies to generate electricity in NSW.
Survey respondents were asked to what extent they supported or opposed renewable energy technologies for producing at least some of the electricity in NSW.
83 10010
Percentage of respondents
stay the samemore less don’t know
3 4
Figure 3.33: Greater Sydney Region ‒ use of renewable energy technologies to produce electricity in NSW over the next 5 years.

80
Survey respondents were asked whether, over the next five years, they thought NSW should try to produce more of its electricity from renewable energy, less, or it should stay the same as now.
34 10061
Percentage of respondents
a good idea, and you’re prepare to pay more for your electricity to support it
a good idea, as long as you don’t have to pay anything more for your electricity
don’t know
3
it’s just not a good idea to use renewable energy at all
2
Figure 3.34: Greater Sydney Region ‒ overall views about using renewable energy to produce electricity in NSW and its cost.
Table 3.27: Greater Sydney Region ‒ perceived advantages and disadvantages of using renewable energy technologies (unprompted).
Advantage DisadvantageNumber of respondents 500 500
Numbers below are shown as percentages.
Environment 80 6Cost 35 43Efficiency/reliability 0 19Employment 7 4Health 4 3Build energy sector/skills 6 0Noise 0 5Visual impact 0 2Takes a lot of space 0 3Lack existing infrastructure 0 3Other 8 8None/don’t know 12 35
Community attitudes to wind and solar farms
944 8743
45 8136
Solar farms
15Wind farms
Percentage of respondents
strongly support it support it oppose it strongly oppose it
6 9
3 6
Figure 3.35: Greater Sydney Region ‒ support for and opposition to building wind or solar farms in NSW.
