community-aware charging station network … charging station network design for electrified ... and...
TRANSCRIPT

TRCLC 15-08
August 31, 2016
Community-Aware Charging Station Network Design for Electrified Vehicles in Urban Areas:
Reducing Congestion, Emissions, Improving Accessibility, and
Promoting Walking, Bicycling, and use of Public Transportation
FINAL REPORT
DEVELOPED BY:
Dr. Ratna Babu Chinnam (PI) Professor
Tel: 313-577-4846; Fax: 313-578-5902 E-mail: [email protected]
Dr. Alper E. Murat (Co-PI)
Associate Professor Tel: 313-577-4846; Fax: 313-578-5902
E-mail: [email protected]
Western Michigan University | University of Texas at Arlington | Utah State University | Wayne State University | Tennessee State University

Technical Report Documentation Page
1. Report No.
TRCLC 15-08 2. Government Accession No.
N/A 3. Recipient’s Catalog No.
N/A
4. Title and Subtitle
Community-Aware Charging Station Network Design for Electrified Vehicles in Urban Areas:
Reducing Congestion, Emissions, Improving
Accessibility, and Promoting Walking, Bicycling, and
use of Public Transportation
5. Report Date
August 31, 2016
6. Performing Organization Code
N/A
7. Author(s)
Dr. Ratna Babu Chinnam (PI), Dr. Alper E. Murat (Co-PI)
8. Performing Org. Report No.
N/A
9. Performing Organization Name and Address
Western Michigan University
1903 West Michigan Avenue
Kalamazoo, MI 49008
10. Work Unit No. (TRAIS)
N/A
11. Contract No.
TRCLC 15-08 12. Sponsoring Agency Name and Address
Transportation Research Center for Livable Communities
(TRCLC)
1903 W. Michigan Ave., Kalamazoo, MI 49008-5316
13. Type of Report & Period Covered
Final Report
9/1/2015 - 8/31/2016 14. Sponsoring Agency Code
N/A
15. Supplementary Notes
16. Abstract
A major challenge for achieving large-scale adoption of EVs is an accessible infrastructure for
the communities. The societal benefits of large-scale adoption of EVs cannot be realized without
adequate deployment of publicly accessible charging stations due to mutual dependence of EV
sales and public infrastructure deployment. Such infrastructure deployment also presents a
number of unique opportunities for promoting livability while helping to reduce the negative
side-effects of transportation (e.g., congestion, emissions, and noise pollution). In this phase, we
develop a modeling framework (MF) to consider various factors and their associated
uncertainties for an optimal network design for electrified vehicles. The factors considered in
the study include: state of charge, dwell time, Origin-Destination (OD) pair. 17. Key Words
Electric Vehicles Network Design, Livability,
Stochastic Model
18. Distribution Statement
No restrictions.
19. Security Classification - report
Unclassified
20. Security Classification - page
Unclassified
21. No. of Pages
22. Price
N/A

Community-Aware Charging Station Network Design for Electrified Vehicles
2
Disclaimer
The contents of this report reflect the views of the authors, who are solely responsible for the facts
and the accuracy of the information presented herein. This publication is disseminated under the
sponsorship of the U.S. Department of Transportation’s University Transportation Centers
Program, in the interest of information exchange. This report does not necessarily reflect the
official views or policies of the U.S. government, or the Transportation Research Center for Livable
Communities, who assume no liability for the contents or use thereof. This report does not represent
standards, specifications, or regulations.
Acknowledgments
This research was funded by the US Department of Transportation through the Transportation
Research Center for Livable Communities (TRCLC), a Tier 1 University Transportation Center at
Western Michigan University. We also would like to acknowledge our collaborators: Ford Motor
Company – Vehicle Electrification Group, Southeast Michigan Transportation Operations Center
(SEMTOC), Southeast Michigan Council of Governments (SEMCOG), HERE – Formerly known
as NAVTEQ, Traffic.com.

Community-Aware Charging Station Network Design for Electrified Vehicles
3
Community-Aware Charging Station Network Design for Electrified Vehicles in Urban Areas:
Reducing Congestion, Emissions, Improving Accessibility, and Promoting
Walking, Bicycling, and use of Public Transportation
EXECUTIVE SUMMARY
We developed a set of tools to support effective planning of network design for charging stations
for EVs in urban areas. Such infrastructure deployment also presents a number of unique
opportunities for promoting livability while helping to reduce the negative side-effects of
transportation (e.g., congestion and emissions). Mile-stone #1: Developed methods for efficient estimation of various factors important for
network design and understand the uncertainties associated with these factors. Real time data from
various publicly available resources are considered for the estimation of the factors. Mile-stone #2: Given the factors contributing to livability aspects and robust network design for
electrified vehicles, formulated a two-stage stochastic programming model to for the network
design of EVs for a community. Mile-stone #3: Applied the developed stochastic model and performed computational experiments,
and analyzed the usefulness of the model in terms of improvements in livability factors and
accessibility of the given network. The goal of the project is to provide series of tools for the city and governmental planning agencies
to evaluate the factors important for network design of EVs and improve livability aspects for the
communities. Shared the findings with SEMCOG and planning to pilot the methods in
collaboration with a SE-MI city under a project extension.

Community-Aware Charging Station Network Design for Electrified Vehicles
4
Table of Contents Abstract ................................................................................................................................ 6
Introduction .......................................................................................................................... 7
Overall Modeling Framework.......................................................................................... 9
Current Work ................................................................................................................. 10
Literature Review............................................................................................................... 10
Network Design for Electrified Vehicles ........................................................................... 13
Parameters and Uncertainties ......................................................................................... 15
State of Charge ........................................................................................................... 16
Dwell Time ................................................................................................................ 16
Weekday vs. Weekend ............................................................................................... 17
Preference for Charging Away from Home ............................................................... 18
EV Market Penetration .............................................................................................. 19
Willingness to Walk ....................................................................................................... 20
Two –Stage Stochastic Model Formulation ................................................................... 23
Modeling Uncertainty – Sample Average Approximation ............................................ 25
Case Study ......................................................................................................................... 26
Livability Assessment ........................................................................................................ 29
Traffic Reduction ........................................................................................................... 31
Emissions Reduction ...................................................................................................... 31
Public Health Benefits ................................................................................................... 32
Conclusions ........................................................................................................................ 32
Results Dissemination ........................................................................................................ 33
References .......................................................................................................................... 33
Community-Aware Charging Station Network Design for Electrified Vehicles
5
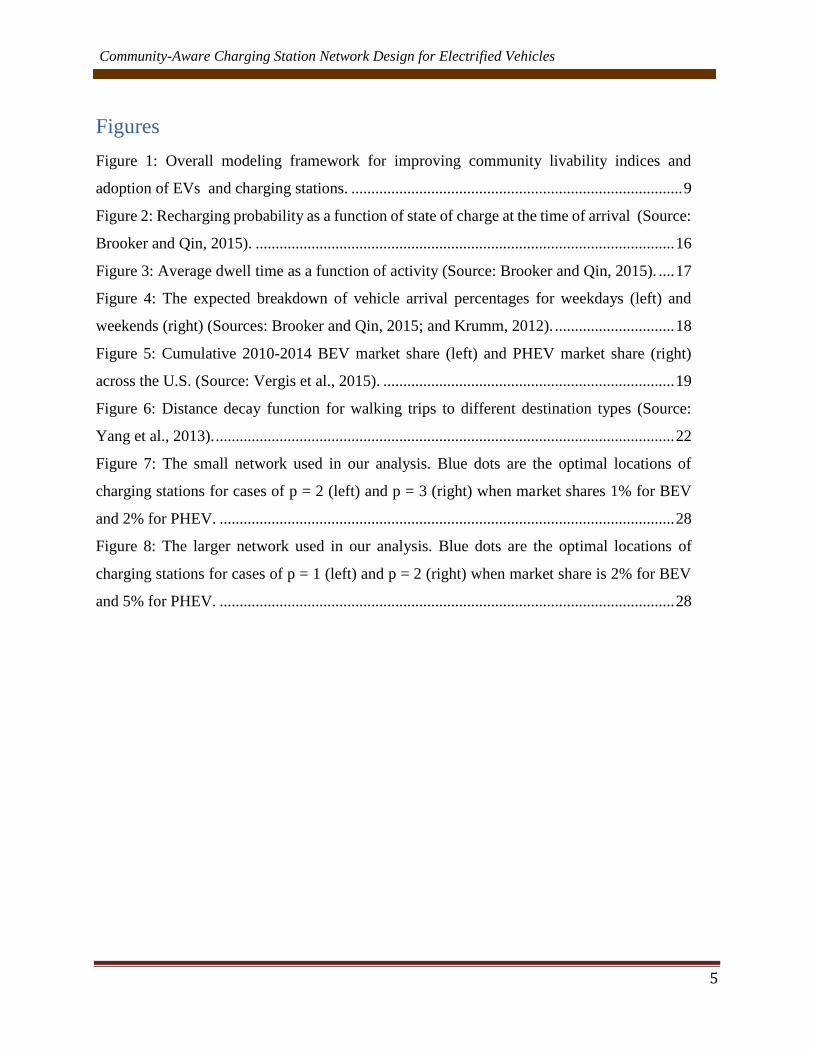
Figures Figure 1: Overall modeling framework for improving community livability indices and
adoption of EVs and charging stations. ................................................................................... 9
Figure 2: Recharging probability as a function of state of charge at the time of arrival (Source:
Brooker and Qin, 2015). ......................................................................................................... 16
Figure 3: Average dwell time as a function of activity (Source: Brooker and Qin, 2015). .... 17
Figure 4: The expected breakdown of vehicle arrival percentages for weekdays (left) and
weekends (right) (Sources: Brooker and Qin, 2015; and Krumm, 2012). .............................. 18
Figure 5: Cumulative 2010-2014 BEV market share (left) and PHEV market share (right)
across the U.S. (Source: Vergis et al., 2015). ......................................................................... 19
Figure 6: Distance decay function for walking trips to different destination types (Source:
Yang et al., 2013). ................................................................................................................... 22
Figure 7: The small network used in our analysis. Blue dots are the optimal locations of
charging stations for cases of p = 2 (left) and p = 3 (right) when market shares 1% for BEV
and 2% for PHEV. .................................................................................................................. 28
Figure 8: The larger network used in our analysis. Blue dots are the optimal locations of
charging stations for cases of p = 1 (left) and p = 2 (right) when market share is 2% for BEV
and 5% for PHEV. .................................................................................................................. 28

Community-Aware Charging Station Network Design for Electrified Vehicles
6
Abstract
Advantages of electric vehicles (EVs) include diversification of the transportation energy
feedstock, reduction of greenhouse gas and other emissions, energy security, fuel economy,
reduced operating costs, and reduced emissions leading to lesser air pollution levels. As a part of
government’s encouragement on vehicle electrification objectives, the major automobile
companies of the world are being challenged to produce affordable EVs by governments and
environmentally conscious consumers. Several companies have accepted the challenge, and more
models of EVs (hybrid vehicles, plug-in hybrid vehicles, pure battery EVs) are being introduced
every year around the world. A major challenge for achieving large-scale adoption of EVs is an
accessible infrastructure for the communities. The societal benefits of large-scale adoption of EVs
cannot be realized without adequate deployment of publicly accessible charging stations due to
mutual dependence of EV sales and public infrastructure deployment. Such infrastructure
deployment also presents a number of unique opportunities for promoting livability while helping
to reduce the negative side-effects of transportation (e.g., congestion, emissions, and noise
pollution). In this phase, we develop a modeling framework (MF) to consider various factors and
their associated uncertainties for an optimal network design for electrified vehicles. The factors
considered in the study include: state of charge – the available charge in batteries of EVs at a given
point of time, dwell time – drivers’ willingness on length of time to park their vehicles in a given
parking location (for potential charging), Origin-Destination (OD) Pair – EV demand for a given
origin-destination within a community and the change in pattern during a week, preferences -
drivers’ preferences regarding their willingness to use publically available charging stations
besides charging at home. Apart from these factors, we also consider the uncertainties in EV
market penetration in the future and driver’s willingness to walk (some distance) from charging
station to destination. We present a case study and computation experiments to quantity the
usefulness of the proposed two-stage stochastic mathematical model for network design, and
provide insights in terms of improvements in livability aspects like reduction of traffic and
emission, and increment of public health benefits. The proposed research relates and contributes
to the attainment of strategic goals of the U.S. Department of Transportation and the U.S.
Department of Energy. It contributes to the fostering of livable communities by increasing the
access to transportation with EVs, improves adoption of EVs, and provides increased
transportation choice. It further contributes to environmental sustainability through reduced
carbon footprint of transport. Lastly, it contributes to the economic competitiveness through
increased transportation productivity and more efficient utilization of existing system resources.
Community-Aware Charging Station Network Design for Electrified Vehicles
7
Introduction Sustainability and livability are concepts that are of great interest to policy makers and city
planners. According to Victoria Transport Policy Institute, sustainability promotes a balance
among economic, social and environmental goals of community, and livability refers to the subset
of sustainability goals such as air and noise pollution prevention, human health, and community
development that are directly related to the life of people in the community. Indeed, walkability
is a livability objective that can promote quality of life within a community. However, promoting
a walkable lifestyle needs a safe and enjoyable environment as well as the pedestrian
infrastructure.
On the other hand, according to the Environmental Protection Agency, 50% to 90% of air pollution
in urban areas comes from automobile emissions. The challenges of rising fuel cost and climate
change along with the clean fuel of EVs are great incentivizing factors for adopting these vehicles
which will bring air quality, traffic congestion reduction, public health enhancement and global
warming benefits to the community. According to Berger et al. (2015), an EV that draws its power
from U.S. electrical grid emits at least 30% less CO2 than comparable gasoline or diesel-fueled
vehicles. Encouraging people to walk and bike is one way to improve public health condition (Guell et al.
2013). Walking and cycling also reduce traffic congestion and air/noise pollution. Health benefits
of walking include reducing the risk of heart pressure, reducing blood pressure, managing weight
and improving fitness. The Centers for Disease Control and Prevention (CDC) reports that more
American people are putting their lives at risk by becoming sedentary and obese. The mean
walking-trip length and duration in the U.S. is estimated to be 0.62 miles and 16 minutes in 2001,
and 0.61 miles and 12 minutes in 2009 (Yang et al. 2013). In 2009, 27% of all trips were shorter
than 1 mile in the U.S., but only 36% of those trips were made by walking or cycling (Beuhler et
al. 2011). The 2012 American Community Survey data reveals that the rate of walking to work in
the U.S. has decreased from 5.6% in 1980 to 2.8% between 2008 and 2012. However, there is a
great difference between the U.S. and other Western countries in non-motorized travel. For
example, 25% of daily trips are made by bicycle and 22% are made by walking in the Netherlands
(Kuzmyak et al. 2012). According to the National Personal Transportation Survey, percentage of
all urban trips that have been done by walking or biking decreased from 10% in 1977 to 6.3% in
1995, whereas, people in Netherlands walked or biked 7 times more than people in the U.S. in
1995 (Pucher et al., 2003). CDC has recently developed the Active Community Environments
(ACE) programs to encourage people to walk and bike more through urban design and

Community-Aware Charging Station Network Design for Electrified Vehicles
8
transportation policies (Centers for Disease Prevention and Control, 2002).
The societal benefits of large-scale adoption of EVs cannot be realized without adequate
deployment of publicly accessible charging stations due to mutual dependence of EV sales and
public infrastructure deployment. Such infrastructure deployment also presents a number of
unique opportunities for promoting livability while helping to reduce the negative side-effects of
transportation (e.g., congestion and emissions). Access to charging infrastructure is also among
the most important factors that can increase market penetration of EVs. To build such an
infrastructure, city planners and policy makers need to know the number of charging stations that
are required, the optimal locations that they should be installed, and recharging capacity at each
station (Miralinaghi, 2012). An effective design of charging network will influence travel behavior
of drivers and can also encourage them to walk to their final destinations. Public charging refers to any charging location that is away from home and can be located in both
public parking structures and gas stations. Public charging stations are more important to drivers
that have not installed one in their home (Dong and Lin, 2012). Besides locating charging stations,
capacity is an issue that must be taken into account since low capacity will increase waiting time
of drivers to charge their vehicles or even discourage them to use public charging stations. In
addition, driving behavior and charging pattern of EVs are among critical factors that can affect
economic and environmental benefits of EV adoption. A study by University of Michigan
estimates that a plug-in hybrid EV will emit 252 to 262g CO2 per mile driven in 2030 depending
on the allocation method using baseline grids and charging methods, which means that EV
adoption will not be helpful in GHG-reduction in short term but it will definitely reduce emissions
in the long-run (Hofmeister, 2014).
Since drivers are used to refueling their vehicles at gas stations, installing charging stations at gas
stations will fit into their refueling behavior. It will also help maintaining public infrastructure
utilization. On the other hand, since drivers won't be able to spend long time in gas stations, fast
charging stations have to be considered for these places whereas people usually tend to park their
vehicles for long hours in parking lots, which make lower-rate charging stations more feasible for
parking places. However, a high parking fee may reduce the chance of using charging stations in
parking lots (Cai et al., 2014). According to the International Parking Institute (IPI), the desire for
more livable and walkable community has become the most important societal change that is
influencing parking industry (International Parking Institute, 2015).
Community-Aware Charging Station Network Design for Electrified Vehicles
9
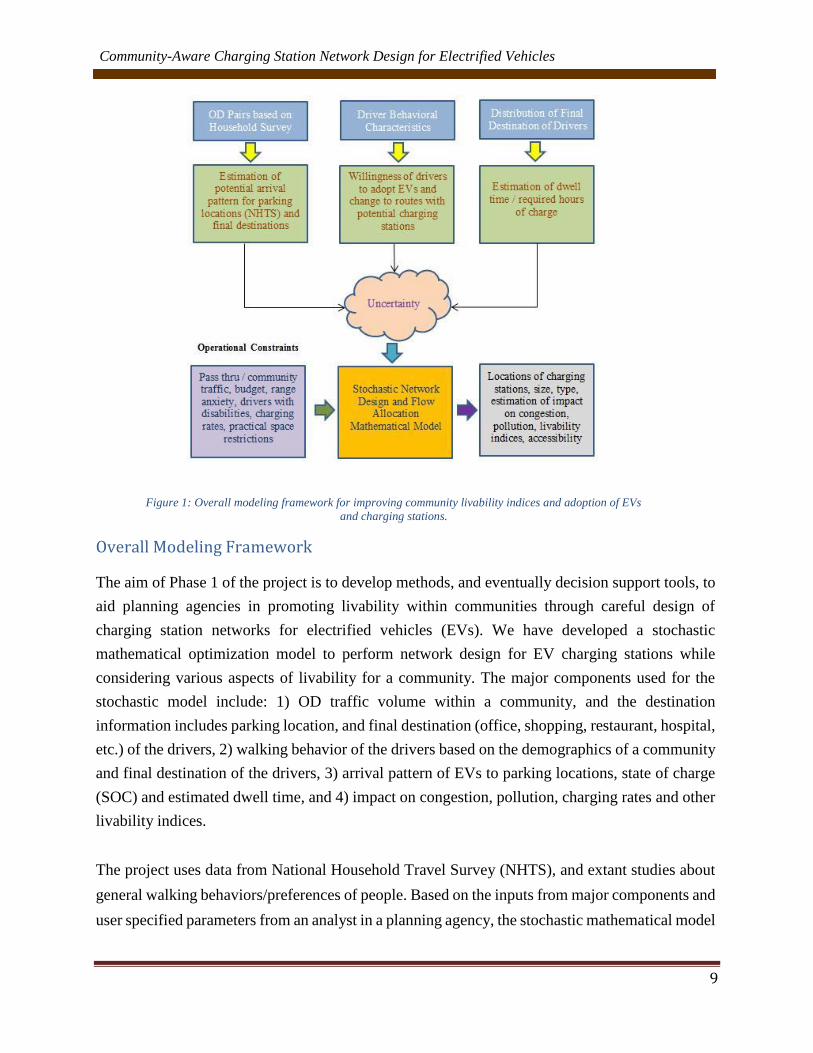
Figure 1: Overall modeling framework for improving community livability indices and adoption of EVs
and charging stations.
Overall Modeling Framework The aim of Phase 1 of the project is to develop methods, and eventually decision support tools, to
aid planning agencies in promoting livability within communities through careful design of
charging station networks for electrified vehicles (EVs). We have developed a stochastic
mathematical optimization model to perform network design for EV charging stations while
considering various aspects of livability for a community. The major components used for the
stochastic model include: 1) OD traffic volume within a community, and the destination
information includes parking location, and final destination (office, shopping, restaurant, hospital,
etc.) of the drivers, 2) walking behavior of the drivers based on the demographics of a community
and final destination of the drivers, 3) arrival pattern of EVs to parking locations, state of charge
(SOC) and estimated dwell time, and 4) impact on congestion, pollution, charging rates and other
livability indices.
The project uses data from National Household Travel Survey (NHTS), and extant studies about
general walking behaviors/preferences of people. Based on the inputs from major components and
user specified parameters from an analyst in a planning agency, the stochastic mathematical model

Community-Aware Charging Station Network Design for Electrified Vehicles
10
with an objective to maximize the livability indices and adoption of EVs proposes an optimal
network for charging stations. Furthermore, pricing schemes are utilized to estimate the return on
investments from the proposed network design in a post-optimization analysis.
Current Work
In the current Phase 1 part of this research, we want to develop models and methods to design an
integrated framework for designing EV charging station network for a given region/community
by determining number, location, and size of stations while explicitly accounting for the impact
on traffic flows (reduced congestion), increased livability metrics (reduced noise, greenhouse
emission, increased walkability), user choices (given, e.g., the range anxiety, trip distributions),
as well as preferences of the charging station operators (cost of location, electricity, utilization
and revenues). Our model contributes to the fostering of livable communities by increasing the access to
transportation with EVs, improves adoption of EVs, and provides increased transportation choice.
It further contributes to environmental sustainability through reduced carbon footprint of
transport. Lastly, it contributes to the economic competitiveness through increased transportation
productivity and more efficient utilization of existing system resources. In addition, through the
aim of reducing drivers walking commute to stations as well as their cost for charging, enables
communities to be more livable for both the owners of EVs as well as general public by improving
mobility, accessibility, and reducing congestion.
Literature Review During the last decade, many researchers have focused on optimally locating alternative-fuel-
vehicle's refueling stations. Some authors have studied the charging behavior of EV drivers. Lam
et al. (2006) studied joint behavior of travel and parking of drivers through a time-dependent
network equilibrium model. Their results showed that travel demand, walking distance, parking
capacity and parking fee are the most important factors in determining parking behavior. Using
driving pattern data in NHTS, Kelly et al. (2012) simulated PHEV charging and gasoline
consumption. They analyzed the effects of charging location, charging rate, time of charging and
battery size to measure the impact that PHEV adoption can have on energy consumption and
emission reduction. Dong et al. (2012) examined the impact of public charging infrastructure on
gasoline consumption of plug-in hybrid EVs. Their analysis showed that public charging
infrastructure benefits PHEVs with small batteries the most and reduces energy consumption of
PHEVs by 30% compared to charging stations installed at homes. Using battery EV charging data

Community-Aware Charging Station Network Design for Electrified Vehicles
11
in Japan, Sun et al. (2015) applied a mixed logit model to analyze the charging behavior of private
and commercial battery EV drivers in terms of starting time of recharging. They found that state
of charge, remaining time to the next travel and the distance that has to be driven in the next travel
are the most important factors in deciding to charge the vehicle or not after the last trip of the day.
Azadfar et al. (2015) studied the economic, environmental and technical factors that may affect
charging behavior of EV drivers and in turn the electricity load on the grid. They found that
charging infrastructure and battery performance are the most important factors in charging pattern
of EV drivers.
Public health and transportation researchers tend to analyze walking and bicycling preference of
people. Using travel survey data for the Minneapolis and St. Paul region of Minnesota, Iacono et
al. (2008) estimated distance decay function for different travel modes, auto and non-auto modes,
and several destination types in order to develop accessibility measures. While many studies have
suggested 400 meters as the threshold for walking preference, their results showed that many
pedestrians travel more than this threshold. Guell et al. (2013) investigated factors that affect
walking and cycling to and from work in environments that are not supportive for these activities.
Their analysis showed that one of the reasons that commuters decide to walk or bike to and from
work in an unsupportive route is the availability of parking at work. Panter et al. (2013) examined
the individual, workplace and environmental factors that could increase the share of walking and
biking activities in travelling to and from work. They found that people who do not have access
to parking at work and who have the most supportive environment are more likely willing to walk
and bike. They suggested that providing limited or non-free parking at work and provide free off-
site parking may encourage people to walk and bike more. Waerden et al. (2015) studied the
relationship between car drivers' willingness to walk from parking lots to their final destinations
and four trip purposes (work, social, weekly activity and non-weekly activity) using multi-nominal
regression analysis. Analysis of responses of more than 300 members of the Eindhoven University
of Technology's University Parking Panel showed that frequency of car use and parking duration
are the most important factors determining willingness to walk. Many researchers have concentrated on developing optimal charging infrastructure for EVs.
Upcharch et al. (2009) considered the capacity of charging stations in the flow refueling location
model (FRLM) in order to maximize the vehicle-miles travelled. In this case, optimal solutions in
FRLM might become suboptimal solutions. To deal with computational burden of generating
combinations of locations capable of serving the round trip on each route, Capar et al. (2012)
developed a mixed-binary-integer optimization model. They showed that large-scale cases of their
proposed model can be solved within short period of time. Capar et al. (2013) presented a more
Community-Aware Charging Station Network Design for Electrified Vehicles
12
computationally efficient model for flow-refueling location model to provide insights for
managerial concerns such as OD demand forecasting uncertainty, robustness of optimal locations
in regard to vehicle driving ranges. Zhang et al. (2013) investigated the relationship between EV
charging infrastructure requirements, plug-in EV operating cost and battery EV feasibility. They
concluded that all charging infrastructures reduce operating cost of plug-in EV and sufficient
public charging infrastructure is needed to satisfy battery EVs. Wang et al. (2013) proposed a
mixed-integer programming method to model capacitated multiple-recharging-station-location
problem considering budget constraint and vehicle routing behavior, and using the concepts of set
coverage and maximum coverage.
Baouche et al. (2014) a proposed mathematical model to minimize total cost, consisting of travel
cost from demand zones to charging locations and investment cost, and find the optimal locations
of charging stations for EVs in an urban area considering p-dispersion constraint. Dong et al.
(2014) applied a genetic algorithm to find the optimal locations of charging stations for EVs
considering the daily travel activity and charging behavior constraints. Their study showed that
installing public charging stations will significantly increase EV adoption. Ahn et al. (2015)
proposed a model to estimate the required density of charging stations for EVs for urban areas.
They selected a city in South Korea to perform their analysis and determine the optimal density
of charging stations. Cavadas et al. (2015) proposed a mixed-integer programming model to locate
slow-charging stations for EVs in an urban environment considering the possibility that there
might be several stops by each driver during the day and he only charge his vehicle at one of these
locations. Since there may not be enough budgets to build a sufficient number of charging stations
or since the adoption rate of EVs might be low, Chung et al. (2015) proposed a multi-period
optimization method, a forward-myopic method, and a backward-myopic method to plan for
optimal locations of charging stations. Since tour-based network equilibrium model can precisely
track the state of charge of the battery and also consider the dwell time at each destination, He et
al. (2015) proposed such a model to optimally locate public charging stations for EVs considering
recharging behavior of drivers. Hosseini et al. (2015) proposed a two-stage stochastic program to
locate permanent and portable charging stations with and without considering stations capacities
to maximize the served traffic flows. Huang et al. (2015) developed an integer programming
formulation to minimize the lifetime cost of equipment, installations, and operations of charging
stations for plug-in EVs at workplaces by considering different charging levels and demographics
of employees. In order to maximize the amount of vehicle-miles-travelled for an electrified
vehicle, Shahraki et al. (2015) proposed a mathematical model to select the optimal locations for

Community-Aware Charging Station Network Design for Electrified Vehicles
13
public charging stations considering vehicle travel patterns. They applied their model on taxis data
over a three week period of time in Beijing, China. Viswanathan et al. (2016) took a computational
science approach to determine the optimal locations for charging stations of EVs. In their study,
they have considered existing traffic and driving behavior of EV drivers.
Network Design for Electrified Vehicles Widespread adoption of EVs along with introduction of new EV models capable of traveling
longer distances will result in a need for building community-aware network of charging stations.
As the EV usage for daily commute increases, the consideration for the ability to recharge these
vehicles away from base locations (i.e., residential locations) will become even more important.
While significant portion of the EV users will have sufficient battery state of charge (SOC) to
complete their commuting trip, there will be EV users that would need intermediate recharging at
their destination locations (e.g., workplace). Our Phase 1 research aims at developing and demonstrating (at the proof-of-concept level) a
system for the design and deployment of the charging infrastructure in support of the increasing
adoption of EVs to improve livability (reduced congestion, noise, improve walkability) in urban
areas, help ease users range anxiety, reduce user costs (e.g., walking), and reduce infrastructure
cost. Our goal is to develop analytical data-driven tools and demonstrate that strategically planned
and incentivized deployment of charging stations in urban areas would lead to improved livability
of these areas, and these benefits will continue to increase with increased adoption of the EVs. In this research, we develop a stochastic programming model to determine optimal infrastructure
of charging stations for a community. There are many uncertainties such as state of charge (SOC)
at the time of arrival to a location, parking duration based on type of the activity, driver's
preference in terms of charging away from home and distance to walk from charging station to
final destination that have to be considered in determining the locations of charging stations. The
presence of all these uncertainties makes deterministic optimization irrelevant. So, different
scenarios for uncertain parameters are generated and a stochastic optimization model is developed
to account for these uncertainties in order to locate the optimal places for installing EV charging
stations that have high potential of utilization and encourage people to walk more in the
community since accessibility to charging infrastructure for EVs is being considered a
fundamental component of community livability.
Since EVs must be parked for several hours to be recharged, we consider some parking lots, public
parking facilities as well as parking spaces at workplaces, shopping malls and so on, as possible
Community-Aware Charging Station Network Design for Electrified Vehicles
14
locations for installing charging stations based on urban plans. To determine the exact final
destination of each EV driver, we randomly assign each driver to a final destination location (to
compute final walking distance) based on a uniform probability distribution. We assume that each charging station has multiple outlets so that multiple drivers can charge their
vehicles using the same charging station at the same time. This will help more demand to be met
than the case where only one station is installed in every location. We assume that all charging
point terminal types are semi-rapid charging ones (level 2 of charging power) that are typically
recommended for private and public parking lots and shopping malls, and provide 10 to 20 miles
range per hour of charging. Further research is needed to find the best mix of charging levels for
any region. The required EV charging infrastructure depends on many factors such as EV market
penetration, government support and charging behavior of EV drivers (Global EV Outlook, 2013).
The cost of installing charging stations at each location will depend on types of charging stations,
number of stations, parking fee and the traffic level in the area of that location. It also depends on
the distance from the facility's electrical panel and labor costs (Idaho National Laboratory Report,
2015). Rocky Mountain Institute has estimated that the cost of installing a level 2 charging station
for public use is between $3,000 and $8,000 per charger in a parking garage and between $5,000
and $14,000 at a curbside. While using fast-charging stations are not very common now but it is
expected that there will be more demand for this charging type in the future. The cost of purchase
and installation of such a charging station is almost between $30,000 and $80,000. The following
table shows in detail the cost of installing these two charging type stations in public places
(Agenbroad and Holland, 2014):
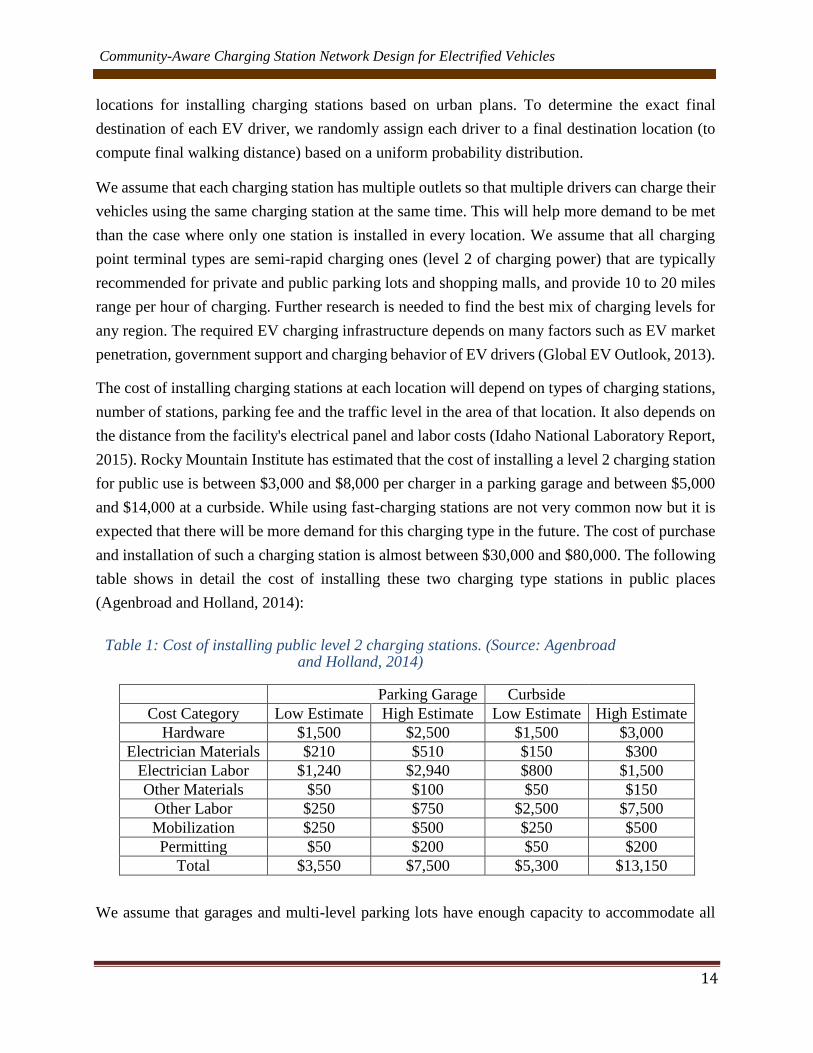
Table 1: Cost of installing public level 2 charging stations. (Source: Agenbroad and Holland, 2014)
We assume that garages and multi-level parking lots have enough capacity to accommodate all
Parking Garage Curbside
Cost Category Low Estimate High Estimate Low Estimate High Estimate
Hardware $1,500 $2,500 $1,500 $3,000
Electrician Materials $210 $510 $150 $300
Electrician Labor $1,240 $2,940 $800 $1,500
Other Materials $50 $100 $50 $150
Other Labor $250 $750 $2,500 $7,500
Mobilization $250 $500 $250 $500
Permitting $50 $200 $50 $200
Total $3,550 $7,500 $5,300 $13,150

Community-Aware Charging Station Network Design for Electrified Vehicles
15
vehicles and all drivers park their cars in these places since it is difficult to track walking distances
to final destinations in case on-street parking is also considered. According to the literature, factors
such as walking distance from parking lot to final destination, type of parking facility (e.g.,
underground parking, multilayer parking, curb parking, and off-road parking), parking fee,
available parking spaces, trip purpose, search time, parking duration and access time to the parking
place can significantly affect driver's decision to choose a parking place. However like Ji et al.
(2007), we only consider walking distance to final destination the contributing factor in choosing
a parking lot. In this study, we made the assumption that other factors such as safety, pedestrian
facilities and enjoyable elements are in good shape and will not discourage people to walk from
parking lots to their final destinations.
In order to make a balance between the utilization levels of charging service locations and alleviate
congestion in certain points of the community, we need to put more charging stations in areas that
have low normal congestion regardless of the number of EVs expected to frequent the
neighborhood. We can also put a bound on the traffic that can be attracted to every charging
location in certain time intervals. Traffic calming will reduce crashes, air and noise pollution and
make the community safer and more livable. It is expected that demand for public charging
stations has a peak load in the morning so the model has to consider charging time management
to make a balance in electricity load on the grid. This can also be controlled through dynamic
pricing of charging service at different time intervals during each day. In the next section, the
sources of the uncertainties are described in detail and next, the model formulation and the solution
approach are specified.
Parameters and Uncertainties To simulate the behavior of EV drivers, we use the analysis of two surveys that were done few
years ago: the 2009 National Household Travel Survey that was conducted by American Federal
Highway Administration through phone surveys from more than 150 thousand U.S. households
and the 2008-2012 American Community Survey that is a statistical survey and is done by the
U.S. Census Bureau. The first step in developing a network of charging stations is estimating demand for vehicle
charging during a weekday or weekend. Like facility location models, we assume that demand
occurs at fixed points on a network. This demand will be attracted to different charging station
locations based on their distance preference for walking toward their final destination. Different
scenarios represent various levels of EV state of charge at the time of arrival, duration of the
activity, time of the week, preference of drivers for charging at public stations, and willingness to
walk due to demographic, urban level and seasonality factors.
Community-Aware Charging Station Network Design for Electrified Vehicles
16
The following uncertainties can affect demand for public charging stations.
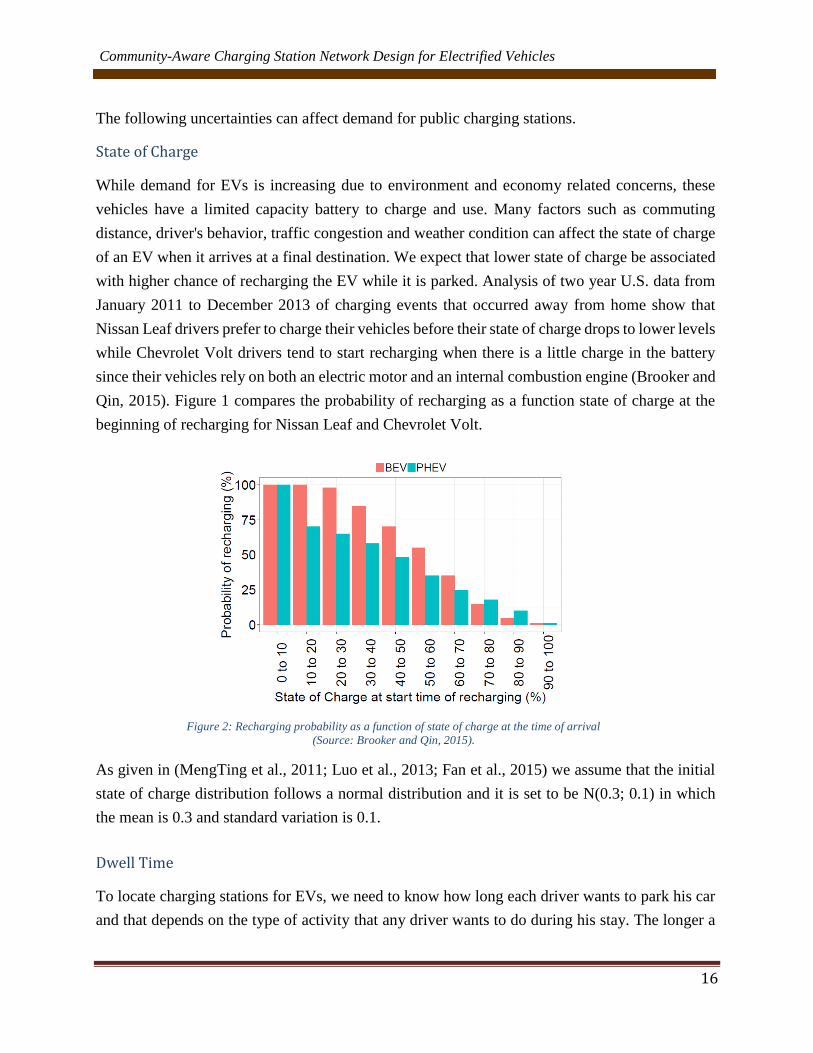
State of Charge While demand for EVs is increasing due to environment and economy related concerns, these
vehicles have a limited capacity battery to charge and use. Many factors such as commuting
distance, driver's behavior, traffic congestion and weather condition can affect the state of charge
of an EV when it arrives at a final destination. We expect that lower state of charge be associated
with higher chance of recharging the EV while it is parked. Analysis of two year U.S. data from
January 2011 to December 2013 of charging events that occurred away from home show that
Nissan Leaf drivers prefer to charge their vehicles before their state of charge drops to lower levels
while Chevrolet Volt drivers tend to start recharging when there is a little charge in the battery
since their vehicles rely on both an electric motor and an internal combustion engine (Brooker and
Qin, 2015). Figure 1 compares the probability of recharging as a function state of charge at the
beginning of recharging for Nissan Leaf and Chevrolet Volt.
Figure 2: Recharging probability as a function of state of charge at the time of arrival
(Source: Brooker and Qin, 2015).
As given in (MengTing et al., 2011; Luo et al., 2013; Fan et al., 2015) we assume that the initial
state of charge distribution follows a normal distribution and it is set to be N(0.3; 0.1) in which
the mean is 0.3 and standard variation is 0.1.
Dwell Time To locate charging stations for EVs, we need to know how long each driver wants to park his car
and that depends on the type of activity that any driver wants to do during his stay. The longer a

Community-Aware Charging Station Network Design for Electrified Vehicles
17
person wants to stay at her destination, the higher the chance that she tends to recharge her vehicle.
We use six different destination categories that Brooker et al. (2015) defined based on NHTS data:
Work, Social, Family, Meal, Study, and Shopping. Figure 2 shows how much time on average
people tend to park their vehicles based on their trip purpose (Krumm, 2012).
Figure 3: Average dwell time as a function of activity (Source: Brooker and Qin, 2015).
Zhong et al. (2008) concluded that Weibull, log-normal and log-logistic distributions are the best
fitted distributions for modeling duration of activities on weekdays and weekends. While their
analysis shows that model type and parameters or both might be different for an activity on
weekdays versus weekends, they found Weibull distribution as the most applicable one among the
three distributions. In addition, they found that certain activities such as social activities and
shopping tend to last longer during weekend. So, we use Weibull distribution to estimate parking
duration of EV drivers considering average staying time as in figure 2 for different activities. We
also differentiated the duration of some activities like family outings, meal, school, shopping,
social, and work in weekdays and weekends as described in next section.
Weekday vs. Weekend People tend to attend social events, visit their families and go to shopping centers more during
weekends than weekdays, in which demand mostly consists of people who are traveling for work
or school so it is expected that a different demand pattern occurs for charging stations in different
days of the week. Figure 3 confirms that demand for charging stations is dependent on time and
type of day.
During weekdays, maximum demand (load) occurs during morning time when people are arriving
at work or school but maximum demand usually happens around noon during weekends when
people are going to shopping malls and social places. We use Weibull distribution for the arrival

Community-Aware Charging Station Network Design for Electrified Vehicles
18
time EVs to parking lots during weekdays and weekends based on the studies by Pashajavid et al.
(2012) and Guner et al. (2015).
Figure 4: The expected breakdown of vehicle arrival percentages for weekdays (left) and weekends (right) (Sources:
Brooker and Qin, 2015; and Krumm, 2012).
Preference for Charging Away from Home Analysis of data collected by Idaho National Laboratory in 2012 and 2013 from over 4,000 Leafs
and 1,800 Volts across the U.S. shows that drivers of Leaf prefer to charge away from home only
16% of the time and drivers of Volt prefer to do that in only 13% of the time. The data also shows
that 13% of Leaf drivers and 5% of Volt drivers only charge their vehicles at home (Idaho National
Laboratory Report, 2015). So vast majority of people intend to use publicly accessible charging
stations.
Although the following table shows that many people that drive more daily miles tend to charge
their vehicles in places other than their homes, the effect of daily miles travelled on the chance of
charging away from home is small (Idaho National Laboratory Report, 2015):

Community-Aware Charging Station Network Design for Electrified Vehicles
19
Table 2: Travel daily mile and away-from-home charging behavior (Source: Idaho National Laboratory, 2015).
EV Market Penetration There are many social, environmental and economic factors that can significantly contribute to
the increasing market share of different types of EVs. According to the U.S. Department of
Energy, although the market share of batter EVs (BEVs) and plug-in hybrid EVs (PHEVs) are
relatively high in some states, EVs are not very common in many states. Vergis et al. (2015)
showed that the presence of charging infrastructure will contribute to the adoption of battery EVs
but does not have any significant effect on the adoption of plug-in hybrid EVs. The following
figures from the U.S. Department of Energy 2015 reports clearly show that BEVs and PHEVs
have different market share across the states between 2010 and 2014.
Figure 5: Cumulative 2010-2014 BEV market share (left) and PHEV market share (right) across the U.S. (Source: Vergis et
al., 2015).
According to Turrentine et al. (2015), plug-in EV sales account for 0.6% of the 2015 U.S. market
share. They believe that transition to EVs will take place like the market transition of hybrid cars
and expected 3-5% of the market between 2015 and 2020, and 6-15% of the market between 2020
Tendency to charge away from home Never Sometimes Frequently Most of the
time
Leaf average daily driving distance (mi) 25 31 43 32
Volt average daily driving distance in
EV mode (mi) 25 29 40 26

Community-Aware Charging Station Network Design for Electrified Vehicles
20
and 2025 will belong to electric cars. However, 2011 Energy Outlook report of the U.S.
Department of Energy estimated the market share of EVs is less than 1% in 2035 while it projected
that EV annual sales will be around 13,800 cars at that time. Carley et al. (2013) surveyed adult drivers in large U.S. cities in fall 2011 in order to find factors
that can affect their interest of buying a plug-in electric vehicle. Besides demographic variables
that can strongly predict intent of purchase, their results show that the presence of a charging
station inside the community is the only awareness variable that has a significant effect on intent
of purchase. From policy point of view, one effective way to increase EV adoption is to build
more charging infrastructure. Using multiple linear regression, Sierzchula et al. (2014) examined
the effect of consumer financial incentives and several socio-economic factors on national EV
market shares of 30 countries for the year 2012. While their descriptive analysis shows that neither
financial incentives nor charging infrastructure contributes to adoption of EVs, statistical analysis
confirms that installing one charging station (per 100,000 residents) could have twice the impact
on a country's rate of new EV sales compared to$1,000 in financial incentives. In fact, there is a chicken-and-egg problem between charging stations and EVs. Drivers want to
make sure that there are enough charging stations before they buy any electric car and EV installers
want to be sure that there is enough demand in the market for EVs before they start installing
charging stations. Increasing charging infrastructure will help drivers not to get out of charge
during daily travel.
Willingness to Walk
The willingness to walk of car drivers can be affected by their socio-demographic characteristics
such as age, gender, education level, and occupation. Walking distances are shorter for children
and elderly than young and middle-age groups. Past studies also show that walking preferences
are correlated with many urban design factors such as street connectivity, pedestrian infrastructure
and mixed land uses (Forsyth et al. 2008).
Fotheringham et al. (1989) proposed the unconstrained gravity model to predict the interactions
between different urban zones.
𝑇𝑖,𝑗 = 𝐾 × 𝑣𝑖𝜇
× 𝑤𝑗𝛼 × 𝑐𝑖,𝑗
𝛽 (1)
In this model, 𝑇𝑖,𝑗is the number of trips between zones 𝑖 and j, 𝑣𝑖 and 𝑤𝑗are the intensity of origin
and destination zones, and 𝑐𝑖,𝑗is the distance decay function component of the gravity model. This

Community-Aware Charging Station Network Design for Electrified Vehicles
21
function shows how an activity depends on the travel distance. For example, we expect that more
people are willing to walk shorter distances than longer ones. By assuming that origins and
destinations are known in the gravity model, this model reduces to the distance decay function
part.
Many researchers have used distance decay function that shows the willingness to walk or bike a
distance toward different types of destinations. The parameter of this decay function depends on
the type of the final destination. Research using distance decay function has revealed different
behaviors for people that live in different areas. For example, Icacano et al. (2008) found that
people who live in Minnesota tend to walk and bike more for leisure and recreation purposes while
Larsen et al. (2010) found that people would walk and bike longer distances for work than for
other purposes in Montreal. Estimation results of Yang et al. (2013) confirms that negative exponential distribution can better
describe walking trips over short distances than distributions such as Gaussian. They specify the
distance decay function as
𝑃(𝑑) = 𝑒−𝛽×𝑑 (2)
which shows the percentage of people that are willing to walk or longer distances. They used 2009
NHTS data to estimate the decay parameter for different groups and trip purposes. The estimated
distributions for walking preference for different activities are shown in Figure 5.
Their analysis of the 2009 NHTS data shows that people are more willing to walk for recreation,
social events and work activities rather than for studying, shopping, eating meal or dog-walking.
Men also tend to walk farther than women but the difference is not significant. Adults between
age 18 and 64 represent the highest rate of walking among age groups while old people and
children tend to walk shorter distances.
There are many natural and built environment factors that can affect walking rates of people. The
presence of hills and steep grades can influence walking negatively. Seasonal variations in weather
such as hot summers and cold winters can prevent people to walk. Built environment
characteristics such as mixed land use, urban design, neighborhood safety, city size, and
community type can also make walking more attractive (Kuzmyak et al. 2012). Data show that
the more compact the mixed land use is, the higher the chance that people tend to walk toward
their final destinations. For example, American Community Survey displays that people living in
cities walk more to work than in suburbs and outside metro areas.
Community-Aware Charging Station Network Design for Electrified Vehicles
22
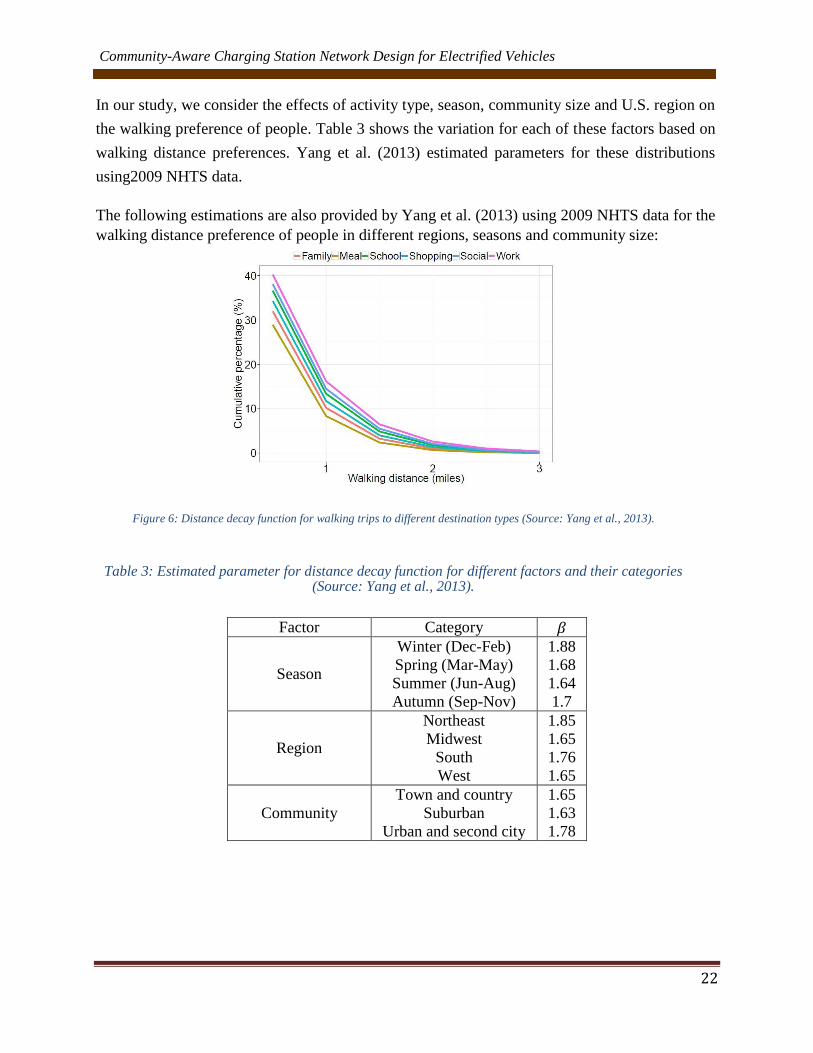
In our study, we consider the effects of activity type, season, community size and U.S. region on
the walking preference of people. Table 3 shows the variation for each of these factors based on
walking distance preferences. Yang et al. (2013) estimated parameters for these distributions
using2009 NHTS data.
The following estimations are also provided by Yang et al. (2013) using 2009 NHTS data for the
walking distance preference of people in different regions, seasons and community size:
Figure 6: Distance decay function for walking trips to different destination types (Source: Yang et al., 2013).
Table 3: Estimated parameter for distance decay function for different factors and their categories (Source: Yang et al., 2013).
Factor Category 𝛽
Season
Winter (Dec-Feb)
Spring (Mar-May)
Summer (Jun-Aug)
Autumn (Sep-Nov)
1.88
1.68
1.64
1.7
Region
Northeast
Midwest
South
West
1.85
1.65
1.76
1.65
Community
Town and country
Suburban
Urban and second city
1.65
1.63
1.78

Community-Aware Charging Station Network Design for Electrified Vehicles
23
Two –Stage Stochastic Model Formulation The following notations are used for the two-stage stochastic programming model:
Sets
- 𝑃: Set of parking lots.
- 𝑆: Set of potential locations for charging stations.
- 𝐿: Set of number of charging stations in each location.
- Γ: Set of arrival times and departure times.
- 𝑇: Set of times.
- 𝑊: Set of scenarios.
Fixed Model Parameters
- 𝑝: Maximum number of locations that charging stations can be installed in.
Scenario Dependent Parameters
- 𝑑𝛾(𝑡),𝑝,𝑠(𝑤): Demand with arrival and departure time set of 𝛾(𝑡) that is attracted from
parking lot p to charging location s in scenario w.
- 𝑑𝑢𝑠,𝑠′(𝑤): Demand that can choose both locations 𝑠 and 𝑠′for recharging in scenario 𝑤.
First Stage Decision Variables
- 𝑥𝑠: 1 if location 𝑠 is considered for installing charging stations.
- 𝑧𝑙,𝑠: 1 if 𝑙 charging stations are installed in location 𝑠. Second Stage Decision Variables
- 𝑦𝛾(𝑡),𝑝,𝑠(𝑤): Captured demand with arrival and departure time set of 𝛾(𝑡) that is at-
tracted from parking lot 𝑝 to charging location 𝑠 in scenario 𝑤. 𝑐𝑠,𝑠′(𝑤): 1 if both location 𝑠 and 𝑠′ are chosen for installing charging stations
The two-stage stochastic optimization model is presented as follows:
First-Stage Model:
𝑀𝑎𝑥 𝑓(𝑥, 𝑧) = 𝐸[𝜑(𝑥, 𝑧, 𝑤)] (3)
s.t
∑ 𝑥𝑠 = 𝑝𝑠∈𝑆
(4)

Community-Aware Charging Station Network Design for Electrified Vehicles
24
𝑧𝑙,𝑠 ≤ 𝑥𝑠 𝑙 ∈ 𝐿, 𝑠 ∈ 𝑆 (5)
∑ 𝑧𝑙,𝑠 ≤ 1𝑙∈𝐿,𝑠∈𝑆
(6)
𝑥𝑠, 𝑧𝑙,𝑠 ∈ {0,1}, 𝑙 ∈ 𝐿, 𝑠 ∈ 𝑆 (7)
Second-Stage Model:
𝜑(𝑥, 𝑤) = 𝑀𝑎𝑥 ∑ 𝑦𝛾(𝑡),𝑝,𝑠(𝑤) − ∑ 𝑐𝑠,𝑠′(𝑤) × 𝑑𝑢𝑠,𝑠′(𝑤)𝑠∈𝑆,𝑠′∈𝑆𝛾(𝑡)∈Γ,𝑝∈𝑃,𝑠∈𝑆 (8)
∑ 𝑦𝛾(𝑡),𝑝,𝑠(𝑤) ≤ ∑ 𝑧𝑙,𝑠𝑙∈𝐿𝛾(𝑡)∈Γ,𝑝∈𝑃 𝑠 ∈ 𝑆, 𝑡 ∈ 𝑇 (9)
𝑦𝛾(𝑡),𝑝,𝑠(𝑤) ≤ 𝑑𝛾(𝑡),𝑝,𝑠(𝑤) 𝛾(𝑡) ∈ Γ, 𝑝 ∈ 𝑃, 𝑠 ∈ 𝑆, 𝑡 ∈ 𝑇 (10)
𝑐𝑠,𝑠′(𝑤) ≤ 𝑥𝑠 𝑠, 𝑠′ ∈ 𝑆 (11)
𝑐𝑠,𝑠′(𝑤) ≤ 𝑥𝑠′ 𝑠, 𝑠′ ∈ 𝑆 (12)
𝑐𝑠,𝑠′(𝑤) ≥ 𝑥𝑠 + 𝑥𝑠′ − 1 𝑠, 𝑠′ ∈ 𝑆 (13)
𝑐𝑠,𝑠′(𝑤) ∈ {0,1}, 𝑦𝛾(𝑡),𝑝,𝑠(𝑤) ≥ 0, 𝛾(𝑡) ∈ Γ, 𝑝 ∈ 𝑃, 𝑠 ∈ 𝑆, 𝑡 ∈ 𝑇, 𝑤 ∈ 𝑊 (14)
In this model, first-stage decisions are made on the locations of charging stations and subsequently,
the decisions are exposed to uncertainties in the second-stage. In the second-stage, recourse
decisions are made to maximize the potential traffic flows based on the locations chosen in the
first-stage. Constraint 4 refers to the maximum number of locations that can be chosen for
installing charging stations in the community. Constraints 5 and 6 determine the number of
charging stations in any location that is selected for installing charging stations. Constraint 9
ensures that there is enough capacity to satisfy attracted demand to each station. Constraint 10
states that attracted demand cannot exceed the total possible demand at each time and station.
Constraints (11) – (13) negate the sum of utilization of two individual charging stations when are
located too close to each other. This represents cannibalization effect on demand when two
charging stations are located too close.

Community-Aware Charging Station Network Design for Electrified Vehicles
25
Modeling Uncertainty – Sample Average Approximation According to Santoso et al. (2005), a major difficulty in solving two-stage stochastic optimization
problems is that we need to solve a huge number of linear optimization problems, one for each
scenario, which makes the problem computationally intractable. We use sample average
approximation (SAA) method to generate appropriate number of scenarios (within a prescribed
confidence interval) to represent uncertainty for the two-stage stochastic programming model.
Although our objective function is maximization, the following section represents a standard
minimization problem. The standard sample average approximation method is described as follows:
1. Estimating a lower bound for the optimal solution:
Generate M independent sample sets of scenarios each of size 𝑁, i.e., (𝑤𝑗1, 𝑤𝑗
2, . . . , 𝑤𝑗𝑁 ) for
𝑗 = 1,2, … , 𝑀
For each sample set 𝑚, find the optimal solution:
𝑣𝑁𝑗
=1
𝑁× ∑ 𝜑(𝑥, 𝑧, 𝑤𝑗
𝑖
𝑁
𝑖=1
) (15)
Compute the followings:
�̅�𝑁,𝑀 =1
𝑀× ∑ 𝑣𝑁
𝑗𝑀𝑗=1 (17)
𝜎�̅�𝑁,𝑀 2 =
1
𝑀×(𝑀−1)× ∑ (𝑣𝑁
𝑗− �̅�𝑁,𝑀
𝑀𝑗=1 ) 2 (18)
According to Norkin et al. (1998) and Mark et al. (1999) , the expected value of 𝑣𝑁 is less than or
equal to the optimal value 𝑣∗ . Since the sample average �̅�𝑁,𝑀 is an unbiased estimation of
expected value of 𝑣𝑁 , the 𝐸[�̅�𝑁,𝑀] is less than or equal to the optimal value 𝑣∗. So, �̅�𝑁,𝑀 provides
a lower statistical bound for the optimal solution.
2. Estimating an upper bound for the optimal solution:
If (�̅�, 𝑧̅) is a feasible solution for the first stage problem, we expect that 𝑓(�̅�, 𝑧̅) ≥ 𝑣∗. So,
choosing any feasible solution of the first stage problem will provide an upper statistical
bound for the optimal value.

Community-Aware Charging Station Network Design for Electrified Vehicles
26
Choose a sample of size 𝑁′ of scenarios, much larger than 𝑁 , i.e., ( 𝑤1, 𝑤2, … , 𝑤𝑁′)
independent of samples to find the lower limit and estimate the objective function:
𝑓(�̅�, 𝑧̅) =1
𝑁′× ∑ 𝜑(𝑥, 𝑧, 𝑤𝑖)
𝑁′
𝑖=1
(19)
𝑓(�̅�, 𝑧̅) =1
𝑁′× ∑ 𝜑(𝑥, 𝑧, 𝑤𝑖)
𝑁′
𝑖=1
(19)
Compute the variance for this estimation:
𝑓(�̅�, 𝑧̅) =1
𝑁′× ∑ 𝜑(𝑥, 𝑧, 𝑤𝑖)
𝑁′
𝑖=1
(19)
3. Finding an estimation of the optimality gap: Use the upper bound and the lower bound that are computed in previous steps to find an
estimation for the optimality gap:
𝑔𝑎𝑝𝑀,𝑁,𝑁′(�̅�, 𝑧̅) = 𝑓(�̅�, 𝑧̅) − �̅�𝑁,𝑀 (20)
4. Checking the quality of the estimated optimality gap:
an estimation for the variance of this estimated optimality gap can be found by
𝜎𝑔2𝑎𝑝 = 𝜎𝑣𝑁,𝑀
2 + 𝜎𝑁′2 (�̅�, 𝑧̅) (21)
Case Study To show the efficiency of the two-stage model, we have started conducting a variety of
experiments using actual data obtained through SEMCOG for the Midtown area of Wayne State
University in Detroit, MI. However, we are not yet done with these experiments. In the interim,
we report here results from synthetic networks. In particular, we report here results from a small

Community-Aware Charging Station Network Design for Electrified Vehicles
27
test network and a larger network. The large network consists of 500 nodes as final destinations
and 50 parking lots that drivers are already parking their vehicles. From these 50 parking lots, 10
are considered as potential locations for charging stations. In the small network case, 100 nodes
are considered as final destinations. There are also 10 parking lots that drivers are already parking
their vehicles from which 5 are considered as potential locations for charging stations. In addition,
we assumed that we can install at most 2 packs of chargers with 4 outlets in small network and 2
packs of chargers with 10 outlets in large network in every possible location.
The following tables show the result of running the SAA for the small network problem in order
to find the sufficient number of scenarios to get the optimal solution. This network is shown in
figure 6. In these tables, average is the lower bound for the optimal solution, standard deviation is
the standard deviation for this lower bound, gap is the difference between upper bound and lower
bound for the optimal solution and sigma is the standard deviation for this gap.
Table 4: SAA result for case = 1 and (M,𝑁′) = (20,1000).
N Average St. Dev. gap sigma 20 10.11 0.14 0.08 0.179 40 10.53 0.09 0.34 0.142 50 10.31 0.14 0.12 0.178
Table 5: SAA result for case = 2 and (M, 𝑁′ ′) = (20,1000).
N Average St. Dev. gap sigma 20 20.7 0.25 0.09 0.335 40 21.03 0.24 0.42 0.328 50 21.03 0.22 0.42 0.314
Table 6: SAA result for case = 3 and (M,𝑁′) = (20,1000).
Table 7: SAA result for case = 4 and (M,𝑁′) = (20, 1000).
N Average St. Dev. gap sigma 20 30.71 0.52 0.31 0.606 40 30.84 0.3 0.44 0.432 50 31.12 0.29 0.72 0.426
Average St. Dev. gap Sigma 20 39.84 0.51 0.71 0.664 40 39.8 0.48 0.67 0.641 50 40.81 0.39 1.68 0.577

Community-Aware Charging Station Network Design for Electrified Vehicles
28
Figure 7: The small network used in our analysis. Blue dots are the optimal locations of charging stations for cases of p = 2 (left)
and p = 3 (right) when market shares 1% for BEV and 2% for PHEV.
Figure 8: The larger network used in our analysis. Blue dots are the optimal locations of charging stations for cases of p = 1
(left) and p = 2 (right) when market share is 2% for BEV and 5% for PHEV.
The preliminary results of finding optimal locations for installing charging stations for small and
large networks using Sample Average Approximation method are presented in figures 6 and 7,
respectively. The smaller circle dots are showing the demand nodes and square dots are
representing possible locations for installing charging stations. The optimal locations are shown in
blue color. In these cases, we assume that total number of cars arriving to the community follows
a uniform distribution between 2,000 and 4,000 per day in small network, and between 4,000 and
6,000 per day in large network.
Average of accessibility to charging stations and average of walking distances are computed for
different scenarios of BEV and PHEV market shares in tables 8 and 9. Negative values for walking

Community-Aware Charging Station Network Design for Electrified Vehicles
29
imply that people are willing to walk less if we can install charging stations at the optimal locations. Average of accessibility to charging stations and average of walking distances are computed for
different scenarios of BEV market share and PHEV market share and reported in Tables 8 and 9.
Livability Assessment Developing a set of indicators is helpful in measuring the performance of transportation strategies
that are designed to improve livability of the community. An important principle of livability
analysis is increasing the transportation options for people so that they can meet at least a part of
their travel needs through walking and biking. One example of performance measures is the
percentage of trips that have been done through walking.
Table 8: Access to charging stations and walking distances in small network.
Table 9: Access to charging stations and walking distances in large network.
Some economists have measured in detail the benefits of walking and cycling. Litman (2009)
estimated the external costs of walking and compared them to the ones of driving cars in average
and peak urban conditions. He found that walking can save $0.25 per vehicle-mile and $0.50 per
vehicle-mile travelled in average urban condition and urban-peak condition, respectively. The
following table summarizes the monetized benefits of reduced motor vehicle travel per
mile(Litman, 2016):
Market Share: Market Share:
(BEV 1%, PHEV 2%) (BEV 0.05%, PHEV 0.4%)
Number of Access Walking Access Walking
Chargers distance distance
𝑝 = 1 8 1% 16.99 1% -14.74
𝑝 = 2 12 1% 17.29 1% -5.6
Market Share: Market Share: (BEV 1%, PHEV 2%) (BEV 2%, PHEV 5%)
Number of Access Walking distance Access Walking distance
Chargers
𝑝 = 1 10 1% -34.73 1% -54.71
𝑝 = 2 20 1% -38.83 1% -55.51

Community-Aware Charging Station Network Design for Electrified Vehicles
30
Table 10: Economic value of benefits of reduced motor vehicle travel per mile. (Source: Litman, 2016)
Impact Urbane peak Urban Off-Peak Rural Average
Congestion $0.2 $0.05 $0.01 $0.06
Restriction
Reduced Barrier $0.1 $0.01 $0.01 $0.01
Energy Conservation $0.03 $0.03 $0.03 $0.03
Pollution Reduction $0.1 $0.05 $0.01 $0.044
The AARP Public Policy Institute has developed an index to measure livability in neighborhood
level around the U.S. by focusing on old people since successful places to live usually are designed
for elderly people. The institute surveyed 4,500 Americans of age 50 and above to come up with
the following categories that determine a community's strengths and weaknesses (FHA 2011): Housing affordability as measured by housing cost burdens and the availability of subsidized
housing Neighborhood quality as measured by safety metrics and vacancy rates, as well as proximity
to grocery stores, parks, libraries jobs, and so on Alternative transportation options that connect people to social activities, economic
opportunities and health care Environmental conditions, including air and water quality, as well as resiliency plans that
incorporate disaster recovery and energy efficiency Health access, as measured by access to exercise options, health care availability, access to
healthy food Civic engagement, including residents' ability to reduce social isolation through community
engagement, measured by voting rates, number of cultural/arts institutions and organizations
and access to the internet Employment opportunities
In this index, communities are compared against each other and get a score between 0 and 100 in
each category. The average city gets 50 in each category and best places get 100. By studying the
problem of finding the optimal locations for charging stations of EVs from sustainability point of
view, Guo et al. (2015) developed and index system consisting of environmental, economic and
social criteria to evaluate the performance of siting the optimal locations for EV charging
infrastructure. Using research articles and feasibility reports of installing charging stations for EVs
and judgment of the experts in the various fields such as environment, economy, society, electric
Community-Aware Charging Station Network Design for Electrified Vehicles
31
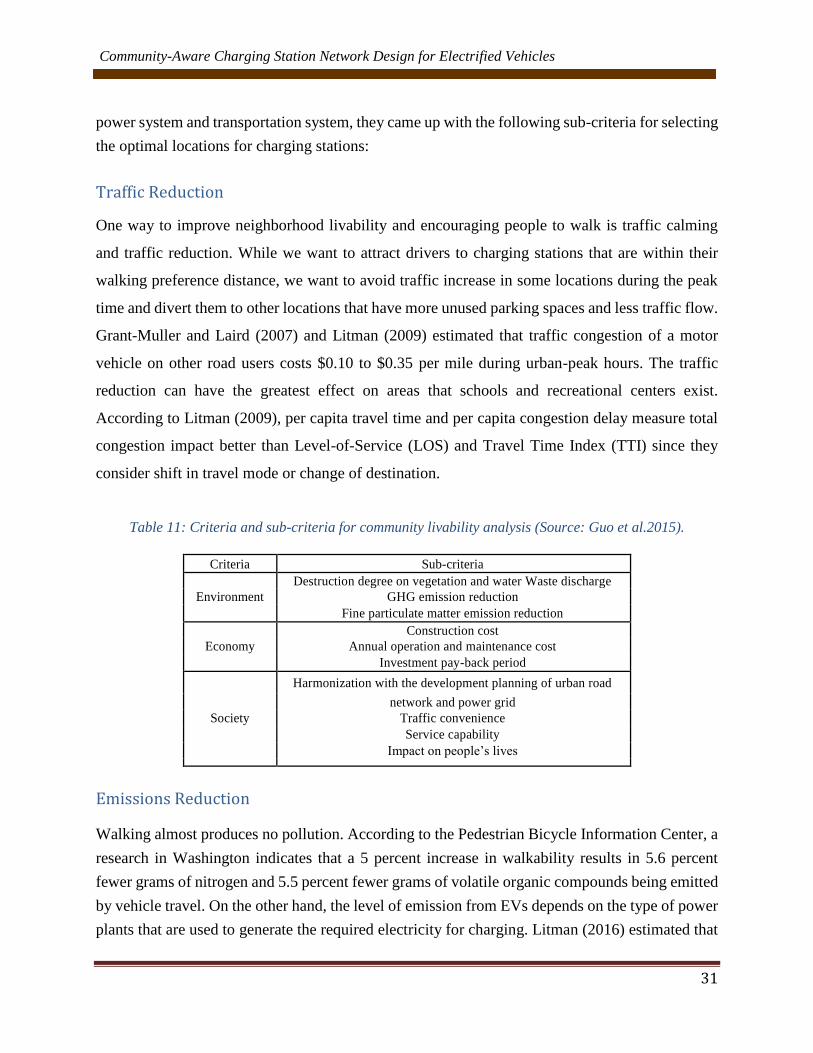
power system and transportation system, they came up with the following sub-criteria for selecting
the optimal locations for charging stations:
Traffic Reduction One way to improve neighborhood livability and encouraging people to walk is traffic calming
and traffic reduction. While we want to attract drivers to charging stations that are within their
walking preference distance, we want to avoid traffic increase in some locations during the peak
time and divert them to other locations that have more unused parking spaces and less traffic flow.
Grant-Muller and Laird (2007) and Litman (2009) estimated that traffic congestion of a motor
vehicle on other road users costs $0.10 to $0.35 per mile during urban-peak hours. The traffic
reduction can have the greatest effect on areas that schools and recreational centers exist.
According to Litman (2009), per capita travel time and per capita congestion delay measure total
congestion impact better than Level-of-Service (LOS) and Travel Time Index (TTI) since they
consider shift in travel mode or change of destination.
Table 11: Criteria and sub-criteria for community livability analysis (Source: Guo et al.2015).
Criteria Sub-criteria Destruction degree on vegetation and water Waste discharge
Environment GHG emission reduction Fine particulate matter emission reduction Construction cost
Economy Annual operation and maintenance cost Investment pay-back period
Harmonization with the development planning of urban road
network and power grid Society Traffic convenience
Service capability Impact on people’s lives
Emissions Reduction
Walking almost produces no pollution. According to the Pedestrian Bicycle Information Center, a
research in Washington indicates that a 5 percent increase in walkability results in 5.6 percent
fewer grams of nitrogen and 5.5 percent fewer grams of volatile organic compounds being emitted
by vehicle travel. On the other hand, the level of emission from EVs depends on the type of power
plants that are used to generate the required electricity for charging. Litman (2016) estimated that

Community-Aware Charging Station Network Design for Electrified Vehicles
32
the cost of pollution produced from driving automobiles is approximately 10 per mile for urban-
peak, 5 for urban o -peak and 1 for rural areas.
Public Health Benefits
Many studies in the literature have shown that there is a positive relationship between physical
activity and public health condition. According to WHO reports, physical inactivity contributes to
30% of ischaemic heart disease, 21-25% of breast and colon cancers, and 27% of diabetes
incidents. The Centers for Disease Control and Prevention has initiated a Healthy People 2020
program that emphasizes on the increase of walking and cycling. The design of charging
infrastructure can provide opportunities for people in a community to increase their level of
physical activity. The New Zealand Transport Agency estimates that walking has a value of $3.7
2008 USD per mile for improving health and reducing congestion. The following table shows the
monetized values of health benefits of walking provided by Land Transport New Zealand. These
values are the combination of the benefits that each person can get from walking and the benefits
that society can get (Litman, 2014).
Table 12: Economic value of public health benefits from walking (Source: Litman 2014).
Walking level Internal External 2007 U.S. Dollars
Benefit ($) Benefit ($) per mile
Low 0.12 0.12 0.24
Medium 0.24 0.24 0.48
High 0.48 0.48 0.96
Conclusions In this project, we studied and presented a two-stage stochastic programming model for network
design of EV in a given community. The developed models and the resulting tools are expected to
be used by planning agencies in the future. In continuation of the first phase, we expect to extend
the study in a second phase. The second phase will enhance the modelling framework in following
ways: a) identification of accessibility range for the community for the proposed EV stations
network and include a minimum coverage requirement, and assess the impact of uncovered regions
within a community, b) inclusion of multi-mode of transportation for a community and incentivize
the potential EV charging stations based on their reachability for multi-modes of transportation,
and gauge the shift in drivers’ adoption of such EV charging stations, c) provision to quantify the
Community-Aware Charging Station Network Design for Electrified Vehicles
33
robustness and sensitivity of prescribed network design with respect to the changes in the arrival
pattern, walking or adoption behavior of drivers and estimate the influence of pricing scheme on
a network design; this will provide useful insights due to the randomness used for the model, and
d) evaluation of the model with a pilot study for a community by partnering with a regional
planning agency such as the SEMCOG.
Results Dissemination
Following are the plans for knowledge dissemination from this phase of the project:
Optimization codes are developed using R and Python languages, and Gurobi was used as
an optimization solver. The software codes will be packaged as modules and will be shared
with planning agency (initially with SEMCOG) so they become part of their planning kit.
The research with be presented in the upcoming conferences (INFORMS annual meeting to
be held at Nashville in November).
The study will be integrated in undergraduate and graduate courses (Courses - Introduction
to Operations Research (UG) and Deterministic Optimization (PG)). A manuscript has been prepared based on the current study and expected to be submitted by the
end of summer. We are also preparing a white paper based on our case-study with SEMCOG and
we intend to share the white-paper and possibly engage in training sessions with other national
planning agencies.
References [1] Emerging trends in parking, 2015. International Parking Institute. [2] Huang, Y., Zhou, Y., 2015. An optimization framework for workplace charging strategies.
Transportation Research Part C 52, 144-155. [3] Sun, X., Yamamoto, T., Morikawa, T., 2015, Charge timing choice behavior of battery
electric vehicle users. Transportation Research Part D 37, 97-107. [4] Lam, W., Li, Z., Huang, H., Wong, S., 2006. Modeling time-dependent travel choice
problems in road networks with multiple user classes and multiple parking facilities.
Transportation Research Part B 40 (2006) 368-395. [5] Azadfar, E., Sreeram, V., Harries, D., 2015. The investigation of the major factors
Community-Aware Charging Station Network Design for Electrified Vehicles
34
influencing plug-in electric vehicle driving patterns and charging behavior. Renewable and
Sustainable Energy Reviews 42, 1065-1076. [6] Kelly, J., MacDonald, J., Keoleian, G., 2012. Time-dependent plug-in hybrid electric vehicle
charging based on national driving patterns and demographics. Applied Energy 94, 395-405. [7] Dong, J., Lin, Z., 2012. Within-day recharge of plug-in hybrid electric vehicles: Energy
impact of public charging infrastructure. Transportation Research Part D 17, 405-412. [8] Cai, H., Jia, X., Chiu, A., Hu, X., Xu, M., 2014. Siting public electric vehicle charging
stations in Beijing using big-data informed travel patterns of the taxi fleet. Transportation
Research Part D 33, 39-46. [9] Guell, C., Panter, J., Ogilvie, D., 2013. Walking and cycling to work despite reporting an
unsupportive environment: insights from a mixed-method exploration of counterintuitive
findings. BMC Public Health, 13:497. [10] Panter, J., Desousa, C., Ogilvie, D., 2013. Incorporating walking or cycling into car journeys
to and from work: The role of individual, workplace and environmental characteristics.
Preventive Medicine 56, 211-217. [11] Larsen, J., El-Geneidy, A., Yasmin, F., 2010. Beyond the quarter mile: Re-examining travel
distances by active transportation. Canadian Journal of Urban Research 19, 70-88. [12] Iacono, M., Krizek, K., El-Geneidy, A., 2008. Access to destinations: How close is close
enough? Estimating accurate distance decay functions for multiple modes and different
purposes. [13] Upchurch, C., Kuby, M., Lim, S., 2009. A model for location of capacitated alternative-fuel
stations. Geographical Analysis 41, 85-106. [14] Berger, D., Jorgensen, A., 2015. A comparison of carbon dioxide emissions from electric
vehicles to emissions from internal combustion vehicles. Journal of Chemical Education 92,
1204-1208. [15] Viswanathan, V., Zehe, D., Ivanchev, J., Pelzer, D., Knoll, A., Aydta, H., 2016. Simulation-
assisted exploration of charging infrastructure requirements for electric vehicles in urban
environments. Journal of Computational Science 12, 1-10. [16] Zhang, L., Brown, T., Samuelsen, S., 2013. Evaluation of charging infrastructure
requirements and operating costs for plug-in electric vehicles. Journal of Power Sources 240,
515-524. [17] Hofmeister, B., 2014. Electric vehicle charging infrastructure: Navigating choices regarding
regulation, subsidy, and competition in a complex regulatory environment. Journal of Energy
and Environmental Law, 42-71.
Community-Aware Charging Station Network Design for Electrified Vehicles
35
[18] Ahn Y., Yeo H., 2015. An analytical model to estimate the optimal density of charging
stations for electric vehicles. PLoS ONE 10(11). [19] Capar, I., Kuby, M., Leon, V., Tsai, Y., 2013. An arc cover path-cover formulation and
strategic analysis of alternative-fuel station locations. European Journal of Operational
Research 227, 142-151. [20] Capar, I., Kuby, M., 2012. An efficient formulation of the flow refueling location model for
alternative-fuel stations. IIE Transactions, 44:8, 622-636. [21] Dong, J., Liu, C., Lin, Z., 2014. Charging infrastructure planning for promoting battery
electric vehicles: An activity-based approach using multiday travel data. Transportation
Research Part C 38, 44-55. [22] He, F., Yin, Y., Zhou, J., 2015. Deploying public charging stations for electric vehicles on
urban road networks. Transportation Research Part C 60, 227-240.
[23] Baouche, F., Billot, R., Trigui, R., El Faouzi, N., 2014. Efficient Allocation of Electric
Vehicles Charging Stations: Optimization Model and Application to a Dense Urban
Network. IEEE Intelligent transportation systems magazine 14, 33-43. [24] Wang, Y., Lin, C., 2013. Locating multiple types of recharging stations for battery-powered
electric vehicle transport. Transportation Research Part E 58, 76-87. [25] Chung, S., Kwon, C., 2015. Multi-period planning for electric car charging station locations:
A case of Korean Expressways. European Journal of Operational Research 242, 677-687. [26] Shahraki, N., Cai, H., Turkay, M., Xu, M., 2015. Optimal locations of electric public
charging stations using real world vehicle travel patterns. Transportation Research Part D 41,
165-176. [27] Waerden, P., Timmermans, H., Bruin-Verhoeven, M., Car drivers' characteristics and the
maximum walking distance between parking facility and final destination. The Journal of
Transport and Land Use 1, 1-11. [28] Forsyth, A., Hearst, M., Oakes, J., Schmitz, K., 2008. Design and destinations: Factors in u-
encing walking and total physical activity. Urban Studies 45(9), 1973-1996. [29] Centers for Disease Prevention and Control, Active Community Environments (Atlanta, Ga:
National Center for Chronic Disease Prevention and Health Promotion, 2003). Available at:
http://www.cdc.gov/nccdphp/dnpa/aces.htm. Accessed December 15, 2002. [30] Pucher, J., Dijkstra, L., 2003. Promoting safe walking and cycling to improve public health:
Lessons from the Netherlands and Germany. American Journal of Public Health Vol 93, No.
9, 1509-1516. [31] Krumm, J., 2012. How people use their vehicles: Statistics from the 2009 National

Community-Aware Charging Station Network Design for Electrified Vehicles
36
Household Travel Survey. SAE International. [32] Plugged in: How Americans charge their electric vehicles. Idaho National Laboratory. [33] Kuzmyak, J., Dill, J., 2012. Walking and bicycling in the United States: The who, what,
where and why. TR News. [34] McKenzie, B., 2014. Modes less traveled-Bicycling and walking to work in the United
States: 2008-2012. American Community Survey Reports. [35] Fotheringham, A. S., O' Kelly, M., 1989. Spatial interaction models: formulations and
applications. Boston: Kluwer. [36] Yang, Y., Diez-Roux, A., 2012. Walking distance by trip purpose and population subgroups.
American Journal of Preventive Medicine 43, 11-19. [37] Brooker, R., Qin, N., 2015. Identification of potential locations of electric vehicle supply
equipment. Journal of Power Sources 299, 76-84. [38] Ji, Y., Deng, W., Wang, W. and Liu, G., 2007. Two-phased Parking Choice Model for Pre-
trip Parking Guidance System, Proceedings of the 86th Annual Meeting of the Transportation
Research Board, Washington DC, USA.
[39] Global EV outlook, Understanding the Electric Vehicle Landscape to 2020, 2013. [40] Creating Livable Communities, How the transportation decision making process can support
more livable community outcomes, Federal Highway Administration, 2011. [41] Guo, S., Zhao, H., 2015. Optimal site selection of electric vehicle charging station by using
fuzzy TOPSIS based on sustainability perspective. Applied Energy 158, 390-402. [42] Hosseini, M., MirHassani, S., 2015. Refueling-station location problem under uncertainty.
Transportation Research Part E 84, 101-116. [43] Plugged In: How Americans charge their electric vehicles. 2015. Idaho National Laboratory. [44] Becker, T., Sidhu, I., Tenderich, B., 2009. Electric vehicles in the United States: A new
model with forecasts to 2030. Center for Entrepreneurship and Technology, University of
California, Berkeley. [45] Litman, T., 2009. Transportation cost and benefit analysis. Victoria Transport Policy
Institute. [46] Litman, T., 2014. Economic value of walkability. Victoria Transport Policy Institute. [47] Vergis, S., Chen, B., 2015. Comparison of plug-in electric vehicle adoption in the United
States: A state by state approach. Research in Transportation Economics 52, 56-64. [48] Agenbroad, J., Holland, B, 2014. Pulling back the veil on EV charging station costs. Rocky
Mountain Institute. [49] Litman, T., 2016. Evaluating active transport benefits and costs. Victoria Transport Policy
Community-Aware Charging Station Network Design for Electrified Vehicles
37
Institute. [50] Litman, T., 2015. Air pollution costs. Victoria Transport Policy Institute. [51] U.S. Department of Energy, 2015. Fact of the Week 876, 877. Retrieved July 17, 2015 from:
http://energy.gov/eere/vehicles/transportation-fact-week. [52] Zhong, M., Hunt, J., Lu, X., 2008. Studying differences of household weekday and weekend
activities: A duration perspective. Transportation Research Record 2054, 28-36. [53] Turrentine, T., Kurani, K., Garas, D., Nicholas, M., Tal, G., 2015. Developing the plug-in
electric vehicle market: World, USA California experience. UC Davis Plug-in Hybrid and
Electric Vehicle Research Center. [54] Electric vehicle market penetration: An examination of industry literature. The Texas
Transportation Institute, Strategic Solutions Center. [55] MengTing, D., JingHong, Z., Man, Z., WenZhuo, W., 2011. Optimization of electric vehicle
charging capacity in a parking lot for reducing peak and filling valley in power grid.
International Conference on Advanced Power System Automation and Protection. [56] Luo, Z., Hu, Z., Song, Y., Xu, Z., Lu, H., 2013. Optimal coordination of plug-in electric
vehicles in power grids with cost-benefit analysis |Part II: A case study in China. IEEE
Transactions on Power Systems, Vol. 28, No. 4, 3556-3565.
[57] Fan, P., Sainbayar, B., Ren, S., 2015. Operation analysis of fast charging stations with energy
demand control of electric vehicles. IEEE Transactions on Smart Grid, Vol. 6, No. 4, 1819-
1826. [57] Guner, S., Ozdemir, A., 2015. Distributed storage capacity modeling of EV parking lots. 9th
International Conference on Electrical and Electronics Engineering (ELECO). [58] Pashajavid, E., Golkar, M.A., 2012. Placing parking lot of plug-in electric vehicles within a
distribution grid considering high penetration level of photovoltaic generation. Integration of
Renewables into the Distribution Grid, CIRED workshop. [59] Carley, S., Krause, R.M., Lane, B.W., Graham, J.D., 2013. Intent to purchase a plug-in
electric vehicle: A survey of early impressions in large US cites. Transportation Research
Part D 18, 39-45. [60] Sierzchula, W., Bakker, S., Maat, K., Wee, B., 2014. The influence of financial incentives
and other socio-economic factors on electric vehicle adoption. Energy Policy 68, 183-194. [61] Mock, P., Yang, Z., 2014. Driving electrification: A global comparison of fiscal incentive
policy for electric vehicles. The International Council on Clean Transportation.