community benefit programming to … · ... , and a literature review. 5 ... prog. for supplemental...
TRANSCRIPT
COMMUNITY BENEFIT PROGRAMMING TO IMPROVE HEALTHY FOOD ACCESS AND REDUCE RISK OF DIET-RELATED DISEASE
A National Survey of Hospitals

2
Table of Contents
ProjectIntroduc-on,OverviewofSurveyMethods,andKeyFindings......................................slides3-12CommunityHealthNeedsAssessments..................slides13-25Implementa-onStrategies.............................slides26-36Distribu-onofReportedProgramsbyHospital............slides37-39&CommunityCharacteris-csSupportforLocalFoodSystems.........................slides40-43

PROJECT INTRODUCTION, OVERVIEW OF SURVEY METHODS, AND KEY FINDINGS
Tamara Dunn/Flickr U.S. Department of Agriculture

4
Project Introduction
ChangestoIRSregula-onsgoverningnonprofithospitals'communitybenefitobliga-onshavecreatedanewimpetusforhospitalstocollaboratewithotherstakeholderstoimplementcommunityhealthimprovementplansthataddresssocialdeterminantsofhealth,includingincreasingaccesstoquality,affordablefood.HealthCareWithoutHarmhasundertakenathree-yearproject,withsupportfromtheRobertWoodJohnsonFounda-on,toexaminehospitalcommunitybenefitprogrammingtoincreasehealthyfoodaccess,promotehealthyandsustainablefoodsystems,andreduceriskofdiet-relatedhealthcondi-ons.Theprojectincludesprimaryresearchaswellasdevelopinganddissemina-ngtoolsandresourcestosupportreplica-onofpromisingcommunitybenefitprac-ces.Thestudyinvolvesana-onalsurveyofnot-for-profithospitals,analysisofsurveyrespondents’CommunityHealthNeedsAssessments(CHNAs)andimplementa-onsstrategies,in-depthinterviewswithkeyinformants,casestudies,andaliteraturereview.

5
Thischartbooksummarizesfindingsfromasurveyofarandomsampleofcommunitybenefitdirectorsatnot-for-profit,generalmedicalandsurgicalhospitalsthroughouttheUnitedStates.ThesamplewasdrawnfromtheAmericanHospitalAssocia-on(2014)hospitalsdatabase.Thisreportalsoincludesselecteddatafromsurveyrespondents’CHNAs.Thisreportisthefirstinaseriesofresearchreportsandotherresourcesthatwillbereleasedin2017.Thesewillincludeacomprehensiveresearchreportthatwilldiscussindepththefindingsfromthesurveyandotherresearchmethodsandpresentrecommenda-ons.Alsoforthcomingisatoolkitofguidanceresourcesthatwillsupporthospitalcommunitybenefitprofessionalsandcommunitypartnersindevelopingini-a-vestopromotehealthyfoodaccessandhealthierfoodenvironments.

6
Survey methodology Ø Thesurveywasdevelopedinsummer2016toinves-gatehowhospitals
organizecommunitybenefitac-vi-esandhowtheyincludefoodinsecurity,healthyfoodaccess,anddiet-relateddiseaseintheircommunityhealthneedsassessmentsandimplementa-onstrategies
Ø Invita-onstopar-cipateinonlinesurveyweree-mailedtocommunitybenefitmanagersatarandomsampleof930private,not-for-profit,generalhospitalsthroughouttheUnitedStates
Ø SurveyinfieldfromAugust16-December8,2016
Ø 215completedsurveysreturned
Ø Responserate23.12%
Ø Surveyrespondents’communityhealthneedsassessments(CHNAs)werealsoanalyzedinconjunc-onwithsurveydata

7
Survey sample characteristics
Characteristic Survey Respondents Population
Geographic Region Midwest 36% 35%
South 22% 29% Northeast 22% 18%
West 21% 19% Rural/Urban
Urban 62% 64% Rural 38% 36%
Hospital Size Small (<100 beds) 43% 44%
Medium (100-399 beds) 46% 44% Large (400+ beds) 11% 12%
Other Characteristics ACO* hospital 44% 37%
Children's hospital 2% 2% Critical access hospital 28% 25% Major teaching hospital 7% 7% Minor teaching hospital 40% 39%
System affiliation 67% 69% *Accountable Care Organization
Respondentsfairlycloselymatchedthepopula-onsurveyed.TheNortheastover-respondedwhiletheSouthunder-responded.
AccountableCareOrganiza-onhospitalsalsoover-responded.

8
Key findings about community health needs assessments (CHNAs) Ø Obesitywasiden-fiedasahealthneedin71%ofrespondents’CHNAs,whilefoodinsecurityorhealthyfoodaccesswasiden-fiedasahealthneedin13%ofCHNAs.
Ø 57%ofhospitals’CHNAsu-lizedfoodenvironmentmeasures.ThemostcommonmeasureswereCountyHealthRankings&Roadmaps’FoodEnvironmentIndexandtheU.S.DepartmentofAgriculture's(USDA)fooddesertmeasures.
Ø Dataondiet-relatedbehaviors,suchasfruitandvegetableconsump-on,wasincludedin40%ofCHNAs.
Ø 45%ofhospitalsreportedincludingatleastonefood-relatedorganiza-onontheirCHNAcommieee.Havingafood-relatedorganiza-onontheCHNAcommieeewasstronglycorrelatedwithhavingacommunitybenefitprogramthattargetedhealthyfoodaccessorfoodinsecurity.
Ø Collabora-ngwithotherhospitalsintheCHNAprocesswascommon,with59%ofhospitalsrepor-ngcollabora-onwithotherfacili-es(withinand/orexternaltotheirhospitalsystem)intheirCHNAs.Urbanhospitalsweremorelikelytocollaboratewithotherfacili-esthanruralhospitals(67%forurbanvs.46%forrural).
9
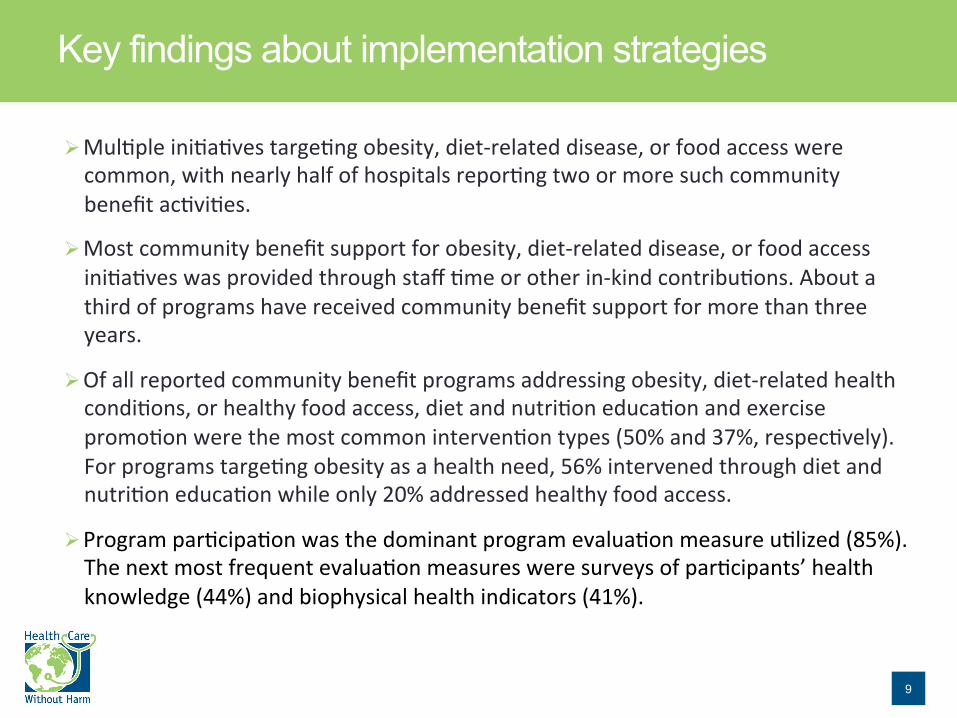
Key findings about implementation strategies Ø Mul-pleini-a-vestarge-ngobesity,diet-relateddisease,orfoodaccesswerecommon,withnearlyhalfofhospitalsrepor-ngtwoormoresuchcommunitybenefitac-vi-es.
Ø Mostcommunitybenefitsupportforobesity,diet-relateddisease,orfoodaccessini-a-veswasprovidedthroughstaff-meorotherin-kindcontribu-ons.Aboutathirdofprogramshavereceivedcommunitybenefitsupportformorethanthreeyears.
Ø Ofallreportedcommunitybenefitprogramsaddressingobesity,diet-relatedhealthcondi-ons,orhealthyfoodaccess,dietandnutri-oneduca-onandexercisepromo-onwerethemostcommoninterven-ontypes(50%and37%,respec-vely).Forprogramstarge-ngobesityasahealthneed,56%intervenedthroughdietandnutri-oneduca-onwhileonly20%addressedhealthyfoodaccess.
Ø Programpar-cipa-onwasthedominantprogramevalua-onmeasureu-lized(85%).Thenextmostfrequentevalua-onmeasuresweresurveysofpar-cipants’healthknowledge(44%)andbiophysicalhealthindicators(41%).

10
Key findings about community benefit support for local food systems Ø Forthoserespondentswhoreportedhavingacommunitybenefitprogramthattargetedfoodinsecurityorhealthyfoodaccess,43%saidincludinglocalororganicproducersintheprogramwasveryimportant.
Ø 48%ofallrespondentssaidthatitwasveryorsomewhatlikelythattheirfacilitywouldprovidecommunitybenefitsupportinthenext3yearstoanini-a-veinvolvingcommunityagriculture(e.g.urbanfarmorcommunitysupportedagriculture).

11
Department in which most or all community benefit functions are located
Communitybenefitfunc-onsarehousedin
diversehospitaldepartments.Departmentsthatengagethecommunityalsohavediversenames.

12
Hospitals reported using resources from the following organizations to inform community benefit activities
Organization
Utilized online or print re-sources
Attended an online webinar
Attended a conference or in-person training
American Hospital Association (e.g. Association for Community Health Improvement or Hospitals in Pursuit of Excellence)
60% 26% 18%
State hospital association 54% 23% 26% Catholic Health Association 49% 28% 17% CDC (e.g. Community Health Improvement Navigator or Healthy People 2020)
73% 17% 5%
ASTHO (Assoc. of State and Territorial Health Officials) or NACCHO (National Assoc. of County and City Health Officials)
19% 2% 2%
Community Commons (chna.org) 42% 11% 2% County Health Rankings & Roadmaps 79% 20% 7%
Community Benefit Connect 20% 8% 3% Public Health Institute (www.phi.org) 39% 10% 3%
CDCandCountyHealthRankings&Roadmapsarethemostwidelyusedsourcesofonlineorprintmaterials.
AHAandCHAprovidekey
resourcesthroughwebinarsandin-persontrainingsor
conferences.
COMMUNITY HEALTH NEEDS ASSESSMENTS
U.S. Department of Agriculture

14
CHNA dates and collaborative process
Conducted first CHNA in
2011 or earlier 29% 2012 27% 2013 42%
2014 or later 2%
Conducted most-recent CHNA in
2013 or earlier 1% 2014 4% 2015 30% 2016 65%
Abouttwo-thirdsof
respondentscompletedtheir
most-recentCHNAin2016.
59%collaboratedwithotherhospitals
(withinand/orexternaltotheir
hospitalsystem)intheirCHNAprocess.

15
Roles or groups represented on CHNA committee
45%ofhospitals
includedatleastonefood-related
organiza-onontheirCHNAcommieee.

16
Relationship between CHNA committee membership and reported community benefit programs
Havinganyreportedprogramsaddresingobesity,
diet-related
Programstargetingfoodsecurityand/orhealthyfoodaccess
Programstargetingpreventionortreatmentof
obesity
Programstargetingpreventionor
treatmentofdiet-relateddisease
Signif.a Signif.a Signif.a Signif.a
HospitalAdmin.Staff† -- -- -- --
HealthcarePractitioner Pos** -- -- --
StatePublicHealthAgency -- -- -- --
LocalPublicHealthAgency -- -- -- --
Low-incomeCommunity Pos* Pos* -- --
Ethnic/RacialMinorityCommunity -- -- Pos** Pos*
Org.forEmergencyFoodProvision -- Pos*** -- Pos**
Prog.forSupplementalMealProvision -- Pos** -- --
FoodSystemAdvocacyGroup -- Pos*** Pos*** --aDirectionandsignificanceofcorrelationbetweencommitteepartic.andprogramtypebasedonsimplelogisticregression***p<0.01;**p<0.05;*p<0.1†Hospitalexecutivemanagement,publicrelationsormarketing,boardofdirectors,orfoundation
CHNACo
mmitteeM
embe
rs
Havingafoodorganiza-on
representedontheCHNA
commieeewasassociatedwith
havingacommunity
benefitprogramthattargetedhealthyfoodaccessorfoodinsecurity.

17
Different ways public health participated in the CHNA process
Localpublichealthagenciespar-cipatedinconduc-ngprimarydatacollec-onandiden-fyinghealthneedsin62%and60%ofCHNAs,
respec-vely.

18
Consultant participation in the CHNA process
52%ofhospitalsu-lizedaconsultantforoneormoreof
theseCHNAac-vi-es.Consultantsweremostheavilyrelied
uponforprimarydatacollec-onand
facilita-ngtheCHNAprocess.
19
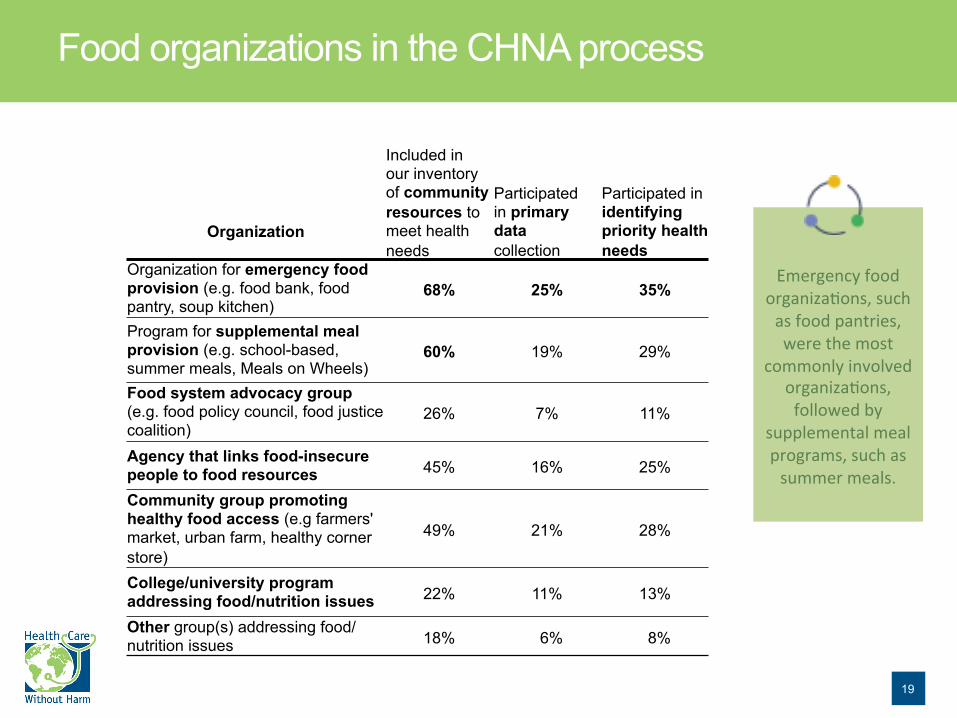
Food organizations in the CHNA process
Organization
Included in our inventory of community resources to meet health needs
Participated in primary data collection
Participated in identifying priority health needs
Organization for emergency food provision (e.g. food bank, food pantry, soup kitchen)
68% 25% 35%
Program for supplemental meal provision (e.g. school-based, summer meals, Meals on Wheels)
60% 19% 29%
Food system advocacy group (e.g. food policy council, food justice coalition)
26% 7% 11%
Agency that links food-insecure people to food resources 45% 16% 25%
Community group promoting healthy food access (e.g farmers' market, urban farm, healthy corner store)
49% 21% 28%
College/university program addressing food/nutrition issues 22% 11% 13%
Other group(s) addressing food/nutrition issues 18% 6% 8%
Emergencyfood
organiza-ons,suchasfoodpantries,werethemost
commonlyinvolvedorganiza-ons,followedby
supplementalmealprograms,suchassummermeals.

20
Health needs identified in survey respondents’ CHNAs
HealthNeed
OnListofIden,fied
HealthNeeds†
OnListofPriori,zed
HealthNeeds∆Obesitypreven-onortreatment* 71% 54%Diabetes 40% 28%Otherdiet-relateddiseases 45% 24%Foodinsecurityorhealthyfoodaccess 13% 1%Poverty,economicsecurity,orunemployment 22% 7%Noneofthesehealthneedsiden-fiedorpriori-zed 21% 32%*Includesneedforimproveddiet/nutri>onandneedforincreasedphysicalac>vity†of205facili>esforwhichCHNAswereavailable∆of166CHNAsthatlistedpriorityneeds
Obesitywasthemostcommonofthesehealthneeds
iden-fiedandpriori-zedin
CHNAs.
13%ofCHNAsiden-fiedfoodinsecurityor
healthyfoodaccessasahealthneed.

21
Diet-related health conditions data sources utilized in CHNAs
Obesity,Diabetes,andotherDiet-RelatedDiseaseSecondaryData&Sources
Includesdatacollectedonprevalenceofobesity,diabetes,cardiovasculardisease,highbloodpressure,andhighcholesterol
PercentofCHNAsusingatleastonediet-relateddiseasemeasure 94%Obesity 88%Diabetes 78%
OtherDiet-RelatedDisease 75%
TopdatasourcesincludedCDC(e.g.BehavioralRiskFactorsSurveillanceSystem,YouthRiskBehaviorSurveillanceSystem,WONDER)LocalandStatesources(e.g.city,county,orstatepublichealthdepartmentsurveys)
Dataonprevalenceofobesityand
diet-relateddiseaseswerecollectedinnearlyallCHNAs.
TheCDCandstateorlocalpublichealthagencieswerethe
mostcommonsourcesfordata.

22
Food insecurity metrics and data sources utilized in CHNAs
FoodInsecuritySecondaryMeasures&SourcesIncludesdatacollectedonfoodinsecurity,u>liza>onoffreeorreduced-priceschoolmeals,andSNAP&WICusage.
PercentofCHNAsusingatleastonefoodinsecuritymeasure 52%Foodinsecurity* 34%
Free/reduced-priceschoolmealsusage 25%SNAPusage 22%
Childfoodinsecurity* 13%WICusage 5%
TopdatasourcesincludedMaptheMealGap,FeedingAmericaNa-onalCenterforEduca-onSta-s-csCommunityHealthRankings&Roadmaps(ci-ngMaptheMealGap)
*FeedingAmerica’sfoodinsecuritymeasuresareanindirectes-mateofthetotalnumberofindividualsorchildrenunderage18whoarefoodinsecureinacountyduringtheyear.Es-matesarebasedondatafromtheCurrentPopula-onSurvey(U.S.CensusBureauandtheBureauofLaborSta-s-cs).SeeFeedingAmerica.orgfordetails.
52%offacili-es’
CHNAsusedatleastonemeasureoffoodinsecurity.
MaptheMealGap
fromFeedingAmericaandthe
AmericanCommunitySurveyfromtheCensusBureauwerethemostcommonsourcesofdata.

23
Food environment metrics and data sources utilized in CHNAs
FoodEnvironmentSecondaryMeasures&SourcesIncludesmeasurescollectedonprevalenceoffooddesertsand/ordifferentkindsoffoodoutlets
PercentofCHNAsusingatleastonefoodenvironmentmeasure 57%Foodenvironment* 33%
Fooddesert* 27%Fastfoodrestaurantsdensity 16%
Grocerystoredensity 15%Lowfoodaccess 14%
Farmer'smarketdensity 6%Storesaccep>ngSNAP 8%Storesaccep>ngWIC 3%
TopdatasourcesincludedFoodAccessResearchAtlas,USDACommunityBusinessPaeerns,USCensusCountyHealthRankings&Roadmaps(theirIndex&USDAdata)
*FoodEnvironmentIndexisCountyHealthRankingsandRoadmaps’ownindex,whichcombinesUSDA'sFoodDesertdataandFeedingAmerica'sFoodInsecuritydataintooneIndexthatisusedtorankcoun-es.FoodDesertdataisexclusivelyfromUSDA'sFoodAccessResearchAtlasandisacompositeofincomelevelandproximitytoagrocerystore.LowFoodAccessisalsofromtheUSDAandisjustthegeographicpor-onofFoodDesertdata,orproximitytogrocerystores.
Foodenvironmentmeasureswere
u-lizedinroughly60%ofhospitals’
CHNAs.
ThemostcommonmeasureswereCHRR'sFood
EnvironmentIndexandtheUSDA'sfooddesertmeasures.

24
Dietary behavior metrics and data sources utilized in CHNAs
Food-RelatedBehaviorsSecondaryMeasures&SourcesIncludesdatacollectedonfood-relatedbehaviorssuchasfruitandvegetableconsump>on,sugarconsump>on,orexpendituresondifferenttypesoffoods
PercentofCHNAsusingatleastonefood-relatedbehaviormeasure 40%Fruit/vegetableconsump>on 38%
Sugarconsump>on 13%Fastfoodconsump>on 3%
TopdatasourcesincludedBehavioralRiskFactorsSurveillanceSystem,CDCLocalandstatesources(e.g.city,county,orstatepublichealthdepartmentsurveys)CommunityCommons(e.g.CDCBRFSSdataandNielsenexpendituredata)
40%ofCHNAs
includeddataondiet-related
behaviors,suchasfruitandvegetable
consump-on.
TheCDC’sBRFSSsurveysandstateorlocalpublichealthagency
surveyswerethemostcommonsourcesfordata.

25
Food and diet-related primary data utilized in CHNAs
PrimaryDataCollec,onMethodsPercentofCHNAsusingatleastoneoriginaldatacollec,onmethod 89%
Surveys 61%Focusgroups 53%
Interviews 40%
Nearly90%ofCHNAsusedatleastonesourceoforiginaldatathatcapturedobesityanddiet-relatedhealth
needs,eitheraspartofasetofgeneralques-onsorthroughques-onsfocusedonobesityanddiet-relateddisease.

IMPLEMENTATION STRATEGIES
U.S. Department of Agriculture
27
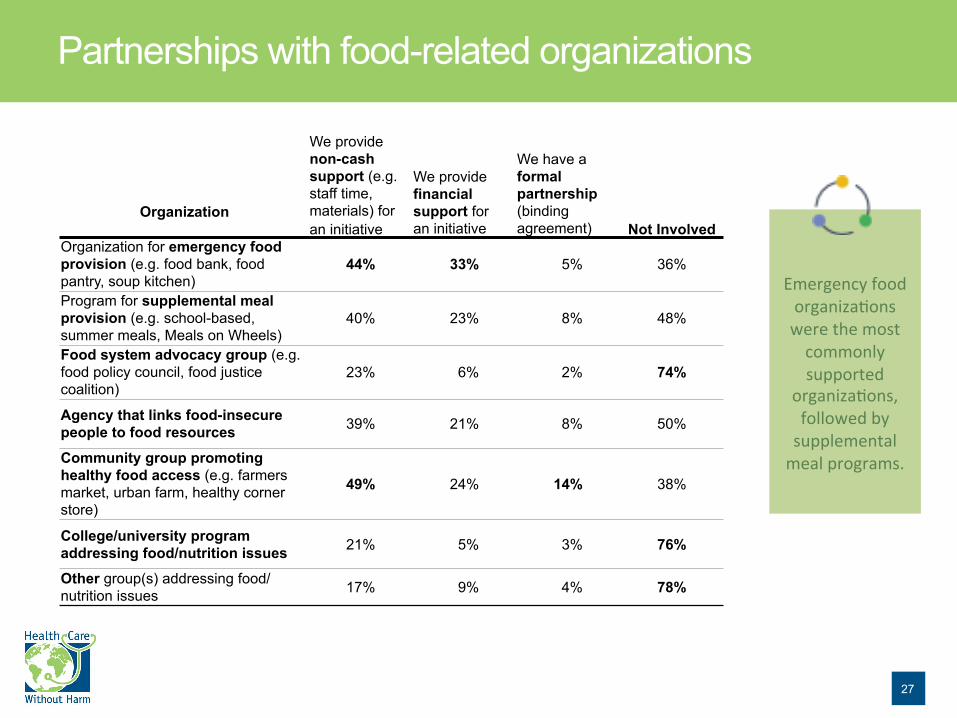
Partnerships with food-related organizations
Organization
We provide non-cash support (e.g. staff time, materials) for an initiative
We provide financial support for an initiative
We have a formal partnership (binding agreement) Not Involved
Organization for emergency food provision (e.g. food bank, food pantry, soup kitchen)
44% 33% 5% 36%
Program for supplemental meal provision (e.g. school-based, summer meals, Meals on Wheels)
40% 23% 8% 48%
Food system advocacy group (e.g. food policy council, food justice coalition)
23% 6% 2% 74%
Agency that links food-insecure people to food resources 39% 21% 8% 50%
Community group promoting healthy food access (e.g. farmers market, urban farm, healthy corner store)
49% 24% 14% 38%
College/university program addressing food/nutrition issues 21% 5% 3% 76%
Other group(s) addressing food/nutrition issues 17% 9% 4% 78%
Emergencyfoodorganiza-onswerethemostcommonlysupported
organiza-ons,followedbysupplementalmealprograms.

28
Decision-making authority
Themajorityofrespondents
reportedthatseniormanagementwas
theul-mateauthorityforseveralcommunitybenefit
programmingmaeers.However,communitybenefit
directorsholdauthorityovermonitoringandevalua-on.

29
Hospitals reporting 0,1, 2, or 3 community benefit initiatives to address obesity, diet-related disease, or food access
Mul-pleini-a-vestarge-ngobesity,
diet-relateddisease,orfoodaccesswerecommon,withnearly
halfofhospitalssurveyedrepor-ngtwoormoresuchcommunitybenefit
programs.

30
Targeted health needs (among all reported initiatives addressing obesity, diet-related disease, or food access)
Fewerthanhalfofcommunity
benefitprogramswereaimedataddressingfoodinsecurityorhealthyfood
access.

31
Community benefit intervention types (among all reported initiatives addressing obesity, diet-related disease, or food access)
Dietandnutri-oneduca-on
andexercisepromo-onwerethemostcommon
interven-ontypes.

32
Percent of programs targeting different health needs that engage different intervention activities
Intervention activity type
Diet & Nutrition Education
Exercise Promotion
Improving Food
Access
Diabetes Screening or Management Other
Hea
lth n
eed
targ
eted
Prevention or treatment of obesity 56% 44% 20% 8% 13%
Prevention or treatment of diet-related disease 55% 39% 16% 15% 14%
Improving food security and/or healthy food access
44% 23% 56% 4% 8%
Other health conditions or SDH 63% 41% 15% 7% 33%
From 331 community benefit programs reported by 215 respondents Programs were assigned up to two activity types Respondents could select more than one targeted health need
Forprogramstarge-ngobesityasahealthneed,56%intervenedthroughdietand
nutri-oneduca-on,while
only20%addressedhealthy
foodaccess.

33
Time of hospital support & internal or external management of initiatives (for reported initiatives addressing obesity, diet-related disease, or food access)
Aboutathirdofprogramshavereceivedcommunitybenefitsupportformorethanthreeyears.About75%ofprogramsaremanagedbyhospitalstaff.

34
Populations targeted by community benefit initiatives (among reported initiatives addressing obesity, diet-related disease, or food access)
Abouthalfofprogramsto
addressfoodordiet-relatedhealthneedstargeted
low-incomehouseholds.

35
Evaluation methods utilized (among reported initiatives addressing obesity, diet-related disease, or food access)
Programpar-cipa-onwasthedominantevalua-on
measureu-lized,while41%ofprogramsused
biophysicalhealthindicators.

36
Types of community benefit support provided (among reported initiatives addressing obesity, diet-related disease, or food access)
Most
communitybenefitsupportwasprovidedthroughstaff-meorother
in-kindcontribu-ons.

DISTRIBUTION OF REPORTED PROGRAMS BY HOSPITAL & COMMUNITY CHARACTERISTICS
Beaumont Hospital Farmers Market (Hillary Greenwood)

38
Relationship between hospital characteristics and reported community benefit programs
%a Signif.b %a Signif.b %a Signif.b %a Signif.b
Northeast 85.1 -- 51.1 -- 78.7 -- 70.2 --
Midwest 88.3 -- 50.7 -- 81.8 -- 71.4 --
South 83.0 -- 48.9 -- 74.5 -- 76.6 Pos*
West 72.7 Neg** 45.5 -- 63.6 -- 59.1 --
Small(<100beds) 79.4 -- 38.0 Neg* 71.7 -- 67.4 --
Medium(100-399beds) 84.6 -- 53.5 -- 77.8 -- 72.7 --
Large(400+beds) 95.7 -- 78.3 Pos** 87.0 -- 69.6 --
Urban 89.4 Pos*** 55.3 -- 80.3 -- 74.2 --
CriticalAccess 80.0 -- 38.3 -- 71.7 -- 68.3 --
Teaching † 89.1 Pos* 60.4 Pos** 79.2 -- 72.3 --
ACO § 90.4 Pos** 51.8 -- 83.1 -- 74.7 --
SystemAffiliation 88.8 Pos*** 55.9 Pos** 81.1 -- 76.2 Pos*
†Majororminorteachinghospital
aPercentofhospitalsincategorythathaveatleastonereportedprogrambDirectionandsignificanceofcorrelationbetweenhospitalcharacteristicandprogramtypebasedonsimplelogisticregression
§AccountableCareOrganization
***p<0,01;**p<0.05;*p<0.1
Programstargetingpreventionor
treatmentofobesity
Programstargetingpreventionor
treatmentofdiet-relateddisease
Programstargetingfoodsecurityand/orhealthyfoodaccess
HospitalCharacteristics(n
=215
) Region
Size
Other
Havinganyreportedprogramsaddresingobesity,diet-relateddisease,orfoodaccess
Urbanhospitalsandhospitals
thatarepartofahospitalsystemweremorelikelytoreportatleastonecommunitybenefitprogram
addressingobesity,
diet-relateddisease,orfood
accessorinsecurity.

39
Relationship between county-level health & sociodemographic characteristics and reported community benefit programs
Havinganyreportedprogramsaddresingobesity,
diet-relateddisease,orfood
access
Programstargetingfoodsecurityand/orhealthyfoodaccess
Programstargetingpreventionortreatmentof
obesity
Programstargetingpreventionor
treatmentofdiet-relateddisease
Signif.a Signif.a Signif.a Signif.a
Obesity† Parab*** -- -- Parab**
Diabetes† Parab** -- Pos* --
FoodInsecurity § Neg* Pos** -- --
SNAPUsage ∆ -- Pos*** -- --
Poverty ∆ Neg** Pos*** -- --
Unemployment ∆ -- Pos*** -- --
aDirectionandsignificanceofcorrelationbetweencharacterisitcandprogramtypebasedonsimplelogisticregression
***p<0.01;**p<0.05;*p<0.1†2010-2014BRFSS(CDC)county-levelobesityanddiabetesprevalenceestimates§2014FeedingAmerica,county-levelfoodinsecurityprevalenceestimates
Coun
ty-le
velp
revalenceofhealth
&
sociod
emog
raph
iccha
racteristicsfor
respon
denthospitals(n
=215
)
bParabolicrelationshipwherehospitalsincountieswithhigherandlowerobesityordiabetesratesappeartobetheleastlikelytohaveaCBprogramaddressingobesity,diet-relateddisease,orfoodaccess
∆2010-2014AmericanCommunitySurvey(USCensusBureau)county-levelestimatesofSNAPusage,povertyprevalence(%belowFPL),andunemployment
Hospitalsinareaswithhigherratesoffoodinsecurity,SNAPusage,poverty,or
unemploymentseemtobemorelikelytohave
communitybenefitprogramstarge-nghealthyfoodaccessorfoodinsecurity.

SUPPORT FOR LOCAL FOOD SYSTEMS
Photos by Lindsey J. Scalera

41
Forthoserespondentswhohadacommunitybenefitprogramthataddressedfoodinsecurityorhealthyfoodaccess,43%saidincludinglocalororganic
producersintheprogramwas
veryimportant.
Ifyouhaveacommunitybenefitini>a>vetoimprovehealthyfoodaccess,howimportantwasittoincludesupportforlocal/regional
ororganicproducersaspartoftheprogram?
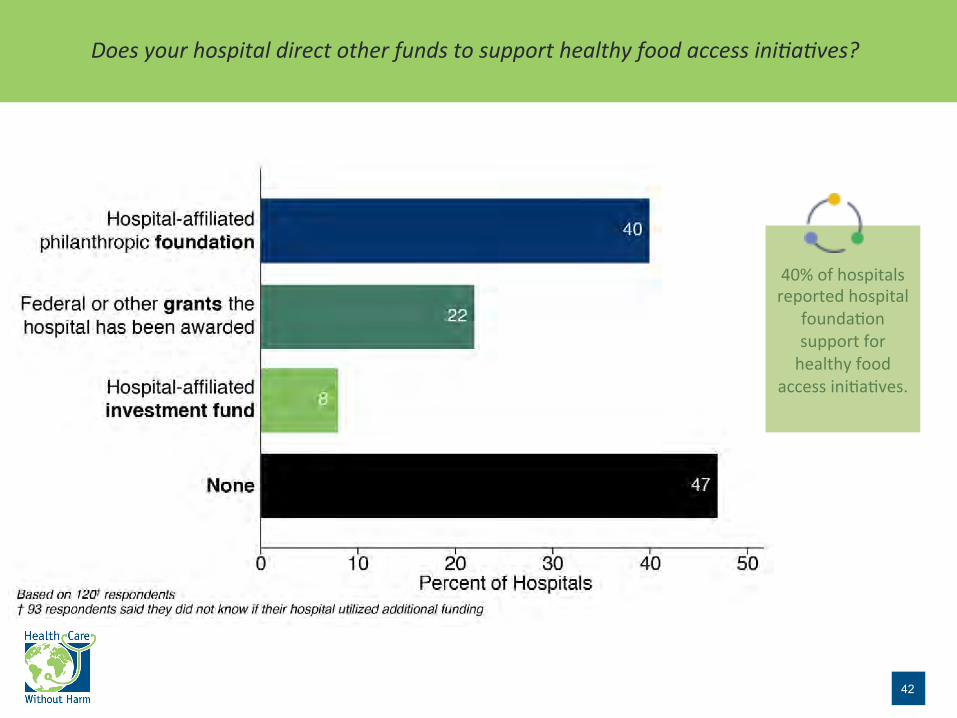
42
40%ofhospitalsreportedhospital
founda-onsupportforhealthyfood
accessini-a-ves.
Doesyourhospitaldirectotherfundstosupporthealthyfoodaccessini>a>ves?

43
Themajorityofrespondents
reportedthatitwaslikelythattheirfacili-eswouldprovide
communitybenefitsupportto
programsforemergencyor
supplementalfoodprovisionorthatlinkfoodinsecurepeopletofoodresourcesinthenextthreeyears.
Howlikelyisitthatyourfacilitywillprovidecommunitybenefitsupporttotheseprogramtypesinthenextthreeyears?

44
Citation
SuggestedCita,on:HealthCareWithoutHarm(2017).CommunityBenefitProgrammingtoImproveHealthyFoodAccessandReduceRiskofDiet-RelatedDisease:ANa-onalSurveyofHospitals.Reston,VA:HealthCareWithoutHarm.Accessedatnoharm.org/foodaccessCBsurveyThissurveyispartofalargerproject,CatalyzingHealthCareInvestmentinHealthyFoodSystems,whichexamineshospitalcommunitybenefitprogrammingtoincreasehealthyfoodaccess,promotehealthyandsustainablefoodsystems,andreduceriskofdiet-relatedhealthcondi-ons.Formoreinforma-on,visitnoharm.org/ResilientCommuni-es

45
Acknowledgements
SupportforthisprojectwasprovidedinpartbytheRobertWoodJohnsonFounda-on.TheviewsexpressedheredonotnecessarilyreflecttheviewsoftheFounda-on. PhotoCredits• U.S.DepartmentofAgriculture• TamaraDunn/Flickr• LindseyJ.Scalera• Madebyoliver/Fla-con

HealthCareWithoutHarmseekstotransformthehealthsectorworldwide,withoutcompromisingpa-entsafetyorcare,sothatitbecomesecologicallysustainableandaleadingadvocateforenvironmentalhealthandjus-ce.Withofficesonfourcon-nentsandpartnersaroundtheworld,HealthCareWithoutHarmisleveragingthehealthsector’sexper-se,purchasingpower,poli-calclout,workforcedevelopment,andmoralauthoritytocreatethecondi-onsforhealthypeople,communi-es,andtheenvironment. ThisreportwasproducedbyHealthCareWithoutHarm’sna-onal
HealthyFoodinHealthCareprogram,whichharnessesthepurchasingpowerandexper-seofthehealthcaresectortoadvancethedevelopmentofasustainablefoodsystem.Visithealthyfoodinhealthcare.orgformoreinforma-on.
CONTACTINFOHealthCareWithoutHarm12355SunriseValleyDriveSuite680Reston,VA20191
Health Care Without Harm