community detection in networks with node … detection in networks with node attributes jaewon yang...
TRANSCRIPT

Community Detection in Networks withNode Attributes
Jaewon YangStanford University
Julian McAuleyStanford University
Jure LeskovecStanford University
Abstract—Community detection algorithms are fundamentaltools that allow us to uncover organizational principles innetworks. When detecting communities, there are two possiblesources of information one can use: the network structure, and thefeatures and attributes of nodes. Even though communities formaround nodes that have common edges and common attributes,typically, algorithms have only focused on one of these two datamodalities: community detection algorithms traditionally focusonly on the network structure, while clustering algorithms mostlyconsider only node attributes. In this paper, we develop Com-munities from Edge Structure and Node Attributes (CESNA),an accurate and scalable algorithm for detecting overlappingcommunities in networks with node attributes. CESNA statis-tically models the interaction between the network structure andthe node attributes, which leads to more accurate communitydetection as well as improved robustness in the presence ofnoise in the network structure. CESNA has a linear runtimein the network size and is able to process networks an orderof magnitude larger than comparable approaches. Last, CESNAalso helps with the interpretation of detected communities byfinding relevant node attributes for each community.
I. INTRODUCTION
One of the most important tasks when studying networksis that of identifying network communities. Fundamentally,communities allow us to discover groups of interacting objects(i.e., nodes) and the relations between them. For example,in social networks, communities correspond to groups offriends who attended the same school, or who come fromthe same hometown [28]; in protein interaction networks,communities are functional modules of interacting proteins [1];in co-authorship networks, communities correspond to scien-tific disciplines [16]. Identifying network communities allowsus to discover functionally related objects [15], [16], [41],study interactions between modules [2], infer missing attributevalues [4], [10], and predict unobserved connections [9].
Identifying network communities can be viewed as aproblem of clustering a set of nodes into communities, wherea node can belong multiple communities at once. Becausenodes in communities share common properties or attributes,and because they have many relationships among themselves,there are two sources of data that can be used to performthe clustering task. The first is the data about the objects(i.e., nodes) and their attributes. Known properties of proteins,users’ social network profiles, or authors’ publication historiesmay tell us which objects are similar, and to which communi-ties or modules they may belong. The second source of datacomes from the network and the set of connections between the
objects. Users form friendships, proteins interact, and authorscollaborate.
However, clustering methods typically focus only one ofthese two data modalities. In terms of attributes, clusteringalgorithms [6], [20] identify sets of objects whose attributesare similar, while ignoring relationships between objects. Onthe other hand, community detection algorithms aim to findcommunities based on the network structure, e.g., to findgroups of nodes that are densely connected [14], [39], but theytypically ignore node attributes.
By considering only one of these two sources of infor-mation independently, an algorithm may fail to account forimportant structure in the data. For example, attributes mighttell us to which community a node with very few links belongsto; this would be difficult to determine from the networkstructure alone. Conversely, the network might tell us that twoobjects belong to the same community, even if one of themhas no attribute information. Thus, it is important to considerboth sources of information together and consider networkcommunities as sets of nodes that are densely connected, butwhich also share some common attributes. Node attributescan complement the network structure, leading to more pre-cise detection of communities; additionally, if one source ofinformation is missing or noisy, the other can make up forit. However, considering both node attributes and networktopology for community detection is also challenging, as onehas to combine two very different modalities of information.
Only recently have approaches for detecting communitiesbased on both sources of information been developed [4], [28](Table I). Many existing methods that combine network andnode attribute information use single-assignment clustering [3],[12], [31], [35], [43]; however, the applicability of thesemethods is limited, as they cannot detect overlapping com-munities. Approaches based on topic models [4], [27], [38],[40] allow overlapping communities to be detected. However,they assume “soft” node-community memberships, which arenot appropriate for modeling communities because they do notallow a node to have high membership strength to multiplecommunities simultaneously [42]. Finally, all existing methodsare only able to handle relatively small networks: the networkstypically analyzed consist only of thousands of nodes [9], [27],[28], [38].
Present work: Community detection in networks with nodeattributes. Here, we develop a high-performance (accurateand scalable) overlapping community detection method fornetworks with node attribute information. We present Com-

Method class O H D NHeuristics [3], [12], [31], [35], [43] 7 3 7 100,000LDA-based [4], [9], [27], [38], [40] 3 7 3 85,000Clique-based heuristics[18], [19] 3 3 7 100,000Social circles [28] 3 3 7 5,000CESNA 3 3 3 1,000,000TABLE I. METHODS FOR COMMUNITY DETECTION IN NETWORKS
WITH NODE ATTRIBUTES. O: DETECTS OVERLAPPING COMMUNITIES?, H :ASSIGNS HARD NODE-COMMUNITY MEMBERSHIPS?, D: ALLOWS FORDEPENDENCE BETWEEN THE NETWORK AND THE NODE ATTRIBUTES?
(FIG. 1), N : LARGEST NETWORK THAT CAN BE PROCESSED IN 10 HOURS(FIG. 4). REFER TO SEC. II FOR FURTHER DETAILS.
munities from Edge Structure and Node Attributes (CESNA),which is based on a generative model for networks with nodeattributes. Our model advances existing approaches (summa-rized in Table I) by making several innovations that ulti-mately lead to better performance both in terms of accuracyas well as scalability. First, our model allows us to detectoverlapping communities by employing hard node-communitymemberships. This way, we can avoid the assumption of soft-membership methods that nodes sharing multiple commoncommunities are less likely to be connected [42]. Second, incontrast to a line of previous work [18], [28], which assumedthat communities and attributes are marginally independent, weassume that communities “generate” both the network as wellas attributes (Figure 1). This way we allow for dependencebetween the network and the attributes. Third, to fit the modeland thus discover communities, we develop a block-coordinateascent method where we can update all model parameters intime linear in the number of edges in the network [41]. Thismakes our method scale to networks an order of magnitudelarger than what was possible by previous methods.
To the best our knowledge, CESNA is the first overlappingcommunity detection method that models both hard node-community memberships and the dependency between thecommunities and attributes. Moreover, CESNA can detectoverlapping, non-overlapping, as well as hierarchically nestedcommunities in networks, while considering both node at-tributes and graph structure.
We evaluate CESNA on six online social, information,and content-sharing networks: Facebook, Google+, Twitter,Wikipedia, and Flickr. We quantify CESNA’s accuracy indetecting communities by comparing its predictions to hand-labeled ground-truth communities. We compare CESNA tostate-of-the-art community detection methods, including thosethat detect communities based only on the network structure,methods based only on node attributes, and methods thatmodel both network structure and attributes jointly. Overall,CESNA achieves a 47% improvement in the accuracy ofdetected communities over the baselines we consider. We alsoexamine whether node attributes can boost the performance ofcommunity detection algorithms in cases where the networkis noisy or not fully observed. We add noise to the networkand we find that the performance gap between CESNA overcompeting methods increases as the network structure becomesnoisier and therefore less reliable. This means that CESNA isable to successfully leverage node attributes to compensate formissing or noisy information in the network structure.
To quantify the scalability of CESNA we measure its run-ning time on synthetic networks of increasing size. Comparedto existing methods, the size of networks that CESNA can
(a)
X
(b)
Fig. 1. Two ways of modeling the statistical relationship between a graphG, attributes X , and communities F . Circles represent latent variables thatneed to be inferred and squares represent manifest (observed) variables.
process far exceeds the current state-of-the-art: CESNA canhandle networks 100 times larger than LDA-based methods [4]given the same runtime budget. Even when compared tomethods that consider only the network structure (i.e., whichhandle strictly less information), CESNA is faster than mostbaselines.
Last, we also inspect communities detected by CESNA onFacebook networks, and on a network of Wikipedia articlesabout famous philosophers. We find that, on Facebook data,CESNA automatically learns that education-based attributes(“School name” or “Major”) are very highly correlated with acommunities, whereas other people’s attributes, such as “Workstart date” and “Work end date” are not related to commu-nity structure. On philosophers data, CESNA learns naturalattributes for communities: e.g., subjects about Islamic cultureare associated with a community of Islamic philosophers.While methods that ignore node attributes assign very influen-tial philosophers (e.g., Aristotle) to most communities, CESNAcircumvents this issue by modeling attributes, and discoveringthat Aristotle, while well connected to many philosophers, doesnot share common attributes with all of them.
The rest of the paper is organized as follows. Section IIbriefly surveys related work. In Section III, we describe thestatistical model of CESNA, and in Section IV, we discuss theparameter fitting procedure. We proceed by describing exper-imental evaluation in Section V and conclude in Section VII.
II. RELATED WORK
We summarize the related work in Table I and group italong two dimensions. First, we consider how the methodsmodel statistical dependency between communities, node at-tributes, and the underlying network (column D of Table I).Figure 1 shows the two paradigms that are typically used.In Figure 1(a), community memberships F generate both thegraph G and attributes X , while in Figure 1(b), F and Xare given independently, and then the graph G is generatedby the interaction between F and X . Second, we focuson how the methods model the community memberships ofindividual nodes (columns O and H). Soft-membership modelsassociate a probability distribution with the node’s membershipto communities, which means the more communities a nodebelongs to, the less it belongs to each individual community(simply because probabilities have to sum to one). On theother hand, hard-membership models associate an independentbinary variable for each node and community pair and, thus,do not suffer from the assumptions made by soft-membershipmodels.
As shown in Table I, heuristic single-assignment clusteringmethods for networks with node attributes [12], [35], [43]detect hard node-community memberships, however, because

each node can belong to exactly one community, these methodscannot detect overlapping communities.
LDA-based methods [4], [9], [27] aim to find sets ofnodes that have similar “topics” of attributes and link amongeach other. These topic models are based on the paradigmin Figure 1(a) where community memberships nodes generatelinks and node attributes. However, these methods assume softcommunity memberships, which leads to unrealistic assump-tions about the structure of community overlaps [42]. We notethat recently developed methods [38], [40] also assume soft-membership and the paradigm in Fig. 1(a).
III. CESNA MODEL DESCRIPTION
Here, we develop a probabilistic model that combinescommunity memberships, the network topology, and node at-tributes. We present the Communities from Edge Structure andNode Attributes (CESNA), a probabilistic generative modelfor networks and node attributes that satisfies the desideratamentioned above. Our model is based on the following intuitiveproperties:
• Nodes that belong to the same communities are likelyto be connected to each other.
• Communities can overlap, as individual nodes maybelong to multiple communities.
• If two nodes belong to multiple common communities,they are more likely to be connected than if they shareonly a single common community (i.e., overlappingcommunities are denser [13], [42]).
• Nodes in the same community are likely to share com-mon attributes — for example, a community mightconsist of friends attending a same school.
We formally describe the generative process of CESNA asfollows. We assume that there are N nodes in the network G,each node has K attributes, and there are C communities intotal. We denote the network by G, the node attributes by X(Xuk is k-th attribute of node u), and community membershipsby F . For community memberships F , we assume that eachnode u has a non-negative affiliation weight Fuc ∈ [0,∞) tocommunity c. (Fuc = 0 means that node u does not belong tocommunity c.)
We shall now proceed by describing these components ofthe model in further detail.
Modeling the links of the network. To model how thenetwork structure depends on node community memberships,we aim to capture the following three intuitions:
1) node community affiliations influence the likelihoodthat a pair of nodes is connected,
2) the degree of influence (the probability that nodesbelonging to the same community are connected)differs per community, and
3) each community influences this connection probabil-ity independently.
To achieve these goals, we build on Affiliation NetworkModels [8], [13], [24], [42], where the graph G(V,E) arises
from node community memberships F . To generate the adja-cency matrix A ∈ {0, 1}N×N of network G, we employ theprobabilistic generative process of the BigCLAM overlappingcommunity detection algorithm [41]. In particular, we assumethat two member nodes u, v belonging to a community c areconnected with the following probability:
Puv(c) = 1− exp(−Fuc · Fvc).
Note that if either u or v does not belong to c (Fuc = 0 orFvc = 0), these nodes would not be connected (Puv(c) = 0).
We assume that each community c connects nodes u, vindependently with probability 1−exp(−Fuc ·Fvc). From this,we can derive the edge probability Puv between nodes u and v.In order for u, v to be unconnected, the nodes u and v shouldnot be connected in any community c:
1− Puv =∏c
(1− Puv(c)) = exp(−∑c
Fuc · Fvc).
In summary, we assume the following generative process foreach entry Auv ∈ {0, 1} of the network’s adjacency matrix:
Puv = 1− exp(−∑c
Fuc · Fvc),
Auv ∼ Bernoulli(Puv).(1)
Note that the above generative process satisfies our threeaforementioned requirements. The network edges are createddue to shared community memberships (Requirement (1)).Furthermore, each membership Fuc of a node u is regarded asan independent variable to allow a node to belong to multiplecommunities simultaneously (Requirement (2)). This is in starkcontrast to “soft-membership” models (such as mixed mem-bership stochastic block models [2]), which add constraints∑c Fuc = 1 so that Fuc is a probability that a node u belongs
to a particular community. Finally, because each communityc generates connections between its members independently,nodes belonging to multiple common communities have ahigher probability of connecting than if they share just a singlecommunity (Requirement (3)).
Modeling node attributes. Just as community affiliations canbe used to model network edges, they can also be used tomodel node attributes. We next describe how node attributesare generated from community memberships.
We assume binary-valued attributes where for each attributeXuk of a node u, we consider a separate logistic model.Our intuition is that, based on a node’s community member-ships, we should be able to predict the value of each of thenode’s attribute values. Thus, we regard group membershipsFu1, . . . , FuC as input features of the logistic model with theassociated logistic weight factor Wkc (for each attribute k andcommunity c). We also add an intercept term Fu(C+1) = 1 tothe input feature of each node u:
Quk =1
1 + exp(−∑cWkc · Fuc)
,
Xuk ∼ Bernoulli(Quk)(2)
where Wkc is a real-valued logistic model parameter forcommunity c to the k-th node attribute and Wk(C+1) is a biasterm. The value of Wkc represents the relevance of each groupmembership c to the presence of a particular node attribute k.

Adjacency
Matrix
Logistic
Model
Logistic
Model
Fig. 2. Plate representation of CESNA. Xuk: k-th attribute of node u; Wk:Logistic weight vector for attribute k; Quk: Probability that Xuk = 1; Fuc:Membership strength of node u to community c; Auv : Indicator for whetherthe nodes u and v are connected; Puv : Probability that Auv = 1.
Figure 2 illustrates the CESNA model. Rectangles (Xuk,Auv) are the node attributes and the network adjacency matrixthat we observe. Circles denote latent variables: communitymemberships F and logistic weights W . We explain how toestimate community memberships from node attributes and thenetwork structure (i.e., how we infer F from X and A) in thefollowing section.
Last, we also note that depending on the type of attribute,there are also other choices for modeling attributes X basedon F . For example, for real-valued attributes linear regressioncould be used. Also, note that we assume that the number ofattributes is relatively small compared to the number of nodes;as such, we can use a separate logistic model for each attribute.In the case of many attributes, one could consider methods thatgroup attributes as well as nodes [22].
IV. INFERRING COMMUNITIES WITH CESNA
Next, we shall describe how we detect network communi-ties by estimating CESNA model parameters from given data.We are given an undirected graph G(V,E) with binary nodeattributes X . We aim to detect C communities as well as therelation between communities and attributes. For now, we shallassume the number of communities C is given. Later, we willdescribe how to automatically estimate C.
We aim to infer the values of latent variables F and Wbased on the observed network and the attributes. This meanswe need to estimate N ·C community memberships (i.e., F ∈RN×C), and K · (C+1) logistic weight parameters (i.e., W ∈RK×(C+1)).
We find the optimal F and W by maximizing the likelihoodl(F,W ) = logP (G,X|F,W ) of the observed data G,X:
F , W = argmaxF≥0,W
logP (G,X|F,W ). (3)
Because G and X are conditionally independentgiven F and W , we can decompose the log-likelihoodlogP (G,X|F,W ) as follows:
logP (G,X|F,W ) = LG + LXwhere LG = logP (G|F ) and LX = logP (X|F,W ). Wecompute LG and LX simply using Equations 1 and 2:
LG =∑
(u,v)∈E
log(1− exp(−FuFTv ))−∑
(u,v)6∈E
FuFTv
LX =∑u,k
(Xuk logQuk + (1−Xuk) log(1−Quk)),
where Fu is a vector {Fuc} for node u and Quk is defined inEquation 2.
Last, we also invoke l1-regularization on W to avoid over-fitting and to learn sparse relationships between communitiesand attributes. Thus, our optimization problem that we aim tosolve is:
F , W = argmaxF≥0,W
LG + LX − λ|W |1, (4)
where λ is a regularization hyperparameter.
To solve the problem in Eq. 4, we adopt a block coordinateascent approach. We update Fu for each node u by fixing bothW and the community membership Fv of all other nodes v.After updating Fu for all nodes, we then update W while fixingcommunity memberships F . This way, we can decomposethe non-convex optimization problem of Eq. 4 into a set ofconvex subproblems. We describe our solution to each of thesesubproblems next.
Updating community memberships. To update communitymemberships, we build on the optimization procedure usedin BigCLAM [41]. However, we modify the procedure toconsider node attributes (which BigCLAM ignores). We updatethe membership Fu of an individual node u while fixing allother parameters (the membership Fv of all other nodes, andlogistic model parameters W ).
We solve the following subproblem for each u:
Fu = argmaxFuc≥0
LG(Fu) + LX(Fu), (5)
where LG(Fu) and LX(Fu) are the parts of LG,LX involvingFu, i.e.,
LG(Fu) =∑
v∈N (u)
log(1− exp(−FuFTv ))−∑
v 6∈N (u)
FuFTv
LX(Fu) =∑k
(Xuk logQuk + (1−Xuk) log(1−Quk))
where N (u) is a set of neighbors of u. Note that this problemis convex: LG(Fu) is a concave function of Fu [41], [30] andLX(Fu) is a logistic function of Fuc when W is fixed.
To solve this convex problem, we use projected gradientascent. The gradient can be computed straightforwardly:
∂LG(Fu)∂Fu
=∑
v∈N (u)
Fvcexp(−FuFTv )
1− exp(−FuFTv )−
∑v 6∈N (u)
Fvc
∂LX(Fu)
∂Fu=
∑k
(Xuk −Quk)Wkc.
We then update each Fuc by gradient ascent and then projectonto a space of non-negative real numbers [0,∞):
Fnewuc = max(0, F olduc + α(∂LG(Fu)∂Fu
+∂LX(Fu)
∂Fu)) (6)

where α is a learning rate which we set using backtrackingline search [7].
Updating logistic parameters. We update parameters W ofthe logistic model by keeping community memberships Ffixed. To compute this, we first notice that we can ignore LGin Eq. 4, as G does not depend on W . Next, we also includel1-regularization on W , as we aim to learn sparse relationshipsbetween community memberships and node attributes:
W = argmaxW
∑u,k
logP (Xuk|F,W )− λ|W |1.
Furthermore, as we employ an independent logistic model foreach attribute, we only need to consider the k-th attribute whenupdating the weight vector Wk:
argmaxWk
∑u
logP (Xuk|F,Wk)− λ|Wk|1. (7)
Note that this is l1-regularized logistic regression with inputfeatures F and output variable X . Again, we simply apply agradient ascent method:
∂ logP (Xuk|F,Wk)
∂Wkc= (Xuk −Quk)Fuc,
Wnewkc =W old
kc +α(∑u
∂ logP (Xuk|F,Wk)
∂Wkc−λ·Sign(Wkc)),
where α is a step size as in Eq. 6.
Now, we iteratively update Fu for each u and then updateWk for each attribute k. We stop iterating once the likelihooddoes not increase (by at least 0.001%) after a full iterationover all Fu and all Wk.
Determining community memberships. After learning real-valued community affiliations F , we need to determinewhether node u belongs to community c. To do so, we regardu as belonging to c only if the corresponding Fuc is above thethreshold δ. We set δ so that a node belongs to community cif the node is connected to other members of c with an edgeprobability higher than 1/N . To determine δ, we need to solve:
1
N≤ 1− exp(−δ2).
Solving this inequality, we set the value of δ =√− log(1− 1/N). We have also experimented with other val-
ues of δ and found that this value of δ gives good performancein practice.
Choosing the number of communities. To automatically findthe number of communities C, we adopt the approach used in[2]. We reserve 10% of node pairs in the adjacency matrixand node-attribute pairs as a holdout set. Varying C, we fit theCESNA with C communities on 90% of node-node pairs andnode-attribute pairs and then evaluate the likelihood of CESNAon the holdout set. The K that induces the maximum held-outlikelihood will be chosen as the number of communities.
Computational complexity of CESNA. We next analyze thecomputational complexity of CESNA. In particular, we showthat a full iteration of CESNA takes time linear in the numberof edges and attributes.
For simplicity, let us assume a single community C = 1,then updating Fu for a single u takes N +K operations whencomputed in a naive way. However, we can compute ∂LG(Fu)
∂Fu
in O(|N (u)|). This means that the number of operationsrequired to compute the gradient is proportional to the degreeof node u since [30], [41]:∑
v 6∈N (u)
Fvc = (∑v
Fvc − Fuc −∑
v∈N (u)
Fvc).
By storing∑v Fvc, the second term in ∂LG(Fu)
∂Fucan be
computed in O(|N (u)|). Therefore, updating Fu for all nodesu takes O(|E| + NK) operations. Because updating Wk
takes just O(N) for each k, a full iteration of CESNA takesO(|E| + NK) operations, which is linear in the number ofedges, nodes and the number of attributes.
Notice that CESNA nicely lends itself to parallelization.In particular, updating Wk naturally allows for parallelization,as we can update Wk for multiple attributes k simultaneously.Because F is fixed, the problems in Eq. 7 are independent fordifferent attributes k. We also update Fu for multiple nodesu in parallel. In this case, updating each u is not necessarilyindependent for different nodes u. However, as shown by Niuet al. [32], updating Fu in parallel works well in practice, asnetworks tend to be sparse. As we show in the next section,parallelization on a single shared memory machine boosts thespeed of CESNA by a factor of 20 (the number of threads).
A parallel C++ implementation of CESNA algorithm isavailable as a part of the Stanford Network Analysis Platform(SNAP): http://snap.stanford.edu/snap.
CESNA hyperparameter settings. To initialize F , we use lo-cally minimal neighborhoods [17]. A neighborhood N(u) of anode u is locally minimal if N(u) has lower conductance thanall neighborhoods N(v) of u’s neighbors v. Locally minimalneighborhoods have been shown to be a good initialization forcommunity detection methods [17].
Last, notice that the overall model likelihood is a com-bination of the network likelihood LG and the likelihood ofnode attributes LX (Eq. 4). As the two likelihoods can havevastly different ranges we scale them using the parameter α.In particular, we introduce a hyperparameter α that controlsthe scaling between the two likelihoods:
argmaxF≥0,W
(1− α)LG + αLX − λ|W |1.
We choose values of hyperparameters α and λ among α ∈{0.25, 0.5, 0.75}, λ ∈ {0.1, 1.0} based on the held-out datalikelihood (i.e., by cross-validation). We note that the perfor-mance of CESNA does not change much with the values ofhyperparameters. Setting α = 0.5 (i.e., the unscaled version ofEq. 4) and λ = 1 gives reliable performances in most cases.
V. EXPERIMENTAL EVALUATION
We quantify the performance of CESNA by comparing it tostate-of-the-art community detection methods in various socialand information networks. We evaluate the performance ofthe methods by evaluating the accuracy of the detected com-munities when compared to the gold-standard, ground-truth

Dataset N E C K S AFacebook 4,089 170,174 193 175 28,76 1.36Google+ 250,469 30,230,905 437 690 143.51 0.25Twitter 125,120 2,248,406 3,140 33,569 15.54 0.39Philosophers 1,218 5,972 1,220 5,770 6.86 6.87Flickr 16,710 716,063 100,624 1,156 28.91 174.08
TABLE II. DATASET STATISTICS. N : NUMBER OF NODES, E: NUMBEROF EDGES, C : NUMBER OF COMMUNITIES, K : NUMBER OF NODE
ATTRIBUTES, S: AVERAGE COMMUNITY SIZE, A: COMMUNITYMEMBERSHIPS PER NODE.
communities. We also evaluate the scalability by measuringthe running time as the network size grows.
Dataset description. For our evaluation, we consider fivedatasets where we have network information as well as nodeattributes. In addition to networks and attributes, we also haveaccess to explicit ground-truth community labels. The avail-ability of such ground-truth allows us to evaluate communitydetection methods by quantifying the degree of agreementbetween the detect and the ground-truth communities [35].Table II lists the networks and their properties.
The networks come from 3 different domains: informationnetwork among Wikipedia articles (philosophers) [1], content-sharing network (Flickr) [35], and ego-networks from onlinesocial network services (Facebook, Google+, and Twitter) [28].We next describe each of these networks in further detail.
The philosophers network [1] consists of Wikipedia articlesabout famous philosophers. Nodes represent Wikipedia articlesabout philosophers, and undirected edges indicate whether onearticle links to another. For the attributes of each node u,we use a binary indicator vector of out-links from node uto other non-philosopher Wikipedia articles. For example, weregard a link to a Wikipedia article “Edinburgh” as a binaryattribute “Edinburgh.” We consider 5,770 attributes, to whichat least five philosophers have a link. Moreover, Wikipedia alsoprovides categories (e.g., “Muslim philosophers”, or “Earlymodern philosophers”) for each article. We regard each cat-egory with more than five philosophers as a ground-truthcommunity.
The Flickr image sharing network [35] consists of nodeswhich represent Flickr users, and edges indicate follow rela-tions between users. We use tags of images uploaded by agiven user as her attributes. In this network, the ground-truthcommunities are defined as user-created interest-based groupsthat have more than five members.
The last three networks (Facebook, Google+, and Twitter)are ego-networks that are available from the Stanford LargeNetwork Dataset Collection (http://snap.stanford.edu/data). Toobtain ground-truth communities and node attributes, we usethe same protocol as in [28]. Ground-truth communities aredefined by social circles (or “lists” in Twitter), which are man-ually labeled by the owner of the ego-network. In Facebookand Google+, node attributes come from user profiles, suchas gender, job titles, institutions, and so on. In Twitter, nodeattributes are defined by hashtags used by the user in hertweets. To reduce the dimensionality of the node attributes,we discard any attribute which the owner of the ego-networkdoes not possess.
Baselines for comparison. We consider the three classes ofbaseline community detection methods: (1) methods that use
only the network structure, (2) methods that user only nodeattributes, and (3) methods that combine both.
The first class of baselines considers only the network,ignoring node attributes altogether: Demon [10] and Big-CLAM [41] are state-of-the-art overlapping community detec-tion methods.
Second is a class of baselines that focuses on node at-tributes without considering the network structure. Here, weuse Multi Assignment Clustering (MAC) [15], which detectsoverlapping communities based on node attributes alone.
The third class of baselines we consider combines thenetwork structure with node attributes. For this class, wechoose three state-of-the-art methods. Based on Table I weselect one algorithm from each model type: Block-LDA [4] rep-resents soft-membership approaches, while the CODICIL [35]represents heuristics for non-overlapping communities, and theEDCAR [18] represents heuristics for finding dense subgraphs.Finally, we consider the Circles [28] method, which representsoverlapping hard-membership approaches.
For all baselines, we use implementations provided bythe authors. All baselines except CODICIL require a user tospecify the number of communities to detect. We set thisparameter so that each model detects the same number ofcommunities as CESNA. CODICIL and EDCAR also has otherinput parameters, for which we used default values providedby the authors.
Evaluation metrics. We quantify the performance in termsof the agreement between the ground-truth communities andthe detected communities. To compare a set of ground-truthcommunities C∗ to a set of detected communities C, weadopt an evaluation procedure previously used in [41]: Everydetected community is matched with its most similar ground-truth community. Given this matching, we then compute theperformance. We also then take every ground-truth communityand match it with a detected community and again computethe performance. Our final performance is the average of thesetwo metrics. We average the two scores because matching onlyfrom one side leads to degenerate optimal performance (forexample, outputting all possible subsets of nodes as detectedcommunities would achieve perfect matching ground-truthcommunities to the detected ones).
More formally, our evaluation function is:
1
2|C∗|∑
C∗i ∈C∗
maxCj∈C
δ(C∗i , Cj) +1
2|C|∑Cj∈C
maxC∗
i ∈C∗δ(C∗i , Cj),
(8)where δ(C∗i , Cj) is some similarity measure between thecommunities C∗i and Cj . We consider two standard metricsδ(·) for quantifying the similarity between a pair of sets,namely the F1 score and the Jaccard similarity. Thus, for eachmethod, we obtain a score between 0 and 1, where 1 indicatesthe perfect recovery of ground-truth communities.
Experiments on recovering ground-truth communities. Weevaluate the performance of CESNA and baselines on our fivedatasets. Table III shows the results where “N/A” means thatthe method cannot scale to a given network. We make severalobservations.

F1 score Jaccard similarityMethod Info Phil Flickr Facebook Google+ Twitter Phil Flickr Facebook Google+ Twitter Avg.Demon Net 0.244∗ 0.171∗ 0.386∗ 0.323∗ 0.280∗ 0.143∗ 0.098∗ 0.283∗ 0.234 0.186∗ 0.235∗
BigCLAM Net 0.276∗ 0.166∗ 0.455 0.341 0.359∗ 0.156∗ 0.092∗ 0.347 0.231 0.246∗ 0.267∗
MAC Attr 0.117∗ N/A 0.297∗ 0.159∗ 0.246∗ 0.069∗ N/A 0.190∗ 0.101∗ 0.154∗ 0.133∗
Block-LDA Both 0.146∗ N/A 0.356∗ 0.307 0.273∗ 0.082∗ N/A 0.241∗ 0.204∗ 0.173∗ 0.178∗
CODICIL Both 0.277∗ 0.132∗ 0.378∗ 0.247∗ 0.279∗ 0.167∗ 0.079∗ 0.263∗ 0.166∗ 0.190∗ 0.218∗
EDCAR Both 0.264∗ 0.112∗ 0.321∗ 0.135∗ 0.258∗ 0.157∗ 0.051∗ 0.222∗ 0.081∗ 0.165∗ 0.177∗
Circles Both N/A N/A 0.401∗ 0.365 0.319∗ N/A N/A 0.265∗ 0.254 0.211∗ 0.183∗
CESNA Both 0.314 0.183 0.462 0.352 0.362 0.192 0.106 0.347 0.249 0.249 0.282TABLE III. PERFORMANCE OF METHODS ON FIVE DATASETS. Info INDICATES THE INFORMATION USED BY A GIVEN METHOD (NETWORK,
ATTRIBUTES, OR BOTH). BEST PERFORMING MODELS ARE BOLDED. SYMBOL ∗ INDICATES THAT CESNA OUTPERFORMS A GIVEN BASELINE BY 95%STATISTICAL CONFIDENCE. OVERALL, CESNA STATISTICALLY SIGNIFICANTLY OUTPERFORMS ALL CONSIDERED METHODS.
Comparing CESNA to methods without the node attributes(Demon and BigCLAM), we notice that CESNA achievesbetter performance, as it combines the information from thenode attributes as well as the network. Similarly, CESNA alsooutperforms MAC, which only focuses on node attributes. Inparticular, CESNA never performs worse than state-of-the-artmethods that use only a single source of data. The strongperformance of CESNA is not obvious, as it would be entirelypossible that combining two sources of data would confusethe algorithm and degrade the overall performance (in fact,notice that BigCLAM, which uses only the network structure,indeed outperforms most of the methods that use both sourcesof information). Thus, we believe that the strong performanceof CESNA as an indication that CESNA combines the bestingredients from both worlds.
When comparing the performance of CESNA to methodsthat consider both the network structure and node attributes(CODICIL, Block-LDA, and Circles), we again observe thestrong performance of CESNA. On average, CESNA gives47% relative improvement in the accuracy of detected commu-nities over methods that consider both sources of information.
We also note that CESNA shows a bigger margin in per-formance against the baselines in an information network suchas the philosophers dataset, or a content-sharing network likeFlickr than in social networks. In the philosophers network,for example, CESNA achieves a 14% relative gain in theF1 score and 15% in the Jaccard similarity compared to thebest baseline. A possible explanation for this phenomenon isthat in content-sharing and information networks, the prop-erties/content of the nodes plays a much bigger role in linkformation.
Overall, we note that across all datasets and evaluationmetrics, CESNA yields the best performance in 8 out of 10cases. In terms of average performance, CESNA outperformsDemon by 20%, BigCLAM by 6%, MAC by 112%, Block-LDA by 58%, CODICIL by 29%, EDCAR by 57%, and Circlesby 54%.
Last, we also measure the statistical significance of per-formance differences of CESNA and the baselines. For eachbaseline’s performance on each data set, we compute the statis-tical significance of CESNA outperforming the baseline using aone-sided Z-test. We use the symbol ∗ in Table III to indicate a95% statistical significance level. On the philosophers, Flickr,and Twitter datasets, CESNA outperforms every baseline ata 95% significance level. On Facebook, CESNA outperformsall baselines, at a 95% significance level in all but one case.On Google+, CESNA performs the second best compared toCircles.
Experiments on partially observed networks. Combiningnetwork and attribute information into a single method should,in principle, lead to the development of a more robust commu-nity detection algorithm. In particular, when networks may beincomplete or partially observed, the performance of CESNAshould degrade gently, as it should be able to rely on the nodeattribute information; this way, it should compensate for thenoise in the network structure.
To investigate the robustness of performance under anunreliable network structure, we next explore the problem ofdetecting communities from partially observed networks wheresome fraction of edges are missing while the node attributes arefully available. For the sake of evaluation, we remove a fractionγ of edges in the network uniformly at random. Note that weregard a removed edge in the same way as an unobserved edge,because in practice we cannot distinguish between edges thatdo not exist (e.g., users who aren’t friends) and edges that areunobserved (e.g., users who haven’t gotten around to declaringtheir friendship yet).
Rather than examining performance of all 6 baselines, wefocus on making a comparison over the three top baselinesthat use either the network or the node attributes: BigCLAM,which considers the network only and is the best baselinein our experiments; MAC, which only considers the nodeattributes; and CODICIL, which is the best performing baselinethat considers both the network and the attributes. For eachbaseline, we measure the relative performance that CESNAachieves over the baseline:
F1γ(CESNA)− F1γ(Baseline)F1γ(Baseline)
where F1γ is the F1 score in Eq. 8 for the network with γfraction of edges removed.
In Figure 3, we display experimental results (with standarddeviation) as we vary from γ = 0 to γ = 0.8. We considerall datasets except philosophers (for which, results are toonoisy due to the small network size). For Flickr, we omitperformance of MAC, as the algorithm was not able to processit due to too high time and space complexity.
In all cases, we note similar behavior (Figure 3). As thenetwork becomes more unreliable, the improvement of CESNAover BigClam increases. On the other hand, for methods thatuse node attributes (and the network structure), we note thatin Google+, the performance improvement of CESNA remainsconstant, while in Facebook and Twitter, the performanceimprovement of CESNA slowly shrinks as more and more ofthe network structure gets removed.

0
20
40
60
80
100
120
140
0 0.1 0.2 0.3 0.4 0.5 0.6 0.7 0.8
Re
lative
Im
pro
ve
me
nt
in F
1 (
%)
Fraction of deleted edges
CESNA VS BigCLAMCESNA VS CODICIL
CESNA VS MAC
(a) Google+
0
10
20
30
40
50
60
70
0 0.1 0.2 0.3 0.4 0.5 0.6 0.7 0.8
Re
lative
Im
pro
ve
me
nt
in F
1 (
%)
Fraction of deleted edges
CESNA VS BigCLAMCESNA VS CODICIL
CESNA VS MAC
(b) Facebook
0
5
10
15
20
25
30
35
40
45
50
0 0.1 0.2 0.3 0.4 0.5 0.6 0.7 0.8
Re
lative
Im
pro
ve
me
nt
in F
1 (
%)
Fraction of deleted edges
CESNA VS BigCLAMCESNA VS CODICIL
CESNA VS MAC
(c) Twitter
-20
-15
-10
-5
0
5
10
15
20
25
30
0 0.1 0.2 0.3 0.4 0.5 0.6 0.7 0.8
Re
lative
Im
pro
ve
me
nt
in F
1 (
%)
Fraction of deleted edges
CESNA VS BigCLAMCESNA VS CODICIL
(d) Flickr
Fig. 3. Relative gain in F1 over the best method with network informationonly (BigCLAM) and with node attributes only (MAC) when edges arerandomly removed.
The results are intuitive: Even though the network containsmany missing edges, CESNA still outperforms other methodsby better leveraging the information present in the nodeattributes. The results with MAC and CODICIL, which aredecreasing functions of γ, nicely shows that the performancegain from the network structure diminishes as we remove moreedges.
Last, we also briefly note that similar results are observedwith the relative improvement in Jaccard similarity, and thatCESNA consistently outperforms the other four baselines notshown in Figure 3 for every value of γ.
Evaluating scalability. We evaluate the scalability of commu-nity detection methods by measuring each method’s runningtime on synthetic networks as we increase the network size.Using the Forest Fire model [25], we generate syntheticnetworks with the forward and backward probabilities set to0.36 and 0.32, respectively. For attributes, we generate K = 10attributes for each node with independent Bernoulli randomvariables with probability 0.5.
Figure 4 shows the running time of methods versus thenetwork size. Among the four baselines that consider bothnetwork and the node attributes (i.e., Block-LDA, CODICIL,EDCAR, Circles), we show CODICIL since it is the fastestamong the four. We also consider a parallelized version ofCESNA (CESNA (24 threads)).
Overall, we notice that CESNA is the second-fastestmethod overall, next to BigCLAM. However, we note thatBigCLAM is expected to be faster than CESNA, as it usesa similar optimization procedure as CESNA yet without con-sidering node attributes. MAC is the slowest, and CODICILis the second-slowest method. DEMON is faster than CESNAfor small networks (up to 100,000 nodes), though CESNA isfaster when the network becomes larger.
We obtain even further speedup by considering a parallelimplementation of CESNA. Using 24 threads on a singlemachine, CESNA takes just 10 minutes to process a 300,000node network.
0
2000
4000
6000
8000
10000
0 100 200 300
Tim
e (
Sec.)
Number of nodes (× 103)
DEMONBigCLAM
MACCODICIL
CESNACESNA (24 threads)
Fig. 4. Algorithm runtime comparison. Block-LDA and Circles are omittedas they took more time than 10,000 seconds for networks larger than 1% ofthe X-axis (3,000 nodes).
Last, we also note that all the baselines shown in Fig. 4solve “simpler” problems than CESNA. For example, CODI-CIL detects non-overlapping communities, which is simplerthan detecting overlapping communities. Demon and Big-CLAM consider only network information, ignoring nodeattributes. Nevertheless, CESNA is faster than CODICIL andDemon, and it takes about 30% more time than BigCLAM.Comparing CESNA to methods that achieve the same goal —that is, overlapping community detection with node attributes(i.e., Block-LDA, EDCAR, and Circles) — CESNA has aconsiderable advantage in scalability, as it is about an order ofmagnitude faster.
VI. ANALYSIS OF DETECTED COMMUNITIES
Incorporating node attributes into community detectiongives two direct advantages. The first advantage is the im-proved accuracy in community detection, which we observedin the previous section. The second advantage is that the nodeattributes provide cues for interpreting detected communities.For example, a community in a Facebook ego-network mightconsist of a set of high-school friends, and the homogeneityof a particular attribute in a given community might help usto interpret and explain its existence. Such interpretations arean important part of community detection [1], [2], [33], yetfinding them is very time-consuming and may require domainknowledge, as in traditional settings, one has to infer themeaning of a given community based only on the identitiesof its members. By incorporating node attributes, however,CESNA allows us to characterize a community by examiningthe attributes associated with high logistic weights in themodel.
In this section, we qualitatively analyze our results in theFacebook network and the philosophers network to provideinsights as to how CESNA brings the two advantages (betterinterpretability and higher accuracy). In both networks, we findthat CESNA is able to find the attributes that are naturallyrelated to the communities. On philosophers data, we alsoshow how CESNA can improve the accuracy of detectedcommunities by incorporating node attributes.
Analysis of Facebook communities. CESNA learns the lo-gistic model weight Wkc for each attribute k and communityc. Highly positive values of Wkc mean that members ofcommunity c are likely to have attribute k, and a highlynegative value means the opposite (members are likely not to
have the attribute). Not every attribute will be associated withcommunity memberships, as some attributes may be irrelevantfor a given community. To characterize the level of associationbetween communities and attributes k, we measure the l2 norm‖Wk‖ of its logistic weight Wk = {Wk·}.
To examine which attributes are related to communities(either positively or negatively), we examine detected commu-nities in Facebook ego-networks. We find that the top attributesare related to schools, including the schools attended, the typesof education that users received, and the major. On the otherhand, the bottom five attributes include work start dates, workend dates, and locale. None of them act as social factors aroundwhich communities on Facebook form.
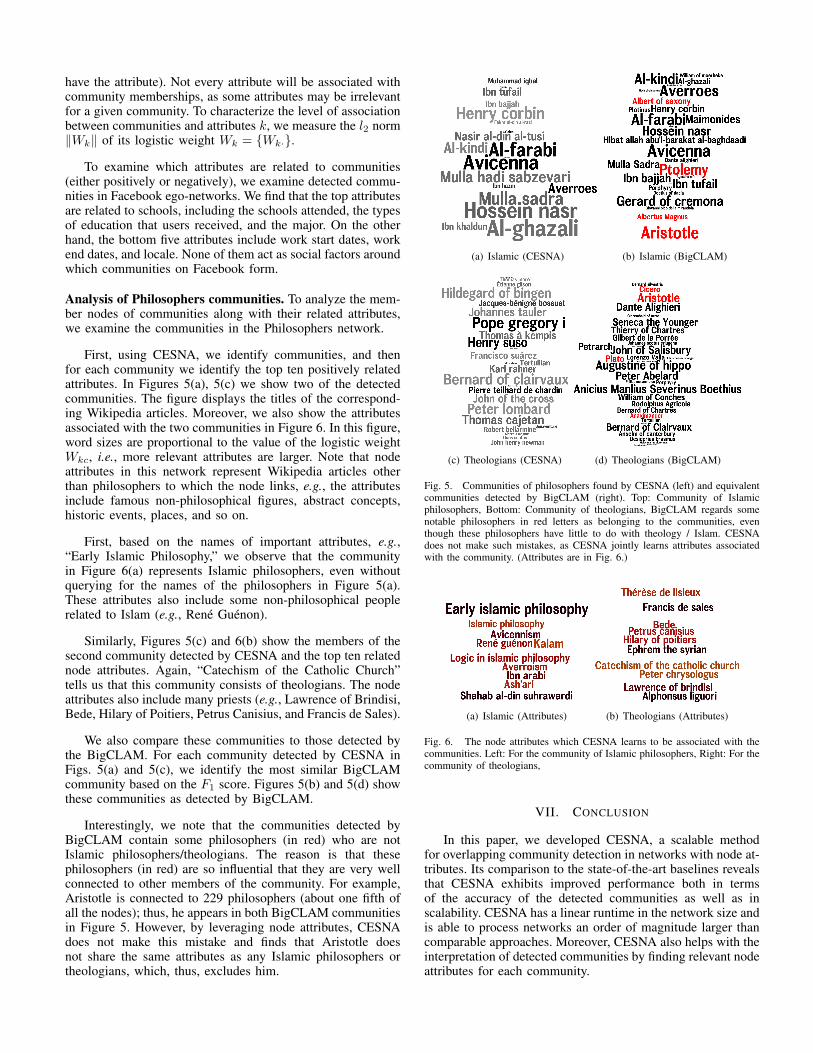
Analysis of Philosophers communities. To analyze the mem-ber nodes of communities along with their related attributes,we examine the communities in the Philosophers network.
First, using CESNA, we identify communities, and thenfor each community we identify the top ten positively relatedattributes. In Figures 5(a), 5(c) we show two of the detectedcommunities. The figure displays the titles of the correspond-ing Wikipedia articles. Moreover, we also show the attributesassociated with the two communities in Figure 6. In this figure,word sizes are proportional to the value of the logistic weightWkc, i.e., more relevant attributes are larger. Note that nodeattributes in this network represent Wikipedia articles otherthan philosophers to which the node links, e.g., the attributesinclude famous non-philosophical figures, abstract concepts,historic events, places, and so on.
First, based on the names of important attributes, e.g.,“Early Islamic Philosophy,” we observe that the communityin Figure 6(a) represents Islamic philosophers, even withoutquerying for the names of the philosophers in Figure 5(a).These attributes also include some non-philosophical peoplerelated to Islam (e.g., Rene Guenon).
Similarly, Figures 5(c) and 6(b) show the members of thesecond community detected by CESNA and the top ten relatednode attributes. Again, “Catechism of the Catholic Church”tells us that this community consists of theologians. The nodeattributes also include many priests (e.g., Lawrence of Brindisi,Bede, Hilary of Poitiers, Petrus Canisius, and Francis de Sales).
We also compare these communities to those detected bythe BigCLAM. For each community detected by CESNA inFigs. 5(a) and 5(c), we identify the most similar BigCLAMcommunity based on the F1 score. Figures 5(b) and 5(d) showthese communities as detected by BigCLAM.
Interestingly, we note that the communities detected byBigCLAM contain some philosophers (in red) who are notIslamic philosophers/theologians. The reason is that thesephilosophers (in red) are so influential that they are very wellconnected to other members of the community. For example,Aristotle is connected to 229 philosophers (about one fifth ofall the nodes); thus, he appears in both BigCLAM communitiesin Figure 5. However, by leveraging node attributes, CESNAdoes not make this mistake and finds that Aristotle doesnot share the same attributes as any Islamic philosophers ortheologians, which, thus, excludes him.
(a) Islamic (CESNA) (b) Islamic (BigCLAM)
(c) Theologians (CESNA) (d) Theologians (BigCLAM)
Fig. 5. Communities of philosophers found by CESNA (left) and equivalentcommunities detected by BigCLAM (right). Top: Community of Islamicphilosophers, Bottom: Community of theologians, BigCLAM regards somenotable philosophers in red letters as belonging to the communities, eventhough these philosophers have little to do with theology / Islam. CESNAdoes not make such mistakes, as CESNA jointly learns attributes associatedwith the community. (Attributes are in Fig. 6.)
(a) Islamic (Attributes) (b) Theologians (Attributes)
Fig. 6. The node attributes which CESNA learns to be associated with thecommunities. Left: For the community of Islamic philosophers, Right: For thecommunity of theologians,
VII. CONCLUSION
In this paper, we developed CESNA, a scalable methodfor overlapping community detection in networks with node at-tributes. Its comparison to the state-of-the-art baselines revealsthat CESNA exhibits improved performance both in termsof the accuracy of the detected communities as well as inscalability. CESNA has a linear runtime in the network size andis able to process networks an order of magnitude larger thancomparable approaches. Moreover, CESNA also helps with theinterpretation of detected communities by finding relevant nodeattributes for each community.

There are many possible directions for future work. Onedirection is to extend CESNA to handle more general typesof attributes. Similarly, extending the method to cluster theattributes into “topics,” while also identifying communitieswould likely lead to even easier interpretation of detected com-munities. Finally, incorporating other sources of informationthan node attributes, such as information diffusion [5] or edgeattributes [4], would also be possible.
Acknowledgements. We thank Yiye Ruan for sharing theCODICIL code and the Flickr data. This research has been sup-ported in part by NSF IIS-1016909, CNS-1010921, CAREERIIS-1149837, IIS-1159679, ARO MURI, DARPA GRAPHS,ARL AHPCRC, Okawa Foundation, PayPal, Docomo, Boeing,Allyes, Volkswagen, Intel, Alfred P. Sloan Fellowship, and theMicrosoft Faculty Fellowship.
REFERENCES
[1] Y.-Y. Ahn, J. P. Bagrow, and S. Lehmann. Link communities revealmulti-scale complexity in networks. Nature, 2010.
[2] E. M. Airoldi, D. M. Blei, S. E. Fienberg, and E. P. Xing. Mixedmembership stochastic blockmodels. JMLR, 2007.
[3] L. Akoglu, H. Tong, B. Meeder, and C. Faloutsos. PICS: Parameter-freeIdentification of Cohesive Subgroups in Large Attributed Graphs. SDM’12, 2012.
[4] R. Balasubramanyan and W. W. Cohen. Block-lda: Jointly modelingentity-annotated text and entity-entity links. In SDM ’11, 2011.
[5] N. Barbieri, F. Bonchi, and G. Manco. Cascade-based communitydetection. In WSDM ’13, 2013.
[6] D. M. Blei, A. Ng, and M. Jordan. Latent dirichlet allocation. JMLR,3:993–1022, 2003.
[7] S. Boyd and L. Vandenberghe. Convex Optimization, 2004.[8] R. L. Breiger. The duality of persons and groups. Social Forces, 1974.[9] J. Chang and D. M. Blei. Relational topic models for document
networks. In AISTATS ’09, 2009.[10] M. Coscia, G. Rossetti, F. Giannotti, and D. Pedreschi. Demon: a local-
first discovery method for overlapping communities. In KDD ’12, 2012.[11] D. Crandall, D. Cosley, D. Huttenlocher, J. Kleinberg and S. Suri.
Feedback effects between similarity and social influence in onlinecommunities. In KDD ’08, 2008.
[12] M. Ester, R. Ge, B. Gao, Z. Hu, and B. Ben-Moshe. Joint ClusterAnalysis of Attribute Data and Relationship Data: the Connected k-Center Problem. In SDM ’06, 2006.
[13] S. L. Feld. The focused organization of social ties. American J. ofSociology, 1981.
[14] S. Fortunato. Community detection in graphs. Physics Reports, 2010.[15] M. Frank, A. P. Streich, D. Basin, and J. M. Buhmann. Multi-assignment
clustering for boolean data. JMLR, Mar. 2012.[16] M. Girvan and M. Newman. Community structure in social and
biological networks. PNAS, 2002.[17] D. F. Gleich and C. Seshadhri. Neighborhoods are good communities.
In KDD ’12, 2012.[18] S. Gunnemann, B. Boden, I. Farber, and T. Seidl Efficient Mining
of Combined Subspace and Subgraph Clusters in Graphs with FeatureVectors. In PAKDD ’13, 2013.
[19] S. Gunnemann, I. Farber, B. Boden, and T. Seidl Subspace ClusteringMeets Dense Subgraph Mining: A Synthesis of Two Paradigms. InICDM ’10, 2010.
[20] S. Johnson. Hierarchical clustering schemes. Psychometrika, 1967.[21] G. Karypis and V. Kumar. Multilevel k-way partitioning scheme for
irregular graphs. J. of Parallel and Distributed Computing, 1998.[22] M. Kim and J. Leskovec. Latent multi-group membership graph model.
In ICML ’12, 2012.[23] A. Lancichinetti, F. Radicchi, J. J. Ramasco, and S. Fortunato. Finding
statistically significant communities in networks. PLoS ONE, 2011.
[24] S. Lattanzi and D. Sivakumar. Affiliation networks. In STOC ’09, 2009.[25] J. Leskovec, J. Kleinberg, and C. Faloutsos. Graphs over time:
densification laws, shrinking diameters and possible explanations. InKDD ’05, 2005.
[26] D. Liben-Nowell and J. Kleinberg. The link prediction problem forsocial networks. In CIKM ’03, 2003.
[27] Y. Liu, A. Niculescu-Mizil, and W. Gryc. Topic-link lda: joint modelsof topic and author community. In ICML ’09, 2009.
[28] J. McAuley and J. Leskovec. Learning to discover social circles in egonetworks. In NIPS ’12, 2012.
[29] K. Miller, T. Griffiths, and M. Jordan. Nonparametric Latent FeatureModels for Link Prediction. In NIPS ’09, 2009.
[30] M. Mørup, M. N. Schmidt, and L. K. Hansen. Infinite multiplemembership relational modeling for complex networks. CoRR, 2011.
[31] F. Moser, R. Colak, A. Raey, and M. Ester. Mining Cohesive Patternsfrom Graphs with Feature Vectors. In SDM ’09, 2009.
[32] F. Niu, B. Recht, C. Re, and S. J. Wright. Hogwild: A lock-freeapproach to parallelizing stochastic gradient descent. In NIPS ’11, 2011.
[33] G. Palla, I. Derenyi, I. Farkas, and T. Vicsek. Uncovering theoverlapping community structure of complex networks in nature andsociety. Nature, 2005.
[34] M. Rosvall and C. T. Bergstrom. Maps of random walks on complexnetworks reveal community structure. PNAS, 2008.
[35] Y. Ruan, D. Fuhry, and S. Parthasarathy. Efficient community detectionin large networks using content and links. In WWW ’13, 2013.
[36] V. Satuluri and S. Parthasarathy. Scalable graph clustering usingstochastic flows: applications to community discovery. In KDD ’09,2009.
[37] Y. Sun, Y. Yu, and J. Han. Ranking-based clustering of heterogeneousinformation networks with star network schema. In KDD ’09, 2009.
[38] Y. Sun, C. Aggarwal, and J. Han. Relation Strength-Aware Clusteringof Heterogeneous Information Networks with Incomplete Attributes. InVLDB ’12, 2012.
[39] J. Xie, S. Kelley, and B. K. Szymanski. Overlapping communitydetection in networks: the state of the art and comparative study. ACMComputing Surveys, 2013.
[40] Z. Xu, Y. Ke, Y. Wang, H. Cheng, and J. Cheng. A model-basedapproach to attributed graph clustering In SIGMOD ’12, 2012.
[41] J. Yang and J. Leskovec. Overlapping community detection at scale: Anon-negative factorization approach. In WSDM ’13, 2013.
[42] J. Yang and J. Leskovec. Structure and overlaps of communities innetworks. ACM TIST, 2013.
[43] Z. Yang, H. Cheng, and J. Yu. Graph clustering based on struc-tural/attribute similarities. VLDB ’09, 2009.