community early childhood profile -- buncombe … percent of children enrolled in 1-5 star centers...
TRANSCRIPT

Community Early Childhood Profile -- Buncombe County

FY 2017-2018 EC Profile Results for Buncombe
Indicator Description Standards FY 2016-17 FY 2017-18
Early Care and Education -- Quality
PLA40a
PLA40b
Average Star Ratingfor Children in 1-5Star Care
Of those in care,percent of Children in4 and 5 star facilities
Minimum: 4.0 AND 60%High Performing: 4.0 AND 60%
for eachage group (age data available on
LP Central)
3.94
71%
3.96
71%
BelowMinimum
BelowMinimum
PLA50a
PLA50b
Average Star Ratingfor SubsidizedChildren in 1-5 StarCare
Percent ofSubsidized Childrenin 4 and 5 star care
Minimum: 4.25 AND 80%High Performing: Minimum plus
4.25 AND 70% for each agegroup (age data available on LP
Central)
4.69
91%
4.50
89%
HighPerforming
MeetsMinimum
Early Care and Education -- Workforce
EDU10
Percent of ChildrenEnrolled in 1-5 StarCenters That Have AtLeast 75% of LeadTeachers withCollege Degrees (i.e. 7 Lead TeacherEducation Points)
Minimum Standard: >=50% ofchildren are enrolled in 1-5 star
rated child care centers that haveat least 7 lead teacher education
points High Performing
Standard: >=50% of children areenrolled in 1-5 star rated child
care centers that have at least 7lead teacher education points for
each age group (age dataavailable on LP Central)
44% 46%BelowMinimum
BelowMinimum
February 6, 2019 The North Carolina Partnership for Children, Inc. Page 1

FY 2017-2018 EC Profile Results for Buncombe ( cont. )
February 6, 2019 The North Carolina Partnership for Children, Inc. Page 2
Indicator Description Standards FY 2016-17 FY 2017-18
EDU20
Percent of ChildrenEnrolled in 1-5 StarCenters That HaveDirectors withCollege Degrees (i.e.7 AdministratorEducation Points)
Minimum: >= 60% of childrenenrolled in 1-5 star rated child
care centers that have at least 7administrator points.
High Performing: >= 60% ofchildren enrolled in 1-5 star rated
child care centers that have atleast 7 administrator educationpoints of each age group (agedata available on LP Central)
58% 61%BelowMinimum
MeetsMinimum
FS20a
Percent of Parents/Guardians WhoReport Reading totheir Children at least4-6 Days a Week
Minimum: 75%High Performing: 90%
67%Statewide
62%Statewide
BelowMinimum
BelowMinimum
FS20bPercent of Parents/Guardians WhoReport Reading toTheir Children Daily
Minimum: 55%High Performing: 70%
41%Statewide
41%Statewide
BelowMinimum
BelowMinimum
FS30Percent of childrenage 0-5 with aninvestigated report ofchild abuse/neglect
>= 5.0% and <12.0%A range has been set based on
the distribution of identifiedchildren among counties. If thecounty is outside the range, the
partnership will convenemeetings to
8.9% 7.9%Within theRange
Within theRange
FY 2017-2018 EC Profile Results for Buncombe ( cont. )
February 6, 2019 The North Carolina Partnership for Children, Inc. Page 3
Indicator Description Standards FY 2016-17 FY 2017-18
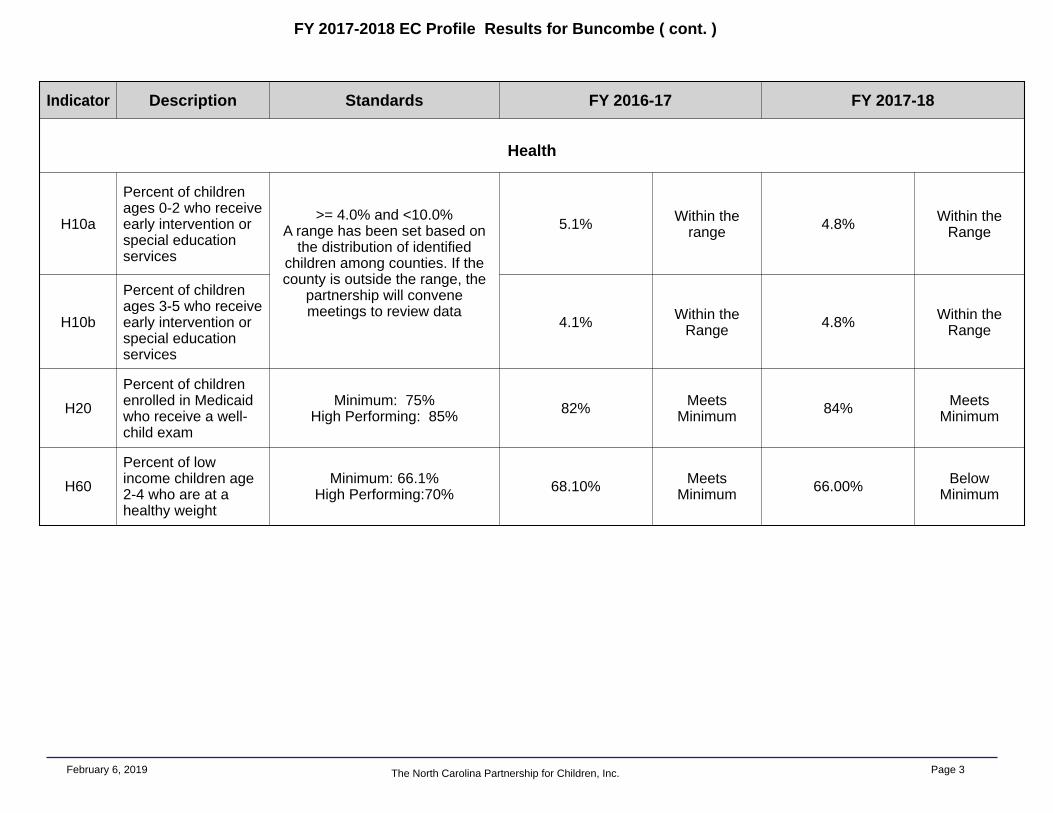
Health
H10a
Percent of childrenages 0-2 who receiveearly intervention orspecial educationservices
>= 4.0% and <10.0%A range has been set based on
the distribution of identifiedchildren among counties. If thecounty is outside the range, the
partnership will convenemeetings to review data
5.1% 4.8%Within therange
Within theRange
H10b
Percent of childrenages 3-5 who receiveearly intervention orspecial educationservices
4.1% 4.8%Within theRange
Within theRange
H20Percent of childrenenrolled in Medicaidwho receive a well-child exam
Minimum: 75%High Performing: 85% 82% 84%Meets
MinimumMeets
Minimum
H60Percent of lowincome children age2-4 who are at ahealthy weight
Minimum: 66.1%High Performing:70% 68.10% 66.00%Meets
MinimumBelow
Minimum

EC Profile Data Sources, 2018
PLA40 - DCDEE Regulatory enrollment data, 2018
PLA50 - DCDEE Subsidy Reimbursement System, Smart Start Subsidy Reimbursement System, NC Pre-K enrollment data, Title I enrollment data, Head Start, 2018
EDU10 - DCDEE Regulatory enrollment data, 2018
EDU20 - DCDEE Regulatory enrollment data, 2018
FS20 - National Survey of Children's Health, 2016-17
FS30 - Management Assistance for Child Welfare, Work First, and Food & Nutrition Services in North Carolina, 2018; NC Office of State Budget and Management Certified Estimates of the Total Populations of Counties in North Carolina for July 1, 2017
H10a - NC Division of Public Health, Women's and Children's Health Section - "North Carolina's Infant-Toddler Programs: Saturation Rates", 2018
H10b - Department of Public Instruction Certified Headcount of Special Education, 2018; NC Office of State Budget and Management Certified Estimates of the Total Populations of Counties in North Carolina for July 1, 2017
H20 - NC Division of Medical Assistance, Form CMS-416 Early and Periodic Screening, Diagnostic, and Treatment (EPSDT) Participation Report, 2017
H60 - NC Pediatric Nutrition and Epidemiology Surveillance System (NC-PedNESS), 2016