community economics of cruise tourism in central … of contents community economics of cruise...
TRANSCRIPT

Cruise Tourism and Community Economics in Central America and the Caribbean:
The Case of Costa Rica
Andy Seidl, Fiorella Giuliano, Lawrence Pratt, Rene Castro, and Ana Maria Majano
September, 2005
CEN 664
Working Paper. Written by The Latin American Center for Competitiveness and Sustainable Development (CLACDS) of INCAE. This work seeks to stimulate thought about: new conceptual frameworks; possible alternatives to framing problems; suggestions to put in place public policies; regional, national and regional investment projects; and, business strategies. It does not intend to prescribe models or policies. Neither does it makes the authors or CLACDS responsible for incorrect interpretation of its content, nor for good or bad management or public policy practice. The objective is to elevate the level of discussion regarding competitiveness and sustainable development in the Central American region. Under the prior stated conditions, CLACDS, and not necessarily its contributing partners, is responsible for its content. September, 2005.
1

TABLE OF CONTENTS COMMUNITY ECONOMICS OF CRUISE TOURISM IN CENTRAL AMERICA AND THE CARIBBEAN: THE CASE OF COSTA RICA ......................................................... 3 INTRODUCTION............................................................................................................. 3 APPROACH.................................................................................................................... 4
Cruise industry growth and regional economic development....................................... 4 Profile of cruise tourists ............................................................................................... 5 Understanding cruise tourist expenditures................................................................... 5 Understanding crew expenditures ............................................................................... 6 Estimating local economic impact................................................................................ 6 Establishing and estimating other sources of benefits and costs due to cruise tourism..................................................................................................................................... 6
ANALYSIS AND RESULTS............................................................................................ 7
Regional growth of the cruise industry......................................................................... 7 Cruise tourism as economic development ................................................................... 8 The role of cruise tourism in Costa Rica .................................................................... 10 Costa Rica’s cruise tourists ....................................................................................... 11 Local economic impact of tourist expenditures .......................................................... 12 Cruise ship employees and local economic impact ................................................... 12 Cruise ships, port authorities and local business....................................................... 13 Cruise ships and the environment ............................................................................. 15
CONCLUSIONS, LESSONS LEARNED AND FUTURE DIRECTIONS ....................... 16 TABLES........................................................................................................................ 19
Table 1: Costa Rica tourist visits and expenditures, 1993-2003 ........................... 19 Table 2: Reasons to visit Costa Rica .................................................................... 19 Table 3: Cruise tourist arrivals to Costa Rica, 1994-2004 ...................................... 20 Table 4: Cruise ship arrivals to Costa Rica, by port, 2002-2004. ........................... 20 Table 5: Seasonal Variation in Costa Rica Cruise Ship Tourism, 2001-2003 ........ 21 Table 6: Provider Concentration of Cruise Ship Tourism in Costa Rica ................. 21 Table 7: Characteristics of Costa Rican Cruise Ship Tourists, 2003...................... 22 Table 8: Tour purchases by Costa Rica cruise tourists .......................................... 22 Table 9: Cruise tourist expenditures in Costa Rica, 1996-2003 ............................. 23 Table 10: Tours offered to Costa Rica cruise tourists, P&O Princess .................... 23 Table 11: Estimated cruise ship employee tour purchases, 2004. ......................... 24 Table 12: Comparative charges of port authorities for cruise ships versus cargo ships, Puntarenas and Puerto Limon, Costa Rica, 2004, US$............................... 24 Table 13: Municipality taxes for port services, cleaning and maintenance, Puntarenas............................................................................................................. 25
RESOURCES ............................................................................................................... 26
2
COMMUNITY ECONOMICS OF CRUISE TOURISM IN CENTRAL AMERICA AND THE CARIBBEAN: THE CASE OF COSTA RICA
INTRODUCTION Cruise tourism is of small, but increasing, importance in Central America and the Caribbean, is of substantial importance in particular port locations, and is being touted as a desirable local economic development opportunity within the region. Tourism, like all engines of economic development, has desirable and undesirable features. Little objective research about cruise tourism economics and community economic development exists (e.g., Klein, 2003ab; Gabe, 2003; McKee and Mamoosadeh, 1994; Mamoozadeh and McKee, 1994; Dwyer et al., 2004). The results that are available appear to be rather site specific, in part due to strong differences between terminal main (dis-)embarkation ports and semi-terminal (primarily for tourist visitation) ports (McKee and Mamoozadeh, 1994). Johnson (2002), citing conflicting reports on purchasing patterns among cruise tourists (Hall and Braithwaite, 1990; Henthorne, 2000), argues that the specifics of the community economic impact of cruise tourism constitute an important hole in the literature base on the industry. Most recently, the Barbados Minister of Tourism strongly affirmed the need for an independent environmental economic assessment of the industry on and in the Caribbean region (CTO, 2004) and no studies exist focusing on the cruise industry in Costa Rica. A thorough understanding of the industry facilitates recognition of the potentials and pitfalls of a chosen driver of economic development. Economic issues surrounding the cruise ship industry include direct and potential impacts on the port authorities and port communities, hidden environmental impacts on marine and coastal ecosystems, development alternatives to cruise ships for port communities, distributional impacts and cultural implications of cruise tourism development and socio-economic impacts of disembarking crew members, in addition to the typically tracked tourist expenditures. This paper illustrates an economic approach to understanding the cruise tourism industry as a driver of economic development through a preliminary analysis of the industry in Costa Rica. The objective of this approach is to describe the role and activities of the cruise ship industry in Costa Rica and identify sources of economic benefit and cost such that more informed local policy decisions about the cruise ship tourism might be made and a more comprehensive inquiry into this important question might be initiated in the near future. This approach should be applicable to communities wherever cruise tourism currently exists or is under consideration to be included in the portfolio of community economic activities.
3

APPROACH Cruise tourism influences all four aspects of the tourism market: transportation, accommodation, tourism services and tour operations (McKee, 1988). The cruise industry can provide either complementary or competing goods and services to local providers. Four principal economic agents are of interest to this study: cruise tourists, cruise ship employees, port communities and countries, and the cruise company itself (see, for example, Dwyer et al., 2004; Braun et al., 2002; Gabe et al., 2003). A number of particular challenges in estimating the economic impact of cruise ships have been identified: 1) The crew is non-local, so they do not pay income tax in the locality, their jobs do not “count” toward local economic development, and there is significant leakage of their wage expenditures to other ports and their home countries; 2) The cruise liner ownership is non-local and corporate, so they do not typically pay host nation income taxes, nor are they required to adhere to local labor standards or a number of other laws, and are likely to invest their profits outside of the port region or country; And 3) for some tourist visits the cruise is a part, but not the sole purpose of the trip, making it challenging to establish which expenditures can be attributed to the cruise industry (Braun, et al., 2002). A mix of primary and secondary data collection, including expert interviews and tourist surveys, descriptive and econometric analysis are appropriately applied to these challenges in order to illuminate socio-economic issues and information surrounding cruise tourism as an engine of economic development in Central America and the Caribbean. We illustrate general approaches to the community economic analysis of cruise tourism through preliminary work undertaken in Costa Rica. Personal interviews and secondary data constitute the primary information sources for this first estimation of the effects of cruise tourism on Costa Rica. These sources of information are appropriately used in other regional locations as well. For various parts of the study, detailed below, artisans, travel agencies, port administrators, municipal officials, tourism agencies, university personnel and others were interviewed or otherwise consulted in the port communities of Limon, Puntarenas and Caldera. The Vice Minister of Public Security, tour operators who work directly with the ships, port agents and researchers at the university of Costa Rica were also interviewed for this research. In addition, cruise passenger data collected by the Costa Rican Institute of Tourism (ICT) were analyzed. The data for this study were collected from June through August 2004. More statistically rigorous approaches can be applied at each juncture in order to improve the confidence with which we can extrapolate results to broader populations and make policy recommendations. Recommended applications of appropriate economic valuation methods including travel costs method (TCM), the contingent valuation method (CVM) and export base analysis (EBA), providing complementary and supplementary information to our first estimates are detailed below. Cruise industry growth and regional economic development We begin with a review of the information available describing the role and growth of the cruise ship industry within the broader context of the tourism industry in Central America and the Caribbean. We use published information and secondary data sources for this overview, supplemented by personal interviews with key informants within the industry.
4

In our subsequent analysis, cruise ship company personnel will be interviewed with regard to ship passenger capacity, total number of passengers on board, number of passengers disembarking at a particular location, and the number, type and value of tours and other port services sold on board. Similar information will be collected from ship personnel regarding ship employees. In addition, company personnel will be interviewed to reveal the nature and amount of local purchases undertaken by the ship itself as well as any payments made for port services, docking fees, or waste disposal. Profile of cruise tourists Next, we use data and information collected through surveys by the national tourism institute (ICT) of Costa Rica and other available secondary information, including promotional information provided by the industry on their websites, to create a profile of the typical cruise trip involving Costa Rican ports of call. In a more general approach, profiles of tourists and tourism of each country often can be collected from secondary data sources (e.g., phone book, census, published and gray literature) and from interviews of national tourism authorities where necessary. Among the useful sorts of information to be collected include: the political economic history of cruise tourism and of tourism, national cruise tourism and tourism policy, the role of the cargo ship industry, and issues or concerns regarding (cruise) tourism as a driver of economic development that do not find themselves in the readily available secondary data (e.g., drugs, crime, prostitution, unwelcome cultural change). Understanding cruise tourist expenditures Third, we use ICT data to provide a preliminary description of cruise tourist expenditures in Costa Rica, creating a basis for a more detailed future study that would formally analyze tourist expenditures, their distribution locally, and their sensitivity to cost and service quality changes using the travel cost method (TCM). The travel cost method (TCM) is a commonly employed analytical tool to facilitate understanding of the demand for tourism services. TCM employs surveys of tourists to obtain a profile of their actual trip expenditures and elicits sensitivity to an exogenous change in travel costs, demographic characteristics, and trip characteristics in order to derive a demand curve for tourism visitation. TCM would allow us to extrapolate survey results to broader populations, infer willingness to pay for tourism services, explore the effect of local, national, or industry policy changes on tourism behavior and, therefore, economic impact. In order to undertake a TCM of cruise tourism, we suggest a stratified random sample of cruise tourists should be interviewed upon their return to the ship after visiting the port of call. The 15-20 minute survey would ask tourists about their expenditures at that port of call, their (anticipated) expenditures on their entire trip, the sorts of activities they undertook at the port of call and on their trip, and some demographic information. The information gleaned from the TCM would be combined with information collected from ship personnel and secondary information in order to estimate the total value of cruise tourism expenditures to the cruise ship industry and to the local economy. This information may be used to better understand the relative bargaining position, dependence or interdependence of these two principal stakeholder groups.
5
Understanding crew expenditures TCM, when combined with interview and secondary information, is also appropriate to use to reveal cruise ship employees’ purchasing behavior while in port, preferences for goods and services, and sensitivity to changes in the quality or cost of those services. However, the survey instrument employed should be somewhat different and the demand curve derived will be distinct from that found for the cruise tourists, recognizing the potential for distinct preferences, demographics and budget constraints for employees relative to tourists. Estimating local economic impact In addition to tourists and crew members, the ships themselves are a source of revenue and costs for port communities and demand for port community services. Port authority officials will be interviewed regarding port policies and cruise-liners. Information will be collected regarding services provided and fees charged. Infrastructural needs and demands of cruise ships relative to cargo ships and any local cargo ship policies affecting the cruise industry. Basic information regarding the frequency, size and seasonality of cruise-liners will also be collected. Although a great deal of economic impact information can be derived from travel cost surveys, it is both important and useful to obtain an understanding of the economic contribution of cruise tourism from the perspective of local businesses for a number of reasons. The TCM survey will reveal expenditures in the port country, but not necessarily the port community. If the distribution of the costs and benefits of cruise tourism development between the port community and the country as a whole do not fall equitably, there may be a potential need or justification for corrective social, environmental or economic policy. Secondly, not all local expenditures remain in the local economy. The size of the local multiplier is dependent upon the amount of indirect and induced local purchases driven by the direct purchases of tourists. For example, 1983 Caribbean port expenditures by cruise ship passengers ranged from $16.50 in St. Christopher and Nevis to $35 in Antigua and Barbuda (McKee, 1988). The apparent differences in economic impact per visitor may be exacerbated or eliminated if the differences in purchasing behavior are from products with substantial local content or are from imported luxury goods. The local multiplier for cruise ship expenditures can be understood through a survey of port area businesses. Based on anecdotal evidence, we reason that the vast majority of tourists who choose to disembark, but who do not purchase a tour, will travel less than a mile from the ship. Moreover, services provided directly to the ships are likely to be located quite near the port. As such, we propose to produce a categorized compendium of businesses found within a mile of the port and to survey a representative sample of these businesses by type to reveal their relative dependence on tourism in general and cruise tourism in particular as well as the size and seasonality of this dependence. Local economic impact and multiplier estimates can be derived from this approach. Therefore, the likely economic impact of policy changes or exogenous changes in tourism behavior can also be derived from these estimates. Establishing and estimating other sources of benefits and costs due to cruise tourism The cruise industry poses a significant source of potential pollution and environmental risk. In addition, the industry may be responsible for socially unsavory impacts of tourism development
6

that would provide valuable information to local decision-makers, whether or not the information is derived specifically from that locality. For example, few ex ante approaches exist for estimating the potential cost of potential impacts of pollution due to cruise ships, cargo ships or other types of development. In all such cases, we are dependent upon case history, and a literature review to establish what has happened in the past, its probably impact and consequences, and to attempt to get a gauge of the likelihood of it happening in the future in a particular location. This is not an exact science by any means, but it is the best we have and valuable lessons and precautionary actions might be considered locally appropriate based upon those lessons learned. Such broad categories of considerations and concerns will be catalogued by this research. Where appropriate, the likelihood, extent and estimated impacts of these features will be derived from available information and used as a means to illustrate the issues. ANALYSIS AND RESULTS Regional growth of the cruise industry The long haul passenger jet destroyed the passenger shipping industry in the 1960s. Cruise ships made the jump from sea travel as transport to sea travel as leisure. Cruise tourism is now the fastest growing part of the tourism sector (Klein, 2002; TIES, 2004; McKee and Mamoozadeh, 1994). Cruise ships carried 500,000 passengers in 1970, some 8.5 million (6 million Americans) in 1997 (Economist, 1998) and about 9.8 million passengers in 2003 (BREA, 2004). The cruise industry accounts for 1.4% of all international tourists, ranking 20th if the industry were a nation, and 2.7% of global tourism receipts (8th) (Kester, 2002). In North America the number of people taking cruises doubled between 1990 and 2000 and Americans constitute some 72% of the global cruise market, although cruising is becoming more popular with Europeans in recent years (Kester, 2002). In 2002, the global cruise industry capacity was 183 vessels and about 213,000 berths growing at an annual rate of about 7% (Kester, 2002). A more recent count of the global fleet of cruise ships is currently 220 ships, though the industry announced plans to increase that fleet by 25% between 2000 and 2005. The cruise ship industry also plans 56-70 new terminals (docking points) in the US over the next 15 yrs (Blue Water News, 2004). Not only will there be more ships, but ship capacity is increasing as well. Older cruise liners typically had capacities of around 1,000 passengers. In 2002, the average cruise liner had 1,163 berths, weighed 43,000 tons, and was in service for about 15 yrs. The largest four cruise corporations have a generally younger (10 yrs) and larger (1,5000 berth average) fleet (Kester, 2002). A modern 70,000 tonne cruise liner can house 2,000 people, while a new 135,000 tonne ship can house 3,100. Globally, eight companies dominated the industry in the late 1990s (Douglas and Douglas, 1999). Currently, it is controlled by two: Carnival Corporation and Royal Caribbean Cruise Lines. Carnival Corporation includes Carnival, Holland, Costa, Cunard, Windstar and Seaborn cruise companies. Royal Caribbean Cruise Lines includes RCI, Celebrity and Island cruise companies (Klein, 2003a). Carnival Corporation reported profits of $1.02 billion on revenues of $4.37 billion (30% return on investment) in 2002, making it the most profitable leisure company in the world. Royal Caribbean reported $254 million in profits on $3.15 billion in revenues (9% return), P&O Princess, $301 million on $2.45 billion (14%), and Star Cruises, including Star, Norwegian and
7
Orient cruise lines, reported $82.6 million in profits on $1.57 billion (6%) in revenues (Klein, 2003a). In 2003, P&O Princess became part of Carnival Corporation. Profits and total revenues for the top four cruise lines combined were $1.66 billion and $11.54 billion, respectively, or a 17% industry level return on investment in 2002 (Klein, 2003a). Cruise ships typically enjoy 90-95% occupancy rates, relative to the 70% rates striven for in the hotel sector (Economist, 1998; Pattullo, 1996a). Despite, or perhaps resulting in, their profitability, both Carnival and Royal Caribbean are registered in “flag-of-convenience” nations, so they avoid many U.S. environmental and labor laws and don’t pay U.S. corporate income tax (Klein, 2003a). The cruise industry is heavily concentrated in the Caribbean, Alaska and the Mexican Riviera. Some 2/3 of the global cruise ship capacity is located in the Caribbean during the winter months (October-March) and about ¼ in the summer months (April-September). In 2002, Carnival Cruise Lines controlled 38% of the market in the Caribbean and Mexican Riviera, Royal Caribbean commands 26%, P&O Princess had 6% and Star Cruises some 8% of total passengers. With the merger between Carnival and P&O Princess in 2003, two carriers account for more than 2/3 of all cruises in the region. Between the winter and summer months, the global fleet shifts substantially toward Alaska (0-16%), the Mediterranean (8%-31%), and Atlantic Europe (0-18%)(Kester, 2002). The trend toward larger ships should increase rather than decrease this seasonality (McKee, 1988). Cruise tourism as economic development McKee (1988), Fish and Gunther (1994) and others find a number of fairly unique concerns and opportunities with regard to the encouragement of cruise tourism as an engine of economic development. These concerns focus on local control and the distribution of local costs and benefits of cruise activities. In this section, we focus on the relationship between the industry and general economic development impacts on ports of call rather than on the specific issues covered in other sections. First, communities and local businesses dependent upon cruise tourism must compete in an environment dominated by very few multi-national corporations. The local economy becomes dependent upon the economic conditions of international consumers and on the global economic opportunities available to the cruise ship industry, rather than local economic conditions (McKee, 1988; Fish and Gunther, 1994). The dependence relationship between industry and locality is exacerbated by research findings indicating that there is a high degree of substitutability among sun and fun category tourism destinations (Caribbean Islands, southern Mexico, southern Europe) (Fish and Gunther, 1994). Such conditions reduce local volition, economic development alternatives and profit margins and increase potential local economic variability. McKee (1988), McKee (1986) and McKee and Mamoozadeh (1994) argue that there may be some unique opportunities provided by cruise tourism as a driver of natural resource based economic development. For example, port calls create a brief taste of a location that may result in a longer visit in the future that may not have been otherwise considered. Gabe et al. (2003) find that the clientele served by cruise ships is at a substantial variance from the more typical Maine visitor. In addition, since cruise tourists bring their beds with them, environmentally and financially costly investment in local built infrastructure can be postponed or avoided entirely. Fewer local tourist services imply lower local dependence on tourist expenditures and, potentially, a more informed approach to further tourism development planning. However, it also implies lower local tourist expenditures, thus economic activity, and local multiplier effects.
8

Unfortunately, for many cruise destinations, though probably not Costa Rica, construction materials are largely imported and the better known resorts and hotels are foreign-owned. For example, Alaska, similar to many island economies, demonstrates high levels of leakage (wage, high cost of goods sold (low value added), and service), low levels of economic diversification and infrastructure development (McDowell Group Inc., 2000). The low degree of local value-added, or high degree of leakage out of the local economy, results in a relatively low amount of positive economic impact. Increasing the proportion of local content, or reducing the imported content, of tourism services, increases local multipliers. Most items in “duty free” shops have very little local content. Wilkinson (1989) estimates that 40% of money spent in Caribbean Island economies immediately leaks out to multinational hotel chains and airlines, resulting in abysmal income multiplier estimates of 0.58-1.195 (Fish and Gunther, 1994). These, and the few other published results that are not derived from consulting firms, have lead researchers to strongly question the accuracy of the 2.5 multiplier used by Price Waterhouse’s FCCA contracted study in 1994 (Pattullo, 1996a) and beyond (e.g., Price Waterhouse Cooper, 2004). Local multipliers will be higher for terminal (home) ports for cruise ships than for ports that simply entertain day visitors from the ships. In addition, multipliers are higher as the population and complexity of the local economy increases. Braun et al. (2002) found that the total impact of the cruise industry increased almost two fold by expanding the scale of analysis from Brevard County to include all of Central Florida. Moreover, the share of economic impact shifted away from cruise liners (89% vs 94%)and toward passengers (7% vrs 5%) and crew (4% vrs 2%) as the scale of analysis became smaller. That is, passenger and crew spending is concentrated near the port, whereas cruise liner spending is more geographically dispersed. Although the cruise industry initially touted exotic ports of call as a principal thrust of its tourism experience, increasingly marketing campaigns focus on the on board amenities available to cruisers. “Mass cruise tourism has been likened to all-inclusive resort experiences, with the cruise ship itself providing the holiday experience rather than any destinations to be visited” (Ubersax, 1996). This shift from floating hotels to floating resorts increases the incentives for the industry to maximize the time (and money) cruisers spend on board and minimize their time in port. As such, cruise ship companies are in direct competition with local communities for the expenditures of cruise tourists (McKee, 1988; McKee and Mamoozadeh, 1994) and with land based resorts for the tourism market more generally (Kester, 2002; Pattullo, 1996a). In order to maximize their take, the industry sells land based tours to selected providers on board for a substantial markup (typically 50%) and contracts with local retailers for “preferred” status in exchange for as much as 40% of gross sales (Klein, 2003a). Some, including Disney Corporation, have gone so far as to purchase their own islands, cays, or beaches, generating the least possible positive local economic impact (Pattullo, 1996a). “With respect to the Caribbean region, it has been suggested that ‘there is little interaction between the passengers and the economy and the population of the islands they visit’ (Barry et al., 1984)”(McKee, 1988). There is great variety and, therefore, site specificity in predicting the amount of ship board vs in port spending by cruise tourists. Although many costs of cruise vacations are included in their prices, Klein (2003) finds industry wide averages of $220-232 per day in ship board spending. This constitutes a sharp increase relative to CLIA’s 1987 report of $22.50 per day (McKee and Mamoozadeh, 1994), even adjusting for inflation and, potentially, income differences over the period. Klein (2003) implies that the changes in ship board spending come at a cost to land based spending and are due to changes in the marketing of cruises as floating resorts rather than simply floating hotels. Since about 90% of cruises are between two and 8 days in duration (Douglas and Douglas, 1999), and the average cruise is about 7 days (Kester, 2002; McKee and Mamoozadeh, 1994; Pattullo, 1996a), approximately $1,500 in tourist spending per trip in
9

addition to the cost of the cruise itself can be estimated from Klein’s numbers. Kester (2002) calculates an average of $1,341 in revenues per cruise across all cruise types. Average land expenditures for cruise tourists in the Caribbean range from $15 to $270 in 2001 (CTO, 2003), differences driven largely by the purchases of imported luxury goods with little local content. Pattullo (1996) finds 45-67% of onshore expenditures went to duty free shopping, 17% to tours and attractions and 8% on food. Gabe et al. (2003) finds an average land expenditure of $85.26 in Bar Harbor, Maine, an estimated $105.82 including tours purchased on board. Both means are somewhat skewed by jewelry purchases (Gabe et al., 2003). In the US Virgin Islands some 80% of onshore purchases is for duty free shopping, while the similar figure for Martinique is 50% (Pattullo, 1996a). The role of cruise tourism in Costa Rica Tourism, particularly ecological and cultural tourism, is strongly encouraged as an engine of sustainable economic development in Costa Rica. More than 1 million visitors spend more than US$1 billion annually, drawn by its natural beauty, agreeable climate and reputation for political stability and safety (Tables 1 and 2). The quality of Costa Rica’s protected areas, beaches and volcanoes continue to be the most highly rated features of the country by visitors (ICT, 2004). Although the vast majority of visitors to Costa Rica arrive via airplane, an increasing number of tourists gain access to the country’s rich natural and cultural history via cruise ship (Table 3). Although cruise ship tourism has been an active and growing portion of the global tourism sector since the 1970s, cruise ships first arrived in Costa Rica in the early 1990s (Table 3). Cruise ship visits to Costa Rica have increased from about 150 ships in 1993 to 215 in 2004, after peaking at over 250 ships in 1999. Cruise tourists, however, have increased over the period from just over 100,000 in 1993 to about 320,000 in 2004, due to increasing ship capacities (ICT, 2004). Cruise tourism, therefore, constitutes an increasing share of all tourism visits to the country, from approximately 1 in 7 tourist arrivals in 1993 to nearly 1 in 4 in 2003, although cruise ship visits are approximately one-seventh the length of stay of the average tourist visit to Costa Rica. Initially, cruise ships docked at the Pacific ports of Puntarenas, Calderas and Golfito. By the end of the 1990s ships were also docking at the Atlantic/Caribbean port of Puerto Limon (Table 4). Currently, visits to Puntarenas appear to be on the decline while visits to Puerto Limon seem to be on an upward trajectory, accounting for approximately 2/3 of cruise ships and tourists to Costa Rica (ICT, 2004). The cruise ship tourism season strongly coincides with the high season (December-March) for tourism in the rest of Costa Rica, exacerbating potential congestion and other development challenges of strong seasonality (Table 5). Cruise tourists represent as many as one in three visitors visits during the high season. A typical 10 day vacation cruise, including Costa Rican ports of call, costs as little as $1,200 to as much as $4,500 and includes some 7 or 8 port destinations. A typical $1,200 itinerary for cruises that land in Costa Rica on Carnival/Royal Caribbean cruise lines is Miami, Aruba, Panama Canal Transit, Puntarenas, Acapulco, Mazatlan, Cabo San Lucas, and Los Angeles. A $2,000 cruise itinerary including Costa Rican ports of call on Princess Cruises/Holland America is: Los Angeles, Cabo San Lucas, Acapulco, Puntarenas, Cartagena, Ocho Rios (Jamaica), Aruba, and Miami. A luxury cruise of $4,500 on Crystal/Silversea Cruises includes an itinerary of Fort Lauderdale, Florida, Aruba, Puntarenas, Acapulco, Puerto Vallarta, Cabo San Lucas, and Los Angeles.
10

Three cruise lines comprise an increasingly large market share of the Costa Rican cruise tourism industry, accounting for ½ of all ships in 1999 increasing to some 2/3 of all arrivals in 2003 (Table 6). Royal Caribbean’s ships now provides ¼ of all cruise ship visits to Costa Rica, while Carnival’s various carriers account for another 1/3 of the Costa Rica cruise ship tourism market. Thus, Carnival and Royal Caribbean currently comprise well more than ½ of the Costa Rican cruise tourism industry, a degree of market power that could provide particular negotiation challenges to current and potential port communities. Costa Rica’s cruise tourists While a bit more than ½ of tourists to Costa Rica are North Americans, more than 80% of cruise ship passengers, or 800 people on average, whose voyage passes through Costa Rican ports, are from North America. About 17% of all tourists and cruise tourists to Costa Rica are European (ICT, 2003). US residents show a preference for the Caribbean Coast, comprising some 2/3 of all passengers to Puerto Limon, but only about ½ of cruise tourists to Puntarenas. About 70% of cruise passengers are married and a parallel number travel with a partner or family. Cruisers to Puerto Limon have substantially more educational attainment and, as might be expected, reported annual income than visitors to Puntarenas. However, the general tourist population is substantially more educated and younger than are Costa Rica’s cruise tourists. Some 70-80% of cruise tourists to Costa Rica are 45 yrs old or greater, while the average visitor to the country is about 40 yrs old (Table 7). Similarly, Gabe et al. (2003) report an average respondent of 60 yrs old with less than 5% of respondents younger than 40 yrs old in their study of Maine cruise tourism. Cruise ships are in Costa Rican ports for an average of 12 hrs per visit. Similarly, Gabe et al. (2003) report ships spend an average of 9 hrs in port (7-12 range) in Maine, while the average respondent spent about 5 hrs off the ship. Since their visit is so brief, cruise tourist expenditures in Costa Rica come from tours, local transportation, food and beverage, souvenirs and incidental purchases. Some 90% of passengers disembark at Costa Rican ports of call, while 10% remain on board. Approximately 45-65% (400-600 people) of those who choose to disembark prepurchase local tours while on board, about 15% (135 people) purchase tours upon arrival at the port and the remaining 20% (180 people) do not purchase tours (Table 8). The average passenger purchases 4-5 tours on his 10-day vacation and no more than one at any given port. According to Kester (2002) over 80% of cruise tourists worldwide participate in panoramic visits, shopping and sightseeing, 50-80% participate in excursions, cultural visits, beach activities and gastronomy, and about 10% engage in golf and tennis. For Costa Rica, the most popular tours for passengers who disembark in Limon are Tortuguero turtle sanctuary (27%), a forest canopy aerial tram ride through Braulio Carrillo National Park (17%), a scenic train trip (16%), and a banana plantation tour (12%). The most popular tours for passengers who disembark in Puntarenas are the city of San Jose (23%), a small boat tour in a mangrove estuary (22%), traditional arts and crafts in Sarchi (19%), an aerial tram ride through Braulio Carrillo (8%) and a coffee plantation tour (Café Britt)(8%). Generally speaking, of those who purchase tours, approximately ½ are oriented toward the natural environment of Costa Rica, whereas closer to 20-25% could be considered culturally oriented. In addition, respondents mention several other factors making Costa Rica an attractive port of call including: nice people, banana and coffee plantations. The ICT (2003) estimates that cruise tourists spend just under $100 each during their stay in Costa Rica (Table 9). Recent surveys indicate that expenditures by visitors to Puntarenas are
11

in line with these expectations, while estimated expenditures by visitors to Puerto Limon are somewhat higher. Expenditures per visitor have varied little in nominal terms over the past decade, but total expenditures have increased from about $15 million in 1996 to more than $26 million in 2003 (ICT, 2003). However, Klein (2002) finds that in general spending from cruise passengers in port communities has dropped by half since 1994 due to changes in demographics and on-board spending. Local economic impact of tourist expenditures Tourism expenditures are considered exports because new money comes from outside of the region in order to purchase goods and services from inside the region. Export industries, also called base industries, are essential to regional growth and development because they increase the amount of regional economic activity, whereas nonbase industries simply increase the rate of circulation of goods and services within a region and do not create any new wealth. Export base analysis (EBA) tracks the flow (or multiplication) of new outside money through the local economy. Local multipliers increase with the complexity of the local economy and with the proportion of local goods and services purchased to create the good or service ultimately purchased by the tourist. Although a formal TCM/EBA analysis would be the most rigorous approach to address this issue, available secondary information combined with expert interviews can provide a reasonably accurate perspective to inform any such subsequent analysis. ICT surveys indicate that only about $28-36 of cruise tourist expenditure pass directly from tourist to local goods and service providers (Table 8). For example, through surveys we estimate approximately 80 artisans sell about $74 worth their wares each at each port and for each ship (Guiliano et al., 2004). If at most 800 (400) tourists per ship are exposed to the artisans, the average expenditure on arts and crafts would be about $7-8 ($14-16) per person. Approximately 35% of tours purchased are ½ day in duration, allowing participants to return to the ship for their prepaid meals. The cruise operator also compensates local tour companies for the tours purchased on board (Table 10). The cruise line typically captures as much as 50% of the fees charged the tourists for these local tours (Klein, 2002), so we might calculate an average of about $70-75 per cruise tourist, or 70-75% of total local tourist expenditures, finds itself in the local economy. The economic impact of that $70 increases (multiplies) with the proportion of locally produced goods purchased (e.g., locally grown and processed agricultural products, locally grown and produced arts and crafts) and decreases with the proportion of imported goods (e.g., canned and bottled beverages, film, sunscreen, pharmaceuticals). Braun et al. (2002) estimate cruise passenger spending mutipliers of 1.43 in employment effects, 1.62 for wages and 1.88 in value added creation for an economically complex and highly populated terminal port in Central Florida. INCAE (2004) estimates that about $0.40 of each tourist dollar spent in Costa Rica remains in the local economy, potentially implying a local multiplier or 1.4 and a total local impact of about $98 per cruise tourist to Costa Rica. Cruise ship employees and local economic impact It would be most appropriate to undertake a TCM of ship employee behavior while in local ports, informed by interviews with ship personnel, port personnel and secondary data. Until that time
12

which such analysis can be undertaken, we provide estimates based upon the latter two categories of information. The ratio of employees to passengers on most cruise ships is approximately 1:2 or 1:3 (McKee and Mamoozadeh, 1994), increasing to four employees for every five passengers on luxury liners (Klein, 2003a). Thus, each cruise ship that comes to a Costa Rican port carries 500 to 1000 employees (e.g., musicians, maids, cooks, etc.). Based on anecdotal evidence, approximately 40% of ship employees tend to disembark at each port of call. Costa Rican ports of call are thought to be popular with ship employees in part due to the country’s reputation for value in dental and health care. More detailed surveys would reveal whether this hypothesis is viable. In 2000, 16% of cruise ship workers earned less than $500 per month, 38% earned $500-999, 19% earned $1,000-1,400, 17% earned $1,500-1,900, and 12% earned more than $2,000 per month (Klein, 2003a). Crews are decidedly less American relative to the passengers (Douglas and Douglas, 1999) and clearly earn less income than passengers, making it likely that they would have distinct in port consumer preferences as well. Ship employees are not typically served by the tour operators selling tours on the ship and tend not to mix with the passengers while in port. Due to their duties, ship employees tend to have an average of only 6 hrs to explore each port of call and have substantially lower incomes than a typical cruiser. One operator in Limon who markets to ship employees relates that he captures approximately 20% of the ship employees with shorter duration tours and activities including rafting, canopy tours, national park visits, beach parties at an average of about $60 per person. This generates about $3,840 in gross revenues and $1,920 in profits per cruise ship to the tour operator (Table 11). McDowell Group Inc. (2000) found off ship expenditures of crew members of between $5 and $20 per visit to an Alaskan port, or about 5-10% of tourist expenditures per visitor to the same location. It is also appropriate to employ export base techniques to ship employee expenditures since they are not local people. Braun et al. (2002) finds multipliers for crew spending of 1.66 employment impact, 1.59 wage effect and 1.66 in value added creation for Central Florida. If the local multiplier for cruise ship employee purchases in Costa Rica is more like 1.4 (due to lower population and less economic complexity), and at this point there is insufficient evidence to suggest otherwise, the total local economic impact per visiting ship employee purchasing a tour is about $84 or about $5,380 in local economic impact per ship, excluding local expenditures of employees who left the ship but did not purchase tours.
Cruise ships, port authorities and local business Individual ships compensate ports for services provided to them. Cruise ships are charged per passenger and per meter for a stay of up to 12 hrs, for services related to passenger disembarkation. Expert interview and the review of official documents is the only manner in which to reveal this information. The results of such an approach and analysis are provided here. On average, ports charge per passenger port fees in the neighborhood of $5.00 per passenger (Klein, 2003a), representing more than $1,375,000 in fees potentially captured by Costa Rica in 2003. However, there is a great deal of variation in per passenger charges. In 1993, St Maarten had no per tourist charge, Dominica charged $2 and the Bahamas charged $15 per cruise tourist (Pattullo, 1996a). Bermuda charges a regional high of $63 per day tripper from the cruise
13

ships, while Juneau, Alaska charges only $5 per head (Johnson, 2002). Within the Caribbean Basin this variation is said to be driven by competition among potential port nations and quality of facilities on offer. The Caribbean Community (Caricom) and the Organization of Eastern Caribbean States have made efforts to standardize the per tourist charges across their member countries. However, it has not been successful (Pattullo, 1996a) and a “race to the bottom” to capture cruise business is largely observed (Uebersax, 1996). Puntarenas charges only $2.50 per passenger, generating a potential loss of $687,500 relative to industry standard if applied across the Costa Rica. However, since November 3, 2003, cruise ships have been charged $2.09 per passenger in Puerto Limon. This charge has been reduced over time from $3.50 prior to September 11, 2001, to $2.75 per head from September 2001 to November 2003. For a representative thousand-passenger ship, this 40% fee reduction from recently charged fees represents a loss of $1,410 per ship to the Limon port authority in nominal terms. This amounts to about $268,000 in lost fees 2003 alone relative to Costa Rica’s relatively low port charge and about $800,000 lost locally in 2003 relative to modest industry norms. Puerto Limon receives about 7 to 11 times as many cargo ships as it does cruise ships during the high tourist season. In Puntarenas, the number of cruise ship visits is steadily declining, while the number of cargo ships is steadily increasing. From the perspective of the port authority, when the port is working at or near its capacity any cruise ship docked represents a (fraction of or multiple of) cargo ship that could not be attended. As a result, typical revenues (and costs) of cargo ships should be weighed against that of cruise ships in the port authority’s accounting framework. It is considered a nearly universal practice to give docking priority to cruise ships over cargo ships, to the considerable detriment to the latter. Wood (1982) contends that it is the nature of the cruise ship industry not to wait in line; but rather to move along to another port when faced with even slight delays, which contributes to the universality of this port priority policy. Wood (1982) finds that this priority policy for cruise ships is generally unjustified economically. The port of Limon charges cruise ships $0.48 per meter per hour and each cruise ship is charged a flat rate of $5,864 to dock the ship for passengers to disembark. Puntarenas charges $0.35 per m-hr and a flat rate of $4,800 for a ship of typical cruiseline size. In Puerto Limon, cargo ships pay a flat rate by registered weight, a rate per meter-hr that is almost three times the cruise ship rate ($1.27/m-hr), a port use fee of $0.87 per tonne, tugboat charges of $0.19 per registered tonne, and a within port navigation fee of $33.47 per trip. The analogous payments in Puntarenas are substantially higher. Table 12 provides a side-by-side comparison of the relative contribution of similar cruise ships versus cargo ships to the local port authority in Puerto Limon and Puntarenas. It shows that cargo ships in Puerto Limon pay almost twice as much to the port than cruise ships under the current fee structure, while cargo ships pay about seven times the fees paid by cruise ships in Puntarenas. Even if the per passenger fees reflected industry norms, cargo ship payments would exceed cruise ship payments by some $3,000 per ship in Puerto Limon. Since 1999, the city of Puntarenas has charged $1.50 tax per cruise ship passenger (but not ship employee) and a flat fee of $50 for each ship flying under any flag other than Costa Rica to cover the additional costs of maintaining an appropriate human environment for tourists (Table 13). To date, Limon has no such taxes, but is taking the idea under consideration. The ship may purchase supplies while in port, may add or exchange employees, or may require special services for employees. Since Costa Rica is known for the quality of its dental care, there is some, if not a huge amount of, activity in the local provision of these services to cruise
14
ship employees. Similarly, the ships may or may not purchase water locally at a rate of $10 per tonne in Limon or $2.58 per tonne in Puntarenas (200-400 tonnes per ship). Ships tend not to purchase fruits and vegetables locally, since Costa Rica is not among the cheapest locations for such items in the region. Job quantity versus job quality is a consistent challenge of economic development. This can particularly be the case with nonconsumptive natural resource based industial development like tourism, where many of the jobs created are in the service and retail trade sectors. In an analysis of the contribution of cruise ships to the Alaskan economy, McDowell (2000) found that the local jobs created to serve the cruise industry were 77-94% of the average private sector wages in host communities. The jobs created were primarily in the transportation, retail and service sectors. Cruise ships and the environment Although it has been argued that cruise tourism offers a unique opportunity for sustainability due to its spatial confinement and predisposition to precise management, problems associated with waste generation and disposal, other pressures on fragile and unique natural environments, and social and economic impacts on host communities continue to be vetted (Johnson, 2002). Cruise tourism pollutes sea floors, harbors and coastal areas, degrades scarce water sources, destroys coral reef habitat, creates public health concerns ashore, and generates pressure on land based waste disposal sites (Uebersax, 1996 in Johnson, 2002). Negri and Hayward (2000) and Negri et al. (2002) find that cruise ships constitute significant sources of water pollution and reef damage due to improper oil, fuel, and waste disposal and the use of toxic paints. Uebersax (1996) indicates that the average cruise ship produces 1 kg of burnable waste, 0.5 kg of food waste and 1 kg of glass and tin waste per person per day. Three of the four largest cruise lines have been convicted of breaking US environmental laws since 1998. P&O Princess was also convicted, but earlier in the 1990s (Klein, 2003a). In 1998, P&O Group released a corporate environmental report that acknowledged the impact of cruise liners in terms of waste generated and the percentage recycled, oil consumption and carbond dioxide emissions, ozone depletion, sulphur dioxide emissions, oil spillage, and water use (Johnson, 2002). In 2000 the Bluewater Network petitioned the US Congress to consider cruise ships as point sources of water pollution (Johnson, 2002). Cruise lines have paid more than $60 million in fines over the past 5 yrs and $90 million over the past decade for illegal dumping or concealing it (Klein, 2003a). With a few notable exceptions (one case each in Egypt, Mexico and Brazil), the enforcement of these environmental regulations has been by the United States (Klein, 2003a). In 1998 Holland America was fined $2 million for illegal discharges of oily bilge in Alaska in 1994. Royal Caribbean was fined $18 million for 21 felony counts of violating US water pollution laws, dumping oil and hazardous chemicals, in 1999. A $250,000 reward was awarded to passengers of the P&O Princess cruise who bore witness to intentional dumping of plastics and other waste by the cruiseliner (Johnson, 2002).
Klein (2002) among others argues that “the cruise industry has the resources to build cleaner ships, stop dumping in coastal waters and contribute to coastal environmental protection and clean-up, but prefers to forward unenforceable voluntary agreements less likely to impact the bottom line if violated. They are getting a free ride…” Holland American Line has been involved in attempting to restore accidental reef damage, although there appears to be rather limited success. Unlike this case where the blame is clearly traceable to a single operator, there is little
15
evidence of the industry addressing the more general cumulative effects of cruise tourism on the worlds’ marine and terrestrial ecosystems (Johnson, 2002). Although there are no studies directly relating cruise ships, waste and natural resource use in Costa Rica, cruise ships do not have a particularly good reputation when it comes to the preservation of the natural environment from which they profit. The cruise ships that dock in Costa Rican ports do not practice recycling. Garbage disposal is currently and temporarily prohibited in Puerto Limon. In Puntarenas, and in Puerto Limon when it is permitted, only dry solid waste is accepted. The ships pay private local vendors for these services. The industry currently pays nothing for environmental protection from the risk of accidental spills/dumping, monitoring or cleanup. To the extent that cruise tourists exploit private businesses when they are in Costa Rica, disposal of their waste should be considered accounted for. However, when they travel to public areas and use public facilities, the degree of compensation for waste generation and resource use is less clear, but should probably not vary considerably from other types of tourists on average. CONCLUSIONS, LESSONS LEARNED AND FUTURE DIRECTIONS Growth in the cruise ship industry in Latin America and the Caribbean in general and in Costa Rica specifically will be accompanied with demands for investment in ports of call for these larger ships arriving in greater numbers. Such investment will create jobs and income for host communities and countries. It will also generate pollution, increase congestion, and have other social and cultural impacts in port communities and beyond. The question is whether this is the appropriate economic development path for Costa Rica and/or other countries and communities in the region to follow. McKee and Mamoozadeh (1994) conclude against the notion stating “…it seems doubtful that Third World economies should consider cruise tourism as a major factor in development plans.” The Costa Rican government has responded to growth in the cruise ship industry by designating Puntarenas and Limon as “Primary Centers of Tourism Development,” providing tax holidays, infrastructure investments to separate tourism activities from cargo shipping, and other inducements to further develop these ports to accommodate cruise ship tourism. Costa Rica must seriously consider whether cruise tourism is an engine of economic development it would like to encourage or discourage based upon the following comparisons where appropriate: no cruise ships vs cruise ships; cargo ships vs cruise ships; and other tourism vs cruise tourism. Our analysis raises the following issues and concerns with investing in cruise tourism at a cost to other potential avenues of local economic development.
The cruise tourism industry competes with the cargo shipping industry for port space at what appears to be a significant cost to Costa Rican ports in favoring cruise ships to cargo ships. Port fees in Limon and Puntarenas are skewed against the cargo ship industry. Charging the industry standard per passenger and the same per meter-hr rate as is charged to cargo ships would essentially equalize the payments to the port authority between cruise ships and cargo ships in Puerto Limon. The fee structure in Puntarenas is strongly skewed against the cargo ship industry relative to cruise ships and equalization appears unlikely there. Moreover, cruise tourist numbers are in decline in Puntarenas, unlike Limon, and their local
16

expenditures are lower than their counterparts in Limon. It may be that cargo ships are a more viable long term development alternative than cruise ships in Puntarenas.
The cruise tourism season peaks at the same time that other forms of tourism peak,
diminishing the quality of the individual tourism experience and putting tourism infrastructure (e.g., busses, roads, parks, beaches, restaurants, water supplies, electricity, concessionaires) under greater stress than would otherwise be observed. This is a particular bone of contention among Costa Ricans, as the tourism industry regularly proposes to change the public school holidays in order to be more tourist industry friendly and spreading demand for tourist services more evenly throughout the year. Although this is not an unreasonable policy to consider on its face, it has resulted in significant public outcry about the “tail wagging the dog” arguing that Costa Rica should be, first and foremost, for the Costa Ricans.
Although the total tourism expenditures of cruisers may be similar to other tourists, it
appears that the amount of money injected into the local economy per cruise tourist is substantially lower than for other types of tourism. Much like the reputation of land based “all inclusive” resorts, cruise companies appear to capture most of the economic returns from the cruise tourist experience, regardless of the role the local natural resource base and people might have played in it.
The economic benefits due to expenditures by ships’ employees, which must be considered
in the likely impact of cruise tourism, may be outweighed by the economic and social or cultural costs of their in port activities, although definitive evidence of this remains unstudied.
Port communities may become tempted to engage in a race to the bottom (in terms of port
fees) to accommodate cruise ships, due to the highly concentrated nature of the cruise industry. Although port charges for cruise ships are quite similar between Puerto Limon and Puntarenas, they are substantially below reported industry standard and are amoung the lowest in the region.
Due to the country’s relative affluence regionally, cruise ships purchase relatively few
supplies in Costa Rica, mitigating potential benefits of their stop in a Costa Rican port.
Cruise ships generate a great deal of human waste, water and air pollution, which can create a serious health hazard, cleanup costs, and which are not commensurate with other types of tourism development available to Costa Rica. Water pollution concerns at beach communities near Puntarenas (e.g., Jaco, Playa Hermosa) often (rightly or wrongly) point to cruise ships as the source of these problems. Here again, regional, multi-national pollution policies applied to marine industries would work to mitigate these effects without harming local competitiveness narrowly defined, and perhaps enhance it considering economic development alternatives more broadly.
Decision makers may want to consider that investment in cruise tourism friendly ports may
be less efficient from a national perspective than investment in infrastructure (e.g., airports) to increase more profitable types of tourism.
Leaders may want to consider the encouragement of smaller “pocket” cruises over the
current cruise version of mass tourism (McKee, 1988). Such ships would probably not compete with cargo ships for port space, rather they would contribute to the increasing
17

number of local harbors for private leisure vessels, and would potentially create more “value added” than mass cruise tourism. Current examples of pocket luxury cruises include: Abercrombie and Kent International, providing luxury nature watering trips around Antarctica; Windjammer Barefoot Cruises, small sailing yachts around the Caribbean; and Swan Hellenic historic tours with lectures around the Mediterranean.
We do not purport to have provided the definitive word on cruise tourism as an engine of economic development in Central America and the Caribbean, nor in Costa Rica. We hope to have provided an overview of the important economic issues to consider, a first estimate of the potential impacts of the industry in Costa Rica, and an appropriate research path to reveal more precise and robust information to facilitate future decision making and negotiations regarding the cruise ship industry. We hope that through this synthesis of the currently available information augmented by painstaking interviews of representatives of all relevant stakeholder groups to have raised the important questions and provided some insights into their potential answers within the Costa Rican context. Clearly more research is needed to precisely understand this increasingly important and largely unstudied tourism subsector such that better informed local, national and regional socio-economic and environmental policy might be created.
18

TABLES
Table 1: Costa Rica tourist visits and expenditures, 1993-2003
Year # of Tourists Tourist Receipts (US$ millions) Receipts per tourist visit (US$) 1993 684,005 557 8441994 761,448 626 8221995 784,610 660 8411996 781,127 689 8821997 811,490 719 8861998 942,853 884 9371999 1,031,585 1036 10042000 1,088,075 1229 11302001 1,131,406 1096 9682002 1,113,359 1078 9682003 1,192,889 1199 1005Source: Developed by the Balance of Payments Section, Central Bank of Costa Rica, May 2004. [email protected] - Hernan Fonseca.
Table 2: Reasons to visit Costa Rica Rank Motivation Percentage 1 Pleasure, relaxation, vacation, recreation 622 Business and professional motivations 203 Visit family and friends 124 Studies/education 25 Health treatment 1 Activity 1 Beach and Sun 612 See local flora and fauna 453 Hiking and volcano visits 454 Birdwatching 335 Sports 10Source: Instituto Costarricense de Turismo (ICT), tourist survey, 2003
19

Table 3: Cruise tourist arrivals to Costa Rica, 1994-2004 Year # of Cruise Ships # of Tourists Tourists per Ship 1994 173 155,584 8991995 164 139,428 8501996 168 158,742 9451997 202 201,386 9971998 220 224,405 10201999 253 235,039 9292000 199 189,814 9542001 195 188,596 9672002 186 222,496 11962003 202 275,585 13642004 215 318,103 1480Source: Instituto Costarricense de Turismo (ICT). 2004. Anuario de Turismo, 2003.
Table 4: Cruise ship arrivals to Costa Rica, by port, 2002-2004.
Pacific (Calderas, Puntarenas, Golfito)
Caribbean (Moin, Puerto Limon)
Total Year
Ships Tourists Ships Tourists Ships Tourists
Tourists per ship
2002 81 79,721 105 142,775 186 222,496 11962003 74 85,035 128 190,055 202 275,585 13642004 62 84,528 153 233,575 215 318,103 1480Source: Instituto Costarricense de Turismo (ICT). 2004. Anuario 2003.
20

Table 5: Seasonal Variation in Costa Rica Cruise Ship Tourism, 2001-2003
2001 2002 2003 Month Visitors % of total Visitors % of total Visitors % of total
January 16547 16 13026 9 27677 15February 18782 18 24652 17 26073 14March 16008 16 29690 21 30770 16April 11002 11 14540 10 15647 8May 0 0 5319 4 0 0June 0 0 2252 2 0 0July 0 0 2392 2 0 0August 0 0 2399 2 0 0September 0 0 3915 3 0 0October 7477 7 5560 4 11291 6November 12388 12 16346 11 29293 15December 20698 20 22684 16 49799 26Total 102902 100 142775 100 190550 100Source: Instituto Costarricense de Turismo (ICT). 2004. Anuario 2002, 2003.
Table 6: Provider Concentration of Cruise Ship Tourism in Costa Rica, 1999-2003
1999 2000 2001 2002 2003 Ships # % # % # % # % # % Carnival+Princess+Holland America 74 29 64 32 61 31 68 37 76 38Royal Caribbean+Celebrity 38 15 29 15 31 16 37 20 51 25Chrystal 17 7 9 5 8 4 7 4 9 4Top 2 Total 112 44 93 47 92 47 105 56 127 63Overall Total 253 100 199 100 195 100 186 100 202 100Source: Based on data provided in ICT—Anuario, 2003
21

Table 7: Characteristics of Costa Rican Cruise Ship Tourists, 2003 All Tourists All Cruise Tourists Puntarenas Limon Residence (% yes) USA 52.9 63.4 49 65.6 Europe 16.9 16.6 15.5 16.8 Canada 9.7 11.9 24.7 9.9First visit (% yes) 59.8 83.5 72.8 85.0Passenger or Employee (% passenger) 100.0 90.3 81.4 91.6Travel Companions (% in category) Couples 46.3 48.1 46 Families 26.6 20.9 27.4 W/ Friends 14.4 18.4 13.8Marital status (% married) 71.6 69.6 71.9Education University 81.5 61.4 53.1 62.7 Secondary 15.9 32.2 38.7 31.2Age (% in category) >66 yrs 7.7 (>60 yrs) 27.7 27.8 27.6 56-65 yrs 19.6 (50-60 yrs) 34.0 31.4 34.4 46-55 yrs 22.5(40-50 yrs) 17.9 11.9 18.9 36-45 yrs 26.9(30-40 yrs) 8.9 12.9 8.3Income (% in category) $76K-100K 23.9 4.6 26.9 $61K-75K 27.6 14.4 29.6 $41K-60K 18.6 21.6 18.2 $25K-40K 6.3 20.6 4.1 <$25K 3.1 14.9 1.3Source: ICT Tourist Survey 2003
Table 8: Tour purchases by Costa Rica cruise tourists Puerto Limon-Moin Puerto Caldera-
Puntarenas Total
Purchased tour on board 59.2% 39.9% 56.8% Cost and average duration $85.35- 5 hrs $72.41- 6 hrs $84.32 – 5 hrsPurchased tour at local agency 8.6% 3.8% 8% Cost and average duration $48.12 – 4 hrs $29.17 – 3 hrs $46.94 – 4hrsSelf guided tour 0.9% - 3 hrs 11.4% - 4 hrs 2.1% - 4 hrsAverage time off ship 4.24 hrs
(min = 1; max = 10)4.41 hrs
(min = 3; max = 8) 4.26 hrs
(min = 1; max = 10)Average expenditures off ship $36 $26 $34Source: ICT Tourist Survey, 2003
22
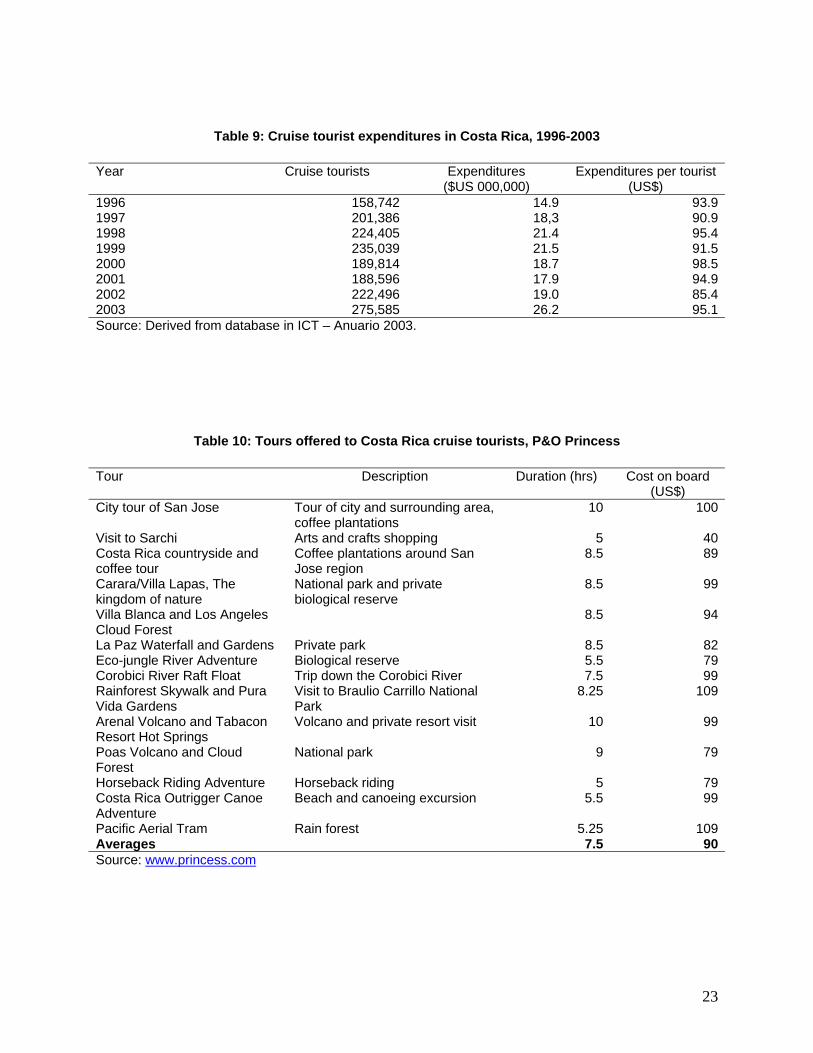
Table 9: Cruise tourist expenditures in Costa Rica, 1996-2003 Year Cruise tourists Expenditures
($US 000,000) Expenditures per tourist
(US$) 1996 158,742 14.9 93.91997 201,386 18,3 90.91998 224,405 21.4 95.41999 235,039 21.5 91.52000 189,814 18.7 98.52001 188,596 17.9 94.92002 222,496 19.0 85.42003 275,585 26.2 95.1Source: Derived from database in ICT – Anuario 2003.
Table 10: Tours offered to Costa Rica cruise tourists, P&O Princess Tour Description Duration (hrs) Cost on board
(US$) City tour of San Jose Tour of city and surrounding area,
coffee plantations 10 100
Visit to Sarchi Arts and crafts shopping 5 40Costa Rica countryside and coffee tour
Coffee plantations around San Jose region
8.5 89
Carara/Villa Lapas, The kingdom of nature
National park and private biological reserve
8.5 99
Villa Blanca and Los Angeles Cloud Forest
8.5 94
La Paz Waterfall and Gardens Private park 8.5 82Eco-jungle River Adventure Biological reserve 5.5 79Corobici River Raft Float Trip down the Corobici River 7.5 99Rainforest Skywalk and Pura Vida Gardens
Visit to Braulio Carrillo National Park
8.25 109
Arenal Volcano and Tabacon Resort Hot Springs
Volcano and private resort visit 10 99
Poas Volcano and Cloud Forest
National park 9 79
Horseback Riding Adventure Horseback riding 5 79Costa Rica Outrigger Canoe Adventure
Beach and canoeing excursion 5.5 99
Pacific Aerial Tram Rain forest 5.25 109Averages 7.5 90Source: www.princess.com
23
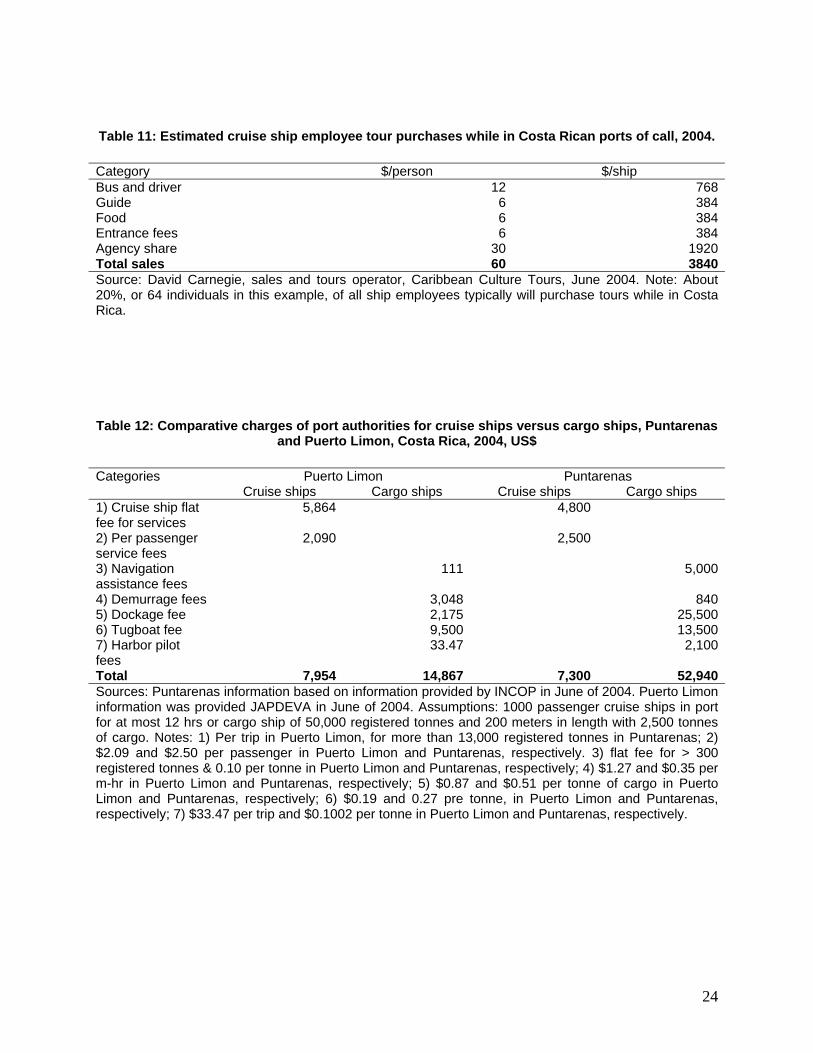
Table 11: Estimated cruise ship employee tour purchases while in Costa Rican ports of call, 2004. Category $/person $/ship Bus and driver 12 768Guide 6 384Food 6 384Entrance fees 6 384Agency share 30 1920Total sales 60 3840Source: David Carnegie, sales and tours operator, Caribbean Culture Tours, June 2004. Note: About 20%, or 64 individuals in this example, of all ship employees typically will purchase tours while in Costa Rica.
Table 12: Comparative charges of port authorities for cruise ships versus cargo ships, Puntarenas and Puerto Limon, Costa Rica, 2004, US$
Categories Puerto Limon Puntarenas Cruise ships Cargo ships Cruise ships Cargo ships 1) Cruise ship flat fee for services
5,864 4,800
2) Per passenger service fees
2,090 2,500
3) Navigation assistance fees
111 5,000
4) Demurrage fees 3,048 8405) Dockage fee 2,175 25,5006) Tugboat fee 9,500 13,5007) Harbor pilot fees
33.47 2,100
Total 7,954 14,867 7,300 52,940Sources: Puntarenas information based on information provided by INCOP in June of 2004. Puerto Limon information was provided JAPDEVA in June of 2004. Assumptions: 1000 passenger cruise ships in port for at most 12 hrs or cargo ship of 50,000 registered tonnes and 200 meters in length with 2,500 tonnes of cargo. Notes: 1) Per trip in Puerto Limon, for more than 13,000 registered tonnes in Puntarenas; 2) $2.09 and $2.50 per passenger in Puerto Limon and Puntarenas, respectively. 3) flat fee for > 300 registered tonnes & 0.10 per tonne in Puerto Limon and Puntarenas, respectively; 4) $1.27 and $0.35 per m-hr in Puerto Limon and Puntarenas, respectively; 5) $0.87 and $0.51 per tonne of cargo in Puerto Limon and Puntarenas, respectively; 6) $0.19 and 0.27 pre tonne, in Puerto Limon and Puntarenas, respectively; 7) $33.47 per trip and $0.1002 per tonne in Puerto Limon and Puntarenas, respectively.
24
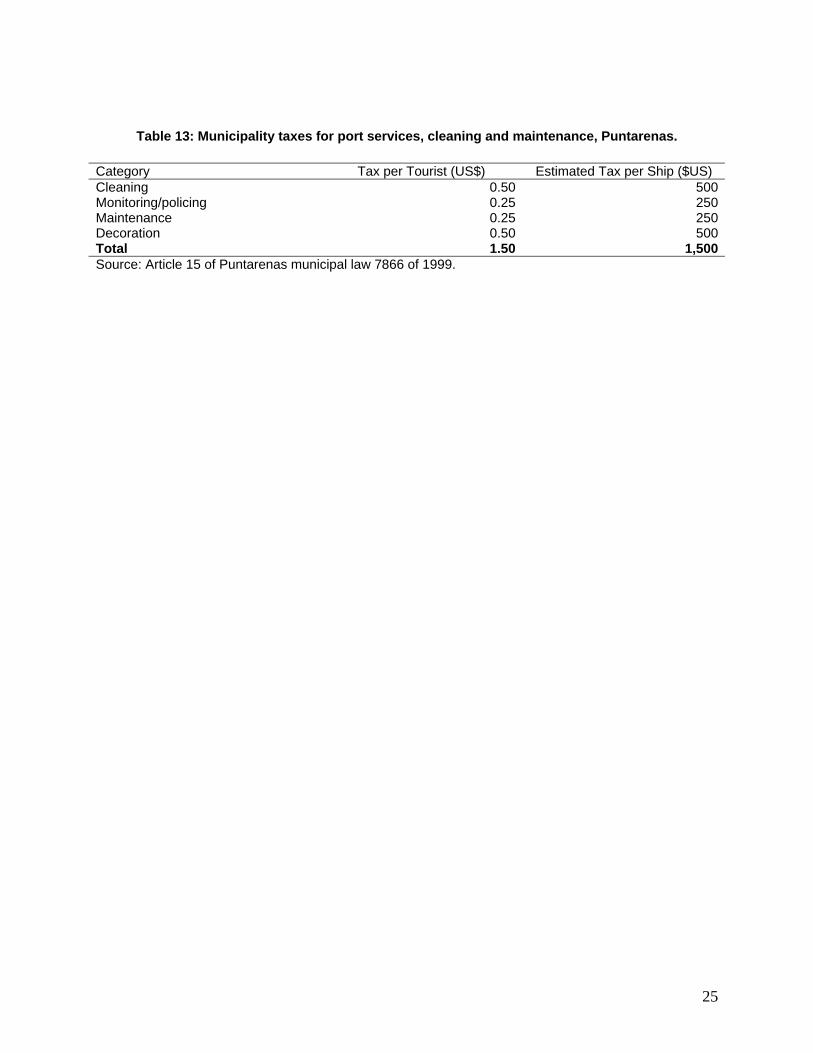
Table 13: Municipality taxes for port services, cleaning and maintenance, Puntarenas. Category Tax per Tourist (US$) Estimated Tax per Ship ($US) Cleaning 0.50 500Monitoring/policing 0.25 250Maintenance 0.25 250Decoration 0.50 500Total 1.50 1,500Source: Article 15 of Puntarenas municipal law 7866 of 1999.
25
RESOURCES Barry, Tom, Beth Wood, and Deb Preusch. 1984. The other side of paradise: Foreign control in
the Caribbean. New York, Grove Press. 77 pp. Blue Water News. 2004. Website accessed: October 1, 2004. Bonn Marketing Research Group for the Tampa Bay Convention and Visitors Bureau. 2001.
2001 Annual Visitors Study for Tampa/Hillsborough County. Braun, Bradley, M., Xander, James, A., and Kenneth R. White. 2002. The impact of the cruise
industry on a region’s economy: a case study of Port Canaveral, Florida. Tourism Economics. 8:3: 281-288.
Business Research and Economic Advisors (BREA). 2004. The contribution of the North
American Cruise Industry to the US Economy in 2003. International Council of Cruise Lines. August 2004. 81 pages.
Caribbean Tourism Organization (CTO). 2004. Barbados tourism minister calls for independent
study on impact of cruise and land based tourism. Caribspeak, October 19, 2004. http://news.caribseek.com/set-up/exec/view.cgi?archive=46&num=4776
Caribbean Tourism Organization (CTO). 2003. Caribbean Tourism Statistical Report. Barbados. Costa Rican Tourism Institute (ICT). 2004a. Annual Statistics-2003. Costa Rican Tourism Institute (ICT). 2004b. Annual Statistics for cruise ships-2003. Douglas, Ngaire and Norman Douglas. 1999. Cruise consumer behavior: A comparative study.
Pp 369-392. In: Consumer behavior in travel and tourism. Pizam, Abraham and Yoel Mansfeld, eds. Haworth Hospitality Press: New York.
Dwyer, Larry, Douglas, Ngaire, and Zelco Livaic. 2004. Estimating the economic contribution of
a cruise ship visit. Tourism in Marine Environments. 1(1), 5-16. Economist. 1998. Floating fantasy. Travel and tourism survey, the Economist. 01/10/1998, V
346, I 8050, p 14. Fish, Mary and William D. Gunther. 1994. Small island economies, tourism and political crises.
In: External linkages and growth in small economies. McKee, David L., ed. Praeger: Westport, Connecticut. Pp 82-112.
Gabe, Todd, Lynch, Colleen, McConnon, James and Thomas Allen. 2003. Economic impact of
cruise ship passengers in Bar Harbor, Maine. REP Staff Paper 518. Department of Resource Economics and Policy, University of Maine, Orono. March 2003.
Guiliano, F., Pratt, L., Castro, R., and A.M. Majano. 2004. El impacto del turismo de cruceros en
Costa Rica. INCAE, Costa Rica.
26
Johnson, D. 2002. Environmentally sustainable cruise tourism: a reality check. Marine Policy. 26, 261-270.
Hall, J.A., and R. Braithwaite. 1990. Caribbean cruise tourism: a business of transnational
partnerships. Tourism Management. 1990, 11 (4): 339-47. Henthorne T.L. 2000. An analysis of expenditures by cruise ship passengers in Jamaica.
Journal of Tourism Research. 2000, 38: 246-50. The International Ecotourism Society (TIES). 2004. Eco Currents. Special feature: The cruise
industry. Laura Ell and Anne Marie Moore, eds. The International Ecotourism Society. Second/Third Quarter, 2004.
Kester, John G.C. 2002. Cruise tourism. Tourism Economics, 2002, 9(3): 337-350. Klein, R. 2003a. Cruising-out of control: The cruise industry, the environment, workers, and the
Maritimes. March, 2003. Canadian Centre for Policy Alternatives-Nova Scotia. http://www.policyaltneratives.ca 24 pp.
Klein, R. 2003b. Charting a course: The cruise industry, the government of Canada, and
purposeful development. September 2003. http://www.kahea.org/ocean/pdf/charting-a-course.pdf
Klein, R., 2002. Cruise ship blues: The underside of the cruise industry. Gabriola Island: New
Society Publishers. Mamoozadeh, Abbas and McKee, David L. 1994. Cruise-ship tourism and small island
economies: An economic perspective. In: External linkages and growth in small economies. McKee, David L., ed. Praeger: Westport, Connecticut. Pp 103-114.
McDowell Group, Inc. 2000. The economic impacts of the cruise industry in Southeast Alaska.
October 2000. 39 pages. McKee, David L. 1986. Tourism and the planning of Third World infrastructures. Foreign Trade
Review. 21, 2. September 1986, pp 148-156. McKee, David L. 1988. Some reflections on cruise ships and the economic development of
small island nations. Canadian Journal of Development Studies. December, 1988. 9: 2. Pp 249-259.
McKee, David L. and Mamoozadeh, Abbas. 1994. Cruise Ships in the Third World:
Developmental versus corporate financial objectives. In: External linkages and growth in small economies, McKee, D.L., ed. Pp. 91-101. Westport, Conn. and London: Greenwood, Praeger.
McKee, David L., ed. 1994. External linkages and growth in small economies. Westport, Conn.
and London: Greenwood, Praeger. Negri, Andrew P. and Andrew J. Heyward. 2000. Inhibition of fertilization and larval
metamorphosis of the coral Acropora millepora (Ehrenberg, 1834) by petroleum products. Marine Pollution Bulletin. 41: 7 (2000): 420-427.
27
Negri, Andrew P., Heyward, Andrew J., Smith, Luke P., and Nicole S. Webster. 2002. Understanding ship-grounding impacts on a coral reef: Potential effects of anti-foulant paint contamination on coral recruitment. Marine Pollution Bulletin. 44: 2 (February 2002): 111-117.
Pattullo, Polly. 1996a. Sailing into the sunset: The cruise-ship industry. Pp 156-177. In: Last
resorts: The cost of tourism in the Caribbean. Cassell: London. Pattullo, Polly. 1996b. Last resorts: The cost of tourism in the Caribbean. Monthly Review
Press, New York. Price Waterhouse Coopers for Florida-Caribbean Cruise Association (FCCA). Economic impact
of the Cruise Industry on the Caribbean. 2001 (2002, 03, 04?). http://www.f-cca.com/pages/research.html.
Uebersax, M.B. 1996. Indecent proposal: cruise ship pollution in the Caribbean. 1996.
http://www.planeta.com/planeta/96/0896cruise.html Wood, Thomas W. 1982. The economics of mixed cargo and cruise ship traffic in a port. Journal
of Transport Economics and Policy. January 1982. Pp 43-53.
28