community epidemiology report november 2014cdn.trustedpartner.com/docs/library...drug trends update...
TRANSCRIPT

Drug Trends Update Nov 2014
Jim Hall [email protected] 1
Community Epidemiology Report
November 2014
Drug Abuse Trends Update Broward County and
South Florida
James N. Hall, Epidemiologist
Center for Applied Research on
Substance Use and Health Disparities
Nova Southeastern University

Drug Trends Update Nov 2014
Jim Hall [email protected] 2
a-pyrrolidinovalerophenone
“Flakka”
alpha-PVP
• Flaca – Skinny • Flakka – Beautiful, elegant woman who charms all • Wakka Flakka – Hip-Hop DJ • Elsewhere called
“Gravel”
Chemical structures of Synthetic Cathinones Pyrrolidinophenone compounds in comparison to MDPV

Drug Trends Update Nov 2014
Jim Hall [email protected] 3
Toxic Effects: • Tachycardia, • Agitation, • Psychosis, • Violent behavior, • Excited Delirium • Hyperthermia • Kidney failure • Death
South Florida Crime a-PVP Lab Cases:
• 2012 - 2 • 2013 - 6 • 2014 - 120 +
Top 10 Most Frequently Identified Drugs of Total Reports
from South Florida Crime Labs Reports CY 20131
Drug 2013 % Δ vs. 2012
Cocaine 10,147 Down 11 %
Marijuana/Cannabis/THC 5,276 Down 2 %
Methylone (N-Methyl-3,4-Methylenedioxycathinone) 1,194 Up 208 %
Hallucinogen 984 Up 88 %
Rx Opioids 933 Down 4 %
Heroin 925 Up 33 %
Rx Benzodiazepines 849 Down 4 %
Methamphetamine 211 Up 24 %
Phenylimidothiazole Isomer 154 Down 37 %
Caffeine 131 Down 45 %
All Other Analyzed Drugs 2,272 Down 18 %
Total 23,069 Down 3 %
Source: US DEA – National Forensic Laboratory Information System as of May 9, 2014
Drug Trends Update Nov 2014
Jim Hall [email protected] 4
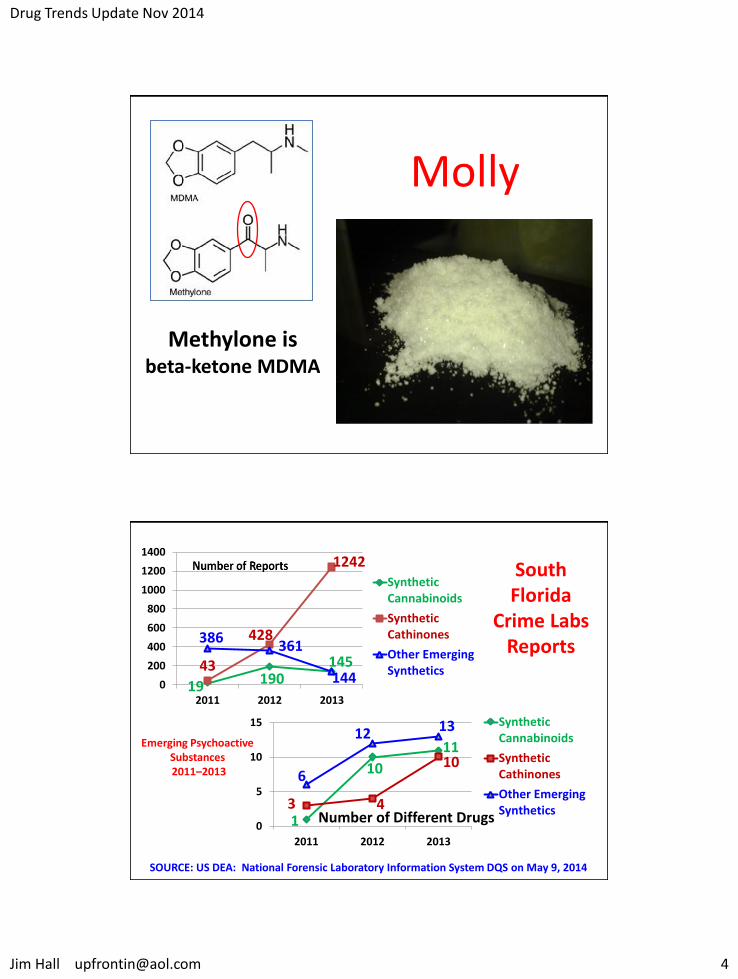
Methylone is beta-ketone MDMA
Molly
South Florida
Crime Labs Reports
SOURCE: US DEA: National Forensic Laboratory Information System DQS on May 9, 2014
Emerging Psychoactive Substances 2011–2013
19 190 145 43
428
1242
386 361
144 0
200
400
600
800
1000
1200
1400
2011 2012 2013
SyntheticCannabinoids
SyntheticCathinones
Other EmergingSynthetics
1
10
11
3 4
10 6
12 13
0
5
10
15
2011 2012 2013
SyntheticCannabinoids
SyntheticCathinones
Other EmergingSyntheticsNumber of Different Drugs

Drug Trends Update Nov 2014
Jim Hall [email protected] 5
Emerging 169 Synthetic Drug Deaths in Florida - 2023
6
31
5
20
101
6 0
20
40
60
80
100
120
140
Cannabinoids Cathinones Other Synthetics
Present
Cause of Death
26
132
11
# o
f D
rug
Occ
urr
en
ces
Source: FDLE – Florida Medical Examiners Commission, November 2014
2C Phenethylamines 2C-B

Drug Trends Update Nov 2014
Jim Hall [email protected] 6
Percent of High School Males Reporting Having Used Synthetic Marijuana Florida and
Broward County - 2012
15.1 % 12.4 %
5.3 % 3.9%
0%
2%
4%
6%
8%
10%
12%
14%
16%
18%
20%
FloridaLifetime
BrowardLifetime
Florida Past30 Days
Broward Past30 Days
Source: Florida Youth Substance Abuse Survey 2012

Drug Trends Update Nov 2014
Jim Hall [email protected] 7
Methamphetamine Arrests Broward County, FL: Jan 2010–July 2014 n=168
10% 17% 17%
38%
18%
0%
20%
40%
2010 2011 2012 2013 1st H2014
Percent By Year
1% 7%
28% 64%
Percent By Race/Gender
Black Female
White Female
Black Male
White Male0%
10%
20%
30%
40%
< 20 20's 30's 40's 50's 60's
2%
35%
26% 27%
9%
1%
Percent By Age

Drug Trends Update Nov 2014
Jim Hall [email protected] 8
Methamphetamine Trends
So FL Crime Labs 2012 2013 Δ 2012 vs. 2013
3 SE FL Counties 170 211 Up 24 %
Related Deaths 2012 2013 Δ 2012 vs. 2013
State of Florida 146 169 Up 16 %
Primary Treatment 2011 2012 Δ 2011 vs. 2012
State of Florida 1.6 % 2 % Up 25 %
Rx Nonmedical Use in Florida 2000 -2013
Responding to an Epidemic
Drug Trends Update Nov 2014
Jim Hall [email protected] 9
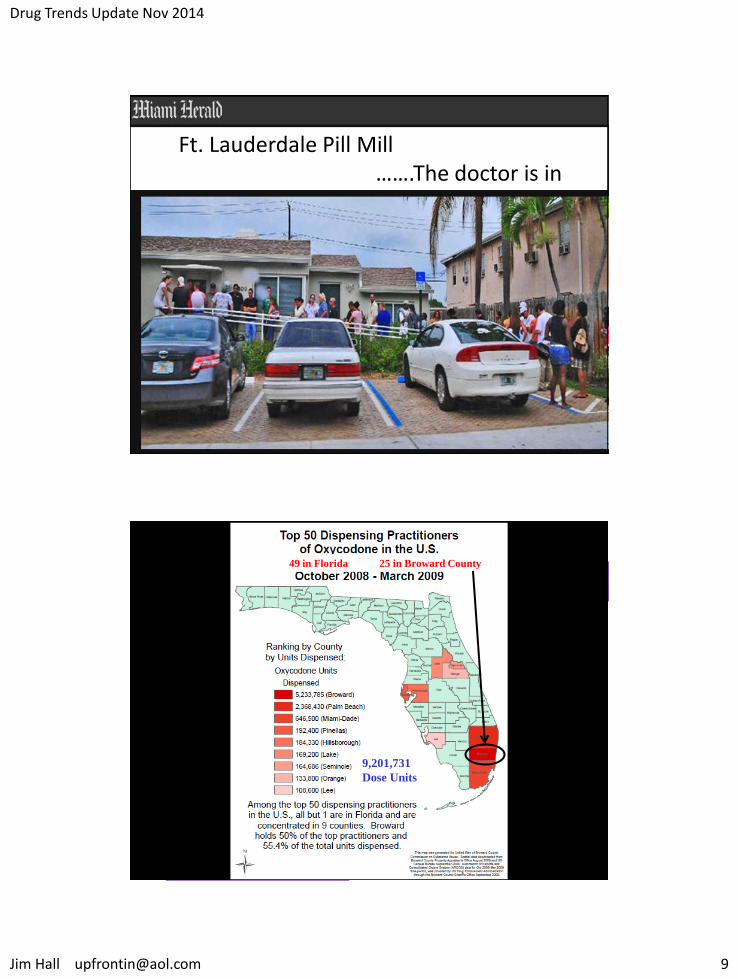
Ft. Lauderdale Pill Mill …….The doctor is in
9,201,731
Dose Units
49 in Florida 25 in Broward County

Drug Trends Update Nov 2014
Jim Hall [email protected] 10
Florida’s Response
• July 2010 – Senate Bill 2272 Legal authority to close “Pill Mills” and limited practitioner dispensing of CS Schedule II to 3-day supply
• August 2010 – Tamper-resistant OxyContin®.
• March 2011 – Law Enforcement Strike Force
• July 2011 - House Bill 7095 Comprehensive law bans practitioner dispensing of CS II and new regulations. Permits PDMP to operate.
Number of Selected Lethal Rx Opioid Occurrences Among Deceased Persons in Florida 2008 to 2013
Source: FDLE – Drugs Identified In Deceased Persons by Florida Medical Examiners Jan 2008 - Dec 2013 Reports
# “C
ause
of
De
ath
” O
ccu
rre
nce
s
476 465 533
652 715
801
607
640
392 343
279 255
337 336 380
340 336 358
341
350 274
238 221 168 153
147 160 142
110 152
144 201 176
239 268
300
141 129 136 129
139 176
136 171 118 126 158
133
0
100
200
300
400
500
600
700
800
900
Oxycodone
Methadone
Morphine
Hydrocodone
House Bill 7095 Takes effect
CS-II Dispensing Limits & OxyContin Tamper Resistant Strike Force

Drug Trends Update Nov 2014
Jim Hall [email protected] 11
Number of Unique Patients Identified By Threshold Levels Number of Prescribers and Number of Pharmacies
by Quarter 2012-2013
Level 5
Level 6
Level 7
Level 8
Levels 9, 10 15 Source: 2012-2013 Annual Report
Florida’s Prescription Drug Monitoring Program (PDMP)
3,000
500
5 Prescribers & 5 Pharmacies
2,864
1,415 1,097
427
514
178
51-% Decrease
Grams of Oxycodone Sales in Florida Per 100,000 Population
63,325
28,808 21,614
0
10,000
20,000
30,000
40,000
50,000
60,000
70,000
2009 2010 2011 2012 2013
Grams Sold Per 100,000 Population
National Rank Among States and Territories
# 1
# 19
# 22
Source: US Drug Enforcement Administration – ARCOS Automation of Reports and Consolidated Orders System
Gra
ms
of
Oxy
cod
on
e S
old
pe
r 1
00
,00
0
Drug Trends Update Nov 2014
Jim Hall [email protected] 12
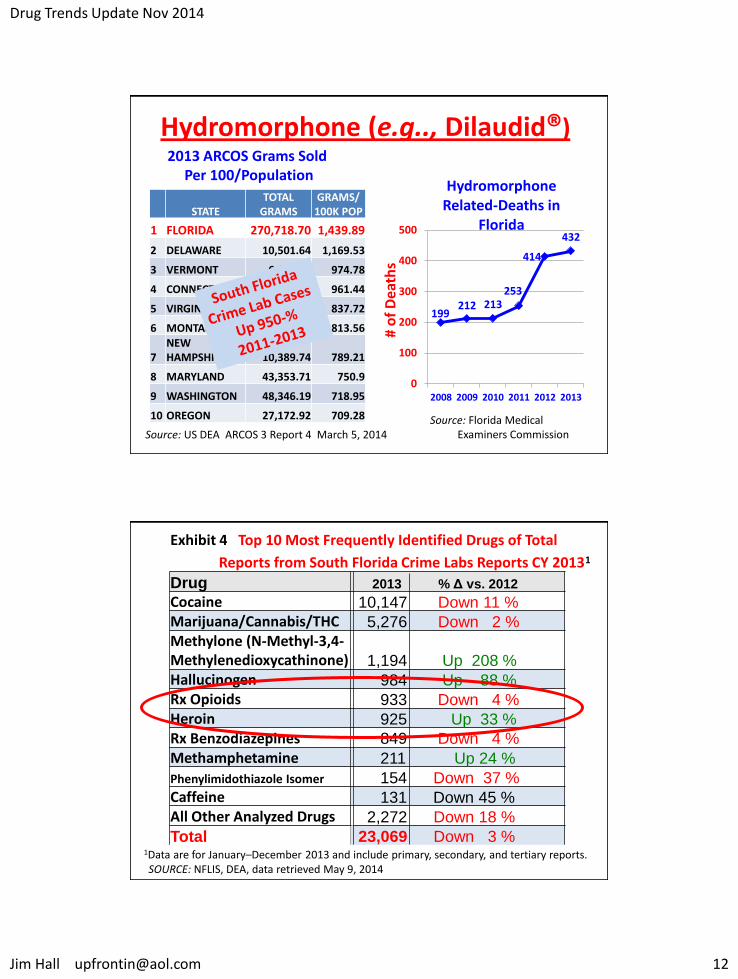
Hydromorphone (e.g.., Dilaudid®)
STATE TOTAL
GRAMS GRAMS/
100K POP
1 FLORIDA 270,718.70 1,439.89
2 DELAWARE 10,501.64 1,169.53
3 VERMONT 6,099.61 974.78
4 CONNECTICUT 34,362.81 961.44
5 VIRGINIA 67,026.15 837.72
6 MONTANA 8,049.45 813.56
7 NEW HAMPSHIRE 10,389.74 789.21
8 MARYLAND 43,353.71 750.9
9 WASHINGTON 48,346.19 718.95
10 OREGON 27,172.92 709.28
199 212 213
253
414
432
0
100
200
300
400
500
2008 2009 2010 2011 2012 2013
Hydromorphone Related-Deaths in
Florida
# o
f D
eath
s
2013 ARCOS Grams Sold Per 100/Population
Source: US DEA ARCOS 3 Report 4 March 5, 2014 Source: Florida Medical Examiners Commission
Exhibit 4 Top 10 Most Frequently Identified Drugs of Total
Reports from South Florida Crime Labs Reports CY 20131
Drug 2013 % Δ vs. 2012
Cocaine 10,147 Down 11 %
Marijuana/Cannabis/THC 5,276 Down 2 %
Methylone (N-Methyl-3,4-Methylenedioxycathinone) 1,194 Up 208 %
Hallucinogen 984 Up 88 %
Rx Opioids 933 Down 4 %
Heroin 925 Up 33 %
Rx Benzodiazepines 849 Down 4 %
Methamphetamine 211 Up 24 %
Phenylimidothiazole Isomer 154 Down 37 %
Caffeine 131 Down 45 %
All Other Analyzed Drugs 2,272 Down 18 %
Total 23,069 Down 3 % 1Data are for January–December 2013 and include primary, secondary, and tertiary reports. SOURCE: NFLIS, DEA, data retrieved May 9, 2014

Drug Trends Update Nov 2014
Jim Hall [email protected] 13
Number of Heroin Deaths in Florida: 2000 –2013
276
328 326
261
180
122
96 110
132
111
58 62
117
199
15
57
36 27
26
17 8 10 6 6 4
12
6 20
61
39
46
32
18
22 20 26 38
30 26 15
33 40
0
50
100
150
200
250
300
350
2000 2001 2002 2003 2004 2005 2006 2007 2008 2009 2010 2011 2012 2013
Florida
Palm Beach
Broward
Miami-Dade
# H
ero
in D
eath
s
SOURCE: Florida Medical Examiners Commission Reports 2000-2013
11

Drug Trends Update Nov 2014
Jim Hall [email protected] 14
Number of Heroin Deaths in Florida: 2000 – 2013
15
57
36
27 26
17
8
10
6 6 4
12
6
20
17
53 50 49
35
17 13
4
17
8 5
3
9 11
61
39
46
32
18
22 20
26
38
30 26
15
33
40
0
10
20
30
40
50
60
70
2000 2001 2002 2003 2004 2005 2006 2007 2008 2009 2010 2011 2012 2013
Palm Beach
Broward
Miami-Dade
# H
ero
in D
eath
s
SOURCE: Florida Medical Examiners Commission Reports 2000-2013
Heroin Trends Related Deaths 2012 2013 Δ 2012 vs. 2013
State of Florida 117 199 Up 70 %
Palm Beach County 6 20 Up 233 %
Broward County 9 11 Up 22 %
So FL Crime Labs 2012 2013 Δ 2012 vs. 2013
3 SE FL Counties 696 925 Up 33 %
Primary Treatment 2011 2012 Δ 2011 vs. 2012
State of Florida 2.2 % 3.2 % Up 45 %

Drug Trends Update Nov 2014
Jim Hall [email protected] 15
Among Florida Youth “Most Don’t”
Drink, Smoke, or Take Drugs
Screening, Brief Intervention, Referral to Treatment