community health needs assessment - cleveland clinic
TRANSCRIPT

1
Community Health Needs Assessment
2
Table of Contents
Executive Summary 3
Background
Purpose of the Community Health Needs Assessment 5
Description of Hospital Facility 5
Definition of the Community Served 6
Processes and Methods
Approach 7
Secondary Data
Primary Data
8
Community Leader Interviews 9
Community Resident Focus Groups 10
Other Health Needs Assessments
11
Process Used to Identify Significant Health Needs 11
Summary of Results 12
Potential Measures and Resources 18
External Community Resources 18
Edwin Shaw Rehabilitation Institute Internal Resources 18
To Request Copies and for More Information 20
Appendix 1: Primary Data 21
Appendix 2: Secondary Data 26
Appendix 3: Actions Taken Since the Previous CHNA 80

Community Health Needs Assessment
3
EXECUTIVE SUMMARY
The Edwin Shaw Rehabilitation Institute (ESRI) is a hospital facility operated by Akron General Medical Center. Since its beginning in 1918 as the Springfield Lake Tuberculosis Sanitarium, ESRI has provided programs and services to meet the rehabilitation needs of those in the community with physical disabilities or chemical dependency issues. ESRI has conducted and participated in various surveys throughout its history that were designed to assess the health needs of the community it serves. Such surveys have been used for program development, staffing and facility planning, and to meet the requirements of various accrediting organizations. All have been designed to result in the delivery of progressively better services meant to improve the health of the community. The assessment presented here is intended to continue that progression, as well as satisfy the requirement to conduct a Community Health Needs Assessment (CHNA), as described in Internal Revenue Code section 501(r)(3) and related guidance.
In 2015, ESRI became a member of the Cleveland Clinic, bringing additional resources to the community served by ESRI as well as making a number of highly specialized, Cleveland Clinic-based services more easily accessible to that community.
The Kent State University College of Public Health (KSU) was engaged to conduct the ESRI CHNA. During the CHNA process, epidemiologic data for ESRI’s service area were reviewed and compared to the rates for two peer counties, the state, the nation, and the Healthy People 2020 objectives. Input was also obtained from community leaders through personal interviews and from community residents via focus groups, and CHNAs conducted by other community groups were consulted. All of this information was used to develop a list of significant health needs for ESRI’s service area. The methods used to identify these significant health needs are described later in this document.
Six significant health needs were identified through this assessment:
1. Access to Affordable Health Care
2. Chronic Diseases and Other Health Conditions
3. Economic Development and Community Condition
4. Health Professions Education and Research
5. Health Care for the Elderly
6. Wellness
Community Health Needs Assessment
4
Access to Affordable Health Care includes three dimensions: Physical accessibility, defined as the availability of good health services within reasonable reach of those who need them and of opening hours, appointment systems and other aspects of service delivery that allow people to obtain the services when they need them; Financial affordability defined as people’s ability to pay for services without financial hardship. Affordability is influenced by the wider health financing system and by household income; and, Acceptability including people’s willingness to seek services.
Chronic Diseases and other Health Conditions are usually defined as a disease persisting for three months or more that generally cannot be prevented by vaccination, cured by medicine, or will just disappear. Examples include asthma, cancers, cardiovascular disease, diabetes, mental health and COPD. Many other health conditions that we have included in this category, such as infant mortality and obesity have close links to lifestyle choices such as physical inactivity, poor nutrition, avoidance of medical care, tobacco use and drug and alcohol abuse.
Economic Development and Community Condition define the state of a community in which people reside. It includes the assets community residents possess and share that determine the quality of their life, including physical, human, social, financial and environmental.
Health Professions Education and Research involves the education, development and support of physicians and other health care professionals in the practice of medicine and/or medical research. Medical research can range in methodology from randomized control trials to case studies. The purpose of this research is to generate high quality knowledge that can be used to promote, restore or maintain the health status of people.
Health Care for the Elderly includes services provided to older individuals or communities for the purpose of promoting, maintaining, monitoring or restoring health. The definition of “older person” varies across cultures but is generally considered to be age 65 and above in the United States. Elderly persons tend to have a higher prevalence of chronic disease, physical disability, mental illness and other co-morbidities.
Wellness can be defined to be an active process of becoming aware and being able to make healthy choices that lead to a healthier and more successful existence. It is closely linked to lifestyle and the choices one makes.

Community Health Needs Assessment
5
BACKGROUND
Purpose of the Community Health Needs Assessment The Patient Protection and Affordable Care Act (ACA) has brought significant changes to the U.S. health care system, including the addition of Internal Revenue Code (IRC) section 501(r), applicable to hospital organizations exempt from federal income tax. Within IRC 501(r) is the requirement for such a hospital organization to conduct, once every three years, a Community Health Needs Assessment (CHNA) for each hospital facility it operates. The Internal Revenue Service (IRS) is charged with enforcing these new requirements, and has issued guidance for hospital facilities to follow in order to comply with the law. This guidance states that a CHNA report should include:
The community served and how it was defined.
The process and methods used to conduct the assessment, including the sources and dates of the data and other information used in the assessment and the analytical methods applied to identify community health needs.
The information gaps that impact the ability to assess health needs.
Collaborating hospitals and vendors used while conducting the CHNA.
How input was received from persons who have expertise in public health and from persons who represent the broad interests of the community, including a description of when and how these persons were consulted.
The prioritized community health needs, including a description of the process and criteria used in prioritizing the health needs.
Existing health care facilities and other resources within the community available to meet the prioritized community health needs.
A tax exempt hospital facility is also required to produce an Implementation Strategy that outlines some of the efforts intended to address the needs identified in the CHNA. Information about the impact of the 2013 Implementation Strategy can be found in Appendix 3 of this document.
Thus, the purpose of this CHNA is to build upon a history of collaborative efforts aimed at improving community health. This report will also act as a resource for other community groups working toward improving the health of the community. In addition, this report will fulfill the CHNA requirements established by the ACA for the hospital facilities listed.
Description of Hospital Facility The Edwin Shaw Rehabilitation Institute (ESRI) is an inpatient rehabilitation hospital offering physical medicine and rehabilitative services. Its inpatient services focus primarily on patients recovering from traumatic brain injury, strokes, amputations, and spinal cord injury. ESRI’s outpatient services include those related to its inpatient services, but also include abstinence-based and medication-assisted treatment programs for alcohol and chemical dependencies. The facility has 35 licensed beds.

Community Health Needs Assessment
6
In 2015, ESRI became a member of The Cleveland Clinic, bringing additional resources to the community served by ESRI as well as making a number of highly specialized, Cleveland Clinic-based services more easily accessible to that community.
Definition of the Community Served The facility is located at 330 Broadway East in Cuyahoga Falls, in central Summit County, Ohio. The facility provides inpatient and outpatient rehabilitation services to adults recovering from and or adjusting to physical challenges resulting from illness, surgery, and injury. ESRI also treats adults dealing with substance abuse issues. Since this population can include expectant mothers and parents, children are often an important part of this particular community it serves. While the facility welcomes patients from communities throughout Northeast Ohio and beyond, 2015 patient discharge data show that the vast majority of patients reside in Summit County.
Thus for purposes of the CHNA, ESRI defines the community it serves as consisting of adults with physical challenges or substance abuse issues – and the families of such persons – in Summit County, Ohio.

Community Health Needs Assessment
7
Summit County As of 2015, it is estimated that there are over 541,000 people living in Summit County. Since 2010, the population size has increased slightly by less than a percent. There are 31 cities, villages, and townships located in Summit County, with the largest being the City of Akron. Compared to the State of Ohio, Summit County has a slightly smaller proportion of children (under 18 years old) and a slightly higher proportion of older adults (65 years and older). In Summit County, 20.5% percent of the population is non-White, compared to 17.3% in the State. Educational attainment is slightly higher in Summit County than the State of Ohio, with 90.7% having a high school diploma or higher and 29.9% having a bachelor’s degree or higher. Similarly, annual per capita income in Summit County is slightly higher than the State of Ohio, but the percent of Summit County residents living in poverty is 2.2% lower than that of the State.
PROCESSES AND METHODS
Approach The Edwin Shaw Rehabilitation Institute (ESRI) engaged Kent State University’s College of Public Health (KSU) to collect and analyze the data that serves as the foundation of the 2016 Community Health Needs Assessment (CHNA). That engagement was coordinated with similar engagements KSU had with neighboring, unrelated hospital facilities: Summa Health System and Akron Children’s Hospital.
Under KSU guidance, meetings were held to identify the process to be used to conduct the CHNA. This was determined primarily by the specific requirements of CHNAs mandated by the IRS. A work plan with anticipated timelines was also created; this became part of the contract addendum.
To conduct the 2016 Community Health Needs Assessment, KSU followed several recommendations offered by the Catholic Health Association of the United States in its 2015 second edition of Assessing and Addressing Community Health Needs. Specifically, KSU used a comparison benchmarking approach using epidemiological data, supplemented with qualitative data from focus groups with residents throughout the hospital service area as well as personal interviews with community and organizational leaders knowledgeable about health issues. In addition, other health status reports, such as Health Department Community Health Improvement Plans (CHIPs), were reviewed for their contribution
After the data were collected and reported to the three hospitals in a group meeting on June 1, 2016, a series of individual hospital meetings were held to identify the prioritized health needs based on the epidemiologic data, the input from community leaders and residents, input from Health Commissioners and other CHNAs that had been previously been conducted.
Implementation strategies were developed that identified the plans the hospitals will undertake separately and collectively to address some of the prioritized health needs identified in the CHNAs. ESRI’s plans will be publicly available at www.clevelandclinic.org/CHNAReports

Community Health Needs Assessment
8
Secondary Data The epidemiologic data used in this report were collected from a variety of sources that report information at the county, state, and national levels. The epidemiologic data collected represented a very wide range of factors that affect community health, such as mortality rates, health behaviors, environmental factors, and health care access issues.
Community Health Needs Assessment Toolkit The Community Health Needs Assessment Toolkit is a collaborative partnership between Kaiser Permanente; the Institute for People, Place, and Possibility (IP3); the Centers for Disease Control and Prevention; and other partners that seek to make freely available data that can assist hospitals, nonprofit organizations, state and local health departments, financial institutions, and other organizations working to better understand the needs and assets of their communities and to collaborate to make measurable improvements in community health and well-being. Similar to the County Health Rankings program, the Community Health Needs Assessment Toolkit project collects information from a variety of sources and creates county-level profiles for comparison purposes. For more information about the Community Health Needs Assessment Toolkit, visit assessment.communitycommons.org.
Community Health Status Indicators The Community Health Status Indicators project is a partnership between the Centers for Disease Control and Prevention, the National Institutes of Health/National Library of Medicine, the Health Resources Services Administration, the Public Health Foundation, the Association of State and Territorial Health Officials, the National Association of County and City Health Officials, the National Association of Local Boards of Health, and the Johns Hopkins University School of Public Health. Similar to the County Health Rankings project, the Community Health Status Indicators project collects information on a variety of sources and generates county profiles. Currently, most of the data are from 2015 and contain information that the County Health Rankings does not. For more information about the Community Health Status Indicators project, visit wwwn.cdc.gov/communityhealth.
County Health Rankings The County Health Rankings & Roadmaps program is a collaboration between the Robert Wood Johnson Foundation and the University of Wisconsin Population Health Institute. The program collects county-level information on mortality, morbidity, health behaviors, clinical care, social and economic factors, and physical environment, for nearly all counties in the United States. Some data reported are actual counts based on actual reports (i.e., reported disease diagnoses), some data are estimated based on samples (i.e., the Behavioral Risk Factor Survey), and some data are modeled to obtain a more current estimate (i.e., projected 2014/2015 estimates based on 2010 census data). For more information about the County Health Rankings program, visit www.countyhealthrankings.org.
Northeastern Ohio Regional Trauma Network The mission of the Northeastern Ohio Regional Trauma Network is to collaboratively develop a regional trauma system and improve trauma care for the communities served, through data evaluation, research, injury prevention, and education. The purpose of the network is to collect and analyze pre-hospital and hospital demographic and clinical data for peer review purposes,

Community Health Needs Assessment
9
injury prevention initiatives, community-based education and research, submission of data to the State trauma registry, and performance improvement initiatives. County-level data that could be compared to peer counties, the state, and the nation were obtained through a special data request. For more information on the Northeastern Ohio Regional Trauma Network, visit arha.technologynow.com/ProgramsServices/NortheasternOhioRegionalTraumaNetwork.aspx
Ohio Department of Education The Ohio Department of Education oversees the state’s public education system, which includes public school districts, joint vocational school districts, and charter schools. The department also monitors educational service centers, other regional education providers, early learning and childcare programs, and private schools. The Ohio Department of Education publishes annual “report cards” on schools and districts that contain information on the demographics and educational outcomes of students. For more information about the data available at the Ohio Department of Education, visit education.ohio.gov/Topics/Data.
Ohio Department of Health The Ohio Department of Health is a cabinet-level agency that administers most state-level health programs, including coordination of the activities for child and family health services, health care quality improvement, services for children with medical handicaps, nutrition services, licensure and regulation of long-term care facilities, environmental health, prevention and control of injuries and diseases, and others. County-level data that could be compared to national statistics were collected in a variety of areas and used in this CHNA. For more information about the data available from the Ohio Department of Health, visit www.odh.ohio.gov/healthstats/datastats.aspx.
Ohio Hospital Association Established in 1915, the Ohio Hospital Association (OHA) is the nation’s first state-level hospital association. OHA collaborates with member hospitals and health systems to meet the health care needs of their communities and to create a vision for the future of Ohio’s health care environment. OHA, in coordination with member hospitals, has developed new web-based software called Insight that allows hospitals to run customized and standard reports for marketing, physician recruiting, business development, and benchmarking purposes. Several health indicators were drawn from OHA’s Insight system with their permission. For more information about OHA Insight, visit www.ohanet.org/insight/.
Primary Data
Community Leader Interviews In addition to examining the county-level epidemiologic data, interviews were conducted with 13 Summit County community leaders from March through June, 2016 to gain their insight into the significant health needs of children and adults in their communities, the factors that affect those health needs, other existing community health needs assessments, possible collaboration opportunities, and to solicit suggestions on what the hospitals can do to address the prioritized health needs identified in the CHNA. These community leaders provide a perspective on the broad interests of the communities served by the hospital facility, including the medically underserved, low-income persons, minority groups, those with chronic disease needs, and

Community Health Needs Assessment
10
leaders from local public health agencies and departments who have special knowledge and expertise in public health.
Leaders from the following community organizations were consulted during this CHNA:
Superintendent, Akron Public Schools
City of Akron Assistant to the Mayor for Health, Education, and Families
Mayor, City of Hudson
Mayor, City of New Franklin
Mayor, City of Stow
President and CEO, Greater Akron Chamber of Commerce
Superintendent, Hudson City School District
Director of Refugee Resettlement, International Institute of Akron
Members of the U.S. Congress representing districts serving the Summit County area
Director, Summit County Alcohol, Drug Addiction, and Mental Health Board
Summit County Executive
Commissioner, Summit County Public Health
Community Resident Focus Groups In addition to the input from community leaders, focus groups were conducted with community residents from April through September, 2016 to get their input on what they thought were the significant health needs in their communities, the factors that affect those needs, the solutions they thought would solve those needs, and what the hospitals and other community groups could do to address those needs. Due to the observed information gap in the epidemiologic data, substance abuse issues, and mental health issues, several questions were asked to probe more deeply on these issues. In addition, a questionnaire was distributed to focus group participants to gather demographic information and basic perceptions of community health. The discussion guide, questionnaire, and protocol were reviewed and approved by the Kent State University Institutional Review Board.
The list of significant health needs resulting from the epidemiologic analysis was supplemented with additional health needs identified by these community leaders and community residents. An analysis was conducted on the notes and transcripts of community leader interviews and community resident focus groups to identify and quantify themes that consistently emerged. The health areas listed below were the main health needs identified for Summit County adults by community leaders and residents.
Community Leaders Alcohol and Drug Abuse Dental Health Mental Health
Community Residents Diabetes Drugs and Alcohol Mental Health Obesity
Community Health Needs Assessment
11
Other Health Needs Assessments Lastly, prior health needs assessments that were conducted in the region were also reviewed and helped to inform this CHNA. Some of these health needs assessments were known to the Steering Committee, some were found using Internet searches, and some were provided by Community Leaders.
The other CHNAs that were reviewed during the preparation of this CHNA included:
The CHNAs conducted by the partnering hospitals in 2010 and 2013
The 2011, 2013, and 2015 Stark County Health Needs Assessment conducted by Aultman Hospital, Mercy Medical Center, and Alliance Community Hospital
Medina County Community Health Improvement Plan 2013-2018 conducted by the Living Well Medina County collaborative.
Health Profile of Portage County, Results from the 2008 Ohio Family Health Survey conducted by the Health Policy Institute of Ohio, The Center for Community Solutions, and Cleveland State University
Assessing NE Ohio Community Health Needs Assessments: Standards, Best Practice, and Limitations conducted by The Center for Community Solutions in 2015
Summit County Community Health Assessment 2011, and the 2015 update conducted by Summit County Public Health
The 2012 and 2015 Portage County CHNAs
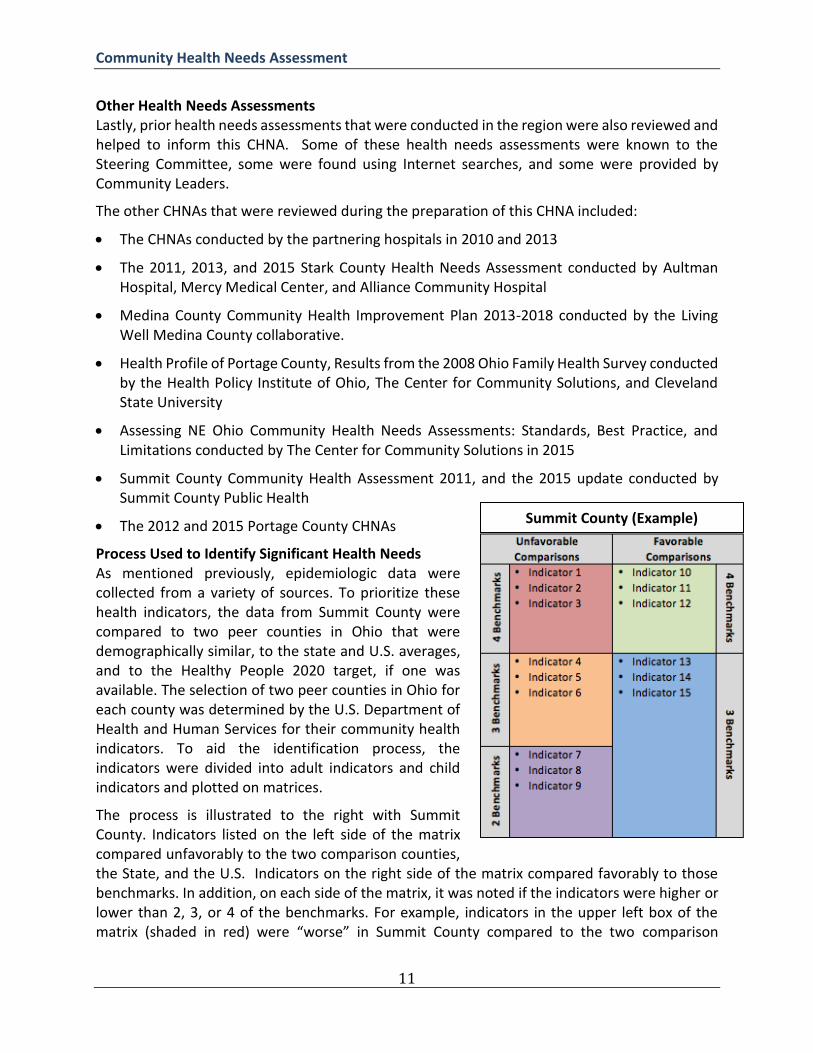
Process Used to Identify Significant Health Needs As mentioned previously, epidemiologic data were collected from a variety of sources. To prioritize these health indicators, the data from Summit County were compared to two peer counties in Ohio that were demographically similar, to the state and U.S. averages, and to the Healthy People 2020 target, if one was available. The selection of two peer counties in Ohio for each county was determined by the U.S. Department of Health and Human Services for their community health indicators. To aid the identification process, the indicators were divided into adult indicators and child indicators and plotted on matrices.
The process is illustrated to the right with Summit County. Indicators listed on the left side of the matrix compared unfavorably to the two comparison counties, the State, and the U.S. Indicators on the right side of the matrix compared favorably to those benchmarks. In addition, on each side of the matrix, it was noted if the indicators were higher or lower than 2, 3, or 4 of the benchmarks. For example, indicators in the upper left box of the matrix (shaded in red) were “worse” in Summit County compared to the two comparison
Summit County (Example)
Community Health Needs Assessment
12
counties, the State, and the U.S. Indicators in the bottom right (shaded in blue) were “better” in Summit County compared to these benchmarks. The use of these matrices helped the Steering Committee quickly compare the vast amount of data to key benchmarks and identify the significant health needs based on the epidemiologic data. At a meeting of the three hospital systems on May 1, 2016, the group agreed that any epidemiologic indicator that deviated in a negative direction on 3 or more benchmarks would be considered a “significant health need.” The significant health needs identified from the analysis of the epidemiologic variables for ESRI were described previously and are summarized below.
SUMMARY OF RESULTS
1. Access to Affordable Health Care
i. According to the Chronic Condition Data Warehouse (CCW), in 2012 the percentage of the Medicare population eligible for Medicaid was higher in Summit County than in the comparison counties of Hamilton and Montgomery, as well as the state and nation.
ii. In 2012, there were more Medicare recipients per 1,000 persons in Summit County than in Hamilton and Montgomery counties, the State and the nation that relied upon emergency departments for their healthcare needs according to the Chronic Condition Data Warehouse (CCW).
iii. According to the Ohio Department of Health, in 2010 more Medicare patients per 1,000 were discharged for ambulatory care sensitive conditions per the number of hospitalizations for ambulatory care sensitive conditions. Termed, “preventable hospitalizations”, this measure indicates that more illnesses or chronic conditions may have been manageable in an outpatient setting. Summit’s rate is higher than two comparison counties, the state and the nation.
iv. More adults were unemployed in Summit County in 2014, according the U.S. Bureau of labor Statistics, than in Hamilton and Montgomery counties and the State of Ohio. Focus group participants in 2016 also identified underemployment as a significant problem in the community.
v. Community focus group participants in 2016 also revealed that the cost of health care and accessibility to mental health services present a perceived barrier to services.
vi. Interviews with community leaders in 2016 identified access to mental health services as a top health need in Summit County.

Community Health Needs Assessment
13
2. Chronic Diseases and Other Health Conditions (Data Source Following)
a. Asthma
i. The percentage of adults with asthma was higher in Summit County than in Hamilton County, the state and the nation in 2012 according to the Chronic Condition Data Warehouse (CCW).
ii. The community served also has a higher percentage of Medicare beneficiaries with Asthma in 2012 than two comparison counties, the state and the nation according to the Chronic Condition Data Warehouse (CCW).
iii. Members of an inner-city community focus group conducted in 2016 revealed that asthma was reported as a significant problem in their families and neighborhood.
b. Cancer
i. Four types of cancer (breast, colorectal, respiratory and prostate) emerged as significant health needs in Summit County when the service area was compared to two comparable counties the state, nation and Healthy People 2020 targets. Data sources for these findings included the National Center for Health Statistics 2010 data on mortality, the 2012 Behavioral Risk Factor Surveillance System (BRFFS), and the Chronic Condition Data Warehouse (CCW) in 2012.
ii. Focus group participants in 2016 identified pancreatic, ovarian and breast cancer as significant health needs in their families and community.
c. Cardiovascular Diseases
i. The percentage of the Medicare population with high blood pressure is higher in the hospital service area than in Hamilton and Montgomery counties and the State of Ohio in 2012 according to the Chronic Condition Data Warehouse (CCW).
ii. The percentage of adults reporting high blood cholesterol is higher than Hamilton County, the state, the nation and Healthy People 2020’s target according to the 2012 Behavioral Risk Factor Surveillance System (BRFFS)
iii. Medicare beneficiaries have a higher rate of heart failure in 2012 than two comparison counties, the state and the nation according to the Chronic Condition Data Warehouse (CCW).
iv. The number of deaths due to heart disease per 100,000 is higher in the service area than Hamilton and Montgomery counties, the nation and Healthy People 2020 targets in 2013 according to the National Center for Health Statistics

Community Health Needs Assessment
14
v. More Medicare beneficiaries have experienced a stroke in Summit County than in Hamilton or Montgomery counties or the State of Ohio according to the Chronic Condition Data Warehouse (CCW) in 2012. More adults also died from a stroke than in Montgomery County, the nation and the Healthy People 2020 benchmark, reports the National Center for Health Statistics 2010 data on mortality.
vi. Primary data from community leader interviews in 2016 identified cardiovascular issues as one of the significant health concerns in the hospital service area. Focus group participants also reported high blood pressure as a major problem in their communities.
d. COPD
i. More Medicare beneficiaries in Summit County had COPD than in Hamilton or Montgomery counties, the state and the nation in 2012 according to the Chronic Condition Data Warehouse (CCW).
ii. The number of deaths due to chronic lower respiratory disease per 100,000 population was higher in 2013 in the hospital service area than in Hamilton or Montgomery counties, the state and the nation as shown in the National Center for Health Statistics 2010 data on mortality.
e. Diabetes
i. The community served had a percentage of the Medicare population with diabetes in 2012 higher than Hamilton and Montgomery counties, the state and the nation according to the Chronic Condition Data Warehouse (CCW).
ii. In 2016 community focus group participants and community leaders both identified diabetes as a significant health concern in Summit County.
f. Infant Mortality
i. The community served had an infant death rate (0-28 days) in 2010 that was higher than Montgomery County, the state, the nation and the Healthy people 2020 benchmark according to the Community Health Needs Assessment Toolkit of the Community Commons.
ii. Inner-city focus group participants in 2016 identified infant mortality as a health concern, brought about, several argued, by maternal depression.
iii. Primary data from community leader interviews in 2016 also identified infant mortality as a significant health concern in the hospital service area, and one where several interventions were currently underway.
Community Health Needs Assessment
15
g. Obesity
i. Primary data from community leader interviews in 2016 identified obesity and overweight individuals as one of the top 7 significant health concerns in the hospital service area.
ii. Focus group participants also identified obesity as an issue in their community in 2016.
h. Mental Health
i. Primary data from community leader interviews in 2016 identified mental Health as the 4th most significant health issue in Summit County in 2016. Lack of access to necessary services was frequently cited.
ii. Participants in an inner-city community focus group in 2016 identified mental health as a large issue in their families and community. The “stigma” of admitting to a mental health need was noted and several had experienced suicide and mental health issues among family members.
i. Substance Abuse
i. Summit County had a higher percentage of adults reporting heavy alcohol consumption in 2012 than Montgomery County, the state and the nation according to the Centers for Disease Control and Prevention, Behavioral Risk Factor Surveillance System (BRFFS).
ii. The community also had a much higher percentage of driving deaths associated with alcohol in 2013 than Montgomery and Hamilton counties and the State of Ohio according to the Fatality Analysis Reporting System (FARS).
iii. In 2012 the percentage of adults abusing prescription drugs was higher in Summit County than in Montgomery County and Ohio according to the National Institute of Drug Abuse.
iv. Community focus group participants identified heroin and opioids as one of the most significant health problems in the County in 2016. An inner-city focus group reported that many pregnant women were using drugs during pregnancy.
v. Community leaders in 2016 also indicated that heroin and opioids use was the most significant health need in the County.
3. Economic Development and Community Condition
i. The homicide rate per 100,000 population was higher in Summit County in 2013 than in Ohio, the nation and the Healthy People 2020 target rate according to the Community Health Needs Assessment Toolkit.
ii. Affordable rental housing is a problem in Summit County, which required a higher rent for a two-bedroom apartment, and also had a lower average
Community Health Needs Assessment
16
hourly wage earned by renters in 2014, than Hamilton and Montgomery counties and the State of Ohio as reported in the National Low Income Housing Coalition’s Out of Reach Database.
iii. Primary data from community focus group participants in 2016 also identified poverty, lack of jobs paying a living wage, transportation and crime as community conditions affecting their health condition.
4. Health Professions Education and Research
i. Data from the Health Resources Services Administration (HRSA) Data Warehouse indicate that ESRI is designated as a Health Professionals Shortage Area (HPSA) and that Summit County has 12 census tracks included in HPSA designation. According to data from the Bureau of Clinician Recruitment, HRSA, and the Kaiser Family Foundation in 2016 noted that Ohio has achieved only 68.2% of needed primary care physicians statewide. The Ohio Legislature's Health Care Efficiency Study Committee on September 3, 2016 concluded that there is a need to increase graduate medical education training in the state. According to the Ohio State Medical Association, which testified at the hearing, 25% of all physicians in Ohio are over the age of 60 and nearing retirement.
i. Community focus group participants in 2016 reported a lack of primary medical care and a lack of primary care physicians in the neighborhoods in which they reside. They also reported a lack of “continuity of care” in their medical experiences. The community has a need for research into causes and treatments of the health conditions it faces.
5. Health Care for the Elderly
i. Summit County’s influenza and pneumonia death rate per 100,000 residents was well above the rates for Montgomery and Hamilton counties and the State of Ohio in 2011 according to the Ohio Department of Health’s Network of Care.
ii. In 2012, the percentage of the Medicare population with Alzheimer’s disease was higher in Summit County than in Montgomery and Hamilton counties and the State of Ohio 2011 according to the Ohio Department of Health’s Network of Care.
iii. The percentage of the Medicare population with osteoporosis was also higher in Summit County in 2012 than in Hamilton and Montgomery counties and the State of Ohio 2011 according to the Ohio Department of Health’s Network of Care.
iv. Summit County also had a higher proportion of the Medicare aged population with arthritis in 2012 than Hamilton and Montgomery counties and the State of Ohio 2011, also according to the Ohio Department of Health’s Network of Care.

Community Health Needs Assessment
17
v. There was a higher percentage of acute hospital readmissions among Medicare beneficiaries in 2012 than in Ohio, the nation and the comparable Ohio counties of Hamilton and Montgomery according to the Chronic Condition Data Warehouse (CCW).
6. Wellness
i. Summit County had a lower number of grocery stores per 100,000 population in 2013 than Montgomery County, the state and the nation according to the Business Register’s County Business Patterns.
ii. There were a larger number of fast food restaurants per 100,000 population in 2013 in Summit County than in Hamilton County, the state and the nation as reported in the Business Register’s County Business Patterns.
iii. Community leaders in interviews in 2016 identified food insecurity, access to healthy food and obesity as major related problems in Summit County.
iv. Focus group participants in Summit County in 2016 identified lack of exercise and overweight as major health problems.
Potential Measures and Resources
Community Health Needs Assessment
18
External Community Resources The greater Akron/Summit County community has a strong history of collaboration to address issues that affect residents. ESRI believes that by partnering with other community organizations, it can improve more lives than it could by working alone. ESRI recognizes the strengths that the following organizations have as resources for improving our community’s health:
ESRI Internal Resources ESRI provides a variety of resources to help address the rehabilitative aspects of Summit County’s health needs as identified in the Community Health Needs Assessment. Patients trust ESRI because of our experience and clinical excellence in these areas. Outlined below are some of the specialized internal resources available to our community.
Cardiovascular Disease: Stroke ESRI addresses health needs related to stroke. ESRI has attained specialty accreditation in Stroke Specialty Programs (Adult) from the Commission for the Accreditation of Rehabilitation Facilities (CARF). This accreditation recognizes ESRI specialists in stroke care through our strong continuum of care in inpatient and outpatient programming.
To address stroke in our community, we offer:
CARF-accredited inpatient rehabilitation programs-hospital: stroke specialty programs (adult)
Support groups: Stepping Stones stroke support group
Access, Inc.
Akron-Canton Regional Food Bank
Akron Children’s Hospital
Akron General Health System
Akron Metropolitan Housing Authority
Akron Urban League
American Academy of Pediatrics, Ohio Chapter
American Cancer Society
American Diabetes Association
American Heart Association
American Lung Association
AxessPointe Community Health Center
Child Guidance & Family Solutions
Coleman Professional Services
County of Summit Alcohol, Drug Addiction, and Mental Health Services Board Faithful Servants Care Center
Greenleaf Family Services
Haven of Rest Ministries
International Institute
March of Dimes
Minority Health Roundtable
Open M
Summit County Public Health
Portage Path Behavioral Health
Summit County Children Services
Summit County Department of Job and Family Services
Salvation Army
United Way of Summit County
Info Line also maintains a searchable database of community resources at www.211summit.org

Community Health Needs Assessment
19
Driver’s rehabilitation program for disabled individuals
Return to recreational programs for adaptive recreational options for disabled individuals
Challenge Golf program: handicapped accessible driving range and golf course
Outlined below are some of the many other internal resources available to our community.
Chronic Diseases and Other Health Conditions
Diabetes For individuals with diabetes, ESRI is able to provide basic education on how to better control diabetes with lifestyle changes and also how to prevent potential complications. Our diabetic educators offer one-on-one instruction and group classes during convenient hours for those living with this chronic disease. Among our community offerings are:
Ongoing community screenings for diabetes
Speaker’s bureau community talks
Substance Abuse ESRI has been providing substance abuse services to the community since 1974. ESRI is the area’s most experienced accredited provider of rehabilitation services and is dedicated to patients who have endured life-altering injuries or illnesses. ESRI also provides rehabilitation services to those who may also have issues with abuse of alcohol, prescription drugs, and/or illicit drugs. The Dobkin Center for the Treatment of Addiction provides comprehensive addiction medicine and substance abuse treatment services to adults and adolescents. Among our community offerings are:
Chemical dependency assessments for alcohol- and/or drug-addicted adults and adolescents
Intensive outpatient and group counseling programs for adults and adolescents who are alcohol, drug and/or opiate addicted
Abstinence-based treatment protocols for adults and adolescents
Medication-assisted treatment for opiate-addicted adults, adolescents, and pregnant women
Counseling programs for alcohol- and/or drug-addicted adults with brain injury
Alcoholics Anonymous support groups
Lifestyle Factors, Maternal Health ESRI understands that lifestyle choices can positively or negatively impact a person’s health. These can include the choice to use tobacco. ESRI is able to provide the following offerings to the community to reduce tobacco use:
Smoking cessation classes for the community
Great American Smokeout information and support
Community Health Needs Assessment
20
Substance abuse educational programming for clients, including pregnant women and families, that outlines the health benefits of a smoke-free environment
By working together with these community resources to address identified health needs, much can be accomplished for our community’s benefit.
Why Are Only Adult Health Needs Discussed in this CHNA? While it recognizes children as part of the community it serves, due to the focused nature of its services and the special needs of the child patient, Edwin Shaw Rehabilitation Institute does not directly address significant health categories for children.
The community served by ESRI is also the community served by Akron Children’s Hospital, whose resources are focused on the child patient.
To Request Copies and for More Information In addition to being publicly available on our website, a limited number of reports have been printed. If you would like a copy of this report or if you have any questions about it, please contact [email protected]
Community Health Needs Assessment
21
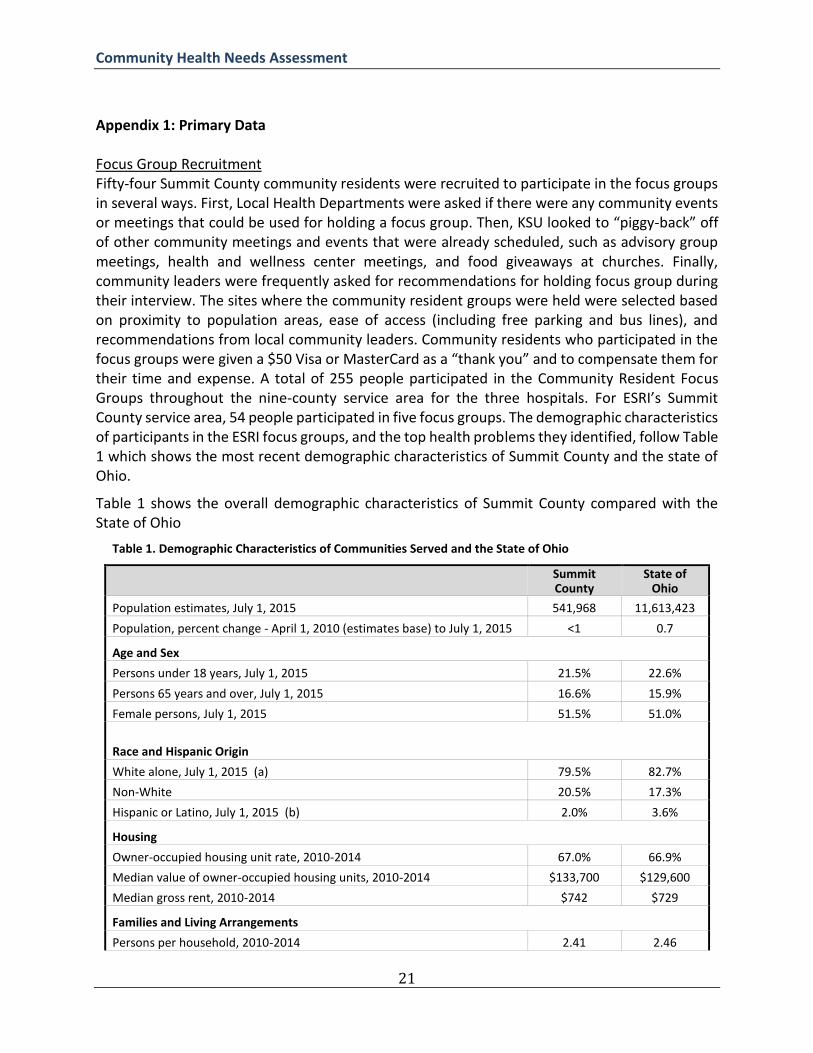
Appendix 1: Primary Data Focus Group Recruitment Fifty-four Summit County community residents were recruited to participate in the focus groups in several ways. First, Local Health Departments were asked if there were any community events or meetings that could be used for holding a focus group. Then, KSU looked to “piggy-back” off of other community meetings and events that were already scheduled, such as advisory group meetings, health and wellness center meetings, and food giveaways at churches. Finally, community leaders were frequently asked for recommendations for holding focus group during their interview. The sites where the community resident groups were held were selected based on proximity to population areas, ease of access (including free parking and bus lines), and recommendations from local community leaders. Community residents who participated in the focus groups were given a $50 Visa or MasterCard as a “thank you” and to compensate them for their time and expense. A total of 255 people participated in the Community Resident Focus Groups throughout the nine-county service area for the three hospitals. For ESRI’s Summit County service area, 54 people participated in five focus groups. The demographic characteristics of participants in the ESRI focus groups, and the top health problems they identified, follow Table 1 which shows the most recent demographic characteristics of Summit County and the state of Ohio.
Table 1 shows the overall demographic characteristics of Summit County compared with the State of Ohio
Table 1. Demographic Characteristics of Communities Served and the State of Ohio
Summit County
State of Ohio
Population estimates, July 1, 2015 541,968 11,613,423
Population, percent change - April 1, 2010 (estimates base) to July 1, 2015 <1 0.7
Age and Sex
Persons under 18 years, July 1, 2015 21.5% 22.6%
Persons 65 years and over, July 1, 2015 16.6% 15.9%
Female persons, July 1, 2015 51.5% 51.0%
Race and Hispanic Origin
White alone, July 1, 2015 (a) 79.5% 82.7%
Non-White 20.5% 17.3%
Hispanic or Latino, July 1, 2015 (b) 2.0% 3.6%
Housing
Owner-occupied housing unit rate, 2010-2014 67.0% 66.9%
Median value of owner-occupied housing units, 2010-2014 $133,700 $129,600
Median gross rent, 2010-2014 $742 $729
Families and Living Arrangements
Persons per household, 2010-2014 2.41 2.46

Community Health Needs Assessment
22
Education High school graduate or higher, percent of persons age 25 years+, 2010-2014 90.7 88.8
Bachelor's degree or higher, percent of persons age 25 years+, 2010-2014 29.9 25.6
Income and Poverty
Median household income (in 2014 dollars), 2010-2014 $50,082 $48,849
Per capita income in past 12 months (in 2014 dollars), 2010-2014 $28,389 $26,520
Persons in poverty 13.4% 15.8%
Notes: 1 2015 estimate, 2 Since 2010, 3 As of 2011, 4 persons age 25+, 2007-2011, 5 2007-2011
Source: US Census Bureau (http://quickfacts.census.gov/qfd/maps/ohio_map.html)
Characteristics of Participants As shown in Table 2, around 65 percent of respondents were female. The average age of participants was 48.8 years and the average number of years that participants had lived in their home county was 26.1 years. 68.5% percent were Caucasian, 20.4% were African American and 2.4% were Hispanic.
Table 2. Demographic Characteristics of Community Resident Focus Group Participants (n=54)
Characteristic Number Percent
County of Residence: Summit 54 100.0%
Number of Years Lived in County (average and SD)
26.1 20.1
Female 35 64.8%
Male 19 35.2%
Age (average and SD) 48.8 13.0
Racial Background African American (or Black) 11 20.4%
Asian American 1 1.9%
Caucasian (or White) 37 68.5%
Native Hawaiian or Other Pacific Islander
0 0.0%
American Indian or Alaska Native 3 5.6%
Other/Missing 2 6.7%
Ethnic Background Hispanic or Latino/a 1 2.4%
Not Hispanic or Latino/a 37 88.1%
Missing 4 9.5%
Community Health Needs Assessment
23
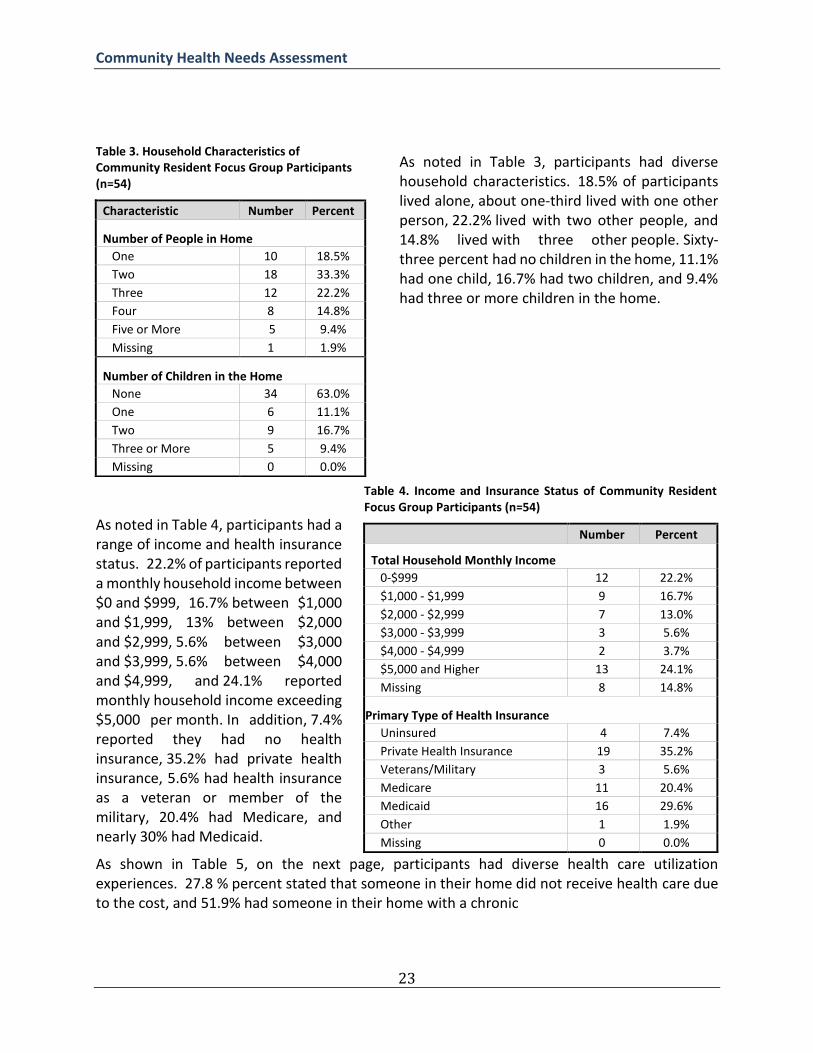
As noted in Table 3, participants had diverse household characteristics. 18.5% of participants lived alone, about one-third lived with one other person, 22.2% lived with two other people, and 14.8% lived with three other people. Sixty-three percent had no children in the home, 11.1% had one child, 16.7% had two children, and 9.4% had three or more children in the home.
As noted in Table 4, participants had a range of income and health insurance status. 22.2% of participants reported a monthly household income between $0 and $999, 16.7% between $1,000 and $1,999, 13% between $2,000 and $2,999, 5.6% between $3,000 and $3,999, 5.6% between $4,000 and $4,999, and 24.1% reported monthly household income exceeding $5,000 per month. In addition, 7.4% reported they had no health insurance, 35.2% had private health insurance, 5.6% had health insurance as a veteran or member of the military, 20.4% had Medicare, and nearly 30% had Medicaid.
As shown in Table 5, on the next page, participants had diverse health care utilization experiences. 27.8 % percent stated that someone in their home did not receive health care due to the cost, and 51.9% had someone in their home with a chronic
Table 3. Household Characteristics of Community Resident Focus Group Participants (n=54)
Characteristic Number Percent
Number of People in Home One 10 18.5%
Two 18 33.3%
Three 12 22.2%
Four 8 14.8%
Five or More 5 9.4%
Missing 1 1.9%
Number of Children in the Home None 34 63.0%
One 6 11.1%
Two 9 16.7%
Three or More 5 9.4%
Missing 0 0.0%
Table 4. Income and Insurance Status of Community Resident Focus Group Participants (n=54)
Number Percent
Total Household Monthly Income
0-$999 12 22.2%
$1,000 - $1,999 9 16.7%
$2,000 - $2,999 7 13.0%
$3,000 - $3,999 3 5.6%
$4,000 - $4,999 2 3.7%
$5,000 and Higher 13 24.1%
Missing 8 14.8%
Primary Type of Health Insurance Uninsured 4 7.4%
Private Health Insurance 19 35.2%
Veterans/Military 3 5.6%
Medicare 11 20.4%
Medicaid 16 29.6%
Other 1 1.9%
Missing 0 0.0%
Community Health Needs Assessment
24
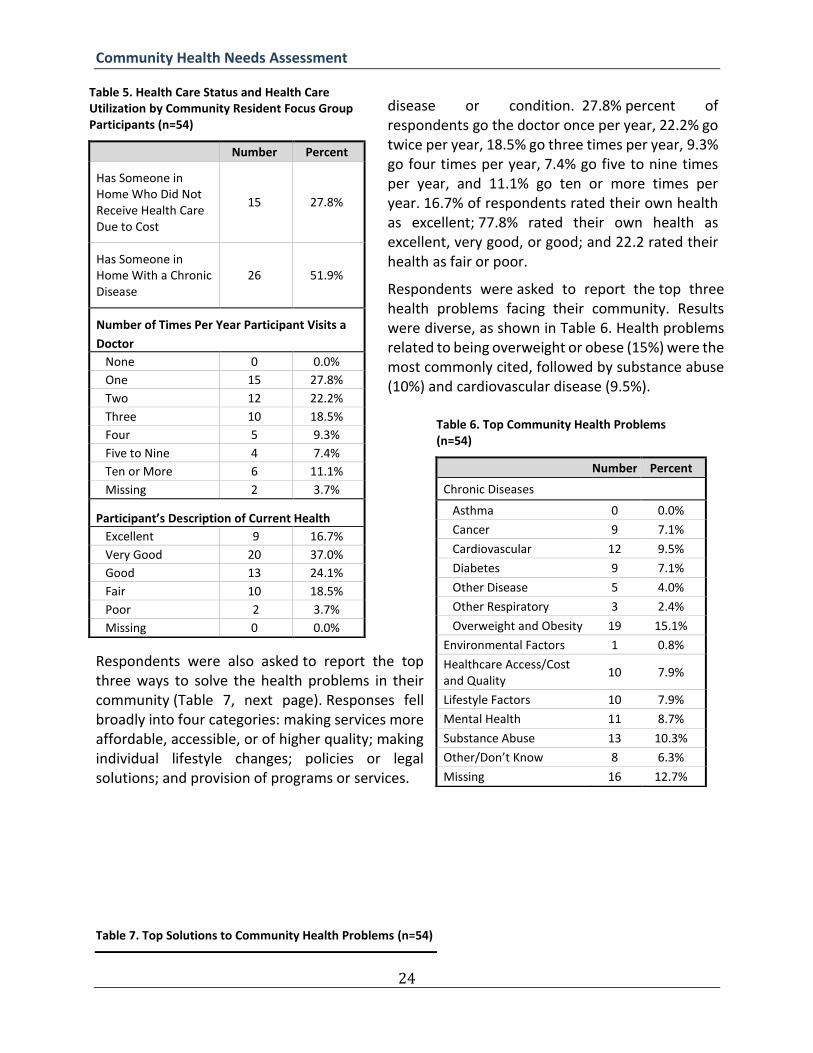
disease or condition. 27.8% percent of respondents go the doctor once per year, 22.2% go twice per year, 18.5% go three times per year, 9.3% go four times per year, 7.4% go five to nine times per year, and 11.1% go ten or more times per year. 16.7% of respondents rated their own health as excellent; 77.8% rated their own health as excellent, very good, or good; and 22.2 rated their health as fair or poor.
Respondents were asked to report the top three health problems facing their community. Results were diverse, as shown in Table 6. Health problems related to being overweight or obese (15%) were the most commonly cited, followed by substance abuse (10%) and cardiovascular disease (9.5%).
Respondents were also asked to report the top three ways to solve the health problems in their community (Table 7, next page). Responses fell broadly into four categories: making services more affordable, accessible, or of higher quality; making individual lifestyle changes; policies or legal solutions; and provision of programs or services.
Table 5. Health Care Status and Health Care Utilization by Community Resident Focus Group Participants (n=54)
Number Percent
Has Someone in Home Who Did Not Receive Health Care Due to Cost
15 27.8%
Has Someone in Home With a Chronic Disease
26 51.9%
Number of Times Per Year Participant Visits a
Doctor None 0 0.0%
One 15 27.8%
Two 12 22.2%
Three 10 18.5%
Four 5 9.3%
Five to Nine 4 7.4%
Ten or More 6 11.1%
Missing 2 3.7%
Participant’s Description of Current Health Excellent 9 16.7%
Very Good 20 37.0%
Good 13 24.1%
Fair 10 18.5%
Poor 2 3.7%
Missing 0 0.0%
Table 6. Top Community Health Problems (n=54)
Number Percent
Chronic Diseases Asthma 0 0.0%
Cancer 9 7.1%
Cardiovascular 12 9.5%
Diabetes 9 7.1%
Other Disease 5 4.0%
Other Respiratory 3 2.4%
Overweight and Obesity 19 15.1%
Environmental Factors 1 0.8%
Healthcare Access/Cost and Quality
10 7.9%
Lifestyle Factors 10 7.9%
Mental Health 11 8.7%
Substance Abuse 13 10.3%
Other/Don’t Know 8 6.3%
Missing 16 12.7%
Table 7. Top Solutions to Community Health Problems (n=54)

Community Health Needs Assessment
25
Responses coded as “affordability, accessibility, and quality” were primarily general in nature (access to healthcare, lower costs, better healthcare), and included few specific suggestions (transportation, insurance should cover gym memberships). “Individual lifestyle changes” were solutions that could be taken on by individual community members, such as exercise, eating a healthy diet, keeping on top of doctors’ appointments, and getting rest. Policies and legal solutions were those that require macro-level intervention, including higher incomes, smaller government, and getting insurance and government out of the way. Responses coded as “provision of programs or services” ranged from general suggestions, such as prevention and education, to more specific proposed solutions, such as counseling, early screening, fitness centers, and bringing physical activity back to schools.
Respondents identified provision of programs or services (26%) and individual lifestyle changes (25%) as the most desirable solutions for health problems facing the community, followed by making services more affordable, accessible, or of higher quality (11%), and policies or legal solutions (4%).
Number Percent
Affordability/Accessibility/Quality 14 11.1%
Individual Action/Lifestyle 31 24.6%
Policies/Legal 5 4.0%
Programs and Services 33 26.2%
Other/Don’t Know 4 3.2%
Missing 39 31.0%

Community Health Needs Assessment
26
Appendix 2: Secondary Data
Table of Contents
Introduction 29
Access to Health Care 30
Percentage of Medicare Population Eligible for Medicaid 30
Percentage of Adults Unemployed 31
Emergency Department Utilization 32
Hospital Outpatient Visits 33
Preventable Hospitalization 34
Chronic Disease 35
Cancer 35
Breast Cancer 36
Cervical Cancer Screening 37
Colorectal Cancer 38
Colorectal Cancer Diagnosis among Medicare Beneficiaries 38
Colorectal Cancer Death Rate 38
Colonoscopy 40
Respiratory Cancer 41
Prostate Cancer 42
Diabetes 43
Kidney Disease 44
Asthma 45
Adults with Asthma 45

Community Health Needs Assessment
27
Medicare Beneficiaries with Asthma 46
Medicare Beneficiaries with COPD 47
Lung Disease Death Rate per 100,000 48
Cardiovascular Disease 49
Risk Factors for Cardiovascular Disease 49
High Blood Pressure 49
High Cholesterol 50
Heart Failure 51
Heart Disease Death Rate 52
Stroke 53
History of Stroke 53
Stroke Death per 100,000 54
Alzheimer’s Disease 55
Osteoporosis 56
Arthritis 57
Environmental Factors 58
Water Quality 58
Air Quality 59
Community Assets and Deficits 60
Access to Grocery Stores 60
Fast Food Restaurants 61
Crime and Violence – Homicide 62
Housing Costs 63
Rent for a Two Bedroom Apartment 63
Hourly Wage Needed to Afford a Two Bedroom Apartment 64
Hourly Wage 65
Rent Affordable at Average Renter Wage 66
Number of Full-Time Renter Wage Jobs Needed to Afford Average Rent 67
Infectious Disease 68

Community Health Needs Assessment
28
Influenza and Pneumonia 68
Viral Meningitis 69
Injury and Accidents 70
Poisoning 70
Motor Vehicle Accidents 71
Quality of Health Care 72
Hospital Readmission 72
Maternal and Child Health 73
Infant Mortality 73
Substance Abuse 74
Heavy Alcohol Consumption 74
Driving Deaths Due to Alcohol 76
Prescription Drug Abuse 77
References 78
Community Health Needs Assessment
29
Introduction
To conduct the 2016 Community Health Needs Assessment, the Kent State University College of
Public Health followed several recommendations offered by the Catholic Health Association of
the United States in its 2015 second edition of Assessing and Addressing Community Health
Needs. This Data Appendix includes epidemiological data for indicators identified as significant
health needs for the hospital service area.
Epidemiologic data from a variety of sources were collected on 298 adult and child health
indicators where available. To identify the epidemiological significant health needs for Edwin
Shaw Rehabilitation Institute, adult data from Summit County was compared to two peer
counties in Ohio that were demographically similar, the state and US averages, and the Healthy
People 2020 target, if one was available. To aid the identification process, the indicators were
plotted on matrices.
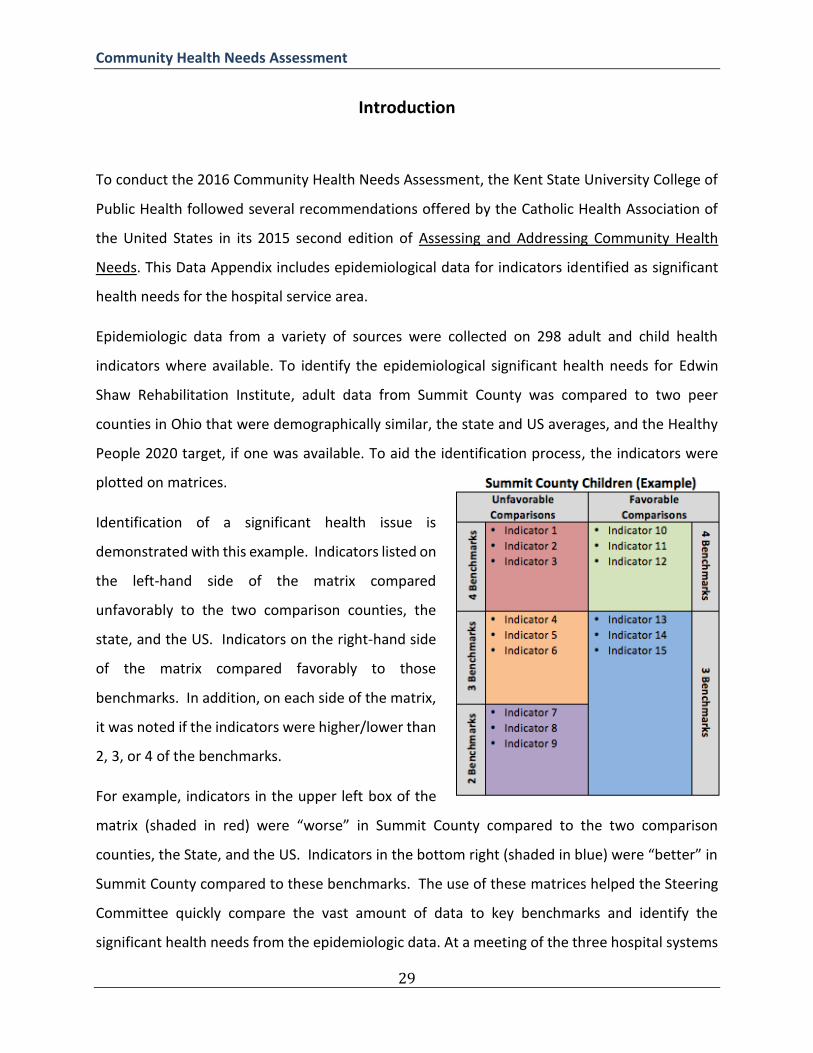
Identification of a significant health issue is
demonstrated with this example. Indicators listed on
the left-hand side of the matrix compared
unfavorably to the two comparison counties, the
state, and the US. Indicators on the right-hand side
of the matrix compared favorably to those
benchmarks. In addition, on each side of the matrix,
it was noted if the indicators were higher/lower than
2, 3, or 4 of the benchmarks.
For example, indicators in the upper left box of the
matrix (shaded in red) were “worse” in Summit County compared to the two comparison
counties, the State, and the US. Indicators in the bottom right (shaded in blue) were “better” in
Summit County compared to these benchmarks. The use of these matrices helped the Steering
Committee quickly compare the vast amount of data to key benchmarks and identify the
significant health needs from the epidemiologic data. At a meeting of the three hospital systems

Community Health Needs Assessment
30
on May 1, 2016 the Steering Committee agreed that any epidemiological indicator that was
“worse” on 3 or more benchmarks would be considered a “significant health need”. These
indicators are described and detailed data presented on each for the hospital’s service area in
the pages that follow.
Access to Health Care
Access to health care is a broad term used to describe the availability, acceptability, affordability,
and accessibility of health care systems and providers. Lack of access to health care makes it
difficult for people to get the health care they need, which can lead to premature disability and
death.
Indicators pertaining to access to health care that
met inclusion criteria include: the percentage of
Medicare population eligible for Medicaid, the
percentage of unemployed adults, emergency
department utilization, hospital outpatient visits,
and preventable hospitalizations.
Percentage of Medicare Population Eligible for
Medicaid
Medicaid eligibility is determined by membership
in a qualifying group. For example, low income
families, qualified pregnant women and children,
and individuals receiving Supplemental Security
Income (SSI) are groups that are eligible.
Additional groups may be eligible depending on
state guidelines.
0.00%
5.00%
10.00%
15.00%
20.00%
25.00%
% MedicarePopulationEligible forMedicaid
HP2020
US 14.77%
Ohio 22.65%
Summit 23.36%
Hamilton 21.02%
Montgomery 20.25%
(H) The Percentage of Medicare Population Eligible for Medicaid
Community Health Needs Assessment
31
What is the data source for this indicator? “Percentage of Medicare Population Eligible for
Medicaid” is the percentage of Medicare fee-for-service beneficiaries who meet eligibility
requirements for Medicaid. The most recent data (2012) are from The Chronic Condition Data
Warehouse (CCW) and are reported on The Ohio Department of Health’s Network of Care
website.
How does our community rank? With 23.36% of Medicare beneficiaries also eligible for
Medicaid, Summit County exceeds national, state, and both comparison counties’ eligibility rates.
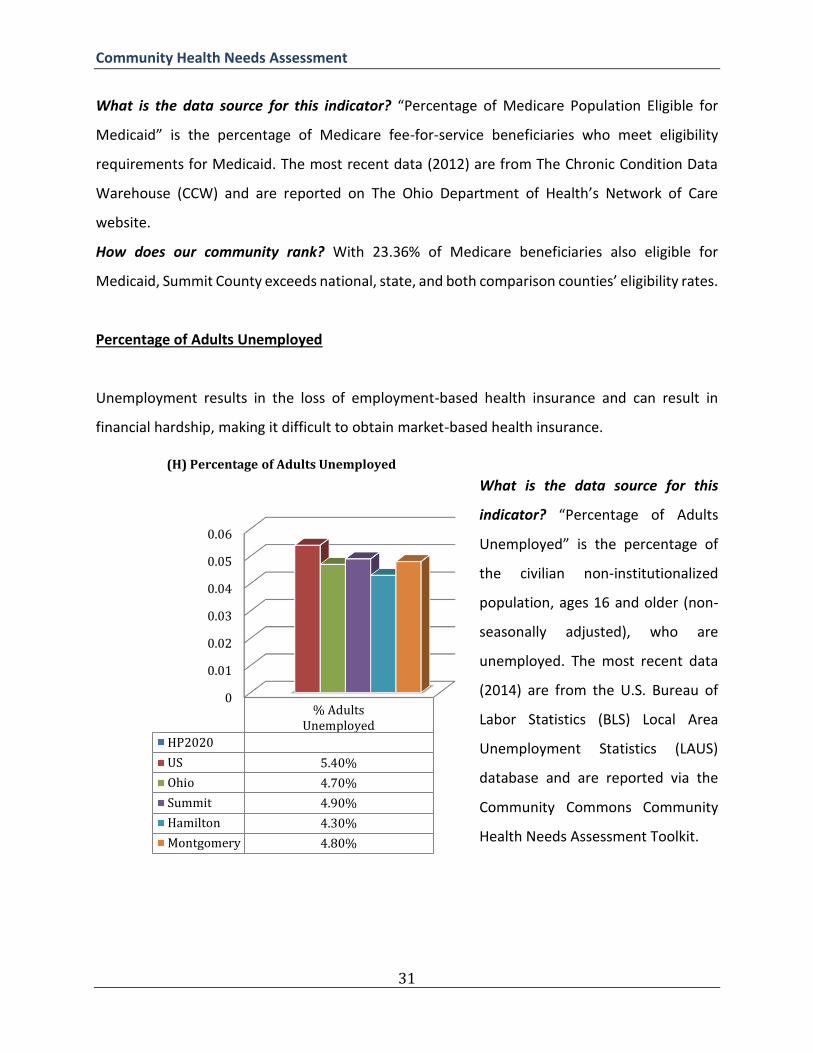
Percentage of Adults Unemployed
Unemployment results in the loss of employment-based health insurance and can result in
financial hardship, making it difficult to obtain market-based health insurance.
What is the data source for this
indicator? “Percentage of Adults
Unemployed” is the percentage of
the civilian non-institutionalized
population, ages 16 and older (non-
seasonally adjusted), who are
unemployed. The most recent data
(2014) are from the U.S. Bureau of
Labor Statistics (BLS) Local Area
Unemployment Statistics (LAUS)
database and are reported via the
Community Commons Community
Health Needs Assessment Toolkit.
0
0.01
0.02
0.03
0.04
0.05
0.06
% AdultsUnemployed
HP2020
US 5.40%
Ohio 4.70%
Summit 4.90%
Hamilton 4.30%
Montgomery 4.80%
(H) Percentage of Adults Unemployed

Community Health Needs Assessment
32
How does our community rank? With an unemployment rate of 4.9%, Summit County’s
unemployment rate exceeds the state and both comparison counties’ rates. The national
unemployment rate (5.4%) is higher.
Emergency Department Utilization
Relying on emergency departments for basic healthcare needs may result in poor care
coordination and adverse health
outcomes (Flores-Mateo, 2012). In
addition to the high costs associated
with inappropriate emergency
department use, resources may be
diverted from true crises. Emergency
department utilization is an indicator
of access to care; excessive use may
indicate a lack of appropriate lower
level care in the community.
What is the data source for this
indicator? “The Number of
Emergency Department Visits per
1,000 Medicare Beneficiaries” is the
annual number of inpatient or
hospital outpatient emergency visits among Medicare fee-for-service beneficiaries. The most
recent data (2012) are from The Chronic Condition Data Warehouse (CCW) and are reported on
The Ohio Department of Health’s Network of Care website.
0
200
400
600
800
1000
EmergencyDepartment
Visit Ratefor Medicare
Patients
HP2020
US 560.07
Ohio 788
Summit 836
Hamilton 752
Montgomery 797
(H) The Number of Emergency Department Visits per 1000 Medicare Beneficiaries

Community Health Needs Assessment
33
How does our community rank? With 836 emergency department visits per 1,000 Medicaid
beneficiaries in 2012, the Summit County emergency department utilization rate exceeds
national, state, and both comparison counties’ rates.
Hospital Outpatient Visits
What is the data source for this
indicator? “The Total Number of
Hospital Outpatient Visits for
Medicare Patients” is the total
number of hospital outpatient visits
made by Medicare fee-for-service
beneficiaries per 1,000 beneficiaries.
The most recent data (2012) are
from The Chronic Condition Data
Warehouse (CCW) and are reported
on The Ohio Department of Health’s
Network of Care website.
How does our community rank?
With 5,397 hospital outpatient visits
per 1,000 Medicare beneficiaries in
2012, the Summit County hospital
outpatient utilization rate exceeds
the national rate, in addition to both comparison counties’ rates. The state rate (5,432) is higher.
Preventable Hospitalization
0
1000
2000
3000
4000
5000
6000
TotalHospital
OutpatientVisits forMedicarePatients
HP2020
US 4,014.66
Ohio 5,432
Summit 5,397
Hamilton 3,879
Montgomery 3,751
(H) The Total Number of Hospital Outpatient Visits for Medicare Patients (per 1,000)

Community Health Needs Assessment
34
Preventable hospitalizations include
those for acute illnesses or chronic
conditions that might have been
manageable in an outpatient setting.
These hospitalizations are an
indicator of health care systems’
overall efficiency and vary
depending on population health
behaviors, as well as the quality and
accessibility of care available in the
community.
What is the data source for this
indicator? “The Preventable
Hospitalization Rate for Medicare Patients” is the discharge rate per 1,000 Medicare fee-for-
service enrollees for ambulatory care sensitive conditions, over the number of hospitalizations
for ambulatory care sensitive conditions by Medicare fee-for-service enrollees. The most recent
data (2010) are from The Dartmouth Atlas Project (DAP) and are reported on The Ohio
Department of Health’s Network of Care website.
How does our community rank? With a rate of 72.9 preventable hospitalizations per 1,000
Medicare enrollees in 2010, the Summit County preventable hospitalization rate exceeds the
national and state rates, in addition to both comparison counties’ rates.
Chronic Disease
01020304050607080
Preventable HospitalizationRate of Medicare Patients
HP2020
US 59.2
Ohio 71.7
Summit 72.9
Hamilton 56.3
Montgomery 56.5
(H) Preventable Hospitalization Rate of Medicare Patients (per 1,000)

Community Health Needs Assessment
35
Chronic diseases are a type of disease that a person can live with for a prolonged period of time,
and sometimes indefinitely. Those with a chronic disease usually need to see their doctors on a
regular basis in order to monitor the disease progression and receive treatment.
Chronic diseases identified as significant health needs in Summit County include: Cancer (breast,
colorectal, respiratory, and prostate), diabetes, kidney disease, high cholesterol, asthma, blood
pressure, stroke, Alzheimer’s disease, osteoporosis, and arthritis.
Cancer
Cancer is a term that encompasses over 100 different diseases that share one common
characteristic: The unregulated development and proliferation of abnormal cells. If cancer is left
untreated, these abnormal cells may spread, or metastasize, to other parts of the body,
interrupting organ function and placing the individual at risk of significant illness and death.
Breast Cancer

Community Health Needs Assessment
36
What is the data source for this
indicator? The “Female Breast
Cancer Death Rate per 100,000” is
the number of female deaths due to
breast cancer per 100,000 females in
the population. The most recent data
(2004-2010) are from The National
Vital Statistics System Mortality
component (NVSS-M), which is
reported to the National Center for
Health Statistics (NCHS) and are
available on The Ohio Department of
Health’s Network of Care website.
How does our community rank? With 32.9 deaths per 100,000, the Summit County female death
rate for breast cancer exceeds Healthy People 2020 goals, as well national, state, and one
comparison county’s rates. The Hamilton County rate (33.4) is higher.
Cervical Cancer Screening
0
10
20
30
40
BreastCancer
Death Rate
HP2020 20.7
US 23.5
Ohio 31.2
Summit 32.9
Hamilton 33.4
Montgomery 30.9
(H) Female Breast Cancer Death Rate(per 100,000)

Community Health Needs Assessment
37
What is the data source for this
indicator? The “Percentage of
Women over 18 getting a Pap Smear”
is the percentage of women over the
age of 18 who self-report receiving a
Pap test in the last 3 years. The most
recent data (2006-2012) are from the
Behavioral Risk Factor Surveillance
System (BRFSS), a collaborative
project between the Centers for
Disease Control and Prevention (CDC)
and U.S. states and territories; these
data are reported on The Ohio
Department of Health’s Network of
Care website.
How does our community rank? With 78.4% of women in Summit County obtaining a Pap Smear
screening between 2006 and 2012, the Summit County Pap Smear rate is lower than Healthy
People 2020 goals, as well as the state and both comparison counties’ rates. The national rate is
not available.
Colorectal Cancer
70%
75%
80%
85%
90%
95%
% WomenOver 18
Getting PapSmear
HP2020 93%
US
Ohio 78.70%
Summit 78.40%
Hamilton 78.50%
Montgomery 78.80%
(H) The Percentage of Women Over 18 Getting a Pap Smear
Community Health Needs Assessment
38
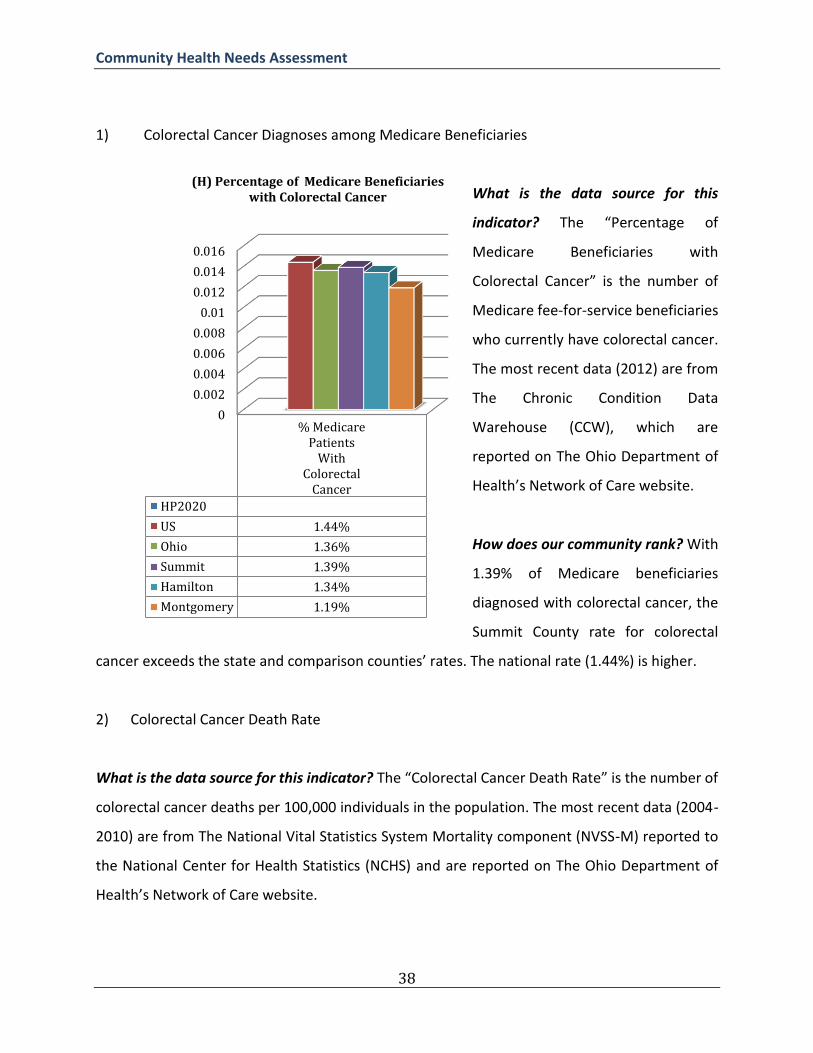
1) Colorectal Cancer Diagnoses among Medicare Beneficiaries
What is the data source for this
indicator? The “Percentage of
Medicare Beneficiaries with
Colorectal Cancer” is the number of
Medicare fee-for-service beneficiaries
who currently have colorectal cancer.
The most recent data (2012) are from
The Chronic Condition Data
Warehouse (CCW), which are
reported on The Ohio Department of
Health’s Network of Care website.
How does our community rank? With
1.39% of Medicare beneficiaries
diagnosed with colorectal cancer, the
Summit County rate for colorectal
cancer exceeds the state and comparison counties’ rates. The national rate (1.44%) is higher.
2) Colorectal Cancer Death Rate
What is the data source for this indicator? The “Colorectal Cancer Death Rate” is the number of
colorectal cancer deaths per 100,000 individuals in the population. The most recent data (2004-
2010) are from The National Vital Statistics System Mortality component (NVSS-M) reported to
the National Center for Health Statistics (NCHS) and are reported on The Ohio Department of
Health’s Network of Care website.
0
0.002
0.004
0.006
0.008
0.01
0.012
0.014
0.016
% MedicarePatients
WithColorectal
Cancer
HP2020
US 1.44%
Ohio 1.36%
Summit 1.39%
Hamilton 1.34%
Montgomery 1.19%
(H) Percentage of Medicare Beneficiaries with Colorectal Cancer

Community Health Needs Assessment
39
How does our community rank?
With 21.8 deaths per 100,000, the
Summit County colorectal cancer
death rate exceeds Healthy People
2020 goals, in addition to the
national, state, and both comparison
counties’ rates.
3) Colonoscopy
0
5
10
15
20
25
ColorectalCancer
Death Rate
HP2020 14.5
US 17.2
Ohio 20.9
Summit 21.8
Hamilton 20.7
Montgomery 20.6
(H) Colorectal Cancer Death Rate(per 100,000)
Community Health Needs Assessment
40
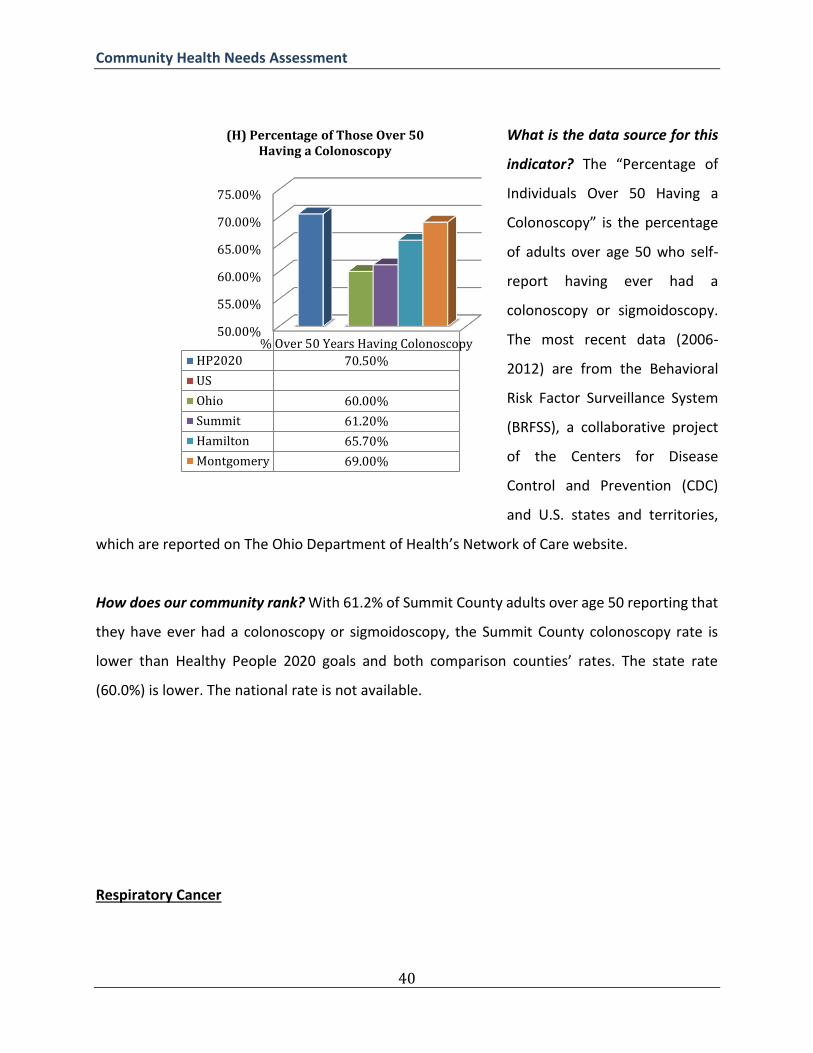
What is the data source for this
indicator? The “Percentage of
Individuals Over 50 Having a
Colonoscopy” is the percentage
of adults over age 50 who self-
report having ever had a
colonoscopy or sigmoidoscopy.
The most recent data (2006-
2012) are from the Behavioral
Risk Factor Surveillance System
(BRFSS), a collaborative project
of the Centers for Disease
Control and Prevention (CDC)
and U.S. states and territories,
which are reported on The Ohio Department of Health’s Network of Care website.
How does our community rank? With 61.2% of Summit County adults over age 50 reporting that
they have ever had a colonoscopy or sigmoidoscopy, the Summit County colonoscopy rate is
lower than Healthy People 2020 goals and both comparison counties’ rates. The state rate
(60.0%) is lower. The national rate is not available.
Respiratory Cancer
50.00%
55.00%
60.00%
65.00%
70.00%
75.00%
% Over 50 Years Having Colonoscopy
HP2020 70.50%
US
Ohio 60.00%
Summit 61.20%
Hamilton 65.70%
Montgomery 69.00%
(H) Percentage of Those Over 50 Having a Colonoscopy

Community Health Needs Assessment
41
What is the data source for this
indicator? The “Respiratory Cancer
Death Rate” is the number of
respiratory cancer deaths per 100,000
individuals in the population. The
most recent data (2004-2010) are
from The National Vital Statistics
System Mortality component (NVSS-
M), which is reported to the National
Center for Health Statistics (NCHS)
and are available on The Ohio
Department of Health’s Network of
Care website.
How does our community rank? With
67.6 deaths per 100,000, the Summit
County respiratory cancer death rate
exceeds the national, state, and one comparison county’s rates. The Montgomery County rate
(70.3) is higher.
Prostate Cancer
0
10
20
30
40
50
60
70
80
RespiratoryCancer
Death Rate
HP2020
US 51.4
Ohio 64.5
Summit 67.6
Hamilton 65.3
Montgomery 70.3
(H) Respiratory Cancer Death Rate(per 100,000)

Community Health Needs Assessment
42
What is the data source for this
indicator? The “Prostate Cancer Death
Rate” is the number of prostate cancer
deaths per 100,000 individuals in the
population. The most recent data
(2006-2010) are from The National
Vital Statistics System Mortality
component (NVSS-M), which is
reported to the National Center for
Health Statistics (NCHS) and are
available on The Ohio Department of
Health’s Network of Care website.
How does our community rank? With
28.1 deaths per 100,000 males, the
Summit County prostate cancer death
rate exceeds Healthy People 2020 goals, as well as the national, state, and both comparison
counties’ rates.
Diabetes
0
5
10
15
20
25
30
ProstateCancer
Death Rate
HP2020 21.8
US 23.6
Ohio 23.8
Summit 28.1
Hamilton 26.1
Montgomery 24.3
(H) Prostate Cancer Death Rate(per 100,000 males)

Community Health Needs Assessment
43
Diabetes is an illness in which blood sugar (glucose) levels are higher than normal. Most of the
food that an individual eats is converted into glucose, which must in turn be absorbed by cells.
The pancreas produces a hormone called insulin, which helps cells absorb glucose. In diabetes,
the body either cannot produce enough insulin, or cannot use the insulin it produces, which leads
to a buildup of sugar in the blood. The two primary forms of diabetes are Type 1, or juvenile-
onset diabetes, and Type 2, or adult-onset diabetes (CDC, 2011).
What is the data source for this
indicator? The “Percentage of the
Medicare Population with Diabetes”
is the percentage of the Medicare
fee-for-service population with
diabetes. The most recent data
(2012) are from the Centers for
Medicare and Medicaid Services
(CMS) Chronic Conditions
Warehouse (CCW), which are
reported via the Community
Commons Community Health Needs
Assessment Toolkit.
How does our community rank?
With 27.53% of the Medicare
population diagnosed with diabetes, the Summit County diabetes rate exceeds national, state,
and both comparison counties’ rates.
Kidney Disease
0
0.05
0.1
0.15
0.2
0.25
0.3
% MedicarePopulation
WithDiabetes
HP2020
US 15.40%
Ohio 18%
Summit 27.53%
Hamilton 25.66%
Montgomery 27.26%
(H) Percentage of the Medicare Population with Diabetes
Community Health Needs Assessment
44
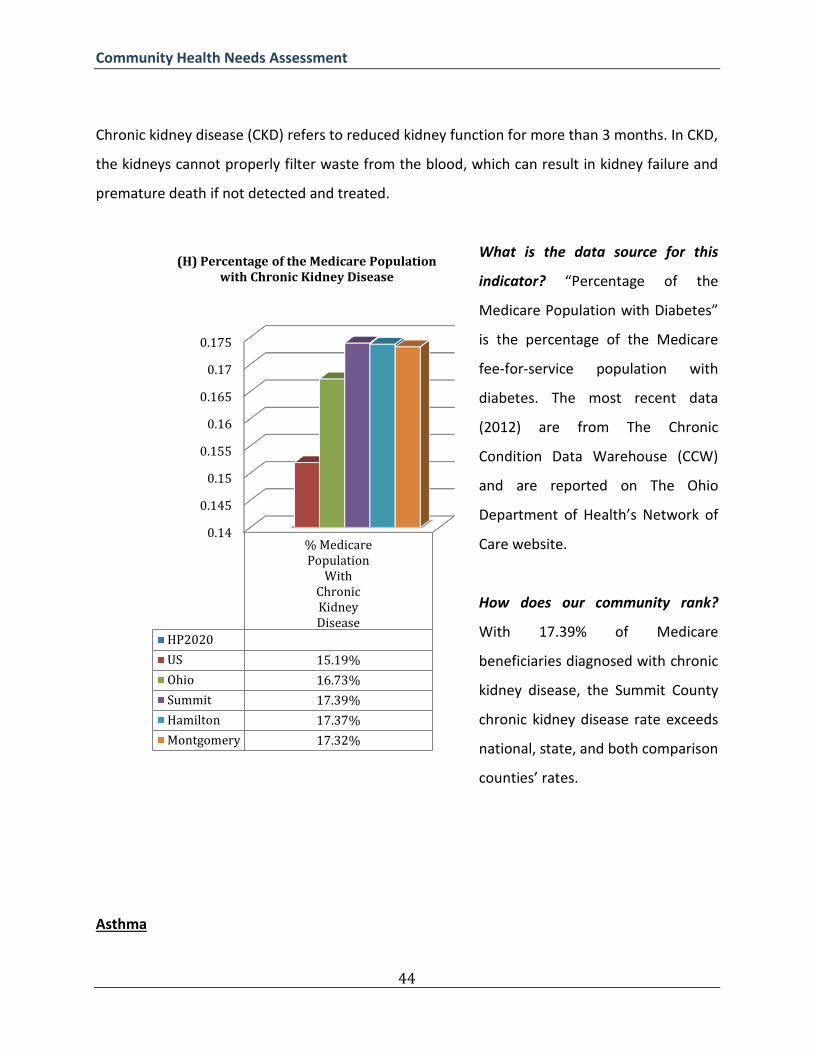
Chronic kidney disease (CKD) refers to reduced kidney function for more than 3 months. In CKD,
the kidneys cannot properly filter waste from the blood, which can result in kidney failure and
premature death if not detected and treated.
What is the data source for this
indicator? “Percentage of the
Medicare Population with Diabetes”
is the percentage of the Medicare
fee-for-service population with
diabetes. The most recent data
(2012) are from The Chronic
Condition Data Warehouse (CCW)
and are reported on The Ohio
Department of Health’s Network of
Care website.
How does our community rank?
With 17.39% of Medicare
beneficiaries diagnosed with chronic
kidney disease, the Summit County
chronic kidney disease rate exceeds
national, state, and both comparison
counties’ rates.
Asthma
0.14
0.145
0.15
0.155
0.16
0.165
0.17
0.175
% MedicarePopulation
WithChronicKidneyDisease
HP2020
US 15.19%
Ohio 16.73%
Summit 17.39%
Hamilton 17.37%
Montgomery 17.32%
(H) Percentage of the Medicare Population with Chronic Kidney Disease

Community Health Needs Assessment
45
Asthma is a disease that affects the lungs. When irritants such as smoke and air pollutants are
inhaled by a person with asthma, the lining of the respiratory system may become inflamed,
leading to wheezing, chest tightness, coughing, and difficulty breathing. Individuals with asthma
must employ specific medications to avoid this inflammation (also known as an asthma attack),
and must avoid triggers, which make asthma worse (CDC, 2012).
The percentage of adults with asthma, the percentage of Medicare beneficiaries with asthma,
the percentage of the Medicare population with COPD, and lung disease death rate were
examined.
1) Adults with Asthma
What is the data source for this
indicator? “Percentage of Adults with
Asthma” is the percentage of adults,
18 years of age and older, who self-
report that they have ever been told
by a doctor, nurse, or other health
professional that they had asthma.
The most recent data (2012) are from
the Centers for Medicare and
Medicaid Services (CMS) Chronic
Conditions Warehouse (CCW) and are
reported via the Community
Commons Community Health Needs
Assessment Toolkit.
How does our community rank? With 14.50% of Summit County adults self-reporting that they
have been told by a doctor, nurse, or other health professional that they have asthma, the
0
0.05
0.1
0.15
0.2
% AdultsWith
Asthma
HP2020
US 13.40%
Ohio 13.80%
Summit 14.50%
Hamilton 13%
Montgomery 16.10%
(H) Percentage of Adults with Asthma

Community Health Needs Assessment
46
Summit County asthma rate exceeds national, state, and one comparison county’s rates. The
Montgomery County rate (16.10%) is higher.
2) Medicare Beneficiaries with Asthma
What is the data source for this
indicator? “Percentage of Medicare
Beneficiaries with Asthma” is the
percentage of Medicare fee-for-
service beneficiaries who have
asthma. The most recent data (2012)
are from The Chronic Condition Data
Warehouse (CCW) and are reported
on The Ohio Department of Health’s
Network of Care website.
How does our community rank?
With 6.41% of Summit County
Medicare beneficiaries being
diagnosed with asthma, the Summit
County asthma rate exceeds
national, state, and both comparison
counties’ rates.
3) Medicare Beneficiaries with COPD
0.00%
1.00%
2.00%
3.00%
4.00%
5.00%
6.00%
7.00%
% MedicarePopulation
WithAsthma
HP2020
US 4.15%
Ohio 5.35%
Summit 6.41%
Hamilton 5.99%
Montgomery 5.23%
(H) Percentage of the Medicare Population with Asthma

Community Health Needs Assessment
47
What is the data source for this
indicator? “Percentage of Medicare
Beneficiaries with COPD” is the
percentage of Medicare fee-for-
service beneficiaries who have
Chronic Obstructive Pulmonary
Disease (COPD). The most recent
data (2012) are from The Chronic
Condition Data Warehouse (CCW)
and are reported on The Ohio
Department of Health’s Network of
Care website.
How does our community rank?
With 13.78% of Summit County
Medicare beneficiaries being
diagnosed with COPD, the Summit
County COPD rate exceeds the
national, state, and both comparison
counties’ rates.
4) Lung Disease Death Rate per 100,000
0.00%
2.00%
4.00%
6.00%
8.00%
10.00%
12.00%
14.00%
% MedicarePopulationWith COPD
HP2020
US 11.76%
Ohio 13.63%
Summit 13.78%
Hamilton 10.31%
Montgomery 12.91%
(H) Percentage of the Medicare Population with COPD
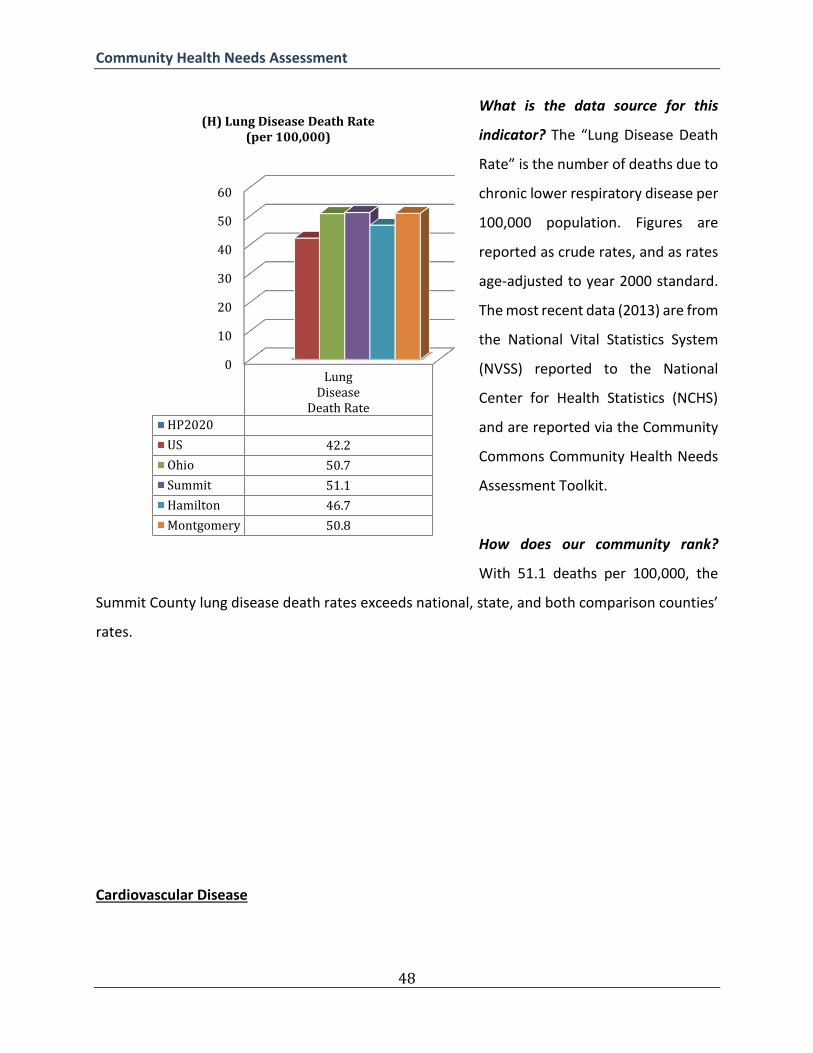
Community Health Needs Assessment
48
What is the data source for this
indicator? The “Lung Disease Death
Rate” is the number of deaths due to
chronic lower respiratory disease per
100,000 population. Figures are
reported as crude rates, and as rates
age-adjusted to year 2000 standard.
The most recent data (2013) are from
the National Vital Statistics System
(NVSS) reported to the National
Center for Health Statistics (NCHS)
and are reported via the Community
Commons Community Health Needs
Assessment Toolkit.
How does our community rank?
With 51.1 deaths per 100,000, the
Summit County lung disease death rates exceeds national, state, and both comparison counties’
rates.
Cardiovascular Disease
0
10
20
30
40
50
60
LungDisease
Death Rate
HP2020
US 42.2
Ohio 50.7
Summit 51.1
Hamilton 46.7
Montgomery 50.8
(H) Lung Disease Death Rate(per 100,000)

Community Health Needs Assessment
49
Cardiovascular disease is a term that encompasses a range of diseases that involve the heart,
capillaries, and veins. Heart attack and stroke are the most common cardiovascular diseases, and are
two of the most pervasive and expensive health problems in America. Each year, treatment of heart
attack and stroke costs hundreds of billions in health expenditures and diminished economic
productivity.
Risk Factors for Cardiovascular Disease
1) High Blood Pressure
High blood pressure, also referred to as
hypertension, means the pressure in
your blood is higher than it should be.
Having high blood pressure increases the
risk of both heart attack and stroke.
What is the data source for this
indicator? The “Percentage of the
Medicare Population with High Blood
Pressure” is the percentage of Medicare
fee-for-service beneficiaries with
hypertension. The most recent data
(2012) are from The Chronic Condition
Data Warehouse (CCW) and are reported
on The Ohio Department of Health’s
Network of Care website.
How does our community rank? With
58.39% of Summit County Medicare beneficiaries having high blood pressure, the Summit County
0.54
0.55
0.56
0.57
0.58
0.59
0.6
0.61
0.62
%Medicare
PopulationWith High
BloodPressure
HP2020
US 61.07%
Ohio 57.72%
Summit 58.39%
Hamilton 56.46%
Montgomery 57.49%
(H) Percentage of the Medicare Population with High Blood Pressure

Community Health Needs Assessment
50
high blood pressure rate exceeds state, and both comparison counties’ rates. The national rate
(61.07%) is higher.
2) High Cholesterol
Cholesterol is a waxy substance that the body needs, however in excessive amounts cholesterol
can build up in the arteries and cause problems. High blood levels of cholesterol put individuals
at risk for heart attack and stroke. In fact, people with high levels of cholesterol are at twice the
risk for heart attack as those with ideal levels (CDC, 2016).
What is the data source for this
indicator? The “Percentage of Adults
with High Cholesterol” is the
percentage of adults aged 18 and
older who self-report that they have
ever been told by a doctor, nurse, or
other health professional that they
had high blood cholesterol. The most
recent data (2012) are from The
Behavioral Risk Factor Surveillance
System (BRFSS), a collaborative
project of the Centers for Disease
Control and Prevention (CDC) and
U.S. states and territories. Data are
reported via the Community
Commons Community Health Needs
Assessment Toolkit.
0.0%
10.0%
20.0%
30.0%
40.0%
50.0%
% AdultsWith High
Cholesterol
HP2020 13.5%
US 38.52%
Ohio 38.70%
Summit 39.16%
Hamilton 34.09%
Montgomery 45.90%
(H) Percentage of Adults with High Cholesterol
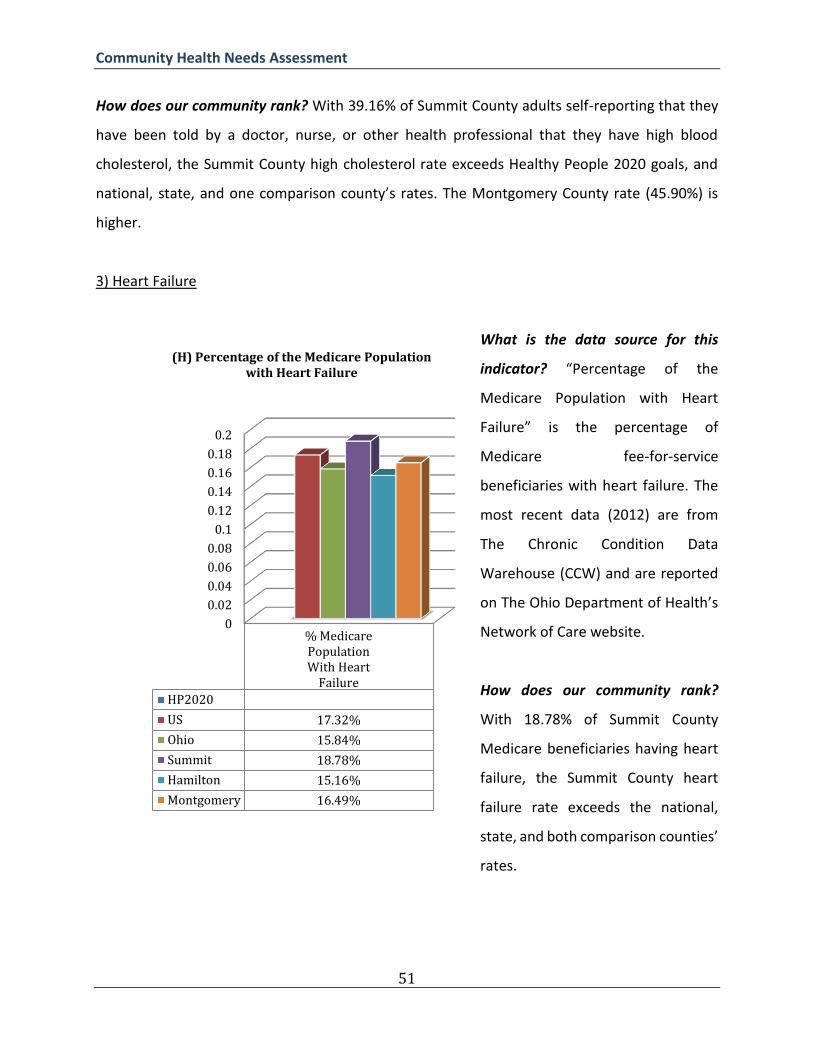
Community Health Needs Assessment
51
How does our community rank? With 39.16% of Summit County adults self-reporting that they
have been told by a doctor, nurse, or other health professional that they have high blood
cholesterol, the Summit County high cholesterol rate exceeds Healthy People 2020 goals, and
national, state, and one comparison county’s rates. The Montgomery County rate (45.90%) is
higher.
3) Heart Failure
What is the data source for this
indicator? “Percentage of the
Medicare Population with Heart
Failure” is the percentage of
Medicare fee-for-service
beneficiaries with heart failure. The
most recent data (2012) are from
The Chronic Condition Data
Warehouse (CCW) and are reported
on The Ohio Department of Health’s
Network of Care website.
How does our community rank?
With 18.78% of Summit County
Medicare beneficiaries having heart
failure, the Summit County heart
failure rate exceeds the national,
state, and both comparison counties’
rates.
0
0.02
0.04
0.06
0.08
0.1
0.12
0.14
0.16
0.18
0.2
% MedicarePopulationWith Heart
Failure
HP2020
US 17.32%
Ohio 15.84%
Summit 18.78%
Hamilton 15.16%
Montgomery 16.49%
(H) Percentage of the Medicare Population with Heart Failure
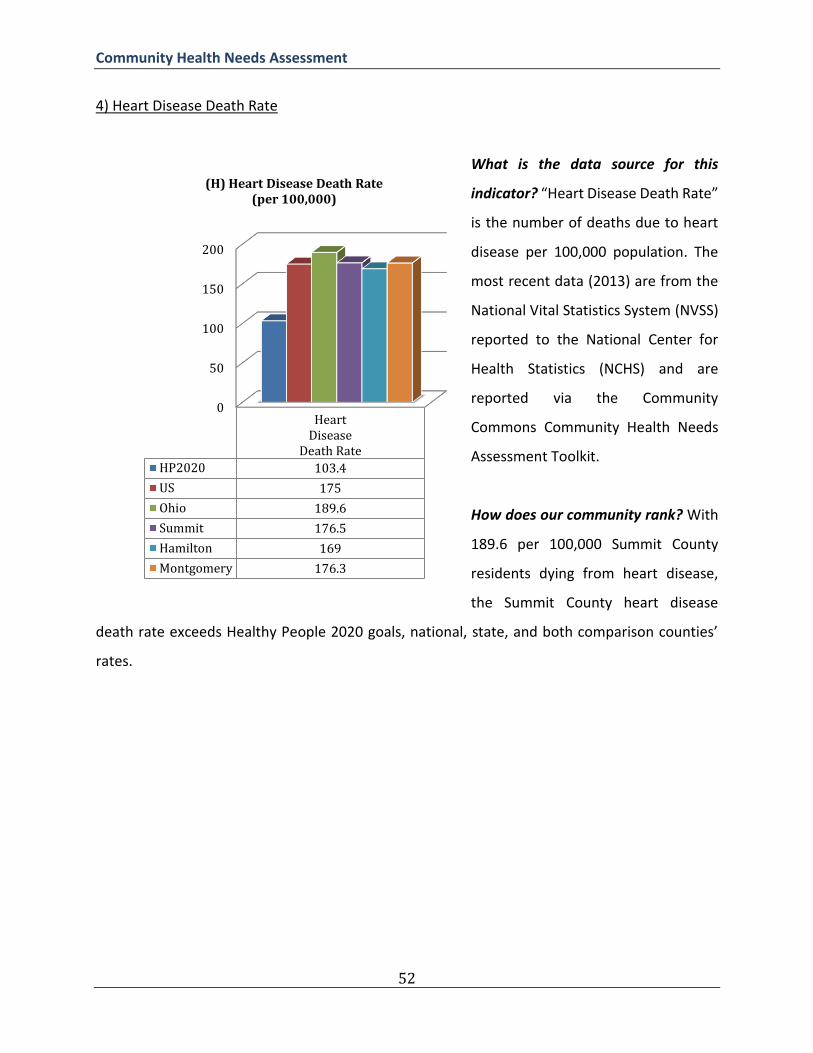
Community Health Needs Assessment
52
4) Heart Disease Death Rate
What is the data source for this
indicator? “Heart Disease Death Rate”
is the number of deaths due to heart
disease per 100,000 population. The
most recent data (2013) are from the
National Vital Statistics System (NVSS)
reported to the National Center for
Health Statistics (NCHS) and are
reported via the Community
Commons Community Health Needs
Assessment Toolkit.
How does our community rank? With
189.6 per 100,000 Summit County
residents dying from heart disease,
the Summit County heart disease
death rate exceeds Healthy People 2020 goals, national, state, and both comparison counties’
rates.
0
50
100
150
200
HeartDisease
Death Rate
HP2020 103.4
US 175
Ohio 189.6
Summit 176.5
Hamilton 169
Montgomery 176.3
(H) Heart Disease Death Rate(per 100,000)
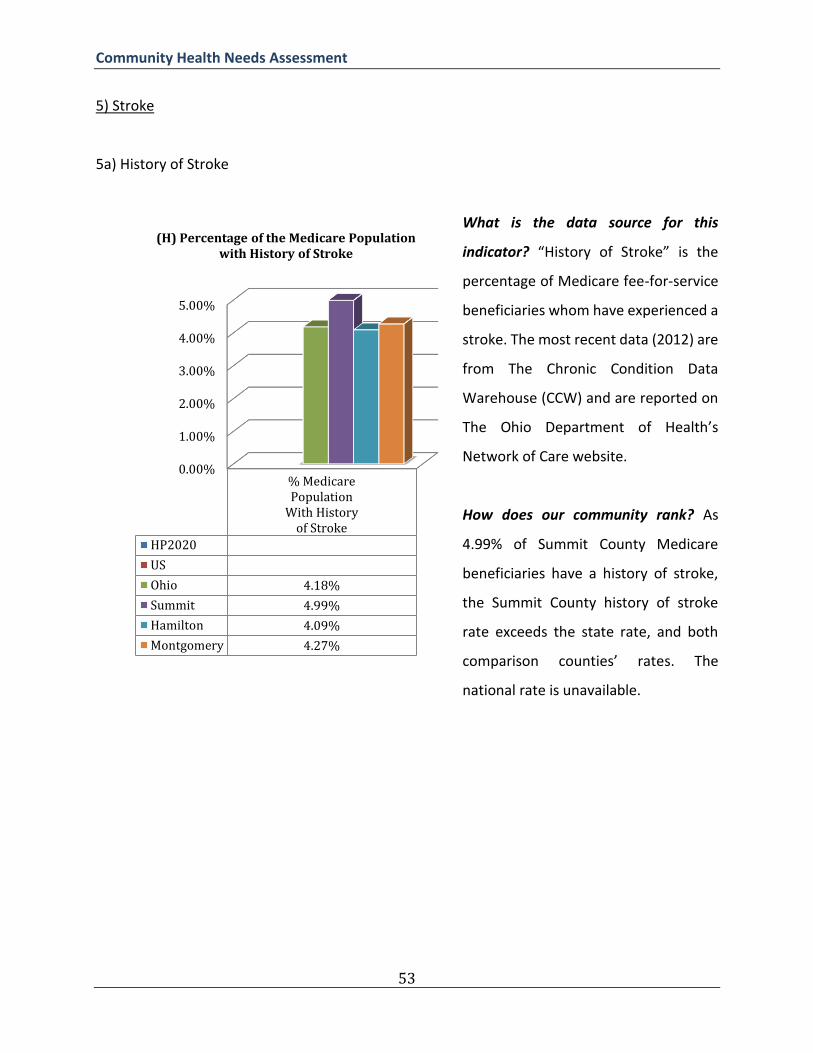
Community Health Needs Assessment
53
5) Stroke
5a) History of Stroke
What is the data source for this
indicator? “History of Stroke” is the
percentage of Medicare fee-for-service
beneficiaries whom have experienced a
stroke. The most recent data (2012) are
from The Chronic Condition Data
Warehouse (CCW) and are reported on
The Ohio Department of Health’s
Network of Care website.
How does our community rank? As
4.99% of Summit County Medicare
beneficiaries have a history of stroke,
the Summit County history of stroke
rate exceeds the state rate, and both
comparison counties’ rates. The
national rate is unavailable.
0.00%
1.00%
2.00%
3.00%
4.00%
5.00%
% MedicarePopulation
With Historyof Stroke
HP2020
US
Ohio 4.18%
Summit 4.99%
Hamilton 4.09%
Montgomery 4.27%
(H) Percentage of the Medicare Population with History of Stroke

Community Health Needs Assessment
54
5b) Stroke Death Rate per 100,000
What is the data source for this
indicator? “Stroke Death Rate” is the
number of deaths due to stroke per
100,000 population. The most recent
data (2013) are from the National
Vital Statistics System (NVSS),
reported to the National Center for
Health Statistics (NCHS), and are
available via the Community
Commons Community Health Needs
Assessment Toolkit.
How does our community rank?
With 41.1 per 100,000 Summit
County residents dying from stroke,
the Summit County stroke death rate
exceeds Healthy People 2020 goals,
national, and one comparison county’s rates. The state (41.4) and Hamilton County (48.2) rates
are higher.
0
10
20
30
40
50
StrokeDeath Rate
HP2020 34.8
US 37.9
Ohio 41.4
Summit 41.1
Hamilton 48.2
Montgomery 39.1
(H) Stroke Death Rate(per 100,000)
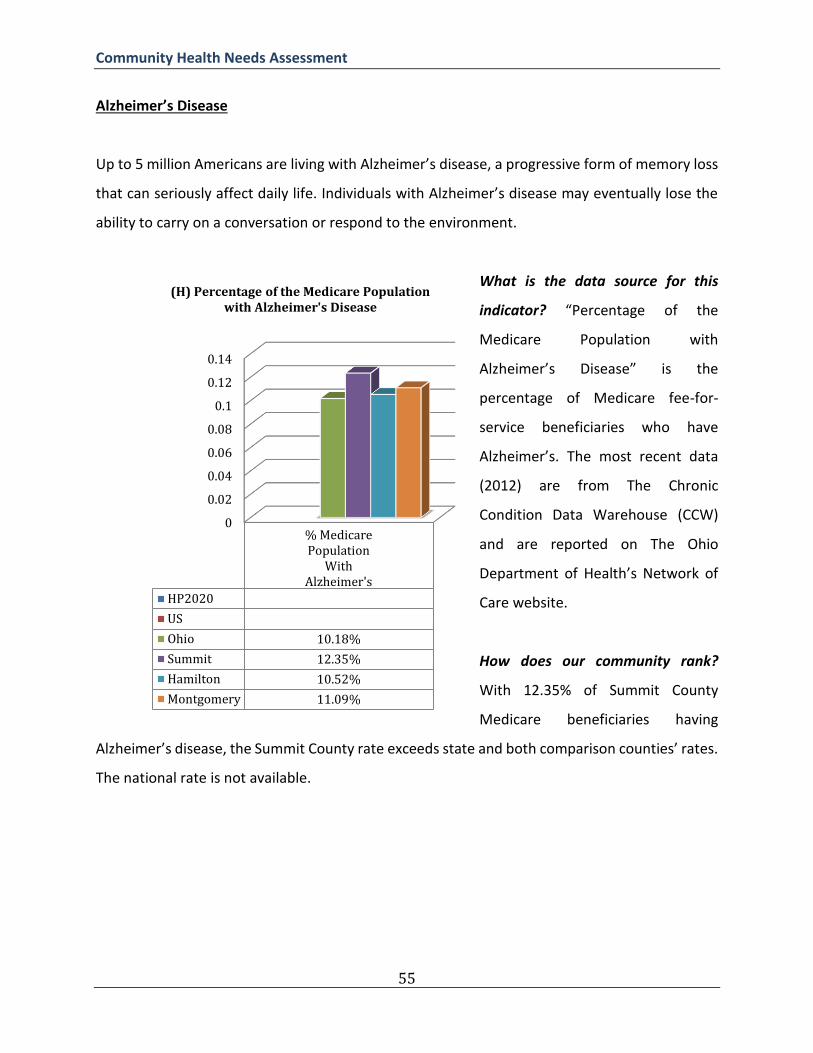
Community Health Needs Assessment
55
Alzheimer’s Disease
Up to 5 million Americans are living with Alzheimer’s disease, a progressive form of memory loss
that can seriously affect daily life. Individuals with Alzheimer’s disease may eventually lose the
ability to carry on a conversation or respond to the environment.
What is the data source for this
indicator? “Percentage of the
Medicare Population with
Alzheimer’s Disease” is the
percentage of Medicare fee-for-
service beneficiaries who have
Alzheimer’s. The most recent data
(2012) are from The Chronic
Condition Data Warehouse (CCW)
and are reported on The Ohio
Department of Health’s Network of
Care website.
How does our community rank?
With 12.35% of Summit County
Medicare beneficiaries having
Alzheimer’s disease, the Summit County rate exceeds state and both comparison counties’ rates.
The national rate is not available.
0
0.02
0.04
0.06
0.08
0.1
0.12
0.14
% MedicarePopulation
WithAlzheimer's
HP2020
US
Ohio 10.18%
Summit 12.35%
Hamilton 10.52%
Montgomery 11.09%
(H) Percentage of the Medicare Population with Alzheimer's Disease

Community Health Needs Assessment
56
Osteoporosis
Osteoporosis is a disease involving weakened bones and decreased bone mass, which increases
the risk of fractures. Breaking a bone can have serious consequences, especially for older adults,
including chronic pain, loss of mobility, and depression. Breaking a hip is particularly dangerous
for seniors: 20% of those who break a hip die within one year and many more end up in long-
term care (National Osteoporosis Foundation, 2016).
What is the data source for this
indicator? “Percentage of the
Medicare Population with
Osteoporosis” is the percentage of
Medicare fee-for-service
beneficiaries with osteoporosis. The
most recent data (2012) are from
The Chronic Condition Data
Warehouse (CCW) and are reported
on The Ohio Department of Health’s
Network of Care website.
How does our community rank?
With 6.93% of Summit County
Medicare beneficiaries having
osteoporosis, the Summit County
rate exceeds state and both
comparison counties’ rates. The
national rate is not available.
0.058
0.06
0.062
0.064
0.066
0.068
0.07
% Medicare PopulationWith Osteoporosis
HP2020
US
Ohio 6.22%
Summit 6.93%
Hamilton 6.68%
Montgomery 6.70%
(H) Percentage of the Medicare Population with Osteoporosis
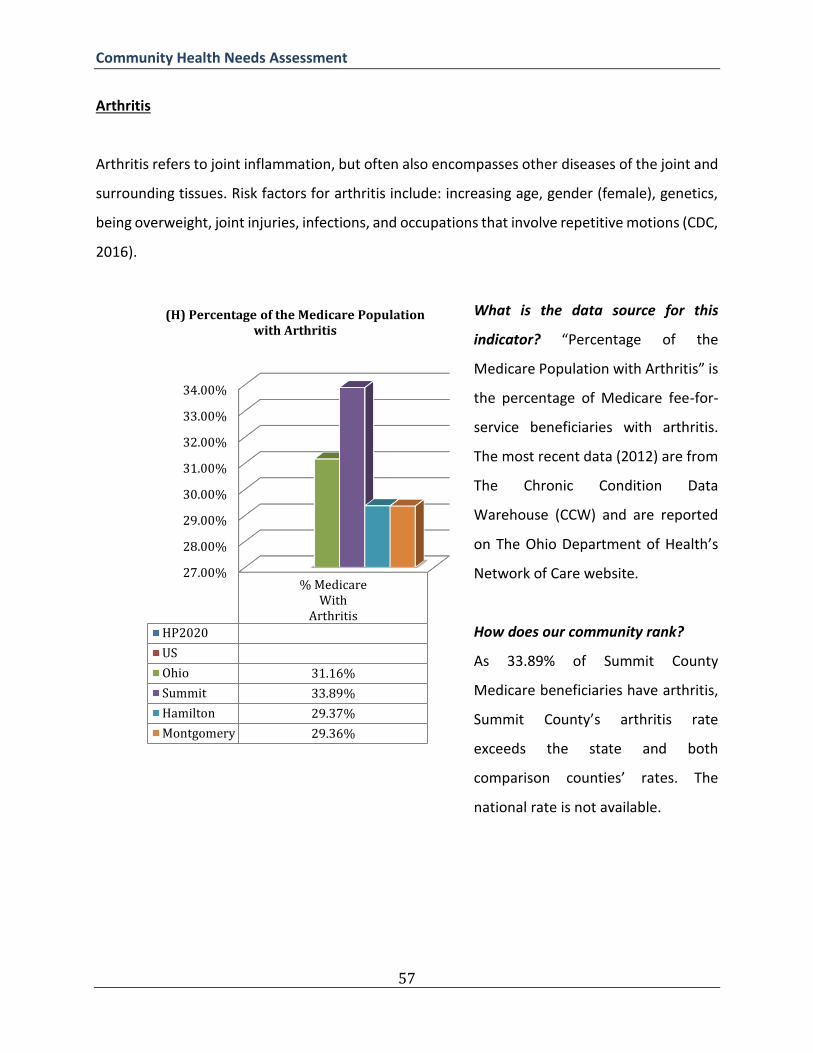
Community Health Needs Assessment
57
Arthritis
Arthritis refers to joint inflammation, but often also encompasses other diseases of the joint and
surrounding tissues. Risk factors for arthritis include: increasing age, gender (female), genetics,
being overweight, joint injuries, infections, and occupations that involve repetitive motions (CDC,
2016).
What is the data source for this
indicator? “Percentage of the
Medicare Population with Arthritis” is
the percentage of Medicare fee-for-
service beneficiaries with arthritis.
The most recent data (2012) are from
The Chronic Condition Data
Warehouse (CCW) and are reported
on The Ohio Department of Health’s
Network of Care website.
How does our community rank?
As 33.89% of Summit County
Medicare beneficiaries have arthritis,
Summit County’s arthritis rate
exceeds the state and both
comparison counties’ rates. The
national rate is not available.
27.00%
28.00%
29.00%
30.00%
31.00%
32.00%
33.00%
34.00%
% MedicareWith
Arthritis
HP2020
US
Ohio 31.16%
Summit 33.89%
Hamilton 29.37%
Montgomery 29.36%
(H) Percentage of the Medicare Population with Arthritis

Community Health Needs Assessment
58
Environmental Factors
Environmental risk factors are a broad category of external conditions that can negatively affect
health outcomes. These include air and water quality, presence of toxic substances, public health
infrastructure, and community assets and deficits. They are especially important for children,
since they can have a lasting impact on healthy physical and mental development.
Water Quality
What is the data source for this
indicator? “Percentage of
Households with Drinking Water
Quality Violations” is the percentage
of households in the population
potentially exposed to water that
exceeded a violation limit during the
past year. The most recent data
(2013-2014) are from The Safe
Drinking Water Information System
(SDWIS), as reported to EPA by the
states, and are available via County
Health Rankings.
How does our community rank?
With 4.0% of Summit County
households experiencing drinking
water violations, the Summit County rate is the same as the state rate and higher than both
comparison counties’ rates.
0
0.005
0.01
0.015
0.02
0.025
0.03
0.035
0.04
%Households
withDrinking
WaterViolations
HP2020
US
Ohio 4.00%
Summit 4.00%
Hamilton 0.00%
Montgomery 0.00%
(H) Percentage of Households with Drinking Water Violations
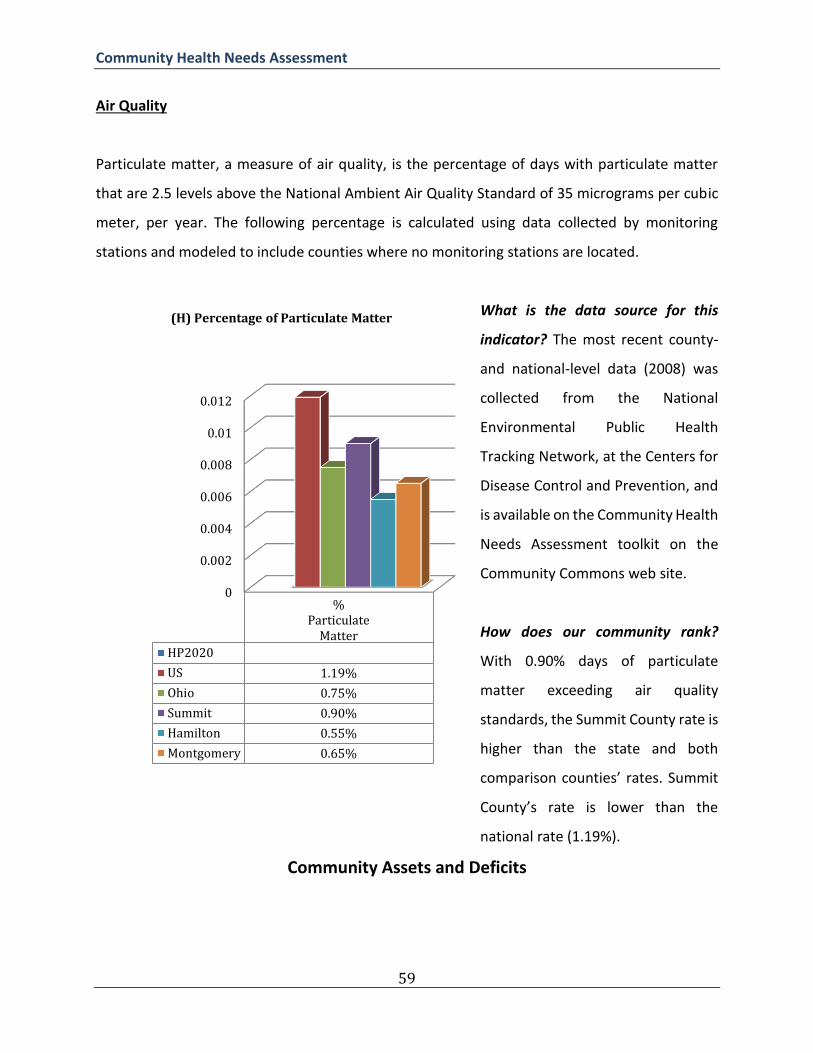
Community Health Needs Assessment
59
Air Quality
Particulate matter, a measure of air quality, is the percentage of days with particulate matter
that are 2.5 levels above the National Ambient Air Quality Standard of 35 micrograms per cubic
meter, per year. The following percentage is calculated using data collected by monitoring
stations and modeled to include counties where no monitoring stations are located.
What is the data source for this
indicator? The most recent county-
and national-level data (2008) was
collected from the National
Environmental Public Health
Tracking Network, at the Centers for
Disease Control and Prevention, and
is available on the Community Health
Needs Assessment toolkit on the
Community Commons web site.
How does our community rank?
With 0.90% days of particulate
matter exceeding air quality
standards, the Summit County rate is
higher than the state and both
comparison counties’ rates. Summit
County’s rate is lower than the
national rate (1.19%).
Community Assets and Deficits
0
0.002
0.004
0.006
0.008
0.01
0.012
%Particulate
Matter
HP2020
US 1.19%
Ohio 0.75%
Summit 0.90%
Hamilton 0.55%
Montgomery 0.65%
(H) Percentage of Particulate Matter

Community Health Needs Assessment
60
Community assets are strengths within the community, including: knowledge and skills of
residents, community associations, businesses, institutions, services, physical structures, and
natural resources. Community deficits are needs and/or problems identified within the
community. Several indicators were examined to assess community assets and deficits, including
access to grocery stores, crime and violence rates, and housing costs.
Access to Grocery Stores
Access to grocery stores and the number of
fast food restaurants are measures of access
to healthy food and the effect of the
environment on diet.
What is the data source for this indicator?
“Number of Grocery Stores per 100,000” is the
number of grocery stores per 100,000
population. Grocery stores can be defined as
supermarkets and/or smaller grocery stores
primarily engaged in retailing a general line of
food. Included in this count are delicatessen-
type establishments. Convenience stores and
large general merchandise stores that also
retail food, such as supercenters and warehouse club stores, are excluded. The most recent data
(2013) are from County Business Patterns, which are extracted from the Business Register (BR),
a database of all known single and multi-establishment employer companies maintained and
updated by the U.S. Census Bureau. These data are available on the Community Health Needs
Assessment toolkit on the Community Commons web site.
0
5
10
15
20
25
# GroceryStores per100,000
HP2020
US 21.2
Ohio 18.2
Summit 16.06
Hamilton 21.44
Montgomery 15.14
(H) Number of Grocery Stores (per 100,000)
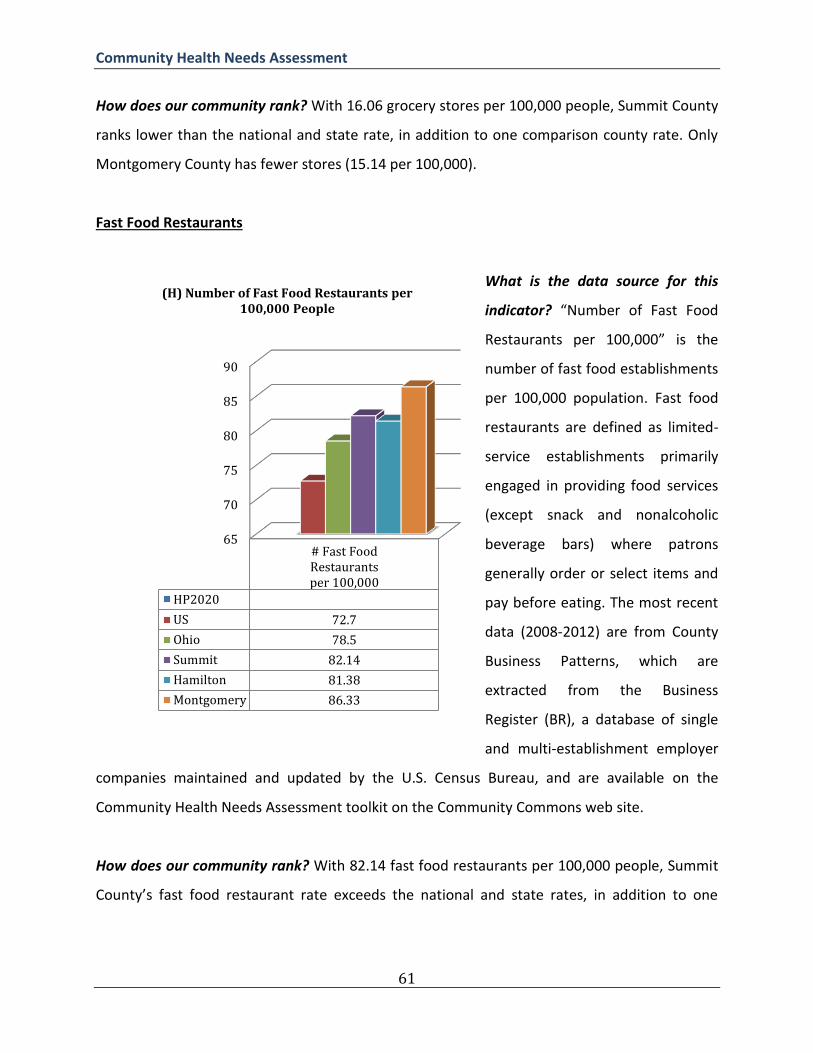
Community Health Needs Assessment
61
How does our community rank? With 16.06 grocery stores per 100,000 people, Summit County
ranks lower than the national and state rate, in addition to one comparison county rate. Only
Montgomery County has fewer stores (15.14 per 100,000).
Fast Food Restaurants
What is the data source for this
indicator? “Number of Fast Food
Restaurants per 100,000” is the
number of fast food establishments
per 100,000 population. Fast food
restaurants are defined as limited-
service establishments primarily
engaged in providing food services
(except snack and nonalcoholic
beverage bars) where patrons
generally order or select items and
pay before eating. The most recent
data (2008-2012) are from County
Business Patterns, which are
extracted from the Business
Register (BR), a database of single
and multi-establishment employer
companies maintained and updated by the U.S. Census Bureau, and are available on the
Community Health Needs Assessment toolkit on the Community Commons web site.
How does our community rank? With 82.14 fast food restaurants per 100,000 people, Summit
County’s fast food restaurant rate exceeds the national and state rates, in addition to one
65
70
75
80
85
90
# Fast FoodRestaurantsper 100,000
HP2020
US 72.7
Ohio 78.5
Summit 82.14
Hamilton 81.38
Montgomery 86.33
(H) Number of Fast Food Restaurants per 100,000 People

Community Health Needs Assessment
62
comparison county’s rate. Only Montgomery County has more fast food restaurants (86.33 per
100,000).
Crime & Violence - Homicide
Homicide is the intentional and unlawful killing of one person by another person.
What is the data source for this
indicator? “Homicide Rate” is the
rate of deaths due to homicide per
100,000 population. The most recent
data (2013) were reported via the
Community Health Needs
Assessment Toolkit.
How does our community rank?
With 5.9 homicide deaths per
100,000 people, the Summit County
rate exceeds Healthy People 2020
goals and the national and state
rates. Summit County has fewer
homicides per 100,000 than both
comparison counties.
0
2
4
6
8
10
HomicideRate
HP2020 5.5
US 5.3
Ohio 5.4
Summit 5.9
Hamilton 9.3
Montgomery 9.6
(H) Homicide Rate (per 100,000)
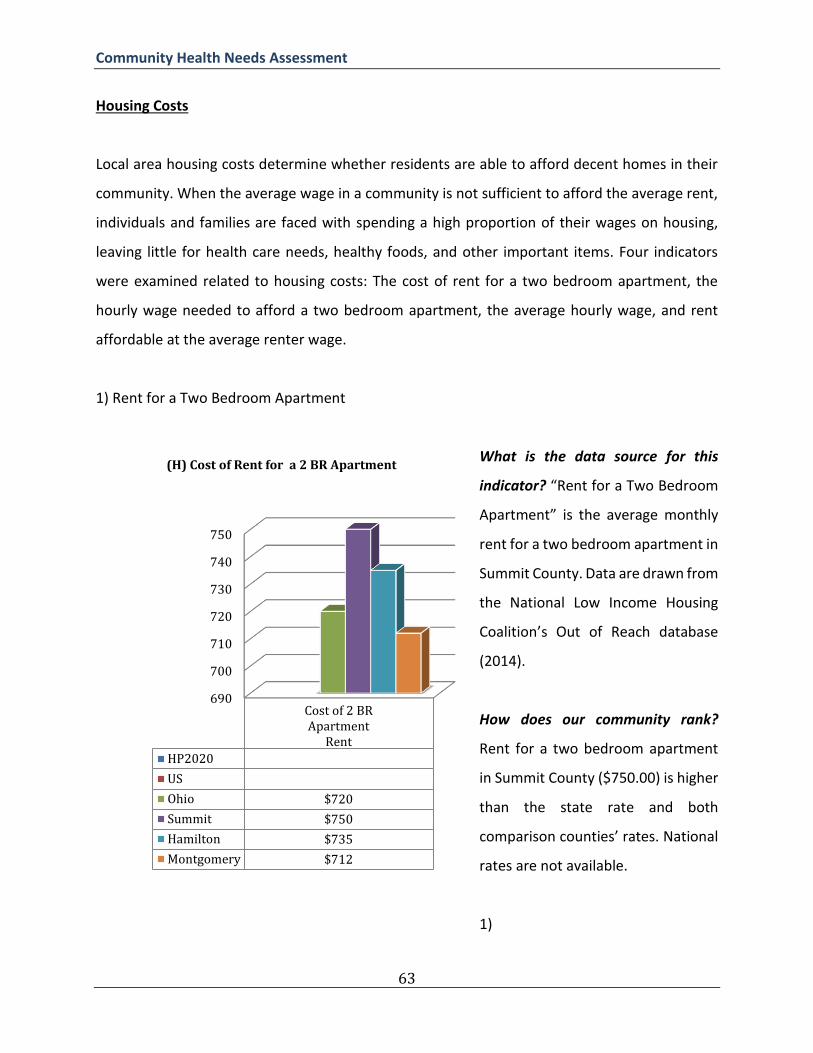
Community Health Needs Assessment
63
Housing Costs
Local area housing costs determine whether residents are able to afford decent homes in their
community. When the average wage in a community is not sufficient to afford the average rent,
individuals and families are faced with spending a high proportion of their wages on housing,
leaving little for health care needs, healthy foods, and other important items. Four indicators
were examined related to housing costs: The cost of rent for a two bedroom apartment, the
hourly wage needed to afford a two bedroom apartment, the average hourly wage, and rent
affordable at the average renter wage.
1) Rent for a Two Bedroom Apartment
What is the data source for this
indicator? “Rent for a Two Bedroom
Apartment” is the average monthly
rent for a two bedroom apartment in
Summit County. Data are drawn from
the National Low Income Housing
Coalition’s Out of Reach database
(2014).
How does our community rank?
Rent for a two bedroom apartment
in Summit County ($750.00) is higher
than the state rate and both
comparison counties’ rates. National
rates are not available.
1)
690
700
710
720
730
740
750
Cost of 2 BRApartment
Rent
HP2020
US
Ohio $720
Summit $750
Hamilton $735
Montgomery $712
(H) Cost of Rent for a 2 BR Apartment

Community Health Needs Assessment
64
2) Hourly Wage Needed to Afford a Two Bedroom Apartment
What is the data source for this
indicator? “Hourly Wage Needed to
Afford a Two Bedroom Apartment” is
the amount a resident of Summit
County would need to earn hourly in
order to afford the average rent of a
two bedroom apartment in Summit
County. Data are drawn from the
National Low Income Housing
Coalition’s Out of Reach database
(2014).
How does our community rank? The
hourly wage needed to afford a 2
bedroom apartment in Summit
County is $14.42, which is higher
than the state wage, as well as both
comparison counties’ wage. The
national wage is not available.
13.2
13.4
13.6
13.8
14
14.2
14.4
14.6
HourlyWage
Needed toAfford 2 BRApartment
HP2020
US
Ohio $13.84
Summit $14.42
Hamilton $14.13
Montgomery $13.69
(H) Hourly Wage Needed to Afford a 2 BR Apartment
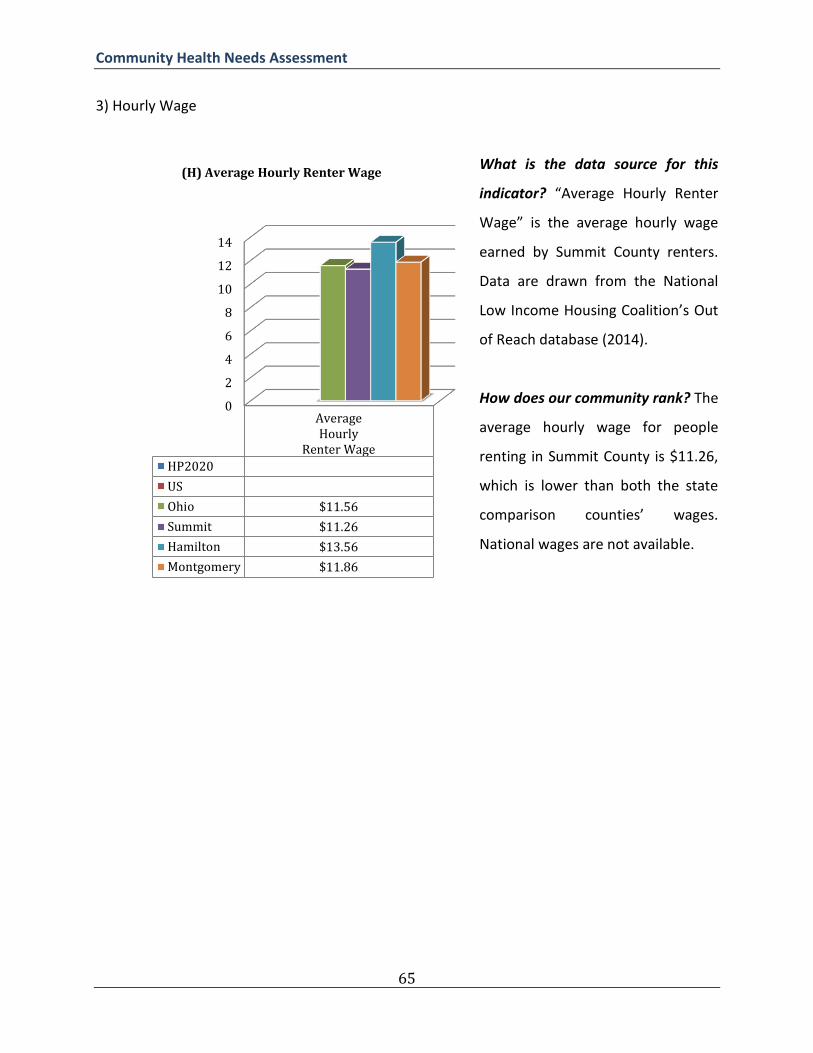
Community Health Needs Assessment
65
3) Hourly Wage
What is the data source for this
indicator? “Average Hourly Renter
Wage” is the average hourly wage
earned by Summit County renters.
Data are drawn from the National
Low Income Housing Coalition’s Out
of Reach database (2014).
How does our community rank? The
average hourly wage for people
renting in Summit County is $11.26,
which is lower than both the state
comparison counties’ wages.
National wages are not available.
0
2
4
6
8
10
12
14
AverageHourly
Renter Wage
HP2020
US
Ohio $11.56
Summit $11.26
Hamilton $13.56
Montgomery $11.86
(H) Average Hourly Renter Wage

Community Health Needs Assessment
66
4) Rent Affordable at Average Renter Wage
What is the data source for this
indicator? “Rent Affordable at
Average Renter Wage” is the rent
that would be affordable for Summit
County renters based on the average
hourly wage for renters in Summit
County. Data are drawn from the
National Low Income Housing
Coalition’s Out of Reach database
(2014).
How does our community rank? The
average Summit County renter
would be able to afford $585.00 in
monthly rent, which is lower than
the state and both comparison
counties’ affordable rent rates.
National rents are not available.
0
100
200
300
400
500
600
700
800
RentAffordable
at MeanRenter Wage
HP2020
US
Ohio $601
Summit $586
Hamilton $705
Montgomery $617
(H) Rent Affordable at Mean Renter Wage

Community Health Needs Assessment
67
5) Number of Full-Time Renter Wage Jobs Needed to Afford Average Rent
What is the data source for this
indicator? “Number of Full-Time
Renter Wage Jobs Needed to Afford
Average Rent” is the number of full-
time jobs Summit County renters
would need to have to afford the
average rent for a two bedroom
apartment in Summit County. Data
are drawn from the National Low
Income Housing Coalition’s Out of
Reach database (2014).
How does our community rank? The
average Summit County renter
would need to work 1.3 full time jobs
to afford the average rent for a two
bedroom apartment in Summit
County. This is more than an average
worker would need to work at the
state level and in both comparison
counties. National data are not
available.
0
0.2
0.4
0.6
0.8
1
1.2
1.4
Full-TimeMean Renter
Wage JobsNeeded to
AffordAverage
Rent
HP2020
US
Ohio 1.2
Summit 1.3
Hamilton 1
Montgomery 1.2
(H) Full-Time Mean Renter Wage Jobs Needed to Afford Average Rent

Community Health Needs Assessment
68
Infectious Disease
Infectious diseases are caused by microorganisms such as bacteria, viruses, parasites or fungi and
can be spread from person to person (WHO, 2016). Common infectious diseases in the United
States range include the common cold and infectious gastroenteritis, to diseases that can be
more severe, such as HIV and other sexually transmitted infections (STIs), hepatitis, influenza,
pneumonia, and viral meningitis.
Influenza and Pneumonia
Influenza seasons vary in severity depending upon a variety of factors. Each year in the United
States, millions of people get sick, hundreds of thousands are hospitalized, and thousands (or
tens of thousands) of people die from influenza.
What is the data source for this
indicator? “Influenza and Pneumonia
Death Rate” is the number of deaths
due to influenza and pneumonia per
100,000 residents. The most recent
data (2009-2011) are drawn from the
Ohio Department of Health’s Network
of Care website.
How does our community rank? The
Summit County influenza and
pneumonia death rate per 100,000 is
19, which is higher than the state and
both comparison counties’ rates.
National rates are not available.
0
5
10
15
20
Influenzaand
PneumoniaDeath Rate
HP2020
US
Ohio 15.4
Summit 19
Hamilton 15.2
Montgomery 11
(H) Influenza and Pneumonia Death Rate (Age-adjusted)

Community Health Needs Assessment
69
Viral Meningitis
Viral meningitis is the inflammation of the tissue that covers the brain and spinal cord. Viral
meningitis is often less severe than bacterial meningitis and usually does not require specific
treatment. However, some risk factors can cause viral meningitis to become severe and even
fatal.
What is the data source for this
indicator? “Viral Meningitis infection
Rate” is the number of cases of viral
meningitis per 100,000 population.
The most recent data (2012) are
drawn from the Ohio Department of
Health’s Network of Care web site.
How does our community rank? The
Summit County viral meningitis
infection rates of 10.5 per 100,000 is
higher than the state and both
comparison counties’ rates. National
data are not available.
Injury and Accidents
0
2
4
6
8
10
12
ViralMeningitis
Rate
HP2020
US
Ohio 6.1
Summit 10.5
Hamilton 8.2
Montgomery 8
(H) Viral Meningitis Infection Rate (per 100,000)
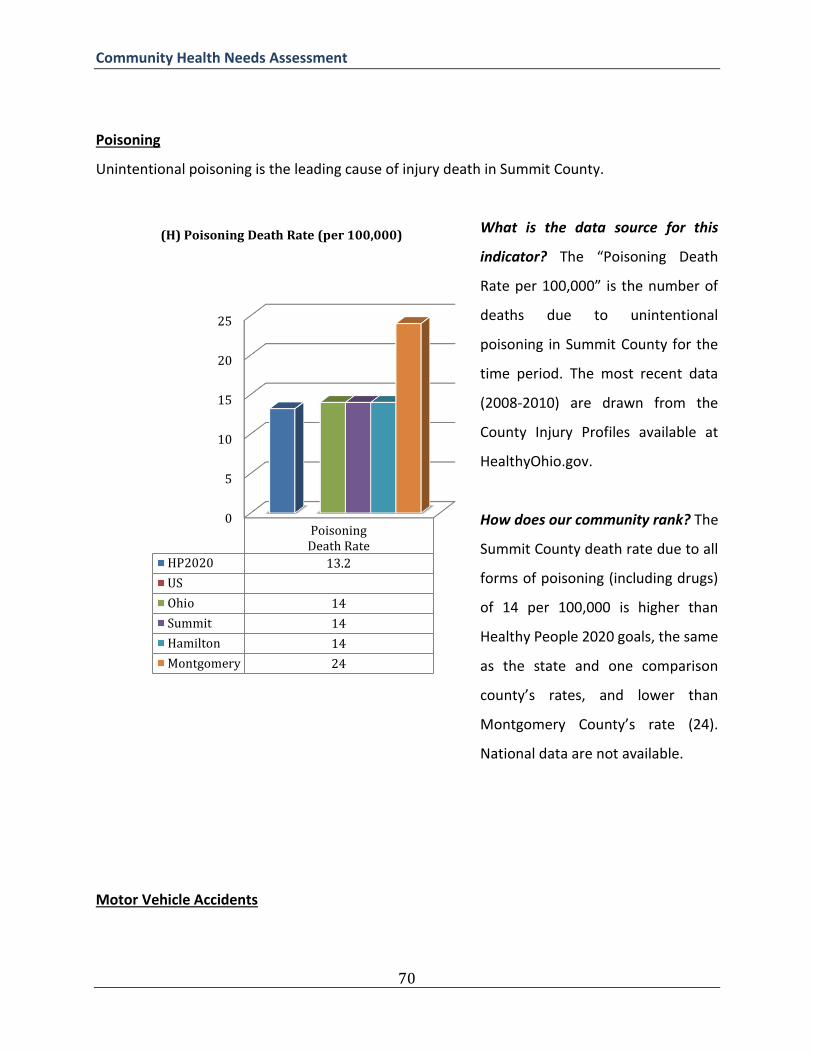
Community Health Needs Assessment
70
Poisoning
Unintentional poisoning is the leading cause of injury death in Summit County.
What is the data source for this
indicator? The “Poisoning Death
Rate per 100,000” is the number of
deaths due to unintentional
poisoning in Summit County for the
time period. The most recent data
(2008-2010) are drawn from the
County Injury Profiles available at
HealthyOhio.gov.
How does our community rank? The
Summit County death rate due to all
forms of poisoning (including drugs)
of 14 per 100,000 is higher than
Healthy People 2020 goals, the same
as the state and one comparison
county’s rates, and lower than
Montgomery County’s rate (24).
National data are not available.
Motor Vehicle Accidents
0
5
10
15
20
25
PoisoningDeath Rate
HP2020 13.2
US
Ohio 14
Summit 14
Hamilton 14
Montgomery 24
(H) Poisoning Death Rate (per 100,000)
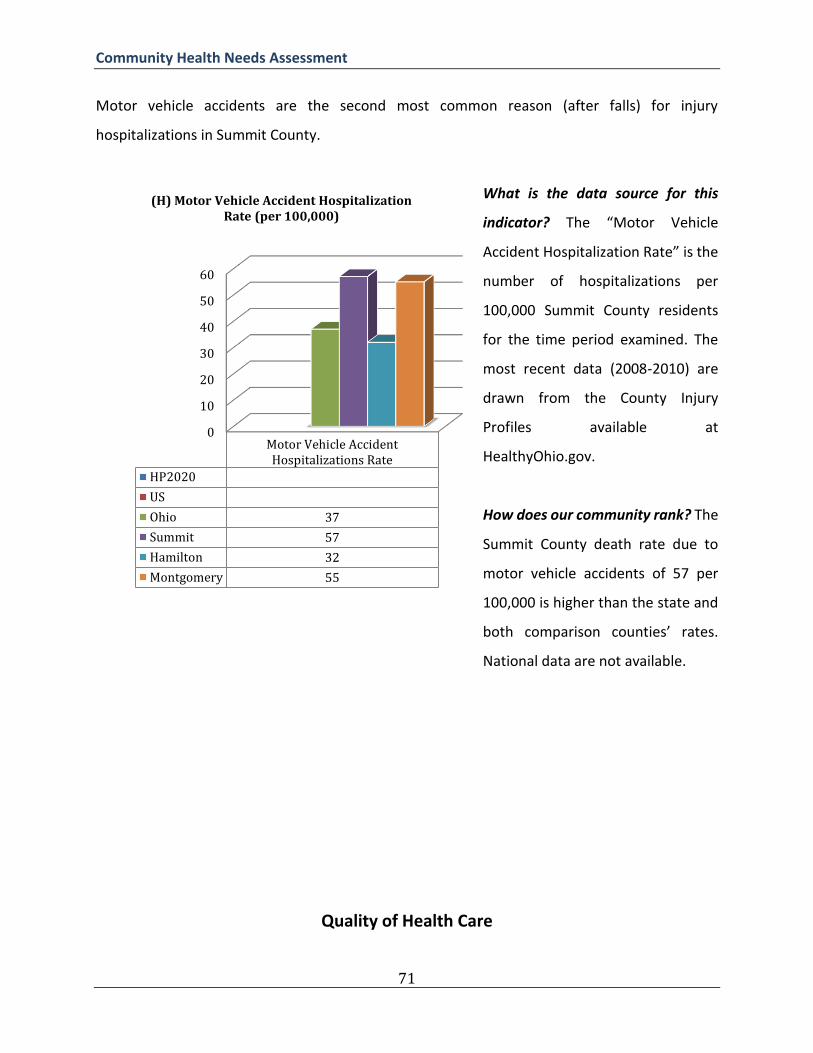
Community Health Needs Assessment
71
Motor vehicle accidents are the second most common reason (after falls) for injury
hospitalizations in Summit County.
What is the data source for this
indicator? The “Motor Vehicle
Accident Hospitalization Rate” is the
number of hospitalizations per
100,000 Summit County residents
for the time period examined. The
most recent data (2008-2010) are
drawn from the County Injury
Profiles available at
HealthyOhio.gov.
How does our community rank? The
Summit County death rate due to
motor vehicle accidents of 57 per
100,000 is higher than the state and
both comparison counties’ rates.
National data are not available.
Quality of Health Care
0
10
20
30
40
50
60
Motor Vehicle AccidentHospitalizations Rate
HP2020
US
Ohio 37
Summit 57
Hamilton 32
Montgomery 55
(H) Motor Vehicle Accident Hospitalization Rate (per 100,000)
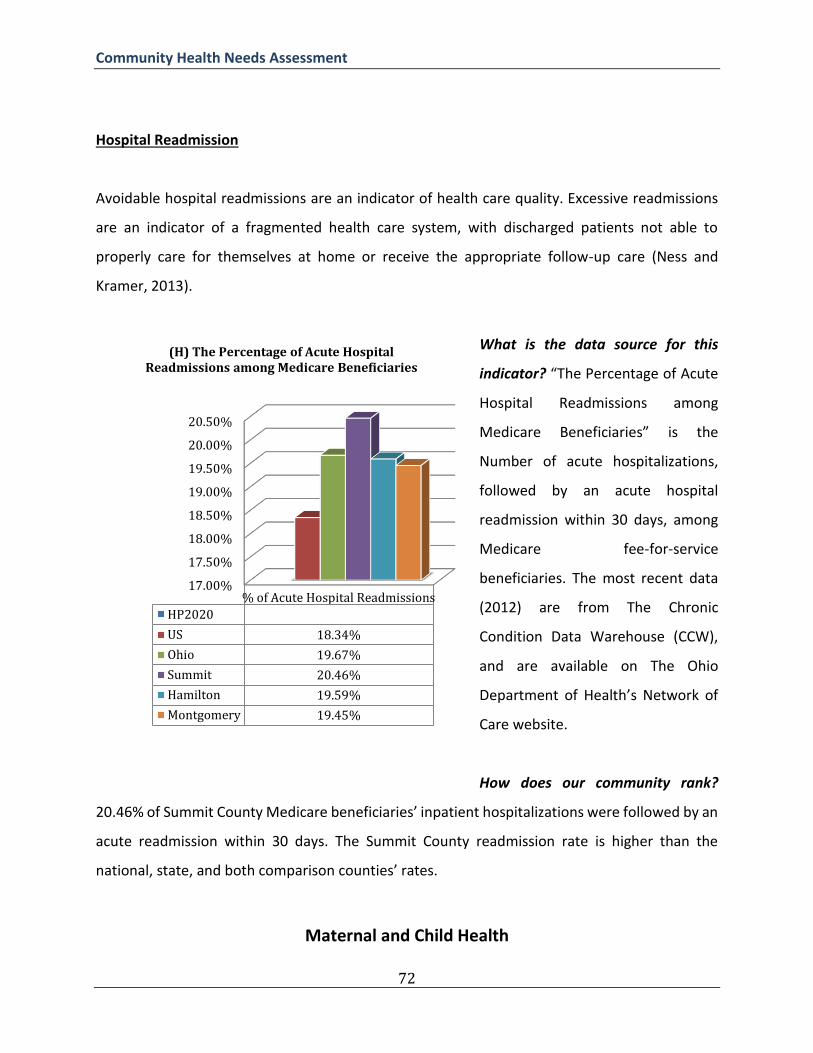
Community Health Needs Assessment
72
Hospital Readmission
Avoidable hospital readmissions are an indicator of health care quality. Excessive readmissions
are an indicator of a fragmented health care system, with discharged patients not able to
properly care for themselves at home or receive the appropriate follow-up care (Ness and
Kramer, 2013).
What is the data source for this
indicator? “The Percentage of Acute
Hospital Readmissions among
Medicare Beneficiaries” is the
Number of acute hospitalizations,
followed by an acute hospital
readmission within 30 days, among
Medicare fee-for-service
beneficiaries. The most recent data
(2012) are from The Chronic
Condition Data Warehouse (CCW),
and are available on The Ohio
Department of Health’s Network of
Care website.
How does our community rank?
20.46% of Summit County Medicare beneficiaries’ inpatient hospitalizations were followed by an
acute readmission within 30 days. The Summit County readmission rate is higher than the
national, state, and both comparison counties’ rates.
Maternal and Child Health
17.00%
17.50%
18.00%
18.50%
19.00%
19.50%
20.00%
20.50%
% of Acute Hospital Readmissions
HP2020
US 18.34%
Ohio 19.67%
Summit 20.46%
Hamilton 19.59%
Montgomery 19.45%
(H) The Percentage of Acute Hospital Readmissions among Medicare Beneficiaries

Community Health Needs Assessment
73
Maternal and infant health is a broad category of factors that affect pregnancy and childbirth.
Improving the well-being of mothers and infants is an important public health goal in the United
States. Healthy birth outcomes and early identification and treatment of health conditions among
infants can prevent death or disability and enable children to reach their full potential (HHS,
2013).
Infant Mortality was identified as a significant health need in Summit County.
Infant Mortality
Each year, roughly 25,000 infants die in the
United States (CDC, 2012). Infant mortality is
measured by the overall number of deaths
before day 28 (neonatal mortality).
What is the data source for this indicator? The
“Infant Death Rate 0-28 days”, or “Neonatal
Mortality”, is the number of deaths from any
cause in the first 28 days of life per 1,000 live
births. The most recent county- and national-
level data (2010) were modeled based on
reported data from 2004-2010. The data were
collected from the National Vital Statistics
System at the National Center for Health
Statistics and reported on the Community
Health Needs Assessment toolkit on the
Community Commons web site.
0
1
2
3
4
5
6
7
8
InfantDeath
Rate 0-28Days
HP2020 4.1
US 4.6
Ohio 5.2
Summit 5.3
Hamilton 7.5
Montgomery 4.5
(C) Infant Death Rate 0-28 Days (per 1,000 live births)

Community Health Needs Assessment
74
How does our community rank? 5.2 infants die within 28 days per 1,000 births in Summit County.
The Summit County infant death rate is higher than Healthy People 2020 goals, in addition to the
national and state rates, and one comparison county’s rates. Hamilton County has a higher rate
(7.5) of infant death.
Substance Abuse
Substance abuse refers to a set of conditions associated with the consumption of mind- and
behavior-altering substances that have negative behavioral and health outcomes (Healthy People
2020). Some of the substances abused are legal, such as alcohol for adults; some are illegal, such
as heroin; and some are legal but illegally used, such as the misuse of prescription drugs by people
not prescribed them.
Three indicators are presented for substance abuse: The number of adults who report heavy
alcohol consumption, the percentage of driving deaths associated with alcohol, and the
percentage of adults abusing prescription drugs.
Heavy Alcohol Consumption
Alcohol abuse is a medical term that describes the frequent use of beverages that contain ethyl
alcohol in spite of the harmful effects of frequent alcohol consumption. Harmful effects of
alcohol abuse include inability to meet major professional or social obligations, drinking in high-
risk situations, dysfunction in social relationships, legal consequences of violation of laws that
dictate appropriate alcohol use, and alcohol dependence. Alcohol dependence, or alcoholism, is
a chronic condition in which individuals experience a strong craving for alcohol, inability to limit
drinking to a safe level, and continued use of alcohol in spite of damage to physical, psychological,
and interpersonal well-being. Long-term medical effects of both alcohol abuse and alcoholism
include liver damage such as cirrhosis, inflammation of the pancreas, liver cancer, esophageal
cancer, high blood pressure, psychological disorders, and unintentional injuries including motor
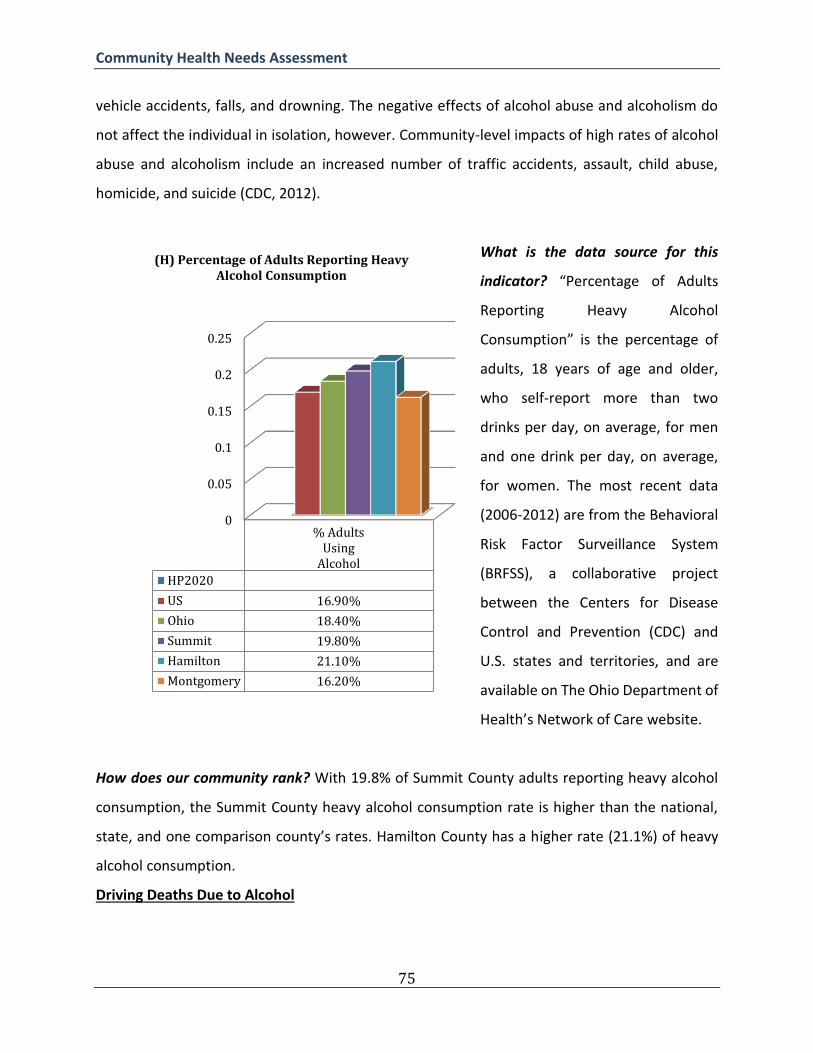
Community Health Needs Assessment
75
vehicle accidents, falls, and drowning. The negative effects of alcohol abuse and alcoholism do
not affect the individual in isolation, however. Community-level impacts of high rates of alcohol
abuse and alcoholism include an increased number of traffic accidents, assault, child abuse,
homicide, and suicide (CDC, 2012).
What is the data source for this
indicator? “Percentage of Adults
Reporting Heavy Alcohol
Consumption” is the percentage of
adults, 18 years of age and older,
who self-report more than two
drinks per day, on average, for men
and one drink per day, on average,
for women. The most recent data
(2006-2012) are from the Behavioral
Risk Factor Surveillance System
(BRFSS), a collaborative project
between the Centers for Disease
Control and Prevention (CDC) and
U.S. states and territories, and are
available on The Ohio Department of
Health’s Network of Care website.
How does our community rank? With 19.8% of Summit County adults reporting heavy alcohol
consumption, the Summit County heavy alcohol consumption rate is higher than the national,
state, and one comparison county’s rates. Hamilton County has a higher rate (21.1%) of heavy
alcohol consumption.
Driving Deaths Due to Alcohol
0
0.05
0.1
0.15
0.2
0.25
% AdultsUsing
Alcohol
HP2020
US 16.90%
Ohio 18.40%
Summit 19.80%
Hamilton 21.10%
Montgomery 16.20%
(H) Percentage of Adults Reporting Heavy Alcohol Consumption

Community Health Needs Assessment
76
What is the data source for this
indicator? “Percent of Driving Deaths
Associated with Alcohol” is the
percentage of driving deaths with
alcohol involvement. The most
recent data for this indicator (2009-
2013) are drawn from the Fatality
Analysis Reporting System (FARS).
FARS is a census that documents
motor vehicle fatalities occurring
within the 50 States, the District of
Columbia, and Puerto Rico since
1975. To qualify as a FARS case, the
crash had to involve a motor vehicle
traveling on a traffic way customarily
open to the public, and must have
resulted in the death of a motorist or
a non-motorist within 30 days of the crash. Data are reported on the County Health Rankings and
Roadmap website.
How does our community rank? With 52% of driving deaths due to alcohol, the Summit County
alcohol-related driving death rate exceeds the state and both comparison counties’ rates.
National data are not available.
Prescription Drug Abuse
0
0.1
0.2
0.3
0.4
0.5
0.6
% DrivingDeaths
Associatedwith Alcohol
HP2020
US
Ohio 36.00%
Summit 52.00%
Hamilton 40.00%
Montgomery 38.00%
(H) The Percentage of Driving Deaths Associated with Alcohol

Community Health Needs Assessment
77
While prescription medications may be safely used to treat a broad array of physical and
psychological maladies, many of the drugs used to treat common conditions have the potential
to be abused for recreation purposes. Medications that are most commonly abused include:
opioids (which treat pain disorders), central nervous system depressants prescribed for anxiety
and sleep disorders, and stimulants (for attention deficit hyperactivity disorder and narcolepsy).
The principal risk of abuse of prescription drugs is overdose, which may result in impaired short-
term function, medical emergency, or death (NIH, 2012).
What is the data source for this
indicator? “The Percentage of Adults
Abusing Prescription Drugs” is the
percentage of adults, 19 years of age
and older, abusing prescription drugs.
The most recent data (2015) are from
OMAS.
How does our community rank? With
6% of adults in Summit County
abusing prescription drugs, the
Summit County rate exceeds the state
rate and one comparison county’s
rates, and is the same as Montgomery
County’s rate. National rates are not
available.
References
0.044
0.046
0.048
0.05
0.052
0.054
0.056
0.058
0.06
% AdultsAbusing
PrescriptionDrugs
HP2020
US
Ohio 5%
Summit 6%
Hamilton 6%
Montgomery 5%
(H) The Percentage of Adults Abusing Prescription Drugs

Community Health Needs Assessment
78
-Center for Disease Control and Prevention (CDC). (2011). Diabetes. Centers for Disease Control and Prevention. Retrieved July 11, 2016, from http://www.cdc.gov/diabetes/consumer/learn.htm - Center for Disease Control and Prevention (CDC). (2012). Alcohol and Public Health. Centers for Disease Control and Prevention. Retrieved July 11, 2016, from http://www.cdc.gov/alcohol/faqs.htm
- Center for Disease Control and Prevention (CDC). (2012). Asthma. Centers for Disease Control and Prevention. Retrieved July 13, 2016, from http://www.cdc.gov/asthma/
- Center for Disease Control and Prevention (CDC). (2011). Diabetes. Centers for Disease Control and Prevention. Retrieved June 11, 2013, from http://www.cdc.gov/diabetes/consumer/learn.htm
-Center for Disease Control and Prevention (CDC). (2012). Infant Mortality. Centers for Disease Control and Prevention. Retrieved July 10, 2016, from http://www.cdc.gov/reproductivehealth/MaternalInfantHealth/InfantMortality.htm -Centers for Disease Control and Prevention (CDC). High Cholesterol Facts. (2015). Retrieved August 30, 2016, from http://www.cdc.gov/cholesterol/facts.htm -Centers for Disease Control and Prevention (CDC). Frequently Asked Questions (FAQs). (2016). Retrieved August 30, 2016, from http://www.cdc.gov/arthritis/basics/faqs.htm -Centers for Disease Control and Prevention (CDC). Seasonal Influenza, More Information. (2016). Retrieved August 30, 2016, from http://www.cdc.gov/flu/about/qa/disease.htm -Centers for Disease Control and Prevention (CDC). Viral Meningitis. (2016). Retrieved August 30, 2016, from http://www.cdc.gov/meningitis/viral.html -County Health Rankings and Roadmaps. Health Rankings. (n.d.). Retrieved August 30, 2016, from http://www.countyhealthrankings.org/app/ohio/2016/measure/factors/134/datasource
-Flores-Mateo G, Violan-Fors C, Carrillo-Santisteve P, Peiro S, Argimon J-M (2012) Effectiveness of Organizational Interventions to Reduce Emergency Department Utilization: A Systematic Review. PLoS ONE 7(5): e35903. doi:10.1371/journal.pone.0035903
-Moy, E., Chang, E., Barrett, M., & Centers for Disease Control and Prevention (CDC). (2013). Potentially preventable hospitalizations—United States, 2001-2009. MMWR Surveill Summ, 62(Suppl 3), 139-43.
Community Health Needs Assessment
79
-Ness, D., and W. Kramer. "Reducing hospital readmissions: it’s about improving patient care." Health Affairs Blog (2013). -National Institutes of Health. (2012). “Prescription Drugs.” National Institute on Drug Abuse. Accessed June 11, 2013. Available at: http://www.drugabuse.gov/drugsWabuse/prescriptionWdrugs -National Osteoporosis Foundation. What is Osteoporosis and What Causes It? (n.d.). Retrieved August 30, 2016, from https://www.nof.org/patients/what-is-osteoporosis/ -Ontario Healthy Communities Coalition. Mapping Your Community Assets. (n.d.). Retrieved August 30, 2016, from http://www.ohcc-ccso.ca/en/courses/community-development-for-health-promoters/module-two-process-strategies-and-roles/tool-mapp
-United States Department of Health and Human Services (HHS). (2013). Office of Disease Prevention and Health Promotion. Healthy People 2020. Washington, DC. Accessed June 15, 2013. Available at: http://www.healthypeople.gov/2020/
-United States Department of Health and Human Services (HHS). (2013). Office of Disease Prevention and Health Promotion. Healthy People 2020. Washington, DC. Accessed June 15,
2013. Available at: http://www.healthypeople.gov/2020/
-World Health Organization. Infectious diseases. (2016). Retrieved August 30, 2016, from http://www.who.int/topics/infectious_diseases/en/

Community Health Needs Assessment
80
Appendix 3: Actions Taken Since the Previous CHNA Impact of Actions Taken Since the 2013 Community Health Needs Assessment The Edwin Shaw Rehabilitation Institute (Edwin Shaw) uses evidence-based approaches in the delivery of healthcare services and educational outreach with the aim of achieving healthy outcomes for the community it serves. It undertakes periodic monitoring of its programs to measure and determine the effectiveness of these approaches and to ensure that best practices continue to be applied. Given that the process for evaluating the impact of various services and programs on population health is longitudinal by nature, significant changes in health outcomes may not manifest for several Community Health Needs Assessment cycles. Edwin Shaw continues to evaluate the cumulative impact of each of its programs. Chronic Diseases
1. Diabetes Action: Edwin Shaw continues to work on educating those diagnosed with diabetes on managing the disease. Highlighted Impact:
In conjunction with Akron General Medical Center, a related hospital facility, Edwin Shaw teamed up with a local church to provide community based diabetes education. Approximately 75% of the participants showed improvements in fasting blood sugar and weight.
To gain feedback and improve the effectiveness of its diabetes management classes, Edwin Shaw has launched a program to interview by phone all those patients participating in the classes. Patients are contacted 90 days after course completion and asked a series of questions on their ability to control their diabetes based on course content. The information is used to further tailor the course and improve its effectiveness.
Substance Abuse
1. Opioid and Heroin Abuse Action: Edwin Shaw continues to engage in programs to save lives through education, addiction counseling and emergency treatment in the battle against opioids and heroin. The following impacts were achieved in conjunction with the Akron General Medical Center, a related hospital facility.
Highlighted Impacts:
In 2015, the Death Avoided With Naloxone (DAWN) program was initiated and began building opioid/heroin overdose kits. Any person may request a kit. The kits are distributed free of charge. Over 120 DAWN kits have been distributed.

Community Health Needs Assessment
81
In 2015, Edwin Shaw obtained a grant to create an ambulatory detox unit. Edwin Shaw committed a physician and nurse to the unit. It went into operation in April of 2015 and served over 200 persons by year end.
Lifestyle Factors
1. Smoking Cessation Action: Edwin Shaw offers a number of educational to improve the health patients and their families through smoking cessation programs. Highlighted Impacts:
Edwin Shaw incorporated smoking cessation classes into its ambulatory detox program, emphasizing the benefits to children of a smoke free environment. This provides the opportunity to reach community members with such education that might not take advantage of Edwin Shaw’s traditional smoking cessation classes.
Edwin Shaw continued to offer its free smoking cessation classes with 5 classes offered each year.

82