community health needs assessment draft
TRANSCRIPT

1 | P a g e
DRAFT
Community Health
Needs Assessment Children’s Hospital of Orange County Orange, CA
December 12, 2019
2 | P a g e
Overview
1. OVERVIEW A. Executive Summary 4
B. Prioritized Health Needs 5
C. Goals of the Community Health Needs Assessment 6
D. About CHOC Children’s 6
E. Mission of CHOC Children’s 7
F. Vision of CHOC Children’s 7
G. Core Values of CHOC Children’s 8
H. Programs & Services 8
I. Community Benefit Program 11
2. CHNA METHODOLOGY A. Definition and Characterization of Primary Service Area 12
B. Engagement of Community Stakeholders 13
C. Identification and Prioritization of Needs/Health Gaps 13
D. Informational Gaps 13
3. DEMOGRAPHICS A. Population Change 15
B. Ethnicity & Race 17
C. Household 17
D. Household Income 18
4. SOCIOECONOMIC FACTORS A. Education Levels 20
B. Chronic Absenteeism 22
C. English Proficiency 24
D. Child Poverty 25
E. Healthcare Access 26
F. Food Insecurity 28
G. Unemployment 30
H. Crime 31
5. HEALTH INDICATORS A. Mortality 32
B. Infant Mortality 33
C. Natality 34
D. Morbidity 35
E. Immunizations (Vaccines) 35
F. Oral Health 36
G. Suicide 38
H. Mental Health and Autism 39
TABLE OF CONTENTS

3 | P a g e
I. Substance Abuse 41
J. Asthma 43
K. Obesity and Diabetes 44
L. Physical Fitness 47
M. Nutrition 48
N. Breastfeeding 49
6. COMMUNITY ASSETS A. Access to Primary Care 50
B. Facilities 51
7. COMMUNITY INPUT A. Survey Process and Results 55
B. Demographics of Survey Respondents 55
C. Access to Healthcare 56
D. Critical Health Concerns 56
E. Quality of Care 58
F. Health Behaviors 58
G. Health Problems 58
8. KEY INFORMANT SURVEY A. Demographics of Survey Respondents and Survey Process 60
B. Survey Findings 60
9. APPENDIX A. Appendix A: Data Sources 68
B. Appendix B: Community Input – List of Key Informants Representing and/or Serving
Low-Income, Medically Underserved, Minority Populations 70
C. Appendix C: Community Input – Key Informant Survey 72
D. Appendix D: Community Input – Parent Population Survey 75
E. Appendix E: Resources to Address Needs 83
F. Appendix F: IRS Checklist 85

4 | P a g e
EXECUTIVE SUMMARY
CHOC Children’s has two hospital campuses – CHOC Children’s Hospital (“CHOC at Orange”) and CHOC
Children’s at Mission Hospital (“CHOC at Mission”), collectively referred to as “CHOC Children’s”. While the
law requires that each licensed hospital conduct a Community Health Needs Assessment (“CHNA”), it may be
conducted with another hospital or group of hospitals, so long as the characteristics and specific needs of each
hospital’s population are distinctly identified where different. Because both CHOC Children’s facilities are
located within the same county (Orange), serve many of the same populations and provide many of the same
types and levels of services, CHOC Children’s conducted the CHNA for its two facilities simultaneously.
Another consideration for issuing a joint CHNA is that many health indicators (morbidity, mortality, etc.,) are
only available at the county level. This 2019 CHNA report will assist in prioritizing the unmet health needs
adversely affecting the community.
The purpose of the CHNA is to identify community health assets and issues, determine and monitor the overall
health of the population, and set health objectives. The final deliverable will then be used to assist the CHOC
Board and Senior Management in setting priorities and allocating resources over the next several years.
CHOC Children’s CHNA Steering Committee comprised of the following individuals who helped conduct the
2019 CHNA:
• Shahab Dadjou, Chief Strategy Officer
• Jena Jensen, Chief Governmental Relations Officer
• Michael Weiss, DO, Vice President of Population Health
• Charles V. Golden, DO, Vice President and Executive Medical Director of CHOC Children’s Primary
Care Network
• Anita Sankaran, Director of CHOC Children’s Primary Care Network
• Billy Lambon, Senior Strategy Consultant
• Michael Jones, Strategy Consultant
• Roseanne De Lemos, Operations Administrative Resident
Note: CHOC Children’s did not contract with any third parties to assist in conducting its 2019 CHNA.
OVERVIEW
5 | P a g e
PRIORITIZED HEALTH NEEDS
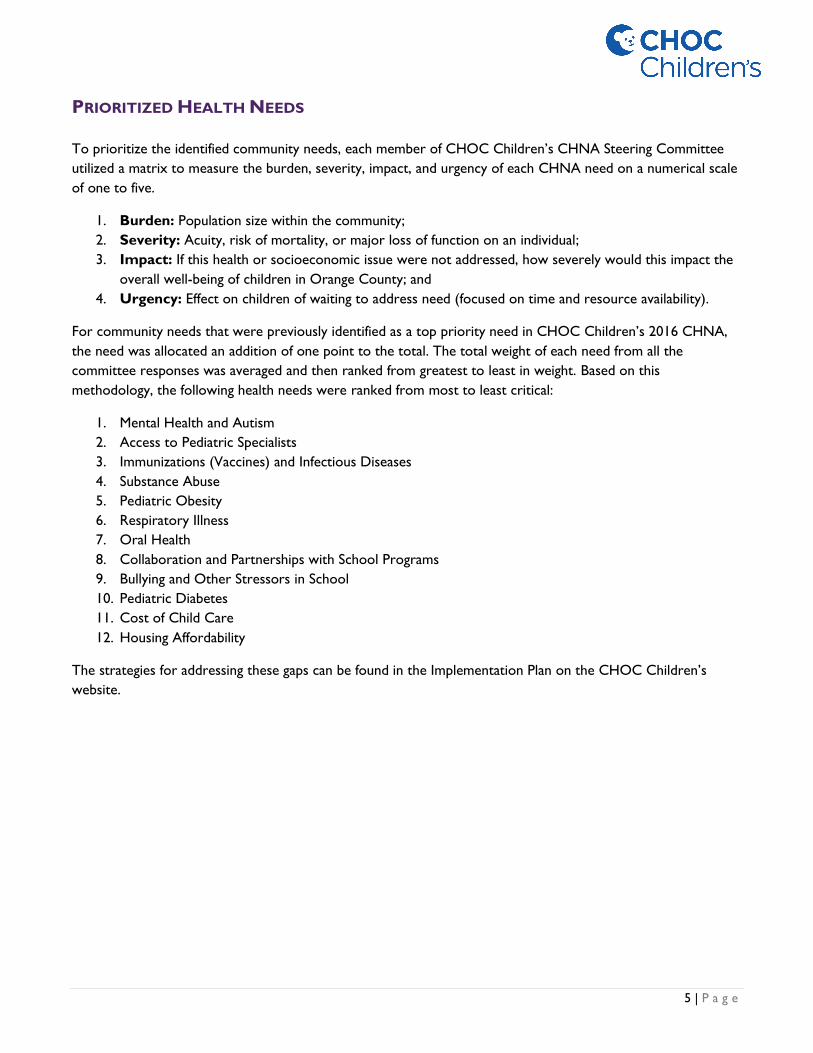
To prioritize the identified community needs, each member of CHOC Children’s CHNA Steering Committee
utilized a matrix to measure the burden, severity, impact, and urgency of each CHNA need on a numerical scale
of one to five.
1. Burden: Population size within the community;
2. Severity: Acuity, risk of mortality, or major loss of function on an individual;
3. Impact: If this health or socioeconomic issue were not addressed, how severely would this impact the
overall well-being of children in Orange County; and
4. Urgency: Effect on children of waiting to address need (focused on time and resource availability).
For community needs that were previously identified as a top priority need in CHOC Children’s 2016 CHNA,
the need was allocated an addition of one point to the total. The total weight of each need from all the
committee responses was averaged and then ranked from greatest to least in weight. Based on this
methodology, the following health needs were ranked from most to least critical:
1. Mental Health and Autism
2. Access to Pediatric Specialists
3. Immunizations (Vaccines) and Infectious Diseases
4. Substance Abuse
5. Pediatric Obesity
6. Respiratory Illness
7. Oral Health
8. Collaboration and Partnerships with School Programs
9. Bullying and Other Stressors in School
10. Pediatric Diabetes
11. Cost of Child Care
12. Housing Affordability
The strategies for addressing these gaps can be found in the Implementation Plan on the CHOC Children’s
website.

6 | P a g e
GOALS OF THE COMMUNITY HEALTH NEEDS ASSESSMENT
The Patient Protection and Affordable Care Act (ACA) (HR3590), Internal Revenue Service section 501(r)(3)
and California Senate Bill 697 direct tax-exempt hospitals to conduct a CHNA and develop an implementation
strategy to address these needs every three years.
The primary goals of the CHNA include the following:
• Defining the patient population served by CHOC Children’s and the communities from which this
population originates;
• Determining community health needs and resources, including those specifically related to pediatric
inpatient and outpatient care;
• Identifying significant gaps hindering the provision of pediatric primary and specialty inpatient/outpatient
services; and
• Mitigating the barriers to meeting health and social needs through the development of an
Implementation Plan.
To meet these primary goals, CHOC Children’s 2019 CHNA sought input from experts in public health, local
health departments and community members who were representative of and providing service to minority
groups, low-income individuals and medically underserved populations. Engaging the community in this way helps
CHOC Children’s develop an informed understanding of the most pressing needs or health gaps existing within
communities served. To provide comments about CHOC Children’s 2019 CHNA, please contact us at:
CHOC Children’s 2019 CHNA fulfills the requirements of the ACA, IRS Section 501(r) and California law. See
Appendix F for more details.
ABOUT CHOC CHILDREN’S HOSPITAL
CHOC at Orange is a licensed 334-bed tertiary/quaternary children’s hospital dedicated to the provision of care
ranging from prenatal and neonatal (newborns) through 17 years of age, to patients up to 25 years of age
diagnosed with certain rare conditions. CHOC at Orange is located at 1201 W La Veta Avenue, Orange, CA
92868.
CHOC at Mission is a licensed 54-bed “hospital within a hospital” that treats patients ranging in age from
newborn through 17 years of age. It is located at 27700 Medical Center Road, Mission Viejo, CA 92691 on the
5th floor of Mission Hospital.
Although CHOC Children’s provides healthcare services to pediatric and young adult patients from across the
nation, CHOC Children’s primary service area (PSA) is Orange County, California. CHOC at Orange and
CHOC at Mission are the only hospitals in Orange County that exclusively treat inpatient pediatrics. The map
below shows that CHOC Children’s is uniquely positioned to provide pediatric health care services to all
Orange County pediatric residents.

7 | P a g e
MISSION OF CHOC CHILDREN’S
To nurture, advance and protect the health and well-being of children
VISION OF CHOC CHILDREN’S
To be the leading destination for children’s health by providing exceptional and innovative care

8 | P a g e
CORE VALUES OF CHOC CHILDREN’S
Excellence Setting and achieving the highest standards in all we do
Innovation Advancing children’s healthcare by leading with new ideas and technology
Service Delivering unmatched personal experience
Collaboration Working together with our colleagues and partners to achieve our mission
Compassion Caring with sensitivity and respect
Accountability Serving as dedicated stewards of the lives and resources entrusted to us
PROGRAMS & SERVICES
CHOC Children’s offers an array of primary, secondary, tertiary, and quaternary services across its network of
inpatient, outpatient and ancillary centers including, but not limited to, the following:
• A 30-bed PICU that offers the highest levels of care to critically ill or injured children. CHOC Children’s
pediatric intensive care specialists are available in the hospital 24-hours-a-day, seven-days-a-week, along
with highly skilled nursing and support staff;
• CHOC Children's has a total of 101 licensed inpatient neonatal intensive care (NICU) beds. This
includes a 37-bed, Level 4 NICU at CHOC at Orange,1 offering critical tertiary and quaternary care for
newborn babies suffering from respiratory, circulatory, neurological, surgical and cardiac problems. This
unit provides all private rooms;
• CHOC at Orange also offers a 12-bed Small Baby Unit, a special unit designed for babies born at less
than 28 weeks gestation or who weigh less than 1,000 grams; and
• Also sitting on our hospital license, CHOC at Orange operates a 13-bed, Level 2 NICU at St. Joseph
Hospital - Orange, with all private rooms. St. Joseph Hospital – Orange is located next door to CHOC
at Orange and is joined by an underground tunnel for fast and efficient patient transfers.
1 For states and hospitals who use this classification, a level 4 NICU is an intensive care unit that can care for babies as young as 22 to 24
weeks gestational age. The term "micro-preemies" is used to describe babies born between 22 and 26 weeks of gestation or smaller than
1 pound 13 ounces. Level 4 NICUs can provide very sophisticated types of respiratory support for very sick babies, including
extracorporeal mechanical oxygenation or ECMO. They also offer a wide variety of neonatal surgeries including heart surgeries for babies
born with congenital heart disease.

9 | P a g e
The following is a list of CHOC Children’s inpatient and outpatient services:
Adolescent Medicine Oncology (Hyundai Cancer Institute)
Eating Disorders Adolescent and Young Adult Cancer Program
Reproductive Health After Cancer Treatment Survivorship Program
Mental Health Blood and Marrow Transplant Program
(LGBTQIA) Adolescent Health Care Bone and Soft Tissue Sarcoma Program
Allergy/Immunology Histiocytosis Program
Asthma Education Programs Leukemia Program
Breathmobile Lymphoma Program
Eosinophilic Esophagitis Clinic Neuro-oncology Program
Cardiology (Heart Institute) Recurrent and Refractory Cancer Program
Cardiac Catheterization Laboratory Solid Tumor Program
Cardiodiagnostics Ophthalmology
Cardiovascular Intensive Care Unit (CVICU) Orthopaedics (Orthopaedic Institute)
Electrophysiology (EP) Program Clubfoot and Foot Disorder Program
Healthy Lifestyle Classes Fracture Clinic
Heart Surgery Hand Program
Interventional Cardiology Program Infant and Adolescent Hip Disorder Program
Lipid Clinic Limb Program
Pacemaker & Implantable Cardioverter Defibrillator Program Muscular Dystrophy Association Clinic
Pulmonary Hypertension Clinic Musculoskeletal Tumor Program
Sports Cardiology Program Neuromuscular Disease Program
Critical Care Orthopaedic Surgery
Cardiovascular Intensive Care Unit (CVICU) Spasticity Clinic
Extracorporeal Life Support Program (ECMO) Spina Bifida Clinic
Neonatal Intensive Care Unit (NICU) Spine Center
Pediatric Intensive Care Unit (PICU) Sports Medicine Program
Transport Services Otolaryngology (Ear, Nose and Throat)
Dentistry Cleft and Craniofacial Program
Dermatology Cochlear Implant Program
Developmental and Behavioral Pediatrics Vascular Anomalies Center
Developmental Services Physical Medicine and Rehabilitation
Emergency Medicine Rehabilitation Services
Emergency Department Physical Therapy
Transport Services Occupational Therapy
Trauma Center Speech and Language Pathology
Endocrinology and Diabetes Developmental Therapy
Healthy Lifestyle Classes Plastic Surgery
Gastroenterology Brachial Plexus Program
Colorectal/Bowel Management Program Cleft and Craniofacial Program
Eosinophilic Esophagitis Clinic Vascular Anomalies Center

10 | P a g e
Feeding Program Psychology/Psychiatry
Functional Abdominal Pain Program Autism Assessments
Gastrointestinal Motility Program Mental Health Services
Inflammatory Bowel Disease (IBD) Program Neuropsychology Program
Intestinal Rehabilitation Program Pulmonology
General and Thoracic Surgery Sleep Disorder Center
Genetics Radiology/Imaging
Hematology Rheumatology
Vascular Anomalies Center Surgical Services
Infectious Disease Thoracic Surgery
Metabolic Disorders Urology
Metabolic Lab Bedwetting and Daytime Incontinence Program
Neonatology/Perinatology Disorders of Sexual Differentiation Program
Neonatal Intensive Care Unit (NICU) Hypospadias Program
Neurocritical NICU Spina Bifida Clinic
Small Baby Unit Wellness and Primary Care
Surgical NICU Adolescent and Teen Medicine
High-Risk Infant Follow-Up Clinic Behavioral Services
Nephrology Eating Disorders Program
Neurology/Neurosurgery (Neuroscience Institute) Human Papillomavirus (HPV) Vaccination
Brachial Plexus Program Immunizations
Concussion Program Management of Chronic Conditions
Craniosynostosis Program Screenings
Developmental Services Sports Physicals
Down Syndrome Program Urgent Care (Orange Clinic)
Epilepsy Program Well-child, Routine and Sick Visits
Hydrocephalus Program
Muscular Dystrophy Association Clinic
Neurodiagnostics
Neurofibromatosis Program
Neurometabolic Program
Neuromuscular Disease Program
Neuro-oncology Program
Plagiocephaly Clinic
Sleep Center
Sleep Disorder Center
Spasticity Clinic
Spina Bifida Clinic
Tuberous Sclerosis Program

11 | P a g e
COMMUNITY BENEFITS PROGRAM
CHOC Children’s is committed to the children and families in Orange County who depend on CHOC for care.
With the provision of $84.5 million in community benefits in the fiscal year 2018, CHOC Children’s continues
to provide 89 benefit services to address the following:
• Healthcare Access: increase access to quality pediatric healthcare resources and information to
families, especially low-income and medically underserved, throughout Orange County;
• Behavioral Health Access: enhance the community’s access to behavioral health information and
social and emotional services, targeting the underserved;
• Disease Prevention: increase awareness of disease prevention and promote early intervention of
major diseases that affect the community;
• Information Resource: provide the community with resources for information and education on
health risk behaviors;
• Injury Prevention: actively contribute to reducing the number of unintentional injuries to young
children, especially targeting low-income, ethnically diverse and medically underserved populations; and
• Community Action: actively recruit, recognize and advocate for the importance of volunteer
leadership and community assistance in providing care for children.
To see CHOC Children’s Community Benefit Report, please visit CHOC Children’s website for the most up-
to-date annual public report.
12 | P a g e
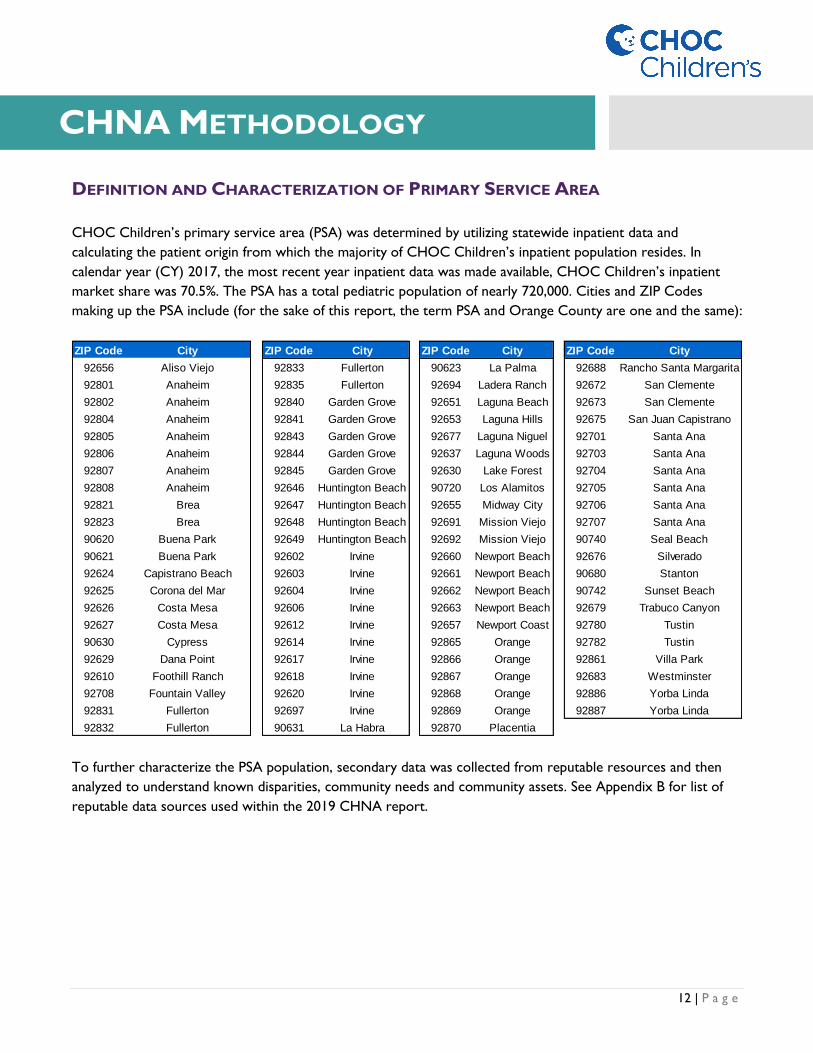
DEFINITION AND CHARACTERIZATION OF PRIMARY SERVICE AREA
CHOC Children’s primary service area (PSA) was determined by utilizing statewide inpatient data and
calculating the patient origin from which the majority of CHOC Children’s inpatient population resides. In
calendar year (CY) 2017, the most recent year inpatient data was made available, CHOC Children’s inpatient
market share was 70.5%. The PSA has a total pediatric population of nearly 720,000. Cities and ZIP Codes
making up the PSA include (for the sake of this report, the term PSA and Orange County are one and the same):
To further characterize the PSA population, secondary data was collected from reputable resources and then
analyzed to understand known disparities, community needs and community assets. See Appendix B for list of
reputable data sources used within the 2019 CHNA report.
ZIP Code City ZIP Code City ZIP Code City ZIP Code City
92656 Aliso Viejo 92833 Fullerton 90623 La Palma 92688 Rancho Santa Margarita
92801 Anaheim 92835 Fullerton 92694 Ladera Ranch 92672 San Clemente
92802 Anaheim 92840 Garden Grove 92651 Laguna Beach 92673 San Clemente
92804 Anaheim 92841 Garden Grove 92653 Laguna Hills 92675 San Juan Capistrano
92805 Anaheim 92843 Garden Grove 92677 Laguna Niguel 92701 Santa Ana
92806 Anaheim 92844 Garden Grove 92637 Laguna Woods 92703 Santa Ana
92807 Anaheim 92845 Garden Grove 92630 Lake Forest 92704 Santa Ana
92808 Anaheim 92646 Huntington Beach 90720 Los Alamitos 92705 Santa Ana
92821 Brea 92647 Huntington Beach 92655 Midway City 92706 Santa Ana
92823 Brea 92648 Huntington Beach 92691 Mission Viejo 92707 Santa Ana
90620 Buena Park 92649 Huntington Beach 92692 Mission Viejo 90740 Seal Beach
90621 Buena Park 92602 Irvine 92660 Newport Beach 92676 Silverado
92624 Capistrano Beach 92603 Irvine 92661 Newport Beach 90680 Stanton
92625 Corona del Mar 92604 Irvine 92662 Newport Beach 90742 Sunset Beach
92626 Costa Mesa 92606 Irvine 92663 Newport Beach 92679 Trabuco Canyon
92627 Costa Mesa 92612 Irvine 92657 Newport Coast 92780 Tustin
90630 Cypress 92614 Irvine 92865 Orange 92782 Tustin
92629 Dana Point 92617 Irvine 92866 Orange 92861 Villa Park
92610 Foothill Ranch 92618 Irvine 92867 Orange 92683 Westminster
92708 Fountain Valley 92620 Irvine 92868 Orange 92886 Yorba Linda
92831 Fullerton 92697 Irvine 92869 Orange 92887 Yorba Linda
92832 Fullerton 90631 La Habra 92870 Placentia
CHNA METHODOLOGY

13 | P a g e
ENGAGEMENT OF COMMUNITY STAKEHOLDERS
Additionally, community members who represent broad interests of the community were solicited for input to
further identify community needs and community assets, such as programs, services and resources that improve
the health and well-being of community members. Community stakeholders include regional governmental
public health departments and members of medically underserved, low-income and minority populations in the
community. In September and October 2019, input was solicited through a combination of interviews and
survey questionnaires. CHOC Children’s received 232 responses from community members and key informants
who are knowledgeable pediatric experts in Orange County. See Appendix C and D for copies of the
questionnaire and survey used to engage the community.
Additionally, no written comments from CHOC Children’s 2016 CHNA or Implementation Strategy Plan were
received from the community. CHOC Children’s will continue to track any submissions made to ensure that all
relevant comments are reviewed and addressed by appropriate hospital staff.
IDENTIFICATION AND PRIORITIZATION OF NEEDS/HEALTH GAPS
Through primary and secondary data collection and analysis, CHOC Children’s PSA health needs were
identified. To prioritize the health needs, the CHNA Steering Committee members were asked to each
complete a decision matrix. In this decision matrix, each identified community health need was assessed on
burden, scope, impact and severity using a numerical scale of one to five:
1. Burden: Population size within the community;
2. Severity: Acuity, risk of mortality, or major loss of function on an individual;
3. Impact: If this health or socioeconomic issue were not addressed, how severely would this impact
the overall well-being of children in Orange County; and
4. Urgency: Effect on children of waiting to address need (focused on time and resource availability).
For community needs that were previously identified as a top priority need in CHOC Children’s 2016 CHNA,
the need was allocated an addition of one point to the total. The total weight of each need from all the
committee responses was averaged and then ranked from greatest to least in weight.
A gap analysis was conducted by comparing prioritized health needs with CHOC Children’s services and PSA
community assets. Additionally, the gap analysis process included an evaluation of the 2016 CHNA and
implementation initiatives.
From the gaps identified and needs prioritized, an implementation strategy will be developed to address needs and
bridge gaps which is further supported and approved by CHOC Children’s leadership and overall organization.
INFORMATION GAPS
Many social, economic, morbidity, mortality, and health outcomes data points (secondary data) are tracked and
recorded at the county level across all population cohorts, including the age cohort 18+, making it challenging to

14 | P a g e
determine the effect these indicators have on just the population CHOC Children’s serves. Other qualitative and
quantitative information limitations include:
• Secondary data: Much of the secondary data analyzed is only available at the county level. This limited
CHOC Children’s ability to decipher and assess social determinants within individual communities
within Orange County. CHOC Children’s mitigated this issue by conducting interviews with community
stakeholders familiar with the individual communities within Orange County to determine access and
availability of healthcare services;
• Interviews and surveys: Opinions gathered from community representatives could differ from those
of the broader Orange County population. While every effort was made to recruit a sample size
representative of CHOC Children’s entire pediatric population, the diverse group of participants
representing each of the unique cities within Orange County could not be guaranteed. This challenge is
expected in metropolitan areas such as Orange County;
• Inpatient data: There is an approximate 12-18-month lag in the availability of inpatient data provided
by the Office of Statewide Healthcare Planning and Development (OSHPD). CY 2017 is the most recent
year OSHPD inpatient data was made available. This lag in data access means CHOC Children’s, at
times, is assessing the impact of inpatient healthcare initiatives on data that may or may not be
representative of the times. This could result in misinterpretations to the actual state of affairs of a given
health or social determinant;
• Outpatient data: Although CHOC Children’s has invested heavily in outpatient data, by purchasing
claims data from a third-party vender, this information is neither current (through CY 2018) nor
complete (limitations by payer, heath system, self-insured entities, employers, IPA, and Medical
Foundations) and therefore limits CHOC Children’s ability to conduct a conclusive and holistic
assessment of Orange County’s current pediatric health needs. In these types of instances, CHOC
Children’s relied on a combination of historical data as well as interviews (both community and
individual input) to provide a more conclusive viewpoint of any possible health or social issues; and
• Data lag: The list of data sources included in this report provides the dates for each of the major data
sets referenced when conducting the CHNA. This data was valuable and allowed the identification of
health needs relative to CHOC Children’s PSA. However, older datasets may not reflect recent trends
in health statistics and outcomes. Again, this challenge was mitigated by referencing feedback received
from community input to compare and contract possible discrepancies.
15 | P a g e
Studying demographics helps uncover possible health disparities often attributed to social, economic, and/or
environmental disadvantage. According to Healthy People 2020, “health disparities adversely affect groups of
people who have systematically experienced greater obstacles to health based on their racial or ethnic group;
religion; socioeconomic status; gender; age; mental health; cognitive, sensory, or physical disability; sexual
orientation or gender identity; geographic location; or other characteristics historically linked to discrimination
or exclusion.”
To reiterate, Orange County is CHOC Children’s PSA. California’s total population is 39,813,541 people of
which 22.9%, or 9,125,894, are children aged 0-18 years old.2 Orange County has 8% of California’s total
population but 0.5% of its land area. Orange County is the third largest county in California by population size
with 3,252,459 residents in 2019. The median age is 37.9 years old.3 Children (0-18 years old) make up 22.1%,
or 719,221 children,4 of the Orange County population. Orange County’s age cohort 0-18 is projected to
decrease nearly 1% by 2024.
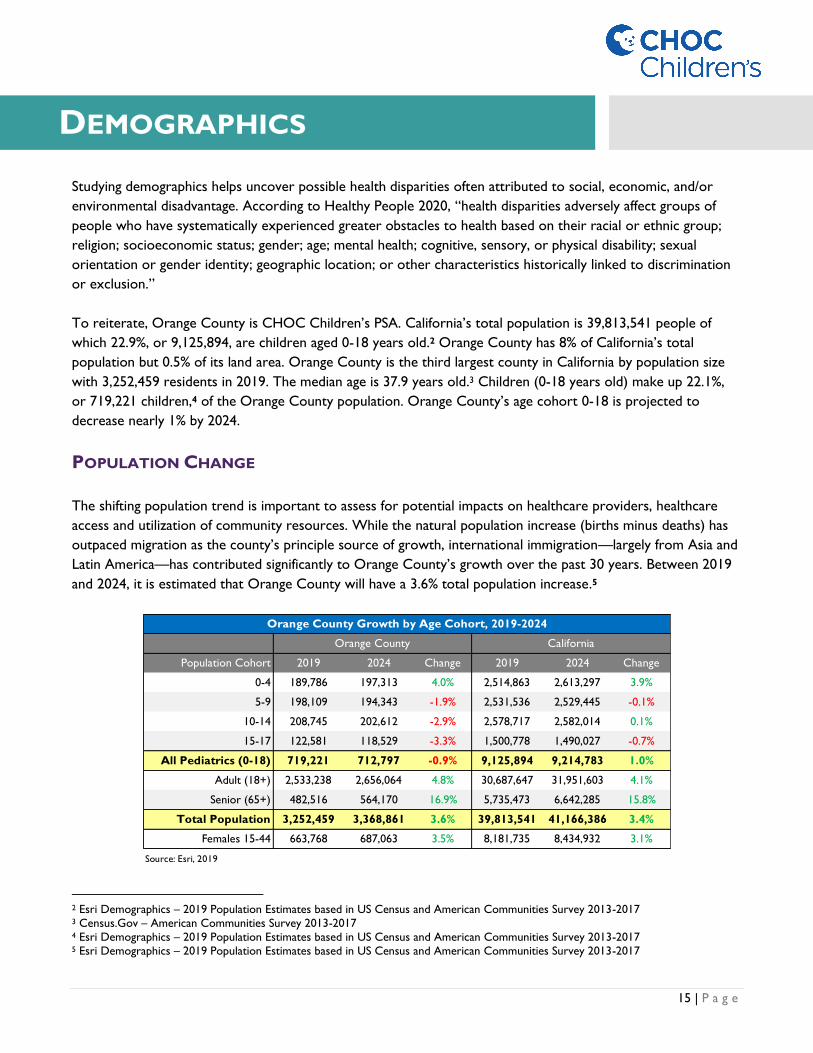
POPULATION CHANGE
The shifting population trend is important to assess for potential impacts on healthcare providers, healthcare
access and utilization of community resources. While the natural population increase (births minus deaths) has
outpaced migration as the county’s principle source of growth, international immigration—largely from Asia and
Latin America—has contributed significantly to Orange County’s growth over the past 30 years. Between 2019
and 2024, it is estimated that Orange County will have a 3.6% total population increase.5
2 Esri Demographics – 2019 Population Estimates based in US Census and American Communities Survey 2013-2017 3 Census.Gov – American Communities Survey 2013-2017 4 Esri Demographics – 2019 Population Estimates based in US Census and American Communities Survey 2013-2017 5 Esri Demographics – 2019 Population Estimates based in US Census and American Communities Survey 2013-2017
Population Cohort 2019 2024 Change 2019 2024 Change
0-4 189,786 197,313 4.0% 2,514,863 2,613,297 3.9%
5-9 198,109 194,343 -1.9% 2,531,536 2,529,445 -0.1%
10-14 208,745 202,612 -2.9% 2,578,717 2,582,014 0.1%
15-17 122,581 118,529 -3.3% 1,500,778 1,490,027 -0.7%
All Pediatrics (0-18) 719,221 712,797 -0.9% 9,125,894 9,214,783 1.0%
Adult (18+) 2,533,238 2,656,064 4.8% 30,687,647 31,951,603 4.1%
Senior (65+) 482,516 564,170 16.9% 5,735,473 6,642,285 15.8%
Total Population 3,252,459 3,368,861 3.6% 39,813,541 41,166,386 3.4%
Females 15-44 663,768 687,063 3.5% 8,181,735 8,434,932 3.1%
Source: Esri, 2019
Orange County California
Orange County Growth by Age Cohort, 2019-2024
DEMOGRAPHICS

16 | P a g e
Age Cohort 0-18: The Orange County age cohort 0-18 is projected to decrease by approximately 1% from
719,221 children in 2019 to 712,797 in 2024. This is lower than the California growth rate that is projected to
increase by 1% over the same period.
Age Cohort 0-4: The age cohort 0-4 (+4.0%) is the only Orange County age cohort, within the age range 0-
18, that is projected to increase between 2019 and 2024. This increase is consistent with California. Orange
County’s age cohort 0-4 makes up 26% of all children in the county. This percentage is projected to grow to
28% of all Orange County children by 2024.
Age Cohort 5-9: The Orange County age cohort 5-9 is projected to contract nearly 2% between 2019 and
2024 to nearly 195,000 children. Over the same period, California’s population is projected to remain stagnant
on just over 2.5 million children. The age cohort 5-9 makes up 27% of the population 0-18 which is consistent
with California overall.
Age Cohort 10-14: The Orange County age cohort 10-14 is projected to contract by 3% to 212,612 children
by 2024. By contrast, California’s population is projected to grow slightly to nearly 2.6 million over the same
period.
Age Cohort 15-17: The Orange County age cohort 15-17 is projected to decrease by 3.3% from 122,581
children in 2019 to 118,529 in 2024. This is the steepest decrease across all age cohorts, including adult, within
Orange County. The California growth rate for age cohort 15-17 is projected to decrease by 0.7% over the
same period.
Age Cohort 18+: Despite the Orange County population 0-18 projected to shrink nearly 1% between 2019
and 2024, the adult population 18+ is forecast to increase 4.8% to nearly 2.7 million over the same period. This
is higher than the California growth rate of 4.1%. Much of this growth can be attributed to net in-migration
among adults embarking on employment opportunities and Orange County aging overall. For this reason, the
age cohort 18+ is projected to make up a larger percentage of the overall population (79%) by 2024, an increase
of 1% from 2019. California is also projected to age slightly more by 2024 with the age cohort 18+ projected to
increase to 78% by 2024.
Age Cohort 65+: The Orange County age cohort 65+ is projected to increase nearly 17% from 482,516 in
2019 to 564,170 in 2024. This is the steepest growth increase across all age cohorts in Orange County.
California’s growth rate in the age cohort 65+ is also projected to increase considerably by 2024 but at a slightly
slower rate than Orange County overall (16%).
Females 15-44: This population group is important as it measures the reproductive age span of women
assumed for statistical purposes. The number of Orange County females 15-44 is predicted to increase 3.5%
from 663,768 in 2019 to 687,063 in 2024. This increase is higher than the California increase of 3.1% over the
same period.

17 | P a g e
ETHNICITY & RACE
Understanding race and ethnicity composition can better assist in determining health disparities including higher
rates of chronic disease, healthcare access, premature death, and other health determinants affecting a
community’s population.
Orange County continues to experience increased racial and ethnic diversification. Within the age cohort 0-18,
the racial distribution is as follows: White (49.4%), Some Other Race (21.3%) and Asian (18.2%). Nearly 49% of
Orange County is of Hispanic or Latino origin. This is lower than the California Hispanic or Latino population
percentage of 54.3%.
Among the different Orange County races and ethnicities 0-18, White (-5.8%) and American Indian/Alaska Native
(-4.3%) populations are expected to see the largest decrease in population change between 2019 and 2024.6 Over
this same period, Asian and Multiple Races are expected to see the largest gain in 0-18 population increasing by
7.7% and 6.4%, respectively.
HOUSEHOLDS
According to How Housing Matters, growing up in an affordable home can have a significant effect on a child’s
ability to thrive. Other findings on the importance of a suitable home environment for children include:
• Poor housing quality is associated with higher baseline symptoms of depression, anxiety, and aggression
from elementary school through young adulthood;
• The strain of household affordability and a history of moving often are associated with adverse health
outcomes for effected children;
• Compared to home owners with children, renter households with children are more likely to have
asthma triggers in their homes and are more likely to have at least one child diagnosed with asthma;
• Moving schools is associated with lower reading scores;
6 Esri Demographics – 2019 Population Estimates based in US Census and American Communities Survey 2013-2017
Pop. % Pop. % Pop. % Pop. %
White 355,593 49.4% 334,828 47.0% -5.8% 4,257,623 46.7% 4,147,595 45.0% -2.6%
Black / African American 12,975 1.8% 13,267 1.9% 2.3% 546,370 6.0% 536,114 5.8% -1.9%
American Indian / Alaska Native 4,404 0.6% 4,214 0.6% -4.3% 95,910 1.1% 96,086 1.0% 0.2%
Asian 131,099 18.2% 141,228 19.8% 7.7% 1,123,987 12.3% 1,198,989 13.0% 6.7%
Pacific Islander 2,335 0.3% 2,271 0.3% -2.8% 38,588 0.4% 39,390 0.4% 2.1%
Some Other Race 153,283 21.3% 153,486 21.5% 0.1% 2,241,548 24.6% 2,314,862 25.1% 3.3%
Multiple Races 63,376 8.8% 67,409 9.5% 6.4% 875,776 9.6% 932,499 10.1% 6.5%
Total Population (0-18) 719,221 100% 712,797 100% -0.9% 9,125,894 100% 9,214,783 100% 1.0%
Hispanic Population 351,812 48.9% 353,824 49.6% 0.6% 4,957,082 54.3% 5,160,420 56.0% 4.1%
Source: Esri, 2019
Change
2019-2024
California
Age Cohort 0-18: Population Change by Ethnicity and Race, 2019-2024
Population Cohort
Orange County
2019 2024 Change
2019-2024
2019 2024

18 | P a g e
• Children living in a housing cost burden environment, including living in homes that are in foreclosure or
in tax delinquency, are more likely to receive inferior kindergarten readiness scores than children living
in a stable housing environment; and
• Children living in a crowded household are less likely to graduate from high school and tend to have
lower educational attainment by age 25.
Orange County’s household population is projected to grow 3.6% from 3,207,763 in 2019 to 3,324,165 in 2024.
This is similar to the projected growth rate in California (3.5%) overall. The current household growth rate of
0.72 is expected to decrease to 0.64 by 2024.
In Orange County, there are a total of 1,060,886 households,7 with an average household size of 3.02. Over 71%
of Orange County’s total households are considered Family Households – slightly higher than the California
percentage of 69%. Although an estimated 35,000 additional homes will be constructed in Orange County
between 2019 and 2024, the change in population growth (3.6%) is still predicted to outpace the increased
number of houses (3.3%) over the same period. This trend is consistent with California (3.5% increase in the size
of the population versus 3.1% increase in the number of total households).
The number of households with one or more persons with a disability is 203,829 or 19.2% of total households.
Having a disabled child may increase stress and affect physical health and make it difficult to find appropriate and
affordable child care.
HOUSEHOLD INCOME
Orange County continues to be among the most inaccessible places to live for low and moderate-income
earners. This is a major concern for families as cost burden affects quality of life. Additionally, the number of
households receiving food stamps or participating in the Supplemental Nutrition Assistance Program (SNAP)
within Orange County is 66,353 or 8.8% of Orange County’s total family households (this is lower than the
California rate of 10.0%). The number of married couple families living below poverty level is 30,957 or 4.1% of
total family households.
7 Total households refer to people who are living in a housing structure, and can be made up of family households or non-family
householders. Family households is a household maintained by a householder who is in a family and includes unrelated people who may
be residing there. The number of family households is equal to the number of families. A nonfamily household consists of a householder
living alone or shared home exclusively with people to whom he/she isn’t related.
2019 2024 Change 2019 2024 Change
Household Population 3,207,763 3,324,165 3.6% 38,995,367 40,348,212 3.5%
Households: Annual Growth Rate 0.72 0.64 ↘ 0.64 0.62 ↘
Total Households 1,060,886 1,095,455 3.3% 13,339,357 13,759,222 3.1%
Average Household Size 3.02 3.03 0.3% 3.03 2.93 -3.3%
Total Family Households 756,645 781,140 3.2% 9,162,700 9,449,863 3.1%
Source: Esri , 2019
Household Growth by Year, 2019-2024
Orange County California

19 | P a g e
For 2019, it is estimated that Orange County has an average median household income of $88,453.8 This is
nearly 20% higher than the California average of $74,520 and 46% higher than the U.S. average of $69,180. The
percentage of higher-income households ($100,000+) in Orange County is projected to grow from 44.8% of
total households in 2019 to 51.7% of households in 2024. This is significantly higher than the 2024 California
(44.0%) and U.S. (33.9%) projections.
Orange County’s median home value is $682,052 and average rental rate is $2,004.9 By 2024, Orange County’s
home value is estimated to increase to $715,049 and median household income to $102,755.10 This is a concern
as a larger proportion of wages spent on housing expenses such as rent and mortgage takes away from spending
towards preventative care, medical care, cost of raising a child, or vehicle maintenance. Households with low
incomes spend a greater percentage of their income on housing. According to the Legislative Analyst's Office,
high home prices force workers in California’s coastal communities, like Orange County, to commute 10%
further each day than commuters elsewhere in the nation, largely because limited affordable housing options
exist near major job centers.
In general, Orange County has higher home values compared to that of the state. California’s median home
value is $556,621 with median household income of $74,520. By 2024, these values are expected to increase to
$617,383 and $86,333, respectively.
8 Esri Demographics – 2019 Population Estimates based in US Census and American Communities Survey 2013-2017 9 CoStar.com – As Cited by Collins, Jeff, Orange County Register May 31, 2019 10 Esri Demographics – 2019 Population Estimates based in US Census and American Communities Survey 2013-2017
Variable OC CA USA OC CA USA
Median Household $88,453 $74,520 $60,548 $102,755 $86,333 $69,180
Average Household $121,359 $106,321 $87,398 $139,918 $123,187 $99,638
$0 - $15,000 6.8% 9.0% 10.7% 5.3% 7.3% 9.0%
$15 - $24,999 6.1% 7.6% 9.0% 4.7% 6.0% 7.7%
$25 - $34,999 5.8% 7.3% 8.9% 4.7% 6.2% 7.8%
$35 - $49,999 8.6% 10.6% 12.4% 7.2% 9.2% 11.5%
$50 - $74,999 14.8% 15.8% 17.5% 13.4% 14.8% 17.0%
$75 - $99,999 13.1% 12.4% 12.6% 12.9% 12.6% 13.1%
$100 - $149,999 19.4% 16.9% 15.1% 20.9% 18.7% 17.0%
$150,000 -$199,999 10.7% 8.8% 6.5% 13.1% 11.0% 8.3%
$200,000+ 14.7% 11.8% 7.3% 17.7% 14.3% 8.6%
Total 100% 100% 100% 100% 100% 100%
Orange County Household Income Distribution
2019 Estimate 2024 Projection
Source: Esri and US. Census , 2019
20 | P a g e
EDUCATION LEVELS
According to the Centers for Disease Control and Prevention (CDC), people with at least some college
education have mortality rates (deaths per 1,000 individuals per year) less than half of those without any college
education. In addition, people who are more educated exhibit less anxiety and depression, have fewer functional
limitations, and are less likely to have a serious health condition like diabetes, cardiovascular disease or asthma.
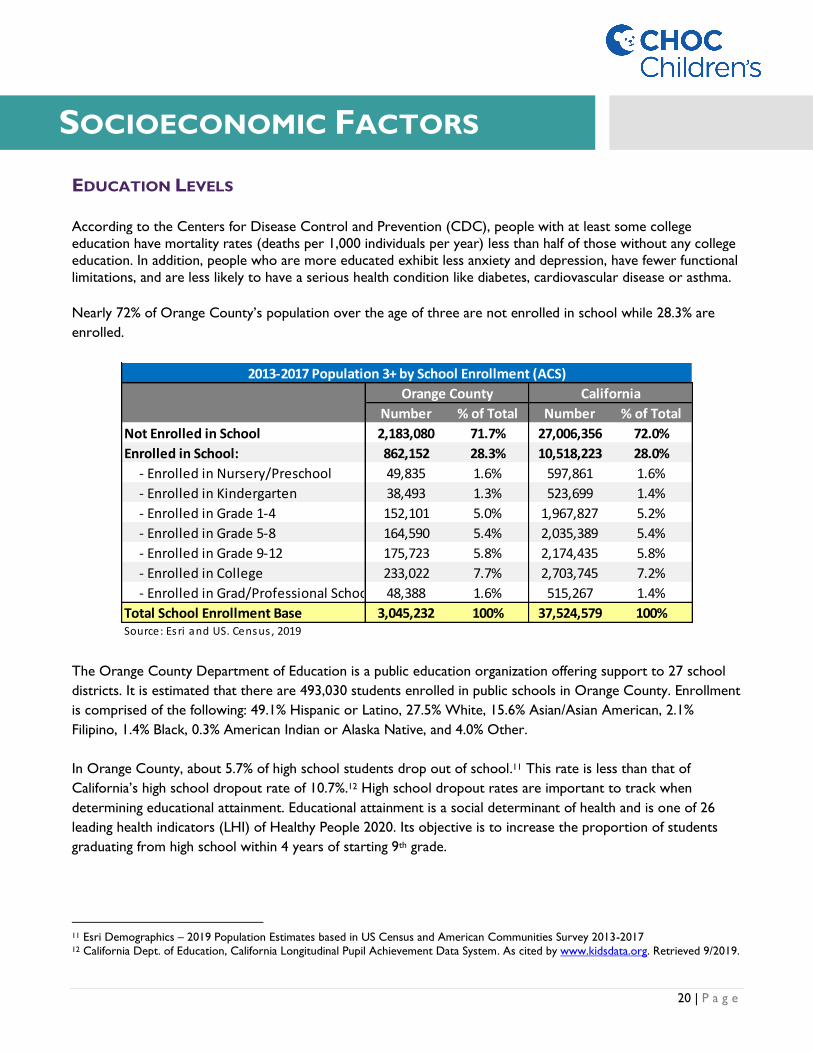
Nearly 72% of Orange County’s population over the age of three are not enrolled in school while 28.3% are
enrolled.
The Orange County Department of Education is a public education organization offering support to 27 school
districts. It is estimated that there are 493,030 students enrolled in public schools in Orange County. Enrollment
is comprised of the following: 49.1% Hispanic or Latino, 27.5% White, 15.6% Asian/Asian American, 2.1%
Filipino, 1.4% Black, 0.3% American Indian or Alaska Native, and 4.0% Other.
In Orange County, about 5.7% of high school students drop out of school.11 This rate is less than that of
California’s high school dropout rate of 10.7%.12 High school dropout rates are important to track when
determining educational attainment. Educational attainment is a social determinant of health and is one of 26
leading health indicators (LHI) of Healthy People 2020. Its objective is to increase the proportion of students
graduating from high school within 4 years of starting 9th grade.
11 Esri Demographics – 2019 Population Estimates based in US Census and American Communities Survey 2013-2017 12 California Dept. of Education, California Longitudinal Pupil Achievement Data System. As cited by www.kidsdata.org. Retrieved 9/2019.
Number % of Total Number % of Total
Not Enrolled in School 2,183,080 71.7% 27,006,356 72.0%
Enrolled in School: 862,152 28.3% 10,518,223 28.0%
- Enrolled in Nursery/Preschool 49,835 1.6% 597,861 1.6%
- Enrolled in Kindergarten 38,493 1.3% 523,699 1.4%
- Enrolled in Grade 1-4 152,101 5.0% 1,967,827 5.2%
- Enrolled in Grade 5-8 164,590 5.4% 2,035,389 5.4%
- Enrolled in Grade 9-12 175,723 5.8% 2,174,435 5.8%
- Enrolled in College 233,022 7.7% 2,703,745 7.2%
- Enrolled in Grad/Professional School 48,388 1.6% 515,267 1.4%
Total School Enrollment Base 3,045,232 100% 37,524,579 100%Source: Esri and US. Census , 2019
Orange County California
2013-2017 Population 3+ by School Enrollment (ACS)
SOCIOECONOMIC FACTORS
21 | P a g e
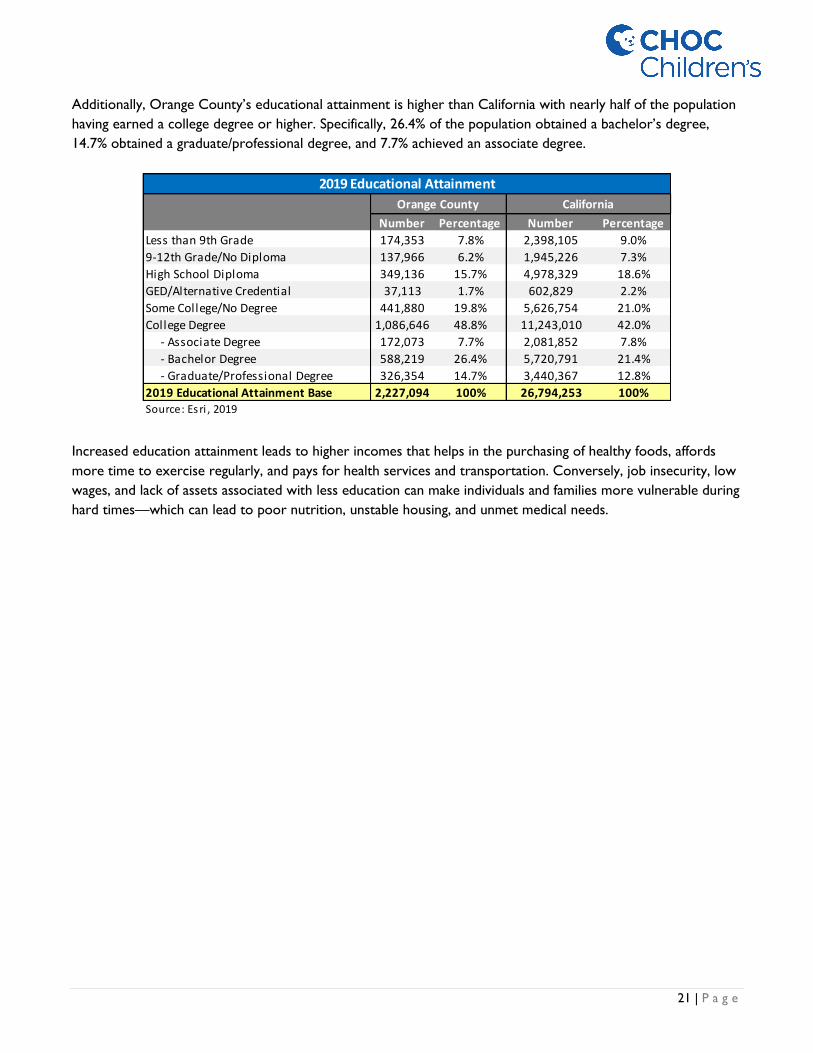
Additionally, Orange County’s educational attainment is higher than California with nearly half of the population
having earned a college degree or higher. Specifically, 26.4% of the population obtained a bachelor’s degree,
14.7% obtained a graduate/professional degree, and 7.7% achieved an associate degree.
Increased education attainment leads to higher incomes that helps in the purchasing of healthy foods, affords
more time to exercise regularly, and pays for health services and transportation. Conversely, job insecurity, low
wages, and lack of assets associated with less education can make individuals and families more vulnerable during
hard times—which can lead to poor nutrition, unstable housing, and unmet medical needs.
Number Percentage Number Percentage
Less than 9th Grade 174,353 7.8% 2,398,105 9.0%
9-12th Grade/No Diploma 137,966 6.2% 1,945,226 7.3%
High School Diploma 349,136 15.7% 4,978,329 18.6%
GED/Alternative Credential 37,113 1.7% 602,829 2.2%
Some College/No Degree 441,880 19.8% 5,626,754 21.0%
College Degree 1,086,646 48.8% 11,243,010 42.0%
- Associate Degree 172,073 7.7% 2,081,852 7.8%
- Bachelor Degree 588,219 26.4% 5,720,791 21.4%
- Graduate/Professional Degree 326,354 14.7% 3,440,367 12.8%
2019 Educational Attainment Base 2,227,094 100% 26,794,253 100%Source: Esri , 2019
Orange County
2019 Educational Attainment
California

22 | P a g e
CHRONIC ABSENTEEISM
Chronic absenteeism is a measurement based on the number of students absent at least 10% of the instructional
days that they were enrolled in school. According to Attendance Works, kindergarten students who are
chronically absent are likely to be less proficient readers and be held back in later grades. The study went on to
show that by sixth grade, chronic absenteeism is one of the early warning indicators influencing eventual high
school graduation.
The report below shows the annual Orange County K–12 public school chronic absenteeism rate by ethnicity.
Overall, the Orange County chronic absenteeism rate (8.3%) is lower than that of the California statewide rate
(11.1%). Despite Orange County’s chronic absenteeism rate being lower than California, many ethnic groups
within Orange County recorded rates far higher than the average statewide rate. This included:
• African American: 13.5% chronic absenteeism rate;
• American Indian or Alaska Native: 16.5% chronic absenteeism rate; and
• Pacific Islander: 14.5% chronic absenteeism rate.
Also assessed was the chronic absenteeism rates of school districts within Orange County. Only three school
districts reported higher chronic absenteeism rates when compared to the statewide rate (11.1%). These
include the Orange County Department of Education (36.3%), Fullerton Joint Union High (11.7%), and Anaheim
Union High School District (11.4%). The school district with the lowest chronic absenteeism rate in Orange
County was Fountain Valley Elementary School District. Only 3.7% of the district’s 6,519 enrolled students were
reported as being chronically absent over the course of the school year.
Orange
County California
Orange
County California
Orange
County California
African American 6,855 351,274 925 70,622 13.5% 20.1%
American Indian or Alaska Native 1,101 33,157 179 6,958 16.3% 21.0%
Asian 81,251 578,878 2,446 22,270 3.0% 3.8%
Filipino 10,218 153,577 436 8,017 4.3% 5.2%
Hispanic or Latino 243,526 3,426,105 23,923 415,666 9.8% 12.1%
Pacific Islander 1,660 29,539 240 5,141 14.5% 17.4%
White 128,234 1,462,370 10,794 141,803 8.4% 9.7%
Two or More Races 18,532 224,439 1,431 23,764 7.7% 10.6%
Not Reported 4,412 55,792 564 8,290 12.8% 14.9%
Total 495,789 6,315,131 40,938 702,531 8.3% 11.1%
Source: California Department of Education
Note: Lower rate is better = Above California Average (11.1%)
Orange County K-12 Chronic Absenteeism by Ethnicity, 2017/2018
K-12 Enrollment
Chronic Absenteeism
Count
Chronic Absenteeism
Rate
Ethnicity

23 | P a g e
The cause of chronic absenteeism can have many underlying factors, such as domestic violence, child neglect,
bullying, and transportation issues.
District Name
K-12
Enrollment
Chronic
Absenteeism
Count
Chronic
Absenteeism
Rate
Above/Below
OC Average
Above/Below
CA Average
Orange County Department of Education¹ 9,073 3,290 36.3% ● ●
Fullerton Joint Union High 14,143 1,652 11.7% ● ●
Anaheim Union High 31,455 3,580 11.4% ● ●
Laguna Beach Unified 2,975 309 10.4% ● ●
Capistrano Unified 55,649 5,707 10.3% ● ●
Newport-Mesa Unified 21,720 2,248 10.3% ● ●
Orange Unified 28,559 2,862 10.0% ● ●
Huntington Beach Union High 16,409 1,627 9.9% ● ●
Magnolia Elementary 6,288 534 8.5% ● ●
Saddleback Valley Unified 27,899 2,280 8.2% ● ●
Placentia-Yorba Linda Unified 26,329 2,114 8.0% ● ●
SBE - Magnolia Science Academy Santa Ana 761 59 7.8% ● ●
Anaheim Elementary 18,658 1,405 7.5% ● ●
La Habra City Elementary 4,871 363 7.5% ● ●
Garden Grove Unified 44,288 3,259 7.4% ● ●
Santa Ana Unified 54,254 3,848 7.1% ● ●
Tustin Unified 24,582 1,706 6.9% ● ●
Buena Park Elementary 4,896 330 6.7% ● ●
Brea-Olinda Unified 6,053 380 6.3% ● ●
Westminster 9,489 580 6.1% ● ●
Centralia Elementary 4,473 264 5.9% ● ●
Ocean View 8,490 474 5.6% ● ●
Huntington Beach City Elementary 7,283 402 5.5% ● ●
Irvine Unified 35,891 1,855 5.2% ● ●
Fullerton Elementary 13,667 664 4.9% ● ●
Savanna Elementary 2,360 106 4.5% ● ●
Cypress Elementary 4,074 161 4.0% ● ●
Los Alamitos Unified 9,965 391 3.9% ● ●
Fountain Valley Elementary 6,519 239 3.7% ● ●
Orange County Total 495,789 40,938 8.3%
California 6,315,131 702,531 11.1%
Source: California Department of Education
Note: Lower rate is better
¹ Includes Juvenile Hall and other Alternative, Community, and Correctional Education Schools
Orange County K-12 Chronic Absenteeism by School District, 2017/2018
24 | P a g e
ENGLISH PROFICIENCY
Limited English proficiency (LEP) is a term used to describe individuals who do not speak English as their primary
language and who have a limited ability to read, speak, write, or understand English. Currently, 44.5 million
people in the United States (or nearly 14% of the population) are foreign born—up from 7.9% in 1990. As this
number grows, so does the amount of health utilization by LEP patients increase. An inability to speak English
well can create barriers to healthcare access, provider communication, and health literacy and education.
Barriers to communication can also result in fewer provider and wellness visits leading to delays in receiving
preventative services, which can lead to chronic conditions and increased risk to hospitalization.
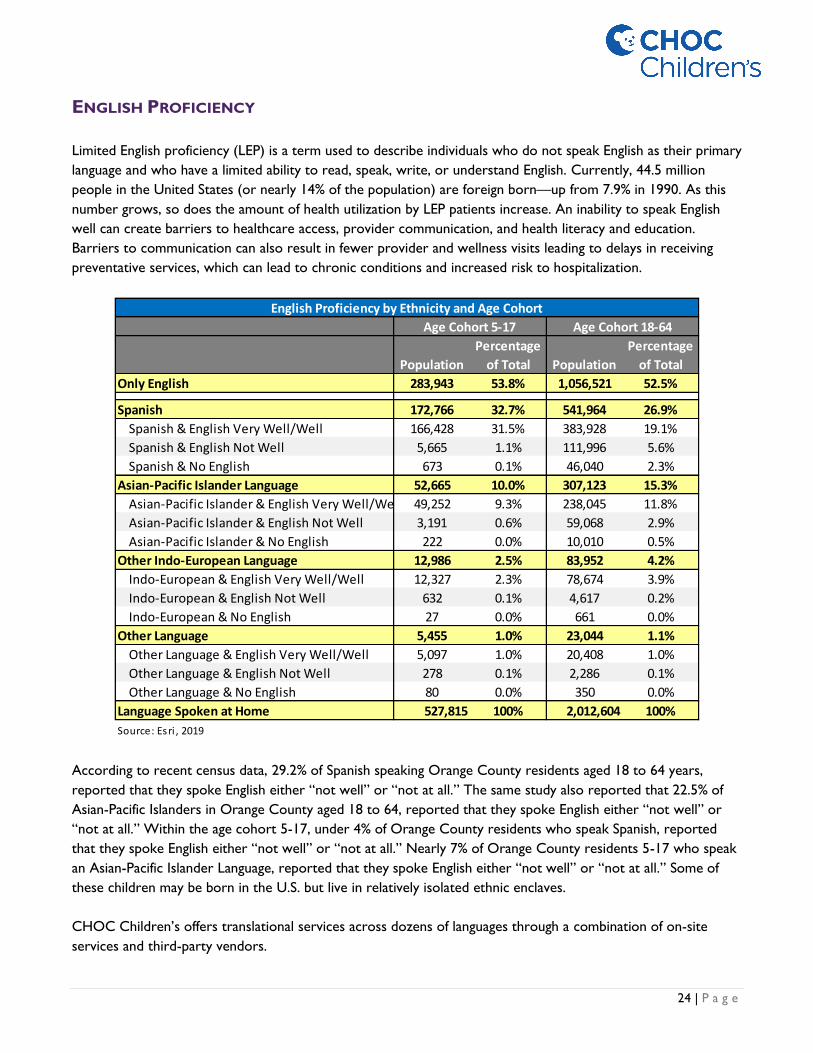
According to recent census data, 29.2% of Spanish speaking Orange County residents aged 18 to 64 years,
reported that they spoke English either “not well” or “not at all.” The same study also reported that 22.5% of
Asian-Pacific Islanders in Orange County aged 18 to 64, reported that they spoke English either “not well” or
“not at all.” Within the age cohort 5-17, under 4% of Orange County residents who speak Spanish, reported
that they spoke English either “not well” or “not at all.” Nearly 7% of Orange County residents 5-17 who speak
an Asian-Pacific Islander Language, reported that they spoke English either “not well” or “not at all.” Some of
these children may be born in the U.S. but live in relatively isolated ethnic enclaves.
CHOC Children’s offers translational services across dozens of languages through a combination of on-site
services and third-party vendors.
Population
Percentage
of Total Population
Percentage
of Total
Only English 283,943 53.8% 1,056,521 52.5%
Spanish 172,766 32.7% 541,964 26.9%
Spanish & English Very Well/Well 166,428 31.5% 383,928 19.1%
Spanish & English Not Well 5,665 1.1% 111,996 5.6%
Spanish & No English 673 0.1% 46,040 2.3%
Asian-Pacific Islander Language 52,665 10.0% 307,123 15.3%
Asian-Pacific Islander & English Very Well/Well 49,252 9.3% 238,045 11.8%
Asian-Pacific Islander & English Not Well 3,191 0.6% 59,068 2.9%
Asian-Pacific Islander & No English 222 0.0% 10,010 0.5%
Other Indo-European Language 12,986 2.5% 83,952 4.2%
Indo-European & English Very Well/Well 12,327 2.3% 78,674 3.9%
Indo-European & English Not Well 632 0.1% 4,617 0.2%
Indo-European & No English 27 0.0% 661 0.0%
Other Language 5,455 1.0% 23,044 1.1%
Other Language & English Very Well/Well 5,097 1.0% 20,408 1.0%
Other Language & English Not Well 278 0.1% 2,286 0.1%
Other Language & No English 80 0.0% 350 0.0%
Language Spoken at Home 527,815 100% 2,012,604 100%
Source: Esri , 2019
English Proficiency by Ethnicity and Age Cohort
Age Cohort 5-17 Age Cohort 18-64

25 | P a g e
CHILD POVERTY
Child poverty has various negative effects on the physical and mental health of children. According to Orange
County Children’s Partnerships (OCCP), poverty is linked to substandard housing, homelessness, inadequate
nutrition, food insecurity, inadequate child care, lack of access to health care, and generally unsafe
neighborhoods. The implications for children living in poverty include greater risk for poor academic
achievement, school dropout, abuse and neglect, behavioral and socioemotional problems, physical health
problems and developmental delays.
Evidently, poverty is a relevant indicator as it creates barriers to health promotion and management. The overall
percentage of residents living in poverty in Orange County is 12.1%. Approximately 16.4% of children (ages 0-
17) live in poverty, 5.3% of children live in deep poverty (<50% Federal Poverty Threshold) and 5.8% of Orange
County children are considered homeless.13
13 U.S. Census Bureau, 2016 American Community Survey. As cited on www.kidsdata.org, a program of the Lucile Packard Foundation
for Children's Health. Retrieved 7/2019.
16.9%17.6% 17.6%
16.9% 16.4%
20.8%20.3%
0.0%
5.0%
10.0%
15.0%
20.0%
25.0%
2009-2013 2010-2014 2011-2015 2012-2016 2013-2017
Orange County Children Living in Poverty
Orange County California National
Source: United States Census Bureau, American Community Survey, 2009-2017

26 | P a g e
HEALTHCARE ACCESS
Access to comprehensive quality health care services is important for promoting and maintaining health,
preventing and managing disease, reducing unnecessary disability and premature death, and achieving health
equity for all Americans. Health insurance coverage helps patients enter the health care system whereas a lack
of adequate health insurance coverage makes it difficult for people to get the health care they need. When
families with inadequate health insurance do get care they need, they can be burdened with large medical bills.
According to Healthy People 2020, uninsured people are more likely to have a poor health status, are less likely
to receive medical care, and are more likely to die prematurely.
Through California’s adoption of the ACA, the percentage of statewide population without health insurance has
been greatly reduced to approximately 5%. Orange County generally mirrors enrollment levels observed
throughout the state but is slightly more affluent and has 5% more employer-based coverage, 2% more self-pay
(direct-purchase coverage), and 4% less Medicaid/Medi-Cal when compared to the rest of the state.
Annual health care spending per household in Orange County is approximately 10% higher than the state
average at $7,474 per household compared to $6,705 at the state level. Health Insurance Premium spending is
also 10% higher, with an average household health insurance premium of $4,450 or $370 per month.
49%
8%
0%
34%
0%4% 5%
44%
6%0%
38%
1%5% 5%
0%
10%
20%
30%
40%
50%
60%
Employer-BasedHealth Ins Only
Direct-PurchaseHealth Ins Only
MedicareCoverage Only
MedicaidCoverage Only
TRICARE/VA 2+ Types ofHealth Insurance
No HealthInsuranceCoverage
Health Insurance Coverage 2013-2017 ACS Population <19
OC CA
Source: Esri, 2019

27 | P a g e
The table below shows the Orange County pediatric population, by insurance coverage type, compared to the
state of California for 2019. Overall, the Orange County pediatric population has higher rates of employer-based
health insurance and lower rates of Medi-Cal coverage when compared to California. In Orange County, 48.75%
of the pediatric population obtain coverage through employer-based insurance and 33.62% through Medi-Cal.
In Orange County, 4.67% of the pediatric population are uninsured which is slightly lower than the state average
(4.74%).14 More Hispanic children continue to have higher uninsured rates than other racial/ethnic groups.15
14 Esri Demographics – 2019 Population Estimates based in US Census and American Communities Survey 2013-2017 15 Orange County Children’s Partnership (2019). The 24th Annual Report on the Conditions of Children in Orange County [Report].
$7.93 Billion
$89.44 Billion
$7,474$6,705
$0
$1,000
$2,000
$3,000
$4,000
$5,000
$6,000
$7,000
$8,000
$0
$20
$40
$60
$80
$100
$120
$140
OC CA
Spe
nd
ing
pe
r H
ou
seh
old
Tota
l Sp
en
din
g Bill
ion
s2019 Health Care Spending
Health Care Spending Healthcare Spending Per Household
Insurance Type
Pediatric
PopulationPercentage
Pediatric
PopulationPercentage
One Type of Health Insurance 692,548 91.20% 8,691,191 90.18%
− Employer-Based Health Ins Only 370,189 48.75% 4,248,385 44.08%
− Direct-Purchase Health Ins Only 63,147 8.32% 588,224 6.10%
− Medicare Coverage Only 1,847 0.24% 47,144 0.49%
− Medi-Cal Coverage Only 255,261 33.62% 3,700,128 38.39%
− TRICARE/Military Health Only 2,035 0.27% 105,534 1.10%
− VA Health Care Only 69 0.01% 1,776 0.02%
2+ Types of Health Insurance 31,313 4.12% 489,325 5.08%
No Health Insurance Coverage 35,483 4.67% 457,257 4.74%
Pediatric Population 759,344 100% 9,637,773 100%Source: Esri , 2019
Orange County California
Orange County Pediatric Population by Insurance Type, 2019
Source: Esri, 2019

28 | P a g e
FOOD INSECURITY
According to Healthy People 2020, food insecurity is defined as the disruption of food intake or eating patterns
because of a lack of money and other resources—which can be temporary or long-term. Food insecurity is an
important social determinant within the economic stability domain. Food insecurity does not necessarily cause
hunger; however, hunger is an outcome of food insecurity. Food insecurity may reflect a household’s need to
make trade-offs between important basic needs, such as housing or medical bills, and purchasing nutritionally
adequate foods.
Having limited food access due to cost can be associated with chronic morbidities, such as obesity and diabetes.
Seth A. Berkowitz, Andrew J. Karter and their colleagues conducted a study to analyze the association between
food insecurity, low physical food access (food deserts), and glycemic control (diabetes). In March 2018, their
study was published in the American Diabetes Association with the conclusion that food insecurity is associated
with higher HbA1c (diabetes). However, living in an area with low physical food access (i.e., food deserts) is not
associated with diabetes. Therefore, this study supports governmental efforts such as National School Lunch
Program (NSLP), the Women, Infants, and Children (WIC) program and the Supplemental Nutrition Assistance
Program (SNAP) to reduce food insecurity.
21.2%20.6%
19.3%
17.9%
16.3%15.7%
18.1%
17.0%
0%
5%
10%
15%
20%
25%
2012 2013 2014 2015 2016 2017
Orange County Child Food Insecurity Rate
Orange County California National
Source: Feeding America, 2012-2017

29 | P a g e
Feeding America, a not-for-profit organization focusing on food access and nutrition, noted that the food
insecurity rate in Orange County, across all age cohorts, was 9.2%. When looking at food insecurity rate for
children, Feeding America reported that 15.7% of Orange County children experience food insecurity. This
figure has dropped continually since 2012 (21.2%) and is below the California and National child food insecurity
rates. Food insecure children are those children living in households experiencing food insecurity.
The table below ranks the Orange County school districts based on number of children eligible to receive either
free or reduced priced meals.
Of the 479,000 students enrolled in public schools in Orange County, approximately 49% are eligible to receive
free or reduced-price meals. School districts are often the primary source of nutrition for feeding children
growing up with food insecurity. This is especially challenging for school districts with over 75% of students
enrolled in the free and reduced-price meal programs.
School District Number
% of
District
Above/Below
CA Average Number
% of
District
Above/Below
CA Average
Anaheim Elementary 17,342 12,931 74.6% ● 14,656 84.5% ●
Magnolia Elementary 5,851 4,487 76.7% ● 4,886 83.5% ●
Santa Ana Unified 51,482 37,867 73.6% ● 41,542 80.7% ●
SBE - Magnolia Science Academy Santa Ana 674 504 74.8% ● 535 79.4% ●
La Habra City Elementary 4,656 2,980 64.0% ● 3,463 74.4% ●
Westminster 9,120 5,789 63.5% ● 6,595 72.3% ●
Anaheim Union High 30,292 18,888 62.4% ● 21,604 71.3% ●
Savanna Elementary 2,199 1,383 62.9% ● 1,552 70.6% ●
Garden Grove Unified 42,301 25,590 60.5% ● 29,015 68.6% ●
Buena Park Elementary 4,552 2,773 60.9% ● 3,113 68.4% ●
Orange County Department of Education 6,955 4,002 57.5% ● 4,340 62.4% ●
Centralia Elementary 4,221 2,269 53.8% ● 2,505 59.3% ●
Fullerton Joint Union High 13,695 5,711 41.7% ● 6,719 49.1% ●
Fullerton Elementary 13,067 5,650 43.2% ● 6,386 48.9% ●
Orange Unified 27,478 11,797 42.9% ● 12,942 47.1% ●
Ocean View 7,986 3,392 42.5% ● 3,721 46.6% ●
Newport-Mesa Unified 20,641 8,169 39.6% ● 9,038 43.8% ●
Tustin Unified 23,768 7,906 33.3% ● 9,242 38.9% ●
Huntington Beach Union High 15,967 5,359 33.6% ● 5,974 37.4% ●
Placentia-Yorba Linda Unified 25,477 8,538 33.5% ● 9,496 37.3% ●
Cypress Elementary 3,923 1,158 29.5% ● 1,342 34.2% ●
Brea-Olinda Unified 6,008 1,563 26.0% ● 1,826 30.4% ●
Saddleback Valley Unified 26,747 7,236 27.1% ● 7,972 29.8% ●
Capistrano Unified 53,269 12,567 23.6% ● 13,840 26.0% ●
Fountain Valley Elementary 6,328 1,345 21.3% ● 1,508 23.8% ●
Huntington Beach City Elementary 6,949 1,250 18.0% ● 1,353 19.5% ●
Irvine Unified 35,291 5,837 16.5% ● 6,610 18.7% ●
Los Alamitos Unified 9,730 1,328 13.6% ● 1,634 16.8% ●
Laguna Beach Unified 2,861 300 10.5% ● 330 11.5% ●
Orange County Total 478,830 208,569 43.6% ● 233,739 48.8% ●
California Total 6,186,628 3,236,350 52.3% 3,675,129 59.4%
Source: California Department of Education, January 31, 2019
Children
Enrolled (K-12)
Free Meal Eligible
Orange County School Districts by Number of Children Enrolled Eligible for Free or Reduced Priced Meals
Free or Reduced Price Meal Eligible

30 | P a g e
Food insecurity negatively impacts health outcomes—a statement supported by multiple studies. The Center on
the Developing Child at Harvard University stated that “inadequate nutrition can permanently alter a child’s
brain architecture and stunt their intellectual capacity, affecting the child’s learning, social interaction, and
productivity. Children who do not receive what they need for strong, healthy brain development during early
childhood may never recover their lost potential for cognitive growth and eventual contributions to society.”
UNEMPLOYMENT
Unemployment is a relevant indicator as unemployment creates financial instability and barriers to access
including insurance coverage, health services, healthy food, and other necessities that contribute to poor health
status. Unemployment status can be a stressor for individuals and their families. According to California
Employment Development Department Bureau of Labor Statistics, Orange County’s unemployment rate was
3.0% in August 2019. This is less than the California (4.2%) and national (3.8%) rate.
5.5
%
4.5
%
4.0
%
3.5
%
3.1
%
3.0
%
8.3
%
6.6
%
5.3
%
4.8
%
5.0
%
4.7
%
8.0
%
6.4
%
5.8
%
4.9
%
4.3
%
4.1
%
6.4
%
5.2
%
4.7
%
4.0
%
3.5
%
3.4
%
7.5
%
6.2
%
5.5
%
4.8
%
4.3
%
4.2
%0.0%
1.0%
2.0%
3.0%
4.0%
5.0%
6.0%
7.0%
8.0%
9.0%
2014 2015 2016 2017 2018 2019 YTD
Unemployment Rate, 2014-2019 YTD
Orange County Los Angeles County San Bernardino County San Diego County California
Source: State of California, Employment Development Department, 2014-2019 YTD

31 | P a g e
CRIME
Crime can deter individuals from pursuing healthy behaviors. Not only can it increase stress, it can compromise
physical safety and psychological well-being. Orange County enjoys one of the nation’s lower crime rates. The
crime index in Orange County is 77, which is significantly less than California (103 crime index). The city of
Irvine is considered to be one of the safest cities in America.
5840
60 6953
8064
81110
111
9684
134
106
10199
92
185
0
50
100
150
200
250
300
350
PersonalCrime Index
MurderIndex
Rape Index RobberyIndex
Assault Index PropertyCrime Index
BurglaryIndex
LarcenyIndex
MotorVehicle Theft
Index
Orange County Crime Indexes, 2019
Orange County California
Source: Esri, 2019

32 | P a g e
MORTALITY
The overall age-adjusted mortality rate for Orange County is significantly lower than that of California. Orange
County reported age-adjusted mortality rates in three causes that did not meet the national objective:
cerebrovascular disease, chronic liver disease and cirrhosis, and drug-induced deaths.
Selected Cause
Orange
County
Cal
ifo
rnia
Nat
ion
al
Ob
ject
ive
All Causes 545.9 ● - 608.5 a
All Cancers 129.1 ● ● 140.2 161.4
Colorectal Cancer 1.8 ● ● 12.8 14.5
Lung Cancer 25.8 ● ● 28.9 45.5
Female Breast Cancer 18.2 ● ● 19.1 20.7
Prostate Cancer 17.7 ● ● 19.6 21.8
Diabetes 13.9 ● - 20.7 b
Alzheimer's Disease 38.6 ● - 34.2 a
Coronary Heart Disease 77.2 ● ● 89.1 103.4
Cerebrovascular Disease (Stroke) 35.9 ● ● 35.3 34.8
Influenza/Pneumonia 15.1 ● - 14.3 a
Chronic Lower Respiratory Disease 26.8 ● - 32.1 a
Chronic Liver Disease and Cirrhosis 10.7 ● ● 12.2 8.2
Accidents (Unintentional Injuries) 26.5 ● ● 30.3 36.4
Motor Vehicle Traffic Crashes 7 ● ● 8.8 12.4
Suicide 9.3 ● ● 10.4 10.2
Homicide 2.3 ● ● 5 5.5
Firearm-Related Deaths 4.6 ● ● 7.6 9.3
Drug-Induced Deaths 12.1 ● ● 12.2 11.3
2019 Mortality Statistics: Rate Per 100,000 Population, All Ages
Source: California Department of Public Health
a: Healthy People 2020 (HP 2020) National Objective has not been established.
b: National Objective is based on both underlying and contributing cause of death which requires use of multiple cause of death
files. California's data exclude multiple/contributing causes of death.
Age Adjusted
Above/Below:
California
National
Objective
HEALTH INDICATORS
33 | P a g e
INFANT MORTALITY
Infant mortality rate is the death of an infant before his or her first birthday, which is an important indicator of
the overall health of a community. According to the American Academy of Pediatrics, the infant mortality rate is
a crude indicator of not only community health status, but also poverty and socioeconomic status levels that
provide context on the overall availability and quality of local health services.
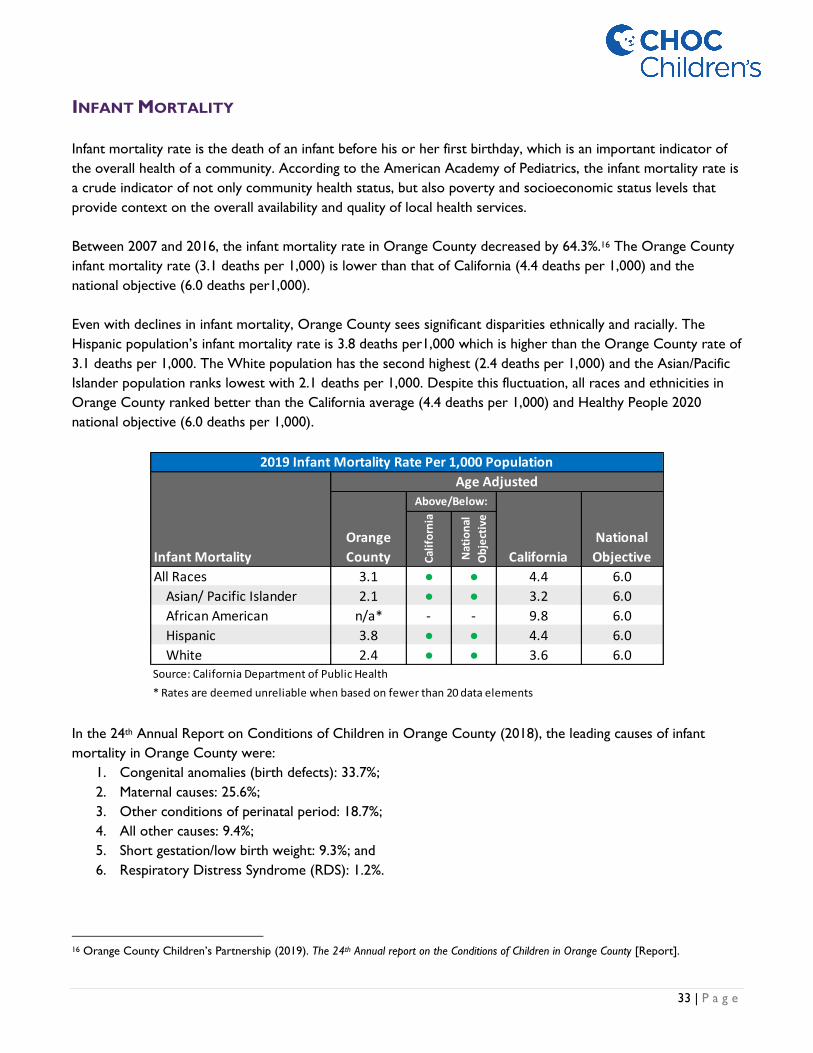
Between 2007 and 2016, the infant mortality rate in Orange County decreased by 64.3%.16 The Orange County
infant mortality rate (3.1 deaths per 1,000) is lower than that of California (4.4 deaths per 1,000) and the
national objective (6.0 deaths per1,000).
Even with declines in infant mortality, Orange County sees significant disparities ethnically and racially. The
Hispanic population’s infant mortality rate is 3.8 deaths per1,000 which is higher than the Orange County rate of
3.1 deaths per 1,000. The White population has the second highest (2.4 deaths per 1,000) and the Asian/Pacific
Islander population ranks lowest with 2.1 deaths per 1,000. Despite this fluctuation, all races and ethnicities in
Orange County ranked better than the California average (4.4 deaths per 1,000) and Healthy People 2020
national objective (6.0 deaths per 1,000).
In the 24th Annual Report on Conditions of Children in Orange County (2018), the leading causes of infant
mortality in Orange County were:
1. Congenital anomalies (birth defects): 33.7%;
2. Maternal causes: 25.6%;
3. Other conditions of perinatal period: 18.7%;
4. All other causes: 9.4%;
5. Short gestation/low birth weight: 9.3%; and
6. Respiratory Distress Syndrome (RDS): 1.2%.
16 Orange County Children’s Partnership (2019). The 24th Annual report on the Conditions of Children in Orange County [Report].
Infant Mortality
Orange
County Cal
ifo
rnia
Nat
ion
al
Ob
ject
ive
All Races 3.1 ● ● 4.4 6.0
Asian/ Pacific Islander 2.1 ● ● 3.2 6.0
African American n/a* - - 9.8 6.0
Hispanic 3.8 ● ● 4.4 6.0
White 2.4 ● ● 3.6 6.0
* Rates are deemed unreliable when based on fewer than 20 data elements
2019 Infant Mortality Rate Per 1,000 Population
Age Adjusted
Above/Below:
California
National
Objective
Source: California Department of Public Health

34 | P a g e
NATALITY
Natality, or birth rate, is a population health measure that helps determine the rate of population growth and
therefore provide substance to the bigger picture when trying to understand impact of community and health
care resource utilization. Natality depends on both level of fertility and the age structure of populations. In
Orange County, the natality rate is 11.9 live births per 1,000.
Preterm birth is defined as delivery of an infant at less than 37 weeks of gestation. It is an important public
health issue as preterm infants are more likely to suffer lifelong neurologic, cognitive and behavioral problems,
which is why preterm birth requires sustained focus on its causes, consequences, and prevention strategies.
Reducing preterm births is a Healthy People 2020 LHI with a goal to decrease preterm live births by 10 percent
to reach a target of 9.4% by 2020. Currently, the national percentage of preterm births is 9.9%. Both California
(8.7%) and Orange County (8.0%) meet the Healthy People 2020 target.
Teen births (births to mothers aged 15-19 years old) is another public health issue that not only affects children
but families and society. Teen mothers are less likely to complete high school or college, more likely to require
public assistance, and more likely to live in poverty when compared to peers who are not mothers.17
Additionally, infants born to teen mothers have lower probability of obtaining emotional and financial resources
and are at greater risk for low birth weight, preterm birth, and death in infancy.18 In Orange County, the teen
birth rate is 10.8 births per 1,000, which is considerably less than the California (15.7 births per 1,000) and
national (18.8 births per 1,000) teen birth rate.
17 Orange County Children’s Partnership (2019). The 24th Annual report on the Conditions of Children in Orange County [Report]. 18 Orange County Children’s Partnership (2019). The 24th Annual report on the Conditions of Children in Orange County [Report].
Infant Natality
Orange
CountyC
alif
orn
ia
Nat
ion
al
Ob
ject
ive
Low Birthweight Infants 6.1% ● ● 6.9% 7.8%
First Trimester Prenatal Care 86.8% ● ● 83.5% 77.9%
Adequate/ Adequate Plus Prenatal Care 83.7% ● ● 77.9% 77.6%
Births to Mothers Aged 15-19 (rates per 1,000) 10.8 ● - 15.7 a
Breastfeeding Initiation 95.0% ● ● 94.0% 81.9%
a Healthy People 2020 National Objective has not been established.
Orange County Natality Statistics, 2019
Age Adjusted
Above/Below:
California
National
Objective
Source: California Department of Public Health
35 | P a g e
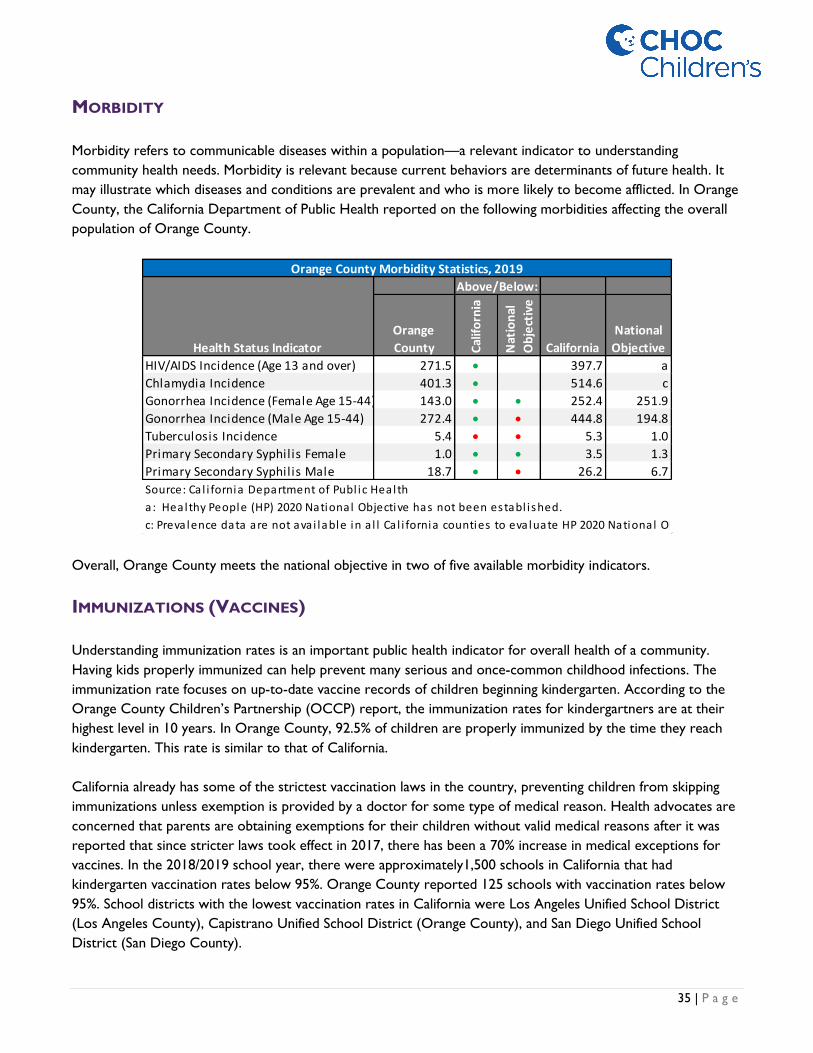
MORBIDITY
Morbidity refers to communicable diseases within a population—a relevant indicator to understanding
community health needs. Morbidity is relevant because current behaviors are determinants of future health. It
may illustrate which diseases and conditions are prevalent and who is more likely to become afflicted. In Orange
County, the California Department of Public Health reported on the following morbidities affecting the overall
population of Orange County.
Overall, Orange County meets the national objective in two of five available morbidity indicators.
IMMUNIZATIONS (VACCINES)
Understanding immunization rates is an important public health indicator for overall health of a community.
Having kids properly immunized can help prevent many serious and once-common childhood infections. The
immunization rate focuses on up-to-date vaccine records of children beginning kindergarten. According to the
Orange County Children’s Partnership (OCCP) report, the immunization rates for kindergartners are at their
highest level in 10 years. In Orange County, 92.5% of children are properly immunized by the time they reach
kindergarten. This rate is similar to that of California.
California already has some of the strictest vaccination laws in the country, preventing children from skipping
immunizations unless exemption is provided by a doctor for some type of medical reason. Health advocates are
concerned that parents are obtaining exemptions for their children without valid medical reasons after it was
reported that since stricter laws took effect in 2017, there has been a 70% increase in medical exceptions for
vaccines. In the 2018/2019 school year, there were approximately1,500 schools in California that had
kindergarten vaccination rates below 95%. Orange County reported 125 schools with vaccination rates below
95%. School districts with the lowest vaccination rates in California were Los Angeles Unified School District
(Los Angeles County), Capistrano Unified School District (Orange County), and San Diego Unified School
District (San Diego County).
Orange
County Cal
ifo
rnia
Nat
ion
al
Ob
ject
ive
California
National
Objective
HIV/AIDS Incidence (Age 13 and over) 271.5 • 397.7 a
Chlamydia Incidence 401.3 • 514.6 c
Gonorrhea Incidence (Female Age 15-44) 143.0 • • 252.4 251.9
Gonorrhea Incidence (Male Age 15-44) 272.4 • • 444.8 194.8
Tuberculosis Incidence 5.4 • • 5.3 1.0
Primary Secondary Syphilis Female 1.0 • • 3.5 1.3
Primary Secondary Syphilis Male 18.7 • • 26.2 6.7
Source: Ca l i fornia Department of Publ ic Health
Above/Below:
Orange County Morbidity Statistics, 2019
Health Status Indicator
c: Prevalence data are not avai lable in a l l Ca l i fornia counties to evaluate HP 2020 National Obj
a: Healthy People (HP) 2020 National Objective has not been establ ished.
36 | P a g e
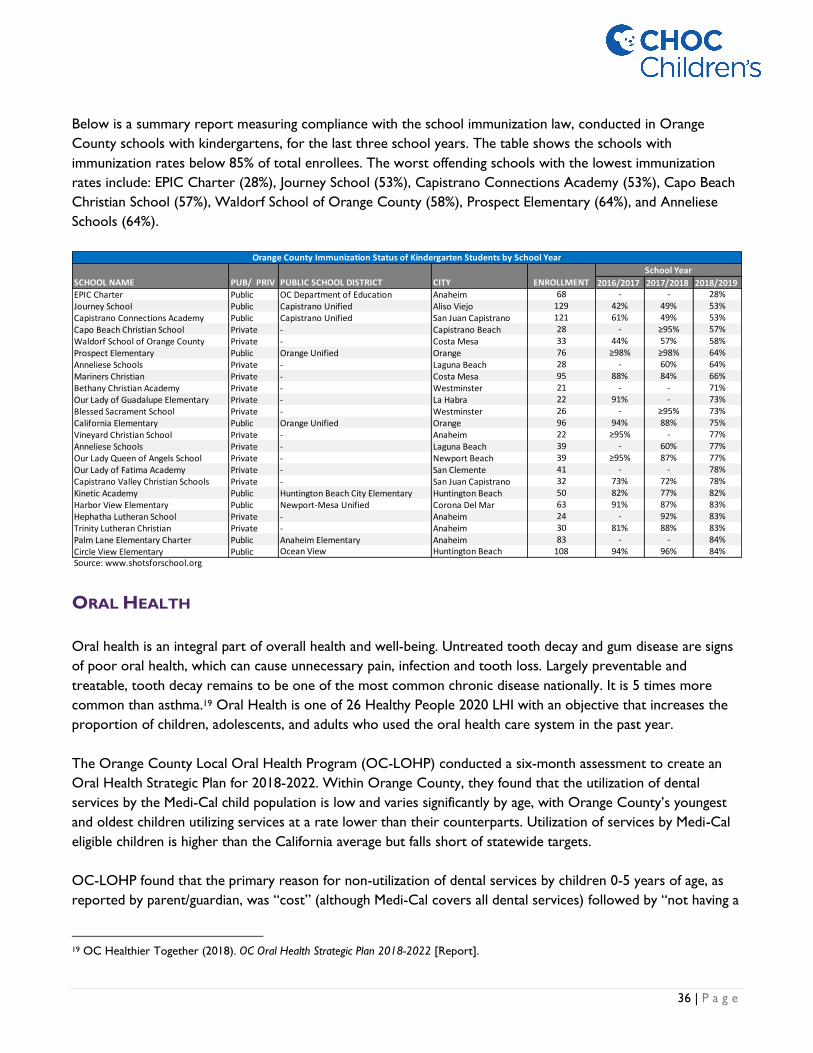
Below is a summary report measuring compliance with the school immunization law, conducted in Orange
County schools with kindergartens, for the last three school years. The table shows the schools with
immunization rates below 85% of total enrollees. The worst offending schools with the lowest immunization
rates include: EPIC Charter (28%), Journey School (53%), Capistrano Connections Academy (53%), Capo Beach
Christian School (57%), Waldorf School of Orange County (58%), Prospect Elementary (64%), and Anneliese
Schools (64%).
ORAL HEALTH
Oral health is an integral part of overall health and well-being. Untreated tooth decay and gum disease are signs
of poor oral health, which can cause unnecessary pain, infection and tooth loss. Largely preventable and
treatable, tooth decay remains to be one of the most common chronic disease nationally. It is 5 times more
common than asthma.19 Oral Health is one of 26 Healthy People 2020 LHI with an objective that increases the
proportion of children, adolescents, and adults who used the oral health care system in the past year.
The Orange County Local Oral Health Program (OC-LOHP) conducted a six-month assessment to create an
Oral Health Strategic Plan for 2018-2022. Within Orange County, they found that the utilization of dental
services by the Medi-Cal child population is low and varies significantly by age, with Orange County’s youngest
and oldest children utilizing services at a rate lower than their counterparts. Utilization of services by Medi-Cal
eligible children is higher than the California average but falls short of statewide targets.
OC-LOHP found that the primary reason for non-utilization of dental services by children 0-5 years of age, as
reported by parent/guardian, was “cost” (although Medi-Cal covers all dental services) followed by “not having a
19 OC Healthier Together (2018). OC Oral Health Strategic Plan 2018-2022 [Report].
2016/2017 2017/2018 2018/2019EPIC Charter Public OC Department of Education Anaheim 68 - - 28%
Journey School Public Capistrano Unified Aliso Viejo 129 42% 49% 53%
Capistrano Connections Academy Public Capistrano Unified San Juan Capistrano 121 61% 49% 53%
Capo Beach Christian School Private - Capistrano Beach 28 - ≥95% 57%
Waldorf School of Orange County Private - Costa Mesa 33 44% 57% 58%
Prospect Elementary Public Orange Unified Orange 76 ≥98% ≥98% 64%
Anneliese Schools Private - Laguna Beach 28 - 60% 64%
Mariners Christian Private - Costa Mesa 95 88% 84% 66%
Bethany Christian Academy Private - Westminster 21 - - 71%
Our Lady of Guadalupe Elementary Private - La Habra 22 91% - 73%
Blessed Sacrament School Private - Westminster 26 - ≥95% 73%
California Elementary Public Orange Unified Orange 96 94% 88% 75%
Vineyard Christian School Private - Anaheim 22 ≥95% - 77%
Anneliese Schools Private - Laguna Beach 39 - 60% 77%
Our Lady Queen of Angels School Private - Newport Beach 39 ≥95% 87% 77%
Our Lady of Fatima Academy Private - San Clemente 41 - - 78%
Capistrano Valley Christian Schools Private - San Juan Capistrano 32 73% 72% 78%
Kinetic Academy Public Huntington Beach City Elementary Huntington Beach 50 82% 77% 82%
Harbor View Elementary Public Newport-Mesa Unified Corona Del Mar 63 91% 87% 83%
Hephatha Lutheran School Private - Anaheim 24 - 92% 83%
Trinity Lutheran Christian Private - Anaheim 30 81% 88% 83%
Palm Lane Elementary Charter Public Anaheim Elementary Anaheim 83 - - 84%
Circle View Elementary Public Ocean View Huntington Beach 108 94% 96% 84%Source: www.shotsforschool.org
School Year
Orange County Immunization Status of Kindergarten Students by School Year
SCHOOL NAME PUB/ PRIV PUBLIC SCHOOL DISTRICT CITY ENROLLMENT

37 | P a g e
dentist/difficulty finding one” among 6-18-year-olds. From the assessment, they found that only 3% of all active
dentists in Orange County are pediatric dentists.
According to County Health Rankings for Orange County, there are 110 dentists per 100,000 population which
places Orange County in top 50th percentile when compared to state and national levels.20 Per American
Academy of Pediatric Dentists, parents and other care providers help every child establish a dental home by 12
months of age.21
Additionally, the CDC noted that pregnant women are more prone to gum disease and cavities which can affect
the baby’s health. Within Orange County, OC-LOHP found that only half the pregnant women (50%) reported
receiving any dental care during pregnancy. Low-income pregnant women in Orange County constitute an
underserved population that faces barriers in utilizing dental services during pregnancy and has limited access to
information about oral health practices and resources.
In addition to low-income status, disparities by race and ethnicity exist among pregnant woman. OC-LOHP
found that Black and Latina women had the lowest utilization rates (39.8% and 42.4% respectively) followed by
Asian women (51.6%). All non-White groups of women utilized dental services at a lower rate during pregnancy
than utilization rates for White women in Orange County and utilization rates for Black and Latina women were
also lower than the Orange County average (50%).
20 Conduent Healthy Communities Institute, 2017 County Health Rankings. As cited in OCHealthierTogether.org, an initiative led by HIP.
Retrieved 8/2019. 21 OC Healthier Together (2018). 2018-2022 OC Oral Health Strategic Plan [Report].
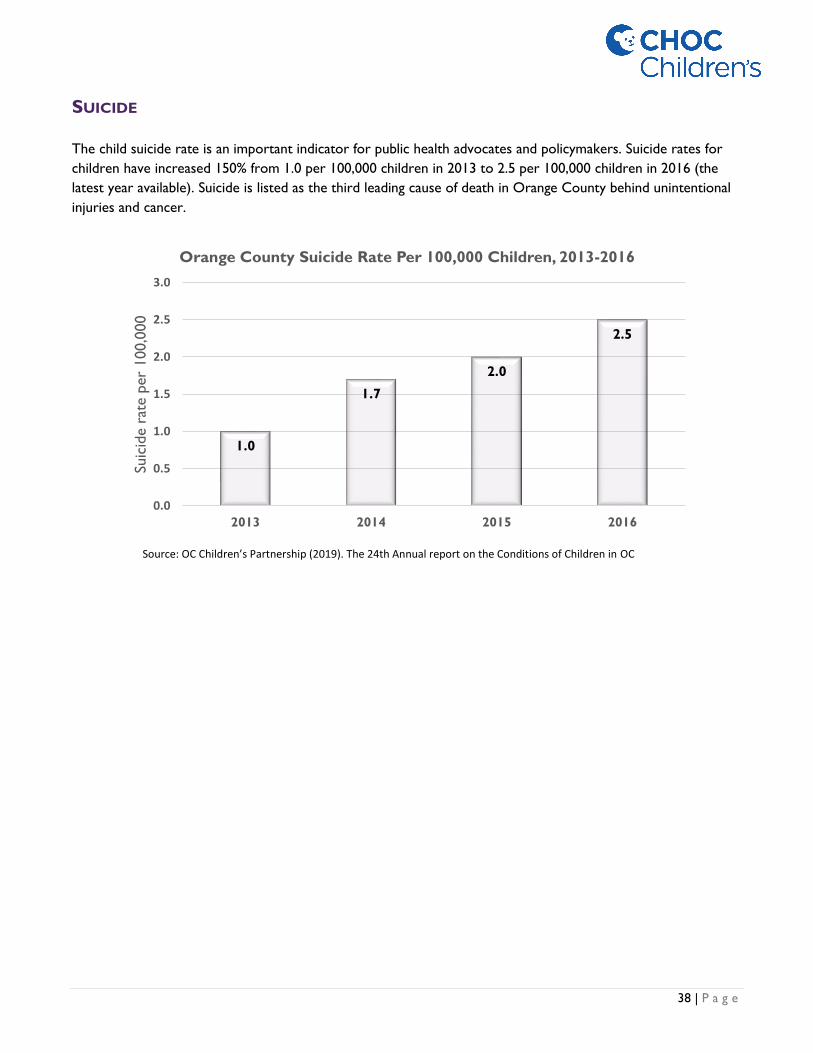
38 | P a g e
SUICIDE
The child suicide rate is an important indicator for public health advocates and policymakers. Suicide rates for
children have increased 150% from 1.0 per 100,000 children in 2013 to 2.5 per 100,000 children in 2016 (the
latest year available). Suicide is listed as the third leading cause of death in Orange County behind unintentional
injuries and cancer.
1.0
1.7
2.0
2.5
0.0
0.5
1.0
1.5
2.0
2.5
3.0
2013 2014 2015 2016
Suic
ide r
ate p
er
100,0
00
Orange County Suicide Rate Per 100,000 Children, 2013-2016
Source: OC Children’s Partnership (2019). The 24th Annual report on the Conditions of Children in OC

39 | P a g e
MENTAL HEALTH AND AUTISM
The presence of behavioral health disorders can impact not only individuals and their families but also systems
within the community, such as schools or the juvenile justice system.22 Behavioral health is an LHI of Healthy
People 2020 with primary objectives focusing on reducing the proportion of adolescents aged 12-17 years old
who experience major depressive episodes (MDEs). The CDC lists the following set of facts on the widespread
abundance of mental health disorders affecting children across the nation:
• 9.4% of children aged 2-17 years have received an ADHD diagnosis;23
• 7.4% of children aged 3-17 years have a diagnosed behavior problem;
• 7.1% of children aged 3-17 years have diagnosed anxiety;
• 3.2% of children aged 3-17 years have diagnosed depression; and
• 1 in 6 U.S. children aged 2–8 years (17.4%) had a diagnosed mental, behavioral, or developmental
disorder.
One measure to determine demand for mental health services is to study the age-adjusted Emergency Room
(ER) rate, of patients under 18, with a primary diagnosis related to mental health. Orange County has 29.8 ER
visits per 10,000 populations under 18 years old.24 As seen in the graph below, the age cohort with the highest
ER utilization was age cohort 15-17 (93.7 per 10,000), followed by age cohort 10-14 (59.7 per 10,000), and age
cohort 5-9 (7.0 per 10,000).
Compared to other California counties, Orange County falls within the top 50% of counties who do well in
addressing ER utilization for mental health. According to the Orange County’s Healthier Together (an initiative
led by the Health Improvement Partnership), treatment for mental disorders is a major cause of hospitalization
for children and adolescents between the ages of 10 and 21 years. As for hospitalization rate due to pediatric
mental health, Orange County’s age-adjusted rate is 18.5 hospitalizations per 10,000 populations under 18-year-
22 Orange County Children’s Partnership (2019). The 24th Annual report on the Conditions of Children in Orange County [Report]. 23 Attention-deficit/hyperactivity disorder (ADHD) is a disorder that makes it difficult for a person to pay attention and control impulsive
behaviors. He or she may also be restless and almost constantly active. 24 Conduent Healthy Communities Institute, 2015-2017 CA Office of Statewide Health Planning and Development. As cited on
OCHealthierTogether.org, an initiative led by HIP. Retrieved 8/2019.
3.5 7
59.7
93.7
29.8
0
20
40
60
80
100
0-4 5-9 10-14 15-17 Overall
Orange County Emergency Department Rate due to Mental Health by Age Cohort
Source: ochealthiertogether.org and the Office of Statewide Health Planning and Development, 2017

40 | P a g e
olds.25 The age group who have significantly higher hospitalization rates due to pediatric mental health is the 15
to 17-year-old with 68.6 hospitalizations/10,000 populations under 18-year-olds.
According to KidsData.org, a Stanford Lucile Packard program, approximately 19% of all Orange County
children, ages three to 22 years old, in special education, have been diagnosed with autism, a dramatic increase
from 2000 when less than 3% were diagnosed with autism. The autism rate in Orange County is the highest in
the state, followed by Los Angeles County (17.0%), Tuolumne County (16.9%), and Butte County (16.8%).
25 Conduent Healthy Communities Institute, 2015-2017 CA Office of Statewide Health Planning and Development. As cited on
OCHealthierTogether.org, an initiative led by HIP. Retrieved 8/2019.
0.0% 2.0% 4.0% 6.0% 8.0% 10.0% 12.0% 14.0% 16.0% 18.0% 20.0%
Orange CountyLos Angeles County
Tuolumne CountyButte County
Santa Clara CountyAlameda County
San Diego CountyHumboldt County
San Francisco CountyCalifornia
Imperial CountyMerced County
Sacramento CountySan Joaquin CountySan Mateo County
Solano CountyContra Costa County
Ventura CountyKern CountyLake County
San Luis Obispo CountyStanislaus CountyRiverside County
Santa Barbara CountyKings County
San Bernardino CountyFresno County
Napa CountyMendocino County
Tulare CountyShasta County
Monterey CountyMadera CountySonoma County
Marin CountySanta Cruz County
Inyo County
Percentage of Special Education Students Diagnosed with Autism by County, 2018
Source: KidsData.org and the California Department of Education, 2018

41 | P a g e
SUBSTANCE ABUSE
Drug addiction, also called substance use disorder, is a disease that affects a person's brain and behavior and
leads to an inability to control the use of a legal or illegal drug or medication. Substances such as alcohol,
marijuana, and nicotine are considered drugs. Sometimes it is difficult to distinguish signs of drug use, which the
Mayo Clinic identified as:
• Problems at school or work;
• Physical health issues, such as lack of energy and motivation, weight loss or gain, or red eyes;
• Neglected appearance;
• Changes in behavior; and
• Indebtedness.
Healthy People 2020 focuses on reducing substance abuse to protect the health, safety, and quality of life for all
people, especially children. The effects of substance abuse affect individuals, families and communities. The
Healthy People 2020 substance abuse LHI objective is to reduce the number of adolescents using alcohol or
illicit drugs in the past 30 days by 10%.
Overall, Orange County youth reported less alcohol and drug use (AOD) when compared to California when
assessing alcohol consumption and drug use in the past 30 days:
According to OC Health Care Agency (OCHCA), although Orange County youth are reporting less alcohol and
drug use compared to statewide averages, Orange County is seeing an increase in drug-related overdose deaths
(of ~80% between 2000-2017) across all age groups.
Opioid
According to OCHCA, drug overdose (poisoning) is now the leading cause of unintentional injury death in the
United States, causing more deaths than motor vehicle crashes. Opioids – both prescription painkillers and
heroin – are responsible for most of those deaths. Nationally, there is sizeable attention to the growing opioid
epidemic. The number of Californians affected by prescription and non-prescription opioid misuse and overdose
is substantial, with rates varying significantly across counties, and even within counties. The OCHCA noted that
coastal cities of Orange County are reporting higher opioid use compared to other cities within the county.
Grade Level
Some
AOD Use
Above/
Below CA
No AOD
Use
Above/
Below CA
Some
AOD Use
No AOD
Use
7th Grade 3.9% ● 96.1% ● 4.1% 95.9%
9th Grade 7.5% ● 92.5% ● 7.5% 92.5%
11th Grade 6.8% ● 93.2% ● 7.5% 92.5%
Non-Traditional 21.1% ● 78.9% ● 25.6% 74.4%
2013-2015 Alcohol/Drug Use on School Property in Past Month,
by Grade Level
Orange County California
Source: WestEd, California Healthy Kids Survey. California Department of Education (Jul. 2017).

42 | P a g e
Alcohol
According to research by the National Institute on Alcohol Abuse and Alcoholism, adolescents who begin
drinking at a young age are more likely to develop alcohol dependence than those who begin drinking at age 21.
Patterns formed during adolescence play a critical role in health throughout adulthood. Alcohol use also impairs
judgment and can lead to other high-risk behaviors such as driving while intoxicated.
As part of the California Healthy Kids Survey, youth were asked if they had ridden in a car driven by someone
who had been drinking alcohol or if they had ever driven a car when they had been drinking alcohol in their
lifetime. Compared to California, Orange County youth were less likely to drink and drive or ride with someone
who had been drinking alcohol. However, of concern is the high percentage of 9th grade (12.2%) and 11th grade
(16.9%) students who reported drinking and driving or riding with someone who had been drinking.
In Orange County, 9th grade (14-15 years old) and 11th grade (16-17 years old) students are less likely to drink
and drive or ride with someone who has been drinking when compared to students in non-traditional programs.
Vaping
Vaping is a more recent phenomenon that is quickly building traction with teens and young adults. Vaping is the
inhaling of aerosol from a vaping device that heats a liquid that can contain various flavored substances including
nicotine, marijuana (THC), and cannabidiol (CBD). These devices are frequently referred to as e-cigarettes, e‐
cigs, vapes, vape pens, electronic vaporizers, pod mods, or pod systems. According to the CDC, more than 3.5
million teens reported using e-cigarettes in 2018. This is a national increase of more than 1.5 million teens from
2017. From 2017 to 2018, use of e-cigarettes across the United States increased from 11.7% to 20.8% among
high school students and from 3.3% to 4.9% among middle school students.
On September 24, 2019, the California Department of Public Health (CDPH) released a health advisory related
to the public health risks posed by vaping any product. The advisory stated that as of June 2019 in California,
CDPH has received reports that two people have died and 90 people with a history of vaping were hospitalized
with severe breathing problems and lung damage. The CDPH’s studies show lung damage from vaping to be
sudden, effecting both young people who have not been vaping for a long time, and healthy people who do not
have a history of lung disease. According to the CDPH, teenagers and young adults make up nearly 50% of all
breathing related hospitalizations from vaping in California.
Number
9th
Grade
11th
Grade
Non-
Traditional
program
9th
Grade
11th
Grade
Non-
Traditional
program
0 times 87.9% 83.0% 62.7% 86.2% 81.9% 67.0%
1 + times 12.2% 16.9% 37.2% 13.8% 18.0% 33.1%
1 time 4.5% 5.3% 7.2% 4.4% 6.5% 6.5%
2 times 3.0% 4.3% 8.3% 3.4% 4.4% 4.8%
3-6 times 2.4% 3.8% 9.9% 3.2% 3.7% 10.6%
7 or more times 2.3% 3.5% 11.8% 2.8% 3.4% 11.2%
Total 100% 100% 100% 100% 100% 100%
2013-2015 Drinking and Driving or Riding with a Driver Who Has Been Drinking, by
Grade Level
Orange County California
Source: WestEd, California Healthy Kids Survey. California Department of Education (Jul. 2017).

43 | P a g e
Aside from the physical health risks associated with vaping and the use of e-cigarettes, the California
Department of Education reports that extended use of these products can also lead to mental and behavioral
health risks including depression, anxiety, and other mood disorders.
The CDPH has the following recommendations for the public:
• Quit vaping altogether, no matter the substance or source. Those that continue to vape are urged to
avoid buying any vaping products on the street and never modify a store-bought vape product;
• Anyone who has in the past few months vaped and is having problems with breathing, or other related
symptoms, should seek medical care immediately; and
• Do not replace vaping with smoking combustible cigarettes but rather ask your doctor for FDA-
approved quitting treatments.
In 2018, there were 86 vaping retail outlets in Orange County, down 75% from the number reported in
2014/2015. The decrease in the number of stores is related to a 2017 enacted California law that increased the
minimum age of purchase to 21 years of age, as well as requiring such stores to apply and retain a California
retailer tobacco license.
According to a California Healthy Kids survey, 27.5% of high school students, and 13.4% of middle-school
students, reported having tried vaping. These statistics are higher than the national average reported by the
CDC.
ASTHMA
Asthma is a long-term condition in which a person’s air passage becomes inflamed. It is a serious public health
problem, especially in Orange County, as it can cause missed school days, daily activity limitations, ER visits, and
even hospitalization. Additionally, studies have shown that asthma disproportionately affects low-income and
minority children.
14.1% of Orange County’s pediatric population have been diagnosed with asthma, which is a growing trend.26
26 Conduent Healthy Communities Institute, 2014-2015 California Health Interview Survey. As cited on OCHealthierTogether.org, an
initiative led by HIP. Retrieved 8/2019.

44 | P a g e
According to OSHPD, bronchitis and asthma related diagnoses consistently rank as the number one reason
patients 0-17 are admitted through the emergency department in Orange County. The admits per 1,000 patients
remained steady between 2012 and 2014 before spiking to 1.23 admits per 1,000 in 2016 and 1.17 admits per
1,000 in 2017.
OBESITY AND DIABETES
According to Orange County’s Healthier Together, obesity and diabetes are major contributors to the leading
causes of death including heart disease, stroke, and certain cancers. Diabetes is itself a major cause of death and
the rate of those living with diabetes has been increasing in the last 30 years. The increasing trend of obesity and
diabetes is heavily influenced by a person’s community and health habits.
The CDC defines childhood obesity as a child who is well above the normal or healthy weight for his/her age
and height. The CDC noted that more than one-third (35%) of U.S. Children ages 2-19 are overweight or obese.
Childhood obesity can cause chronic diseases, such as Type 2 diabetes which is a condition of having high blood
sugar levels. Although Type 2 diabetes most often develops in people over the age of 45, more children, teens,
and young adults are developing it.
755 752 736801
892847
1.04 1.03 1.01
1.11
1.23
1.17
0.7
0.8
0.9
1.0
1.1
1.2
1.3
1.4
1.5
0
100
200
300
400
500
600
700
800
900
1000
2012 2013 2014 2015 2016 2017
EMER
GEN
CY
DEP
AR
TMEN
T A
DM
ITS
Orange County (Age Cohort 0-17) Bronchitis & Asthma Emergency Department Admits by Year, 2012-2017
Bronchitis & Asthma Admits Bronchitis & Asthma Admits Per 1,000
Source: OSHPD Discharge Database, 2012-2017

45 | P a g e
To tackle this national issue,
Healthy People 2020 LHI is focused
on reducing the proportion of
children and adolescents aged 2-19
years old who are considered
obese.
The obesity population among
youth in Orange County is less than
that of California and is on target
for Healthy People 2020 LHI. The
table to the right shows Orange
County 5th grade students who are
obese, by school district.
Although the overall percentage of
Orange County 5th graders (18.4%)
who are obese is lower than the
California average (21.3%), many
school districts meet neither the
state average or national objective
(14.5%).
Of the 26 public school districts
serving 5th graders in Orange
County, only eight meet the
national objective; Laguna Beach
Unified School District (3.5%)
recorded the lowest percentage
followed by Irvine Unified School
District (7.1%), Huntington Beach
Unified School District (8.9%),
Capistrano Unified School District (9.8%), and Fountain Valley Elementary School District (9.9%).
However, 16 of 26 Orange County school districts fall short of the national objective, nine of which do not
meet the California average either. The school districts with the highest percentage of obese 5th graders in
Orange County include; La Habra City Elementary School District (33.3%), Buena Park Elementary School
District (29.6%), Anaheim City Elementary School District (29.5%), Santa Ana Unified School District (28.1%),
and Magnolia Elementary School District (26.1%).
Location
OC
Ave
rage
Cal
ifo
rnia
Nat
ion
al
Ob
ject
ive
La Habra City Elementary 33.0% ● ● ●
Buena Park Elementary 29.6% ● ● ●
Anaheim City Elementary 29.5% ● ● ●
Santa Ana Unified 28.1% ● ● ●
Magnolia Elementary 26.1% ● ● ●
Savanna Elementary 25.9% ● ● ●
Orange Unified 23.5% ● ● ●
Garden Grove Unified 21.9% ● ● ●
Westminster Elementary 21.9% ● ● ●
Centralia Elementary 20.6% ● ● ●
Fullerton Elementary 18.4% ● ● ●
Brea-Olinda Unified 18.2% ● ● ●
Newport-Mesa Unified 16.6% ● ● ●
Ocean View Elementary 16.4% ● ● ●
Tustin Unified 16.3% ● ● ●
Placentia-Yorba Linda Unified 15.4% ● ● ●
Saddleback Valley Unified 13.1% ● ● ●
Cypress Elementary 12.4% ● ● ●
Los Alamitos Unified 10.4% ● ● ●
Fountain Valley Elementary 9.9% ● ● ●
Capistrano Unified 9.8% ● ● ●
Huntington Beach City Elementary 8.9% ● ● ●
Irvine Unified 7.1% ● ● ●
Laguna Beach Unified 3.5% ● ● ●
Orange County 18.4% - ● ●
California 21.3% ● - ●
Note: Healthy People 2020 Objective for Obesity in Children and Adolescents = 14.5%
Source: California Department of Education
Above/Below:
Percentage
Obese
5th Grade Students who are Obese by School District, 2017/2018

46 | P a g e
Much of the disparity in 5th grade obesity rates can be traced to ethnicity and race. The table below shows 5th
grade obesity rates by ethnicity/race in Orange County.
According to the California Department of Education, over 38% of Orange County’s Native Hawaiian or Pacific
Islander 5th graders are obese. This is nearly three times the national objective and twice the average of Orange
County overall. Also concerning is the high Latino obesity rate among 5th graders (26.8%). nearly twice that of
the national objective. The Asian (8%) and White (9.9%) 5th grade obesity rates were considerably lower than
the Orange County average (18.4%), California average (21.3%), and national objective (14.5%).
Obesity statistics by ethnicity and race are an important measure as cultural perspectives on obesity can pose
challenges for understanding the extent of the problem leading to a lack of precautionary measures. Proper
physical activity and nutrition are necessary actions for preventing obesity and diabetes.
18.1%
8.0%
26.8%
38.5%
12.1%9.9%
18.4%
21.3%
14.5%
0%
5%
10%
15%
20%
25%
30%
35%
40%
45%
African American Asian Latino Native Hawaiianor Pacific Islander
Two or MoreRaces
White
5th Grade Students who are Obese by Ethnicity/Race, 2017/2018
Orange County California National Objective
Source: California Department of Education, 2017/2018
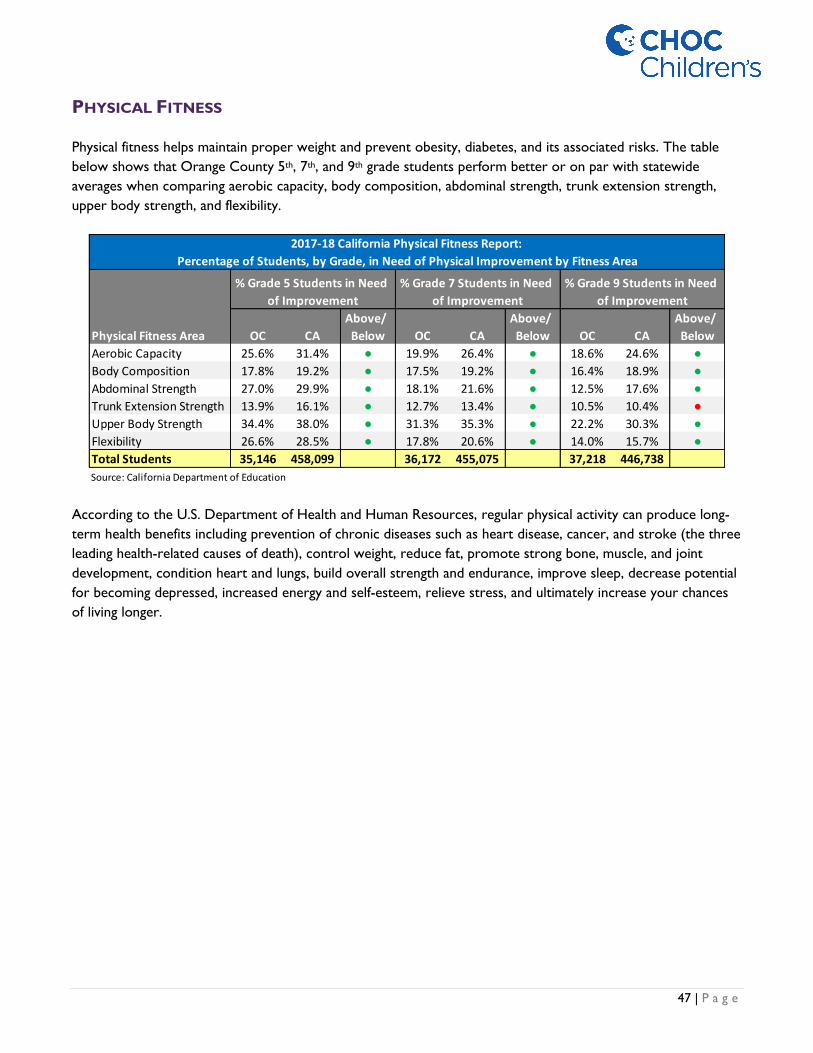
47 | P a g e
PHYSICAL FITNESS
Physical fitness helps maintain proper weight and prevent obesity, diabetes, and its associated risks. The table
below shows that Orange County 5th, 7th, and 9th grade students perform better or on par with statewide
averages when comparing aerobic capacity, body composition, abdominal strength, trunk extension strength,
upper body strength, and flexibility.
According to the U.S. Department of Health and Human Resources, regular physical activity can produce long-
term health benefits including prevention of chronic diseases such as heart disease, cancer, and stroke (the three
leading health-related causes of death), control weight, reduce fat, promote strong bone, muscle, and joint
development, condition heart and lungs, build overall strength and endurance, improve sleep, decrease potential
for becoming depressed, increased energy and self-esteem, relieve stress, and ultimately increase your chances
of living longer.
Physical Fitness Area OC CA
Above/
Below OC CA
Above/
Below OC CA
Above/
Below
Aerobic Capacity 25.6% 31.4% ● 19.9% 26.4% ● 18.6% 24.6% ●
Body Composition 17.8% 19.2% ● 17.5% 19.2% ● 16.4% 18.9% ●
Abdominal Strength 27.0% 29.9% ● 18.1% 21.6% ● 12.5% 17.6% ●
Trunk Extension Strength 13.9% 16.1% ● 12.7% 13.4% ● 10.5% 10.4% ●
Upper Body Strength 34.4% 38.0% ● 31.3% 35.3% ● 22.2% 30.3% ●
Flexibility 26.6% 28.5% ● 17.8% 20.6% ● 14.0% 15.7% ●
Total Students 35,146 458,099 36,172 455,075 37,218 446,738
Source: California Department of Education
2017-18 California Physical Fitness Report:
Percentage of Students, by Grade, in Need of Physical Improvement by Fitness Area
% Grade 5 Students in Need
of Improvement
% Grade 7 Students in Need
of Improvement
% Grade 9 Students in Need
of Improvement

48 | P a g e
NUTRITION
In addition to physical fitness, children need good nutrition to foster healthy growth and development and to
maintain proper weight. A proper diet is important to prevent risks of chronic diseases. One of 26 Healthy
People 2020 LHI is to increase the contribution of total vegetables to the diets of the population aged 2 years
and older.
Of Orange County’s children and teens aged 2-17 years old, 75.1% eat at least two servings of fruits per day—
which is high compared to other California counties.27
27 Conduent Healthy Communities Institute, 2015-2016 CA Health Interview Survey. As cited on OCHealthierTogether.org, an initiative
led by HIP. Retrieved 8/2019.
58.9% 60.8%63.5%
75.1%67.9%
0%
10%
20%
30%
40%
50%
60%
70%
80%
2012-2013 2013-2014 2014-2015 2015-2016
Child and Teen Fruit Consumption
Orange County California
Source: ochealthiertogether.org, 2012-2016

49 | P a g e
BREASTFEEDING
Breastfeeding is an important health indicator, especially for the CHOC Children’s population, because
breastfeeding provides many benefits for healthy infant growth and development. Breastfeeding provides benefits
to the mother as it can mitigate maternal risks of postpartum bleeding, post-menopausal osteoporosis, and
cancer of the breast and ovaries.28 Additionally, breastfeeding helps the entire family with food security and
income because the family income does not have to be spent on buying formula.
In Orange County, the percentage of newborns who were exclusively fed breast milk during their hospitalization
is 65.8%, less than that of California. The percentage of newborns who were breastfed exclusively and those
who received both breast milk and formula was 94.8% in Orange County.
28 Orange County Children’s Partnership (2019). The 24th Annual report on the Conditions of Children in Orange County [Report].
Orange
CountyCalifornia
Exclusive Breastfeeding 65.80% 69.80%
Any Breastfeeding 94.80% 94.00%
In-Hospital Breastfeeding of Newborns
Source: Kidsdata.org, (2019)

50 | P a g e
To fully understand the strengths or positive attributes of Orange County, the following section analyzes
Orange County’s community resources which can be utilized to improve the quality of community life. Also, see
Appendix E for a list of community assets identified by community members.
ACCESS TO PRIMARY CARE
A lack of access to primary care presents barriers to preventative care and good health. The supply and
accessibility of primary care physicians, the type and lack of insurance coverage, poverty level, transportation
obstacles, and cultural and language competency affect access. Individuals in communities affected by barriers to
primary care have shown increased rates of morbidity, mortality, and emergency department hospitalizations.
These can all be reduced if residents have access to primary care services, including health screenings, routine
tests, and vaccinations.
If an average pediatrician performs 5,000 primary care encounters per year, we can estimate the number of full-
time-equivalent (FTE) physicians practicing in the market.
In 2018, primary care physicians with an office location based inside of Orange County rendered over 2.2 million
patient visits. At the same time, Orange County residents aged 0-18 consumed approximately 1.8 million patient
visits in Orange County. This means that Orange County is net-provider of pediatric primary care visits to the
point that over 360,000 pediatric visits were rendered to patients living outside of Orange County by physicians
practicing inside Orange County. Assuming the average pediatrician performs 5,000 primary care encounters per
year, we can estimate the number of full-time-equivalent (FTE) physicians practicing in the market. Using this
methodology, Orange County is a net supplier of pediatric primary care services with the equivalent of 442
providers operating in the county and local patient demand for only 369 providers. In other words, there is an
excess of 73 primary care providers in Orange County that are serving patients originating from Los Angeles,
San Bernardino, and Riverside - counties that have known primary care physician shortages.
Metric Encounters
Estimated FTE @
5,000 Enc/FTE
Visits Rendered by Primary Care Physicians in OC 2,210,990 442
Visits Consumed by OC Residents 1,843,550 369
Difference 367,440 73
Source: BluePrint Claims Data, CY 2018
Orange County Primary Care Visits, 0-18: CY 2018
COMMUNITY ASSETS

51 | P a g e
FACILITIES
Pediatric Acute Capacity Analysis CHOC at Orange (158 licensed beds) and CHOC at Mission (24 licensed beds) have a combined 182 licensed
inpatient pediatric beds. CHOC at Orange reported 10,509 inpatient discharges, 36,650 patient days resulting in
an occupancy rate of 63.6% and an average daily census of 100.4 patients. CHOC at Mission reported 1,557
inpatient discharges, 3,167 patient days resulting in an occupancy rate of 36.2% and an average daily census of 8.7
patients. Service area hospitals run at a combined 60.2% occupancy rate based upon 207 licensed inpatient
pediatric beds. Therefore, on average, there are approximately 80 licensed pediatric beds available in the service
area.
Also assessed was bed utilization at hospitals located outside of the service area but within 25-mile radius of
CHOC at Orange. In total, there are an additional 250 licensed inpatient pediatric beds, within 25-mile radius of
CHOC at Orange, across seven hospital providers resulting in an occupancy rate of 35.1%.
On average, there is an excess of 244 licensed inpatient pediatric beds when aggregating all hospitals within the
service area and within a 25-mile radius of CHOC at Orange. This indicates that the service area, and
surrounding area, have a sufficient number of inpatient pediatric beds serving the community.
Hospital
Driving Distance
from CHOC at
Orange (miles)
Driving Distance
from CHOC at
Mission (miles)
Within
Service Area
Licensed
Beds Discharges
Patient
Days ADC
Occupancy
Rate
Available
Beds
CHOC at Orange - 21.3 X 158 10,509 36,650 100.4 63.6% 58
CHOC at Mission 21.3 - X 24 1,557 3,167 8.7 36.2% 15
Kaiser Foundation Hospital - Anaheim 7.7 26.2 X 12 921 2,511 6.9 57.3% 5
Fountain Valley Regional Hospital 8.7 21.8 X 13 1,211 3,185 8.7 67.1% 4
Service Area Sub-Total 207 14,198 45,513 124.7 60.2% 82
St. Mary Medical Center - Long Beach 19.6 37.1 16 328 861 2.4 14.7% 14
Kaiser Foundation Hospital - Downey 20.6 40.6 17 549 2,091 5.7 33.7% 11
Miller Children's Hospital 21.3 39.2 138 7,573 21,469 58.8 42.6% 79
Beverly Hospital 24.9 45.4 15 486 1,171 3.2 21.4% 12
Corona Regional Medical Center 25.1 35.5 5 150 298 0.8 16.3% 4
Pomona Valley Hospital Medical Center 26.2 46.3 34 970 2,273 6.2 18.3% 28
LAC/Harbor-UCLA Medical Center 29.7 47.2 25 1,550 3,908 10.7 42.8% 14
25-Mile Radius Sub-Total 250 11,606 32,071 87.9 35.1% 162
Total 457 25,804 77,584 212.6 46.5% 244
Source: OSHPD Disclosure Reports, FY 2018
LICENSED INPATIENT PEDIATRIC BEDS WITHIN 25-MILE RADIUS OF CHOC AT ORANGE, 2018

52 | P a g e
Neonatal Intensive Care (NICU) Capacity Analysis CHOC at Orange (104 licensed beds) and CHOC at Mission (22 licensed beds) have a combined 126 licensed
inpatient NICU beds. CHOC at Orange reported 786 inpatient discharges, 17,719 patient days resulting in an
occupancy rate of 46.7% and an average daily census of 48.5 patients. CHOC at Mission reported 204 inpatient
discharges, 2,983 patient days resulting in an occupancy rate of 37.1% and an average daily census of 8.2 patients.
Service area hospitals run at a combined 47.3% occupancy rate based upon 4,227 licensed inpatient NICU beds.
Therefore, on average, there are approximately 179 licensed NICU beds available in the service area.
Also assessed was bed utilization at hospitals located outside of the service area but within 25-mile radius of
CHOC at Orange. In total, there are an additional 300 licensed inpatient NICU beds, within 25-mile radius of
CHOC at Orange, across eight hospital providers resulting in an occupancy rate of 50.1%.
On average, there is an excess of 328 licensed inpatient NICU beds when aggregating all hospitals within the
service area and within a 25-mile radius of CHOC at Orange. This indicates that the service area, and
surrounding area, have a sufficient number of inpatient NICU beds serving the community.
Hospital
Driving
Distance from
CHOC at
Orange (miles)
Driving
Distance from
CHOC at
Mission (miles)
Within
Service Area
Licensed
Beds Discharges
Patient
Days ADC
Occupancy
Rate
Available
Beds
CHOC at Orange - 21.3 X 10⁴ 786 17,719 48.5 46.7% 55
CHOC at Mission 21.3 - X 22 204 2,983 8.2 37.1% 14
UC Irvine Medical Center 2.1 22.6 X 45 461 10,416 28.5 63.4% 16
Garden Grove Hospital and Medical Center 3.1 23.4 X 12 99 855 2.3 19.5% 10
Orange County Global Medical Center 3.5 18.3 X 24 121 1,000 2.7 11.4% 21
AHMC Anaheim Regional Medical Center 7.7 27.7 X 11 580 2,422 6.6 60.3% 4
Kaiser Foundation Hospital - Anaheim 8.5 26.2 X 26 481 8,438 23.1 88.9% 3
Fountain Valley Regional Hospital 8.7 21.0 X 23 364 2,962 8.1 35.3% 15
MemorialCare Orange Coast Medical Center 10.4 21.8 X 12 135 894 2.4 20.4% 10
St. Jude Medical Center 11.7 30.9 X 14 208 2,073 5.7 40.6% 8
Kaiser Foundation Hospital - Irvine 12.6 11.3 X 6 185 2,355 6.5 107.5% 0
Hoag Memorial Hospital Presbyterian 13.9 19.4 X 21 431 4,520 12.4 59.0% 9
MemorialCare Saddleback Medical Center 16.4 6.7 X 19 172 1,907 5.2 27.5% 14
Service Area Sub-Total 339 4,227 58,544 160.4 47.3% 179
PIH Health Hospital - Whittier 19.4 39.4 34 383 4,376 12.0 35.3% 22
St. Mary Medical Center - Long Beach 19.6 37.1 25 177 2,916 8.0 32.0% 17
Kaiser Foundation Hospital - Downey 20.6 40.6 49 528 11,189 30.7 62.6% 18
Miller Children's Hospital 21.3 38.8 95 1,125 20,826 57.1 60.1% 38
PIH Health Hospital - Downey 22.3 42.0 7 85 345 0.9 13.5% 6
Beverly Hospital 24.9 45.4 10 40 196 0.5 5.4% 9
Pomona Valley Hospital Medical Center 26.2 46.3 53 710 12,191 33.4 63.0% 20
LAC/Harbor-UCLA Medical Center 29.7 47.2 27 37 2,776 7.6 28.2% 19
25-Mile Radius Sub-Total 300 3,085 54,815 150.2 50.1% 150
Total 639 7,312 113,359 310.6 48.6% 328
Source: OSHPD Disclosure Reports, FY 2018
LICENSED INPATIENT NEONATAL BEDS WITHIN 25-MILE RADIUS OF CHOC AT ORANGE

53 | P a g e
Pediatric Intensive Care (PICU) Capacity Analysis
CHOC at Orange (54 licensed beds) and CHOC at Mission (8 licensed beds) have a combined 62 licensed
inpatient PICU beds. CHOC at Orange reported 970 inpatient discharges, 10,601 patient days resulting in an
occupancy rate of 53.8% and an average daily census of 29.0 patients. CHOC at Mission reported 272 inpatient
discharges, 948 patient days resulting in an occupancy rate of 32.5% and an average daily census of 2.6 patients.
Service area hospitals run at a combined 50.6% occupancy rate based upon 73 licensed inpatient PICU beds.
Therefore, on average, there are approximately 36 licensed PICU beds available in the service area.
Also assessed was bed utilization at hospitals located outside of the service area but within 25-mile radius of
CHOC at Orange. In total, there are an additional 46 licensed PICU beds, within 25-mile radius of CHOC at
Orange, across three hospital providers resulting in an occupancy rate of 39.1%.
On average, there is an excess of 64 licensed inpatient neonatal beds when aggregating all hospitals within the
service area and within a 25-mile radius of CHOC at Orange. This indicates that the service area, and
surrounding area, have a sufficient number of PICU beds serving the community.
Hospital
Driving
Distance from
CHOC at
Orange (miles)
Driving
Distance from
CHOC at
Mission (miles)
Within
Service
Area
Licensed
Beds Discharges
Patient
Days ADC
Occupancy
Rate
Available
Beds
CHOC at Orange - 21.3 X 54 970 10,601 29.0 53.8% 25
CHOC at Mission 21.3 - X 8 272 948 2.6 32.5% 5
Fountain Valley Regional Hospital 8.7 21.0 X 11 257 1,946 5.3 48.5% 6
Service Area Sub-Total 73 1,499 13,495 37.0 50.6% 36
Miller Children's Hospital 21.3 38.8 30 464 4,666 12.8 42.6% 17
Kaiser Foundation Hospital - Downey 22.3 42 8 135 811 2.2 27.8% 6
LAC/Harbor-UCLA Medical Center 29.7 47.2 8 145 1,095 3.0 37.5% 5
25-Mile Radius Sub-Total 46 744 6,572 18.0 39.1% 28
Total 119 2,243 20,067 55.0 46.2% 64
Source: OSHPD Disclosure Reports, FY 2018
LICENSED INPATIENT PICU BEDS WITHIN 25-MILE RADIUS OF CHOC AT ORANGE

54 | P a g e
Adolescent & Child Psychiatric Capacity Analysis
CHOC opened its inpatient Mental Health unit in mid-2018 resulting in data that reflects a partial year. CHOC
at Orange operates 18 inpatient psychiatric beds reporting 72 inpatient discharges, 607 patient days resulting in
an occupancy rate of 9.2% and an average daily census of 1.7 patients. Service area hospitals run at a combined
54.8% occupancy rate based upon 450 licensed inpatient psychiatric beds. Therefore, on average, there are
approximately 23 licensed psychiatric beds available in the service area.
Also assessed was bed utilization at hospitals located outside of the service area but within 25-mile radius of
CHOC at Orange. In total, there are an additional 115 licensed psychiatric beds, within 25-mile radius of CHOC
at Orange, across four hospital providers resulting in an occupancy rate of 70.2%.
On average, there is an excess of 57 licensed inpatient Adolescent & Child Psychiatric beds when aggregating all
hospitals within the service area and within a 25-mile radius of CHOC at Orange. This indicates that the service
area, and surrounding area, have a sufficient number of inpatient psychiatric beds serving the community.
Hospital
Driving Distance
from CHOC at
Orange (miles)
Within
Service
Area
Licensed
Beds Discharges
Patient
Days ADC
Occupancy
Rate
Available
Beds
CHOC at Orange* - X 18 72 607 1.7 9.2% 16
UC Irvine Medical Center 2.1 X 15 411 3,646 10.0 66.6% 5
College Hospital Costa Mesa 11.6 X 17 971 5,739 15.7 92.5% 1
Service Area Sub-Total 50 1,454 9,992 27.4 54.8% 23
College Hospital 17.3 41 1,098 8,612 23.6 57.5% 17
Canyon Ridge Hospital 26.7 35 3,797 8,311 22.8 65.1% 12
LAC + USC Medical Center 29.7 10 204 2,817 7.7 77.2% 2
Aurora Charter Oak - Los Angeles 28.0 29 1,560 9,742 26.7 92.0% 2
25-Mile Radius Sub-Total 115 6,659 29,482 80.8 70.2% 34
Total 165 8,113 39,474 108.1 65.5% 57
Del Amo Hospital 31.2 45 3,098 15,406 42.2 93.8% 3
Kedren Community Health Center 32.1 17 695 5,588 15.3 90.1% 2
Gateways Hospital 33.2 27 548 3,296 9.0 33.4% 18
Star View Adolescent Center 34.9 16 68 5,467 15.0 93.6% 1
BHC Alhambra Hospital 35.1 32 1,888 11,942 32.7 102.2% -1
Loma Linda University Behavioral Medicine Center 53.2 41 1,935 11,503 31.5 76.9% 9
Resnick Neuropsychiatric Hospital at UCLA 44.0 25 506 7966 21.8 87.3% 3
Riverside University Health System 52.2 12 744 2,284 6.3 52.1% 6
Other Regional Adolescent and Child Providers 215 9,482 63,452 173.8 80.9% 41
Source: OSHPD Disclosure Reports, FY 2018
*Partial year
LICENSED INPATIENT ADOLESCENT & CHILD PSYCHIATRIC BEDS WITHIN 25-MILE RADIUS OF CHOC AT ORANGE

55 | P a g e
SURVEY PROCESS & RESULTS
Orange County community members were sent an online link to a survey via the survey conveyer Survey
Monkey. It was made available in September and October 2019, which allowed CHOC Children’s to receive 207
responses. The survey was not intended to be a scientific or statistically valid sampling of the population. Instead,
the survey was designed to collect both qualitative and quantitative data from residents—including those in
medically underserved, low-income, and minority populations—in order to identify perceived community health
needs affecting children within Orange County. In order to qualify to participate in the survey, respondents had
to meet two criteria: 1) that they lived within the boundaries of Orange County, and 2) that they be a parent or
guardian of a child under the age of 18.
DEMOGRAPHICS OF SURVEY RESPONDENTS
Most survey respondents reside in the cities of Anaheim (13%), Huntington Beach (7%), Santa Ana (7%), Irvine
(6%), Westminster 5%, with the remaining 60% of respondents coming from other cities across Orange County.
When respondents were asked how long they had lived in Orange County, 62% responded 11+ years, 13%
responded 6-10 years, 13% responded with 3-5 years, 9% responded with 1-2 years, with the remaining 3%
reporting living in Orange County for less than 1 year.
Based on the survey results for the age of the survey respondents, 8% of the survey respondents are 18-25
years of age, 28% are 26-34 years of age, 30% are 35-44 years of age, and 22% are 45-54 years of age. Based on
the survey results for race/ethnicity, approximately 54% of survey respondents identified as Caucasian/White,
24% identified as Hispanic/Latino, 19% identified as Asian, 5% identified as African American/Black, 1% identified
as American Indian/Alaska Native, 1% identified as Native Hawaiian/Pacific Islander, and 1% of survey
respondents identified as Middle Eastern. Of the survey respondents, 75% identified as female and 25% identified
as male.
When asked the composition of households based on number of family members, nearly 79% of respondents
reported having a household size of 3-5 people, 12% reported a household size of 1-2 people, 8% reported a
household size of 6-8 people, and 2% reported more than 9 people living in a single household. Survey
respondents were also asked the number of household members by each age cohort. Within the age cohort 0-
18, 49% of respondents reported one child, 33% reported having 2 children, and 18% reported having three
children.
In total, nearly 70% of the survey respondents reported being married, 19% as never married/single, 8% as
divorced, 2% as widowed, and 1% as separated. Pertaining to household income, 22% of the survey respondents
reported earning $100,000-150,000 per year, 21% reported earning $50,000-74,999 per year, 18% reported
earning $150,000 or more per year, 15% reported earning $75,000-99,000 per year, 13% reported earning
$30,000-49,000 per year, and 10% reported earning less than $29,000 per year.
COMMUNITY INPUT

56 | P a g e
Many respondents reported their own health as being “good” (54%) or “very good” (24%). Nearly 18% reported
their health as “fair” with the remaining 4% reporting their heath as “poor” (3%) or “very poor” (1%).
ACCESS TO HEALTHCARE
Approximately 56% of survey respondents have employer sponsored health insurance, 30% have Medi-Cal, 13%
are Medicare beneficiaries, and 10% reported having private health coverage. The remaining survey respondents
(7%) selected either “I have no insurance” (5%) or “my child(ren) have no health insurance” (1%). Most survey
respondents (80%) reported their child/children receiving routine healthcare services at a doctor’s office during
the past 12 months. Almost 14% reported their child/children receiving routine medical care in urgent care
clinics (5%), 4% in an emergency room, 2% in a school-based health center, and nearly 2% in a retail clinic.
Nearly 7% of the survey respondents reported their child/children not needing routine medical care in the last
12 months.
CRITICAL HEALTH CONCERNS
Survey respondents were also asked to report on the critical needs or concerns affecting children’s health in
Orange County on a scale of “not at all critical” to “very critical”.
Access to Healthcare (55%)
When asked about the need for “access to healthcare” for children living in your community, 55% of
respondents replied with “very critical” (35%) or “somewhat critical” (20%). However, nearly 25% reported that
access to healthcare was “not at all critical” (9%) or “not really critical” (15%). Approximately 21% reported
“neutral” on the importance of access to healthcare in their community.
Access to Pediatric Specialists (55%)
When asked about the need for “access to pediatric specialists” for children living in your community, 55% of
respondents replied with “very critical” (27%) or “somewhat critical” (27%). In addition, 22% of respondents
believe access to pediatric subspecialists either to be “not at all critical” (7%) or “not really critical” (15%).
Autism Spectrum Disorder (49%)
When asked about the need for access to “autism spectrum disorder” services for children living in your
community, 49% of respondents replied with “very critical” (18%) or “somewhat critical” (31%). Only 4% of
respondents believe the community in which they reside does not have a critical need at all for autism spectrum
disorder services.
Community-Based Education or Community Learning (49%)
When asked about the need for “Community-based Education or community learning” to assist children living in
your community, 49% of respondents replied with “very critical” (21%) or “somewhat critical” (28%). Over 30%
responded with “neutral” and the remaining 20% responded with “not really critical” (14%) or “not critical at
all” (6%).
Cost burden of Raising a Child (75%)
When asked about the cost burden of raising a child in Orange County, over 75% of respondents replied with
“very critical” (43%) or “somewhat critical” (32%). Over 18% responded with “neutral”. Only 5% believe the
57 | P a g e
cost burden of raising a child in the community in which they reside to be “not really critical” (3%) or “not
critical at all” (2%).
Crime and Community Violence (60%)
When asked about how concerned respondents were about “crime and community violence” affecting children
living in your community, 60% of respondents replied with “very critical” (31%) or “somewhat critical” (29%).
Only 16% of respondents believe crime and community violence to be “not at all critical” (4%) or “not really
critical” (12%).
Environmental Quality (60%)
When asked about the importance for improved “environmental quality (i.e. air pollution, mold, lead, water)”
your community, 60% of respondents replied with “very critical” (28%) or “somewhat critical” (32%). Nearly
14% believed the environmental quality to be “not at all critical” (3%), or “not really critical” in the community
in which they reside.
Cost Burden of Housing (70%)
When asked about the cost burden of housing and the importance of adequate housing for children living in
your community, over 70% of respondents replied with “very critical” (39%) or “somewhat critical” (31%). Over
22% responded with “neutral”. Only 1% or respondents believe that adequate housing to be “not at all critical”
to children living in the community.
Hunger or Access to Healthy Foods (60%)
When asked about the issues surrounding “hunger or access to healthy foods”, nearly 60% of respondents
replied with “very critical” (31%) or “somewhat critical” (28%). Just 21% were “neutral” with their response
with the remaining 20% as either “not at all critical” (6%) or “somewhat critical” (14%).
Language Barriers (45%)
When asked about the obstacles surrounding “language barriers” when accessing healthcare services for
children in Orange County, 45% of respondents replied with “very critical” (14%) or “somewhat critical” (30%).
Only 4% of survey respondents believe language not to be a barrier for accessing healthcare services with 37%
of respondents being indifferent or “neutral” on the subject.
Legal Barriers (60%)
When asked about the obstacles surrounding “legal” barriers when accessing healthcare services for children in
Orange County, 60% of respondents replied with “neutral” (37%), “somewhat critical” (17%), or “not critical at
all” (5%). However, 14% responded that legal barriers were “very critical” when it came to affecting children’s
health in Orange County.
Pediatric Dental Services (43%)
When asked about the need for “pediatric dental services” for children living in your community, 43% of
respondents replied with “very critical” (21%) or “somewhat critical” (22%). However, 21% reported that
pediatric dental care services were “not at all critical” (7%) or “not really critical” (14%). The largest cohort,
“neutral” (35%), were indifferent on the need for improved pediatric dental services in the community.
Pediatric Obesity (58%)
When asked about the critical needs or concerns related to “pediatric obesity” affecting children in Orange
58 | P a g e
County, over 58% of respondents replied with “very critical” (25%) or “somewhat critical” (33%).
Approximately 29% responded with “neutral”. Only 4% believe that childhood obesity to be “not at all critical”.
School Programs (56%)
When asked about the importance of “school programs” and the importance of such programs when it comes
to how they affect children’s health, nearly 56% of respondents replied with “very critical” (26%) or “somewhat
critical” (30%). Just 27% were “neutral” with their response with the remaining 15% as either “not at all critical”
(5%) or “somewhat critical” (12%).
Social Media or Screen Time (65%)
When asked about the health issues surrounding children’s use of “social media or screen time”, nearly 65% of
respondents replied with “very critical” (32%) or “somewhat critical” (33%). The remaining 25% responded with
“not at all critical” (4%) or “somewhat critical” (8%), or “neutral” (22%).
Special Education Needs (53%)
When asked about the importance of “special education needs” for children in Orange County, 53% of
respondents replied with “neutral (39%), “somewhat critical” (25%), or “not critical at all” (5%). However, 14%
responded that legal barriers were “very critical” when it came to affecting children’s health in Orange County.
QUALITY OF CARE
Approximately 18% of respondents rated the overall health of Orange County community, in which they reside,
as “very good”, 45% as “good”, 33% as “fair” and 4% as poor. Nearly 95% of survey respondents reported their
own children’s health as “very good” (47%) or “good”. Less than 5% reported their children’s health as fair with
only one respondent reporting their child/children being in “poor” health.
HEALTH BEHAVIORS
The survey respondents were also asked to list the three most common and serious “risky behaviors” affecting
children living in their community. In total, 621 votes were cast (3 per respondent). The survey included health
and safety concerns often associated with a thriving and healthy community. Overwhelmingly, drug abuse (20%
of the vote) was listed as the most serious “risky behavior” followed by alcohol abuse (16% of the vote), and
lack of exercise/physical activity (12% of the vote). The remaining 50% of the vote included poor eating habits
(10%), being overweight (9%), unsafe sex (6%), and lack of immunizations (5%).
In addition, survey respondents were asked what other health issues affected children living in their
communities. Seven respondents replied in total. Of the seven, two believe vaping to be of concern, and one on
the risks associated with texting and driving.
HEALTH PROBLEMS
The survey respondents were asked what they believed to be the three most important health problems that
affect children within their communities (i.e., the three problems that have the greatest impact on overall health
of children in Orange County). In total, 621 votes were cast (3 per respondent). Over 19% of the votes cast

59 | P a g e
referenced “bullying and other stressors at school” as the most important health problem affecting children in
Orange County. “Mental or behavioral health” ranked as the second most important health concern, with 12%
of the vote, and “obesity” ranked third, with 9% of the vote. Other health concerns referenced by survey
respondents include “child abuse” (8% of the vote), “environmental quality” (6% of the vote), “domestic
violence” (5% of the vote), lack of “physical activity” (5% of the vote), “suicide” (5% of the vote), and “cancers”
(5% of the vote). Only 2% of survey respondents believe dental problems to be a top health problem for
children in the county.
60 | P a g e
DEMOGRAPHICS OF SURVEY RESPONDENTS AND SURVEY PROCESS
CHOC Children’s solicited input from knowledgeable community members who are considered experts in the
fields of health policy and/or population health. They serve children and families in Orange County, including
members of the underserved, low-income, and minority populations. In total, CHOC Children’s had 25
participating key informants. See Appendix B to see the full list of community groups and their representation of,
or service to, low-income, medically underserved, and minority populations. Their opinion was acquired through
a combination of one-on-one interviews and surveys distributed through email in September and October of
2019.
SURVEY FINDINGS
Throughout this process, several themes emerged regarding patient access, preventative care, gaps in services,
and opportunities to enhance and improve upon the services currently provided in Orange County.
Mental Health Services
Almost all the interviewees listed the importance of improving pediatric access to mental health services,
including enhanced coordination of care in order to successfully treat behavioral health conditions and improve
patient outcomes, as one of the most critical health needs facing Orange County. The interviewees explained
that more mental health resources would help families and children who have difficulty finding and accessing
mental health services in the county. The interviewees believe pediatric mental health conditions, if left
untreated, could have dire consequences well into their adult years.
Many interviewees expressed concern in the high prevalence of anxiety and depression among the school-age
population in Orange County. Interviewees attribute these often-untreated conditions with bullying and other
stressors in school, social media and screen time, which can lead to low school attendance rates, lack of physical
activity, and, in extreme cases, teen suicides. Suggestions offered by interviewees include courses offered by
mental health professions for school nurses to assist in identifying early symptoms, additional mental health
resources to families through improved access to community-based education and learning, and access to
pediatric mental health services. Interviewees believe children today are under far more pressure in the era of
social media. Several interviewees attributed depression and anxiety to social media and screen time. This belief
is supported by a longitudinal study published in the journal The Lancet Child & Adolescent Health that
interviewed almost 10,000 children between the ages of 13 and 16 years of age. They found that social media
may harm girls' mental health by increasing their exposure to bullying and reducing their sleep and physical
exercise. Although conclusions of this study focus on one gender, this study is among many that support the
association between mental health of children, social media and other health outcomes. Several respondents
supported the notion that bullying among students was of critical health concern in Orange County.
Some interviewees believe greater coordination and access to pediatric mental health specialists and services
would eliminate barriers to adequately treating children needing mental health services in Orange County.
KEY INFORMANT SURVEY

61 | P a g e
Specific mental health services believed too inadequate or in short supply include universal screening for mental
health and suicide risk.
Some suggested to address deficiencies in mental health services. Interviewees commented that improved
communication between CHOC Children’s and schools/school districts, through electronic health system access
and shared standards of care, would assist in providing enhanced and expanded coordinated care.
Obesity
Since CHOC Children’s 2016 CHNA, obesity continues to rank as a top concern in Orange County. Obesity is
associated with chronic diseases—such as asthma, sleep apnea, ADHD, and metabolic disorders—and other
critical concerns like bullying, stress in school, low self-esteem, mental health, and suicidal ideations. Pediatric
public health key informants have attributed a high incidence and prevalence of obesity to risky behaviors and to
systems that use food as a positive reinforcer. Risky behaviors include children’s dietary choices (being picky
eaters) and their sedentary lifestyle caused mostly by increased screen time. Another risky behavior that our key
informants from school districts noted is the increasing number of students trying to get a doctor’s note to
avoid Physical Education (P.E.). This, along with lack of obesity education, exacerbates the problem.
Obesity education is accessible through community evidence-based programs and interventions, such as teaching
parents food parentings practices (FPPs) that are useful strategies to influence the amount and types of food a
child eats. Accessible community evidence-based programs and interventions are concerns for providers and
families alike. Especially concerning are families and children in the low-income and medically underserved
populations where disparities exist. Some key informants noted that not only does reimbursement affect their
ability to provide these resources to the populations in need, but also families’ ability to pay are hindering their
pediatric obesity treatment and management. In addition to costs related to reimbursement, another concern is
transportation to these resources. Consistent attendance and participation in these evidence-based programs
and interventions are necessary to ensure change of behavior for both children and their families.
Because Orange County is a diverse metropolitan area with different racial and ethnic groups, another challenge
is the cultural perspective on obesity. Educating families and children on obesity is difficult, and key informants
commented during the surveys and one-on-one interviews that it is the responsibility of physicians to educate
families on Body Mass Index (BMI) and explain the diagnosis of obesity. The language barrier adds another layer
of difficulty for educating certain ethnic groups on proper nutrition and healthier options.
Even with free community-educational classes and provider efforts in education, another challenge to consider is
the cost of these healthier food choices to ensure proper nutrition. The cost of healthier foods is more
expensive than the cheap, quick, and convenient fast foods that are available in Orange County, which boasts a
diversity of trendy food chains. In addition to cost of healthier food options, there are food deserts to
consider.29
Key informants also identified a lack of green space (park land) for recreational activities. These are important
resources for communities to live a healthier, active lifestyle. Although Orange County is ranked one of the
safest counties (with low crime rates) in the nation, some cities within the county still have crime and
29 A food desert is an area that has limited access to affordable and nutritious food.

62 | P a g e
community violence that deter outdoor activities. Housing, environmental quality, and crime and community
violence all play a part in the healthier lifestyle that reduces incidence and prevalence of obesity.
Overall, the problem with obesity is multilayered and complex as described by key informants and secondary
research, but there are many ways in which to address this critical community concern. Key informants
suggested to strengthen and continue partnership and collaboration between CHOC Children’s, agencies, other
organizations, and most especially school systems. Data sharing can help with communication and connecting
families to pediatric specialists and other community resources. The key informants have so far identified Dr.
Riba’s Health Club, CalOptima’s weight loss program, Team KiPOW, and many others. To find the list of the
mentioned community assets, see Appendix E. The key is collaboration.
Diabetes
Another major concern for the pediatric population, especially those in the Irvine, Fullerton, La Habra, and
Buena Park as identified by key informants, is Type 2 Diabetes (also known as adult-onset diabetes). According
to Mayo Clinic, there is no cure for Type 2 Diabetes, but losing weight, increased physical activity and proper
nutrition are ways of managing this chronic disease.
Key informants identified these challenges when managing Type 2 Diabetes: lack of access to healthy foods; need
for more partnerships and collaborations with other agencies; increased social media exposure and screen time;
and decreased physical activity.
As noted by key informants, the ways to overcome these obstacles include CHOC Children’s NEW You
(Nutrition, Exercise, Wellness), Kids Fit Club, and PODER (Prevention of Obesity and Diabetes through
Education and Resources). These classes are free and available to both the children and their families. Having on-
site diabetes prevention classes for families is another important resource.
Food Insecurity
Key informants identified obesity and diabetes as concerning morbidities, which is why some key informants are
attributing food insecurity as a root cause and major issue that needs to be prioritized and addressed. They
identified food insecurity as a highly critical need because it is often overlooked and not discussed. The lack of
discussion and community concern impacts the most vulnerable populations. When families are faced with food
insecurity, this becomes their top priority. This means that making well child visits, making sick child visits and
managing complex conditions become secondary priorities to food security.
To keep the discussion alive, key informants emphasized existing community resources already addressing the
issue, such as the “No Kid Hungry” program and “Waste Not OC” Coalition. They suggest having more
awareness and collaboration. An additional list of community assets can be found in Appendix E.
Respiratory Illness
Respiratory illness is another critical health concern that almost all key informant interviewees mentioned as
important to address. The concern for respiratory illnesses is attributed to the increasing prevalence of asthma
and allergies, which is further exacerbated by environmental quality (air pollution) in Orange County.
Asthma is one of the most critical respiratory illnesses needing to be addressed. In Orange County, it has been
increasing over the past three decades and is a major cause of ED visits, hospitalizations, and school
absenteeism. Most especially worrisome is the disparity seen among the underserved population. This is in part
due to language barriers; lack of resources and access to pediatric specialists; immediate identification and

63 | P a g e
connectivity to resources; and need for education to understand the respiratory disease treatment and
management. Another barrier is social media or screen time for respiratory illnesses – being cooped up inside
rather than outside is also a concern, especially if living conditions frequently trigger asthma attacks.
To address respiratory illness, CHOC Children’s Breathmobile program, which has been serving the community
for 17 years, has been commended and highly valued by the community, including Hoag Hospital’s Community
Benefit Program. It has been suggested that more mobile clinics, like the Breathmobile, be distributed through
Orange County as it provides additional support and resources while improving access for underserved isolated
children and families. CHOC Children’s Breathmobile program further increases access to high risk asthmatics
as home visits are made to assess and remediate key allergic and nonallergic triggers by providing house dust
mite covers to those sensitive to this allergen, for instance.
Additional suggestions focus on improving communication and collaboration between CHOC Children’s,
agencies, the community, and the children and families. The use of electronic health systems was suggested as
one platform for achieving collaboration.
Substance Abuse In CHOC Children’s 2016 CHNA, substance abuse was named a critical concern for Orange County. For the
2019 CHNA, substance abuse is once again referenced as a major health concern. More specifically, Orange
County key informants have emphasized concern for vaping (which includes electronic cigarettes termed “e-
cigarettes”)—a risky behavior causing respiratory illnesses. Vaping impacts the health and well-being of children
and families. Key Informants collectively mentioned that prevention is a challenge because flavored vape juices
are trendy and marketable to consumer palates. In addition, lack of access to pediatric specialist; lack of
community-based education; the need for more school programs; and additional partnership and collaboration
between community assets are all barriers to addressing this risky behavior.
This is a public health crisis, not only in Orange County but nationally, as more cases of vaping induced lung-
injuries are becoming prominent. At the release of this report, the CDC is currently investigating 1,000 lung
injury cases believed to be induced by vaping. As investigations are underway, key informants believe that more
public awareness and prevention campaigns need to happen at the county level. The recommended solution to
reducing and limiting vaping throughout Orange County is through improved collaboration between CHOC
Children’s, public agencies, and other community organizations.
Bullying and Other Stressors in School
Bullying and other stressors in school were identified as another major concern associated with mental health,
obesity, and hunger. Key informants have observed an increased number of students with physical symptoms of
stress and anxiety. This is due to stressors in school such as schools and families having higher and higher
expectations of students. More specifically, bullying—an aggressive behavior—is an added stressor to the school
environment. The CDC defines bullying as a form of youth violence that may “inflict harm or distress on the
targeted youth including physical, psychological, social or education harm.” This is a concern for all of Orange
County, especially for Orange, Anaheim, Garden Grove, Santa Ana, Tustin, Buena Park, Irvine, and Villa Park
school districts.
Some of the interviewed attributed bullying to these challenges: lack of access to specialists (especially mental
health services); lack of community-based education; increased screen time and social media exposure; alcohol

64 | P a g e
and substance abuse; poor housing; and the need for partnership and collaboration with other organizations and
community efforts.
To reduce bullying and other stressors in school, experts have suggested counseling, community support
programs, and education around available resources to students and their families. A key resource often utilized
to address bullying are the Family Resource Centers located all over Orange County. These suggestions are in
line with CDC Violence Prevention strategies and approaches to bullying incidences:
• Promoting family environments that support health development;
• Provide quality education early in life;
• Strengthen youth’s skills;
• Connect youth to caring adults and activities;
• Create protective community environments; and
• Intervene to lessen harms and prevent future risk.
Child Safety
The overall concern of child safety is a critical need identified by several of the key informants. One of the key
informants noted that child safety related to motor vehicle accidents is a major concern that CHOC Children’s
should address because of the significant injuries that can happen to children. Suggestions to address child safety
from traumatic injuries caused by motor vehicle crashes include the continuation and implementation of
community-based prevention programs, such as car safety seat training and the no texting-driving program.
These programs, in addition to supporting trauma programs and improving acute trauma care systems, are
significant measures to address child safety.
In addition to education of community members and the existence of pediatric trauma specialists, challenges and
opportunities to address child safety from motor vehicle accidents include treatment of alcohol and abuse,
mental health, and continued organization of trauma system of care among hospitals, providers, fire departments
and ambulance companies.
Furthermore, child safety encompasses the need to protect children from child abuse and neglect. The CDC
defines Adverse Childhood Experiences (ACE) as a term used to describe all types of abuse, neglect, and other
potentially traumatic experiences that occur to people under the age of 18. Studies have shown that as the
number of ACEs increases, so does the risk for the following outcomes:
• Injury (i.e. traumatic brain injury);
• Mental health issues (i.e. depression, suicide);
• Maternal health issues (i.e. pregnancy complications, fetal death);
• Infectious disease (i.e. HIV, STDs);
• Chronic diseases (i.e. diabetes);
• Risky behaviors (i.e. substance abuse); and
• Opportunities (i.e. education).
The outcomes of ACE have so far been identified as critical concerns during CHOC Children’s 2019 CHNA;
however, few key informants have identified ACE as a root-cause of these concerns. By protecting children from

65 | P a g e
ACE and focusing on providing them positive experiences, then the ACE outcomes (i.e. mental health, chronic
diseases, and substance abuse) can also be addressed.
ACE is a critical concern that is just as complex and multidimensional. Barriers to preventing ACE include the
lack of family education, which can mean parents’ low educational attainment and/or lack of knowledge on the
importance of infant mental and brain development for instance. Additional barriers to addressing ACE in
Orange County include the lack of access to health care services (especially physician specialists); the stigma of
obtaining help; the lack of standard screenings especially for mental health; poverty; and the prevalence of
domestic violence.
Key informants noted that ACE is preventable so long as CHOC Children’s, agencies, and other community
efforts collaboratively work together to identify individuals needs and barriers. Working together is a
partnership on intergovernmental transfers to address service gaps and most especially, promote systems
improvement. This requires the use of electronic health records; the education of providers, families and
children; and increased resources (inclusive of reimbursement and people to run evidence-based programs, and
interventions). Key informants also identified current community resources that are currently used to address
child safety, such as MOMS of Orange County, school programs, Family Resource Centers, Western Youth, and
Be Well. To see full list of resources, see Appendix E.
Oral Health
Oral care was a top concern for Orange County community members in the 2016 CHNA. For key informants
in the 2019 CHNA process, a few noted that concern for oral care still exists. Dental disease is the number one
most common pathology in pediatrics, and Orange County has a significant need for these services. Particularly,
pediatric physicians and their representatives have noted a high need of routine dental care under general
anesthesia. Due to high costs and lack of access to pediatric dentists, especially those providing general
anesthesia or sedation, families are avoiding dental care altogether. The reasons for avoiding dental care is due
to more pressing living needs that families need to address. Should these families need dental care, then the
dental work is because of a major dental concern. In other words, families wait until the dental problem
becomes a major problem before addressing the issue.
Language barriers and parent carelessness and/or neglect are other reasons why preventive dental care are at
low utilization rates. Additionally, some key informants discussed the lack of community-based education (or
community learning). For instance, many parents do not understand the importance of proper oral healthcare
and often assume baby teeth do not need the same level of care as adult teeth. Another key informant
highlighted the lack of pediatric dentists that accept Medi-Cal in Orange County. This observation is supported
by The Orange County Local Oral Health Program (OC-LOHP) assessment of primary reasons for non-
utilization of dental services, which are primarily cost and access, respectively.
Overall, key informants have agreed that expanding access to pediatric dentists, especially for kids who need
general anesthesia or sedation, and increasing oral care education opportunities can help address dental care
concerns. Some resources used to address oral include: school-based education, Boys & Girls Club, Healthy
Smiles, FQHCs inclusion of dental services, parent oral health advocates, teledentistry, and fluoride applications
during wellness visits in CHOC Children’s primary care offices. Another suggestion includes grouping
procedures together (i.e. dental exam, blood draws) to minimize exposure to anesthesia.

66 | P a g e
Immunizations (Vaccines) and Infectious Diseases
Up-to-date immunizations protect the health and wellbeing of individuals and communities. Key informants
highlighted the importance of pediatric physicians and their representatives in educating and protecting the
public from infectious diseases.
Low-rates of immunizations—a sign of poor community health—threaten immunocompromised individuals
which is of great concern to key informants working in the Orange County education system. Some challenges
that cause low-rates of immunizations include lack of partnership and collaboration with agencies and other
community resources. The barriers pertain to lack of access to medical care, high costs, and vaccine
misinformation.
Suggestions by key informants include collaboration between CHOC Children’s and other community
organizations to work together in providing public service announcements or campaigns focused on educating
on the importance of having up-to-date immunizations.
Collaboration and Partnership with School Programs
Many of the critical health concerns, identified by key informants, noted the need for school-based involvement
in the overall health and well-being of children in Orange County. School-based support programs can help
address several identified community concerns, including:
• Chronic absenteeism;
• Mental health (anxiety and depression);
• Obesity;
• Respiratory illnesses (asthma and allergies);
• Substance abuse (vaping); and
• Bullying and stressors.
School-based programs are a means of identifying, educating, and connecting students and their families with
community resources to help build a thriving community.
Access to Pediatric Specialists
Another critical health need of the community is the lack of access to pediatric specialists, specifically pediatric
dentists and pediatric mental health providers. Key informants define access through reimbursement coverage;
the number of providers supplying services; physical location of providers; hours of operating and scheduling;
and language barriers. Access to pediatric specialists is a national challenge.
Child Poverty
Child poverty and its consequences was another community health need identified by key informants. Poverty
creates barriers to resources that affects health improvement and promotion. Poverty is often associated with
problems such as lack of child care and neglect, poor education, and hunger. Key informants believe more
should be done to assist families living in poverty within Orange County—a metropolitan area described as
affluent.
Some key informants also mentioned that community-based education, poor environmental quality, unaffordable
and unstable housing, and lack of partnership and collaboration of community assets are all barriers to
addressing poverty within Orange County.
67 | P a g e
Child Care Affordability
Affordable child care was identified by many key informants as a critical health concern, especially for the low-
income and underserved population. The cost of raising a child (inclusive of day care and education) is increasing
and is impacting families across all populations in Orange County. Families are prioritizing child care spending
over other necessities such as housing, medical insurance, and car maintenance. The cost of child care in
California, and particularly Orange County, is more expensive than that in other states. Child care affordability is
a concern that exacerbates other community health issues, including mental health services, oral health services,
and obesity. To overcome this barrier, key informants suggest identifying additional resources that can alleviate
the burden of rising child care costs. Another suggestion is to place more effort in collaborating and partnering
with school programs and other community organizations, especially those that help with food access and job
employment.
Housing Affordability
As identified by secondary resources and informant key interviews and surveys, it has been noted that housing
affordability in Orange County has become a burden to low-income and medically underserved populations. Key
informants believe housing prices have led to increased commute times and lower quality of life. Key informants
identified housing affordability as a barrier when addressing critical health needs, such as mental health services,
obesity, and respiratory illnesses. Additionally, key informants suggest improved collaboration and partnership
with local agencies and community organizations could help address this community need.
68 | P a g e
APPENDIX A: DATA SOURCES
American Academy of Pediatrics (2019). Retrieved from https://www.aap.org/en-us/Pages/Default.aspx
Attendance Works (2019). Retrieved from https://www.attendanceworks.org/chronic-absence/the-problem/
Austin, G., Polik, J., Hanson, T., & Zheng, C. (2018). School climate, substance use, and student well-being in California, 2015-17.
Results of the Sixteenth Biennial Statewide Student Survey, Grades 7, 9, and 11. San Francisco: WestEd.
Berkowitz, S., Karter, A., Corbie-Smith, G., Seligman, H., Ackroyd, S., Barnard, L., … Wexler, D. (2018). Food Insecurity,
Food “Deserts,” and Glycemic Control in Patients With Diabetes: A Longitudinal Analysis. Diabetes Care, 41(6),
1188–1195. https://doi.org/10.2337/dc17-1981
California Department of Education (2019). Retrieved from https://www.cde.ca.gov/ds/
California Department of Public Health (2019). Retrieved from https://www.cdph.ca.gov/
California Employment Development Department Bureau of Labor Statistics (2019). Retrieved from
https://www.bls.gov/data/
Centers of Disease Control and Prevention (2019a). Overweight and Obesity. Retrieved from
https://www.cdc.gov/obesity/index.html
Centers of Disease Control and Prevention (2019b). Oral Health: Children’s Oral Health. Retrieved from
https://www.cdc.gov/oralhealth/basics/childrens-oral-health/index.html
Centers of Disease Control and Prevention (2019c). Violence Prevention: Adverse Childhood Experiences. Retrieved from
https://www.cdc.gov/violenceprevention/childabuseandneglect/acestudy/index.html
Centers of Disease Control and Prevention (2019d). Violence Prevention: Bullying. Retrieved from
https://www.cdc.gov/violenceprevention/youthviolence/bullyingresearch/fastfact.html
Center on the Developing Child at Harvard University (2010). The Foundations of Lifelong Health Are Built in Early Childhood
[Report]. Retrieved from https://developingchild.harvard.edu/wp-content/uploads/2010/05/Foundations-of-Lifelong-
Health.pdf
Esri (2019). CHOC Children’s Esri Demographics of Orange County and California: 2019 Estimates based on US Census
and American Communities Survey 2013-2017 [Computer Software].
Feeding America (2019). Feeding America Research [Dataset]. Retrieved on
https://public.tableau.com/profile/feeding.america.research#!/
Health Resources and Services Administration (2019). Retrieved from https://www.hrsa.gov/
Healthy People 2020 (2019). Retrieved from https://www.healthypeople.gov/2020/Leading-Health-Indicators
How Housing Matters (2019). Retrieved from https://howhousingmatters.org/
KidsData.Org (2019). Retrieved from https://www.kidsdata.org/region/365/orange-county/summary#6/demographics
APPENDIX

69 | P a g e
Laura Otterbach, Noereem Z. Mena, Geoffrey Greene, Colleen A. Redding, Annie De Groot, & Alison Tovar. (2018).
Community-based childhood obesity prevention intervention for parents improves health behaviors and food
parenting practices among Hispanic, low-income parents. BMC Obesity, 5(1), 1–10. https://doi.org/10.1186/s40608-
018-0188-2
Legislative Analyst’s Office (2015). California’s High Housing Costs: Causes and Consequences. Retrieved from
https://lao.ca.gov/reports/2015/finance/housing-costs/housing-costs.pdf
Mayo Clinic (2019). Diabetes. Retrieved from https://www.mayoclinic.org/diseases-conditions/diabetes/symptoms-causes/syc-
20371444
Mayo Clinic (2019). Drug addiction (substance use disorder). Retrieved from https://www.mayoclinic.org/diseases-
conditions/drug-addiction/symptoms-causes/syc-20365112
National Institute on Alcohol Abuse and Alcoholism (2019). Retrieved from https://www.niaaa.nih.gov/research
Office of Statewide Healthcare Planning and Development (OSHPD). Retrieved from https://oshpd.ca.gov/opendata/
Orange County (OC) Healthier Together (2018). OC Oral Health Strategic Plan 2018-2022 [Report]. Retrieved from
http://www.ochealthiertogether.org/content/sites/ochca/Local_Reports/OC_Oral_Health_Strategic_Plan_2018-
2022_FINAL.pdf
Orange County Children’s Partnership (2019). The 24th Annual Report on the Conditions of Children in Orange County [Report].
Orange County Department of Education School District. California Healthy Kids Survey, 2017-18: Main Report. San Francisco:
WestEd Health & Human Development Program for the California Department of Education.
Orange County Health Care Agency (2017). Drug and Alcohol Morbidity and Mortality in Orange County [Report]. Retrieved
from https://docs.house.gov/meetings/IF/IF02/20171212/106716/HHRG-115-IF02-20171212-SD005.pdf
Orange County Health Care Agency (2018). Orange County Local Oral Health Program: Oral Health Strategic Plan 2018-2022
[Report]. Retrieved from http://cms.ocgov.com/civicax/filebank/blobdload.aspx?BlobID=81730
Orange County Healthier Together (2019). 2019-20 Orange County Community Indicators Report. Retrieved from
https://www.ocbc.org/wp-content/uploads/2019/09/CommIndicators_Report_091219-WEB.pdf
Shots for School (2019). Retrieved from https://www.shotsforschool.org/
The Center on the Developing Child at Harvard University (2017). 3 Principles to Improve Outcomes for Children and Families.
Retrieved from http://www.developingchild.harvard.edu
United States Census Bureau (2019). American Community Survey [Datasets]. Retrieved from
https://www.census.gov/acs/www/data/data-tables-and-tools/data-profiles/2016/
United States Department of Health and Human Resources (2019). Be Active. Retrieved from
https://www.hhs.gov/fitness/be-active/index.html
Viner, R., Aswathikutty-Gireesh, A., Stiglic, N., Hudson, L., Goddings, A., Ward, J. (2019). Roles of cyberbullying, sleep, and
physical activity in mediating the effects of social media use on mental health and wellbeing among young people in
England: a secondary analysis of longitudinal data. The Lancelet Child and Adolescent Health, 3(10), 865-696.
https://doi.org/10.1016/S2352-4642(19)30186-5

70 | P a g e
APPENDIX B: COMMUNITY INPUT – LIST OF KEY INFORMANTS REPRESENTING
AND/OR SERVING LOW-INCOME, MEDICALLY UNDERSERVED, MINORITY
POPULATIONS
Name and Title Organization
Representing/Serving Population:
Low-Income, Medically
Underserved, Minority
Jennifer Peach-Guzman, Director of
Operations
AltaMed Health Services (FQHC) Serving low-income, medically
underserved, and minority populations
School Nurses Anaheim Elementary School District Serving low-income, medically
underserved, and minority populations
Stanley Galant, MD, Medical Director
of CHOC Breathmobile
CHOC Breathmobile Serving low-income, medically
underserved, and minority populations
Tina Shaps-Olson, LCSW, Social
Worker
CHOC Children’s Health Alliance Serving low-income, medically
underserved, and minority populations
Amber Morlan, Program Coordinator
Charles V. Golden, DO, President of
CMG and Medical Director of CHOC
Primary Care Network
CHOC Children’s Medical Group and
Primary Care Network
Serving low-income, medically
underserved, and minority populations
Family Advisory Committee (FAC) CHOC Children's Representing low-income, medically
underserved, and minority populations
Daniel Mackey, MD, Pediatrician CHOC Children's Primary Care Serving low-income, medically
underserved, and minority populations
James Cappon, MD, Vice President
and Chief Quality and Patient Safety
Officer
CHOC Children's Quality and Risk
Management
Serving low-income, medically
underserved, and minority populations
Mike De Laby, RN, EMS
Administrator
County of Orange - Health Care
Agency Emergency Medical Services
Serving low-income, medically
underserved, and minority populations
Joshua Yang, Ph.D., Associate
Professor
CSU Fullerton, Department of Public
Health
Representing low-income, medically
underserved, and minority populations
Ilia Rolon, MPH, Vice President of
Programs
First 5 Orange County Serving low-income, medically
underserved, and minority populations
Kelly Schultz, RN, District RN Fountain Valley School District Serving low-income, medically
underserved, and minority populations
Ynette Johnson, RN, School Nurse Fullerton Joint Union High School
District
Serving low-income, medically
underserved, and minority populations
Associate Director of Clinical
Operations
Health Smiles Smile Clinic Serving low-income, medically
underserved, and minority populations
Health Services Coordinator and
School Nurses
Irvine Unified School District Serving low-income and minority
populations

71 | P a g e
Pamela Pimentel, RN, Chief Executive
Officer
MOMS Orange County Serving low-income, medically
underserved, and minority populations
School Nurses Newport-Mesa Unified School District Serving low-income, medically
underserved, and minority populations
Katherine Williamson, MD, President Orange County Chapter - American
Academy of Pediatrics
Serving low-income, medically
underserved, and minority populations
School Nurses Orange County Department of
Education, Special Education Classes
Serving low-income, medically
underserved, and minority populations
Public Heath Projects Manager Orange County Health Care Agency,
Public Health Services
Serving low-income, medically
underserved, and minority populations
Michelle Murphy, MSW, Director of
Public Affairs
Orange County United Way Serving low-income, medically
underserved, and minority populations
School Nurses Orange Unified School District Serving low-income, medically
underserved, and minority populations

72 | P a g e
APPENDIX C: COMMUNITY INPUT – KEY INFORMANT SURVEY

73 | P a g e

74 | P a g e

75 | P a g e

76 | P a g e

77 | P a g e

78 | P a g e

79 | P a g e

80 | P a g e

81 | P a g e

82 | P a g e
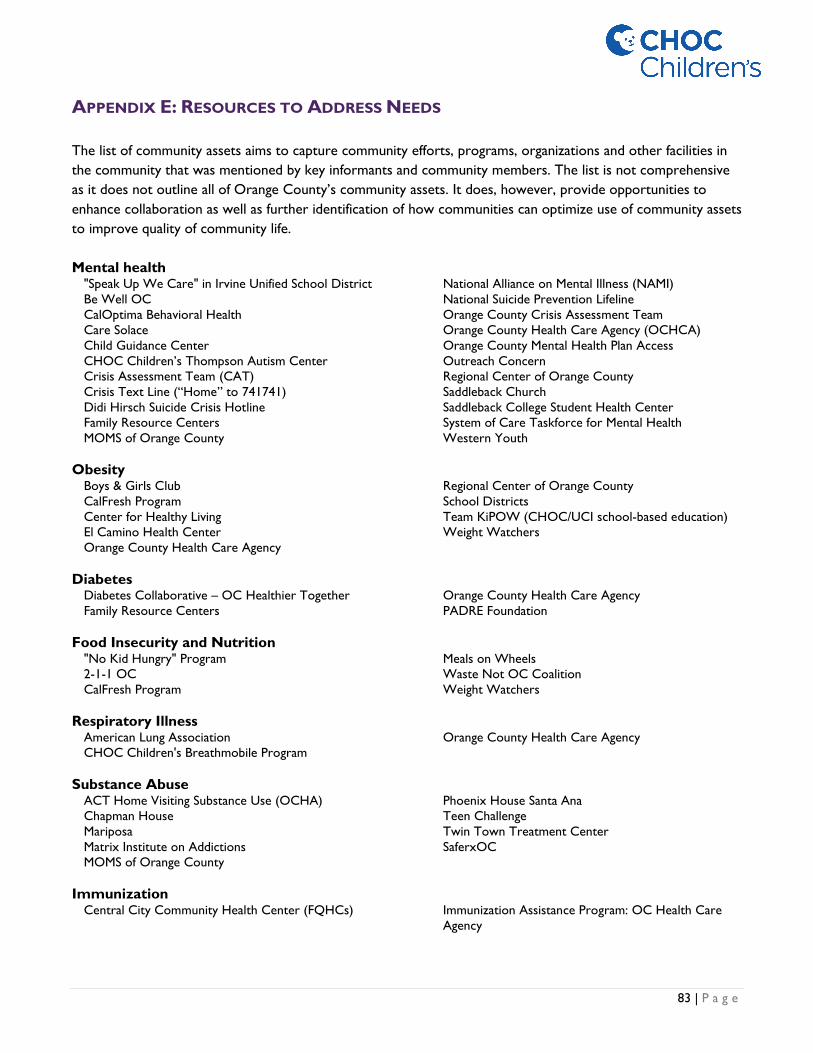
83 | P a g e
APPENDIX E: RESOURCES TO ADDRESS NEEDS
The list of community assets aims to capture community efforts, programs, organizations and other facilities in
the community that was mentioned by key informants and community members. The list is not comprehensive
as it does not outline all of Orange County’s community assets. It does, however, provide opportunities to
enhance collaboration as well as further identification of how communities can optimize use of community assets
to improve quality of community life.
Mental health "Speak Up We Care" in Irvine Unified School District
Be Well OC
CalOptima Behavioral Health
Care Solace
Child Guidance Center
CHOC Children’s Thompson Autism Center
Crisis Assessment Team (CAT)
Crisis Text Line (“Home” to 741741)
Didi Hirsch Suicide Crisis Hotline
Family Resource Centers
MOMS of Orange County
National Alliance on Mental Illness (NAMI)
National Suicide Prevention Lifeline
Orange County Crisis Assessment Team
Orange County Health Care Agency (OCHCA)
Orange County Mental Health Plan Access
Outreach Concern
Regional Center of Orange County
Saddleback Church
Saddleback College Student Health Center
System of Care Taskforce for Mental Health
Western Youth
Obesity Boys & Girls Club
CalFresh Program
Center for Healthy Living
El Camino Health Center
Orange County Health Care Agency
Regional Center of Orange County
School Districts
Team KiPOW (CHOC/UCI school-based education)
Weight Watchers
Diabetes Diabetes Collaborative – OC Healthier Together
Family Resource Centers
Orange County Health Care Agency
PADRE Foundation
Food Insecurity and Nutrition "No Kid Hungry" Program
2-1-1 OC
CalFresh Program
Meals on Wheels
Waste Not OC Coalition
Weight Watchers
Respiratory Illness American Lung Association
CHOC Children's Breathmobile Program
Orange County Health Care Agency
Substance Abuse ACT Home Visiting Substance Use (OCHA)
Chapman House
Mariposa
Matrix Institute on Addictions
MOMS of Orange County
Phoenix House Santa Ana
Teen Challenge
Twin Town Treatment Center
SaferxOC
Immunization Central City Community Health Center (FQHCs) Immunization Assistance Program: OC Health Care
Agency
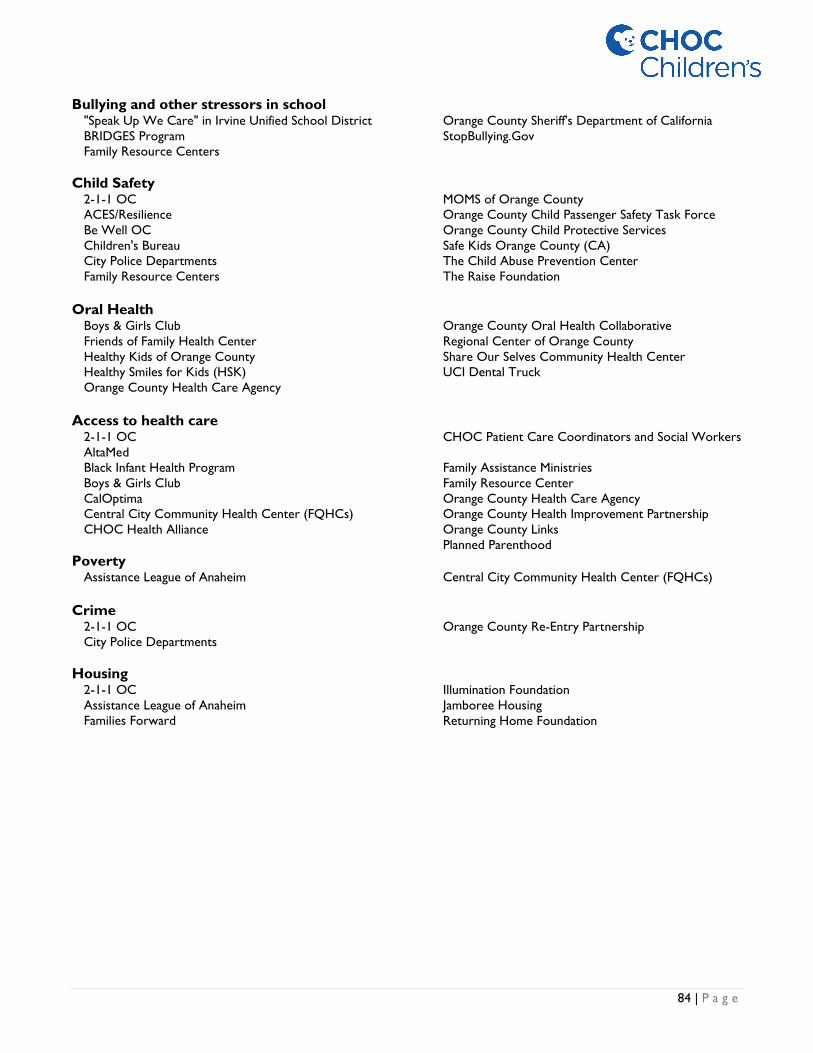
84 | P a g e
Bullying and other stressors in school "Speak Up We Care" in Irvine Unified School District
BRIDGES Program
Family Resource Centers
Orange County Sheriff's Department of California
StopBullying.Gov
Child Safety 2-1-1 OC
ACES/Resilience
Be Well OC
Children's Bureau
City Police Departments
Family Resource Centers
MOMS of Orange County
Orange County Child Passenger Safety Task Force
Orange County Child Protective Services
Safe Kids Orange County (CA)
The Child Abuse Prevention Center
The Raise Foundation
Oral Health Boys & Girls Club
Friends of Family Health Center
Healthy Kids of Orange County
Healthy Smiles for Kids (HSK)
Orange County Health Care Agency
Orange County Oral Health Collaborative
Regional Center of Orange County
Share Our Selves Community Health Center
UCI Dental Truck
Access to health care 2-1-1 OC
AltaMed
Black Infant Health Program
Boys & Girls Club
CalOptima
Central City Community Health Center (FQHCs)
CHOC Health Alliance
CHOC Patient Care Coordinators and Social Workers
Family Assistance Ministries
Family Resource Center
Orange County Health Care Agency
Orange County Health Improvement Partnership
Orange County Links
Planned Parenthood
Poverty Assistance League of Anaheim Central City Community Health Center (FQHCs)
Crime 2-1-1 OC
City Police Departments
Orange County Re-Entry Partnership
Housing 2-1-1 OC
Assistance League of Anaheim
Families Forward
Illumination Foundation
Jamboree Housing
Returning Home Foundation
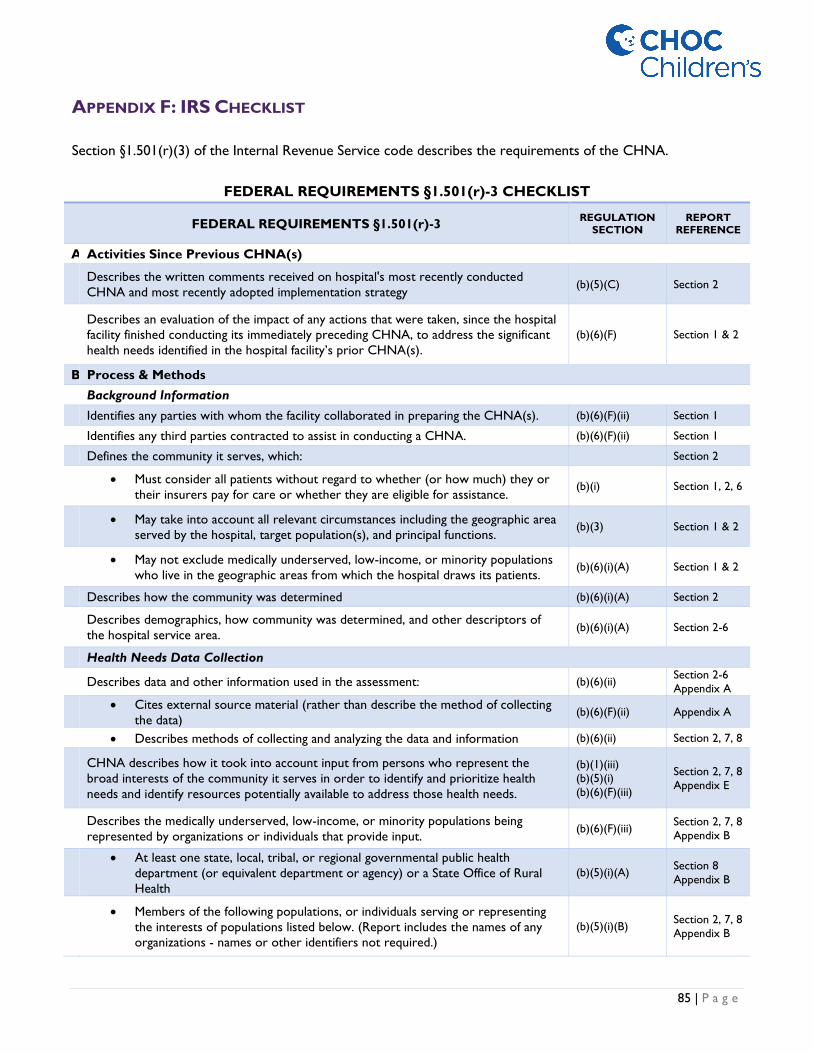
85 | P a g e
APPENDIX F: IRS CHECKLIST
Section §1.501(r)(3) of the Internal Revenue Service code describes the requirements of the CHNA.
FEDERAL REQUIREMENTS §1.501(r)-3 CHECKLIST
FEDERAL REQUIREMENTS §1.501(r)-3 REGULATION
SECTION REPORT
REFERENCE
A Activities Since Previous CHNA(s)
Describes the written comments received on hospital's most recently conducted
CHNA and most recently adopted implementation strategy (b)(5)(C) Section 2
Describes an evaluation of the impact of any actions that were taken, since the hospital
facility finished conducting its immediately preceding CHNA, to address the significant
health needs identified in the hospital facility’s prior CHNA(s).
(b)(6)(F) Section 1 & 2
B Process & Methods
Background Information
Identifies any parties with whom the facility collaborated in preparing the CHNA(s). (b)(6)(F)(ii) Section 1
Identifies any third parties contracted to assist in conducting a CHNA. (b)(6)(F)(ii) Section 1
Defines the community it serves, which: Section 2
• Must consider all patients without regard to whether (or how much) they or
their insurers pay for care or whether they are eligible for assistance. (b)(i) Section 1, 2, 6
• May take into account all relevant circumstances including the geographic area
served by the hospital, target population(s), and principal functions. (b)(3) Section 1 & 2
• May not exclude medically underserved, low-income, or minority populations
who live in the geographic areas from which the hospital draws its patients. (b)(6)(i)(A) Section 1 & 2
Describes how the community was determined (b)(6)(i)(A) Section 2
Describes demographics, how community was determined, and other descriptors of
the hospital service area. (b)(6)(i)(A) Section 2-6
Health Needs Data Collection
Describes data and other information used in the assessment: (b)(6)(ii) Section 2-6
Appendix A
• Cites external source material (rather than describe the method of collecting
the data) (b)(6)(F)(ii) Appendix A
• Describes methods of collecting and analyzing the data and information (b)(6)(ii) Section 2, 7, 8
CHNA describes how it took into account input from persons who represent the
broad interests of the community it serves in order to identify and prioritize health
needs and identify resources potentially available to address those health needs.
(b)(1)(iii)
(b)(5)(i)
(b)(6)(F)(iii)
Section 2, 7, 8
Appendix E
Describes the medically underserved, low-income, or minority populations being
represented by organizations or individuals that provide input. (b)(6)(F)(iii)
Section 2, 7, 8
Appendix B
• At least one state, local, tribal, or regional governmental public health
department (or equivalent department or agency) or a State Office of Rural
Health
(b)(5)(i)(A) Section 8
Appendix B
• Members of the following populations, or individuals serving or representing
the interests of populations listed below. (Report includes the names of any
organizations - names or other identifiers not required.)
(b)(5)(i)(B) Section 2, 7, 8
Appendix B

86 | P a g e
o Medically underserved populations (b)(5)(i)(B) Section 2, 7, 8
Appendix B
o Low-income populations (b)(5)(i)(B) Section 2, 7, 8
Appendix B
o Minority populations (b)(5)(i)(B) Section 2, 7, 8
Appendix B
Additional sources (optional) – (e.g. healthcare consumers, advocates, nonprofit and
community-based organizations, elected officials, school districts, healthcare providers
and community health centers).
(b)(5)(ii) Section 8
Appendix B
Describes how such input was provided (e.g., through focus groups, interviews or
surveys). (b)(6)(F)(iii)
Section 1, 2,
7, 8
Appendix B
Describes over what time period such input was provided and between what
approximate dates. (b)(6)(F)(iii)
Section 1, 2,
7, 8
Summarizes the nature and extent of the organizations’ input. (b)(6)(F)(iii) Section 1, 2,
7, 8
C CHNA Needs Description & Prioritization
Health needs of a community include requisites for the improvement or maintenance of
health status both in the community at large and in particular parts of the community
(such as particular neighborhoods or populations experiencing health disparities).
(b)(4) Section 3, 4, 5
Prioritized description of significant health needs identified. (b)(6)(i)(D) Section 1, 7, 8
Description of process and criteria used to identify certain health needs as significant
and prioritizing those significant health needs. (b)(6)(i)(D) Section 1 & 2
Description of the resources potentially available to address the significant health needs
(such as organizations, facilities, and programs in the community, including those of the
hospital facility.
(b)(4)
(b)(6)(E )
Section I, 6, 8
Appendix E
D Finalizing the CHNA
CHNA is conducted in such taxable year or in either of the two taxable years
immediately preceding such taxable year (a)(1) Section 1
CHNA is a written report that is adopted for the hospital facility by an authorized body
of the hospital facility (authorized body defined in §1.501(r)-1(b)(4)). (b)(iv) Section 1
Final, complete, and current CHNA report has been made widely available to the public
until the subsequent two CHNAs are made widely available to the public. “Widely
available on a web site” is defined in §1.501(r)-1(b)(29).
(b)(7)(i)(A) Date of
posting
• May Not be a copy marked "draft" (b)(7)(ii)
• Posted conspicuously on website (either the hospital facility’s website or a
conspicuously located link to a web site established by another entity). (b)(7)(i)(A)
• Instructions for accessing CHNA report are clear. (b)(7)(i)(A)
• Individuals with Internet access can access and print reports without special
software, without payment of a fee, and without creating an account. (b)(7)(i)(A)
• Individuals requesting a copy of the report(s) are provided the URL. (b)(7)(i)(A)
• Makes a paper copy available for public inspection upon request and without
charge at the hospital facility. (b)(7)(i)(B)