community mapping for exposure in indonesia project report
TRANSCRIPT

1

2
Community Mapping for Exposure in Indonesia PROJECT REPORT
March 2012
Kate Chapman
Humanitarian OpenStreetMap Team

3

4
Section 1: Acknowledgements
1.1 Report Contributors This report was prepared by Kate Chapman of the Humanitarian OpenStreetMap Team. Assistance was provided by Emir Hartato of the Humanitarian OpenStreetMap Team with editing assistance provided by the membership of the Humanitarian OpenStreetMap Team and Australia-Indonesia Facility for Disaster Reduction.
Australia-‐Indonesia Facility for Disaster Reduction This Community Mapping project has been funded by AusAID (Australian Agency for International Development) and BNPB (Indonesian National Disaster Management Agency) through The Australia-Indonesia Facility for Disaster Reduction (AIFDR). AIFDR is a joint initiative between the governments of Australia and Indonesia and work to strengthen Indonesia's ability to reduce the impact of disasters. http://www.aifdr.org
Australian Community Development and Civil Society Strengthening Scheme Phase 2 The AusAID funded Australian Community Development and Civil Society Strengthening Scheme (ACCESS) is an initiative of the Australian Government and Indonesian Government focused on building the capacity of local community and civil society organizations through creating a demand for better governance. One of the fundamental components of ACCESS is to map the local communities they are working in. http://www.access-indo.or.id/
Badan Nasional Penanggulangan Bencana (BNPB) Indonesia’s National Disaster Management Agency (BNPB) is a non-departmental ministerial-level government agency, tasked with providing guidance and direction to the efforts of disaster management that includes disaster prevention, emergency response, rehabilitation, and reconstruction in a fair and equal. http://www.bnpb.go.id/
Humanitarian OpenStreetMap Team Free, collaborative maps are uniquely valuable to humanitarian work, especially in places where base map data is often scarce, out of date, or rapidly changing. OpenStreetMap is a web project to create a free and open map of the entire world, built entirely by volunteers surveying with GPS, digitizing aerial imagery, and collecting and liberating existing public sources of geographic data. The Humanitarian OpenStreetMap Team (HOT) is a initiative to apply the principles and activities of open source and open data sharing towards humanitarian response and economic development. http://hot.openstreetmap.org/
1.2 Supporters
World Bank Global Facility for Disaster Reduction and Recovery Established in 2006, the Global Facility for Disaster Reduction and Recovery (GFDRR) is a partnership of 39 countries and 8 international organizations committed to helping developing countries reduce their vulnerability to natural hazards and adapt to climate change.
Universitas Indonesia, Universitas Gadjah Mada, Institut Teknologi Bandung, Institut Teknologi Sepuluh Nopember, Universitas Andalas

5
Table of Contents Section 1: Acknowledgements ........................................................................................ 4 1.1 Report Contributors ............................................................................................................................................... 4 1.2 Supporters .................................................................................................................................................................. 4
Section 2: Executive Summary ......................................................................................... 7 2.1 Key Accomplishments ........................................................................................................................................... 7 2.2 The Future .................................................................................................................................................................. 7
Section 3: Introduction .................................................................................................... 8 3.1 Initial Workshops .................................................................................................................................................... 8 3.2 Enabling Better Data Collection ........................................................................................................................ 8 3.3 Utilizing the Data ..................................................................................................................................................... 9
Section 4: Two Community Approach .............................................................................. 9 4.1 Rural Area .................................................................................................................................................................. 9 4.2 Urban Approaches ............................................................................................................................................... 10 4.3 Toolsets for Urban Versus Rural Collection ............................................................................................. 10 4.4 Additional Communities Trained .................................................................................................................. 11
Section 5: Mapping with ACCESS Facilitators .................................................................. 11 5.1 Initial Workshops with ACCESS ..................................................................................................................... 11 5.2 Initial Mapping of Two Villages of Sumbawa ........................................................................................... 12 5.2.1 Week intensive workshop ............................................................................................................................. 12 5.2.2 Private Datastore training .......................................................................................................................... 13 5.2.3 Evaluation ........................................................................................................................................................... 13
5.3 Community Mapping Sustainability Workshop ...................................................................................... 15
Section 6: Methodologies for Mapping in Urban Environments ...................................... 16 6.1 University Competition ..................................................................................................................................... 16 6.1.1 The process of the competition .................................................................................................................. 16 6.1.2 Winners ................................................................................................................................................................ 17 6.1.3 Statistics ............................................................................................................................................................... 17 6.1.4 Future Competition ......................................................................................................................................... 18
6.2 Mapping Jakarta with BPBD ............................................................................................................................ 18 6.3 Remote Mapping with Broader OpenStreetMap Community ........................................................... 20
Section 7: Data Accuracy Evaluation ............................................................................... 20
Section 8: Software to Support Mapping in the Indonesian Context ............................... 21 8.1 Tasking Manager .................................................................................................................................................. 21 8.1.1 Tracing of Purchased Satellite Imagery of Padang .......................................................................... 22 8.1.2 Remote and on-‐the-‐ground Mapping in Kupang ............................................................................... 22 8.1.3 Three Day Mapping Workshop in Sumba ............................................................................................. 22 8.1.4 Coordination of Student Training for Mapping Jakarta ................................................................. 22 8.1.5 Quality Control Checks of Mapping of DKI Jakarta ........................................................................... 23
8.2 Private Datastore ................................................................................................................................................. 23

6
Section 9: OpenStreetMap Indonesia ............................................................................. 24 9.1 LearnOSM.org and Translations of JOSM ................................................................................................... 24 9.1.1 LearnOSM.org Website .................................................................................................................................. 25 9.1.2 Translation of JOSM into Indonesian ...................................................................................................... 25
9.2 Digital Community OpenStreetMap Indonesia ....................................................................................... 25 9.3 Outreach Outside Indonesia ............................................................................................................................ 26
Section 10: Presets and Symbols for Indonesia ............................................................. 26
Section 11: Integration of OpenStreetMap Data with InaSAFE ...................................... 27
Section 12: Actual Cost of Mapping .............................................................................. 29 12.1 University Competition Costs ......................................................................................................................... 29 12.2 Community Mapping Cost in Dompu and Bima ...................................................................................... 29 12.3 Expected Ongoing Costs .................................................................................................................................... 29
Section 13: Recommendations ...................................................................................... 29 13.1 Improving Technical Capacity ........................................................................................................................ 29 13.2 Easy Paths for Obtaining Satellite Imagery and GPS Units ................................................................ 30 13.3 Improved Methodologies for Large Scale Mapping Events ............................................................... 30 13.4 Re-‐evaluation of Training Materials for Collection of Building Attributes ................................. 31
Section 14: Conclusion .................................................................................................. 31

7
Section 2: Executive Summary Over the past year the Indonesia’s National Disaster Management Agency (BNPB) and the Australian Agency for International Development (AusAID) through the Australia-Indonesia Facility for Disaster Reduction(AIFDR), the Humanitarian OpenStreetMap Team(HOT), and AusAID funded Australian Community Development and Civil Society Strengthening Scheme Phase II (ACCESS) embarked on a community mapping project pilot. The broad question to be answered by the pilot was “can OpenStreetMap be used to map exposure in Indonesia?” Exposure is an important component in impact models. Hazard is the other component and is the actual event that happens such as a tsunami or earthquake. By using the two together in a model it can estimate how many people, buildings or other important infrastructure could be affected. This pilot was the first attempt to use OpenStreetMap to collect data of this kind and then feed it into scientific models to determine what would happen if a disaster happened in a specific location.
2.1 Key Accomplishments • 163,912 buildings were mapped during the pilot study (June 2011 to March 2012) • Translation of OpenStreetMap software into Indonesian • Creation of basic OpenStreetMap training materials specific to Indonesia • Community facilitator groups on Sumbawa have continued creating their own village level maps
and begun assisting with workshops in other regions • Completion of a university competition and winners traveled to Denver, Colorado in the United
States to attend FOSS4G • Hosting of 10 training workshops with ACCESS (124 people in total) • Hosting of 6 training workshops with 5 different universities within Indonesia • Creation of Separate Datastore tool to allow private information such as poverty indicators to be
combined with OpenStreetMap data • Creating of a tasking tool to coordinate mapping efforts, this tool has been since utilized in
earthquake response in Turkey, mapping coordination in Haiti as well as in multiple projects in Indonesia
• Mapping of DKI Jakarta (Important buildings and sub-village administration boundaries) with Government officials using materials created during the trial
2.2 The Future This pilot has shown to be a success, different communities in Indonesia have been willing to do mapping for different reasons. Be it community poverty mapping, mapping of important buildings for flood preparedness or being excited by a mapping competition, there are many interested organizations and individuals in Indonesia willing and capable of mapping. This newly created community requires support to continue to grow and develop experts and trainers. To establish a sustainable community in Indonesia the following points need to be addressed:
• Expansion of partner organizations that can contribute to and benefit from the OpenStreetMap data • Packaging of the techniques used for critical infrastructure mapping in DKI Jakarta to be more
easily rolled out in other provinces. • Continue online support for those already mapping but may have technical questions • Ensure availability of satellite information or GPS units for mapping in areas where no free sources
are available. • Re-evaluate of manuals for structural information mapping to determine if the information is too
difficult to crowd-source or if the instructions were incomplete • Create a pool of OpenStreetMap trainers to train organizations and assist in implementation their
mapping projects. Many organizations are capable of mapping, but need initial project design advising to begin
• Creation of intermediate and advanced training materials to move the OpenStreetMap community in Indonesia to being more self-sufficient
This young OpenStreetMap community in Indonesia shows much promise. If it is provided with the

8
technical support it needs, a more up to date exposure dataset can be created for critical regions in Indonesia.
Section 3: Introduction Two years ago the idea was conceived by Indonesia’s National Disaster Management Agency (BNPB) and Australian Agency for International Development (AusAID), through Australia-Indonesia Facility for Disaster Reduction (AIFDR) and Global Facility for Disaster Reduction and Recovery (GFDRR) - World Bank to develop software that produces realistic natural hazard impacts scenarios for better planning, preparedness and response activities; later known as InaSAFE1 (Indonesia Scenario Assessment For Emergencies). One of the key inputs into InaSAFE is accurate exposure data; where people work and live and the construction of these structures. Such a comprehensive data set for Indonesia was not available. Discussions began with the Humanitarian OpenStreetMap Team (HOT) in early 2011 to design a pilot to evaluate the feasibility of utilizing OpenStreetMap for collecting this needed information through the mapping of building and their structure type. Initially this pilot was intended to last three months, but as more information was discovered the pilot was extended to provide clear recommendations. This allowed a much better understanding of how people would contribute to OpenStreetMap in Indonesia and to develop software to assist in their contributions. The breakdowns of the three phases of the pilot were as follows:
3.1 Initial Workshops In the initial three months many workshops were hosted both at universities and with ACCESS (Ref 1.2.b). A component of the ACCESS process is to create poverty maps to assist in community decision-making. These early workshops sought to teach OpenStreetMap to ACCESS facilitators by using already existing OpenStreetMap training techniques. The only addition to the training manual was a section on building construction (structure type, wall type, roof type, number of stories) since this was the main desired output from the mapping by BNPB and AIFDR. From hosting these workshops HOT learned more about the needs of specific groups, understood that part of their original mapping included building construction and was able to determine what additional work would be needed to enable ACCESS to utilize OpenStreetMap as part of their process (Ref 5).
3.2 Enabling Better Data Collection The second phase of the pilot was focused on allowing better data collection this was through the creation and pilot of a:
• Private Datastore (Ref 8.1). Every item in OpenStreetMap has a unique ID, the Private Datastore allows collection of private information and linking to OpenStreetMap by this unique identifier. This will allows ACCESS facilitators to make maps with private and public information seamlessly. Some ACCESS facilitators were currently making similar maps, they were not easy to replicate. For example in creating poverty map indicators are calculated to determine what color each household should be. By using GIS one can decide on new thresholds for each type of household (poor, medium and rich in this case) and then recolor the map quickly.
1 http://www.inasafe.org

9
• Tasking Manager (Ref 8.2). The Tasking Manager divides work into geographic grids to coordinate data collection through OpenStreetMap software. The need for this software was apparent after 2010 earthquake in Haiti, as there were many people locally and internationally that wanted to help map, but there was no software to coordinate the systematic collection of the data.
3.3 Utilizing the Data It was identified that after teaching the ACCESS facilitators to collect spatial data, it was also necessary to teach them how to utilize the data to make maps and do basic spatial queries. This was apparent by the products they were developing after the initial workshop, as their methodologies were not always the most effective ways of performing analysis. For example one group was taking screenshots from JOSM (an OpenStreetMap editor) and then coloring each individual house in CorelDraw. This requires a lot of manual work, whereas with Quantum GIS2 (open source GIS software) the houses could be colored automatically based on the information they had already gathered. Additionally each village determines their own poverty thresholds for their maps, so sometimes there would be a need to apply new indicators to recolor a map. Using the CorelDraw methodology would require manual recoloring of each building, whereas QGIS would only require the input of the information and could then instantly recolor the map. Hence additional QGIS manuals (Ref 9.1) were developed based on previous workshops with facilitators to ensure they could create poverty maps by using the OpenStreetMap data in conjunction with QGIS. An additional component in this stage looked at the quality of the data that was collected. If the data were not accurate then how much data was collected and analyzed would not really matter. This is why an academic evaluation of the quality of the OpenStreetMap data took place (Ref 7).
Section 4: Two Community Approach Indonesia contains both broad sprawling cities and spread out rural areas. Initially it was thought that these different types of geographies would require a different approach. For rural areas ACCESS and other facilitators were trained and for urban areas students from local universities were enlisted. Close to the end of this OpenStreetMap pilot in Indonesia we tested the combination of the two methodologies by partnering with the regional disaster management agency (BPBD DKI Jakarta) to host mapping workshops with Kelurahan (village) representatives.
4.1 Rural Area Initially HOT performed eight “Introduction to OpenStreetMap” workshops in ACCESS districts, two in PNPM Generasi (an Indonesian government poverty reduction program) districts (Ref4.4) and one with Mercy Corps (Mercy Corps is working on a AusAID funded ‘build back better’ project in Padang) (Ref 4.4) to show how they could collect geospatial information with easy to use tools and methodologies. HOT initiated 2 training teams consisting of 1 international expert and 1 University of Indonesia GIS student proficient in English. This provided the opportunity for the teams to cover more groups.
2http://www.qgis.org/

10
However with only 2 trainers (and one that can speak Indonesian) it was best to keep the workshops under 15 participants. One of the main concerns in this pilot was addressing if OpenStreetMap, an Internet based spatial data store could be used in rural areas; did the participants have access and have the necessary technical ability to create digital maps? The answers are outlined in Section 5.
4.2 Urban Approaches The urban component of the OpenStreetMap evaluation began with a mapping competition held in Jakarta, Yogyakarta, Bandung, Surabaya and Padang (Ref 6.1). A one-day OpenStreetMap workshop was held at the respective partner University for that city. Universities included Universitas Indonesia, Universitas Gadjah Mada, Institut Teknologi Bandung, Institut Teknologi Sepuluh Nopember, and Universitas Andalas. After each workshop the students were then given six weeks to map as much as they could. A winner from each University was announced and a prize awarded. Later an additional approach was tested in Jakarta. Students from the University of Universitas Indonesia were trained as mapping assistants and then helped facilitate workshops with village leaders to map critical infrastructure. This additional methodology made the rural and urban methods begin to show more similarity than initially anticipated.
4.3 Toolsets for Urban Versus Rural Collection The OpenStreetMap initiative has many methodologies in collecting, adding, and editing data to OpenStreetMap, however the training team specifically looked at the techniques that provide minimal reliance, but maximum collection. Therefore the tools utilized for urban and rural collection were quite similar, they are:
• Walking Papers3 – A website that allows user to print a map which can then be marked. The annotated paper can then be used as a guide in an OpenStreetMap editor. This allows tracing and easy entry of the marks that have been made by pen.
• GPS units – HOT provided each community with a GPS for the length of the OpenStreetMap Pilot. GPS allows collection of location information when satellite imagery is not available.
• Java OpenStreetMap Editor(JOSM) 4– for adding (through imagery tracing, walking papers and GPS points and tracks) and editing of the data. The software was selected because it supports international translation and works well offline.
• Potlach2 web-editor – Internet based editing software, similar to JOSM, however can only be used when one has access to constant Internet access, some of the students do prefer to use this web-editor but they also have the luxury of reliable Internet.
For utilizing the data, Quantum GIS (QGIS) software was taught. ACCESS facilitators were trained in how to produce poverty maps with it and students utilized it to produce paper maps for the DKI Jakarta mapping events. QGIS is also the platform that has been chosen for the creation of InaSAFE the exposure modeling system being built by AIFDR and GFDRR. This allows some efficiency in sharing of the base translation of the software and creation of training materials.
3http://walkingpapers.org/ 4http://josm.openstreetmap.de/

11
4.4 Additional Communities Trained As mentioned two groups from PNPM attended a 2 day workshop in Waingapu and Mataram, the facilitators were able to learn the concept of OpenStreetMap and during the workshop were able to collect data with a GPS and add it to OpenStreetMap. However their technical skills were more varied than ACCESS. PNPM’s current data collection methodologies consist of collecting data entirely on paper. In Waingapu the majority of the facilitators were volunteers from local villages and they had never used a computer before. PNPM decided they did not have time to do a larger pilot quickly, hence no other communities were trained. Mercy Corps is overseeing an AusAID funded project to rebuild homes damaged by the earthquake that occurred in 2009 in Padang. As part of their monitoring and evaluation they wanted to include a mapping component. Originally the Private Datastore (Ref 8.2) that HOT built was designed to be used by Mercy Corps, but their requirements of the tool became too complex to have prepared in a timeframe that would be useful for Mercy Corps. Mercy Corps instead contracted with a local company to build a data management tool that does not have a spatial component.
Section 5: Mapping with ACCESS Facilitators ACCESS has been a key part to the success of this community mapping project, it has allowed for the development and testing of training manuals, software and mapping techniques. Although the ACCESS program is not directly related to disaster reduction, the communities are still collecting the same information that a disaster manager would need to know, from where people work and live to the structures they dwell in. The ACCESS facilitators work in villages to help the residents understand the poverty in their area and then determine what sort of actions they want to take about it. One step of this initiative is to have adetailed poverty maps, outlining where people live and work. The maps created before OpenStreetMap workshops had no geospatial aspect to them and could not be accessed by anyone outside of the community. This means the information they were collecting could not be compared or visualized alongside other geospatial information and could not be shared. There were some ACCESS districts utilizing QGIS already, but without an OpenStreetMap component. The districts were hosting the information themselves on hard-drives, so there was some potential of data becoming lost. HOT began working with the facilitators in March 2011 to see if helping them perform digital mapping was beneficial to their work. In addition to the initial eight 2 day workshops, HOT performed two 5 day intensive workshops with Dompu and Bima. Over the course of all the ACCESS works a total of 126 people were trained, 68 men and 56 women. The training spanned from June to December 2011.
5.1 Initial Workshops with ACCESS The goals of these workshops were to teach an introduction to OpenStreetMap in order to assist HOT in determining what modifications of OpenStreetMap technology would be useful to ACCESS’s program. Additionally it would allow facilitators to determine if mapping with OpenStreetMap could be useful to their work in the first place. Each workshop was two days but the content of the workshops changed over the course of the pilot as the needs of the facilitators were better determined.

12
The key items learned during initial training: • There was a big concern about putting all of the information they gathered on the internet, as
certain attributes could be seen as private (House Hold income etc) • The need for more detailed training manuals in Indonesian. • The translation of the OpenStreetMap software • The need for an OpenStreetMap support system in Indonesian
These items were addressed through the enabling better data collection (Ref 8.2), training manuals and translation of tools (Ref 9.1) and online community (Ref 9.2). It was also identified at the initial training that there were three major factors (other than the one listed above) that allowed participants to start using OpenStreetMap in their day-to-day jobs/live:
• Access to Computers and Internet: Generally most ACCESS facilitators could access a computer and their office had internet (although not reliable).
• Technical skills: Participants that were already proficient in creating maps in CorelDraw relatively easily switched to OpenStreetMap, some that were creating hand-drawn paper maps had more difficulty.
• Access to Satellite Imagery or GPS units: When the workshops initially occurred only about half the locations had satellite imagery available. This therefore relied on GPS units to be the sole collector for the reference data such as roads and large infrastructure, after this is collected walking papers could be use to gather the rest of the information (Ref 5.2). One GPS units was provided to each community for the length of the pilot, however to keep up the enthusiasm in these areas multiple devices should have been provided. Different offices did create a rotation scheme for the units, but by the time so individual were able to have access they may have already forgotten the process.
5.2 Initial Mapping of Two Villages of Sumbawa
5.2.1 Week intensive workshop After initial workshops HOT, AIFDR and ACCESS decided that there was a need to do a practical mapping exercise, to determine what potential data collection workflows would look like. Hence the two HOT teams returned back to the first communities taught in OpenStreetMap; Bima and Dompu located on Sumbawa Island. Talabiu5 was chosen in the Bima Regency and Lanci Jaya6 was chosen in Dompu. The difference between the two villages was that Talabiu had high resolution satellite imagery and Dompu did not, so in Talabiu satellite imagery would be used and in Lanci Jaya the primary tool would be GPS. At the end of the week both groups were able to map all of the buildings in the target area and attach information to them. Since this initial exercise Dompu has mapped 10 additional villages using these techniques and the local government has promised financial support for these mapping activities. During the weeklong exercise purely structural building information was collected. As suspected the private data issue was again highlighted, and unfortunately at this stage of the pilot it was not available for testing, hence during the interim the HOT team provided support to set up an Excel template to manually add the private data. The OpenStreetMap IDs were written into Excel spreadsheets by hand,
5http://osm.org/go/tyV5L869t- 6 http://osm.org/go/tyVcSZeY

13
this allowed the poverty information to have the spatial component of OpenStreetMap but not be public on the Internet. The data from Excel could then be joined to the geographic data from OpenStreetMap in QGIS to create a map.
5.2.2 Private Datastore training In November 2011 HOT returned to Dompu and Bima again to teach how to separate public data from private using the Private Datastore (Ref 8.2), as well as how to rejoin it for analysis in QGIS. The Private Datastore was intended to replace the previous methodology involving Excel for private data collection. One of the difficulties however was to convince the facilitators to switch to the Private Datastore. The familiarity of Excel made it appealing to them for collecting information. Collecting large amounts of information in spreadsheet files is problematic for data retention and sharing, however. To ensure wider acceptance of the tool in other areas a few steps should be taken:
• Introduction of the Private Datastore initially as the way that private data is collected with OpenStreetMap
• Improve methods of setting up projects in the Private Datastore so there is less reliance on HOT staff
• Create a reporting mechanism that ensures data can more easily be retrieved from the Private Datastore
• Have training in specific data analysis methodologies as part of the introduction to the Private Datastore. This will ensure trainees understand the power of collecting the data with this method.
5.2.3 Evaluation The final workshop in Bima and Dompu occurred in January, 2012. Both regions felt they were capable of continuing to map on their own with remote support. One individual from LESPEL (the ACCESS partner in Dompu), stated that mapping has become “just something I do when I have some extra time.” With this sort of contribution there is no reason to think that mapping won’t continue in Dompu. This workshop was used as a time to define the work flows already being used by both groups for data collection. The two groups had come up with slightly different methodologies, but both were allowing them to collect the necessary data for their projects. Bima has begun using the Datastore designed for collecting private data, but Dompu is continuing to collect data and link it to Excel. Using Excel is more labor intensive, but LESPEL had already collected a significant amount of data that way and will begin switching to the Datastore. This switch is slower than in Bima, but more time had been invested in the Excel methodology. Additionally SOLUD (the ACCESS partner in Bima), had begun using the mapping skills they had been taught in different ways. They had collected all of the local government project locations and then imported that information into QGIS to prepare it for use in web-browser based visualization program called Stats Planet. Stats Planet was used to create a dashboard. The local government used this platform to visualize their project locations, and the costs related to each project (Figure 3). The training of individuals from both Dompu and Bima has also served to provide a support base for those mapping in other areas. These areas have begun providing assistance through the OpenStreetMap online community (Ref 9.2) when others ask mapping related questions.

14
Figure 1 workflow in use in Dompu
Figure 2 workflow in use in Bima

15
Figure 3 Screenshot from dashboard made by SOLUD for the government of Bima
5.3 Community Mapping Sustainability Workshop In March 2012, the coordinator of ACCESS asked representatives from HOT, AIFDR, ACCESS, SOLUD, Mitra Turatea (an ACCESS partner in South Sulawesi), and Gesellschaft für Internationale Zusammenarbeit (GIZ is a German Development NGO) to attend a workshop to determine the next steps in mapping Eastern Indonesia and creating a sustainable methodology to enable all communities to use OpenStreetMap and the private datastore (Ref 8.2). The day began with everyone presenting what they have achieved so far in their area. All participants minus Mitra Turatea were using OpenStreetMap as their collection tool. Mitra Turatea are interested in learning OpenStreetMap but are currently using QGIS, ACCESS facilitators offered to assist Mitra Turatea to learn OpenStreetMap. The groups then designed a generic team for a mapping project, including the required skills of team members and how the process would proceed. Two teams were designed: a village team and a facilitator team, the latter would require advance technical skill sets to be able to perform the mapping. The facilitator team would be at a district level, where their main objective is to oversee the Village Team, provide support and add all the information into OpenStreetMap. The village team would gather the information through Walking Papers, GPS units and tables and provided the necessary local knowledge required to collect accurate information. Each time should have the following people and or skill sets: Facilitator Team Skills
● OpenStreetMap ● Surveying (both geospatial and social surveys) ● GIS (such as map making in QGIS)

16
● Training (experience teaching others) ● Community development and engagement ● Conflict Resolution ● IT Skills
Village Team
● Survey tools (GPS, survey forms) ● Community Development ● General Idea of OpenStreetMap and map reading
ACCESS plans to continue the OpenStreetMap mapping program utilizing the outline created at this workshop. They will also continue to utilize the tools and materials created and translated. They are already contracting individuals to support them and further train the facilitators. For poverty mapping they think that OpenStreetMap has shown to be a valuable tool.
Section 6: Methodologies for Mapping in Urban Environments
6.1 University Competition At the beginning of this Community Mapping Pilot there was a clear partner that would be able assist with mapping urban areas. In rural areas the community facilitators’ incentive to map in OpenStreetMap was to create a more efficient and streamlined workflow for them. However in urban areas we needed to create incentives, it was decided that there would be a University competition where students would compete against their fellow students to win a trip to the United States to attend the State of the Map and Free and Open Source Software for Geospatial (FOSS4G) conferences in Denver, Colorado. Each university would have one winner. Five universities were involved in this competition; Universitas Indonesia (UI), Universitas Gadjah Mada (UGM), Institut Teknologi Bandung (ITB), Institut Teknologi Sepuluh Nopember (ITS), and Universitas Andalas (UNAND). The students were not only tasked to digitize buildings, but to also collect building information such building structure, wall type, roof type and the number of floors. Hence the students must visit each building.
6.1.1 The process of the competition 1) A one-day workshop at each of the 5 universities. The workshop consisted of OpenStreetMap
introduction, the requirements of the competition, potlatch2 and JOSM editing tools, an introduction to the online OpenStreetMap community.
2) The contest ran for six weeks, during that time the HOT team monitored the data entry and provided feedback on KompetisiOSM7. One example at the beginning of the contest some individuals were classifying the types of roads incorrectly, so a blog post was posted providing instructions on the proper way to do that
7http://kompetisiosm.org/
17
3) The contest was scored in a simple manner. For every building mapped with structural information students received 5 points and for anything else that was mapped they received one point
4) Students were also encourage to use other social media set up for Indonesia OpenStreetMap (Ref 9.2).
5) In the last week of competition the data collected was randomly checked for accuracy (especially the students that were seen to be leading) to check their accuracy. Students were specifically asked about their data, one example a student had mapped 2 buildings where there only seem to be one on the imagery, but it turned out that though the buildings shared a roof they each had a separate set of walls.
6) Once the data was verified through this method the winners were announced and began the process of preparing to travel to the United States for State of the Map and FOSS4G.
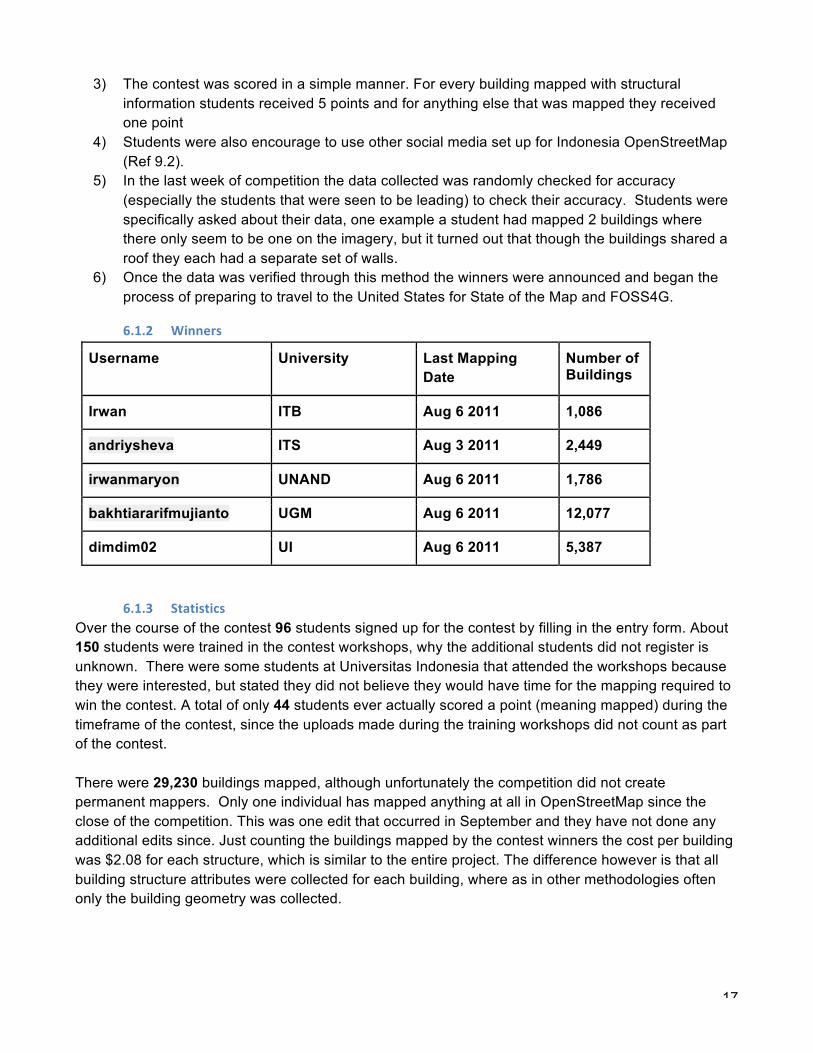
6.1.2 Winners
Username University Last Mapping Date
Number of Buildings
Irwan ITB Aug 6 2011 1,086
andriysheva ITS Aug 3 2011 2,449
irwanmaryon UNAND Aug 6 2011 1,786
bakhtiararifmujianto UGM Aug 6 2011 12,077
dimdim02 UI Aug 6 2011 5,387
6.1.3 Statistics Over the course of the contest 96 students signed up for the contest by filling in the entry form. About 150 students were trained in the contest workshops, why the additional students did not register is unknown. There were some students at Universitas Indonesia that attended the workshops because they were interested, but stated they did not believe they would have time for the mapping required to win the contest. A total of only 44 students ever actually scored a point (meaning mapped) during the timeframe of the contest, since the uploads made during the training workshops did not count as part of the contest. There were 29,230 buildings mapped, although unfortunately the competition did not create permanent mappers. Only one individual has mapped anything at all in OpenStreetMap since the close of the competition. This was one edit that occurred in September and they have not done any additional edits since. Just counting the buildings mapped by the contest winners the cost per building was $2.08 for each structure, which is similar to the entire project. The difference however is that all building structure attributes were collected for each building, where as in other methodologies often only the building geometry was collected.

18
6.1.4 Future Competition At first glance, this part of the pilot project did not produce the desired outcome; 1. active OpenStreetMap members and 2. a large quantity of buildings mapped by each participant. However it did show that buildings with structural information could be successfully gathered and is proven to be accurate (Ref 7). If there was a need for this type of dataset to be quickly gathered, university students can be recruited. However there could be some simple steps to encourage more participation and active members as well as less financial outlay:
• Sponsorship: For the competition to be organized by the community and sponsored by Indonesian companies.
• Small awards during and at the end of the competition: At the beginning of the competition there were many students mapping, however when there was a clear leading student, other students became discouraged. Hence in a future competition it would make sense to have mid-level incentives (from mobile credit to GPS units) so that it wasn't all or nothing for winners. For example having small awards for individuals that mapped 250, 500 and 1000 buildings would be a reasonable way to encourage mapping by more students. Another approach could be having awards by week, so there would be potential for win prizes halfway through the contest.
• Other changes to the rules could further assist to increase the amount of information collected, such as creating bonuses for completely mapping entire areas.
• Better technology surrounding the measurement of the contest: this could also encourage more work. The number of points per student was only updated once a week, so to encourage a more active competition it would be better if this information was refreshed daily or hourly. This would require more technical infrastructure to be created before the beginning of the contest.
• One competition (not a winner per university): a change in the base rules would benefit more competition as well. A better contest would be to have one overall competition combined with mid-level prizes to avoid the disparity present in the previous competition. For example the winner from UGM collected 12,077 buildings as compared to the winner from ITB only collecting 1,086.
• Contest period longer: Making the period of the contest longer could make this approach more sustainable.
• Team collaborations: Another possibility would be to allow formation of teams to encourage community building around the OpenStreetMap data rather than one completely about competition.
Universities could also be approached to encourage their students to incorporate OpenStreetMap into their research thesis and other assignments. Scholarships could potentially be provided. If students were to integrate OpenStreetMap into their projects they would more likely keep mapping after their project is over.
6.2 Mapping Jakarta with BPBD DKI Jakarta is pioneering new ways to prepare for future disasters by understanding the potential impacts of floods on Jakarta’s people, key infrastructure and assets. DKI Jakarta’s Disaster

19
Management Agency (BPBD) with the assistance of the National Disaster Management Agency (BNPB) is developing a detailed scenario that estimates the impact of future flooding to people, schools, hospitals, and other important buildings. The resulting scenario will provide BPBD DKI Jakarta a vital dataset for anticipating the impacts of future disasters and for informing contingency planning. The first step in understanding the potential impact of a flood is to know and map where all of the people, important buildings and logistic hubs are located. The intention is to collect this critical data once and then make it freely and easily available to everyone. In this way the information can be used for contingency planning as well as a huge range of spatial planning and development issues. BPBD DKI Jakarta and BNPB, with assistance from AIFDR, United Nations Office for the Coordination of Humanitarian Affairs (UNOCHA), Global Facility for Disaster Reduction and Recovery Labs, World Bank, Humanitarian OpenStreetMap Team, and University of Indonesia held workshops in each of Jakarta’s 6 Districts in order to help Village Heads map their community boundaries and major infrastructure. The major infrastructure mapped during this project:
● Government Offices (At all levels of government) ● Health Facilities (Hospitals and Clinics) ● Schools (Kindergarten, primary and high school, college and universities) ● Place of Worship (including type of religion) ● Sports Facilities (for evacuation centers) ● Fire Stations ● Police Stations ● Major Roads
Each of these locations were also attribute with name, address, number of floors. Additionally all of the sub-village boundaries (Rukun Warga-RW) were mapped (which has never been done comprehensively before) and additionally tagged if the area was flooded in 2007 (the last major flood in Jakarta). The components of the month long series of events were:
● Training of 70 University of Indonesia students in OpenStreetMap editing ● Creation of maps for the Lurahs to gather information about their areas before workshops ● Workshops for UI students and Lurahs to meet and work together to enter information about
each village. 6 workshops were held, one for each of the districts in Jakarta (the thousand islands workshop was held at AIFDR), regions of the province of Jakarta.
● Clean-up days for students to fix mistakes ● Final presentation by the Governor of Jakarta of printed maps back to the Lurahs to use in their
communities Over 500 representatives from Jakarta’s 267 Villages participated in the workshops – and have mapped an impressive 6,000 buildings and all 2,668 RW boundaries. Given the huge success of this workshop, AIFDR is working with BNPB to examine the feasibility of replicating this work in other high-risk parts of Indonesia.
20
6.3 Remote Mapping with Broader OpenStreetMap Community One of the powers of OpenStreetMap is the global community. After the 2010 earthquake in Port-au-Prince Haiti over 600 individuals utilized satellite imagery to create a very detailed map of the earthquake-affected area in a short period of time. This same community was mobilized to help digitize Padang City, this time for preparedness rather than response. Padang City is still rebuilding after a 2009 earthquake and is at high risk of another event in the future. Originally satellite imagery was bought for the area to enable the university mapping competition, but after the competition was completed most areas of Padang were still unmapped. This was used as an opportunity to put a call out to the OpenStreetMap community to help fill in the gaps and to also test the Tasking Manager (Ref 8.1).
Section 7: Data Accuracy Evaluation Throughout the pilot project it was always a concern that the collection data techniques did not have the same quality or accuracy as government dataset. Dr. Trias Aditya from Universitas Gadjah Mada led an evaluation of the quality of the road and building geometry and attributes8. This work built on a similar project led by Dr. Muki Haklay at the University College London9. The OpenStreetMap quality assessements were done against OpenStreetMap University Competition data in all 5 cities (Ref 6.1) as well as Mercy Corp collection in Padang and ACCESS collection in Dompu. The evaluation activities were conducted in six cities known to be a disaster-prone area in Indonesia: Yogyakarta, Surabaya, Jakarta, Bandung (only for Univeristy Competition), Padang (for both Univeristy Competition and Mercy Corp), and Dompu (for ACCESS collection). The evaluations were conducted by comparing the OpenStreetMap datasets with reference dataset (from field surveys or another existing reference datasets). The methods of evaluation consist of spatial accuracy; attribute accuracy, and contributor evaluations. The spatial accuracy evaluations for the Buildings feature of OSM dataset were conducted using three measures: polygon areas, circularity ratio, and centroid near-distance analysis, while the evaluations for Roads feature from OSM dataset were evaluated using Buffer-overlap and Line-Length Completeness analysis. Geometries and spatial attributes were classified into bins for analysis as very bad, bad, medium, good and very good. The results were varied between geometries of buildings and those of roads.
● Geometries of the building information collected in both the contest areas and community areas were not significantly different than the ground-truthed and reference data.
● The spatial attributes of roads were varied geographically. Good results were found in both Yogyakarta and Dompu, but in other areas the distribution of the very bad, bad, medium, good and very good “appeared equally distributed.”
During the University Competition students received five points for every building mapped with attributes of roof-type, wall-type, construction and usage. In areas where HOT worked with community
8Evaluation of OpenStreetMap Data in Indonesia (Case Study: Yogyakarta, Surabaya, Jakarta, Bandung, Padang and Dompu) Department of Geodetic and Geomatics Engineering, Faculty of Engineering, UGM 8http://povesham.wordpress.com/2009/11/07/linus%E2%80%99-law-and-openstreetmap/

21
facilitators collection of these attributes was taught as well. AIFDR was interested in the attributes for impact modeling and the community facilitators felt that construction information was important to have accurate information for these poverty maps.
● In Padang, Yogyakarta, Surabaya, Jakarta and Bandung the attribute quality was of medium quality.
● The attribute quality in Dompu was of not good quality, they were either not completed or not accurate.
The issue with the data in Dompu is actually that the majority of the attributes are not filled out, not that they are inaccurate. As mentioned previously the ACCESS facilitators in Dompu gather the spatial data in OpenStreetMap, but linked the data with an OSM ID to an Excel template. Therefore it is recommended that when the Excel document is transferred into OpenStreetMap and the Private Datastore, a new evaluation be conducted. From the analysis of the evaluation it can be determined that the geometries of the building information collected in OpenStreetMap could be effectively used for analysis. The road information and the attributes of the building information would need further verification to be useful however. Another smaller study evaluating the training materials should be performed to determine if there is a way to increase the accuracy of the building information. The road information was already there in many cases and mappers need to be taught to more proactively fix issues in the quality of the road data as they come across them.
Section 8: Software to Support Mapping in the Indonesian Context Two new pieces of software were written as part of the pilot. Each one served to fill an important hole in the existing OpenStreetMap software stack. The first solution, called the Tasking Manager, allows for coordinating a large group of mappers. Secondly the Private Datastore was created for communities that were gathering not only public data but also private, previously there has been no software designed to address this issue.
8.1 Tasking Manager Tasking Manager allows division of a geographic area into discrete tasks by square. An administrator defines what mapping tasks are to be completed in each square. An example task would be to instruct someone to trace all of the roads in an area or verify the locations of all of the hospitals. The 2010 earthquake in Haiti was the impetus for such a piece of software. After the earthquake in Haiti hundreds of volunteers wanted to help, but it was difficult for them to figure out what areas had not been mapped and where to focus their efforts. The Tasking Manager was created as an easy way for someone to pick a discrete area to work on and know that it was useful and nobody else was working on it. This ability has proved useful many times since the creation of the Tasking Manager where it has been primarily used for organizing mapping preparedness.

22
Figure 4. Screenshot of the Tasking Manager Website
8.1.1 Tracing of Purchased Satellite Imagery of Padang Satellite imagery of Padang City was purchased to facilitate University of Andalas’ participation in the university mapping competition. After the competition was finished the majority of Padang remained unmapped. A task was put into the Tasking Manager and the greater OpenStreetMap Community was asked to help trace roads and buildings. 79 individuals completed squares in the area and 27 validated them. As of March 25th 62,685 buildings were mapped in Padang, more than any other single city in the rest of Indonesia. Currently there is not a local group mapping in Padang, so these are just the geometries of the buildings without attribute information.
8.1.2 Remote and on-‐the-‐ground Mapping in Kupang Individuals from the Deutsche Gesellschaftfür Internationale Zusammenarbeit(GIZ) had found out about the OpenStreetMap work in Indonesia at the beginning of the pilot study. They began using training materials as they were made available and were interested in the Tasking Manager software. A task was made for Kupang and both those working in Kupang and volunteers from elsewhere have worked together to trace satellite information and those situated locally add additional information. Just under 50% of the tiles have been completed, however the completed section covers the entire southern coast.
8.1.3 Three Day Mapping Workshop in Sumba The same individuals from GIZ that were working in Kupang hosted a three-day OpenStreetMap mapping workshop in Sumba. They utilized the Tasking Manager to coordinate the mapping effort.
8.1.4 Coordination of Student Training for Mapping Jakarta Before mapping DKI Jakarta, the student workshop used the Tasking Manager to help people distribute their mapping efforts. This reduced the issue of people adding the same features and also creating editing conflicts that would have to be then resolved.

23
8.1.5 Quality Control Checks of Mapping of DKI Jakarta The scale of the Mapping Jakarta event was larger than anything that had been attempted in OpenStreetMap before. There was a need to review all of the data entered for accuracy, especially the RW boundaries that were mapped. The tasking server allowed DKI Jakarta to be divided up into squares and two different people to evaluate the quality of the data in each square. This allowed the review process to be more focused and to ensure that all areas were reviewed.
8.2 Private Datastore The goal of the Private Datastore was to have a way of helping people who were willing for some of their data to be open and publicly available, but had additional information they did not want to make public. When training first began with ACCESS it became readily apparent that communities in Indonesia saw no problem putting infrastructure information into OpenStreetMap, but poverty data was more sensitive and not something to make available to the public. Additionally poverty data doesn’t really fit into the type of information OpenStreetMap contributors typically collect anyway. To alleviate this problem the Private Datastore was built. As stated previously Mercy Corps in Padang was to be the initial pilot of the Datastore, but their data collection needs proved too complex for the initial pilot of this new tool. The Private Datastore was designed to build upon already existing tools that community facilitators were using with OpenStreetMap. The software consists of two components:
• The Private Datastore itself, which both holds all the data uploaded to it and has an interface for users to enter private information to be saved in the datastore.
• A plugin for JOSM that determines which data is uploaded to OpenStreetMap and which data is uploaded directly to the Private Datastore. This allows users to enter information in one place, rather than splitting their data entry between JOSM and Excel
Every item in OpenStreetMap has a unique number associated with it. The Private Datastore works is by linking additional information to the OpenStreetMap data by utilizing this OpenStreetMap ID. By providing this automatic linking it helps to avoid mistakes caused by manual linking of information using tools such as Excel. Currently the Datastore is being utilized by SOLUD, an ACCESS party in Bima to perform detailed poverty surveys. Teams in Dompu have been trained in the Private Datastore but continue to use Excel and JOSM together to record both public information in OpenStreetMap and private information about poverty. The key features of the Private Datastore that allows it to improve the quality of data entry of poverty data are:
• Integration with tools that OpenStreetMap users are already familiar so it can quickly fit into workflows
• A web interface that allows updating of just the private data. This method of update is more simple to use, so it will be possible for those that are not proficient in OpenStreetMap to help keep data up to date
• Separate security handled by an administrator so ensure only authorized people obtain access to private information
• Takes the details of linking OpenStreetMap data and poverty data away from the user, so that less mistakes are made.

24
Figure 5. Screenshot of the Private Datastore Website After initial trial of the Private Datastore tool it was highlighted that additional features need to be built for the tool in order to be received by a wider audience. Features that will enhance the tools uptake:
• Easy deployment to Linux servers. This will allow NGOs and government with an IT staff to easily run their own instance of the Private Datastore if they desire.
• Adding a “one to many” relationship between OpenStreetMap features and Private Datastore information. This will allow household information to be collected for buildings that have more than one family living in them.
• Addition of security groups between projects on the same instance of the Private Datastore. This will allow multiple groups to use the Private Datastore so the burden of administering will not be placed on each individual group.
Section 9: OpenStreetMap Indonesia
9.1 LearnOSM.org and Translations of JOSM Additionally during this time software and training materials were further developed and translated as well. The training materials that began as a general overview of OpenStreetMap were modified to be more focused on ACCESS’s facilitators, who were already very familiar with maps and just needed to know how to apply their mapping knowledge to OpenStreetMap.

25
9.1.1 LearnOSM.org Website LearnOSM is a website designed to introduce interested individuals to OpenStreetMap. The chapters and themes used to introduce OpenStreetMap come directly from the lessons learned during the initial ACCESS trainings. Originally the LearnOSM.org website was developed as a weekend project during the pilot study. Later further development of curriculum became part of the community mapping pilot. The basic audience for LearnOSM is community facilitators already familiar with hand-drawn maps. This base knowledge is then used to build skills until the person using the materials can create digital maps on their own utilizing OpenStreetMap and QGIS. LearnOSM is currently divided into two sections, “Beginning OpenStreetMap: A Field guide for Everyone” and “Beginning QGIS.” Topics covered by LearnOSM:
• Introduction to using maps as a tool to ask questions • Obtaining an OpenStreetMap user id • GPS usage • Using Walking Papers • Beginning and advanced editing with JOSM, a OpenStreetMap editor • Making maps with QGIS • Performing basic analysis with QGIS
Originally released in English and Indonesian the guide is now available in six languages. Other OpenStreetMap communities saw the value of the guide and translated it so they could use it in their own projects. The additional languages now available are Japanese, Polish, Italian, and Portuguese.
9.1.2 Translation of JOSM into Indonesian Over the course of the pilot the majority of desktop OpenStreetMap editor JOSM was translated into Indonesian. By translating JOSM it allow Indonesian users to become more familiar with the tool, enhancing their learning experience.
9.2 Digital Community OpenStreetMap Indonesia Significant effort was made toward creating a digital community of OpenStreetMap contributors in Indonesia. This was done through blogging, creation of a portal (openstreetmap.or.id), Twitter and Facebook, additionally the “talk-id” OpenStreetMap mailing list was used. The purpose of this was to engage people who did not already know about OpenStreetMap as well as provide community support to those already using it.
Platform Address/URL Metric
Twitter (@osm_id) http://twitter.com/osm_id 115 Followers
Facebook Group http://facebook.com/groups/osm.id/
150 Members
Website Visitors http://openstreetmap.or.id 293 Unique Visitors Last Month
Mailing List (talk-id) [email protected] 97 Subscribers

26
9.3 Outreach Outside Indonesia In addition to online outreach within Indonesia there were additional stories written to let the rest of the world know about the project. AusAID wrote a story for their website about the mapping efforts in Dompu and Bima during the week long mapping exercise. Interviewees for this story explained why community mapping is useful.10 HOT updated their blog throughout the project, which served multiple purposes. The first purpose was to update the rest of the HOT group about the progression of the project, which helps encourage continued mapping in Padang11. Secondly it helped ensure that others coming to work on mapping in Indonesia were more likely to know about the ongoing work. Key in having many people contribute to the same map is that people know about it. Posts in HOT’s blog consist of specific workshops that have been conducted as well as specific themes that may interest groups such as community mapping12 and the mapping of DKI Jakarta13. These posts can serve as rough drafts for future white papers to show how OpenStreetMap might apply to other projects.
Section 10: Presets and Symbols for Indonesia The default OpenStreetMap cartography is based on traditional British national maps as are the presets data entry forms in the JOSM Editors. The symbols and presets were not very culturally relevant to Indonesia. For example there are many fuel stations for motorcycles in Indonesia, which are small kiosks where one would buy a liter of fuel, not a large station for filling up an automobile. The difference in the two types of features for instance deserves a different symbol. To resolve this issue a designer was brought to two ACCESS workshops to collect information on what types of icons would be more relevant to Indonesia. By performing icon exercises with the workshop participants the designer was able to get feedback on what types of icons would make sense to people as well as show them how to evaluate what makes a good icon, meaning one that is easily understood and recognizable. The symbols are now available on the online webmaps at OpenStreetMap.or.id and as a symbol pack available for QGIS. Additionally custom presets were created and translated to assist in data collection. A preset is a custom data entry form which provides guidance as to what type of information is wanted for each item being mapped. The first custom preset was for the collection of building information for the university competition, this preset was later used in ACCESS mapping workshops as well. A second custom preset was developed specifically around the mapping of DKI Jakarta, all of the features for collection were predetermined and then translated into a preset.
10http://www.ausaid.gov.au/country/indonesia/mapping.cfm 11http://hot.openstreetmap.org/updates/2012-01-10_hot_collaboration_with_gis_corps 12http://hot.openstreetmap.org/updates/2012-03-12_creating_sustainable_community_mapping_projects_workshop 13http://hot.openstreetmap.org/updates/Jakarta_best_community_mapped_for_preparedness

27
Figure 5 An example preset for hospitals from DKI Jakarta Mapping
Section 11: Integration of OpenStreetMap Data with InaSAFE One of the key purposes of the evaluation of OpenStreetMap data in Indonesia was to test the usage of the information in InaSAFE, the free software that produces realistic natural hazard impacts scenarios for better planning, preparedness and response activities. InaSAFE was conceived and initially developed by the BNPB and AusAID, through AIFDR, the World Bank and GFDRR. One of the main desired outputs was the ability to bring the OpenStreetMap information into InaSAFE and then be able to run a scenario. A scenario is an estimate of what would happen if an event (flood, earthquake, tsunami, etc)was to occurr. During the University Competition (Ref 6.1) the students gathered information about the building structure, InaSAFE was then used to analysis this information with the ground shaking to determine which buildings would be damaged or collapse during an earthquake utilizing engineering expertise (Figure 6). Mapping Jakarta with BPBD (Ref 6.2) enabled InaSAFE to determine how many Schools, Hospitals, Government Buildings would be affected by a hazard (Figure 7). A PostGIS database was set-up to sync daily the OpenStreetMap data, this database has been made accessible to AIFDR and BNPB so they can utilize it in conjunction with InaSAFE. The purpose of the database is to make it easy for those interested in using the impact model be able to easily access the data and all its attributes.

28
Figure 6 In the event of Sumatran fault magnitude 7.8 scenario how many OpenStreetMap buildings might be damaged depend in building type (English).
Figure 7 In the event of similar flood to 2007 (by RW administration boundary) how many types of OpenStreetMap buildings will be within the impact zone (Bahasa Indonesian).

29
Section 12: Actual Cost of Mapping The premise of using OpenStreetMap for mapping for exposure data is that the data will be more detailed, more up to date and more cost effective. As of March 26th 163,912 buildings had been mapped in all of Indonesia. The total cost of the pilot was $294,910 so the breakdown of cost was roughly $1.80 per building. $107,000 of the grant was for development of software however and that cost will not need to be included in future estimates since the software has already been developed. Removing the cost of the software development the expected cost per building for next year would be $1.15.
12.1 University Competition Costs The total cost of the University Competition was $14,500. During this time 27,871 buildings were mapped. One unfortunate thing about the competition, however is that it did not entice people to become permanent OpenStreetMap contributors. If a similar contest was held again buildings would be mapped, but no continued commitment of permanent OpenStreetMap contributors would be likely to occur.
12.2 Community Mapping Cost in Dompu and Bima One of the greatest strengths of the community mapping program is that facilitators have a specific project for which they want to utilize OpenStreetMap. After initial training there is a purpose to the continued mapping and they are far more likely to continue than those that entered the competition.
12.3 Expected Ongoing Costs There are expected continuing costs to eventually have all of Indonesia mapped. The initial is providing access to intermediate and advance training materials as well as trainers so that projects in different geographic areas can begin. There are also the negligible costs of keeping servers to support the mapping projects running.
Section 13: Recommendations To continue the rapid growth of OpenStreetMap within Indonesia there are a few factors that need to be highlighted and rectified:
● Enhance the technical capacity of OpenStreetMap within Indonesia. ● High resolution satellite imagery is not available for all of Indonesia ● Robust methodologies for large scale mapping exercise, i.e. mapping DKI Jakarta.
13.1 Improving Technical Capacity After the series of workshops in Indonesia held over the past year there are many individuals and organizations that are familiar with both entering data into OpenStreetMap and utilizing the data. This experience should now be capitalized on by enhancing their knowledge with Intermediate and advance training, providing Indonesia with in country expertise. Additionally in order to ensure uptake, effectiveness and sustainability of OpenStreetMap it is necessary to create a comprehensive training package (beginner, intermediate and advance) as well as creating a pool of trainers across Indonesia. It is envisaged that this training material will be

30
endorsed by BNPB and will become a part of the training materials for disaster scenario development that can feed into contingency planning. This recommendation will be the basis of HOT next proposal to AIFDR to continue work in Indonesia. Additionally it would be very beneficial to see OpenStreetMap related workflows in BNPB’s preparedness and response cycles. After discussions with BNPB representatives there is a desire to create a deployable mapping team within the organization. An evaluation by HOT and MapAction should be completed in order to make recommendations on a training program that would create this.
13.2 Easy Paths for Obtaining Satellite Imagery and GPS Units In January 2012 Microsoft Bing updated much of their satellite coverage of Indonesia. However, the new imagery does not cover everywhere. Satellite imagery serves as the base of further mapping exercises and without it groups will have a difficult time getting started. It is possible to utilize GPS units alone without satellite imagery, but then there is an outlay of cost for GPS units. Lack of available satellite imagery hinders both preparedness mapping and response utilizing OpenStreetMap. For preparedness mapping, a fund should be created where organizations can propose mapping projects and obtain imagery for them. Only projects with a well designed plan and a basis in disaster preparedness would receive imagery through this methodology. HOT can additionally continue to expand its partnerships with imagery providers, to attempt to receive a portion of the imagery for free. Groups often do not need access to GPS units indefinitely. In many cases a base set of data could be collected and then Walking Papers utilized afterwards to add additional features. By providing a GPS Bank for borrowing organizations will be able to get the necessary start to being their disaster reduction mapping programs.
13.3 Improved Methodologies for Large Scale Mapping Events The DKI Jakarta Mapping Project (Ref 6.2) was a chance to explore the idea of mass mapping methodology through Government officials, there were many challenges with this process and with a little more forethought the process could be implemented in other areas with less resources. Within the next proposal HOT will assess different methodologies for mass mapping, from providing an area with an OpenStreetMap expert for a month to a compiling a team of students from the area to map all critical infrastructure in a week. JOSM presets (custom data entry forms; figure 5) can enable everyone to map the same attributes ideal for large scale mapping events; however only a small number of people in Indonesia know how to create presets, hence it is recommended that the next lot of training will incorporate the creation and maintenance of presets. It is also recommended that there in a webpage that allows people to upload and download presets used in Indonesia, hence allowing people to collect the same data. Preparing for mapping Jakarta with BPBD required a lot of map making and printing. Before each workshop a day of map making and printing was required to provide all 267 villages an initial map that they were able to draw on before the workshop. Additionally at the end professional maps were made for every village. By automating the map making process it would reduce resource and allow for shorter preparation time. Field Papers is an extension of Walking Papers which is being developed. It

31
has an atlas making function which could greatly simplify the output of the maps required to perform other large scale mapping events. However additional features need to be built into this tool to allow for uptake for large scale mapping events.
13.4 Re-‐evaluation of Manuals for Collection of Building Attributes Based on the results of the quality evaluation of the OpenStreetMap data it appears that mapping with community facilitators did not provide an effective methodology of obtaining building attribute information. In the cases of the University Competition it was only moderately effective in data collecting with the data shown to be of medium quality. Further evaluation of the manuals around the collection of this information should be undertaken and compared. This will determine whether the average person is unable to collect building information or if the materials describing the differences between the construction types were flawed. To further develop OpenStreetMap in Indonesia it will be important to ensure that all presets have a descriptive manual of how to collect each attribute. In addition these manuals should be tested after creation and then adjusted as needed. A robust evaluation will be required to ensure the sustainability of OpenStreetMap in Indonesia.
Section 14: Conclusion After careful evaluation, OpenStreetMap has shown to be a valuable tool for mapping in Indonesia. With assistance from facilitators, communities created fairly accurate maps of their country. These exercises helped reveal where gaps existed and helped initiate additional software for further support. The main achievements of this project are as followed:
• 163,912 buildings were mapped during the pilot study (June 2011 to March 2012) • Hosting of 10 training workshops with ACCESS (124 people in total) (Ref 5.) • Community facilitator groups on Sumbawa have continued creating their own village level
maps and begun assisting with workshops in other regions (Ref 5.) • Hosting of 6 training workshops with 5 different universities within Indonesia (Ref 6.1) • Completion of a university competition and winners traveled to Denver, Colorado in the United
States to attend FOSS4G (Ref 6.1.2) • Mapping of DKI Jakarta (Important buildings and sub-village administration boundaries) with
Government officials using materials created during the trial (Ref 6.2) • An evaluation of OpenStreetMap data was completed and results showed that OpenStreetMap
data in Indonesia was not significantly different than the ground-truthed and reference data. (Ref 7.)
• Creating of a tasking tool to coordinate mapping efforts, this tool has been since utilized in earthquake response in Turkey, mapping coordination in Haiti as well as in multiple projects in Indonesia (Ref 8.1)
• Creation of Separate Datastore tool to allow private information such as poverty indicators to be combined with OpenStreetMap data (Ref 8.2)
• Translation of OpenStreetMap software into Indonesian (Ref 9.1) • Creation of basic OpenStreetMap training materials specific to Indonesia (Ref 9.1) • Successful implementation of OpenStreetMap into InaSAFE (Ref 11)

32
As knowledge of OpenStreetMap spreads more groups will see the utility of using it in their work. However technical assistance will be required to begin new projects and hence it is necessary to create a comprehensive training package (beginner, intermediate and advance) as well as creating a pool of trainers across Indonesia. With assistance both community groups and government will be able to make OpenStreetMap their own. This will ensure a more complete and up to date exposure dataset of Indonesia with everyone contributing to the same map. To ensure the continued growth of OpenStreetMap:
• Create a robust team of trainers to assist in the implementation of OpenStreetMap projects within Indonesia.
• Compile additional training materials. Intermediate, advanced and “train the trainer” materials are necessary for sustainability.
• Modify the Private Datastore to make data collection easier. • Transfer online OpenStreetMap.id community tools to local support within Indonesia.
Over the last year a small team of trainers was able to introduce OpenStreetMap to many groups within Indonesia. In addition the LearnOSM website was able to provide the necessary information for others to teach themselves, successful introducing many people to OpenStreetMap. However to ensure uptake, effectiveness and sustainability of OpenStreetMap it is necessary to create a comprehensive training package (from beginner to advance and trainer material) as well as creating a pool of trainers across Indonesia. By enlarging the training team this will allow for further expansion of OpenStreetMap. The newly developed software has filled gaps in the OpenStreetMap toolset and made the system easier to use. The tasking manger has assisted the division of a geographic area into discrete tasks by square allowing for mass editing of the one area. The Private Datastore has helped groups that are unable to put all of their data online. However, there are a few features missing to ensure complete adoption of the Private Datastore; 1) is easy deployment, so that groups can run their own versions if needed, 2) feature allows multiple links to a single OpenStreetMap item, which would allow mapping of multiple families to a single building, 3) the addition of security groups must be created so that multiple groups can use the same version of the Private Datastore if they are unable to host it themselves. The online Indonesian OpenStreetMap community was seen to be an essential part to enabling users to assist and support each other, providing training materials, information about current projects and the latest hints and tips about editing in OpenStreetMap. To date Humanitarian OpenStreetMap Team has been running and populating these sites, to enable sustainability the community needs to turned over to a local partner or group of individuals to maintain it. By creating a robust support system, OpenStreetMap will continue to grow in Indonesia. To foster this growth the support needs to come from within country. By developing training material and trainers that will provide this support it will be possible for projects to further grow and new projects to develop. Further development of the Private Datastore will also foster this support system, but indirectly by making OpenStreetMap even easier to use by some groups. Finally hand-over of OpenStreetMap.or.id will allow any group to easily find out answers to questions and new issues, as well as solutions shared with the entire OpenStreetMap Indonesia community. Without this support Indonesian

33
OpenStreetMap will continue to struggle and not be able to become self-sufficient. Indonesian OpenStreetMap has already shown to be a useful tool in collection of exposure information, but by following through with the main recommendations it will ensure the continued growth and sustainability of OpenStreetMap in Indonesia.