community-owned fiber networks: value leaders in america
TRANSCRIPT
Community-Owned Fiber Networks:Value Leaders in America
The Harvard community has made thisarticle openly available. Please share howthis access benefits you. Your story matters
Citation Talbot, David, Kira Hessekiel, and Danielle Kehl. 2017. Community-Owned Fiber Networks: Value Leaders in America. Berkman KleinCenter for Internet & Society Research Publication.
Citable link http://nrs.harvard.edu/urn-3:HUL.InstRepos:34623859
Terms of Use This article was downloaded from Harvard University’s DASHrepository, and is made available under the terms and conditionsapplicable to Other Posted Material, as set forth at http://nrs.harvard.edu/urn-3:HUL.InstRepos:dash.current.terms-of-use#LAA

Our examination of advertised prices shows that com-munity-owned fiber-to-the-home (FTTH) networks in the United States generally charge less for entry-level broadband service than do competing private provid-ers, and don’t use initial low “teaser” rates that sharp-ly rise months later. We also found that Comcast var-ies its pricing by region. Our study was constrained by the lack of standardization in Internet service offerings and a shortage of available data on broadband pricing in the United States. The U.S. Federal Communications Commission doesn't comprehensively collect or make available data from internet service providers on prices advertised or charged, service availability by address, or consumer adoption by address.
Community-Owned Fiber Networks:Value Leaders in AmericaPricing Review Shows They Provide Least-Expensive Local "Broadband"
David TalbotKira HessekielDanielle Kehl
January 2018
Community fiber networks in Sandy, Oregon (bottom left); Opelika, Alabama (top right); and Lafayette, Louisiana are among those offering the lowest local prices for service meeting the FCC's "broadband" threshold (25 Mbps download, 3 Mbps upload).
digital justice < > data stewardshipdigital justice < > data stewardship
RESPONSIVE COMMUNITIESdigital justice < > data stewardshipdigital justice < > data stewardship
RESPONSIVE COMMUNITIES

ABSTRACT
We collected advertised prices for residential data plans offered by 40 community-owned (typically municipally owned) Internet service providers (ISPs) that offer fiber-to-the-home (FTTH) service. We then identified the least-expensive service that meets the federal definition of broadband—at least 25 Mbps download and 3 Mbps upload—and com-pared advertised prices to those of private competitors in the same markets. We found that most community-owned FTTH networks charged less and offered prices that were clear and unchanging, whereas private ISPs typically charged initial low promotional or “teaser” rates that later sharply rose, usually after 12 months. We were able to make comparisons in 27 communities. We found that in 23 cases, the community-owned FTTH providers’ pricing was lower when averaged over four years. (Using a three year-average changed this fraction to 22 out of 27.) In the other 13 communities, comparisons were not possible, either because the private providers’ website terms of service deterred or prohibited data collection or because no competitor offered service that qualified as broadband. We also made the incidental finding that Comcast offered different prices and terms for the same service in different regions.

3Community-Owned Fiber Networks | Responsive Communities
KEY FINDINGS
• When considering entry-level broadband service—the least-expensive plan that provides at least 25/3 Mbps service—23 out of 27 community-owned FTTH providers we studied charged the lowest prices in their community when considering the annual average cost of service over a four-year period, taking into account installation and equipment costs and averaging any initial teaser rates with later, higher, rates. This is based on data collected in late 2015 and 2016.
• In these 23 communities, prices for the lowest-cost program that met the current definition of broadband were between 2.9 percent and 50 percent less than the lowest-cost such service offered by a private provider (or providers) in that market. In the other four cases, a private pro-vider’s service cost between 6.9 percent and 30.5 percent less.
• While community-owned FTTH providers’ pricing is generally clear and unchanging, private providers almost always offer initial "teaser" prices and then raise the monthly price sharply. This price hike in the communities we studied ranged between $10 (20 percent) and $30 (42.8 percent) after 12 months, both imposed by Comcast, but in different communities. Only one community-owned FTTH provider employed this marketing practice for a data-only plan. This exception was a student discount offered by the MINET network in Oregon.
• Language in the website “terms of service” (TOS) of some private ISPs strongly inhibits research on pricing. The TOS for AT&T, Verizon, and Time Warner Cable (now owned by Charter), were particularly strong in deterring such efforts; as a result, we did not record data from these three companies.
• While the United States has 40 community networks offering broadband FTTH service (many of them serving more than one municipality), we did not make comparisons with private compet-itors in 13 cases, either because the TOS prohibited data collection or because no competing broadband service existed in the community network's home community.
• We noted that Comcast varied its teaser rates and other pricing details from region to region. Our sample size was small; just seven of the communities we studied were served by Comcast. Understanding Comcast’s pricing practices and their consumer impacts across the United States would require much deeper study.
• In general we found that making comprehensive pricing comparisons among U.S. Internet ser-vice plans is extraordinarily difficult. The U.S. Federal Communications Commission (FCC) does not disseminate pricing data or track broadband availability by address. Additionally, service offerings follow no standard speed tiers or definitions (such as the specifics of video or phone service bundles). We focused on comparing entry-level broadband plans in part because of these complexities.
Suggested Citation: Talbot, David, Hessekiel, Kira, Kehl, Danielle. Community-Owned Fiber Networks: Value Leaders in America (January 2018). Responsive Communities. Available at: cyber.harvard.edu/publications/2018/01/communityfiber.

4Community-Owned Fiber Networks | Responsive Communities
INTRODUCTION
By one recent estimate, about 8.9 percent of Americans, or about 29 million people, lack ac-cess to wired home broadband service, which the FCC defines as an Internet access connection providing speeds of at least 25 Mbps download and 3 Mbps upload.1 Even where broadband is available, high prices inhibit adoption; in one na-tional survey, 33 percent of non-subscribers cited cost of service as the primary barrier.2 Communi-ty-owned networks have been proposed as one driver of competition, resulting in better service and lower prices.3
But a lack of accurate and comprehensive data about the true state of Internet access speeds and pricing in communities across the country hampers research into the relative value of com-munity networks, among other public-interest questions. Against this difficult backdrop, we attempted to manually examine the pricing on Internet access service plans of FTTH networks owned by cities, towns, counties, and coopera-tives. (We refer to these as “community-owned FTTH networks.”)
We also examined pricing offered by the fol-lowing private competitors that offer services competing with the community-owned FTTH networks: Comcast, Charter, Mediacom, Cox Communications, KTC Pace, Interstate Telecom-munications Cooperative, Zito Media, Bernard Telephone & Communications, Emily Cooper-ative Telephone Company, Centurylink, Wave, and TDS Telecommunications. Due to restrictive website terms of service (described more fully below) we did not collect data from AT&T, Veri-zon, or Time Warner Cable.
We believe this study is the first to compare prices for Internet access services that minimal-ly meet the FCC’s definition of broadband. Our 1 Federal Communications Commission, Restoring Internet Freedom, Declaratory Order, Report and Order, and Order, p. 73 (accessed Jan. 4, 2018). http://transition.fcc.gov/Daily_Releases/Daily_Business/2018/db0105/FCC-17-166A1.pdf, We use the term broadband in this report to refer to the FCC’s minimal speed threshold; far faster speeds are necessary for many services and applications. 2 Maeve Duggan & John B. Horrigan, Home Broadband 2015, Pew Research Center (Dec. 21, 2015), http://www.pewinternet.org/2015/12/21/home-broadband-2015/.3 Community-Based Broadband Solutions: The Benefits of Competition and Choice for Community Development and Highspeed Internet Access, The Executive Office of the President (Jan. 2015), https://obamawhitehouse.archives.gov/sites/default/files/docs/community-based_broadband_re-port_by_executive_office_of_the_president.pdf; Patrick Lucey & Christopher Mitchell, Successful Strategies for Broadband Public-Private Partner-ships, Institute for Local Self-Reliance (Jul. 2016), https://ilsr.org/wp-content/uploads/downloads/2016/08/PPP-Report-2016-1.pdf.4 For more information, see Community Networks, A Project of the Institute for Local Self-Reliance, https://muninetworks.org/. 5 Community-Based Broadband Solutions: The Benefits of Competition and Choice for Community Development and Highspeed Internet Access, The Executive Office of the President (Jan. 2015), https://obamawhitehouse.archives.gov/sites/default/files/docs/community-based_broadband_re-port_by_executive_office_of_the_president.pdf.
limited scope and the unavailability of some data makes this study inherently incomplete. But our findings in communities served by 27 com-munity-owned fiber networks are compelling enough to suggest the need for more data and research about broadband pricing, competition, and adoption in the United States. As we explain below, the FCC is the most appropriate body to undertake comprehensive data collection and dissemination; at the same time, nothing pre-vents state regulatory bodies from requesting greater disclosure by ISPs operating within state boundaries.
SCOPE AND SUMMARY OF METHODSIn order to identify which community networks to include in this study, we relied on a list of net-works provided by the Institute for Local Self-Re-liance (ILSR), a nonprofit research group that has identified approximately 400 U.S. communi-ty-owned networks.4 The Obama White House relied on ILSR’s list when it published a 2015 re-port on the value of community-owned broad-band networks.5 We focused specifically on 40 community networks on the ILSR’s list that offer fiber-to-the-home (FTTH) service—as opposed to service from DSL, coaxial cable, or hybrid technology. (These 40 networks serve at least 80 municipalities, but we made the comparisons in the community in which the network originated.)
We focused on community FTTH networks be-cause fiber will likely be the technology of choice for any new public or private networks (given its exceptionally high capacity, versatility, and du-rability) and because fiber requires the highest up-front investment and installation costs (DSL and cable networks have often been repurposed from legacy phone and TV services). If anything, our focus on fiber may put community networks at a comparative disadvantage when making price comparisons. First, these communities are
5Community-Owned Fiber Networks | Responsive Communities
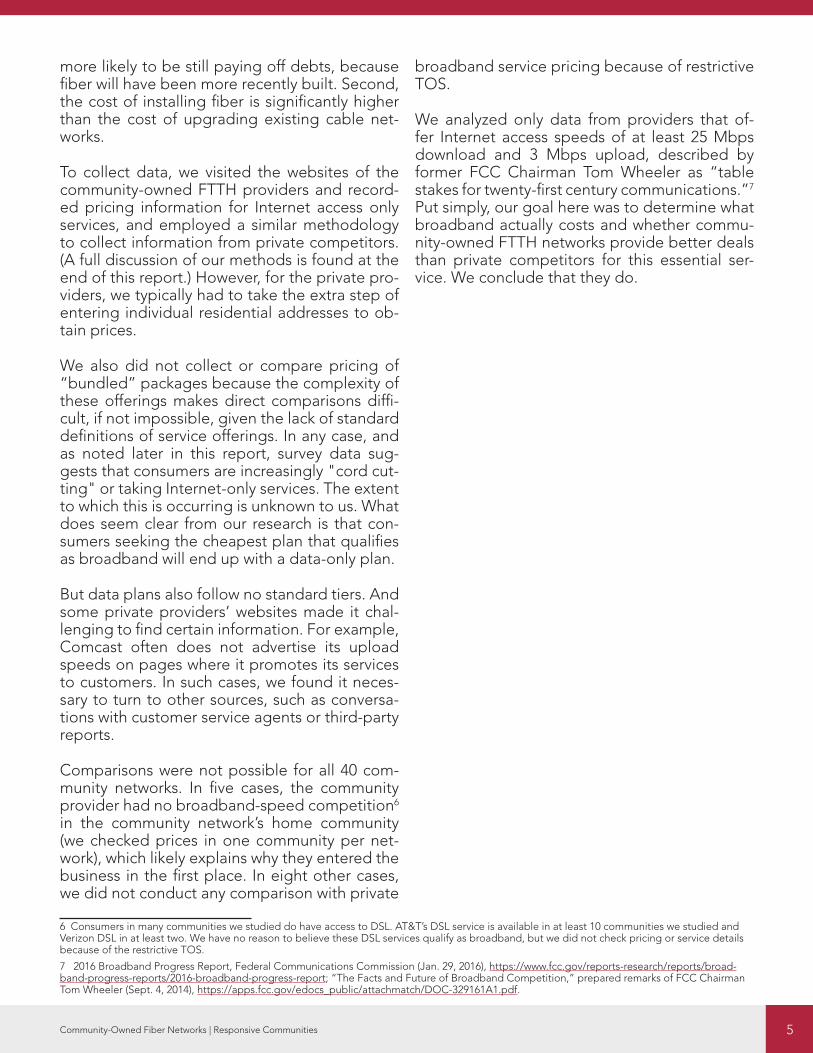
more likely to be still paying off debts, because fiber will have been more recently built. Second, the cost of installing fiber is significantly higher than the cost of upgrading existing cable net-works.
To collect data, we visited the websites of the community-owned FTTH providers and record-ed pricing information for Internet access only services, and employed a similar methodology to collect information from private competitors. (A full discussion of our methods is found at the end of this report.) However, for the private pro-viders, we typically had to take the extra step of entering individual residential addresses to ob-tain prices.
We also did not collect or compare pricing of “bundled” packages because the complexity of these offerings makes direct comparisons diffi-cult, if not impossible, given the lack of standard definitions of service offerings. In any case, and as noted later in this report, survey data sug-gests that consumers are increasingly "cord cut-ting" or taking Internet-only services. The extent to which this is occurring is unknown to us. What does seem clear from our research is that con-sumers seeking the cheapest plan that qualifies as broadband will end up with a data-only plan.
But data plans also follow no standard tiers. And some private providers’ websites made it chal-lenging to find certain information. For example, Comcast often does not advertise its upload speeds on pages where it promotes its services to customers. In such cases, we found it neces-sary to turn to other sources, such as conversa-tions with customer service agents or third-party reports.
Comparisons were not possible for all 40 com-munity networks. In five cases, the community provider had no broadband-speed competition6 in the community network’s home community (we checked prices in one community per net-work), which likely explains why they entered the business in the first place. In eight other cases, we did not conduct any comparison with private
6 Consumers in many communities we studied do have access to DSL. AT&T’s DSL service is available in at least 10 communities we studied and Verizon DSL in at least two. We have no reason to believe these DSL services qualify as broadband, but we did not check pricing or service details because of the restrictive TOS.7 2016 Broadband Progress Report, Federal Communications Commission (Jan. 29, 2016), https://www.fcc.gov/reports-research/reports/broad-band-progress-reports/2016-broadband-progress-report; “The Facts and Future of Broadband Competition,” prepared remarks of FCC Chairman Tom Wheeler (Sept. 4, 2014), https://apps.fcc.gov/edocs_public/attachmatch/DOC-329161A1.pdf.
broadband service pricing because of restrictive TOS.
We analyzed only data from providers that of-fer Internet access speeds of at least 25 Mbps download and 3 Mbps upload, described by former FCC Chairman Tom Wheeler as “table stakes for twenty-first century communications.”7 Put simply, our goal here was to determine what broadband actually costs and whether commu-nity-owned FTTH networks provide better deals than private competitors for this essential ser-vice. We conclude that they do.

6Community-Owned Fiber Networks | Responsive Communities
MAIN FINDING
COMMUNITY FIBER NETWORKS OFFER BETTER ENTRY-LEVEL BROADBAND VALUES AND CLEARER, TEASER-FREE PRICINGOur major finding is that in 23 out of 27 communi-ties where comparisons were possible, entry-lev-el broadband service from a community-owned FTTH network—meaning the lowest-cost service that met the FCC's definition of broadband (at least 25 Mbps download, 3 Mbps upload)—was less expensive, when considering the average annual cost of service over four years,8 than such service offered by a private competitor.
The benefits ranged from a savings of 2.9 per-cent, or $19, annually in Tullahoma, Tennessee, to more than 50 percent, or $600, annually in Lafay-ette, Louisiana. Twelve of the community-owned FTTH providers beat their private competitors’ prices by 20 percent or more for entry-level broadband service. In four communities, a pri-vate provider beat the community-owned FTTH network. In in such cases, the benefits ranged from a 6.9 percent, or $50, saving for users of Charter Spectrum in Jackson, Tennessee, to about a 30.5 percent, or $298, saving, also for users of Charter Spectrum, in Churchill, Nevada.
The lowest-speed tier that met the broad-band minimum varied from provider to pro-vider. In 13 cases, the private provider's lowest-cost plan that met the broadband thresh-old offered higher speeds than did the low-est-cost broadband service of community-owned FTTH networks. In six cases, the reverse was true; in five cases, the speeds were the same.
Our secondary finding was that community -owned providers furnish consumers with dra-matically clearer pricing. Of the 35 private In-ternet access plans we encountered in our data collection, 25 offered low-cost initial promo-8 As part of our analysis we also ran the numbers for a three-year average, a method that would make private providers appear less expensive, given that they tend to use low initial "teaser" rates, typically for 12 months. Only one of the community-owned FTTH networks that were less ex-pensive over four years became more expensive when a three-year term was considered: Cedar Falls, Iowa. See methods section for more details.9 MINET’s promotional pricing option is only available to area students and offers them a six-month discounted price. Because MINET did not have any competitors offering broadband-minimum speeds, we did not include this or their other plan offerings in our analyses. Additionally, com-munity-owned FTTH networks in Lafayette, Louisiana, and Bristol, Virginia, offered bundled services (as opposed to the entry-level broadband plans we studied) having an initial promotional rate of one year. 10 Maeve Duggan & John B. Horrigan, One-in-Seven Americans Are Television “Cord Cutters,” Pew Research Center (Dec. 21, 2015), http://www.pewinternet.org/2015/12/21/4-one-in-seven-americans-are-television-cord-cutters/.11 Lee Rainie, About 6 in 10 Young Adults in U.S. Primarily Use Online Streaming to Watch TV, Pew Research Center (Sept. 13, 2017), http://www.pewresearch.org/fact-tank/2017/09/13/about-6-in-10-young-adults-in-u-s-primarily-use-online-streaming-to-watch-tv/.
tional (or "teaser") rates and then increased the rate substantially at the conclusion of the initial period (typically 12 months). By contrast, we en-countered only three examples of promotional pricing among the community-owned ISPs we studied. And MINET, in the towns of Monmouth and Independence, Oregon, was the only one to offer such a deal on a plan offering Internet ac-cess only, in the form of a special promotion for students.9 The private providers’ price increas-es at the expiration of the promotional period ranged from 20 percent, or $10 monthly (Com-cast Xfinity in Longmont, Colorado), to 42.8 per-cent, or $30.04 monthly (Comcast Xfinity in Con-cord, Massachusetts).
We do not know what fraction of broadband subscribers take data-only plans as opposed to bundles. However, surveys of U.S. consumers by the Pew Research Center indicate a trend to-ward “cord cutting” (the practice of canceling a cable TV subscription and merely taking a data plan). In late 2015 Pew reported that about 15 percent of Americans were cord cutters and that another nine percent had never taken a TV sub-scription.10 Younger people appear more likely to do without bundles. Pew’s most recent survey, in September of 2017, found that 60 percent of people aged 18–29 said they mainly watched TV by using services such as Netflix.11
Our study, though limited in scope, contains a clear finding: community-owned FTTH networks tend to provide lower prices for their entry-lev-el broadband service than do private telecom-munications companies, and are clearer about and more consistent in what they charge. They may help close the “digital divide” by providing broadband at prices more Americans can afford.
7Community-Owned Fiber Networks | Responsive Communities
1
2
3
4
5
6
7
8
9
10
11
12
13
1415
16
17
18
19
20
21
22
23
2425
26
27
Community network
Annual cost savings (or premium) relative to private competitor(s)
1 Lafayette, LA$600.00
$311.36
2 Sebewaing, MI $352.15
3 Morristown,TN
$324.12
$259.23
4 Highland, IL $295.23
5 Pulaski, TN $237.24
6 Dalton, GA $216.98
7 Longmont, CO
$172.74
$301.45
8 Bristol, VA$199.23
$126.74
9 Sandy, OR $170.00
10 Brookings, SD$163.13
$148.60
11 Opelika, AL $139.23
12 Clarksville, TN $138.75
13 Indianola, IA $130.39
Community network
Annual cost savings (or premium) relative to private competitor(s)
14 Monticello, MN
$122.74
$38.34
15 Concord, MA $115.12
16 Chattanooga,TN $107.25
17 Bristol, TN $79.22
18 Auburn, IN $92.76
19 Reedsburg, WI $62.97
20 Marshall, MO $25.90
21 Bellevue, IA $35.52
22 Crosslake, MN $37.25
23 Cedar Falls, IA $24.88
24 Tullahoma, TN $19.22
25 Jackson, TN ($50.13)
26 IssaquahHighland, WA
($100.48)
($108.10
27 Churchill, NV ($298.28)
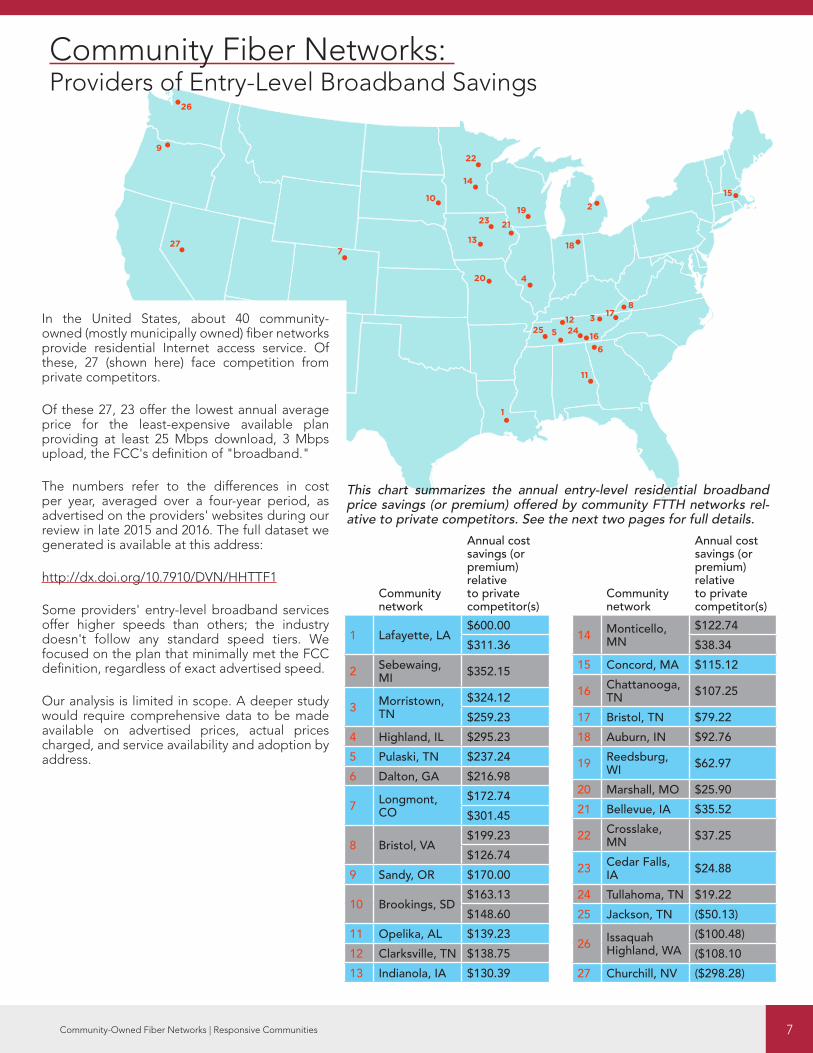
In the United States, about 40 community-owned (mostly municipally owned) fiber networks provide residential Internet access service. Of these, 27 (shown here) face competition from private competitors.
Of these 27, 23 offer the lowest annual average price for the least-expensive available plan providing at least 25 Mbps download, 3 Mbps upload, the FCC's definition of "broadband."
The numbers refer to the differences in cost per year, averaged over a four-year period, as advertised on the providers' websites during our review in late 2015 and 2016. The full dataset we generated is available at this address:
http://dx.doi.org/10.7910/DVN/HHTTF1
Some providers' entry-level broadband services offer higher speeds than others; the industry doesn't follow any standard speed tiers. We focused on the plan that minimally met the FCC definition, regardless of exact advertised speed.
Our analysis is limited in scope. A deeper study would require comprehensive data to be made available on advertised prices, actual prices charged, and service availability and adoption by address.
Community Fiber Networks: Providers of Entry-Level Broadband Savings
This chart summarizes the annual entry-level residential broadband price savings (or premium) offered by community FTTH networks rel-ative to private competitors. See the next two pages for full details.

8Community-Owned Fiber Networks | Responsive Communities
Rank Community
Entry-level broadband offering from community FTTH networkProviderDownload/upload speed (mbps)Avg. service cost per year for first 4 years
Entry-level broadband offering from private competitorProvider Download/upload speed (mbps)Avg. service cost per year for first 4 years
Annualsavings or(premium)
Percentage savings or (premium)
Key (see next page)
1 Lafayette, LALafayette Utilities Systems60/60, $599.40
KTC Pace50/5, $1,199.40 $600.00 50.0% 1, 6
Cox Communications50/5, $910.76 $311.36 34.2% 1, 6
2 Sebewaing, MI Sebewaing Light & Water30/30, $451.25
Comcast Xfinity25/5, $803.41 $352.15 43.8% 1
3 Morristown, TN FiberNET30/30, $419.40
Comcast Xfinity75/5-10, $743.52 $324.12 43.6% 1, 4
Charter Spectrum60/4, $678.63 $259.23 38.2% 1, 4
4 Longmont, CO NextLight25/25, $479.40
Comcast Xfinity25/5, $625.14 $172.74 23.3%
Centurylink40/5, $780.85 $301.45 38.6% 5, 6
5 Highland, IL Highland Communication Services40/40, $383.30
Charter Spectrum60/4, $678.63 $295.23 43.5% 4
6 Pulaski, TN PES Energize25/6.5, $441.39
Charter Spectrum60/4, $678.63 $237.24 35.0% 4
7 Dalton, GA Optilink25/10, $461.65
Charter Spectrum60/4, $678.63 $216.98 32.0% 4
8 Bristol, VA Bristol Virginia Utility Optinet30/5, $479.40
Charter Spectrum60/4, $678.63 $199.23 29.4%
Comcast Xfinity25/5, $606.14 $126.74 20.9%
9 Sandy, OR SandyNet100/100, $504.40
Wave55/5, $674.40 $170.00 25.2%
10 Brookings, SD Swiftel30/5, $616.28
Interstate Telecommunications Cooperative 30/5, $779.40
$163.13 20.9% 3, 4, 6
Mediacom Cable50/5, $764.88 $148.60 19.4% 3, 4, 6
11 Opelika, AL Opelika Power Services30/15, $539.40
Charter Spectrum60/4, $678.63 $139.23 20.5% 4
12 Clarksville, TN Clarskville CDE Lightband50/50, $539.88
Charter Spectrum60/4, $678.63 $138.75 20.4% 1
13 Indianola, IA Indianola Municipal Utilities25/10, $634.49
Mediacom Cable50/5, $764.88 $130.39 17.0%
14 Monticello, MN Monticello Fiber Network50/50, $640.29
TDS Telecom25/10, $763.03 $122.74 16.1% 6
Charter Spectrum60/4, $678.63 $38.34 5.6% 6
15 Concord, MA ConcordNet25/25, $649.40
Comcast Xfinity25/5, $764.52 $115.12 15.1% 2
16 Chattanooga, TN
EPB Fiber Optics100/100, $695.88
Comcast Xfinity25/5, $803.40 $107.25 13.4% 1
17 Bristol, TN Bristol TN Essential Services30/5, $599.40
Charter Spectrum60/4, $678.63 $79.23 11.7% 4
Cheapest Tiers Meeting Broadband DefinitionCommunity Fiber Networks Tend to Beat Private CompetitorsThis table reviews advertised broadband prices in 27 communities served by community-owned FTTH networks and one or two private providers. The dollar figures present average cost per year over four years and takes into account all fees and recurring costs.

9Community-Owned Fiber Networks | Responsive Communities
18 Auburn, IN Auburn Essential Services25/6, $731.64
Mediacom Cable50/5, $824.40 $92.76 11.3% 1, 4
19 Reedsburg, WI Reedsburg Utility Commission50/5, $615.65
Charter Spectrum60/4, $678.63 $62.97 9.3%
20 Marshall, MO Marshall Municipal Utilities40/20, $552.50
Zito Media100/10, $578.40 $25.90 4.5% 1, 4
21 Bellevue, IA Bellevue iVue Internet Services25/25, $863.88
Bernard Telephone & Communications Inc.30/30, $899.40
$35.52 3.9%
22 Crosslake, MN Crosslake Communications30/20, $1,030.40
Emily Cooperative Telephone Company30/30, $1,067.65 $37.25 3.5% 7
23 Cedar Falls, IA Cedar Falls Utilities FiberNet50/25, $740.00
Mediacom Cable50/5, $764.88 $24.88 3.3%
24 Tullahoma, TN Tullahoma Utilities Board30/5, $659.40
Charter Spectrum60/4, $678.63 $19.22 2.8% 1, 4
25 Jackson, TN Jackson Energy Authority60/10, $728.75
Charter Spectrum60/4, $678.63 -$50.13 -6.9% 1
26 Issaquah Highland, WA
Highland Fiber Network100/100, $782.59
Comcast Xfinity25/5, $682.02 -$100.48 -12.8% 6, 8
Wave55/5, $674.40 -$108.10 -13.8% 6
27 Churchill, NV CC Communications35/5, $976.90
Charter Spectrum60/4, $678.63 -$298.28 -30.5% 3
NOTE: The websites of some private providers did not display upload speeds to prospective customers. Upload speeds were added to this table after the fact for two providers, Charter Spectrum and Comcast Xfinity, by consulting with customer service representatives and independent reports.
KEY
1: This community may also be served by AT&T. We did not collect data from AT&T because of prohibitions con-tained in the terms of service posted on AT&T’s website.
2: This community may also be served by Verizon DSL service. We did not collect data from Verizon because of prohibitions contained in the terms of service posted on Verizon’s website.
3: Because this community ISP offered only bundled phone/data, we used the phone/data price in place of a data-only price and did not attempt to subtract the value of the phone service.
4: This community provider also offered a higher speed that was closer to the entry-level speed of the private provider. However, we only compared the cheapest possible plans that met broadband definitions. We also did not attempt to verify actual delivered speeds for any ISP.
5: Longmont, CO, has a DSL provider whose website does not prohibit data collection and that offers broad-band speeds. In this one case, we collected the pricing information in March of 2017.
6: Seven of the 27 communities were served by two private ISPs providing at least 25/3 Mbps service, resulting in the split row containing two sets of prices.
7: In August of 2016, Crosslake Communications was bought by Tri-Co Technologies, a partnership of three pri-vate companies. We collected our data before this occurred.
8: The Highland Fiber Network serves a community called Issaquah Highlands, a neighborhood within Issaquah, WA. It does not serve the larger municipality of Issaquah.

10Community-Owned Fiber Networks | Responsive Communities
INCIDENTAL FINDINGS
COMCAST SUBSTANTIALLY VARIES PRICING AND TERMS BY REGIONWe made an incidental finding: Comcast —which offers service in seven communities we studied—varies its teaser rates and other pricing strategies substantially from region to region. We don't know if Comcast's practice of vary-ing pricing is common in the industry. (Charter Spectrum, present in 13 communities, appears to offer uniform pricing.) Many significant ques-tions—such as impacts by region or demograph-ic group—could be answered with better data. Here's how Comcast Xfinity’s pricing differs by region:
• Discounting a middle-tier speed option – In four communities we studied, Comcast of-fered a middle tier of service at a promotional rate that was less expensive for the first year than was a slower plan. After the promotion expired, the price would rise sharply.
• Presenting prices as a range – Comcast some-times defined a monthly price as a range (be-tween $2 and nearly $15 monthly), leaving it unclear what consumers would be paying.
• Varying teaser rates – Comcast employed dif-ferent teaser rate progressions, including a price increase after 12 months and two price increases over a period of three years.
• Discounts for paperless billing and automat-ic payments – In four communities, the pro-motional price Comcast advertised in bold was only available to customers who allowed Comcast to automatically charge monthly payments to their credit card or bank. Prices were $10 higher for customers who did not agree, a practice that penalizes consumers without credit cards or bank accounts or who are reluctant to provide permission.
• Service with or without a contract – In Is-saquah, WA, and Longmont, CO, Comcast offered consumers a choice of taking service through a 12-month contract or doing so without a contract (and its potential cancel-lation fees) for $10 more a month. As a result,
anyone who chose the plan without a con-tract but didn't end up canceling within the first year would spend an additional $120.
PRIVATE PROVIDERS TEND TO USE TEASER RATES; THE DETAILS VARY
We found that private providers, unlike community FTTH networks, make wide use of promotional or "teaser" pric-ing, meaning low initial rates that sharply rise, typically after 12 months. We encountered the use of promotional pricing by private ISPs in 33 of the 40 communities we sur-veyed. Only one community-owned provider we studied used a promotional rate; it was for college students.
TYPE OF TEASERRATE Provider with this type of rate
Commu-nities in our study served by this provider or providers
6 months Zito Media 1
12 months
Charter SpectrumComcastMediacomCox CommunicationsWaveInterstate Telecommunications CooperativeCenturyLink
21
12 months and again at 24 months
Comcast 2
Non-promotional rates expressed as a range
Comcast 3
No use of teaser rate
Bernard Telephone & Communications CompanyKTC PaceEmily Cooperative Telephone CompanyTDS TelecomComcast
6
We did not collect data because of restrictions in terms of service
AT&TVerizonTime Warner Cable
10
TOTAL 15 40*
* Some communities are covered by two or more of these providers.

11Community-Owned Fiber Networks | Responsive Communities
THE MUNICIPAL MISSION
Municipal and other community-owned ISPs offer similar services to those offered by private providers. But they often follow differing operating philosophies. Community-owned ISPs typically regard the provision of high-speed Internet access as an end in itself and a means to achieving other community benefits, such as economic development, job creation,12 and retaining population and increasing local real estate values;13 many municipal utilities choose to compete on quality of service and customer support, rather than merely on price. Community networks often serve additional functions such as providing connectivity to schools and local governments.14
Municipalities and other public owners follow a variety of business models—such as building and operating their own networks or forming various partnerships with private entities.
Some research organizations, often with ties to large telecommunications companies, have issued reports criticizing com-munity networks, asserting that they represent unfair competition, lose money, or are prone to failure. Often, the claims in these reports are rebutted by independent organizations. For instance, the Institute for Local Self-Reliance offered a rebuttal of a report criticizing the network in Lafayette, Louisiana,15 and corrected a report asserting widespread municipal network failures by a group called the Taxpayer Protection Alliance.16
Those arguments are not within the scope of this report. But we would point out that the divergence of claims about the merits of municipal fiber networks can be extraordinary, as shown by recent assessments of the Chattanooga, Tennessee, municipal utility’s network. A report by a University of Pennsylvania Law School professor who focused only on cash flow over a five-year period—and whose think tank is supported in part by major private ISPs long opposed to municipal proj-ects—predicted the Chattanooga network would take 412 years to become cash-flow-positive.17 And yet an earlier report by a University of Tennessee professor—whose research was supported by the Chattanooga utility itself—estimated that revenue, municipal and utility savings, and various second-order benefits (economic development, savings to businesses and individuals, tax base growth, and so on) produced between $865.3 million and $1.3 billion in community benefits in just five years, while also helping create between 2,800 and 5,200 new jobs.18
Both of those studies have limitations. The University of Pennsylvania study only uses data from 2010 to 2014, when some of the underlying projects were just beginning to build their customer base while incurring significant up-front capital costs, and does not include utility or municipal savings or other benefits. The University of Tennessee study attributes economic development to the fiber network when, in reality, the fiber network was likely one of many factors that helped create jobs and produce other benefits.
Our goal in this report was not to comprehensively assess the public benefits of municipal and community-owned broad-band providers or to answer questions about their financial health. Our focus was on examining the pricing of entry-level broadband service.
12 See, e.g., Jamie McGee, Chattanooga Mayor: Gigabit Speed Internet Helped Revive City, The Tennessean (Jun. 14, 2016), http://www.tennessean.com/story/money/2016/06/14/chattanooga-mayor-gigabit-speed-internet-helped-revive-city/85843196/; Dominic Rushe, Chattanooga’s Gig: How One City’s Super-Fast Internet Is Driving a Tech Boom, The Guardian (Aug. 30, 2014), https://www.theguardian.com/world/2014/aug/30/chattanooga-gig-high-speed-internet-tech-boom. 13 How Fast Internet Affects Home Prices, National Center of Policy Analysis (Jul. 7, 2015), http://www.ncpa.org/sub/dpd/index.php?Article_ID=25821. 14 See Benjamin Lennett et al., The Art of the Possible: An Overview of Public Broadband Options, New America’s Open Technology Institute (May 2014), https://www.newamerica.org/oti/policy-papers/the-art-of-the-possible-an-overview-of-public-broadband-options/.15 Rebecca Toews, Correcting Community Fiber Fallacies: The Reality of Lafayette’s Gigabit Network, Institute for Local Self-Reliance (Oct. 13, 2014), https://ilsr.org/fiber-fallacies-lusfiber/.16 Lisa Gonzalez, New Report Dissects "Boondoggle Map," Institute for Local Self-Reliance (May 24, 2017), https://muninetworks.org/content/new-report-dissects-boondoggle-map.17 Christopher S. Yoo & Timothy Pfenninger, Municipal Fiber in the United States: An Empirical Assessment of Financial Performance, Penn Law Center for Technology, Innovation and Competition (Apr. 3, 2017), https://www.law.upenn.edu/live/files/6611-report-municipal-fiber-in-the-united-states-an.18 Bento J. Lobo, The Realized Value of Fiber Infrastructure in Hamilton County, Tennessee, The University of Tennessee at Chattanooga (Jun 18, 2015), http://ftpcontent2.worldnow.com/wrcb/pdf/091515EPBFiberStudy.pdf.

12Community-Owned Fiber Networks | Responsive Communities
ABOUT “TERMS OF SERVICE”
Most websites have policies that govern what users can do in those online spaces. These documents are typically called “Terms of Service,” “Terms of Use,” or “Acceptable Use” policies, and they exist to help protect the entity’s rights to the website’s contents, to give companies grounds for restricting access for users whose behavior is inappropriate or unlawful, and to create grounds for pursuing legal action.
Most of the providers whose websites required furnishing an address to access pricing information included terms of ser-vice or similar policies. In the case of three companies—AT&T, Verizon, and Time Warner Cable (now owned by Charter)— website language was particularly strong in deterring efforts at collecting pricing information. At the time we collected the data, we encountered the following language on the sites of these providers:
• Time Warner Cable: “Do not ‘harvest’ (or collect) information from the site using an automated software tool or manually on a mass basis (unless we have given you separate written permission to do so). This includes, for example, information about other users of the site and information about the offerings, products, services and promotions available on the site.”19
• Verizon Fios: “Notice: Authorized use of this page is limited to the review of service availability information, for a particular address or phone number, solely by persons interested in purchasing Verizon service or making changes to existing Verizon service. No other use is permitted. After you use this site, Verizon may contact you with information about our products and services, including special offers and promotions.”20
• AT&T: “[Y]ou will not take any of the following actions with respect to our Site, related Software, or Content […] in any manner that: […]is deceptive in any way, such as an offer to sell fraudulent goods or contains an impersonation of any person or entity or misrepresents an affiliation with a person or entity; […] [or] systematically collects and uses any Content including the use of any data mining, or similar data gathering and extraction methods.”21
Obeying the letter of these terms of service made it impossible to make complete pricing comparisons in several com-munities. Here are four examples:
Community-owned fiber network community
Broadband minimum speed available (upload/download in mbps)
Potential broadband provider(s) with restrictive website provisions
Salisbury, NC 50/50 Time Warner Cable; AT&T
Wilson, NC 40/40 Time Warner Cable
Russellville, KY 50/10 AT&T
Sallisaw, OK 30/unknown AT&T
19 Website Terms of Use, Time Warner Cable (Mar 2, 2016), https://web.archive.org/web/20160302161548/http://www.timewarnercable.com:80/en/our-company/legal/privacy-policy/website-terms-of-use.html. Time Warner Cable has since merged its Internet service business with Charter Spec-trum, though at the time we collected information from Charter they were still operating as separate entities. The language from Time Warner Cable’s previous terms of use document is accessible through the Internet Archive.20 See Robert Faris et al., Comments on the Formulation of the National Broadband Research Agenda, “Appendix A” (Nov 2, 2016), https://papers.ssrn.com/sol3/papers.cfm?abstract_id=2862003. Verizon has since altered the layout of its website such that this language does not currently appear in the user interface, but the screenshot in the cited comment to the NTIA and NSF captures the user interface when the study was conducted.21 AT&T Terms of Use, AT&T (accessed June 12, 2017), https://www.att.com/legal/terms.attWebsiteTermsOfUse.html.

13Community-Owned Fiber Networks | Responsive Communities
CONCLUSION
Studying the pricing practices of U.S. Internet service providers is challenging. Many ISPs de-ter data collection, service plans and pricing strategies aren't standardized, and regulators don’t collect and release enough relevant data. Against this backdrop, we did our best over more than 18 months to manually gather and harmo-nize data to explore whether community-owned FTTH networks or private providers offered the best values in providing a service that minimally met the FCC's definition of broadband.
We found that in 23 out of 27 communities where comparisons were possible, entry-level broadband service from a community-owned FTTH network was indeed less expensive than comparable service offered by a private com-petitor when considering the annual cost of ser-vice averaged over four years. What’s more, the community providers were generally far clearer in how they presented pricing—steering clear of initial teaser rates that later rise sharply.
But the unavailability of comprehensive data leaves many fundamental questions unanswered. These include: What does broadband service actually cost consumers in the United States? To what extent do carriers actually charge the rates set forth in price lists? How many consumers at-tempt to renegotiate after teaser rates expire, and how many pay higher prices for many more years? Exactly how sensitive are consumers to price when choosing to adopt broadband ser-vice? Are publicly owned FTTH networks a bet-ter value overall than private ones? Do compa-nies frequently vary pricing of the same service in different regions, and does this have a dispa-rate impact on different demographic groups? Do municipally or other community-owned sys-
22 Report and Order and Further Notice of Proposed Rulemaking in the Matter of Modernizing the E-rate Program for Schools and Libraries, WC Docket No. 13-184 (Jul. 23, 2014). See also Danielle Kehl, What’s Inside the FCC’s E-rate Order?, New America’s Open Technology Institute (Aug. 4, 2014), https://www.newamerica.org/oti/blog/whats-inside-the-fccs-e-rate-order-2/. 23 Federal Communications Commission, WC Docket No. 11-10, Modernizing the FCC Form 477 Data Program (Aug. 4, 2017), https://ecfsapi.fcc.gov/file/08041199205324/FCC-17-103A1.pdf.24 The National Broadband Map is missing a lot of data on smaller ISPs, including municipally owned networks. At the same time, it over-rep-resents the state of competition in many areas because it includes ISPs that only offer commercial or enterprise service. In essence, according to the map it appears that someone who lives on a block that is in reality only served by one residential provider actually has other competitors to choose from. 25 The FCC, for example, has previously declined to collect pricing information from any broadband providers through the annual Form 477 re-porting requirements it imposes on Internet access providers, and has itself conceded that it does not have the “reliable data as to the actual prices consumers pay for these services” that it would need to conduct substantial analysis on the impact of price. See, e.g., Patrick Lucey, FCC Prioritizes Incumbent Protection in Data Collection Order, Community Broadband Networks (Jul. 17, 2013), http://muninetworks.org/content/fcc-prioritizes-in-cumbent-protection-data-collection-order; 2016 Broadband Progress Report, Federal Communications Commission (Jan. 29, 2016) at para. 103.
tems put downward price pressure on private company offerings?
Existing efforts at regulatory data collection fall far short of what would be needed to answer such questions. While the FCC collects data about advertised speed tiers and other service offerings through a telecom industry reporting document called Form 477, it does not compre-hensively collect data on pricing. (It does collect some pricing data in specific circumstances, such as from schools and libraries that participate in the E-rate program, which subsidizes Internet access to those institutions.22)
The FCC also only collects data by census block, not address. The FCC recently sought comment on proposals to expand the scope of data col-lection under Form 477 and specifically asked whether collecting data at the street-address level would be beneficial.23 Having gone through this data-collection exercise, we can report that the answer is yes. Street-address-level data, if available for study, would speak most clearly about the state of broadband service, price, and competition in the United States.
Some existing resources aren’t useful in prac-tice. The National Telecommunications and In-formation Administration (NTIA) in 2009 created a National Broadband Map, but among other problems with this resource, it provides no infor-mation about pricing, and data collection for the map ceased in June of 2014. The Commerce De-partment collects and publishes aggregate data about the state of broadband competition in the United States, but it does so only at the level of census blocks. In general, data is not collected in a coordinated manner, is often incomplete, and omits critical information like price.24, 25 Other in-dependent organizations have attempted to fill

14Community-Owned Fiber Networks | Responsive Communities
the gap but have faced the same challenges we did.26
Community-owned networks are facing pres-sure. State governments in at least 20 states have enacted restrictions on these providers, of-ten with language drafted by cable and telecom lobbyists.27 During Tom Wheeler’s tenure as FCC chairman, the commission pushed back: the FCC in 2015 moved to preempt state laws in North Carolina and Tennessee that restrict municipal broadband providers from offering service be-yond current service boundaries,28 but a federal appeals court reversed the FCC’s decision.29
Our findings, though limited in scope, point to the benefits of community fiber networks in pro-viding broadband to Americans at prices that are more affordable. The national interest would be served by deeper data collection and study.
26 For example, the Open Technology Institute at New America published an annual Cost of Connectivity report in 2012, 2013, and 2014 that includes information about available speeds and prices in eight U.S. cities—including municipally owned networks in Chattanooga, TN, Bristol, VA, and Lafayette, LA. See Danielle Kehl, et al., The Cost of Connectivity 2014, New America’s Open Technology Institute (Oct. 30, 2014), http://www.newamerica.org/oti/policy-papers/the-cost-of-connectivity-2014/; Hibah Hussain, et al., The Cost of Connectivity 2013, New America’s Open Technology Institute (Oct. 28, 2013), https://www.newamerica.org/oti/policy-papers/the-cost-of-connectivity-2013/; Hibah Hussain, et al., The Cost of Connectivity 2012, New America’s Open Technology Institute (Jul. 19, 2012), https://www.newamerica.org/oti/policy-papers/the-cost-of-con-nectivity-2012/. The Center for Public Integrity did a study in 2015 comparing speed and price information from five American cities with those for five French cities of similar size and urbanicity levels in order to highlight the effect of competition on broadband price. Adam Holmes & Chris Zubak-Skees, U.S. Internet Users Pay More and Have Fewer Choices than Europeans, The Center for Public Integrity (Apr. 1, 2015), https://www.publicintegrity.org/2015/04/01/16998/us-internet-users-pay-more-and-have-fewer-choices-europeans.27 Allan Holmes, How Big Telecom Smothers City-Run Broadband, The Center for Public Integrity (Aug. 28, 2014), https://www.publicintegrity.org/2014/08/28/15404/how-big-telecom-smothers-city-run-broadband. 28 Memorandum Opinion and Order in the Matter of City of Wilson, North Carolina Petition for Preemption of North Carolina General Statute Sections 160A-340 et seq., WC Docket No. 14-115, and The Electric Power Board of Chattanooga, Tennessee Petition for Preemption of a Portion of Tennessee Code Annotated Section 7-52-601, WC Docket No. 14-116 (Feb. 26, 2015), available at https://apps.fcc.gov/edocs_public/attach-match/FCC-15-25A1.pdf. In response to petitions from the cities of Wilson and Chattanooga, the FCC relied on its preemption power under the Constitution’s Supremacy Clause to overrule state laws prohibiting the cities from expanding their networks. 29 Tennessee v. Federal Communications Commission, 832 F.3d 597 (6th Cir. 2016).
ABOUT THE PROJECTResponsive Communities is a project of the Berkman Klein Center for Internet & Society at Harvard University. Responsive Communities addresses the most important issues of social justice, civil liberties, and economic devel-opment involving Internet access and government use of data.
AUTHORSDavid Talbot is a fellow at the Berkman Klein Center for Internet & Society, at Harvard University. Kira Hessekiel is a project coordinator of Harvard Law School's Cyberlaw Clinic, based at the Berkman Klein Center. Danielle Kehl is in her third year at Harvard Law School and is a fellow at New America's Open Technology Institute and the Inter-net Law & Policy Foundry.
ACKNOWLEDGMENTSRob Faris, research director at the Berkman Klein Center; Susan Crawford, clinical professor at Harvard Law School; Waide Warner, lecturer in law at Harvard Law School; Jim Baller, president of Baller Stokes & Lide in Washington, DC; Ashley Shelfox, associate at Baller Stokes & Lide; Scott Bradner, secretary to the Internet Society who has held many leadership roles within the Internet Engineer-ing Task Force; and Chris Mitchell, director of the Com-munity Broadband Networks Initiative at the Institute for Local Self-Reliance all provided expertise about municipal networks and guidance about basic research methodolo-gies. Christopher Bavitz, managing director of the Cyber-law Clinic at Harvard Law School; Andy Sellars, former Cy-berlaw Clinic instructional fellow; and former clinic student Andrea Els provided advice about terms of service (TOS). Harvard Law students Kelley McGill and Filippo Raso, and undergraduates Alyssa Smith and Paulomi Rao, provided research assistance in collecting data.
To make possible deeper study of comparative broadband pricing and the relationship between pricing and consumer adoption, the U.S. Fed-eral Communications Commission (above) could comprehensively track and disclose prices advertised and charged and availability of service by address. It also could define standard speed and service tiers. Report Layout: Daniel Dennis Jones

15Community-Owned Fiber Networks | Responsive Communities
APPENDIX
METHODS
The data in this study were collected between November 2015 and January 2016 for most of the community-owned FTTH providers, and between May 2016 and September 2016 for most of the private providers. We obtained these data by visiting the website of every ISP included in the study, writing down what we saw, and preserving screen-shots. We did not attempt to update pricing after initial collection. We did not involve any of the private or public providers in the collection or analysis of the data.
Communities Included in the StudyWe limited the community-owned ISPs in our survey to those that provide fiber-to-the-home (FTTH) residential service. In this study, the term "community-owned FTTH providers" refers to FTTH providers owned by a city, town, county, cooperative, or other public body.
Dozens of other community-owned ISPs operate coaxial cable, DSL, or hybrid infrastructure (some of which have been in operation for decades as television or phone service networks). We reasoned that a targeted study of community-owned FTTH networks provided a valid sub-set and would be fair to the local private competitors be-cause fiber is the most expensive technology to deploy and would have been installed more recently (with capital costs still being paid off in many cases). In addition, fiber—the most advanced and versatile technology—is the likely choice for any future network construction.30
We collected pricing data from the websites of 40 com-munity-owned FTTH providers and their competitors. Our source for the existence of these community-owned FTTH providers was a list of municipal networks compiled by the Institute for Local Self-Reliance (ILSR)31 and a similar list compiled by the White House in 2015 that was based on the ILSR data.32 Next, we identified competitors in those communities by using the National Broadband Map33 and a third-party site called Broadband Now.34 We included all private fiber, cable, or DSL providers who provide broad-band speeds, except those whose websites’ terms of ser-vice prohibited data collection. We did not collect data from Time Warner Cable, AT&T, or Verizon, all of which included language in their terms of service or disclaimers
30 Fiber to the Home: Advantages of Optical Access, Fiber to the Home Council (2010), http://www.bbcmag.com/Primers/BBP_MarApril10_Prim-er.pdf. 31 For more information, see Community Networks, A Project of the Institute for Local Self-Reliance, https://muninetworks.org/. 32 Community-Based Broadband Solutions: The Benefits of Competition and Choice for Community Development and Highspeed Internet Access, The Executive Office of the President (Jan. 2015), https://obamawhitehouse.archives.gov/sites/default/files/docs/community-based_broad-band_report_by_executive_office_of_the_president.pdf. 33 While the National Broadband Map has data about most of the nation’s ISPs, it does not allow a researcher to simply identify all of the competi-tors in a town. Instead, the tool is configured for specific address searches, making it difficult to accurately determine what providers serve an entire area when not all of them offer service at every address in a zip code or town. It also includes Internet service providers that do not offer residential service. About National Broadband Map, National Telecommunications and Information Administration, http://www.broadbandmap.gov/about. 34 Broadband Now also compiles a list of providers in every zip code, sourced from a combination of publicly available and proprietary data and verified by user input. Nick Reese, The Data, BroadbandNow (updated May 27, 2016), http://broadbandnow.com/data. 35 Making comparisons between bundled plans is challenging because there is no set bundle each ISP offers. For example, an ISP may offer four different “triple-play” options (TV, Internet access, and phone) that vary in the number television channels included or the scope of the phone pack-age in addition to the Internet access speed. With most telecommunications providers offering options among basic cable and thousands of chan-nels and different combinations of local, long-distance, and international calling plans, exact, let alone best-fit, comparisons are difficult to find.
on the website that prohibited collecting any pricing in-formation from the site by anyone other than an individual who intended to purchase services. Therefore, some com-munities do not contain complete data about competitor ISPs, which we have noted in the data set.
Seven of the 12 private providers doing business in the communities we studied required a website visitor to en-ter a home address in order to see detailed pricing infor-mation (or in some cases, to see any price at all). In such cases, we used local residential addresses to get past this step and obtain pricing.
The Data We CollectedBelow, we provide a detailed explanation of each cate-gory of information we collected. The data collection task was complex because the industry lacks any standardiza-tion in terms of speed tiers, the specifics of video or phone offerings, and the existence and amounts of up-front fees or promotional discounts. (Some of these ISPs and many of their competitors offered bundled services—packages offering some combination of Internet access, television, and telephone service—but the differences in number of TV channels, the details of phone plans, and other char-acteristics made apples-to-apples comparisons difficult.)
Internet Service Only PlansGiven our resource constraints we decided to focus on in-formation on Internet service only plans.35 For each such plan, we recorded the download and upload speed in megabits per second (Mbps). In two cases where a mu-nicipal provider did not offer any such plan, we recorded the least expensive plan that bundled Internet access with telephone service, and indicated that it was a bundle.
Monthly PricingFor each Internet access plan, we recorded the price the customer is charged for the first month of service. We then determined whether this monthly price was promotional and would increase after some period of time. In such cas-es, we recorded the duration of the discount in months and the price of service once the deal ended, if that in-formation was available. In certain cases, the promotional price plan included multiple tiers of pricing: for example, one price for the first year of service, a higher price for the second year of service, and an even higher price for the

16Community-Owned Fiber Networks | Responsive Communities
third year of service. In those instances, we recorded the lengths of each promotional price interval in months and the new price after that period of time passed.
ContractsWe determined if an ISP required consumers to accept the terms of a contract for its service, and if so, how long that contract lasts. In cases where service plans required con-tracts, we recorded the length in months.
One-Time CostsIn addition to recurring monthly charges, we also recorded any fees or costs that customers had to pay once in the course of acquiring, setting up, or canceling service.
• Installation fees: Some ISPs require professional instal-lation and charge for it; some provide installation for free; and some offer customers a choice between pur-chasing a professional installation or doing a self-in-stallation for a lower price or for free.36
• Activation fees: These are the cost of turning on In-ternet access service, and are sometimes charged in addition to or in lieu of an installation fee.
• Equipment purchase cost: This is the cost of purchas-ing equipment necessary for setting up Internet ac-cess service, such as a modem or router, directly from the ISP. Some ISPs require users to buy equipment from them, while others give customers the option to purchase compatible equipment from another source.
• Termination fees: These are the cost of breaking a ser-vice contract early.
When we encountered costs that did not fit these defini-tions, we noted this as “other” and explained in notes.
Recurring CostsMany ISPs also had additional recurring costs, which we defined as fees or costs that customers pay each month in addition to the monthly Internet access service charge.
• Equipment rental fees: The cost per month of renting equipment for home Internet access service, such as a modem or router, from the ISP. Some ISPs require users to rent the equipment from them, while others give consumers the option customers to purchase compatible equipment from another source. When customers were given a choice, the research team coded the equipment purchase as “not applicable”
36 For the purposes of this survey, when ISPs offered customers a choice between self-installation and professional installation, the research team opted for the professional installation price but noted the cost of self-installation in the survey notes. This coding was based on an assumption that the average first-time Internet access customer might not want or know how to set up a home Internet access connection.37 This kind of recurring cost is distinct from charges for on-site customer assistance or toll-based customer support hotlines, which charge for customer support as needed.38 The raw data from our study is available here: http://dx.doi.org/10.7910/DVN/HHTTF1.39 For the purposes of this survey, when ISPs offered customers a choice between self-installation and professional installation, the research team opted for a professional installation price but noted the cost of self-installation in the survey notes. This coding was based on an assumption that the average first-time Internet access customer might not want or know how to set up a home Internet access connection.
and recorded the cost of the optional equipment in the survey notes.
• Line access fees: Some ISPs charge a monthly fee to cover the cost of maintaining the connection from the ISP’s wired infrastructure to the customer’s home, sometimes called a line access or line maintenance fee. We encountered only one example of line access charges, from TDS Telecommunications in Monticello, Minnesota.
• Customer support fees: Some ISPs charge customers an additional fee for the right to call a customer sup-port line at any time, regardless of whether the cus-tomer actually uses this service.37
A recurring cost that did not match the above descriptions was recorded as “other” and explained in notes.
Network DetailsWe recorded the network infrastructure types: fiber optic cable, coaxial cable, or DSL. For hybrid networks, we did our best to note that the ISP used multiple types of net-work infrastructure.
We documented the process by taking screenshots of all websites from which we obtained information for the sur-vey.38 If we could not find information online, we called the company in question to fill in the details. Some ISPs never provided a full list of all costs associated with taking new service. Any data that we were unable to collect is noted with a "." in the data set.
Calculating and Comparing PricingWe calculated how much a customer would pay each year for four years, on average, after accounting for promotion-al rates, subsequent post-promotional rates, and one-time costs. We reasoned that four years was a reasonable term to consider. A 2010 FCC working paper found that 62 per-cent of surveyed Americans hadn't switched providers in the past three years.39 We also ran calculations for three years (a period of time that would likely benefit private providers, given that they tend to use initial lower teas-er rates) and found that the service of just one additional community-owned FTTH network (Cedar Falls, Iowa) be-came slightly more expensive on average.
Comcast advertises the cost of standard service as a range. We opted to use the lower dollar figure in our calculations.