community participatory approaches in the epidemiology...
TRANSCRIPT

i
COMMUNITY PARTICIPATORY APPROACHES IN THE EPIDEMIOLOGY AND
CONTROL OF TRYPANOSOMOSIS IN CAMELS IN TURKANA DISTRICT, KENYA
KENNEDY MIYORO O. MOCHABO (BVM)
A thesis submitted in partial fulfilment of the requirements for the degree of Master of Science in
Veterinary Epidemiology and Economics.
Department of Public Health, Pharmacology and Toxicology,
Faculty of Veterinary medicine,
University of Nairobi.
© Mochabo 2003

ii
DECLARATION
This thesis is my original work and has not been presented for the award of a degree in any other
university.
Signature. ……………………………………..…………….………..
Kennedy Miyoro O. Mochabo (BVM)
This thesis has been submitted for examination with our approval as University Supervisors:
Signature. …………………………………..…………………………..
Dr. P. M. Kitala (BVM, MSc, PhD)
Signature. ……………………………………..…………………………..
Dr. P. B. Gathura (BVM, MSc, PhD)
Signature. …..…………………………………...………………………..
Dr. W. O. Ogara (BVM, MSc, PhD)

iii
DEDICATION
In memory of my beloved father,
Francis Mochabo Miyoro
And his nephew,
Dr Charles Lwanga Obino
To them, I live to strive to realize their dreams and may the Grace extend His magnanimous
peace to their souls.

iv
TABLE OF CONTENTS
TITLE .......................................................................................................................... I
DECLARATION.........................................................................................................II
DEDICATION........................................................................................................... III
TABLE OF CONTENTS ......................................................................................... IV
LIST OF TABLES ...................................................................................................VII
LIST OF FIGURES ............................................................................................... VIII
LIST OF PLATES .................................................................................................... IX
LIST OF APPENDICES ............................................................................................X
ACKNOWLEDGEMENTS...................................................................................... XI
ABSTRACT..............................................................................................................XII
CHAPTER ONE ..........................................................................................................1
1.0 INTRODUCTION..................................................................................................1
CHAPTER TWO .........................................................................................................4
2.0 LITERATURE REVIEW......................................................................................4 2.1 The camel......................................................................................................................................4 2.2 Epidemiology of trypanosomosis .................................................................................................5
2.2.1 Aetiology 5 2.2.2 History and life cycle 7 2.2.3 Modes of transmission 8 2.2.4 Pathogenesis, clinical signs and pathology 9 2.2.5 Occurrence and prevalence 10 2.2.6 Risk factors 11
2.2.6.1 Host factors 11 2.2.6.2 Environmental factors 12 2.2.6.3 Pathogen factors 13
2.2.7 Immune mechanisms 13 2.3 Diagnosis ....................................................................................................................................14
2.3.1 Parasitological diagnosis 15 2.3.2 Serological diagnosis 16
2.3.2.1 Antibody detection tests 16 2.3.2.2 Antigen detection tests 16
2.3.3 Molecular techniques 17 2.4 Treatment and prevention ...........................................................................................................18 2.5 Control ........................................................................................................................................19
2.5.1 Vector control 20 2.5.2 Use of trypanotolerant animals 21
2.6 Socio-economic impact assessment............................................................................................21 2.7 Community participation ............................................................................................................22
2.7.1 Participatory rural appraisal (PRA) tools 23 2.7.1.1 Advantages and disadvantages of participatory appraisal (PA) tools compared to conventional methods 25

v
CHAPTER THREE ...................................................................................................27
3.0 MATERIALS AND METHODS ........................................................................27 3.1 Study area ...................................................................................................................................27
3.1.1 Description of study area 27 3.1.2 Selection of study area and sites 27
3.2 Data collection ............................................................................................................................30 3.2.1 Participatory rural appraisal (PRA) tools 30
3.2.1.1 Mapping 30 3.2.1.2 Matrices 30
3.2.1.2.1 Local perception of livestock diseases 30 3.2.1.2.2 Seasonal calendars 31 3.2.1.2.3 Control methods 31 3.2.1.2.4 Socio-economic data 31
3.2.2 Proportional piling 33 3.2.3 Trend lines 33 3.2.4 Semi-structured interviews (SSI) 33 3.2.5 Collection of blood samples 34
3.3 Analysis of blood samples ..........................................................................................................34 3.3.1 Latex agglutination test (LAT) 34 3.3.2 Polymerase Chain Reaction (PCR) 34
3.3.2.1 DNA extraction 35 3.3.2.2 Primers and PCR cycling 35
3.4 Data management and analysis...................................................................................................36 3.5 Stakeholders’ workshop..............................................................................................................37
CHAPTER FOUR......................................................................................................38
4.0 RESULTS .............................................................................................................38 4.1 Characteristics of study area .......................................................................................................38 4.2 Participatory mapping.................................................................................................................38 4.3 Matrices ......................................................................................................................................40
4.3.1 Disease matrix 40 4.3.2 Socio-economic matrix 43 4.3.3 Control methods matrix 46 4.3.4 Seasonal calendars 47
4.4 Proportional piling ......................................................................................................................48 4.4.1 Disease incidences 48 4.4.2 Disease mortalities 50
4.5 Trend lines ..................................................................................................................................52 4.6 Diagnosis of surra ......................................................................................................................54 4.7 Stakeholders’ workshop..............................................................................................................56
CHAPTER FIVE .......................................................................................................57
5.0 DISCUSSION .......................................................................................................57 5.1 Participatory mapping.................................................................................................................57 5.2 Matrices ......................................................................................................................................57 5.3 Proportional piling ......................................................................................................................60 5.4 Trend lines ..................................................................................................................................61 5.5 Diagnosis ....................................................................................................................................61 5.6 Stakeholders’ workshop..............................................................................................................61

vi
CHAPTER SIX ..........................................................................................................63
6.0 CONCLUSIONS AND RECOMMENDATIONS 63 6.1 Conclusions.................................................................................................................................63 6.2 Recommendations.......................................................................................................................64
REFERENCES...........................................................................................................65
APPENDICES ............................................................................................................82

vii
LIST OF TABLES
Table 3.1: 2X2 table for computing kappa statistic…………………………………………………… 36
Table 4.1: Types of livestock kept by the Turkana and the three important diseases affecting each type
of livestock. in Lapur Division, Turkana District, 2001-2002……………………………………40
Table 4.2: Summarised matrix scoring of disease-signs in Lapur Division, Turkana District, 2001-2002...42
Table 4.3: Summarised matrix scoring of disease-economic indicators in Lapur Division, Turkana
District, 2001-2002………………………………………………..………………………………45
Table 4.4: Summarised matrix scoring of control methods of surra in Lapur Division, Turkana
District, 2001-2002………………………………………………….…………………………….46
Table 4.5: Summarised seasonal calendar on the occurrence of camel diseases in Lapur Division
Turkana District, 2001-2002……………………………………………………………………...48
Table 4.6: Diagnostic results of surra as determined by pastoralists and their corresponding blood
results on LAT and PCR in Lapur Division, Turkana District, 2002…………...………………...54

viii
LIST OF FIGURES
Figure 3.1: Map of Kenya showing location of the study area, Lapur Division, Turkana District, 2003.
.........................................................................................................................................................29
Figure 4.1: A map constructed on the ground by members of the four Adakars in Lapur Division,
Turkana District, 2001-2002. ..........................................................................................................39
Figure 4.2: Mean annual incidences of camel diseases relative to the healthy in Lapur Division,
Turkana District, 2001-2002...........................................................................................................49
Figure 4.3: Mean annual incidences of camel diseases in Lapur Division, Turkana District, 2001-2002
.........................................................................................................................................................50
Figure 4.4: Mean annual mortalities of camels due to diseases relative to the healthy in Lapur Division,
Turkana District, 2001-2002...........................................................................................................51
Figure 4.5: Cause-specific mean annual mortalities of camels in Lapur Division, Turkana District,
2001-2002………………………………………………………………………….…………………...52
Figure 4.6: Trend lines depicting variation of surra, CBPP, and veterinary drugs delivery levels
(VDDL) in Lapur Division, Turkana District from 1978-2002……………………………………. …53
Figure 4.7: PCR results of 24 camel blood specimens presented for surra diagnosis and their
corresponding LAT results in Lapur Division, Turkana District, 2001-2002………………………….55

ix
LIST OF PLATES
Plate 3.1: Matrix scoring by women from Lapur Division, Turkana District, 2001-2002. ....................32
Plate 3.2: Matrix scoring by men elders from Lapur Division, Turkana District, 2001-2002................32
x
LIST OF APPENDICES
Appendix 1: Disease-signs matrices constructed by the 12 groups of informants on the ground in Lapur
Division, Turkana District, 2002.....................................................................................................82
Appendix 2: Disease-socio-economic indicators matrices constructed by the 12 groups of informants
on the ground in Lapur Division, Turkana District, 2002...............................................................84
Appendix 3: Disease control matrices constructed by four groups of informants on the ground in Lapur
Division, Turkana District, 2002.....................................................................................................87
Appendix 4: Seasonal calendar matrices constructed by 4 groups of informants on the ground in Lapur
Division, Turkana District, 2002.....................................................................................................88
Appendix 5:A filter paper used to impregnate camel blood in Lapur Division, Turkana District, 2002.
.........................................................................................................................................................89

xi
ACKNOWLEDGEMENTS
It is my humble pleasure to extend thanks to my supervisors, Drs. P. M. Kitala, P. B. Gathura
and W. O. Ogara for their wise counsel and encouragement from the development of the project, the
research itself and to the final preparation of this manuscript. They also sacrificed their time to come to
the field in the course of my research to share the challenging experiences, of which I am very grateful.
I am deeply indebted to OAU/IBAR – CAPE Unit for having extended their generous financial
and technical assistance towards the project in Turkana. Without their invaluable contribution, this
project would not have materialized. I also acknowledge ITDG for supporting the project, in terms of
hosting me and providing logistical support. For this, I am most grateful.
I am particularly indebted to the Turkana pastoralists who participated in the research with a lot
of enthusiasm. Special thanks to Dr G. K. Gitau for having influenced me to pursue a postgraduate
course when I was almost deserting the veterinary profession.
Great compliments are due to Zablon Njiru of KETRI, who assisted in camel blood sample
analysis. His technical assistance in the PCR analysis was indeed invaluable.
I will not forget to express gratitude to my colleagues, Eregae and Kaitho for their unswerving
source of inspiration especially in the field where at times life became intolerable. Together we
soldiered on and weathered many storms.
Many thanks to all of you who I have not mentioned here but in one way or another directly or
indirectly contributed to my desire to complete my studies. To you all I thank you most sincerely.
Last but not least, I owe insurmountable respect to one special friend, Esther, for her constant
support during the exigencies of my course and for typing this manuscript. Indeed, you are a wonderful
person.

xii
ABSTRACT
This thesis describes a study of the use of participatory approaches in the epidemiology and
control of camel trypanosomosis (surra) in Turkana District of Kenya. The objectives were: 1) to
evaluate the ability of the Turkana to diagnose, treat and control camel trypanosomosis; 2) to estimate
the incidence of and mortality due to camel trypanosomosis in Turkana District; and 3) to assess the
socio-economic impact of camel trypanosomosis on the Turkanas.
Four animal camps (adakars) were conveniently selected for the study. In each adakar, three
groups of informants were selected to form a total of 12 groups for participatory exercises. Each group
comprised of five to eight informants. The participatory methods used were mapping, matrices,
proportional piling, trend-lines and semi-structured interviews. In addition, blood samples were
collected from camels for trypanosomosis diagnosis using Latex Agglutination Test (LAT) and
Polymerase Chain Reaction (PCR). At the end of the study, a stakeholders’ workshop involving the
Turkana pastoralists, the Intermediate Technology and Development Group (ITDG), the District
Veterinary Officer (DVO) and the Veterinary Officer (VO) of the area, the chief and assistant chief,
and investigators, was held.
The participatory map showed key features including forests, rivers as well as areas with
wildlife (buffaloes, lions, wild cats, elephants, gazelles, foxes, jackals, warthogs, kudus, ostriches,
leopards) and biting flies (camel flies, houseflies, tsetse flies, mosquitoes, ticks and lice). The
important presenting signs for camel trypanosomosis mentioned were overt ventral oedema, loss of
appetite, reduced milk yield, rough hair coat, abortion, low birth-weight calves, small udders,
emaciation, listlessness, swollen joints, coughing, shrunken hump at terminal stages, and death within
3-5 months of infection. The post mortem lesions listed were watery and fibrous meat, lack of fat
around the heart, and watery bone marrow. The informants were in good agreement on most of the
signs of surra with Kendall’s level of concordance (W) ranging from 0.675, 0.753, 0.860 to 0.885 for
infertility and abortion, skin lesions, loss of hair and oedema respectively. The causes of surra
according to the informants were stagnant water shared by livestock and elephants, rain, a riverine tree

xiii
called esokon (Salvadora persica), a shrub called edome (Cordia sinensis), a type of pasture called
epoo (Grewia spp) occurring during the rainy season, and biting flies. There was good agreement (W =
0.547 to W= 0.729) between the informants on the uses of camels which included provision of milk,
meat, blood, fat, and hides, payment of dowry, barter trade, payment of fines, killing to seal marriages
in the absence of an ox, slaughtering to appease the ancestors, as an indicator of wealth, initiation of
elders to higher levels, and slaughtering to mark burial ceremonies of elders. On the control of surra,
the indigenous method appeared to be the most preferred and included drenching of sick animals with
a variety of herbs mixed with soups from goat, wildcat, bird or donkey meat. Branding of oedematous
areas on the body of affected camels was also used for treatment.
The seasonal calendar showed that most cases of surra occurred immediately after the rainy
season as well as in the dry season. The results of proportional piling showed that almost half (49.3%)
of the camel population suffered from one disease or another over the past one year with surra
(lotorobuo) recording the highest (11.4%) incidence. The annual incidence of surra was highest in
adult camels (15%) relative to calves (6.9%). This pattern was also reflected in surra mortalities with
the rate in adults being 9.9% and in calves 5.2%. According to the results of the trend line, the levels of
surra were highest in 1978 but declined thereafter to a stable state from 1996 to 2002. There was poor
agreement between the diagnosis of surra by pastoralists and by LAT (kappa = 0.1875) and PCR
(kappa = 0.32). However, LAT and PCR had excellent agreement (kappa = 0.75).
Based on the study findings, it is concluded that the camel plays an important role in the lives
of the Turkana pastoralists and that surra is an important camel disease, which exerts a heavy toll in
terms of morbidity and mortality. There is a need to conduct a community-based, integrated control
programme of surra in Turkana District.

1
CHAPTER ONE
1.0 INTRODUCTION
rypanosomosis is one of the most researched diseases in Africa and is known to be a major
constraint to the expansion and production of livestock and their products on approximately
10 million km2 of land, covering 37 countries (FAO, 2000; Mugalla, 2000). The economic impact of
trypanosomosis is made up of direct and indirect losses from the disease (Budd, 1999). Direct losses of
trypanosomosis include loss in productivity (in terms of milk, meat, manure), mortality, abortion, as
well as costs of prevention and treatment. Indirect losses include loss of potential for production (i.e.
the production that could be achieved if trypanosomosis did not occur). Most people associate
trypanosomosis with tsetse flies (Glossina spp), but camel trypanosomosis is exceptional (Evans et al.,
1995). Mostly, camels suffer from trypanosomosis caused by Trypanosoma evansi that is transmitted
mechanically independent of tsetse flies. Camels are also affected to a lesser extent by the tsetse-
transmitted trypanosome species T. brucei (Evans et al., 1995). Trypanosoma evansi, the parasite
causing camel trypanosomosis (surra), is cosmopolitan wherever camels are found (Losos, 1980;
Luckins, 1988). In Kenya, 95% of cases of surra have been attributed to T. evansi (Wilson et al.,
1981). The disease manifests itself in different forms: acute, sub-acute, chronic and inapparent (Wilson
et al., 1983). The chronic form is the most common and is characterised by severe anaemia, general
wasting, reduced milk yield, infertility, abortions and death in some animals (Olaho-Mukani et al.,
1993).
The Turkana acquired camels about 150 years ago from the Gabbra and Rendille whom they
drove out of what is now known as Turkana District (Evans et al., 1995). The value of the camel
among individual Kenyan pastoral groups varies. The Turkana, who are originally cattle pastoralists,
still value the camel as the cow (Ngeiywa, 1992) whereas the Gabbra regard the camel husbandry as a
mainstay of their subsistence.
T

2
The nomadic pastoralists have successfully managed their livestock and range resources for
many years using their experience and conventional wisdom acquired through generations. To date,
there is a dearth of published information on trypanosomosis in Turkana District and generally on
camel problems in Kenya (Ngeiywa, 1992). The annual report of the Turkana District Veterinary
Office (DVO) indicates that trypanosomosis is an endemic problem. The DVO reported 169 and 455
treated cases of trypanosomosis in cattle and camels, respectively, for the year 2000 (Ministry of
Agriculture and Rural Development, 2000). Camel trypanosomosis is the most widespread and
probably most economically important disease of camels (Kohler-Rollefson et al., 2001).
The camel has a special significance in the drought-stricken and semi-arid parts of Africa and
Asia. Majority of the world’s 19 million camels are kept by pastoralists who depend on them for food,
transport and income (Kohler-Rollefson et al., 2001). The camel provides milk even during drought
periods and for this reason has been referred to as a ‘desert dairy’ (Evans et al., 1995).
Community participation and the role it plays in animal health services has been reviewed by
Leyland (1991). The extent to which a disease is recognised as a problem is often dependent on the
efficacy of the means for diagnosing it and observing its occurrence (Whiteside, 1958). The Turkana
pastoralists have been known to possess knowledge in the field of animal health (Catley and Leyland,
2001). Participatory rural appraisal (PRA) is a systematic data gathering activity carried out by a
multidisciplinary team to reveal the unidentified facts about a community (Lelo et al., 1995). The core
of PRA study includes spatial, time-related, social and technical data. Veterinarians and livestock
workers have used and are presently using a variety of PRA methods to investigate animal health
problems (Catley, 1999). The tools include interviewing, scoring and ranking, and visualisation such
as seasonal calendars, maps, Venn diagrams and flow diagrams.
Providing veterinary services to the communities according to the western model has proven
difficult due to lack of infrastructure and the veterinarians’ limited experience on camels under
pastoral system. In addition, most veterinarians are not adept with diagnosis and treatment of camel
3
diseases due to the relatively limited research on camels and also the fact that camel diseases are rarely
taught in veterinary schools. Thus, participatory approach (PA) methods become necessary.
Furthermore, there is extensive body of traditional knowledge or ethnoveterinary knowledge that
pastoralists have been known to possess and on which they rely to diagnose or treat many diseases
(Kohler-Rollefson et al., 2001). It is conceivable that the proper collection, collation and analysis of
data from the pastoralists would enable the relevant authorities to formulate and implement policies
that foster improvement in pastoral incomes as well as improve the existing livestock pastoral
production systems. In order to assess the impact of trypanosomosis and ability of the Turkana
pastoralists to diagnose the disease, reliable and accurate data are needed on the incidence of
trypanosomosis, the methods of control, both conventional and traditional.
Given this general background, the specific objectives of the study were:
1. To evaluate the ability of the Turkana in diagnosis, treatment and control of
camel trypanosomosis in Turkana District;
2. To estimate the incidence of and mortality due to camel trypanosomosis in
Turkana District;
3. To assess the socio-economic impact of camel trypanosomosis on Turkana pastoralists.
4
CHAPTER TWO
2.0 LITERATURE REVIEW
2.1 The camel
The camel (Camelus dromedarius – one-humped camel, dromedary) is a member of the old
world group of camels. The new world camels consist of the genera Vicuna and Lama. The genus
Camelus consist dromedarius and bactrinus (two-humped) species (Ngeiywa, 1992; Schwartz and
Dioli, 1992). Dromedaries are the type camelids found in Kenya (Evans et al., 1995).
The camel’s contribution to the national economy is important. However, it is difficult to do an
economic evaluation by a conventional way using parameters like cash flow analysis, gross margin
calculation, because most camel products are confined within the consuming community and often
traded in kind rather than cash (Schwartz and Dioli, 1992). In this dynamic world, the camel has
undergone change from being a ‘ship of the desert’ to being a ‘food security animal’ and thus, there
has been increased interest on matters pertaining to utilization and management of arid and semi-arid
lands (ASALs) where camels are usually found. Countries such as Somalia (with the largest camel
population in the world), Sudan, Ethiopia, Djibouti, Mauritania and Kenya depict the camel on their
currency notes.
Camels are the most valuable species for 75% of Kenya’s land area, which is ASAL and
recently is degrading rapidly towards a desert (Evans et al., 1995). It is estimated that Kenya has
between 700,000-780,000 camels that are kept mostly by the nomadic pastoralists in ASALs in the
northern region of the country (Schwartz and Dioli, 1992). Camels in Kenya are kept mainly for meat,
milk, blood, transportation, and for bush control in ranches. Amongst the pastoralists, camel meat is
only eaten when adult male castrates are slaughtered during drought, on ceremonial occasions or when
a camel dies from disease or predation (Field and Simpkin, 1985). The Turkanas use camel hides for
making ropes, donkey carriers, sandals, and women skirts (Ngeiywa, 1992). In addition, camels are

5
also given out as bride price as well as being used as a bank, i.e., as security against drought, diseases
and other natural calamities that affect smaller stock seriously (Ngeiywa, 1992).
Camels are essential in the subsistence of pastoralists, as they do not compete for food with
other types of livestock due to their grazing/browsing behaviour. Camel milk has been found to have
high levels of vitamin C, which is important for pastoralists. Furthermore, camels have the capability
of converting poor quality and rangeland forage into milk and meat. Thus, the Government of Kenya
efforts to reclaim ASALs and the establishment of ranches should be encouraged (Ngeiywa, 1992).
The Turkana were originally cattle-keepers but acquired camels through intertribal raids from
their camel-keeping neighbours, Gabbra and Rendille (Evans, et al., 1995). The value of the camel
among individual Kenyan pastoral groups varies. The Turkana pastoralists, still value the camel as
some sort of cattle (Ngeiywa, 1992; Evans, et al., 1995) whereas the Gabbra regard camel husbandry
as the mainstay of their subsistence.
2.2 Epidemiology of trypanosomosis
2.2.1 Aetiology
Trypanosomoses are caused by a protozoan parasite of the genus Trypanosoma, order
Kinetoplastida. The parasites have characteristic organelles, a kinetoplast and a flagellum (Soulsby,
1982; FAO, 2000). Trypanosomes parasitize all classes of vertebrates: fish, amphibians, reptiles, birds
and mammals (including humans). Haematophagous invertebrate vectors transmit the parasites
cyclically from host to host except Trypanosoma equiperdum, which is transmitted venereally in
equines. Naturally, trypanosomes are digenetic parasites, which require two hosts to complete their life
cycle. They multiply in blood, tissues or body fluids of the host.
Trypanosomoses form a group of diseases, each of which is caused by a different pathogenic
species of trypanosomes (FAO, 2000). Radostitis et al. (1994) have classified them as:
a) Nagana (African trypanosomosis) is caused by Trypanosoma brucei, T. congolense, T.
vivax and T. simiae. They are cyclically transmitted by tsetse flies (Connor, 1994) and

6
mechanically by other biting flies in a range of animals (Wells, 1972; Roeder et al.,
1984; FAO, 2000);
b) Surra is caused by T. evansi in horses and camels and is transmitted mechanically by
biting flies (Connor, 1994);
c) Dourine is caused by T. equiperdum in horses and is venereally transmitted (Hoare,
1972);
d) Chagas disease is caused by T. cruzi mainly in dogs and humans and is transmitted by
bloodsucking bugs (De Raadt and Seed, 1977);
e) Trypanosomiases caused by T. theileri are non-pathogenic stercorarian in cattle and are
transmitted mechanically (Theiler, 1903).
The trypanosomes, which cause sleeping sickness in humans and nagana in domestic animals,
are of salivarian type. A light microscope can detect the different morphological variations. The
bloodstream forms are trypomastigotes. From the posterior portion arises a flagellum that extends
anteriorly, connected to the body by an undulating membrane, and is 8-35µm long (Hoare, 1972;
Teixeira, 1987; FAO, 2000). In some species, the flagellum may extend free of attachment to the
undulating membrane, beyond the anterior extremity. Within the cell, there is a kinetoplast, found at
the posterior position at the base of the flagellum. The kinetoplast may be either marginal or sub-
terminal. A single nucleus is located halfway along the body (FAO, 2000).
In the tsetse fly, trypomastigotes transform to epimastigotes in which the kinetoplast moves
anteriorly to be adjacent to the nucleus (Ikede, 1986; FAO, 2000). These cyclical changes from
trypomastigote to epimastigote and back to trypomastigote in the course of the life cycle of a
trypanosome are now clear due to ultrastructural and biochemical studies. These studies have revealed
the parasite’s survival tactics in the bloodstream, where it faces immunological defences of the host
and the digestive enzymes of the tsetse fly’s gut.

7
Morphological differences have been used to identify the different species of trypanosomes
after staining in thin blood smears with Giemsa, Leishman’s or other Romanovsky stains. Apart from
morphology, motility, host specificity and tsetse transmissibility have also been used for identification,
but currently characterisation methods include the use of isoenzyme typing, analysis of kinetoplast
DNA and DNA hybridization (Gibson, 1985; Gardiner, 1989; Masake et al., 1997; Desquesnes et al.,
2001). T. congolense and T. vivax are monomorphic parasites and T. brucei polymorphic. T.
congolense is the smallest (8-20 µm long), has no free flagellum and the kinetoplast is usually sub-
terminal and marginal. T. vivax is medium (20-26 µm long), has a long free flagellum and often,
terminal kinetoplast. T. brucei (23-30 µm long) has a long free flagellum, a conspicuous undulating
membrane and a sub-terminal kinetoplast; sometimes there are short stumpy forms, which range from
17-22µm in length but with a well developed undulating membrane. T. simiae is between 12 and 24
µm in length. T. theileri, a stercorarian species, is non-pathogenic and the largest (up to 100 µm in
length) and demonstrates a well-developed host-parasite relationship (Hoare, 1972; FAO, 2000). T.
evansi is morphologically identical to the slender forms of the subgenus Trypanozoon, which include
the brucei group T. brucei brucei, T. brucei gambiense, T. brucei rhodesiense, T. evansi and T.
equiperdum (Evans et al., 1995; FAO, 2000).
2.2.2 History and life cycle
The first report of trypanosomosis was from India in 1880 in horses and camels caused by
Trypanosoma evansi (Waitumbi, 1990; Connor, 1994; Evans et al., 1995). Balbian named the
causative agent after its discoverer, Graffith Evans, who found trypanosomes in the blood of horses
and camels. The local Indians had a local name for the disease – Surra, meaning emaciated. Several
species of tsetse-transmitted trypanosomes cause African trypanosomoses in domestic animals that are
collectively referred to as ‘nagana’, a word derived from the Zulu name ‘nakane’, meaning tsetse fly
disease (Connor, 1994).

8
Trypanosomes reproduce by longitudinal binary fission both in the host and in the vector,
although a sexual process seem to occur in the tsetse fly (Tait and Turner, 1990). Multiplication in host
culminates in mature trypanosomes that stop dividing and are pre-adapted to the conditions in the next
cyclical cycle in the tsetse fly. When the tsetse fly ingests a blood meal, the un-adapted parasites die,
hence the necessity of the bloodstream trypanosomes (trypomastigotes) to change to procyclic forms
(epimastigotes) (Ellie et al., 1999). T. vivax has the simplest migratory pattern limited only to the
proboscis and pharynx. A complete cycle takes 5-13 days (Hoare, 1972; Gardiner, 1989).
2.2.3 Modes of transmission
Transmission is either by inoculation of parasites with saliva or by contamination of mucosa or
broken skin with the vector’s faecal material, voided during a blood meal. On this basis, the
mammalian trypanosomes are classified into salivaria and stercoraria groups respectively (Hoare,
1972; FAO, 2000).
Two main modes of transmission have been reported which include the cyclical and the non-
cyclical transmission. There are about 23 Glossina (tsetse flies) species involved in the cyclical
transmission. They are grouped according to their preferred habitats as: forest species (G. fusca, G.
brevipalpis, G. longipennis), riverine species (G. palpalis, G. tachinoides, G. fuscipes) and savannah
species (G. morsitans, G. austeni, G. pallidipes, G. swynnertoni and G. longipalpis). The latter group
pose the greatest challenge to the livestock industry and man (Jordan, 1976).
The non-cyclical transmission of trypanosomes is aided by biting flies and thus, in the absence
of Glossina, the transmission is maintained in the ecosystem. Biting flies, such as Tabanids (horse
flies), Stomoxys and Hippoboscids (camel flies), transmit trypanosomes mechanically through their
mouthparts when they feed on more than one host within a short interval because the trypanosomes
remain infective for only a short period (Anonymous, 1959; Roeder et al., 1984; Evans et al., 1995). T.
evansi may be transmitted to a lesser extent by ticks of genera Hyalomma, Dermacenter and
Rhipicephalus (Boid et al., 1985).
9
Transplacental transmission has been recorded but is of less significance in the epidemiology
of trypanosomosis (Ogwu and Nuru, 1981; Ikede, et al., 1988). Nasal and conjuctival transmission
have also been reported (Stephen, 1986). Dogs may also become infected by ingestion of infected
carcasses (Evans et al., 1995). Experimentally, trypanosomes may be transmitted by syringes using
infected blood (Soulsby, 1982).
2.2.4 Pathogenesis, clinical signs and pathology
Trypanosomosis is a wasting disease, which leads to a slow progressive loss of body condition
accompanied by anaemia, weakness, collapse and death (FAO, 2000). Its exact pathogenesis is not
clearly understood (Losos and Chouinard, 1979; Losos, 1986). Following inoculation of metacyclic
trypanosomes by the fly during feeding, there is a local skin reaction called a chancre which is more
pronounced in a more susceptible host and slight or absent with some strains (Luckins and Gray, 1978;
Akol and Murray, 1982; FAO, 2000). The trypanosomes change into trypomastigote form and enter
the blood stream directly or through the lymphatics. Their behaviour thereafter depends on the species
of trypanosome transmitted (Ikede, 1986). The parasites multiply causing parasitaemic waves with
host’s defences reacting (Nantulya, 1986), causing intermittent fever in the host. Three features arise
including anaemia, tissue damage, and immunosuppression, which are prominent in the pathology
(Urquhart, 1980; FAO, 2000). Trypanosomes can pass through the placenta and into the foetus causing
abortion in pregnant cows (Ogwu et al., 1986).
In camels, there is reduced appetite and water intake, the hump disappears as the disease
progresses, the hair coat is dull and rough with loss of hair at the tail. There is oedema under the belly
visible especially in the morning, pregnant females may abort and newborn calves of infected dams
usually die. There is pallor of mucous membranes of the eyes, a fluctuating temperature with initial
peaks of up to 410 C and the urine usually has a characteristic smell (Evans et al., 1995; FAO, 2000;
Kohler-Rollefson et al., 2001).

10
There are no pathognomonic signs of the disease in the camels and any clinical examination is
of little importance for a conclusive diagnosis (FAO, 2000), but the parasites can be detected in blood
13 to 16 days after an infective fly has had a meal. The parasitaemia causes a large number of red
blood cells (RBCs) to be removed from circulation by cells of the mononuclear phagocytic system
(MPS) in the spleen, bone marrow, lungs and haemal lymph nodes. The removal of a large number of
RBCs leads to a fall in packed red cell volume (PCV) to below 25% or even to as low as 10%. This
results in anaemia and the affected animals become dull, anorexic, listless, with ocular discharges, and
loss of body condition (Urquhart, 1980; Murray and Dexter, 1988; Evans et al., 1995; FAO, 2000).
There is lymphadenopathy, pale mucous membranes, occasional diarrhoea and oedema of the throat
and the underlying sub-cutaneous tissue. Semen ejaculate quality of bulls and rams is affected (Sekoni
et al., 1988) impacting negatively on fertility (Ikede et al., 1988). In females, oestrous cycles become
irregular and eventually cease (Llewelyn et al., 1988). A cerebral form occurs with T. brucei infection
alone or in mixed infections with other trypanosome species (Masake et al., 1984; Whitelaw et al.,
1988; Wellde et al., 1989). Animals become emaciated and die within 2-4 months as a result of
anaemia, circulatory disturbances and myocardial damage leading to congestive heart failure (Murray
et al., 1979). The camel may live up to four years with sub-clinical infections and some may
eventually recover and eliminate the parasite (Evans et al., 1995). Necropsy lesions, like the clinical
signs, are non-specific (FAO, 2000). However, the gross lesions that would be observed in chronic
cases of surra include dull, dry, scaly and inelastic coat. The carcass is generally emaciated, pale and
may be icteric sometimes. The lymph nodes are enlarged and oedematous on incision. There is
hydrothorax, hydropericardium and ascites. In acute cases, the spleen is enlarged but in chronic cases,
it is atrophic (Connor, 1994; Radostits et al., 1994; FAO, 2000).
2.2.5 Occurrence and prevalence
Trypanosomes are insect-borne and their occurrence depends on vector dynamics (Jordan,

11
1986). In Africa, 37 countries are infested with tsetse flies covering an estimated 10 million km2 of
land surface (Anonymous, 1999; FAO, 2000). Majority of camels suffer from trypanosomosis caused
by T. evansi that is spread mechanically and independent of tsetse flies. Camels are also affected to a
lesser extent by the tsetse-transmitted trypanosome species T. brucei (Evans et al., 1995). T. evansi
parasite is cosmopolitan wherever camels are reared (Losos, 1980; Luckins, 1988). Camel
trypanosomosis is endemic in most camel herds (Njiru et al., 2000) and 95% of camel trypanosomosis
has been associated with T. evansi in Kenya (Wilson et al., 1981).
2.2.6 Risk factors
The sequel to infection with the salivarian trypanosomes is not always a disease. For a disease
to result, there must be an inter-play of many factors that relate to the vectors, wild hosts, livestock and
their management, the trypanosomes and the climatic conditions (Whiteside, 1958).
2.2.6.1 Host factors
In natural hosts and some domestic animals, the salivarian trypanosomes do not evoke clinical
signs. This suggests that there is a host-parasite equilibrium (Mulla and Rickman, 1988). Some breeds
of indigenous cattle tolerate light to moderate challenges by limiting the multiplication of
trypanosomes in blood (Njogu et al., 1985; Murray and Dexter, 1988; Mwangi et al., 1998). This
phenomenon is called trypanotolerance and is both genetically and environmentally determined
(Morrison et al., 1985; Roelants, 1986; Murray et al., 1990). The breeds that have been found to
exhibit this phenomenon are the humpless or taurine referred to as N’Dama cattle as well as the
African buffalo (Murray et al., 1981; Akol and Murray, 1986; Grootenhuis et al., 1990) and in some
breeds of goats and sheep (Kanyari et al., 1983; Mutayoba et al., 1989). In East Africa, the Maasai
Zebu shows reduced susceptibility, but the Orma Boran has superior tolerance (Njogu et al., 1985;
Mwangi et al., 1998).
12
In trypanotolerant animals, it has been found that some may effect self-cure, but some
individual animals may come down with the disease due to stress (Murray et al., 1982). Stress occurs
in late pregnancy and early in lactation in animals that are more susceptible (Murray et al, 1981; Ogwu
and Njoku, 1987). Inter-current infections (e.g. helminthosis), also stressful, may accentuate the
severity of the disease. Trypanotolerance may also be reduced by low plane of nutrition (Maclennan,
1974) and when animals have to trek for long distances in search of water and pasture in the dry
season. This is especially common in the nomadic pastoral communities. Age has some effect on
resistance to trypanosomosis; cattle born in an infested area do not immediately succumb to infection,
though they acquire trypanosomal infection when young, whereas cattle brought to such areas readily
do so (Maclennan, 1974; Murray et al., 1982). Surra affects camels of all ages with a higher incidence
of disease in sub-adult camels shortly after weaning (Evans et al., 1995).
2.2.6.2 Environmental factors
In the tsetse-infested tracts of Africa, populations of game have thrived for many years with the
flies and trypanosomes, and have therefore established a stable host-parasite relationship (Connor,
1994). Tsetse flies caught around game reserves have been found to have higher infection rates and
thus, animals grazing near game reserves or parks are at a higher risk (Whiteside, 1958). There is
usually a build-up of fly vector populations (tabanids, hippoboscids, stomoxys) during the rains due to
a good humid environment for breeding hence resulting in increase of new infections. Towards the end
of a dry season, pastoralists usually take their animals to riverine or swampy areas, which are also
favourable grounds for these flies (Evans et al., 1995).
The degree of risk depends on the challenge, i.e., the number of infective tsetse/vector fly bites
that an animal experiences in a given time (Rogers, 1985). But, the interaction of infective
tsetse/vectors, host preference, host susceptibility and the virulence of the parasite determine the true
challenge or risk.
13
2.2.6.3 Pathogen factors
The developmental cycle of trypanosomes in the fly varies from species of parasite. For
instance, T. vivax has adapted very well, with a relatively simple complete cycle in a fly of five to
thirteen days, compared to one of between 17 to 45 days for T. brucei. Thus, more flies are found
infected by T. vivax parasite (Hoare, 1972; Maclennan, 1974; FAO, 2000). T. evansi has adapted to an
entirely mechanical, non-cyclical mode of transmission by blood-sucking flies other than tsetse and
infects a wide range of animal hosts (Connor, 1994). Mixed trypanosome infections have been found
to be more prevalent since the advent of antigen-trapping enzyme immuno-assays (Nantulya et al.,
1989). Mixed infection rates of 2.75% and 0.014% for T. congolense/T. vivax and T. congolense/T.
brucei, respectively, have been observed in Kenya (Tarimo-Nesbitt et al., 1999). T. vivax has been
found to produce higher levels of parasitaemia than other species of trypanosomes (Connor, 1994).
2.2.7 Immune mechanisms
The ability of trypanosomes to manifest a prolonged infection in a susceptible host is due to
their antigenic variation (Bernards, 1984). The bloodstream parasite (trypomastigote) has a dense
glycoprotein coat, which is anchored to the parasite’s surface membrane (Roditi and Pearson, 1990).
When there is high parasitaemia, the host mounts a specific immunologic response against the
bloodstream parasites producing a complement-mediated lysis of all trypanosomes of that antigenic
type. At some point, some trypanosomes as few as one in 100,000 in numbers activate the gene that
codes for a different protein (Nantulya, 1986). The parasites with a new coat, survive to produce
another parasitaemic peak and the cycle repeats. The antigenic variation is due to the variable surface
glycoproteins (VSGs) expression, which constitutes variable antigen types (VATs) Nantulya (1986).
When the trypanosomes shield themselves from host defence system, it leads to a prolonged course of
infection. The cycles continue until the animal succumbs or the immune mechanism catches up with
the parasite and the animal recovers (Masake, 1980; FAO, 2000). This phenomenon of successive
peaks of parasitaemia brings about the clinical sign of intermittent fever.
14
Immunosuppression has been reported in animals infected with trypanosomosis making them
prone to secondary bacterial infections (Murray and Dexter, 1988). This feature occurs in both
trypanosusceptible and trypanotolerant cattle, but the only distinguishing feature between them is the
humoral response (Taylor et al., 1999).
2.3 Diagnosis
The diagnosis of trypanosomosis is basically divided into clinical, parasitological and
serological. For research purposes, especially in epidemiological surveys, sensitive and specific
diagnostic methods, as well as their applicability in the field, are prerequisites. In fact, the accuracy of
the work will be authenticated if two or more methods that complement each other are used (FAO,
2000). The specific clinical diagnosis of trypanosomosis is difficult due to non-specific clinical signs
coupled with intermittent fever and low parasitaemias (FAO, 2000). Comparisons of different methods
of diagnosis have been done (Nantulya, 1990). Diagnostic procedures vary according to the tools
available and the purpose of the tests (FAO, 2000).
In many tsetse-infested areas, conventional diagnostic facilities are not available, and thus
clinical signs of trypanosomosis are usually used for making a tentative diagnosis. Indeed,
veterinarians and farmers are known to use response to treatment as a confirmation of infection by
trypanosomes (Connor, 1994). There are some traditional tests for diagnosis of surra that have been
documented: Sand Ball Test which involves taking soil that a camel has urinated on, shaping it into a
ball, letting it dry for 15 minutes and then breaking it open and smelling (if the smell is sweet, then the
camel has surra); the other test is the Tail-hair Test, which involves pulling out hair from the tail of a
camel, and if the hair comes out easily with some tissue sticking to it, then that is taken as a
confirmation of surra (Kohler-Rollefson et al., 2001).
For confirmatory diagnosis, parasitological demonstration needs to be done using blood, either
capillary blood from the tip of the tail or venous blood from ear or jugular veins and lymph fluid
(FAO, 2000). Cerebrospinal fluid is used in case of human sleeping sickness (Wellde et al., 1989).
15
2.3.1 Parasitological diagnosis
Parasitological methods include: microscopic examination of blood; parasite concentration
techniques; and animal inoculation. The easiest and most frequently used of the three techniques is
direct microscopic examination of blood, either by wet blood film method, or as stained thick and thin
smears (FAO, 2000). In the wet film smear, the trypanosomes are seen either directly between blood
cells or indirectly as they cause blood cells to move. Fresh lymph preparations and thin smears of
lymph may also be used (FAO, 2000). These smears (thin blood and lymph) are useful for
morphological identification of different trypanosomes under the light microscope (Monzon et al.,
1990; Nantulya, 1990).
Haematocrit centrifugation, a concentration method, is one of the early techniques that has
been used to detect equine trypanosomosis (Kihurani, 1995). Buffy coat (Woo technique) (Woo, 1969)
has been used by either examining directly or by making a smear from a buffy coat/plasma junction (4-
5 mm above the white ring in a micropipette) under a light microscope for presence of motile
trypanosomes (FAO, 2000). One can also assess the degree of anaemia, by reading the packed red
blood cell volume (PCV) of blood in the centrifuged tube.
The oedematous fluids from genitalia, urticarial plaques and vaginal washings have been
centrifuged for use in the diagnosis of T. equiperdum (Hagebock, 1992).
The sub-inoculation of blood and other body fluids into susceptible experimental animals is
another diagnostic technique for trypanosomosis, especially when parasitaemia is scanty (FAO, 2000).
In epidemiological studies, a parasitological diagnosis of trypanosomes in biological vectors is
sometimes necessary (FAO, 2000).

16
2.3.2 Serological diagnosis
Serological techniques have been used in the diagnosis of trypanosomosis. They have proved
particularly useful for the subgenus Trypanozoon, which invade and multiply in the connective tissue.
They have been found good for epidemiological surveys in research (Hopkins et al., 1998).
2.3.2.1 Antibody detection tests
Antibody techniques include complement fixation test (CFT) that has been used in the
diagnosis of T. equiperdum in equines (Hagebock, 1992). Enzyme-linked immunosorbent assays
(ELISA) and radioimmunoassays (RIA) have also been used (Hagebock, 1992). Indirect fluorescent
antibody test (IFAT) has been used in herd diagnosis of trypanosomes (Connor, 1994). Card
agglutination test for trypanosomosis (CATT), the simplest for T. evansi, has also been used
(Nantulya, 1990; Luckins, 1992). When antibodies are detected, however, they do not distinguish
between current and past infections, and also cross-reactions may occur between trypanosome species
(Luckins, 1977).
2.3.2.2 Antigen detection tests
Enzyme immunoassays have been developed for the detection of antigens rather than
antibodies as a means of diagnosis (Nantulya and Lindqvist, 1989). These assays detect the circulating
antigens of T. congolense, T. vivax and T. brucei in blood of infected animals. Latex agglutination test
(LAT) has also been used specifically for T. evansi (Nantulya, 1994).
The demonstration of trypanosome antigens is equivalent to parasitological diagnosis and thus
an indicator of current infection if an animal has not been recently treated for the disease (Voller and
De Savginy, 1981; Nantulya and Lindqvist, 1989).
Parasite detection techniques are generally 100% specific but their sensitivity is relatively low.
Masake and Nantulya (1991) compared the sensitivity of antigen ELISA with the buffy coat technique
and observed that antigen ELISA detected 94.3% and 82.5% of T. congolense infections in goats and

17
cattle, respectively. In contrast, the buffy coat technique detected only 10.9% and 19.7% of T.
congolense infections in goats and cattle, respectively.
The ELISA technique may give false negative results even in parasitologically proven cases.
This occurs in sera from acute or early phase of infection and has been observed in T. congolense, T.
vivax and T. brucei infections in cattle and goats (Nantulya and Lindqvist, 1989; Masake and
Nantulya, 1991). The monoclonal antibody used in antigen ELISA is directed at an internal or somatic
unsecreted antigen that is only released after trypanosome lysis. Thus, in early infection, before the
first parasitaemic peak, the test can give negative results due to absence or low levels of antigens in
blood (Nantulya and Lindqvist, 1989; Masake and Nantulya, 1991). It is, therefore, important to
combine antigen detection ELISA with the parasitological techniques for effective diagnosis of
tryapanosomosis (Nantulya, 1990; Masake and Nantulya, 1991).
2.3.3 Molecular techniques
Molecular techniques are suitable for detecting parasites in the mammalian host and in the
insect vector and currently are the main research tools (FAO, 2000). The principle of molecular tests is
the expression of the occurrence of nucleotides, which are specific for a trypanosome subgenus,
species or even a type or strain. Two main methods are used: DNA-probes and polymerase chain
reaction (PCR) (FAO, 2000).
In DNA-probes, the sample to be examined is heated to separate the two strands of DNA,
which are then fixed to the membrane to avoid recombining after cooling. A probe, which is a linear
sequence of nucleotides prepared to correspond with a similar sequence of the parasite in the sample,
is added. The probe will link (hybridise) with that part of parasite DNA and this will be detected when
the probes are labelled with radioactive isotopes or enzymes for use in ELISA.
The PCR is based on the use of enzyme DNA polymerase that will amplify the sequences of
DNA bases, until sufficient DNA material is produced to detectable levels. The parasite DNA is
denatured by heat and two primers are used that are short sequences of nucleotides (one for each DNA
18
strand) complementary to a specific site on one of the two single parasite DNA strands. The primers
attach to the complementary sites and the DNA polymerase then starts to reproduce the rest of each
complementary sequence, which follows from that primer. Thus, the polymerase amplifies minute
DNA bases when the cycle is repeated. The PCR product is then subjected to electrophoresis and the
bands are detected by a special staining. The procedure is extremely sensitive and detects minute levels
of parasite DNA. However, it is relatively expensive.
In order to detect trypanosomes and avoid false positive results, it is possible to combine PCR
and the DNA probes technology (Gibson, 1985; Gardiner, 1989; Nantulya, 1990; Majiwa, 1998; FAO,
2000; Desquesnes et al., 2001).
2.4 Treatment and prevention
There are a number of drugs available for treatment and prevention of trypanosomosis and
approximately a million doses are administered annually in Africa (FAO, 2000). The drugs can be
grouped as curative, prophylactic or sanative (Boyt, 1980; Raynaud et al., 1989). The curative drugs
are homidium chloride (Novidium), homidium bromide (Ethidium), quinapyramine sulphate
(Trypacide, Antrycide), diminazene aceturate (Berenil, Veriben), isometamidium chloride
(Samorin), suramin (Naganol), and melarsenoxide cysteamine (Cymelarsan). The prophylactic
drugs are quinapyramine sulphate and isometamidium chloride. The latter drug becomes prophylactic
only if used at a high dose (Boyt, 1980).
A sanative drug is one that has not been in use for sometime but when used will eliminate
trypanosomes that are resistant to the drugs used previously. It should provide moderate prophylaxis
and avoid development of resistance to the prime drug, but this has not been well implemented,
leading to a multiple resistance to curative, prophylactic and sanative drugs (Whiteside, 1958; FAO,
2000).
Suramin and quinapyramine sulphate are the two drugs available for the treatment of T. evansi
infections in camels (Evans et al., 1995). Suramin is administered at a dosage rate of 12mg/kg body

19
weight intravenously for curative and prophylactic activity. Quinapyramine, when administered as
methyl sulphate at a dosage rate of 3-5 mg/kg body weight subcutaneously is for curative purposes but
as a pro-salt chloride/methyl sulphate mixture at 5-8.3 mg/kg body weight is for curative and
prophylactic activity. Most drugs are either not curative such as homidium bromide, or are too toxic
for camels such as diminazene aceturate.
The management and control of trypanosomosis will continue to depend on the proper usage of
the few available trypanocides, especially the strategic deployment of the sanative drugs in order to
reduce development of drug resistance plus the continued use of environment-friendly vector control
programmes (FAO, 2000; Anene et al., 2001).
The present strategy of chemotherapy and chemoprophylaxis is faced with the following
technical drawbacks: a limited number of drugs for use; the emergent drug resistance; cross-resistance
to the present drugs; toxicity of the drugs.
2.5 Control
The institution of a programme to either control or eradicate trypanosomosis in an animal
population must be based on knowledge of the extent of the disease in that population, factors
associated with its occurrence, the facilities required for control, and the costs and benefits involved
(Thrusfield, 1986). This is possible through disease monitoring and surveillance. In addition,
surveillance is required to determine whether there are new factors affecting the occurrence of the
disease.
Trypanosomosis control has been carried out in endemic countries by use of three approaches
coupled with modified management: vector population control; chemoprophylaxis; and use of
trypanotolerant animals (Anene et al., 2001). The aim of prevention is to break the vector transmission
cycle in camels. The application of synthetic pyrethroids for the control of Tabanidae and Muscidae
has been effective in cattle (Evans et al., 1995). Sheep and goats, which are often kept close to camels,
act as asymptomatic carriers of T. evansi from where camels can get the infection (Evans et al., 1995).

20
There is no vaccine available for use due to the trypanosome antigenic variation made possible by their
constant change of the glycoprotein surface coat (Radostitis et al., 1994; Taylor et al., 1999).
2.5.1 Vector control
The threat of animal trypanosomosis can be removed in endemic areas by elimination of the fly
vectors (FAO, 1989). The tsetse control objective is to reduce the tsetse population and hence disease
challenge to levels where the risk of infection is either very low, or to manageable levels with drugs, or
by use of trypanotolerant livestock (Pollock, 1986a; FAO, 1989). Tsetse eradication is the complete
elimination of the vectors but this can only be possible if the area to be cleared is relatively small or is
isolated from other infested areas (Pollock, 1986b).
Recently, more environment-friendly methods have been devised including use of targets, traps
and pour-ons. The latter method has an added advantage of reducing tick infestation (Lohr et al., 1991;
Mwongela, 1991; Bauer et al., 1992; Thomson and Wilson, 1992) through the use of synthetic
pyrethroids. The new generation of pour-on insect repellents are helpful in controlling new infections
(Schwartz and Dioli, 1992). The targets and traps, usually impregnated with insecticides, have been
found to be effective, simple, cheap and could be constructed and maintained by local communities
(Dransfield et al., 1991; Williams et al., 1993). The shape, colour, and odour attractants, play a role in
the attraction of tsetse flies to traps (FAO, 1989). Blue colour attracts tsetse, while black and
ultraviolet, reflecting white, entice them to land on a device or enter the trap (FAO, 1989; Vale, 1993).
Natural host odours are the most effective and include buffalo and cattle urine (Owaga, 1985;
Hassanali et al., 1986; Dransfield et al., 1986; Saini, 1986). Carbon dioxide and 1-octen-3-ol, which
are components of breath (Vale and Hall 1985; Dransfield et al., 1986; FAO, 1989), and ketones (e.g.
acetone which is part of the ox odour), have also been found to be effective.
Biological control methods have also been proposed and include use of predators such as ants
and wasps to feed on the tsetse pupae and adults, respectively (Pollock, 1986a). The sterile male
technique is another practical approach for control of tsetse populations (Nantulya and Moloo, 1989).

21
In this method, large numbers of male flies are sterilised by irradiation and released into the field
where they mate with virgin females. The resultant eggs are unfertile and no further development takes
place (Pollock, 1986b). The method is expensive requiring a lot of capital and high technology.
The insecticides, applied to screens or targets, are environmentally acceptable alternatives to
ground or aerial spraying (FAO, 1989). The more recent technique involves use of insecticide-treated
animals, especially cattle as attractive living targets. However, the technique suffers from the
limitation that requires animals to have a density of at least 10 cattle/km2 and be well distributed
(Bauer et al., 1992).
2.5.2 Use of trypanotolerant animals
The use of innate resistance of the host, a phenomenon referred to as trypanotolerance, which is
both genetically and environmentally determined (Morrison et al., 1985; Roelants, 1986; Murray et al.,
1990), is being exploited also in the control of trypanosomosis (FAO, 2000). The breeds that have
been found to be tolerant such as the N’Dama and Orma Boran cattle are being encouraged for use in
trypanosome endemic areas (Maichomo et al., 1999).
2.6 Socio-economic impact assessment
The economic impact of trypanosomosis is made up of direct and indirect losses from the
disease. The direct losses include loss in productivity (in terms of milk, meat, manure), mortality,
abortion as well as costs of prevention and treatment (FAO, 2000). The indirect losses include loss of
potential for production (i.e. the production that could be achieved if trypanosomosis did not occur).
Trypanosomosis is an expensive disease to control and thus, an economic analysis (costs and
benefits) become essential to show the extent of socio-economic losses due to the disease (Thrusfield,
1986). The socio-economic losses directly due to the disease include mortality, morbidity, reduced
productivity, retarded growth, abortion and infertility (Finelle, 1974; Thrusfield, 1986). The costs, on
the other hand, include those of detection and treatment of infected animals (veterinary services, drugs,

22
equipment and operating expenses), chemoprophylaxis and tsetse fly control and research (Finelle,
1974).
The socio-economic impact of tryapanosomosis control is very important in setting up priority
self-sustaining control measures (Budd, 1999). Positive social impacts have been observed in
community control programs in Lambwe Valley, Kenya, where trypanosomosis prevalence decreased
by 84% and 60.6% in high-challenge and low-challenge areas, respectively (Barret and Okali, 1998).
However, in Busia, Kenya, there was failure of a tsetse control program using targets and traps
attributed to the non-incorporating of community participation in the project.
The cost evaluation of tsetse control against chemoprophylaxis has been done in cattle where it
was found that the lower the stock carrying capacity and the lower the incidence of trypanosomosis, it
was more economical to protect the animals by drugs rather than tsetse control (Holmes and Scott,
1982).
2.7 Community participation
Concepts of community participation began to feature in the 1970s. Cohen and Uphoff (1980)
suggested that participation requires people’s involvement in decision-making, programme
implementation, sharing the benefits of development programmes and evaluating them. However, to
date, there are varied definitions that can be subject to misinterpretations (Pretty, 1994; 1995). Pretty
(1995) has given a comprehensive outline of community participation at seven levels with the
underlying theme relating to balance between outsiders and local people ownership in development
activities ranging from decision-making, information and resources.
Rapid rural appraisal (RRA), participatory rural appraisal (PRA) and similar terms have
become common since 1980s. The methods are designed to overcome some of the limitations of the
conventional survey and research methods in developing countries with the aim of increasing the
involvement of local people in development activities. The PRA involves appreciation of the local
knowledge and culture and includes interviews, scoring and ranking, and visualisation methods by the

23
local people (Catley, 1999; Catley et al., 2002a). The PRA is more of a facilitation rather than
investigation by outsiders. In PRA, researchers become facilitators on the local analysis and ownership
of information that lead to community action plans (CAPs) (Chambers, 1997). In the PRA approach,
gathering data is done in group discussions, using mostly informal discussions, visual aids and
observations.
Leyland (1991) has reviewed community participation and its role in animal health services.
The experiences on community-based animal health approaches in Kenya have been documented
(Catley, 1999). There is substantial evidence that participatory appraisal (PA) methods do generate
information that precisely describes local people perceptions on animal health problems. The PA
methods are relatively resource-friendly and are easily flexible according to given circumstances and
information needs (Catley, 1999). In addition, there is an increasing interest by research centres to
involve rural communities in the definition of research problems and identification of their solutions
(Catley and Irungu, 2000). Community-based programmes look promising with regard to sustainability
(Budd, 1999). Where a disease control program is not sustained, major problems such as re-infection
may appear (Barret and Okali, 1998). Project end is ultimately more important than the project itself,
as what continues represents the real contribution of the project, hence its sustainability (Olubai and
Woodhouse, 1999). In any collective and sustained activity of the community, there is need to
recognise the already existing local methods used by the community in the control of trypanosomosis
(Catley and Irungu, 2000). Thus, the need to assess the local characterisation of the disease in the local
names vis-à-vis the scientific disease names.
2.7.1 Participatory rural appraisal (PRA) tools
Participatory rural appraisal (PRA) is an organized data gathering procedure carried out by a
multidisciplinary team to reveal the unidentified facts about a community (Lelo et al., 1995). Several
types of field data form the core of PRA study that includes spatial, temporal, social and technical data.
Veterinarians and livestock workers have used and are currently using a wide range of PRA methods

24
to investigate animal health problems (Catley, 1999). The methods include interviewing, scoring and
ranking, and visualisation tools such as seasonal calendars, maps, Venn diagrams and flow diagrams.
The PA methods, like disease matrix scoring, are good when used with conventional methods
especially where the livestock keepers have a well-developed indigenous knowledge (Catley et al.,
2002a).
The PA methods have evolved from qualitative research methods and experiences. The
qualitative research data validity is based on cross-checking the data that is derived from different
sources. The process is also referred to as triangulation. Also, qualitative research aims at describing
and understanding problems within a specific environment rather than produce results that can be
extrapolated to describe a wider population (Catley et al., 2002a). There is an argument by some
participatory researchers regarding the validity of PA methods in that they cannot be usefully
determined from a quantitative research perspective and the validity criteria objective researches
(Pretty, 1994; 1995). For donors, the PA require reversals in funding patterns with more resources
required as the project unfolds and new objectives and activities appear (Catley and Irungu, 2000).
Most PA methods involve interviewing skills and often follow-up questions are asked after the
completion of a diagram, map or scoring tool (Catley, 1999). The semi-structured interview (SSI) has
some relation to veterinary medicine in history taking and subsequent tentative diagnosis. The SSIs
prompts one to have a checklist of some questions then the follow-ups (Catley and Mohammed, 1996;
Catley, 1999).
For the visualisation methods, mapping has been used in animal health surveys and involves
construction of a map on the ground using locally available materials (Catley, 1999). For spatial data,
maps and transects are used (Lelo et al., 1995). For temporal data, the tools that have been employed
are timelines, trend lines and seasonal calendars.
Venn diagrams have been used in more general agricultural surveys to show the institutional
relationships between different players in a particular community (Catley, 1999). Ranking and scoring

25
methods have been used whereby informants are required to compare items or problems in pairs and
decide the most important and the results presented in a matrix with a total rank calculated (Catley,
1999). The scoring methods are made more visual when a matrix is drawn on the ground with items
along one axis and indicators along the other axis and counters like stones used to score. This method
has been used in northern Somalia to understand associations between different types of ticks and
health problems (Catley and Aden, 1996).
Another visually oriented scoring method is proportional piling (Catley, 1999). The method
involves the use of a large pile of counters like stones. The counters are usually 100 that the informants
are asked to distribute on different items to show the relative sizes or importance. The results from
proportional piling may be presented in pie charts.
2.7.1.1 Advantages and disadvantages of participatory appraisal (PA) tools compared to
conventional methods
According to Mugenda and Mugenda (1999), IIED (1994), ITDG-EA (2001) and Catley et al.
(2002b), the following advantages and disadvantages of PA methods compared to conventional
methods are implied:
The use of PA tools normally generate largely a qualitative data that are detailed, dynamic and
defines local peoples’ problems and solutions whereas the conventional (Traditional) methods only
yield data that are chiefly quantitative and stable (data whose facts do not change). Thus, the PA
methods have been qualified as a bottom-up approach compared to the top-down approach of the
conventional approaches. The PA approaches are holistic in nature whereby all aspects of the
phenomenon in question are studied by use of multiple methods in a process referred to as
triangulation. The focus of conventional methods is usually on selected predefined variables. The
community has a greater access, control, understanding and analysis of information when the PA tools
are employed, but in the conventional ones, the community does not apparently own the information.

26
In addition, this makes the project unsustainable, because researchers are seen as ‘outsiders’ and
decision-making is entirely from them. On this basis, the PA methods attempt to break the cultural
barriers and researchers are seen as ‘insiders’ which in turn, lead to collection of useful information
about the community, particularly, with involvement of local people in decision-making. The PA has
been found to be cheaper and faster in gathering data because the data collection is simultaneous with
analysis and informal tools are used compared to the conventional methods.
The qualitative data arising from use of PA tools, leads to the debated question of reliability
and validity whereas the conventional methods yield quantitative data, which are assumed to be
reliable and validated. Predictions and controls for qualitative data, arising from PA tools are
impossible (Mugenda and Mugenda, 1999). This indicates that the participative appraisal collected
data cannot be extrapolated. The use of PA methods can also be time consuming (some tools are
involving). Furthermore, the minority groups based on, e.g., age, gender, wealth can be overlooked
particularly when an inexperienced person conducts PA.
27
CHAPTER THREE
3.0 MATERIALS AND METHODS
3.1 Study area
3.1.1 Description of study area
The study was carried out in Lapur division of Turkana District in the Rift Valley Province of
Kenya between February and April 2002. The district occupies the northwestern part of Kenya and
covers an area of 70,000 km2. It borders Lake Turkana to the East, Uganda to the West and Sudan and
Ethiopia to the North. Turkana district is divided into 17 administrative divisions.
The district receives an annual average rainfall of 120mm and temperatures are high and fairly
uniform in the range of 24 – 380C. The area spans agroecological zones III to VII and has a human
population of approximately 447,000 people (Central Bureau of Statistics, 1999). The geographic
features include low-lying open plains, mountain ranges, Lake Turkana and the river drainage patterns.
The altitude of the mountain ranges is between 1500 and 1800 metres above sea level (Turkana
development plan, 2002-2008). According to the records at the Turkana District Veterinary Office,
there are approximately 200,000 head of cattle, over 2.5 million small ruminants and about 115,000
camels.
3.1.2 Selection of study area and sites
The northern part of the district (Lapur Division) was conveniently selected due to logistical,
rough terrain and security reasons. A map of Kenya showing Turkana District and the location of the
study area is shown in Figure 3.1. The study was conducted during the dry season when the animals
had been driven to the hills near the Ethiopia and Sudan borders and Lapur Division was nearest.
Lapur Division consists of three locations with an area estimated at 4650 km2 and has a human
population of approximately 13,700 people. The Division has four main Adakars (animal camps) that
were used as the sampling units. The Adakars were identified by local administration since each
Adakar has a leader. The leaders (Emurons) from every Adakar identified the members who formed 12

28
groups of informants for participatory research processes. Each Adakar provided three groups
comprising of five to eight informants.

29
Figure 3.1: Map of Kenya showing location of the study area, Lapur Division, Turkana District, 2003. Adapted from Turkana District Development Plan, 2002-2008

30
3.2 Data collection
3.2.1 Participatory rural appraisal (PRA) tools
Participatory rural appraisal (PRA) tools were used as described by Catley (1999), Catley and
Irungu (2000) and Catley et al. (2001).
3.2.1.1 Mapping
Participatory mapping, a tool for collecting spatial data of a community (Lelo et al., 1995), was
used to identify the geographical boundaries of the Adakars and included other features such as,
natural resources, infrastructure, seasonal camel movements, and the distribution of flies. A group of
informants sketched four maps on the ground and after triangulating the results, they were collapsed
into one blueprint to represent the study area as per Catley (1999).
3.2.1.2 Matrices
3.2.1.2.1 Local perception of livestock diseases
Semi-structured interviews (SSI) were used to gain an understanding of the local perception of
livestock diseases in general, and specifically on camel diseases. The groups of informants were asked
to mention the most important diseases of every livestock they kept. In addition, they were asked to
give the five most important diseases of camels. Through pair-wise ranking, the signs associated with
the five diseases mentioned were obtained. Matrix scoring was used to obtain the local perceptions of
clinical signs in the progression of the five diseases of camels. The signs were subsequently related to
modern veterinary thinking. The five diseases were represented using familiar objects (e.g. bone, dung,
stick, stone), which were placed along the top X-axis of the matrix while their signs (indicators) were
illustrated along the Y-axis. The informants were asked to score the signs one by one according to their
relative importance while maintaining 25 stones per each sign across the 5 diseases and the results
triangulated. The level of agreement across the groups was determined by the method of Seigel and
Castellan (1994). Plates 3.1 and 3.2 show some informants during a matrix scoring.
31
3.2.1.2.2 Seasonal calendars
Seasonal calendars, a time-related data source (Lelo et al., 1995), were used to describe the
seasonal prevalence of the five important camel diseases identified in the matrix scoring. One group of
elders per Adakar was used for this exercise. The elders were asked to divide a calendar year according
to their perception. The seasons by their local names were represented by objects (e.g. dry leaf, stick or
fresh leaf) on the X-axis and cards with names of the diseases written on them placed along the Y-axis.
The four groups of informants were asked to score the prevalences of the diseases one by one
according to the seasons and the results triangulated. The level of agreement across the groups was
determined by the method of Seigel and Castellan (1994).
3.2.1.2.3 Control methods
Different control methods of surra, indigenous and modern, such as use of herbs, drugs,
vacating an area and vector control that determined through conducting SSIs on four informant groups,
were placed on the X-axis and their indicators (cost, effectiveness, ease in use and availability) on the
Y-axis. The four groups of informants were asked to score the different control options against the
indicators and the results triangulated. The level of concordance between the groups was determined
by the method of Seigel and Castellan (1994).
3.2.1.2.4 Socio-economic data
After conducting semi-structured interviews (SSI) with the informants on the losses associated
with important camel diseases, they were organised into 12 groups for purposes of matrix scoring. The
method of scoring was done according Catley and Mohamed (1996). The diseases were placed on the
X-axis and the indicators of economic losses (milk, meat, wool, hides, abortion, fertility, death, sale
value, treatment costs, dowry, ceremonies) obtained through the SSI, on the Y-axis.

32
Plate 3.1: Matrix scoring by women from Lapur Division, Turkana District, 2001-2002.
Plate 3.2: Matrix scoring by men elders from Lapur Division, Turkana District, 2001-2002.

33
3.2.2 Proportional piling
Proportional piling was used to estimate the relative incidences and mortality of the five most
important camel diseases during the past one year. Before the informants could score they were asked
to classify the camels into different age-groups, i.e., adults and the young (suckling and weaners).
Every informant maintained a pile of 100 stones for each age-group. First, the informant split the pile
of stones into two relative to the number of camels sick and healthy during the past one year. This
activity was repeated for 59 informants and provided estimates of annual incidences of the diseases. In
addition, each informant was asked to remove some of the already allotted stones representing the sick
camels to indicate the number that died during the past one year. This activity provided estimates of
the annual mortalities due to the diseases.
3.2.3 Trend lines
Information was collected on trends of surra prevalences for the past 20 or so years on the key
events the community thought were important. The four informant groups were prodded to remember
important events in the community. This activity was used to approximate the years the events took
place. They were also asked how long they have been rearing camels and when they first saw a case
of surra. As a cut-off date, 1978 was adopted because the informants associated it with the death of
an elder called Lowoton hence they called it the year of Lowoton. These events were then related to
the prevalence of camel trypanosomosis. The community informants drew graphs on the ground. Two
sticks were placed on the ground to represent the Y and X axes. The X-axis represented the key
events over the years and on the Y-axis, the informants were asked to score using stones to show the
levels of surra. This tool was used in combination with SSIs.
3.2.4 Semi-structured interviews (SSI)
Semi-structured interviews were employed at every stage in combination with the above tools
of PRA as described by Catley (1999), Catley and Irungu (2000) and Catley et al. (2001). Through
use of SSIs, the informant groups were specifically probed more on the disease of interest
(trypanosomosis) with regard to the signs, causes, treatment and control. They were also used to

34
understand the community’s perception and beliefs of livestock diseases. Besides conducting SSIs,
there was observational estimation of livestock numbers kept in all the four participating adakars.
3.2.5 Collection of blood samples
Whole blood was collected from camels pre-identified by the owners as trypanosomosis cases
and non-cases by a jugular venipuncture into 10ml siliconised plain vacutainers (Becton-Dickinson
and company, Rutherfold, New Jersey, USA). The blood was stored overnight at room temperature for
serum separation. The serum was used for trypanosomosis diagnosis using Latex Agglutination Test
(LAT). In addition, the collected blood was immediately spotted onto filter paper (Appendix 5), air-
dried according to Hopkins et al. (1998), and stored in a plastic jar with silica gel awaiting testing for
trypanosomosis in the laboratory using the polymerase chain reaction (PCR).
3.3 Analysis of blood samples
3.3.1 Latex agglutination test (LAT)
In the field, LAT was done on the camel blood samples according to the method described by
Nantulya (1994). In this test, a suspension of latex particles are sensitised with a monoclonal antibody
against a T. evansi internal antigen. The specific antibody, bound to the latex particles, captures the
antigen molecules in the serum. Several latex particles combine to multiple epitopes of the antigen
molecule to form clusters, which can be visualised with the naked eye. Briefly, the test was conducted
by placing 100µl of serum onto a special test slide. An equal volume of Suratex® reagent was placed
next to the drop of serum. The two drops were mixed with a stirring rod to cover the surface area of the
circle. The test slide was then tilted and rotated manually and the slide examined under a clear light for
any evidence of agglutination.
3.3.2 Polymerase Chain Reaction (PCR)
Laboratory analysis of blood samples on the dried filter papers was done using polymerase
chain reaction (PCR) as described by Saiki et al. (1988).

35
3.3.2.1 DNA extraction
DNA extraction from the filter papers was done with minor modifications according to Boid et
al. (1999). Briefly, a 6 mm diameter disc was cut from the dried blood spot and placed in a 0.5 ml
microcentrifuge tube with 200 µl of sterile water. The tube was incubated at 370 C for 30 minutes and
then centrifuged at 12000 rpm for 2 minutes. The supernatant was removed and discarded. Sterile
water (200 µl) was added and the tube centrifuged at 12000 rpm for one minute, and the supernatant
removed and discarded. A 200 µl of Saponin lysis buffer (0.2% NaCl, 0.15% Saponin and 1 mM
EDTA) was added, the sample vortexed, centrifuged for 1 minute and the supernatant discarded.
Sterile water (200 µl) was added, pause-centrifuged, and the supernatant discarded. A 100 µl of water
was added and the tube incubated at 1000 C for 30 minutes. The tube was then centrifuged at 13000
rpm for 4 minutes, the supernatant transferred into a new tube and stored between -40 to -200 C if not
immediately used.
3.3.2.2 Primers and PCR cycling
Oligonucleotide primers for trypanosome characterisation used were those described for
subgenus Trypanozoon by Moser et al. (1989). Briefly, 50-µl reaction mixtures contained 10 mM Tris-
HCl pH 8.3, 50 mM KCl, 1.5 mM MgCl2, 0.01% gelatin, 200 µM of each of the four deoxynucleoside
triphosphates (dNTPs), oligonucleotide primers (TBR 1&2 specific primers) at 1 mM, 10 µl of DNA
template and 1.5 units of FastStart Taq DNA polymerase (Roche®).
The typical PCR reaction involved an initial step at 940 C for 1 minute to denature the template.
Subsequent cycles involved a second denaturing at 940 for 30 seconds, annealing at 600 C for 45
seconds and extension at 720 C for 30 seconds. In total, 30 cycles were done. Elongation was
continued at 720 C for five minutes.
A 15 µl of each amplified sample was subjected to electrophoresis using 1.5% agarose gel
stained with 1 µg/ml ethidium bromide and photographed under ultraviolet illumination. A positive
control (with reference DNA) and negative control (without DNA) were added for each reaction.
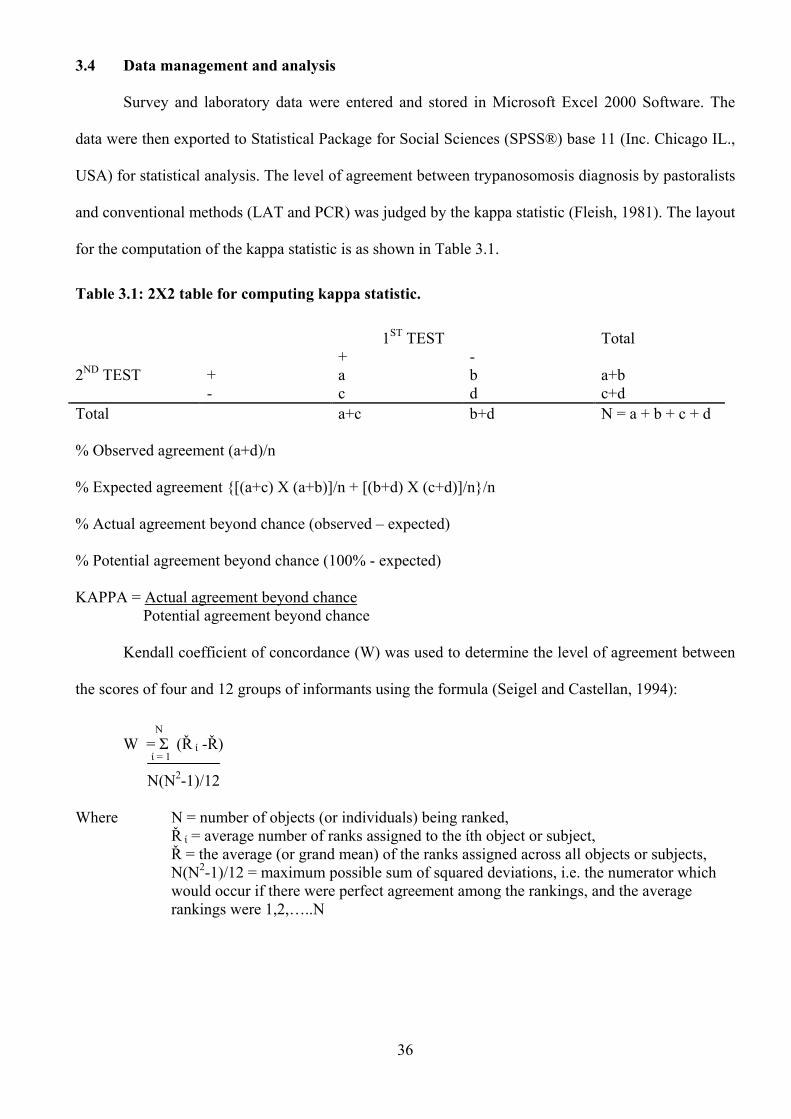
36
3.4 Data management and analysis
Survey and laboratory data were entered and stored in Microsoft Excel 2000 Software. The
data were then exported to Statistical Package for Social Sciences (SPSS®) base 11 (Inc. Chicago IL.,
USA) for statistical analysis. The level of agreement between trypanosomosis diagnosis by pastoralists
and conventional methods (LAT and PCR) was judged by the kappa statistic (Fleish, 1981). The layout
for the computation of the kappa statistic is as shown in Table 3.1.
Table 3.1: 2X2 table for computing kappa statistic.
1ST TEST Total + -
+ a b a+b 2ND TEST - c d c+d
Total a+c b+d N = a + b + c + d % Observed agreement (a+d)/n
% Expected agreement {[(a+c) X (a+b)]/n + [(b+d) X (c+d)]/n}/n
% Actual agreement beyond chance (observed – expected)
% Potential agreement beyond chance (100% - expected)
KAPPA = Actual agreement beyond chance Potential agreement beyond chance
Kendall coefficient of concordance (W) was used to determine the level of agreement between
the scores of four and 12 groups of informants using the formula (Seigel and Castellan, 1994):
N W = Σ (Ř ί -Ř)
ί = 1
N(N2-1)/12 Where N = number of objects (or individuals) being ranked, Ř ί = average number of ranks assigned to the ίth object or subject, Ř = the average (or grand mean) of the ranks assigned across all objects or subjects, N(N2-1)/12 = maximum possible sum of squared deviations, i.e. the numerator which
would occur if there were perfect agreement among the rankings, and the average rankings were 1,2,…..N

37
3.5 Stakeholders’ workshop
After a preliminary analysis of the results in the field, a summarised report was presented in a
seminar to the pastoralists and other stakeholders. The seminar was held at Kokuro and those present
were the members of the four Adakars, the Turkana District Veterinary Officer (DVO), and the
Veterinary Officer (VO) of the area, the hosting NGO (ITDG), the chief and his assistant chief. The
objective of the seminar was to have a forum for discussing the best options for the control of surra.

38
CHAPTER FOUR
4.0 RESULTS
4.1 Characteristics of study area
Lapur, division of Turkana District where the study was carried out is shown in Figure 3.1.
Members from four Adakars participated in the study. The approximate numbers of livestock kept by
the four Adakars were: cattle (950); sheep and goats (20,000); donkeys (500); and camels (200). These
were rough estimates as it was not possible to get the exact numbers due to security reasons.
4.2 Participatory mapping
The collapsed map sketched by the four groups of informants is shown in Figure 4.1. The
map shows natural features such as water sources, vegetation, mountains as well as services like
markets and points for procurement of animal drugs. It also shows the Turkana neighbours, Toposas
and Dongiros from Sudan, and Merilles from Ethiopia.
Flies were mostly found along the rivers and mountains and included camel flies
(Lolingokor), houseflies (Loporeit), tsetse flies (Lopodokongor), mosquitoes (Ng’isurut), and biting
flies (Longicet). Ticks (Emadang’) and lice (Ng’ilach) were also said to be abundant. Wild animals
found within and around the study area included: buffaloes, lions, wild cats, elephants, gazelles,
foxes, jackals, warthogs, kudus, ostriches and leopards.
During the dry season, livestock are moved upstream into the mountains and brought
downstream into the plains during the rainy season as shown on the map.
Turkanas are pastoralists who move from place to place in search of pasture and water for
their livestock and therefore Adakars are not constant with regard to size and location. Occasionally,
due to security reasons, Adakars may merge or even move altogether from one area to another.

39
Figure 4.1: A map constructed on the ground by members of the four Adakars in Lapur Division, Turkana District, 2001-2002.
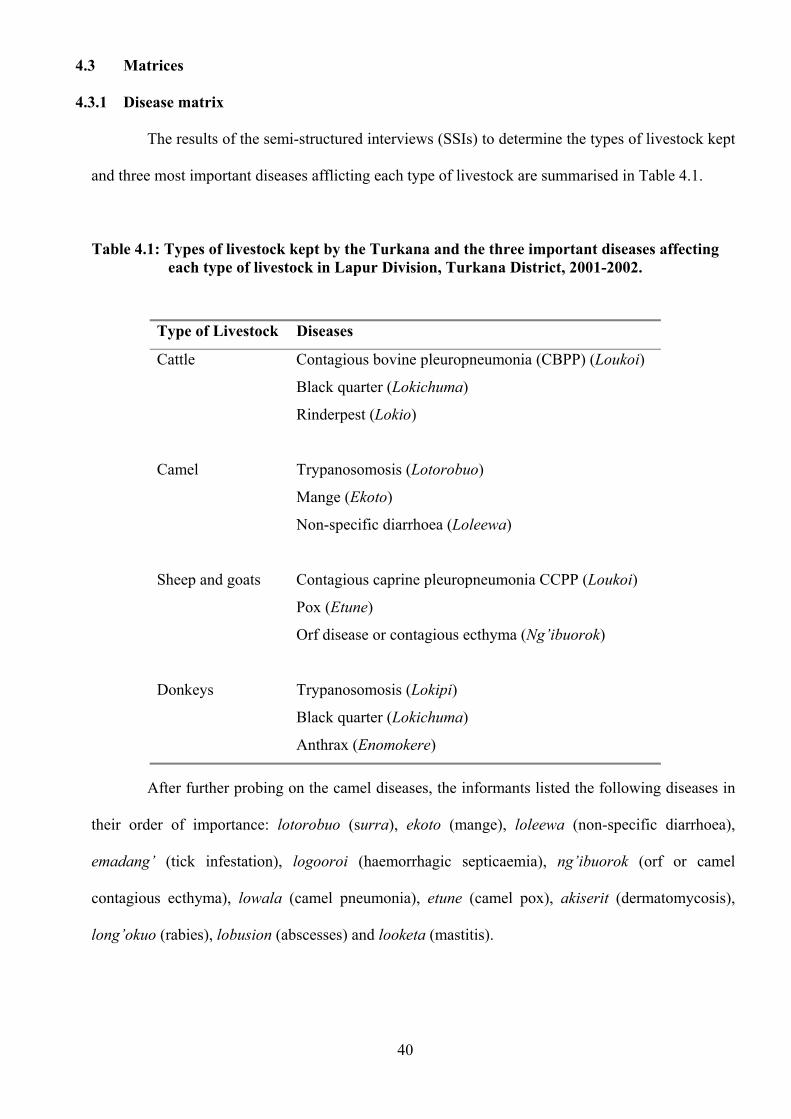
40
4.3 Matrices
4.3.1 Disease matrix
The results of the semi-structured interviews (SSIs) to determine the types of livestock kept
and three most important diseases afflicting each type of livestock are summarised in Table 4.1.
Table 4.1: Types of livestock kept by the Turkana and the three important diseases affecting each type of livestock in Lapur Division, Turkana District, 2001-2002.
After further probing on the camel diseases, the informants listed the following diseases in
their order of importance: lotorobuo (surra), ekoto (mange), loleewa (non-specific diarrhoea),
emadang’ (tick infestation), logooroi (haemorrhagic septicaemia), ng’ibuorok (orf or camel
contagious ecthyma), lowala (camel pneumonia), etune (camel pox), akiserit (dermatomycosis),
long’okuo (rabies), lobusion (abscesses) and looketa (mastitis).
Type of Livestock Diseases
Cattle Contagious bovine pleuropneumonia (CBPP) (Loukoi)
Black quarter (Lokichuma)
Rinderpest (Lokio)
Camel Trypanosomosis (Lotorobuo)
Mange (Ekoto)
Non-specific diarrhoea (Loleewa)
Sheep and goats Contagious caprine pleuropneumonia CCPP (Loukoi)
Pox (Etune)
Orf disease or contagious ecthyma (Ng’ibuorok)
Donkeys Trypanosomosis (Lokipi)
Black quarter (Lokichuma)
Anthrax (Enomokere)

41
It is worth noting that the Turkana name various livestock diseases according to the
presenting signs and the species affected. A particular disease can have various names, e.g.
trypanosomosis is called Lotorobuo in camels and Lokipi in cattle and donkeys. Both names mean
ventral oedema, a sign of trypanosomosis in donkeys and camels.
A pair-wise comparison was used on the five most important diseases of the camel to
determine the disease indicators for use in the matrix scoring (Appendix 1). Lotorobuo was the
disease of interest while the other four were control diseases. The matrix scoring results (Appendix
1) of disease-signs are shown in Table 4.2. As shown in Table 4.2, the most important signs of
lotorobuo were oedema, emaciation, high mortality, and infertility and abortion.

42
Table 4.2: Summarised matrix scoring of disease-signs in Lapur Division, Turkana District, 2001-2002.
Diseases
Signs Lotorobuo Emadang’ Loleewa Ekoto Logooroi
Key: Number of informant groups = 12; W=Kendall’s Coefficient of Concordance (*p<0.05; **p<0.01; ***p<0.001).
W values vary from 0 to 1.0; the higher the value, the higher the level of agreement between the informant groups.
The black dots represent the median scores (number of stones) that were used during the matrix scoring. The
minimum and maximum limits are shown in parentheses.
The agreement between the 12 informant groups on the signs of diseases varied from ‘non
significant (ns)’,‘weak’, ‘moderate’ and ‘good’ according to the critical values of W. The level of
agreement was good for skin lesions (W = 0.753), oedema (W = 0.885), loss of hair (W = 0.860),
moderate for infertility and abortion (W = 0.675), weak for emaciation and not significant (W = 0.171)
for the high mortality disease indicator (Table 4.2).
Skin lesions (W=0.753***)
0 (0-7)
♦♦♦♦
3.5 (0-9)
0 (0-0)
♦♦♦♦♦♦♦♦♦♦ ♦♦♦♦♦♦♦♦♦ 19 (14-25)
0 (0-8)
♦♦♦♦♦♦♦♦♦♦ ♦♦♦♦♦
15 (10-20)
0 (0-5)
0 (0-0)
0 (0-8)
♦♦♦♦♦♦♦
6.5 (5-11)
0 (0-5)
♦♦♦♦♦♦
5.5 (0-10)
0 (0-0)
♦♦♦♦♦♦♦♦♦♦ ♦♦♦♦♦♦♦♦
18 (12-25)
0 (0-5)
Oedema (W=0.885***) Loss of hair (W=0.860***) Emaciation (W=0.420*)
♦♦♦♦♦♦♦♦♦♦ ♦♦♦
12.5 (5-18)
♦♦
1.5 (0-10)
♦♦
1.5 (0-12)
♦♦♦♦♦♦
5.5 (0-12)
0 (0-6)
High mortality (W=0.171ns)
♦♦♦♦♦♦
6 (0-12)
♦♦
2 (0-12)
♦♦♦♦♦♦
5.5 (0-13)
♦♦♦♦♦
4.5 (1-10)
♦♦♦♦♦
5 (0-9)
Infertility and abortion (W=0.675**)
♦♦♦♦♦♦♦♦♦♦ ♦♦
11.5 (4-20)
0 (0-3)
0 (0-8)
♦♦♦♦♦♦♦♦♦♦
9.5 (0-18)
0 (0-8)

43
Additional signs of lotorobuo were explored through SSI. The listed signs were: loss of
appetite, reduced milk yield, rough hair coat, low birth-weight calves, small udders, listlessness,
swollen joints, coughing and a shrunken hump at the terminal stages. The post mortem lesions listed
were watery and fibrous meat, lack of fat around the heart, and watery bone marrow.
When cross-checking the identity of flies, informants consistently called the Hippobosca
camelina (camel fly) and other Tabanus spp as lolingokor and ekaerorot respectively. Glossina spp of
flies were called longicet, a general name for biting flies. A few informants were able to identify G.
swynertoni as lopodokongor although majority of them confused it with the common housefly
(loporeit).
Through SSI, the following were identified by the informants as the most likely causes of
lotorobuo: stagnant water shared by livestock and elephants, rain, a riverine tree called esokon
(Salvadora persica), a shrub called edome (Cordia sinensis), a type of pasture called epoo (Grewia
spp) occurring during the rainy season and biting flies.
4.3.2 Socio-economic matrix
The following uses of camels and their products by the Turkana were identified as important
and included: milk (ng’akile), meat and blood (akiring’ and ng’akot), fat (akimet), hides (agijom),
payment of dowry (akuuta), barter trade, payment of fines, slaughtering to seal marriages in the
absence of an ox, slaughtering to appease the ancestors, as an indicator of wealth, initiation of elders to
higher levels and slaughtering to mark burial ceremonies of elders. On further probing, it was found
that the community uses hides for making mattresses, shoes, bags, oil containers, ropes, donkey
carriers, women skirts and thatching of manyattas especially during the rainy season. Indeed, the
camel song (edong’a) below illustrates the importance the Turkanas attach to camels:

44
Vernacular
Nyani namanang’
Napetem imano ng’akile?
Atonia kolong’ (agopia kolong’)
Chorus
ekori lomanangit
Iyo ikooson
Iyo lokamuran kang’
Iyo ekeutan
Iyo ekewalan
English translation
Where is my milking camel?
The one I do get milk from?
It has long disappeared
Tall like a giraffe (milking giraffe)
Chorus
Tell me where it has disappeared
You the informed
You my in-law
You the suitor
You the feathers bearer
From the list generated on the uses of camels and their products, six were selected and two
(treatment cost, fertility and abortion) added by the investigator to make a total of eight indicators.
These indicators were used against the five most important camel diseases for scoring in the disease-
economic indicators matrix (Appendix 2). The summarised matrix is shown in Table 4.3.
The analysis of the matrix showed moderate to poor agreement between the informant groups
(Table 4.3). There was moderate agreement between the groups for milk (W = 0.547), fat (W = 0.638),
hides (W = 0.701), dowry (W = 0.635), infertility and abortion (W = 0.729). As shown in Table 4.3,
the diseases with the highest scores were lotorobuo and ekoto on all indicators.

45
Table 4.3: Summarised matrix scoring of disease-economic indicators in Lapur Division, Turkana District, 2001-2002.
Diseases
Indicators Lotorobuo Emadang’ Loleewa Ekoto Logooroi
Key: Number of informant groups = 12; W=Kendall’s Coefficient of Concordance (*p<0.05; **p<0.01; ***p<0.001).
W values vary from 0 to 1.0; the higher the value, the higher the level of agreement between the informant groups.
The black dots represent the median scores (number of stones) that were used during the matrix scoring. The
minimum and maximum limits are shown in parentheses.
Milk
(W=0.547**)
♦♦♦♦♦♦♦♦♦♦♦
11 (6-16)
♦♦
2 (0-14)
♦♦♦
3 (0-6)
♦♦♦♦♦
5 (0-12)
♦♦♦
2.5 (0-6)
♦♦♦♦♦♦♦♦♦♦
10 (6-20)
♦♦♦
3 (0-13)
♦♦♦♦
3.5 (0-10)
♦♦♦♦♦
5 (0-12)
♦♦♦
2.5 (0-5)
♦♦♦♦♦♦♦♦♦♦♦
10.5 (5-19)
♦♦
2 (0-9)
♦♦
1.5 (0-11)
♦♦♦♦♦♦♦
7 (0-15)
♦♦
2 (0-4)
Meat and blood
(W=0.443*)
Fat (W=0.638**)
Hides (W=0.701**)
♦♦♦♦♦♦♦♦♦
8.5 (0-15)
♦
0.5 (0-10)
0 (0-2)
♦♦♦♦♦♦♦♦♦ ♦♦♦♦♦
14 (0-25)
0 (0-4)
Dowry
(W=0.635**)
♦♦♦♦♦♦♦
6.5 (1-10)
♦
1 (0-5)
♦♦♦
3 (0-8)
♦♦♦♦♦♦♦♦♦
9 (6-17)
♦♦♦
3 (2-9)
Infertility and
abortion (W=0.729**)
♦♦♦♦♦♦♦♦♦♦
9.5 (3-15)
♦
0.5 (0-6)
♦♦♦
3 (0-10)
♦♦♦♦♦♦♦♦♦
9 (0-16)
0 (0-4)
Sale value
(W=0.400*)
♦♦♦♦♦♦♦♦
7.5 (0-10)
♦♦
1.5 (0-10)
♦♦♦♦
3.5 (0-7)
♦♦♦♦♦♦♦♦♦♦
10 (0-19)
♦♦♦
2.5 (0-11)
Cost of
treatment (W=0.390*)
♦♦♦♦♦♦♦♦
7.5 (2-13)
♦♦
2 (0-12)
♦♦♦
3 (0-8)
♦♦♦♦♦♦♦♦♦♦
9.5 (3-15)
♦♦
2 (0-13)

46
4.3.3 Control methods matrix
The control methods of lotorobuo matrix was scored by the four groups of informants
(Appendix 3) using relocation of animals, pour-on, drugs and indigenous (herbs, branding) as the
control methods and effectiveness, costs, availability and ease of use of the methods as the indicators.
The results are summarised in Table 4.4.
Table 4.4: Summarised matrix scoring of control methods of surra in Lapur Division, Turkana District, 2001-2002.
Control methods
Indicators Relocation Pour-on Drug use Indigenous
Key: Number of informant groups = 4; W=Kendall’s Coefficient of Concordance (*p<0.05; **p<0.01; ***p<0.001). W
values vary from 0 to 1.0; the higher the value, the higher the level of agreement between the informant groups.
The black dots represent the median scores (number of stones) that were used during the matrix scoring. The
minimum and maximum limits are in parentheses.
From Table 4.4, availability as an indicator had the highest agreement (W = 0.974) among the
four groups of informants. Effectiveness, financial cost and ease in use had moderate score of
Effectiveness (W=0.534**)
♦
0.5 (0-8)
♦
0.5 (0-4)
♦♦♦♦♦♦♦♦♦♦ ♦♦
12 (6-14)
♦♦♦♦♦♦ 6 (2-8)
♦♦♦♦♦♦♦♦ 8 (2-10)
♦♦♦♦♦♦
5.5 (4-10)
♦♦♦♦
4 (3-5)
♦♦♦
3 (2-3)
♦
1 (0-2)
0 (0-0)
♦♦♦♦♦♦♦♦
8 (7-9)
♦♦♦♦♦♦♦♦♦♦ ♦
10.5 (10-13)
Low financial cost (W=0.519**) Availability (W=0.974***) Ease in use (W=0.526**)
♦
0.5 (0-2)
0 (0-8)
♦♦♦♦♦♦♦♦♦♦ ♦♦♦
12.5 (5-16)
♦♦♦♦♦♦ 5.5 (4-8)

47
agreement. The indigenous methods of control were scored highly as was the case of drugs in the
control of lotorobuo.
Using SSI tool, the various indigenous treatment methods of lotorobuo were explored. The
main treatment methods were the use of hot iron metal to brand the oedematous areas, and the giving
of salt solution and goat urine orally. Sick animals were also reported to be given soup orally prepared
from goat, wildcat, bird or donkey meat. These soups were mixed with various herbs that included:
lokitoe, kayeb, eyarabos, eusugu, emanman, erengen roots, lorimosha, louyogorok, etesiro, elingoi,
epogai, esokon, edung, ekaye, and elimu. Asked about the effectiveness of the indigenous methods,
majority of the informants reported that camels usually recovered but that the disease recurred after 3-
9 months of administration of the treatment.
4.3.4 Seasonal calendars
The four groups of informants divided a year into three seasons for purposes of matrix scoring
(Appendix 4). The seasons were: akiporo (rainy season); akamu (dry season); and an intermediate
season (akiitiar). Akamu was from January to May, akiitiar in the month of June and akiporo from
July to December. Although the agreement between the informants was poor (W = 0.317) as to when
lotorobuo occurred, the majority concurred that most cases were seen during the akamu season (Table
4.5). There was good agreement for loleewa (W=0.942), moderate agreement for logooroi (W=0.517)
and no agreement for both ekoto and emadang’ (W = 0.050 and W = 0.000, respectively).

48
Table 4.5: Summarised seasonal calendar on the occurrence of camel diseases in Lapur Division, Turkana District, 2001-2002.
Turkana Seasons Diseases Akiporo Akiitiar Akamu
Key: Number of informant groups = 4; W=Kendall’s Coefficient of Concordance (*p<0.05; **p<0.01; ***p<0.001). W
values vary from 0 to 1.0; the higher the value, the higher the level of agreement between the informant groups.
The black dots represent the median scores (number of stones) that were used during the matrix scoring. The
minimum and maximum limits are shown in parentheses.
4.4 Proportional piling
4.4.1 Disease incidences
The informants (59 individuals) categorized camels into three age groups as: adults (ng’ikala),
growing stock (ng’isorok) and suckling (ng’itang’ikala).
Because of the taxing nature of proportional piling, each informant was asked to place the
camels into two main groups, namely, the adults and the young stock (suckling and weaners). Almost
Lotorobuo (W=0.317*)
♦♦♦♦♦
5 (0-8)
♦♦
1.5 (0-5)
♦♦♦♦♦♦♦♦
7.5 (4-15)
Emadang’ (W=0.000ns)
♦♦♦♦♦
5 (0-8)
♦♦♦♦♦
4.5 (4-5)
♦♦♦♦♦
5 (3-11)
♦♦♦♦♦♦♦♦
♦♦♦♦♦♦♦ 15 (8-15)
0 (0-3)
0 (0-4)
♦♦♦♦♦♦
6 (3-10)
♦♦♦♦
4 (0-6)
♦♦♦♦♦
4.5 (2-10)
Loleewa (W=0.942***) Ekoto (W=0.050ns) Logooroi (W=0.517**)
♦♦♦♦♦♦♦♦♦
9 (5-15)
♦♦
1.5 (0-3)
♦♦♦♦
3.5 (0-9)
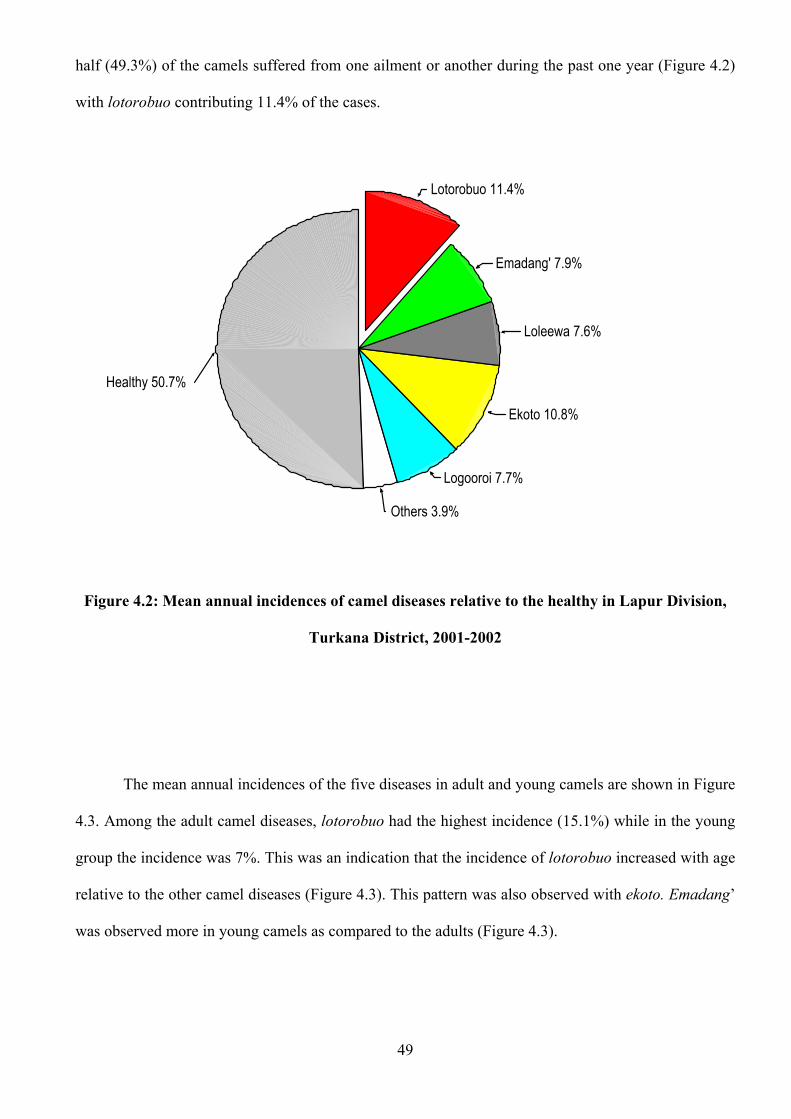
49
half (49.3%) of the camels suffered from one ailment or another during the past one year (Figure 4.2)
with lotorobuo contributing 11.4% of the cases.
Healthy 50.7%
Others 3.9%
Logooroi 7.7%
Ekoto 10.8%
Loleewa 7.6%
Emadang' 7.9%
Lotorobuo 11.4%
Figure 4.2: Mean annual incidences of camel diseases relative to the healthy in Lapur Division,
Turkana District, 2001-2002
The mean annual incidences of the five diseases in adult and young camels are shown in Figure
4.3. Among the adult camel diseases, lotorobuo had the highest incidence (15.1%) while in the young
group the incidence was 7%. This was an indication that the incidence of lotorobuo increased with age
relative to the other camel diseases (Figure 4.3). This pattern was also observed with ekoto. Emadang’
was observed more in young camels as compared to the adults (Figure 4.3).

50
Figure 4.3: Mean annual incidences of camel diseases in Lapur Division, Turkana District, 2001-
2002
4.4.2 Disease mortalities
The results of proportional piling on disease mortalities showed that 31% of camels died in the
past one year with lotorobuo accounting for 7.8% of the fatalities (Figure 4.4). The mean annual
mortalities of adult and young camels are shown in Figure 4.5. Among the adult camel diseases,
lotorobuo had the highest mortality of 10% while in the young group the mortality was 5%. This was
an indication that deaths from lotorobuo increased with age relative to the other camel diseases (Figure
-2
0
2
4
6
8
10
12
14
16
18
Lotorobuo Emadang Lolewa Ekoto Logoroi Others
Disease
Mea
n in
cide
nce
(%) 2
001-
2002
and
95%
CI
Adults All age groups Calves

51
4.5). This feature was also observed to a small extent with ekoto and loleewa. Ekoto and emadang’
were leading causes of mortality in young camels.
Figure 4.4: Mean annual mortalities of camels due to diseases relative to the healthy in Lapur
Division, Turkana District, 2001-2002
69.0% 2.4%
4.6%
7.5%
5.0%
3.7%
7.8%
Healthy Others
Logooroi
Ekoto
Loleewa
Emadang'
Lotorobuo

52
Figure 4.5: Cause-specific mean annual mortalities of camels in Lapur Division, Turkana
District, 2001-2002
4.5 Trend lines
The Turkana associate different times in their history with the occurrence of extraordinary
events, e.g., eclipse of the sun, famine, thunderstorms, wars, deaths of great men or women, disease
outbreaks, etc. After intensive probing of the informants, the year 1978 was chosen as a cut-off point.
This year was associated with the death of an elder called Lowoton. Using other events that occurred
since 1978, the years the events took place were estimated. Variations in the levels of prevalence of
lotorobuo, contagious bovine pleuropneumonia (CBPP) and veterinary drugs delivery levels (VDDL)
were used along the Y-axis and years along the X-axis. There was a general decline in the level of
-2
0
2
4
6
8
10
12
14
Lotorobuo Emadang' Loleewa Ekoto Logooroi Others
Diseases
Mean
(%) m
orta
lities
2001
-200
2 and
95 C
I
Adults All age groups CalvesData
Age group

53
lotorobuo from a high of nearly 100% to a low of 15% in 2002 (Figure 4.6). From 1989, veterinary
drugs delivery levels increased.
0
10
20
30
40
50
60
70
80
90
100
1978 1982 1983 1985 1988 1989 1993 1995 1996 1997 1999 2000 2001 2002YEARS
% L
EVEL
S
SURRA CBPP VDDL
Figure 4.6: Trend lines depicting variation of surra, CBPP, and veterinary drugs delivery levels
(VDDL) in Lapur Division, Turkana District from 1978-2002.

54
4.6 Diagnosis of surra
A total of the 32 camels were bled out of which 16 (50%) were positive for T. evansi on LAT.
According to the pastoralists, 84.4% (27/32) of the camels presented for bleeding were diagnosed with
surra while only 62.5% (20/32) of the corresponding blood samples were positive on PCR (Table 4.6).
Table 4.6: Diagnostic results of surra as determined by pastoralists and their corresponding blood results on LAT and PCR in Lapur Division, Turkana District, 2002.
Camel No. Pastoralist diagnosis LAT PCR EK01 + + + EK02 + + + EK03 + + + EK04 + + + EK05 + - - EK06 + + + EK07 + + + EK08 + + + EK09 + + + EK10 + + + EK11 + - - EK12 + + + EK13 + - - EK14 - - - EK15 + - + EK16 + + + EK17 + - - EK18 + - + EK19 + + + EK20 + - - EK21 + - - EK22 + - - EK23 + + + EP01 + - + EP02 + - - EP03 + + + EP04 + - + EP05 + + + N0I - - - N02 - - - N03 - - - N04 - + + TOTAL POSITIVE 27 16 20

55
The PCR results on 24 of the 32 camel blood specimens and their corresponding LAT results
are displayed in Figure 4.7. The 164bp in the specific band for T. evansi while the common band is a
PCR artefact resulting from nondescript primer dimer bonding (Figure 4.7).
13 14 15 16 17 18 19 20 21 22 23 24 C NC M
LAT + - - + - + + + + + + + PCR + + - + - + + + + + + +
1 2 3 4 5 6 7 8 9 10 11 12 C NC M
LAT + - + - + - + + + - + - PCR + + + - + + + + + - + +
Figure 4.7: PCR results of 24 camel blood specimens presented for surra diagnosis and their corresponding LAT results in Lapur Division, Turkana District, 2001-2002. Key: C = positive control, NC = negative control and M = marker.
There was poor agreement between diagnoses as done by the pastoralists and by the LAT and
PCR with a kappa statistic of 0.19 and 0.32, respectively. However, LAT and PCR had an excellent
agreement (kappa of 0.75) in the diagnosis of camel trypanosomosis.
164 bp Primer dimers
164 bp Primer dimers
500 bp

56
4.7 Stakeholders’ workshop
During the workshop held at the end of the study, various stakeholders discussed the
preliminary results. The role of the community-based animal health workers (CBAHWs) featured
prominently. The pastoralists expressed their displeasure at the mediocre services they received from
the CBAHWs. In addition, they felt they were being exploited by the CBAHWs, since their prices
were exorbitant. However, they were willing to pay for the drugs once the role of CBAHWs was
streamlined and more drug selling points established. The need for retraining of the CBAHWs with
regular visits by the relevant authorities was considered a priority for better management of livestock
diseases.

57
CHAPTER FIVE
5.0 DISCUSSION
5.1 Participatory mapping
Participatory maps are powerful tools in the provision of spatial data on communities in a
particular locality (Lelo et al., 1995). The participatory map drawn by the key informants showed
important features including forested areas, rivers, mountain ranges and areas where biting flies are
found. It has long been recognised that the occurrence of trypanosomosis involves an inter-play of
many factors that relate to disease vectors, wild hosts, livestock and their management, the
trypanosomes and the climatic conditions (Whiteside, 1958). The features reported, particularly the
presence of biting flies, provide ideal conditions for maintenance of surra in the camel population of
Lapur Division. Indeed, surra was identified through pair-wise comparisons by the informants as one
of the leading diseases of camels in the study area. In addition, these results were substantiated by the
detection of T. evansi in the camel blood samples using LAT and PCR diagnostic techniques. The
practice by pastoralists of grazing livestock along rivers and swampy areas, favourable habitats for
biting flies (Evans et al., 1995), may have contributed to the high prevalence of surra. Furthermore,
the presence of a large population of sheep and goats may have acted as a reservoir, since they have
been shown to harbour T. evansi inapparently (Evans et al., 1995). The donkeys could also suffer but
are resistant (FAO, 2000), and could thus have served as reservoirs.
5.2 Matrices
As reported by Catley et al. (2002a) in their study of seasonal incidences of diseases of cattle,
disease vectors and rainfall in southern Sudan, the use of matrix scoring as a tool for gathering
information in pastoralist communities was found to be invaluable in this study. The key informants
agreed quite well on most of the presenting signs of the important camel diseases. Indeed, most of the
signs listed for surra were consistent with what appears in the veterinary literature (Evans et al., 1995;
Kaufmann, 1998; FAO, 2000). In a study by Noor (1999), foul-smelling diarrhoea and sweet smell of
urine of infected camels were also reported as additional signs of surra in Moyale District by Somali

58
pastoralists. In another study by Catley et al. (2001), loss of tail hair was also mentioned by Turkana
pastoralists as a sign of surra. These results were an indication of an enormous wealth of knowledge
Turkana pastoralists possess on livestock diseases. In addition, the informants were able to link
increased cases of surra to a build-up of the biting fly population. It is known that biting flies play an
important role in the transmission mechanisms of surra (Evans et al., 1995; FAO, 2000). Catley and
Irungu (2000) in their study of bovine trypanosomosis using participatory methods documented a
similar knowledge base of livestock diseases by the Orma pastoralists of Tana River District, Kenya.
The informants mentioned and agreed very well on most of the uses of camels. It was however
rather surprising that the Turkana do not use the camel as a transport animal. Camels are used
extensively for transport by the Gabbra/Ariaal and Borana communities in the neighbouring district of
Marsabit as well as the Somali ethnic group of Wajir and Garissa Districts (Evans et al., 1995;
Kaufmann, 1998). This could be attributed to the fact that Turkanas are traditionally cattle keepers and
camels are a relatively new introduction. Furthermore, it was noted that the donkeys were in
abundance and Turkanas prefer using them instead. It is likely that with sound educational
programmes, the Turkanas would be able to use camels in more different ways than is currently the
practice.
Turkana pastoralists consume camel milk, blood and meat and camel hide is used for making
sandals, ropes, whips, donkey carriers, bags and women skirts and for thatching. On traditional
subsistence systems in Kenya, the camel can produce between 2.2 – 4.5 litres of milk per day and their
lactation period is about a year (Kaufmann, 1998). Milk is important to pastoralists in the provision of
vitamin C, which they would otherwise suffer a deficiency from, since fresh fruits and vegetables are
rare in arid lands (Noor, 1999).
Even though Turkana eat camel meat, it was apparent that camels are seldom slaughtered,
except when marking certain occasions. Camels are usually slaughtered at an old age – mean 14.5
years – and have a long calving-to-conception interval of 22 months (Evans et al., 1995: Kaufmann,
1998). These factors may have worked against the use of the camel as an important source of meat.

59
The Turkana have not fully exploited the potential of the camel and its various products. In the
neighbouring Samburu District, camels are being used as tourist attractions through camel races (Noor,
1999). There is need to introduce some of these innovations to the Turkana through educational
programmes.
It is difficult to do an economic analysis in monetary terms in the pastoral camel production
system since most camel products do not enter the market and most inputs are not purchased (Noor,
1999). However, given the various ways the camel is used by the Turkana, the socio-economic impact
of surra arising from morbidity and mortality was likely to have been great.
The informants identified several bottlenecks in their efforts to control surra. Relocating of
animals to avoid riverine habitats where biting flies thrive was not considered an option especially
during the dry season. Although trypanocidal drugs were considered to be reasonably available, their
use were impeded by what Turkana considered as their prohibitive prices. The price of a single dose of
quinapyramine sulphate was Kshs 350.00, equivalent to the cost of an adult goat. It was therefore not
entirely surprising that the preferred method of surra control by the Turkana was the indigenous one,
which involved the application of a concoction of herbs, mixed with soup and the branding of
oedematous areas on sick animals using hot iron. Although the informants were in agreement on the
effectiveness of these remedies, the annual mortality (7.8%) attributed to surra was unacceptably high.
Furthermore, it was claimed that the disease usually recurred after 3 to 9 months upon administration
of these remedies. There is a need to carry out clinical trials on these remedies to assess their efficacy.
The application of similar herbal concoctions in the treatment of cattle trypanosomosis has been
reported among the pastoral Orma community of Tana River District (Catley and Irungu, 2000).
The seasonal calendar was used to demonstrate the temporal variations in the prevalences of
camel diseases. There was poor agreement (W = 0.317) across the groups of informants as to when
surra occurred with the highest frequency. The lack of good agreement may have been due to the few
(four) informant groups (Judges) used for this exercise in comparison to twelve groups used for the
other exercises. Moreover, the PA methods are still under refinement and there is no minimum number

60
of informant groups to achieve good agreement. However, there appeared to be a general consensus
that surra occurred more frequently during the dry season. The upsurge of surra during the dry season
may have been attributed to the build-up of the biting fly population after rains. In addition, during the
dry season, camels are usually in a low plane of nutrition and trek for long distances in search of water
and pasture. This is likely to stress the animals and subsequently trigger clinical signs of surra in
animals which would otherwise be sub-clinically infected. A high prevalence of surra occurring in the
dry season has also been reported in semi-arid rangelands in Kenya by Evans et al. (1995).
5.3 Proportional piling
This PA tool was used for the estimation of incidence and mortality of surra and other camel
diseases. According to the informants, about a half (49.3%) of the camel population suffered from at
least one disease over the past one year with Surra reportedly having the highest annual incidence
(11.4%). The same pattern was also reflected in disease mortalities with crude mortality estimated at
31% for the previous year. Surra accounted for 7.8% of the mortalities with age-specific mortalities of
9.9% and 5.2% in adult camels and calves, respectively. A similar pattern of trypanosomosis has been
observed in Orma cattle where the annual incidence rate was 17.9% in all age groups (Catley and
Irungu, 2000). In a study of surra among Rendille and Gabbra communities of the neighbouring
Marsabit District and the Somali communities of Wajir and Garissa Districts, Kaufmann (1998)
recorded surra incidences of 25%, 8% and 26%, respectively. As noted by Catley and Irungu (2000),
informants were likely to inflate the incidence of surra in expectation of free drugs. However,
infection rates of surra in the range of 20% – 70% have been reported in the past (Wilson, 1984;
Radostitis et al., 1994). The reported incidence (11.4%) due to surra irrespective of age of animal was
within the range of 3% and 20% reported for endemic and epidemic scenarios, respectively (Wilson,
1984; Evans et al., 1995). The 7.8% mortality was high as compared to what has been reported as 3%
(Wilson, 1984), which would be attributed to inflated incidence pattern.

61
5.4 Trend lines
The trend line drawn by the informants from 1978 to March 2002 showed a general decline in
surra prevalence levels from 1978 to 1996. Since 1996, the prevalence levels exhibited an oscillatory
pattern with only minor fluctuations to what appeared to be a steady equilibrium. Although the
delivery of veterinary services appeared to improve during this period of low prevalence, it is difficult
to attribute the low prevalence to veterinary interventions. This argument appears to be supported by
the results of the disease control matrix where informants were in agreement that the trypanocides
were not regularly used due to their prohibitive costs. It is likely that the camel and the causative agent
(T. evansi) of surra have established a stable relationship over time to an endemically stable state.
Indeed, Njiru et al. (2000) have shown that surra occurs endemically in camel populations of Kenya.
This phenomenon of endemic stability has also been reported in tick-borne diseases of cattle in some
parts of central Kenya (Gitau et al., 2001).
5.5 Diagnosis
There was poor agreement in the diagnosis of surra by the pastoralists and diagnosis using the
LAT and PCR techniques (0.1875 and 0.32, respectively). The two tests showed strong agreement
(kappa = 0.75) in the detection of T. evansi in camel blood. The poor agreement between the
pastoralists and the two diagnostic tests may have been due to the tendency of the camel owners to
present their animals for bleeding in expectation of free trypanocides. However, on the basis of the
disease-signs matrix, it was evident that the pastoralists knew surra quite well since they enumerated
surra signs consistent with those found in the veterinary literature. In a different study by Noor (1999)
in Moyale District, Kenya, pastoralists were able to diagnose from between 75-85% of all infected
camel herds.
5.6 Stakeholders’ workshop
This was the first process of feeding back the pastoralists on their information. As noted by
Kaufmann (1998), the workshop stimulated dialogue between the researchers and the informants. The
informants were able to freely discuss the constraints they faced in managing their livestock. The issue
62
of community-based animal health workers (CBAHWs) featured prominently during the discussions.
The presence of the District Veterinary Officer (DVO) for Turkana District was important and had a
chance to hear first-hand, the problems experienced by the pastoralists. The agreements arrived at the
workshop, e.g., streamlining the services of CBAHWs and their close supervision, in addition to
providing more drug-selling points, should of necessity be addressed. The workshop also provided an
opportunity to the pastoralists to learn new techniques in the management of their livestock, e.g., the
use of pour-ons in the control of biting fly populations.
63
CHAPTER SIX
6.0 CONCLUSIONS AND RECOMMENDATIONS
6.1 Conclusions
The present study provided baseline data that can be used in the planning and implementation
of a surra control programme in the pastoralist area of Turkana District. Surra is an important disease
in Turkana with a reported annual incidence of 11.4%. The delivery of veterinary services in this large
and arid area of Kenya is still inadequate partly due to its vastness, harsh climatic conditions and
insecurity. It was evident that the Turkana pastoralists do possess an enormous wealth of knowledge
on livestock diseases. Surra was identified as one of the leading diseases of camels through both pair-
wise comparisons. This was substantiated by the detection of T. evansi in camel blood samples using
LAT and PCR diagnostic techniques. The ability of Turkana pastoralists to diagnose camel
trypanosomosis was generally good as they were able to link increased surra cases to biting fly
population build-up. In addition, the key informants agreed quite well on most presenting signs of
important camel diseases that were consistent with veterinary literature. The Turkanas were well aware
of the modern treatment of camel trypanosomosis, but they preferred traditional herbal concoctions.
However, the efficacy of the indigenous remedies practised by pastoralists in the control of surra,
remains unestablished. The full potential of the camel is not yet fully exploited by the Turkana.
However, the camel still plays an important role in the lives of Turkana pastoralists and thus the socio-
economic impact of surra arising from its morbidity and mortality is likely to have been great. Despite
this, it was difficult to do an economic analysis since most camel products do not enter the market.
Thus, the socio-economic impact was more of a qualitative observation than through measurable
indicators like milk production. The Turkana community showed a lot of interest in this study and are
therefore likely to be compliant in any surra control programme instituted in the area.

64
6.2 Recommendations
Because of the negative effect of surra in Turkana, there is a need for operational research to
compare, using field trials, the feasibility and sustainability of alternate surra control programmes in
the district. Such programmes could include those aimed at reducing the vector populations (e.g. the
use of pour-ons, traps and targets) and the use of trypanocides. The role of community-based animal
health workers (CBAHWs) in enhancing delivery of animal health-care should also be assessed.
Clinical trials also need to be conducted to assess the efficacy of the indigenous remedies applied by
the pastoralists. The pastoralists should also be educated on ways to utilize the camel’s potential for
work, riding and as a pack animal. For the success of these programmes, the pastoralist’s sympathy
and support should be enlisted. In addition, the community should be active participants from the
planning, implementing, and assessment of the programmes.
65
REFERENCES
Akol, G.W. O. and Murray, M. (1982). Early events following challenge of cattle with tsetse infected
with Trypanosoma congolense: Development of local skin reaction. The Veterinary Record,
110: 295-302.
Akol, G.W. O. and Murray, M. (1986). Parasite kinetics and immune response in efferent prefemoral
lymph draining skin reactions induced by tsetse-transmitted Trypanosoma congolense.
Veterinary Parasitology, 19: 281-283.
Anene, B. M., Onah, D. N. and Nawa, Y. (2001). Drug resistance in pathogenic African trypanosomes:
what hopes for the future? Veterinary Parasitology, 96: 83-100.
Anonymous (1959). Annual Report of the Department of Veterinary Services and Animal Husbandry
for the year 1959. Blantyre, Malawi.
Anonymous (1999). Tsetse and Trypanosomosis Research and Development since 1980. Department
For International Development (DFID). Volume 1.
Barret, K. and Okali, C. (1998). Community participation in the management of tsetse: a comparative
assessment of impact and sustainability. Report submitted to the Animal Health Programme of
the DFID.
Bauer, B., Kabore, I., Liebisch, A., Meyer, F. and Petrich-Bauer, J. (1992). Simultaneous control of
ticks and tsetse flies in Satiri, Burkina Faso, by the use of Flumethrin pour-on for cattle.
Tropical Medicine and Parasitology, 43: 459-462.
Bernards, A. (1984). Antigenic variation of trypanosomes. Biochemica et Biophysica Acta, 824: 1-15.
66
Boid, R., Jones, T. W. and Munro, A. (1999). A simple procedure for the extraction of Trpanosome
DNA and host protein from dried blood meal residues of haemotophagus Diptera. Veterinary
Parasitology, 85: 313-317.
Boid, R., Jones, T. W. and Luckins, A. G. (1985). The camel in health and disease. Protozoal diseases
of camels. British Veterinary Journal, 141: 87-105.
Boyt, W. P. (1980). “A field guide for the diagnosis, treatment and prevention of African animal
trypanosomiasis”, FAO, pp. 88-119.
Budd, L. T. (1999). DFID-funded Tsetse fly and Trypanosomosis Research and Development since
1980, vol. 2. An Economic Analysis, Department for International Development. Natural
Resources International Ltd., Chatham, UK.
Catley, A. (1999). Methods on the move. A review of veterinary uses of participatory approaches and
methods focusing on experiences on dry land Africa. International Institute for Environment and
Development, London, UK.
Catley, A. and Irungu, P. (2000). Participatory Research on Bovine Trypanosomosis in Orma cattle,
Tana River District, Kenya. International Institute for Environment and Development and
KETRI.
Catley, A. and Leyland, T. (2001). Community participation and delivery of veterinary services in
Africa. Preventive Veterinary Medicine, 49: 95-113.
Catley, A. P. and Aden, A. (1996). Use of participatory rural appraisal (PRA) tools for investigating
tick ecology and tick-borne diseases in Somaliland. Tropical Animal Health and Production, 28:
91-98.
67
Catley, A. P. and Mohammed, A. A. (1996). The use of livestock disease-scoring by a primary animal
health project in Somaliland. Preventive Veterinary Medicine, 28: 175-186.
Catley, A., Blakeway, S. and Leyland, T. (2002b). Community-based animal healthcare. A practical
guide to improving primary veterinary services. Vetwork UK, ITDG Publication. Southampton
Row, London, UK.
Catley, A., Okoth, S., Osman, J., Fison, T., Njiru, Z., Mwangi, J., Jones, B. A. and Leyland, T. J.
(2001). Participatory diagnosis of chronic wasting disease in cattle in southern Sudan.
Preventive Veterinary Medicine, 1634: 1-21.
Catley, A., Osman, J., Mawien, C., Jones, B. A. and Leyland, T. J. (2002a). Participatory analysis of
seasonal incidences of diseases of cattle, disease vectors and rainfall in Southern Sudan.
Preventive Veterinary Medicine, 53: 275-289.
Central Bureau of Statistics of Kenya (CBS) (1999).
Chambers, R. (1997). Whose reality counts? Putting the last first. Intermediate Technology
Publications, London.
Cohen, J. M. and Uphoff, N. T. (1980). Participation’s Place in Rural Development: Seeking Clarity
through Specificity. World Development, 8: 213-235.
Connor, R. J. (1994). African Animal Trypanosomiasis. In: Coetzer, W. A. J. Thomson, G. R. and
Tustin, R. C. (eds.), Infectious Diseases of Livestock with a Special Reference to Southern
Africa. Oxford University Press, South Africa, pp. 167-212.
De Raadt, P. and Seed, J. R. (1977). Trypanosomes causing disease in man in Africa. In: Kreier, J. P.,
(ed.), Parasitic Protozoa. Academic Press, New York, London.

68
Desquesnes, M., McLaughlin, G., Zoungrana, A. and Davila A. M. (2001). Detection and
identification of Trypanosoma of African livestock through a single PCR based on internal
transcribed spacer 1 of rDNA. International Journal of Parasitology, 31: (5-6): 609-13.
Dransfield, R. D., Brightwell, R.,Chaudhury, M. F., Golder, T. K. and Tarimo, S. A. R. (1986). The
use of odour attractants for sampling Glossina pallidipes austeni (Diptera: Glossinidae) at
Nguruman, Kenya. Bulletin of Entomological Research, 76: 607-619.
Dransfield, R. D., Williams, B. G. and Brightwell, R. (1991). Control of tsetse flies and
trypanosomosis: myth or reality? Parasitology Today, 7: 287-291.
Ellie, O. O., Abakar, M. and Abubakar, L. (1999). The role of trypanolysin in the development of
trypanosomes in tsetse. International Scientific Council for Trypanosomiasis Research and
Control. No. 120: pp.417-421.
Evans, J. O., Simpkin, S. P. and Aitkins, D. J. (1995). Camel keeping in Kenya. Ministry of
Agriculture, Livestock Development and Marketing.
FAO (1989). In: “ Integrated tsetse control and rural development: Joint meeting of FAO panels of
experts on Technical, Ecological and Development aspects of the programme for the control of
African animal trypanosomiasis and related development, Accra, Ghana, 7-9 November 1988.”
FAO, Rome, Italy, pp. 1-42.
FAO (2000). A field guide for the diagnosis, treatment and prevention of African animal
trypanosomosis, 2nd edition. FAO, Rome, Italy.
Field, C. R and Simpkin, S. P. (1985). The importance of camels to subsistence pastoralists in Kenya.
In: UNESCO program of man and biosphere (MAB), IPAL technical report No. E-7: camel

69
diseases and productivity in the arid lands of Northern Kenya. UNESCO, Nairobi, Kenya. pp.
161-192.
Finelle, P. (1974). African animal trypanosomiasis part IV. Economic problems. World Animal
Review, 1015-18.
Fleish, J. L. (1981). Statistical methods for rates and proportions, 2nd Edition. Wiley, New York.
Gardiner, P. R. (1989). Recent studies of biology of Trypanosoma vivax. Advances in Parasitology,
28: 229-317.
Gibson, W. C. (1985). Application of new technologies to epidemiology. British Medical Bulletin, 41:
115-121.
Gitau, G. K., McDermott, J. J., McDermott, B. and Perry, D. B. (2001). The impact of Theileria parva
infections and other factors on calf mean daily weight gains in smallholder farms in Murang’a
District, Kenya. Preventive Veterinary Medicine, 51: 149-160.
Grootenhuis, J. G., Dwinger, R. H., Dolan, R. B., Murray, M. and Moloo, S. K. (1990). Susceptibility
of African buffalo and Boran cattle to Trypanosoma congolense transmitted by Glossina
morsitans centralis. Veterinary Parasitology, 35: 219-231.
Hagebock, J. M. (1992). Dourine. Foreign animal disease report, United States Department of
Agriculture, 19-4: 9-13.
Hassanali, A., McDowell, P.G., Owaga, M. L. A. and Saini, R. K. (1986). Identification of tsetse
attractants from excretory products of wild host animal, Syncerus caffer. Insect science and its
Application, 7: 5-9.
Hoare, C. A. (1972). Trypanosomes of mammals: a zoological monograph. Oxford and Edinburgh:
Blackwell Scientific Publications.

70
Holmes, P. H. and Scott, J. M. (1982). Chemotherapy against animal trypanosomiasis. In:
“Perspectives in trypanosomiasis research”, Edited by Baker, R. Proceedings of the 21st
trypanosomiasis seminar, Research Studies Press, London, UK. pp. 64.
Hopkins, J. S., Chitambo, H., Machila, N., Luckins, A. G., Rae, P. F., van den Bossche, P. and Eisler,
M. C. (1998). Adaptation and validation of antibody-ELISA using dried blood spots on filter
paper for epidemiological surveys of tsetse-transmitted trypanosomosis in cattle. Preventive
Veterinary Medicine, 37: 91-99.
IIED (International Institute for Environment and Development) (1994). RRA Notes No. 20. Special
issue on livestock. Sustainable Agriculture Programme. IIED, London, UK.
Ikede, B. O. (1986). Trpanosomiasis and livestock production in Africa: is current emphasis
misplaced? Tropical Veterinarian, 4: 1-4.
Ikede, B. O., Elhassan, E. and Akpavie, S. O. (1988). Reproductive disorders in African
trypanosomiasis: A review. Acta Tropica, 45: 5-10.
ITDG-EA (Intermediate Technology Development Group – Eastern Africa) (2001). The role of
community-based animal healthcare in rural development, ITDG-EA’s experiences. ITDG-EA
Publication, Nairobi, Kenya, pp. 45-60.
Jordan, A. M. (1976). Tsetse flies as vectors of trypanosomes. Veterinary Parasitology, 2: 143-152.
Jordan, A. M. (1986). Trypanosomiasis control and African rural development. London and New
York, Longman.
Kanyari, P. W. N., Allonby, E. W., Wilson, A. J. and Munyua, W. K. (1983). Some economic effects
of trypanosomiasis in goats. Tropical Animal Health and Production, 15: 153-160.

71
Kaufmann, B. (1998). Analysis of pastoral camel husbandry in northern Kenya. Ed: centre for
agriculture in the tropics and subtropics, University of Hohenheim. Margraf, Weikerheim,
Germany.
Kihurani, D. O. (1995). A clinico-pathological study of equine trypanosomosis. PhD thesis, University
of Nairobi, Kenya.
Kohler-Rollefson, I., Mundy, P. and Mathias E. (2001). A field manual of camel diseases. Traditional
and modern healthcare for the dromedary. ITDG Publication.
Lelo, F., Ayieko, J., Makenzi, P., Muhia, N., Njeremani, D., Muiruri, H., Omollo, J. and Ochola W.
(1995). PRA field handbook for participatory rural appraisal practitioners. PRA Program,
Egerton University, Njoro, Kenya.
Leyland, T. (1991). Participation in the 80s and 90s:Who asks the questions in livestock development?
MSc thesis, University of Edinburgh, Edinburgh, UK.
Llewelyn, C. A., Munro, C. D., Luckins, A. G., Jordt, T., Murray, M. and Lorenzini, E. (1988). The
effects of Trypanosoma congolense infection on oestrous cycle of the Boran cow. British
Veterinary Journal, 144: 379-387.
Lohr, K. F., Omukuba, J. N., Njogu, A. R., Maloo. S. H., Gisemba, F., Okedi, T D. and Mwongela, S.
H. (1991). Investigation of the efficacy of Flumethrin pour-on for the control of tsetse and
trypanosomosis in Kenya. Tropical Medical Parasitology, 42: 131-134.
Losos, G. J. (1980). Diseases caused by Trypanosoma evansi, a review. Veterinary Research
Communications, 4: 165-181.
Losos, G. J. (1986). Infectious Tropical Diseases of Domestic Animals. Longman Scientific and
Technical Association with the International Development and Research Centre, Canada.

72
Losos, G. J. and Chouinard, A. (1979). Pathogenicity of trypanosomes. Proceedings of a workshop
held at Nairobi, Kenya, 20-23 November 1978. Ottawa: International Development Research
Centre.
Luckins, A, G. and Gray, A. R. (1978). An extravascular site development of Trypanosoma
congolense. Nature, 272: 613-614.
Luckins, A. G. (1977). Detection of antibodies in trypanosome-infected cattle by means of a
microplate enzyme-linked immunosorbent assay. Tropical Animal Health and Production, 9: 53-
62.
Luckins, A. G. (1988). T. evansi in Asia. Parasitology Today, 4(5): 137-142.
Luckins, A. G. (1992). Diagnostic methods in trypanosomiasis of livestock. World Animal Review,
70/71: 15-20.
Maclennan, K. J. R. (1974). The epizootiology of tsetse transmitted trypanosomiasis in relation to
livestock development and control measures. In: Control Programmes for Trypanosomes and
their Vectors. Actes du Colloque, Paris, pp. 12-15.
Maichomo, M. W., Olubai, W., Mwenda, C. M. T. and Mapenay, I. M. (1999). Farmer response on
acceptability of the Orma Boran, trypanotolerant breed of cattle introduced into Nguruman,
Kajiado District in Kenya. In: Proceedings of the International Scientific Council for
Trypanosomiasis Research and Control, No. 120: pp.293-295.
Majiwa, P. A. O. (1998). Application of the polymerase chain reaction for detection of trypanosomes.
In: “Towards Livestock Disease Diagnosis and Control in the 21st Century.” Proceedings of a
Symposium, Vienna, 7-11 April 1997.

73
Masake, R. A. (1980). The pathogenesis of infection with Trypanosoma vivax in goats and cattle. The
Veterinary Record, 107: 551-557.
Masake, R. A. and Nantulya, V. M. (1991). Sensitivity of an antigen detection enzyme immunoassay
for diagnosis of Trypanosoma congolense infections in goats and cattle. The Journal of
Parasitology, 77: 231-236.
Masake, R. A., Majiwa, P. A., Moloo, S. K., Makau, J. M., Njuguna, J.T., Maina, M., Kabata, J., ole-
MoiYoi, O. K. and Nantulya, V. M. (1997). Sensitive and specific detection of Trypanosoma
vivax using the polymerase chain reaction. International Livestock Research Institute (ILRI),
Nairobi, Kenya. Experimental Parasitology, 85 (2): 193-205.
Masake, R. A., Nantulya, V. M., Akol, G. W. O. and Musoke, A. J. (1984). Cerebral trypanosomiasis
in cattle with mixed Trypanosoma congolense and T. brucei brucei infections. Acta Tropica, 41:
237-246.
Ministry of Agriculture and Rural Development (2000). Turkana District Annual Report, Department
of Veterinary Services.
Monzon, C. M., Mancebo, O. A. and Roux J. P. (1990). Comparison between six parasitological
methods for the diagnosis of Trypanosoma evansi in the subtropical area of Argentina.
Veterinary Parasitology, 36: 141-146.
Morrison, W. I., Murray, M. and Akol, G.W. O. (1985). Immune response to African trypanosomes.
In: Tizard, I., (ed.). Immunology and pathogenesis of trypanosomiasis. Boca Raton, Florida,
CRC Press, Inc.

74
Moser, D. R., Cook, G. A., Ochs, D. E., McKane, M. R. and Donelson, J. E. (1989). Detection of
Trypanosoma congolense and Trypanosoma brucei subspecies by DNA amplification using the
polymerase chain reaction. Parasitology, 99: 57-66.
Mugalla, C.I. (2000). Household decision making under different levels of trpanosomosis risk. PhD
dissertation, Pennsylvania State University, USA.
Mugenda, O. M. and Mugenda, A. G. (1999). Research methods: qualitative and quantitative
approaches. ACTS Press, Nairobi, Kenya, pp. 197-208.
Mulla, A. F. and Rickman, L. R. (1988). How do African game animals control trypanosome
infections? Parasitology Today, 4: 352-354.
Murray, M. and Dexter, D. M. (1988). Anaemia in bovine African trypanosomiasis. Acta Tropica, 45:
389-432.
Murray, M., Morrison, W. I. and Whitelaw, D. D. (1982). Host susceptibility to African
trypanosomiasis: Trypanotolerance. Advances in Parasitology, 21: 1-68.
Murray, M., Morrison, W. I., Murray, P. K., Clifford, D. J. and Trail J. C. M. (1979). Trypanotolerance
– a review. World Animal Review, 31: 2-12.
Murray, M., Clifford, D. J., Gettinby, G., Snow, W. F. and MCintyre, W. I. M. (1981). Susceptibility to
African trypanosomiasis of N’Dama and zebu cattle in an area of Glossina morsitans
submorsitans challenge. The Veterinary Record, 109: 503-510.
Murray, M., Trail J. C. M. and D’ieteren, G. D. M. (1990). Trypanotolerance in cattle and prospects
for the control of trypanosomiasis by selective breeding. Revue Scientifique et Technique de’l
Office International des Epizootics, 9: 369-386.

75
Mutayoba, B. M., Gombe, S., Waindi, E. N. and Kaaya, G. P. (1989). Comparative trypanotolerance of
the Small East African breed of goats from different localities to Trypanosoma congolense
infection. Veterinary Parasitology, 31: 96-105.
Mwangi, E. K., Stephenson, P., Gettinby, G., Reid, S. W. J. and Murray M. (1998). Susceptibility to
trypanosomosis of three Bos indicus cattle breeds in areas of different tsetse challenge.
Veterinary Parasitology, 79: 1-17.
Mwongela, S. (1991). Investigation of efficacy of Flumethrin pour-on for the control of high tsetse and
trypanosomiasis challenge in Kenya. Tropical Medicine and Parasitology, 42: 131-134.
Nantulya, V. M. (1986). Immunological approaches to the control of animal trypanosomiasis.
Parasitology Today, 2: 168-173.
Nantulya, V. M. (1990). Trypanosomiasis in domestic animals: the problems of diagnosis. Revue
Scientifique et Technique de’l Office International des Epizooties, 9: 357-367.
Nantulya, V. M. (1994). Suratex: A simple latex agglutination test for diagnosis of Trypanosoma
evansi infections (Surra). Tropical Medicine and Parasitology, 45: 9-12.
Nantulya, V. M. and Lindqvist, K. J. (1989). Antigen detection enzyme immunoassays for the
diagnosis of Trypanosoma vivax, T. congolense and T. brucei infections in cattle. Tropical
Medicine and Parasitology, 40: 267-272.
Nantulya, V. M. and Moloo, S. K. (1989). Recent developments of trypanosomiasis. International
Journal of Animal Science, 4: 71-84.
Nantulya, V. M., Lindqvist, K. J. and Stevension, P. (1989). Towards improved diagnosis of
trypanosomiasis. In: Livestock production and diseases in the tropics. Proceedings of the Sixth

76
International Conference on Livestock Production and Disease in the Tropics held in
Wageningen, Netherlands, Vol. 2.
Ngeiywa, K. J. Z. J. (1992). Clinical and pathological investigations on camel skin diseases in some
camel rich districts of Northern Kenya. MSc thesis, University of Nairobi, Kenya.
Njiru, Z. K., Ole-Mapeny, I. M., Ouma, J. O., Ndun’gu, J. M., and Olaho-Mukani, W. (2000).
Prevalence of trypanosomosis in camel calves: a pilot study in Laikipia District of Kenya. Revue
Élevasé Médiciné Vétérinairé Pays Tropicalé, 53(2): 183-186.
Njogu, A. R., Dolan, R. B., Wilson, A. J. and Sayer, P. D. (1985). Trypanotolerance in East African
Orma Boran cattle. Veterinary Record, 117: 632-636.
Noor, I. M. (1999). A description of camel pastoral system in Moyale District, Kenya. MSc
dissertation, University of Nairobi, Kenya.
Ogwu, D. and Njoku, C. O. (1987). Effect of pregnancy on clinical manifestation of bovine
trypanosomiasis. Veterinary Parasitology, 24: 25-33.
Ogwu, D. and Nuru, S. (1981). Transplacental transmission of trypanosome in animals and man. A
review. The Veterinary Bulletin, 51: 381-384.
Ogwu, D. Njoku, C. O. and Osiri, D. I. K. (1986). Effects of experimental Trypanosoma vivax
infection on first-, second-, and third trimester pregnancy in heifers. Theriogenology, 25: 381-
398.
Olaho-Mukani, W., Munyua, W. K., Mutugi, M. W. and Njogu, A. R. (1993). Comparison of antibody
and antigen selection enzyme immunoassays to the diagnosis of Trypanosoma evansi infections
in camels. Veterinary Parasitology, 45: 231-240.

77
Olubai, W. A. and Woodhouse, P. (1999). Community participation and planning and management of
trypanosomosis: the case of KETRI. International Scientific Council for Trypanosomiasis
Research and Control, No. 120: pp. 373-378.
Owaga, M. L. A. (1985). Observations of efficacy of buffalo urine as a potent olfactory attractant for
Glossina pallidipes austeni. Insect Science and its Application, 6: 561-566.
Pollock, J. N. (1986a). In: “Training manual for tsetse control personnel vol. 2. Ecology and behaviour
of tsetse” FAO, Rome, pp.9-12.
Pollock, J. N. (1986b). In: “Training manual for tsetse control personnel vol. 3. Control methods and
side effects.” FAO, Rome, pp. 5-16.
Pretty, J. N. (1994). Alternative systems of inquiry for a sustainable agriculture. IDS Bulletin, 25(2):
37-47.
Pretty, J. N. (1995). Participatory learning for sustainable agriculture. World Development, 23 no. 8:
1247-1263.
Radostits, O. M. Blood, D.C. and Gay, C. C. (1994). Diseases caused by trypanosomes. In: veterinary
medicine. Diseases of cattle, sheep, goats, pigs and horses, 8th ed. Baillière Tindall, London,
England, pp. 787-813.
Raynaud, J. P., Sones, K. R. and Friedheim, E. A. H. (1989). A review of cymelarsan – new treatment
proposed for animal trypanosomiasis due to Trypanosoma evansi and other trypanosomes of T.
brucei group. In: Proceedings of the 20th meeting: International Scientific Council for the
Trypanosomiasis Research and Control (ISCTRC), Mombasa, Kenya ed. 115, OAU, pp. 334-
338.

78
Roditi, I. and Pearson, T. W. (1990). Procyclin coat of African trypanosomes (or the not-so-naked
trypanosome). Parasitology Today, 6: 79-82.
Roeder, P., Scott, J. M. and Pegram, R. G. (1984). Acute Trypanosome vivax infection of Ethiopian
cattle in the apparent absence of tsetse. Tropical Animal Health and Production, 16: 141-147.
Roelants, G. E. (1986). Natural resistance to African trypanosomiasis. Parasite Immunology, 8: 1-10.
Rogers, D. J. (1985). Trypanosomiasis ‘risk’ or ‘challenge’: A review. Acta Tropica, 42: 5-23.
Saiki, R. K., Gelfand, D. H., Stoffel, S., Scahrf, S. F., Higuchi R., Horn, G. T., Mullis, K. B. and
Erlich, R. A. (1988). Primer-directed enzymatic amplification of DNA with a thermostable DNA
polymerase. Science, 239: 487-491.
Saini, R. K. (1986). Antennal responses of Glossina morsitans to buffalo urine, a potent olfactory
attractant of tsetse. Insect Science and its Application, 7: 771-775.
Schwartz, H. J. and Dioli, M. (1992). The one-humped camel (Camelus dromedarius) in Eastern
Africa; a pictorial guide to diseases, health care and management. Verlag Josef Margraf,
Weikersheim, Germany.
Seigel, S. and Castellan, N. J. (1994). Non-parametric statistics for behavioural sciences 2nd edition.
McGraw-Hill, New York, USA, pp. 399.
Sekoni, V. O., Kumi-diaka, J., Saror, D. and Njoku, C. (1988). The effect of Trypanosoma vivax and T.
congolense infections on the reaction time and semen characteristics in the Zebu bull. British
Veterinary Journal, 144: 388-394.
Soulsby, E. J. L. (1982). Helminths, Arthropods and Protozoa of Domesticated animals. 7th ed.
Baillière Tindall, London, UK, pp. 505-555.

79
Stephen L. E. (1986). In: Trypanosomiasis: a veterinary perspective. Stephen L. E (Editor). Pergamon
Press, Oxford, pp. 184-215.
Tait, A. and Turner, C. M. R. (1990). Genetic exchange in Trypanosoma brucei. Parasitology Today,
6: 70-75.
Tarimo-Nesbitt, R. A., Golder, T. K. and Chaudhury M. F. (1999). Trypanosome infection rate in
cattle at Nguruman, Kenya. Veterinary Parasitology, 30: 153.
Taylor, K., Mertens, B., Rocchi, M. and Lynne Elson. (1999). Immune suppression during bovine
trypanosomosis. International Scientific Council for Trypanosomiasis Research and Control, No.
120: pp.179-180.
Teixeira, A. R. L. (1987). The stercorarian trypanosomes. In: Soulsby, E. J. L, (ed.). Immune
responses in parasitic infection. Vol. III: Protozoa. CRC Press Inc., Boca Raton, Florida, USA
pp.25-118.
Theiler, A. (1903). A new Trypanosoma, and the disease caused by it. Journal of Comparative
Pathology, 16: 193.
Thomson, J. W. and Wilson, A. (1992). The control of tsetse flies and trypanosomosis by the
application of Deltamethrin to cattle. Bulletin of Animal Production in Africa, 40: 5-8.
Thrusfield, M. (1986). In: “ Veterinary Epidemiology.” Butterworth and Co. Ltd. London: pp. 1-280.
Turkana District Development Plan, 2002-2008.
Urquhart, G. M. (1980). The pathogenesis and immunology of African trypanosomiasis in domestic
animals. Transactions of the Royal Society of Tropical Medicine and Hygiene, 74: 726-729.
80
Vale, G. A. (1993). Visual responses of tsetse flies (Diptera: Glossinidae) to odour-baited targets.
Bulletin of Entomological Research, 1970: 563-570.
Vale, G. A. and Hall, D. R. (1985). The use of 1-octen-3-ol, acetone and carbon dioxide to improve
baits for tsetse flies Glossina Spp. (Diptera: Glossinidae). Bulletin of Entomological Research,
75: 219-231.
Voller, A. and De Savigny, D. (1981). Diagnostic serology of tropical parasitic diseases. Journal of
Immunological Methods, 46: 1-29.
Waitumbi, J. N. (1990). Studies on the epidemiology and chemotherapy of Trypanosoma evansi
infections in camels. PhD thesis, University of Nairobi, Kenya.
Wellde, B. T., Reardon, M. J., Chumo, D. A., Kovatch, R. M., Waema, D., Wykoff, D. E., Mwangi, J.,
Boyce, W. L. and Williams, J. S. (1989). Cerebral trypanosomiasis in naturally infected cattle in
the Lambwe Valley, South Nyanza, Kenya. Annals of Tropical Medicine and Parasitology, 83:
151-160.
Wells, E. A. (1972). The importance of mechanical transmission in the epidemiology of nagana: A
review. Tropical Animal Health and Production, 4: 74-88.
Whitelaw, D. D., Gardiner, P. R. and Murray, M. (1988). Extravascular foci of Trypanosoma vivax in
goats: the central nervous system and aqueous humour of the eye as potential sources of relapse
of infection after chemotherapy. Parasitology, 97: 51-61.
Whiteside, E. F. (1958). The control of animal trypanosomiasis in Kenya. A paper prepared for
IACED Symposium 1958. Department of Veterinary Services, Kenya.
Williams, B., Dransfield, R., Brightwell, R. and Rogers, D. (1993). Trypanosomiasis: where are we
now? Health policy plan, 8(10): 85-93.

81
Wilson, A. J., Dolan, R. and Olaho-Mukani, W. (1981). Important camel diseases in selected areas of
Kenya. IPAL/UNESCO Rep., No. E. 6.
Wilson, A. J., Schwartz, H. J., Dolan, R. and Olaho-Mukani, W. (1983). A simple classification of
different types of trypanosomiasis occurring in four camel herds in selected areas of Kenya.
Tropenmed Parasitology, 34: 220-224.
Wilson, R. T. (1984). The camel. Longman Group Ltd. Singapore.
Woo, P. T. K. (1969). The haematocrit centrifuge for the detection of trypanosomes in blood.
Canadian Journal of Zoology, 47: 921-923.

82
APPENDICES
Appendix 1: Disease-signs matrices constructed by the 12 groups of informants on the ground in Lapur Division, Turkana District, 2002.
Diseases
Group Indicator Lotorobuo Emadang’ Loleewa Ekoto Logooroi
1Nk H Skin lesions 0 0 0 25 0
1Nk H Oedema 15 0 0 0 10
1Nk H Loss of hair
1Nk H Emaciation 13 0 6 0 6
1Nk H High mortality 0 12 5 4 4
1Nk H Infertility and abortion
2Nk E Skin lesions 0 0 0 25 0
2Nk E Oedema 20 0 0 0 5
2Nk E Loss of hair
2Nk E Emaciation 11 8 0 3 3
2Nk E High mortality 3 3 11 2 6
2Nk E Infertility and abortion
3Nk W Skin lesions 0 0 0 20 5
3Nk W Oedema 20 0 0 0 5
3Nk W Loss of hair 0 8 0 12 5
3Nk W Emaciation 14 4 2 2 3
3Nk W High mortality 4 3 6 10 2
3Nk W Infertility and abortion 4 3 8 10 0
4Ng E Skin lesions 0 3 0 14 8
4Ng E Oedema 11 0 0 8 6
4Ng E Loss of hair 0 0 0 25 0
4Ng E Emaciation 10 1 1 7 6
4Ng E High mortality 12 0 0 7 6
4Ng E Infertility and abortion 12 0 0 5 8
5Ng W Skin lesions 0 5 0 20 0
5Ng W Oedema 20 0 0 0 5
5Ng W Loss of hair 3 3 0 19 0
5Ng W Emaciation 18 0 5 0 2
5Ng W High mortality 8 6 6 1 4
5Ng W Infertility and abortion 20 0 5 0 0
6Ek E Skin lesions 0 0 0 25 0
6Ek E Oedema 14 5 0 0 6
6Ek E Loss of hair 0 10 0 15 0
6Ek E Emaciation 5 10 0 10 0
6Ek E High mortality 6 0 3 10 6
6Ek E Infertility and abortion 10 0 0 15 0
7Ek W Skin lesions 0 4 0 14 7
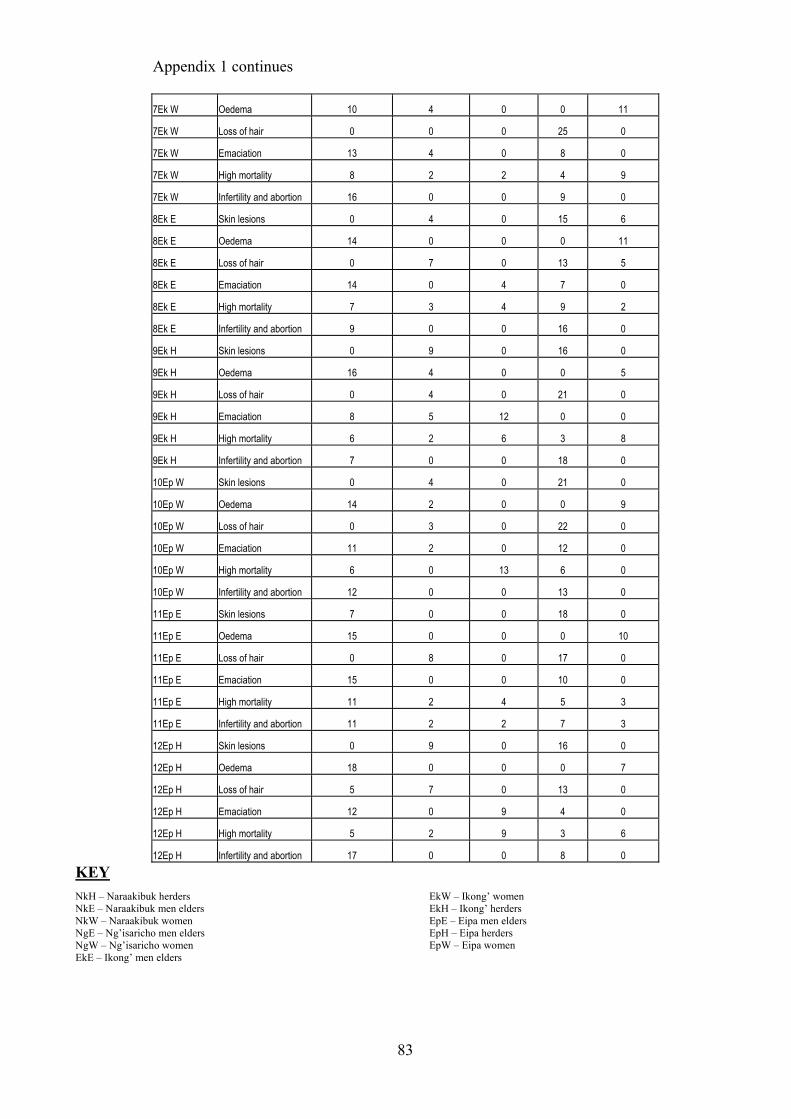
83
Appendix 1 continues 7Ek W Oedema 10 4 0 0 11
7Ek W Loss of hair 0 0 0 25 0
7Ek W Emaciation 13 4 0 8 0
7Ek W High mortality 8 2 2 4 9
7Ek W Infertility and abortion 16 0 0 9 0
8Ek E Skin lesions 0 4 0 15 6
8Ek E Oedema 14 0 0 0 11
8Ek E Loss of hair 0 7 0 13 5
8Ek E Emaciation 14 0 4 7 0
8Ek E High mortality 7 3 4 9 2
8Ek E Infertility and abortion 9 0 0 16 0
9Ek H Skin lesions 0 9 0 16 0
9Ek H Oedema 16 4 0 0 5
9Ek H Loss of hair 0 4 0 21 0
9Ek H Emaciation 8 5 12 0 0
9Ek H High mortality 6 2 6 3 8
9Ek H Infertility and abortion 7 0 0 18 0
10Ep W Skin lesions 0 4 0 21 0
10Ep W Oedema 14 2 0 0 9
10Ep W Loss of hair 0 3 0 22 0
10Ep W Emaciation 11 2 0 12 0
10Ep W High mortality 6 0 13 6 0
10Ep W Infertility and abortion 12 0 0 13 0
11Ep E Skin lesions 7 0 0 18 0
11Ep E Oedema 15 0 0 0 10
11Ep E Loss of hair 0 8 0 17 0
11Ep E Emaciation 15 0 0 10 0
11Ep E High mortality 11 2 4 5 3
11Ep E Infertility and abortion 11 2 2 7 3
12Ep H Skin lesions 0 9 0 16 0
12Ep H Oedema 18 0 0 0 7
12Ep H Loss of hair 5 7 0 13 0
12Ep H Emaciation 12 0 9 4 0
12Ep H High mortality 5 2 9 3 6
12Ep H Infertility and abortion 17 0 0 8 0 KEY NkH – Naraakibuk herders NkE – Naraakibuk men elders NkW – Naraakibuk women NgE – Ng’isaricho men elders NgW – Ng’isaricho women EkE – Ikong’ men elders
EkW – Ikong’ women EkH – Ikong’ herders EpE – Eipa men elders EpH – Eipa herders EpW – Eipa women
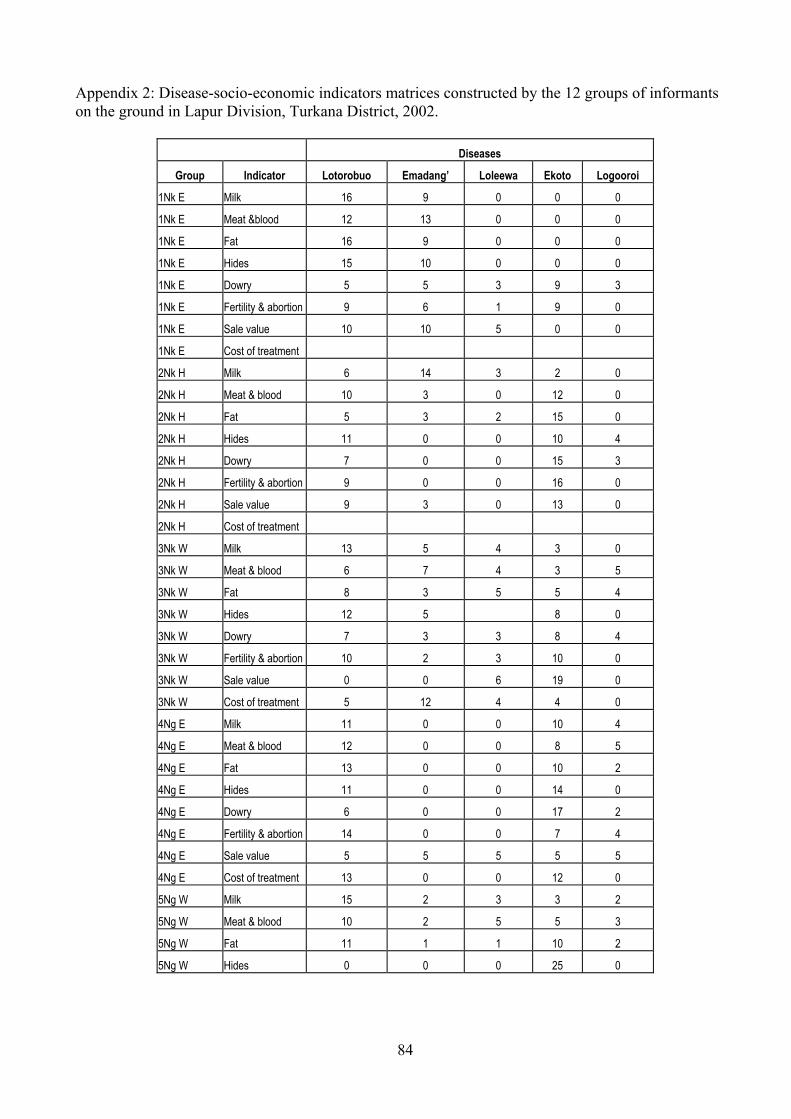
84
Appendix 2: Disease-socio-economic indicators matrices constructed by the 12 groups of informants on the ground in Lapur Division, Turkana District, 2002.
Diseases
Group Indicator Lotorobuo Emadang’ Loleewa Ekoto Logooroi
1Nk E Milk 16 9 0 0 0
1Nk E Meat &blood 12 13 0 0 0
1Nk E Fat 16 9 0 0 0
1Nk E Hides 15 10 0 0 0
1Nk E Dowry 5 5 3 9 3
1Nk E Fertility & abortion 9 6 1 9 0
1Nk E Sale value 10 10 5 0 0
1Nk E Cost of treatment
2Nk H Milk 6 14 3 2 0
2Nk H Meat & blood 10 3 0 12 0
2Nk H Fat 5 3 2 15 0
2Nk H Hides 11 0 0 10 4
2Nk H Dowry 7 0 0 15 3
2Nk H Fertility & abortion 9 0 0 16 0
2Nk H Sale value 9 3 0 13 0
2Nk H Cost of treatment
3Nk W Milk 13 5 4 3 0
3Nk W Meat & blood 6 7 4 3 5
3Nk W Fat 8 3 5 5 4
3Nk W Hides 12 5 8 0
3Nk W Dowry 7 3 3 8 4
3Nk W Fertility & abortion 10 2 3 10 0
3Nk W Sale value 0 0 6 19 0
3Nk W Cost of treatment 5 12 4 4 0
4Ng E Milk 11 0 0 10 4
4Ng E Meat & blood 12 0 0 8 5
4Ng E Fat 13 0 0 10 2
4Ng E Hides 11 0 0 14 0
4Ng E Dowry 6 0 0 17 2
4Ng E Fertility & abortion 14 0 0 7 4
4Ng E Sale value 5 5 5 5 5
4Ng E Cost of treatment 13 0 0 12 0
5Ng W Milk 15 2 3 3 2
5Ng W Meat & blood 10 2 5 5 3
5Ng W Fat 11 1 1 10 2
5Ng W Hides 0 0 0 25 0

85
Appendix 2 continues 5Ng W Dowry 10 0 3 9 3
5Ng W Fertility & abortion 15 0 10 0 0
5Ng W Sale value 3 2 3 14 3
5Ng W Cost of treatment 12 0 3 8 2
6Ek E Milk 6 0 3 12 4
6Ek E Meat & blood 8 3 2 8 4
6Ek E Fat 6 3 0 12 4
6Ek E Hides 0 0 0 25 0
6Ek E Dowry 6 1 3 9 6
6Ek E Fertility & abortion 7 2 3 13 0
6Ek E Sale value 8 0 0 15 2
6Ek E Cost of treatment 4 2 1 15 3
7Ek W Milk 11 1 3 4 6
7Ek W Meat & blood 8 7 4 6 0
7Ek W Fat 12 2 1 10 0
7Ek W Hides 5 0 0 20 0
7Ek W Dowry 8 1 8 6 2
7Ek W Fertility & abortion 11 0 2 9 3
7Ek W Sale value 8 2 4 10 1
7Ek W Cost of treatment 2 2 8 10 3
8Ek H Milk 15 0 6 4 0
8Ek H Meat & blood 7 3 10 4 1
8Ek H Fat 11 0 11 3
8Ek H Hides 4 3 0 16 2
8Ek H Dowry 1 1 5 15 3
8Ek H Fertility & abortion 3 0 8 14 0
8Ek H Sale value 1 0 3 10 11
8Ek H Cost of treatment 7 2 3 13 0
9Ek W Milk 10 2 4 6 3
9Ek W Meat & blood 11 2 4 4 4
9Ek W Fat 7 3 5 7 3
9Ek W Hides 9 2 0 14 0
9Ek W Dowry 5 1 3 14 2
9Ek W Fertility & abortion 7 1 3 12 2
9Ek W Sale value 8 2 2 11 2
9Ek W Cost of treatment 8 2 3 10 2
10Ep E Milk 8 2 4 8 3
10Ep E Meat & blood 11 1 3 8 2
10Ep E Fat 10 2 4 7 2
10Ep E Hides 8 1 2 10 4

86
Appendix 2 continues 10Ep E Dowry 10 1 4 7 3
10Ep E Fertility & abortion 11 1 5 6 2
10Ep E Sale value 10 1 3 8 3
10Ep E Cost of treatment 9 5 2 6 3
11Ep H Milk 12 0 3 10 0
11Ep H Meat & blood 20 0 0 5 0
11Ep H Fat 19 0 0 6 0
11Ep H Hides 4 0 0 21 0
11Ep H Dowry 1 0 6 9 9
11Ep H Fertility & abortion 14 0 8 3 0
11Ep H Sale value 1 0 7 9 8
11Ep H Cost of treatment 2 1 6 3 13
12Ep W Milk 6 3 5 6 5
12Ep W Meat & blood 6 4 5 5 5
12Ep W Fat 10 2 4 5 4
12Ep W Hides 12 2 0 11 0
12Ep W Dowry 7 2 5 7 4
12Ep W Fertility & abortion 9 2 4 8 2
12Ep W Sale value 7 1 6 7 4
12Ep W Cost of treatment 11 5 0 9 0

87
Appendix 3: Disease control matrices constructed by four groups of informants on the ground in Lapur Division, Turkana District, 2002
Control methods
Group Indicators Relocation Pour-on Drugs Indigenous
1EkE Cost 9 5 4 2
1EkE Effectiveness 0 0 14 6
1EkE Availability 0 0 7 13
1EkE Ease 0 0 16 4
2EkW Cost 10 4 3 3
2EkW Effectiveness 0 0 12 8
2EkW Availability 0 0 9 11
2EkW Ease 0 0 12 8
3EpE Cost 2 10 5 3
3EpE Effectiveness 8 4 6 2
3EpE Availability 2 0 8 10
3EpE Ease 1 8 5 6
4EpW Cost 7 6 4 3
4EpW Effectiveness 1 1 12 6
4EpW Availability 2 0 8 10
4EpW Ease 2 0 13 5

88
Appendix 4: Seasonal calendar matrices constructed by 4 groups of informants on the ground in Lapur Division, Turkana District, 2002.
Seasons
Group Diseases Akiporo Akiitiar Akamu
Nk E Lotorobuo 0 0 15
Nk E Emadang' 0 4 11
Nk E Loleewa 8 3 4
Nk E Ekoto 3 6 6
Nk E Logooroi 8 2 5
Ng E Lotorobuo 4 0 11
Ng E Emadang' 5 5 5
Ng E Loleewa 15 0 0
Ng E Ekoto 5 0 10
Ng E Logooroi 8 2 5
Ek E Lotorobuo 8 3 4
Ek E Emadang' 8 4 3
Ek E Loleewa 15 0 0
Ek E Ekoto 7 5 3
Ek E Logooroi 10 3 2
Ep E Lotorobuo 6 5 4
Ep E Emadang' 5 5 5
Ep E Loleewa 15 0 0
Ep E Ekoto 10 3 2
Ep E Logooroi 15 0 0

89
Appendix 5: A filter paper used to impregnate camel blood in Lapur Division, Turkana District, 2002.