community redesign handbook
TRANSCRIPT

Community
Redesign
integrating
land use,
transportation,
and
natural resources
Design Center for American Urban Landscape
College of Architecture and Landscape Architecture


Design Center for American Urban Landscape
College of Architecture and Landscape Architecture
Community Redesignintegrating land use, transportation, and natural resources

Design Center Project Team, Community Redesign Handbook:
Regina Bonsignore, Senior Research FellowJeffrey L. Miller, Research FellowMatthew R. Finn, Research SpecialistFranklin Fitzgerald, Daniel Marckel, Nancy Miller, Wira Noeradi, Carol SwensonHeather Wainwright, Dave Zaffrann
Funding for this project was provided by the McKnight Foundation. Additional funding for this study andother Design Center publications is made possible through support from the University of Minnesota and theDayton Hudson Foundation.The University of Minnesota is committed to the policy that all persons shall have equal access to its pro-grams, facilities, and employment without regard to race, color, creed, religion, national origin, sex, age,marital status, disability, public assistance status, veteran status, or sexual orientation.
© October, 2002 Design Center for American Urban LandscapeCollege of Architecture and Landscape ArchitectureUniversity of Minnesota
Photographs and images in this book were generated by the Design Center for American Urban Landscape unless otherwisenoted. These images may be used without permission for non-profit educational purposes, with attribution. Permission is alsogranted for non-profit educational purposes for reproduction of all or part of written material, except that reprinted withpermission from other sources. Acknowledgment is required and the Design Center for American Urban Landscape requeststwo copies of any material thus produced.
Humboldt AvenueCatherine R. Brown, Roger Howley, Mike Kelly, Daniel Marckel, William Marquez, William R. Morrish
Northwest Corridor Partnership and Brooklyn Blvd. & Hwy. 81Tiago Carvalho, Matthew R. Finn, Frank Fitzgerald, Daniel J. Marckel, Laurie McGinley, Jeffrey L. Miller, Nancy Miller,William R. Morrish, Wira Noeradi, Carlos Pinto, Gia Pionek, Ray Rindahl, Heather Wainwright, Dan WhittakerConsultants: Fred Dock, Rob Lucklow, Ramana Murthy Koti, Jaimison Sloboden
Near Northside, MinneapolisRegina Bonsignore, Catherine R. Brown, Ron Haselius , Roger Howley, Gayla Lindt, Louise Liu, Dan Marckel, William R.Morrish, Sam Olbekson, Todd Rhoades, Sarah Ruplin, Katherine Solomonson, Don Vehige, Craig WilkinsConsultants: John Zeisel, GME Consultants Inc, Gary Meyer
Nicollet AvenueFrank Fitzgerald, Wira Noeradi, Ryan Siemers, Brandon Stengel, Carol Swenson, Heather WainwrightConsultants: Craig Churchward, Fred Dock, James Jencks, Mike Kotila, Ramana Murthy Koti
Northeast BlaineDax Bennett, Regina Bonsignore, Katherine Colla, Frank Fitzgerald, Santosh George, Diane Hellekson, Wira Noeradi, CarolSwenson, Jason ZimmermanConsultants: Martha Brand, Julie Marckel
FarmingtonRegina Bonsignore, Catherine R. Brown, M. Elizabeth Fitzsimons, Harrison Fraker, Thomas A. Hammerberg, William R.Morrish, R. G. SchunnConsultants: Eugene A. Hickok, Daniel M. Parks, Diana Balmori Assoc., Herbert Bormann
North Metro I-35W Corridor CoalitionDax Bennett, Regina Bonsignore, Matt Finn, Frank Fitzgerald, Steven Lai, Sinok Lao, Daniel Marckel, Laurie McGinley, NancyMiller, William R. Morrish, Wira Noeradi, Kim Peterson, Gia Pionek, Carol Swenson, Heather Wainwright, Jason ZimmermanConsultants: Martha Brand, John Carpenter, Joe Di Stefano, Fred Dock, Janna King, Joel Koepp, Ramana Murthy Koti, BarbaraRaye, Nancy Reeves and Associates, Tim Rood, Jaimison SlobodenCoalition Consultants: Robert Benke, Phil Cohen, Nancy Reeves, Joseph Strauss, Shannon Strauss
Design Center Project Teams, Case Studies:

Table of Contents
One Introduction ............................................................................1Organization of the Handbook
Community Goals
Three Scales of Design
Two Planning and Design process .......................................7Assessing the place: issues, scales, and boundaries
Engaging local and regional communities
Taking inventory of the landscape
Analyzing and interpreting the place
Exploring design scenarios
Agreeing on design principles
Moving forward
Three Neighborhood scale .........................................................27Neighborhood Scale Principles
Case Studies:
Creating a community parkway: New greenway and housing amenities for
Humboldt Avenue neighborhoods in Minneapolis, Minnesota
Creating a transit-supportive walkable center: New land use development
patterns for the Brooklyn Boulevard & County Highway 81 district in
Brooklyn Park, Minnesota
Reconnecting a site to its surroundings: Community and environmental design
of a neighborhood in Minneapolis, Minnesota
Four Town scale ..............................................................................47Town Scale Principles
Case Studies:
Building within the community watershed: Designing waterways as an
environmental framework for development in Farmington, Minnesota
A natural-resource based town plan: Integrating community growth and open
space goals in Blaine, Minnesota
Rethinking a community corridor: Developing a common vision for Nicollet
Avenue in Minneapolis, Minnesota
Five Subregional scale ...............................................................67Subregional Scale Principles
Case Studies:
Transforming a highway landscape into a metropolitan corridor of districts,
walkable centers and greenways
Charting a new course for a subregion of seven cities
Glossary....................................................................................81
Bibliography ...........................................................................93


Acknowledgements
This handbook is a synthesis of experiences shared by the manypeople who have worked with and for the Design Center forAmerican Urban Landscape under the leadership of WilliamMorrish, Director (1988-2001) and Catherine Brown, Director ofSpecial Projects (1988-1997). The list of people to acknowledge fortheir contributions includes all the staff, both short and long termwho contributed their ideas, drawings, writing, and legworkneeded to execute the projects profiled here. It includes all of theconsultants who edited and wrote various publications andshared their technical expertise, enhancing our knowledge andproject results. The funders who supported these projects alsocontributed their visions, goals, and critical eyes to help guide thedirection and outcomes of the projects. Finally, the citizens andstaff from our community partners gave the time, sense of humor,patience, and wisdom that has made every project more groundedand outcomes more relevant.


Chapter One: Introduction 1
Introduction
The design of communities and landscape is not always a hotnews item. But in an era of rapid growth, with a projectedpopulation increase of one million people in the next forty years,residents of the Twin Cities have a renewed interest in how theirneighborhoods and cities will take shape to accomodate thisgrowth. At an alarming rate, communities are consuming evergreater amounts of land, serving less people and at greater cost tolocal governments and the environment. Meanwhile, a sense ofsameness seems to threaten the unique qualities in cities across theregion. Do current trends predict the future? Fortunatelyneighborhoods and cities do have alternatives.
As traffic congestion increases, open space disappears, land andhome costs skyrocket, and our natural resources disappear, aserious questioning of past land use practices and policies hasbegun. Are there things that could be done differently, so that ourland consumption does not outpace our population growth? Cannew businesses and homes be built without sacrificing naturalareas? Can all activities be located so that they are not dependenton another trip, battling traffic? How can each of these concernsbe brought together in the neighborhood, town, and landscape ofthe subregion—the larger arena that each of us traverses betweenwork, school, shopping, and play.
The Design Center for American Landscape is a research center atthe University of Minnesota’s College of Architecture andLandscape Architecture that has been trying to answer these typesof questions with communities in the Twin Cities metro regionsince 1988. As more local developers, governments, and citizenssought alternatives to the status quo, the need for local examplesbecame apparent. This handbook is a compilation of informationand experience gained from working at a variety of project scalesand locations. The approaches are drawn from a wide array ofpractioners and proponents of concepts such as livablecommunities, smart growth, transit-oriented development, greeninfrastructure, and low-impact development, represented in theextensive list of references. Because of active participation in thesediscussions, the Center has contributed to the pool of ideas as well.

Community Redesign2
This handbook highlights and integrates these various arenas ofconcern—the environment, transportation, housing,neighborhood placemaking, and sustainable development.Coming from a physical design perspective, this book placesemphasis on this dimension, while recognizing the importance ofother issues such as financing, economics, and social services.
The handbook concentrates on the place-making elements ofdesign that can enhance livability in the following ways:protecting and restoring natural systems, strengthening socialconnections, providing transportation choices, enhancing homesand neighborhoods, and integrating land uses and economicactivities
The book agrees with the premise that local governments wishingto implement these ideas should:1. Proactively plan rather than wait for development proposals
to come in,2. Prepare specific plans prior to any development, based upon
livability principles, and3. Carry out proactive planning in an open and participatory
process. (Weissman, 1992)
Regardless of who prepares these proactive plans, whether it iscity staff or a consulting firm, everyone in the process can benefitfrom knowing how other communities have faced similar issues.Staff, citizens, planning commissioners, or city council memberswho have seen “what might be” are better prepared to evaluatedevelopment proposals, revise existing policies, or developprograms to support their own vision.
Organization of the HandbookThis introductory chapter describes five general goals—theyreappear throughout the book as a common thread—and threescales of community design. Chapter 2 is a general guide to theprocess used by the Design Center and its project partners as theyhave explored, analyzed, proposed, and implemented projectsthroughout the Twin Cities.
The next three chapters discuss three different scales of work thatare defined in terms of size rather than political boundary, thoughin many cases the two coincide. Chapter 3 focuses on the neigh-borhood scale, chapter 4 covers the town scale and the subregionis covered in chapter 5, describing larger-scale efforts. Those withmore experience with community design and planning may wantto jump to the scale of work of most interest.
Neighborhood:Areas comprised of multiple blocks within a
limited geographic area, typically less than a
mile square.
I
Subregion:Larger areas where several communities
share a resource, such as a transportation
corridor or river.
Town:Places that contain multiple
neighborhoods or subdivisions that share
community features such as a
commercial center or corridor, with an
area roughly one mile to six miles square.

Chapter One: Introduction 3
Each chapter begins with the five general goals, made into morescale-specific principles. Case studies are then profiled, followingthe general process format introduced in chapter 2. The mainbody of the book is followed by a glossary of terms that frequentlycrop up in the professional literature and popular press.
Neighborhood Scale Case Studies
1. Humboldt Avenue
2. Brooklyn Boulevard
3. Near North Minneapolis
Town Scale Case Studies
4. Farmington
5. NE Blaine
6. Nicollet Avenue
Subregional Case Studies
7. County Highway 818. North Metro I-35W Coalition
1
2
3
4
5
6
7 8

Community Redesign4
Community GoalsBased upon the Design Center’s work with local communities, thefollowing goals have been recurring themes that have guided thework:
Protect and Restore Natural SystemsStrengthen Social ConnectionsProvide Transportation ChoicesEnhance Homes and NeighborhoodsIntegrate Land Uses and Economic Activities
Each of these goals is briefly described, including reasons whyregions should be interested in the benefits of moving away frompast land use practices and moving toward a pattern of develop-ment that can improve quality of life over the long term.
Protect and Restore Natural SystemsThis goal reflects the growing realization that current develop-ments are severely hampering the survival of all but the mosthuman-tolerant plant and animal species. In this metropolitanarea, it’s especially important to think about, because we are at theupper reaches of the Mississippi River Flyway, the primary birdmigratory route for the mid-continent. We are also an area ofexceptional plant community diversity where three biomes con-verge: the prairie, big woods, and boreal forest. Complementary tothe concern for the health and vitality of native plant and animalspecies is the concern for water quality. We know that non-pointsource water pollution from urban and rural land use is severelydegrading our lakes and streams. Certainly the Twin Cities re-gional identity is defined, in part, by our urban lakes and rivers.This goal focuses on natural systems—the ecological functions ofthe landscape—rather than strictly parks or open space. For thisgoal to be realized, places for habitat and movement of plant andanimal species must be considered in projects at every scale.Urban runoff must be seen not only as a nuisance to be removedduring storms, but also as a resource to be returned to the soil andthen slowly released into the groundwater or surface waters.
Strengthen Social ConnectionsMany of the land use patterns that have evolved in the last fiftyyears have resulted in a landscape that physically separatespeople from each other and from local destinations. While thishandbook does not have the space to delve into the many causesof this phenomenon, a new focus of civic leaders is to providepublic settings where people can interact with others in theirneighborhood or town. Trails, parks, streets, public, and semi-public institutions are all places that can be designed to affordpeople the opportunity for casual encounters of friends andneighbors. Creating these places today becomes particularlyimportant when some traditional meeting places no longer servethat purpose. For instance, in districts where school choice allowsmany options, the neighborhood school is less a focal point forgetting to know neighbors, however the nearby park remains a
As development pressure increases, small
and large natural areas begin to
disappear, until only larger wetlands
remain, severely compromised by
adjacent land uses.
An inviting entry area between the
sidewalk and a library and
recreation center. (Highland Park, St.
Paul)

Chapter One: Introduction 5
local gathering place where T-ball and soccer games are played.Large churches may draw from the entire region rather than therelative small geographic range of a parish church, however alocal community center may be the hub of adult education classesor family programs.
Provide Transportation ChoicesOur typical planning process does a great job of analyzing andaddressing the needs of moving and parking automobiles, withless priority for other options for getting around. On most siteplans, the goal is moving people from parking to building ratherthan between the building and other destinations such as a noon-time walk to a cafe or a walk to the bus stop. At a larger scale,trails are often designed for recreation purposes to link homes andparks, but little investment is given to other places where trailsand sidewalks would be helpful, such as between parks andbusiness centers or along arterials where bus service is available.As land uses separate and spread out, car travel becomes a re-quirement rather than a choice. This design strategy has resultedin more vehicle miles traveled, at great cost in the form of trafficcongestion, continual road reconstruction, and diminished air qual-ity, and many believe at great cost to the collective health of ourpeople. As activity is engineered out of our lives, it becomes harderto integrate exercise into daily living.
Enhance Homes and NeighborhoodsThis goal promotes the idea of neighborhood design rather thanhousing development design. The prevalent practice is to place allmulti-family housing in one area, single family housing in anotherarea, and both of those uses well-separated from business orcommercial uses. In theory, the desire to separate these usescreates a more harmonious environment. In practice, it also cancreate a landscape that limits choice in housing options within aneighborhood for people who cannot afford or do not choose tolive in a single family home. If a community becomes unbalancedin its housing mix, particularly places that develop in a shortperiod of time, concentrations of age groups may strain servicessuch as school facilities or health care if the population is unusu-ally young or elderly. The lack of nearby services typically resultsin more car trips per household, adding to congestion. In somecases, segregating land uses can also result in a concentration ofpoverty that can negatively impact a community’s ability toattract services. A preferred approach is to achieve a harmoniousenvironment through quality design rather than separating “in-compatible” land uses that effectively create socio-economicenclaves. Paying attention to street design and access to localamenities, as well as the architectural character of buildings, areall part of designing a quality neighborhood.
Integrate Land Uses and Economic ActivityThe concept of mixing land uses applies not only to predomi-nantly residential neighborhoods, but also to the commercial areas
The different goals address issues that are
interrelated. A family bike ride or a stroll
down the sidewalk to the local video
store are opportunities to have casual
interactions with neighbors that are less
possible when pathways are not
provided and there are no nearby
destinations.
For many years in the Twin Cities, the
ideal home-type has been equated with
single family houses. This type of housing is
well-suited and preferred by some, but
other types of well-designed dwellings
are equally needed and desirable.

Community Redesign6
of a neighborhood, town or subregion. Integrating land usestraditionally segregated by zoning, a mixed-use strategy clustersdifferent land uses and activities within a walkable area. Thebenefits of such an arrangement include a reduced reliance on cartrips for short errands. If housing is added to the mix, not only aremore people around throughout the day and evening, the possibil-ity of living near work allows the option of further reducingautomobile dependence. A well-designed mixed use area can alsocreate a sense of place in areas lacking such a center.
Three Scales of DesignThe goals described above are general and broad brush. How theyare applied, on the ground, depends in part on the local qualitiesof a place, and in part, on the scale of a project’s focus. Places inthe metropolitan area are constantly undergoing change, withroads and utilities under repair, new stormwater requirements,and market forces that generate zoning change requests and newdevelopment options. Each of these changes are opportunities toincrementally improve the quality of the metro environment.
Sometimes the opportunities are hard to see without looking at amore detailed scale or the broader scale. This handbook discussesthree scales: the neighborhood, town and subregion. They arediscussed and defined in more detail in chapters 3, 4, and 5.Though presented in separate chapters, the most effective practiceis to be aware all three scales on every project. When working atthe neighborhood scale, knowing the larger context can informdecisions about where to locate different types of housing, path-ways, or environmental restoration projects. When working at themacro scale, such as multiple communities along a highwaycorridor, it is important to look at the implications of subregionalprojects on a neighborhood or town scale. Not only does this kindof “zoom lens” approach help set priorities within a community, italso makes a better case for projects and improvements that arecompeting for metropolitan, state, or federal funding matches.
Suburban communities are retrofitting
older shopping centers by adding civic
open space and increasing the amount
of housing near to shopping and work
places.
Neighborhood
Town
Subregion

Chapter Two: Planning and Design Process 7
Chapter Two:
Planning and Design ProcessEvery project is unique in its circumstance andreason for being: a developer seeks a zoningchange, triggering neighborhood activism;elected officials begin planning for a larger cityhall; a county proposes a road upgrade; newenvironmental regulations require water systemretrofits. While the origins of each project aredifferent, each has the potential to add value tothe community by achieving one or more of thefive goals described in the introduction. Whoeverinitiates the process, whether it is the staff of acity, a citizen group, or an advocacy group, theeffort will likely involve a variety of people andoccur over a period of years. This road-map is aguide through that process, distilled from casestudy experiences in the Twin Cities and furtherafield.
The information is basic and geared toward thenewcomer to the physical design dimensions ofcommunity development—whether a junior staffmember or citizen activist wanting to participatein or initiate a project in their community. Tothose familiar with this process, the chapteroffers a reference that compiles familiarstrategies, and maybe a new thing or two.
The chapter outlines general process steps andtasks that will help deliver more from eachproject, by connecting it to multiple other threadsin the community fabric. The process steps are:
• Assessing the place• Engaging communities• Taking inventory of the landscape• Analyzing and interpreting the place• Exploring design scenarios• Agreeing on design principles• Moving forward
Although presented linearly, in practice, the ordermay be different, with some parts of the processrepeated several times if the area of concern isparticularly complex.
Each step and anticipated outcome is brieflydescribed, then followed by a checklist of tasks,
Assessing the placeWhat has prompted the need or desire for change in thephysical environment?What processes will produce well-informed decisionsand design?
Engaging communitiesWho should be involved?How can we engage local people and stakeholders?
Taking inventory of the landscapeWhat natural and physical resources do we have andwhere are they located?How can the information be visualized?
Analyzing and interpreting the placeWhere is there room for improvement?What kind of changes are possible or desirable?
Exploring design scenariosWhat kind of place can we make?What are the different ways we can connect andintegrate community systems to make places?
Agreeing on design principlesWhat is our conceptual vision for this place?What design and planning principles will guide futureefforts?
Moving forwardWhat are the critical next steps to move the projecttoward implementation?What resources might help steer these next steps?
accompanied by helpful tools. These steps arealso used to organize the case study presentationsfound in chapters 3, 4, and 5. They help addressquestions that need answering to elevate a run-of-the-mill project into a civic endeavor thatcaptures the most of local opportunities andachieves broader community-building goals. Thischapter concludes with a summary checklist oftasks and tools.
Guide to the ChapterThe following list shows what questions eachprocess step can help answer.

8 Community Redesign
Assessing the place: issues, scales, and boundariesWhat has prompted the need or desire for change in the physical environment?What processes will produce well-informed decisions and design?
While each community project is unique, twokinds of projects are typical: an idea looking for aplace, such as the location for a new city hall, or aplace undergoing or in need of change, such as ahighway corridor with stagnating land values.This handbook focuses on the latter, though a siteselection process could use similar techniques toevaluate the potential of different sites. For aplace in need of change, the key initiating task isto develop a process that clarifies issues, exploresalternatives, involves the community in a varietyof ways, and arrives at an implementation strategythat is politically and economically feasible.
Desired outcome:The outcome of this guided discussion will be aprocess proposal that includes the general scopeand scale of the study area, general communityredesign goals, process steps, and timelines.
Tool 1: A USGS quadrangle map
This 1”=2000’ scale map is particularly helpful,
because it identifies topography, roads, major
buildings, and natural features. Municipal
boundaries are less prominent, and looking at
an area in a different context than the typical
neighborhood or city map helps people think
outside the box. These inexpensive maps are
available as electronic files or hard copies
that can be purchased at map stores or the
Minnesota Geologic Survey. Be sure to check
when the maps were last updated.
Task: Agree on general goals, work scope andparameters of study or project.For discusssion, draft a list of general goals suchas the ones outlined in this book.Having thatdiscussion with a map, such as a USGSQuadrangle, in front of the group can generate amore focused discussion about the parameters ofa study or project and who should be involved(tool 1). The area of study may include more thanone boundary—for example, a focus area wherethe most change is likely to occur and a broaderstudy area to provide context. In addition togeographic boundaries, other parameters shouldbe established, such as policies or areas that are“off-limits” for change. Circumstances may alterthese parameters as the process moves forward,however, it is useful to articulate as many of thesegivens as possible. By working backwards fromfixed deadlines such as grant application duedates, a general timeline and work scope can beestablished.
2000 feet N

Chapter Two: Planning and Design Process 9
Tool 2: Annotated map
This type of map serves to capture as many potential
elements that could affect or complement each other.
The example includes elements that were happening
at a larger or smaller scale than the study at hand. The
elements are displayed in a bubble over the map,providing a mental map of where activities are taking
place, suggesting possible relationships among
previously separate efforts.
Task: Discuss issues and review existing plansand projects in the area of concern andsurroundings.A small group can brainstorm to create a draft listand map of issues, proposed plans and projects inthe vicinity. Visit with others to verify or add tothe information shown. This activity helps buildawareness of your project, and will reduce thenumber of surprises later on. Visit the site.Resources include neighborhood, city, andregional plans for the future, including capitalimprovement plans, comprehensive plans, smallarea plans, and transportation plans (tools 2,3).
Tool 3: A walk-through or drive-through of the area
Impressions of the actual site as a pedestrian, bus
passenger, or driver can heighten awareness of the
positive elements or shortcomings of a place. This
activity is most effectively done as a group—partly to
insure that it happens, partly because casual insights
and conversations can be thought-provoking. The tour
can also include other parts of the community that
demonstrate positive qualities that might be transferred
to the area of concern.

10 Community Redesign
Engaging local and regional communitiesWho should be involved?How can we engage local people and stakeholders?
This handbook proposes that the process ofbuilding metropolitan communities benefits fromthe knowledge and participation of a broaderrange of people than those typically involved inzoning or planning changes: decision makers,their staff, and directly-affected property owners.Inviting broader participation does not imply afree-for-all, but rather a thoughtfully plannedinvolvement strategy that moves beyond thepublic hearing format. Other forms ofparticipation can yield valuable information anddeeper insight for those involved.
Desired outcome:An effectively designed community engagementstrategy will create goodwill and utilize the localknowledge and talents available. A well-informedgroup of citizens and constituents will be moreaware of upcoming change and its rationale.
Task: Decide who should be involved and how.There are many different formats forinvolvement, such as an open participation or astakeholder group process. An expansive pool ofparticipants can result in more varied thinking.Beyond planning commissioners, communitydevelopment staff, planning staff, propertyowners, residents, and elected officials, consider Tool 4: Process diagram
A depiction of the process, including images of
products as well as where and how people will be able
to participate, will be helpful throughout the study.
Examples of format options:
Open participation process
The public is invited to attend a series of meetings
and workshops, organized by a task force or
committee, with input and feedback recorded
and summarized as a report to a decision-making
body. This format is inclusive, giving all a chance to
participate. However, the weight of participants’
opinions is unclear and attendance may vary
widely, making it difficult to progress through a
series of issues or decisions.
Stakeholder group process
The sponsoring organization assembles a
stakeholder group, representing all primary
interests in the project. The stakeholder group
controls the agenda and identifies information and
analysis needs to support staff. Each member
reports to and represents their constituency group.
A more in-depth awareness can result as well as a
greater chance that the stakeholder group’s
recommendations will be supported by
participating constituency groups. The process can
be more time-consuming and is most effective if
members communicate with and responsibly
represent the interests of their group. If no
agreement on recommendations can be
reached, a majority and minority report can be
produced.
Chapter Two: Planning and Design Process 11
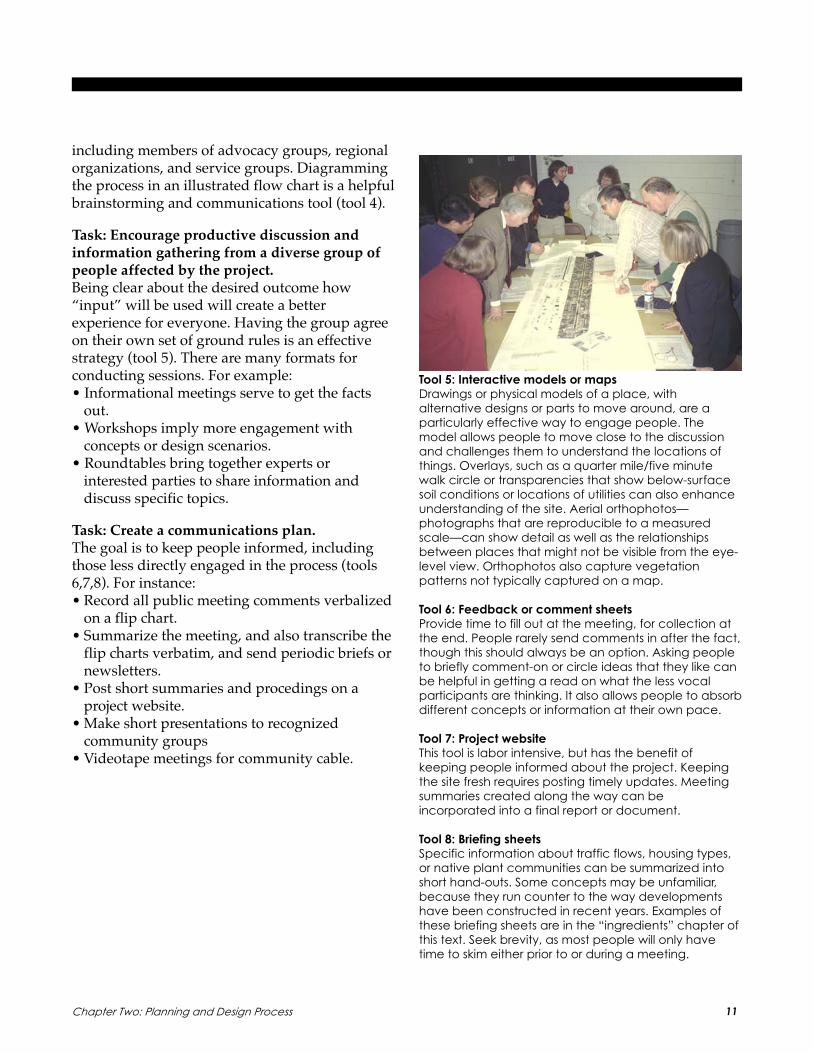
Tool 5: Interactive models or maps
Drawings or physical models of a place, with
alternative designs or parts to move around, are a
particularly effective way to engage people. The
model allows people to move close to the discussion
and challenges them to understand the locations of
things. Overlays, such as a quarter mile/five minute
walk circle or transparencies that show below-surface
soil conditions or locations of utilities can also enhance
understanding of the site. Aerial orthophotos—
photographs that are reproducible to a measured
scale—can show detail as well as the relationships
between places that might not be visible from the eye-
level view. Orthophotos also capture vegetation
patterns not typically captured on a map.
Tool 6: Feedback or comment sheets
Provide time to fill out at the meeting, for collection at
the end. People rarely send comments in after the fact,
though this should always be an option. Asking people
to briefly comment-on or circle ideas that they like can
be helpful in getting a read on what the less vocal
participants are thinking. It also allows people to absorb
different concepts or information at their own pace.
Tool 7: Project website
This tool is labor intensive, but has the benefit of
keeping people informed about the project. Keeping
the site fresh requires posting timely updates. Meeting
summaries created along the way can be
incorporated into a final report or document.
Tool 8: Briefing sheets
Specific information about traffic flows, housing types,
or native plant communities can be summarized into
short hand-outs. Some concepts may be unfamiliar,
because they run counter to the way developments
have been constructed in recent years. Examples of
these briefing sheets are in the “ingredients” chapter of
this text. Seek brevity, as most people will only have
time to skim either prior to or during a meeting.
including members of advocacy groups, regionalorganizations, and service groups. Diagrammingthe process in an illustrated flow chart is a helpfulbrainstorming and communications tool (tool 4).
Task: Encourage productive discussion andinformation gathering from a diverse group ofpeople affected by the project.Being clear about the desired outcome how“input” will be used will create a betterexperience for everyone. Having the group agreeon their own set of ground rules is an effectivestrategy (tool 5). There are many formats forconducting sessions. For example:• Informational meetings serve to get the facts
out.• Workshops imply more engagement with
concepts or design scenarios.• Roundtables bring together experts or
interested parties to share information anddiscuss specific topics.
Task: Create a communications plan.The goal is to keep people informed, includingthose less directly engaged in the process (tools6,7,8). For instance:• Record all public meeting comments verbalized
on a flip chart.• Summarize the meeting, and also transcribe the
flip charts verbatim, and send periodic briefs ornewsletters.
• Post short summaries and procedings on aproject website.
• Make short presentations to recognizedcommunity groups
• Videotape meetings for community cable.

12 Community Redesign
Taking inventory of the landscapeWhat natural and physical resources do we have andwhere are they located?How can the information be visualized?
In this information age, availability of data is lessa concern that finding it, sifting through it, andpresenting it in ways that make sense to people.Information gatherers will vary by project. It maybe consultants, a city staffer assigned to a taskforce, or a citizen activist. Not every piece ofinformation is relevant, but taking inventory of aplace should include information that can informthe achievement of all five community designgoals. That means collecting and mappinginformation on natural resources, transportationsystems, land use and local economy,neighborhood features, and social issues. A menuof inventory options goes into more depth onsuggestions for how and what to collect on eachof these topic areas (tool 15). Inventoryinghappens throughout the process, as newinformation becomes needed or available. Often,design scenarios created through the process willgenerate questions that require more research.
Desired outcome:This step should result in a shared understandingof the change area as well as surrounding areas ofpotential impact. Information gaps can also beidentified and filling them prioritized.
Tool 9: Aerial bird’s-eyed view photos
The view from lowlevel (500 feet+) captures the
patterns and spaces of urban and rural spaces
particularly effectively. A different view of a
neighborhood or familiar place can often reveal
insights that the eye-level photo cannot duplicate.
While it requires only one hour of flight time, many
images can result that are useful for communications
pieces, inventorying physical developments and before
and after image sketches.
Tool 10: Windshield survey
This data gathering technique simply involves driving
through the site, map in hand, with a checklist of
characteristics and qualities to note. Results can be
tabulated in a variety of ways, and can yield
information such as the numbers of a particular type of
businesses in the area, the amount of vegetation, or
the presence/absence of people using a space during
different times of the day.
Task: Get out into the landscape.To best get a sense of how the study areafunctions, there is no substitute for being there. Agroup site visit is an effective tool for kicking offtask force or committee work. Other techniquesinclude photography assignments andwindshield surveys. If a site visit is not possible, apicture, or birds-eye aerial photography tour ishelpful (tools 3,9,10,11).
Task: Collect relevant studies and reports andmake data available to participants.Information such as geotechnical surveys, socialservice assessments and transportation reportscan be digested into briefing sheets (tool 8). Somereports may be so relevant they should beexcerpted or duplicated in their entirety, for themore detail-minded. Precedents of similarprojects are another form of useful research earlyon and throughout the process (tool 12).
Task: Take advantage of available mapped data.Many cities, counties, and agencies havegeographic information systems (GIS) thatcontain data layers useful to a projects, as well astraditional maps (tools 13, 14).

Chapter Two: Planning and Design Process 13
Tool 11: Photography assignment
To get a better sense of important local place, values,
or concerns, send people out with a camera and set of
instructions. People can be asked to take pictures of
places they treasure, or places that need
improvement. They can be asked to stay within the
study area, or be encouraged to document places
elsewhere that have qualities they enjoy. People can
be asked to talk about their images with the group, or
a more formal analysis can look at the content of the
images to draw conclusions.
Tool 12: Precedent research
Learning about projects that display similar
characteristics to the scale of the project can add
insight and expand the palette of possible solutions. This
should be assigned to consultants, if available,
otherwise committee members recruited for their
expertise can be tapped. Other precedents might
relate to the project “type” or “situation,” such as
corridor plans and projects that encouraged mixed use
redevelopment or places that were successful in
turning around a big demographic imbalance.
Organizations such as the Urban Land Institute (ULI)
frequently publish profiles of projects, as do publications
on landscape architecture, architecture, and real
estate development.
Tool 13: Overlay maps
Overlay maps show information themes on separate
layers, but at the same scale. Displayed on
tranparencies together, relationships between different
land uses become easier to detect than if viewed on
separate maps that are at different scales. In the
example above, the two layers could identify where
park land acquisition might be focused or where future
development could be clustered. Overlays can be
hand drawn, as shown to the left, or digital, as part of a
Geographic Information System (GIS, tool 14). Hand
drawn layers are the appropriate tool when
understanding the big picture is important and pinpoint
accuracy is not required.
Tool 14: Geographic information systems (GIS)
GIS is a tool for electronically storing spatial data.
Information is coded, or digitized, into a standard
coordinate system that relates a shape or point to a
location. Information is stored in different layers that
can be combined in a variety of ways. Not only a storer
of information, such as property boundaries or soils, GIS
can also be used as an analysis tool, by asking for
intersections or unions from different layers, similar to
other database queries, but with a map resulting. For
instance, GIS could be queried to find all the properties
that are over 5 acres or have valuation above a
certain threshold. Because it is stored in a database
format, this query could also yield the number of acres
as well. While much of this could be done by hand, GIS
allows the generation of these hybrid maps at a
common scale, with less additional effort once the
data has been digitized.
Overlay map: general pattern of road, tree
cover, and farm fields, hand-drawn from
USGS quadrangles and aerial orthoquad
photographs.
Overlay map: wetland complexes and drainage ditch
systems, hand-drawn from the USGS quadrangle and National
Wetlands Inventory.
Graphic from a digital natural resource inventory showing
different patches of wetland, woodlands and location
points where rare and endangered species have been
identified. Different combinations of information can be
generated, such as only the highest quality woodlands, or
all patches over a certain acreage.
N1 mile
N1 mile
N1 mile

14 Community Redesign
Tool 15: Menu of inventory options
the following notes summarize specific inventory and
data gathering activities, organized topically under the
five goals described in the introduction.
Presentation recommendations:
• Use a base map that is scaled for the task at hand,
for instance: 1 inch = 200 feet for a neighborhood
project, 1 inch = 1000 feet for a town scale
investigation, and 1 inch = a mile for a subregional
overview.
• Three-hole punch the information and provide a
notebook for committee members, particularly for a
process that involves a community or task force that
continues to meet over a period of time.
Natural resources
• Often, a lack of knowledge or awareness is the
biggest threat to natural resources at the
neighborhood scale. Here are some ways to
overcome this problem:
Walking tours.
Hands-on habitat restoration demonstration
project.
Telling the story of what the land used to be like in
earlier days—historical maps and descriptions
are particularly compelling.
On maps and plans, depict the site within the big
picture—as a stepping stone or small link to a
larger network of natural areas.
• Gather or collect data on neighborhood
stormwater, plants, and animals. If there is little
natural habitat remaining, examine soil and water
patterns for good locations to recontour, replant
and restore.
• Survey neighborhood residents to get a sense of
what they know about their local natural resources
and what they value.
• Identify open space sites that are both valued by
residents or have local natural resource significance
by adding biodiversity, unique or scenic views or
water quality benefits.
• Determine the threats and opportunities to priority
sites or systems, such as stormwater overloads or
restoration potential through stormwater
management practices.
• Identify design and funding strategies—short and
long term—to address threats and capitalize on
priority locations. Include neighbors as much as
possible in the information gathering, prioritization
and implementation planning.
• Include this information in Request for Proposals for
development sites and public works projects that
intersect with priority sites.
• Evaluate developments as to whether they add
threats or capitalize on opportunities to preserve or
restore natural systems and site.
Social dimensions
• Inventory existing assets—where people gather, and
what programmatic or physical aspects of the
place brings them together.
• Conduct a demographic analysis to determine who
is missing from the picture—elderly or maybe young
families.
• Evaluate underutilized public rights-of-way, areas,
and gathering spaces. They may not be
comfortable, easily accessible or offer an
attraction—something as simple as a bench under a
tree.
• Involve citizenry in the inventorying of public spaces.
For instance, involve the block club network to
collect information.
• “Homework assignments” can be given to people
on the task force or citizens committee—ask them to
photograph or map their favorite neighborhood
places, where they would expect to run into
neighbors or meet a friend.
Natural resource corridors
and patches are dotted;
public or semi-public open
space is hatched.
An inventory of
undeveloped land
adjacent to the urban
service area.

Chapter Two: Planning and Design Process 15
Transportation
• Find out whom has jurisdiction over the streets in the
planning area, the classification and design
parameters for that type of street. For instance, it
may be a county road, or a city street that receives
state aid. Each of these facts makes a difference as
to minimum widths, number, and location of
driveways. Also find out if these jurisdictions have
any immediate or long-term projects regarding the
street.
• Gather Average Daily Traffic (ADTs) counts from the
city public works department, if they exist. Many
local streets do not have these.
• Map out all sidewalks, off-street paths and bike
locations. Often these are not included in standard
city maps.
• On a map, notate all destinations that may attract
numbers of people, such as stores, restaurants,
coffee shops, churches, schools, bus stops, trails,
places of employment, and parks.
• Map out existing vegetation patterns along
movement corridors. This can be begun with an
aerial orthophoto, then field check in particularly
critical areas, such as along sidewalks, parking lots,
and parks.
• Review typical sections of streets to observe widths
and locations of roads, medians, sidewalks, distance
to the nearest building vegetation edge, and on-
street parking areas as well.
• Research the existing bus routes through the area,
their frequency of service and destinations. Also
research the level of car ownership in the area, from
census tract information.
• Calculate the intensity of development around
existing or potential walkable areas.
• Commission an analysis of traffic speeds and
movements at several critical locations, during the
week and weekends.
• Determine where critical pedestrian crossings are
located, based upon an analysis of informal
pathways through spaces, desire paths, between
work or home and destinations. Identify gaps in the
pedestrian network, overlaying desire paths with the
existing pedestrian network map.
• Determine what factors are detracting or
contributing to neighborhood quality of life—traffic
speeds, volumes, or driver inattention to pedestrians.
• Test different strategies to address problems, such as
traffic calming techniques or driver awareness tools.
Land use mix
• Supplement existing land use maps with a richer
array of distinctions between types of uses. Indicate
multistory vs. single story buildings. At the
neighborhood scale, it is possible to drive the blocks
or use the yellow pages and identify the name and
type of business. This information can be used to
better understand numbers of employees and
customers that are part-time residents of the
neighborhood.
• Draw a “figure ground” of buildings. Either use
existing GIS data layers or hand-trace the footprints
of buildings off of 1”=100’ aerial maps, called “half-
sections” and color in the buildings. This drawing will
give a sense of the scale of buildings and how
pedestrians would feel in the environment around
the buildings. Including stands of vegetation gives
the compete picture of how open or closed the
buildings are.
• Have people take photographs of environments
they enjoy being in and feel safe in, and also less
favorite places in the neighborhood. The
photographs can be discussed or analyzed to
better understand local preferences and valued
places as well as areas in need of attention. These
places can then be mapped.
Homes and neighborhoods
• Through local government tax records, inventory the
age of houses and determine the predominant
ages and housing types.
• Map different demographic profiles to show
distributions of ages and household types. Cross
reference this information with the land use mix map
to show where new housing types might be needed
to address unmet housing needs.
• Select and analyze a prototypical house, multifamily
complex, or business and show how alternative
enhancements to these structures and site could
work within the neighborhood, by adding more
green, improving the exteriors, or adding more
space without negatively impacting the area.
Successful alternatives can be the basis for design
guidelines or criteria for a targeted neighborhood
fix-it loan program.

16 Community Redesign
Analyzing and interpreting the placeWhere is there room for improvement?
What kind of change is possible or desirable?
You’ve gathered or reviewed piles of informationabout the physical, social, and economicdimensions of the place, as well as informationabout how other areas facing similar situationshave addressed the issues at hand. This inventoryis, in itself, an act of analysis, because decisionshave been made about what information tocollect. Taking this process a step further intoanalysis means putting together several differentlayers or pieces of information together to answerquestions. It is important to distill the analysisinto a brief set of conclusions that can be usedeffectively through the remaining steps.
Desired outcome:The analysis should result in clearly reasoned andillustrated conclusions about the feasibility ofdifferent natural resource, land use mix, andtransportation options.
Task: Formulate questions for analysis.The analysis needed is directly related to thegoals articulated for the project or study area (seeExample Box). Include qualitative aspects of thearea, such as valued views to preserve (tool 16).Analyze quantitative aspects of the area, such asdemographic information, with physical data, suchas existing transit service to understand where thegreatest gaps exist between need and service.
Task: Create maps that locate where desiredimprovements could be sited.Using the GIS layers or hand-drawn mapscollected or created for the inventory, combinedifferent layers to highlight spatial relationshipsbetween important components needed toachieve project goals. A physical design analysisshould graphically or verbally highlight, compareor contrast important dimensions of inventoryinformation or design concepts (tool 14).
Example: Using goals to frame questions
Protect and restore natural systems
Where are local water quality problems occurring
and what alternatives exist for correcting them as
part of proposed improvements?
What are the threats to existing natural areas and
how can they be addressed in the context of the
study area?
Strengthen social connections
Are there existing gathering places that could
better accommodate people?
What attractions can be accommodated locally
that current residents or employees seek in other
places?
What places do people avoid?
Provide transportation options
What is the best location to add the development
intensity needed to attract transit service?
Where are prime walking or bicycling destinations
located and what is the quality of pathways
between them?
Enhance homes and neighborhoods
What are the maintenance needs of the most
common house type and where are they
concentrated?
Is reinvestment occurring in older neighborhoods,
as shown by building permits?
Integrate land uses and economic activity
What kind of demographics are needed to attract
commercial services that are lacking?
Where are opportunity sites available to add new
uses that complement existing development?
Task: Evaluate existing conditions with respect todifferent physical, social, and economic criteria.Before jumping to conclusions about thecauses and solutions to perceived problems, amore systematic review of the area will result in amore complete array of the potential limits andopportunities of an area. A basic checklist can beused for projects with a narrow focus. A tool suchas a matrix is more suited to a project withmultiple goals (tool 17).

Chapter Two: Planning and Design Process 17
Tool 16: Perspective drawings and diagramatic maps
Drawings that accentuate three-dimensional qualities
can be effective at recording and communicating
prominant features and views.
Tool 17: Matrix
A matrix is a tool to be more systematic about
analyzing the dimensions and qualities of a place.
Goals could be the columns of a spread sheet, while
physical or social dimensions could be the rows. The
existing conditions of a site or area can be recorded in
each cell of the matris. This analysis can be
accomplished with words, diagrams, photographs or a
combination. Further into the process the matrix can
then be used to evaluate alternatives, using the same
criteria. Criteria can be quantitative, such as frequency
of transit service, or more qualitative, such as perceived
safety of bus stop areas.Matrix: Transit-Oriented Design Alternatives Analysis
Walkable RoutesWhich streets enablewalking access to thetransit station area?
Walkable areas
Which areas arewithin convenientwalking distance ofthe transit station?
Mix of Land Uses
What is the mix of landuses in this district?
Railroad Right-of-Way Transit Station Alternative Transit Station LocationCo Rd 81 Busway Transit Station
52% walkable
51% walkable
inner circle: 1/4 mile radius
outer circle: 1/2 mile radius
parcels within1/4 mile or 5minute walk-ing distance
53% walkable
43% walkable
36% walkable
32% walkable
parcels within1/2 mile or 10minute walk-ing distance
0’ 500’ 1000’ 2000’ 3000’
Multi-Family Residential
Single Family Residential
Commercial
Institutions
Parks
Industrial
T Transit Station
0’ 500’ 1000’ 2000’ 3000’
0 1/2 mile 1 mile 2 miles 3 miles
11111 22222 33333

18 Community Redesign
Exploring design scenariosWhat kind of place can we make?What are the different ways we can connect andintegrate community systems to make places?
There is a good chance that whoever initiated theproject or study has some design scenario oroption in mind. It is always a good idea to look atmore than one scenario, even if only to confirmthe original idea. Each design scenario is a visualrepresentation of how the same general designprinciples can be applied to the site in differentways. Whenever used, design scenarios are notintended as the final plan, but rather a catalyst todiscussion and a means to test the implications ofdifferent directions or emphases that the projectcould take. Proposing scenarios is helpfulthroughout the process of designing acommunity.
Desired outcome:Exploration of design scenarios should yield aricher array of possibilities than moving aheadwith a single idea. Typically a hybrid scenariowill result, bringing into the project a more multi-
faceted project that meets more needs thanoriginally conceived. Taking the time to exploreideas on paper is well spent, considering the timeand expense of a capital investment.
Task: Use design scenarios throughout the process.Below is a description of how scenarios mightcome to play at different stages of a planning orimplementation process (tools 18, 19, 20).
Initial stage: Concepts are tested conceptually ata macro scale can better inform the informationneeds for inventory and analysis. Anotherapproach is to select a small focus area for a quicktest of scenarios. In the act of creating these initialscenarios, designers may discover potentialprogram elements or information gaps that needto be filled. These images can also be useful togenerate interest in the project or for grant andfunding proposals.
Tool 18: Initial stage concept diagram
Only the major components are shown, such as roads
and open space, as in the illustration. An even simpler
technique is a bubble diagram, in which shapes are
blocked out in wide markers on an existing map.
Community built around the design principle of
connecting linear open spaces along the water system.
Community built around the design principle of preserving
and buffering large natural areas.

Chapter Two: Planning and Design Process 19
Connecting Neighborhood Scenario
Parkway Loop Scenario
Tool 19: Mid-stage concept scenario diagrams
The top scenario is a big picture concept for organizing
development around an open space system, used at
th initial stage of the study. The lower two scenarios
presented here were produced mid-stage.
Mid stage: At this stage, the scenarios shouldillustrate how different principles, emphasized todifferent degrees, can impact the results or howdifferent interpretations of the same principlescan yield a different mix of activities and landuses. Discussion of the scenarios can yield a morefocused list of desired results and designprinciples to guide evaluation of future designproposals. This process piece is discussed morefully in the next section.
Final stages: More nuanced design explorationscan be tailored to show how the place can be fine-tuned in a variety of ways. Different resultsshould be compared and contrasted with regardto the on-the-ground experience of thoseexperiencing the place, with emphasis on thepedestrian, bicyclist, or disabled person. Morespecific wildlife and water quality impacts canalso be evaluated at this level of detail.
Task: Propose a spectrum of design scenariosthat a design team or workshop group can applyto the site.There are different approaches that can helpshape a set of community design alternatives. Awide spectrum of approaches, in the land use mixor formal arrangement, can help participantsbetter understand, articulate, and developpriorities. It is important to explore truly differentalternatives, not merely minor variations of oneidea. The following list suggests some that haveproven useful in designing neighborhoods,towns, and subregions:
1. Most change to least change. This scenarioframe can test the limits or ambition of agroup or community and helps people thinkoutside their preconceptions.
2. Land use mix. This scenario frame exploreseach potential land use to its maximum limit.This exercise demonstrates the suitability ofthe entire area for one kind of land use oranother.
3. Goals. Create different scenariosemphasizing one goal with other goals beingmore subordinate. This scenario frame ishelpful to understand the priorities of
different constituencies, but also the potentialnegative impact on other goals.
4. Potential funding sources. Realistically,many community redesign projects cannottake place without a combination of financialstrategies. Often grant, loan, or tax-incentiveprograms are an important leverage point forcommunities in getting the kind of projectthey are seeking, in partnership with theprivate sector. Scenarios can be created thatare geared to the priorities of differentfunding programs.

20 Community Redesign
Tool 20: Final-stage interactive models and maps
A “pizza box” model, named for its resemblance to a
delivery box, is appropriate for smaller group meetings.
The example shown was for a the neighborhood
planning effort, the scale at 1 inch equals 200 feet.
Roads are drawn in and buildings, cut out of foam
board in the appropriate land use color, are attached.
Topography can be suggested by building up layers of
foam core. Different areas of change are cut out of the
base, allowing new alternatives to be modeled and
shown in the neighborhood context. The initial model
building is an investment in time, but well worth the
effort because these models give people a more
tactile understanding of where and how different
alternatives play out. It is particularly useful when
multiple stakeholder meetings are anticipated, or a
long planning horizon is involved, because the model
can then be used many times, with new scenarios
easily modeled as the process evolves. If multiple small
groups are meeting simultaneously, the model base
and different alternative pieces can be photocopied. If
this method is used, group members can cut and
reshape the pieces to create their own composite
scenario.
Task: Select a method of presenting scenariosthat is easy to grasp, with enough detail tounderstand implicationsDepending on the scale of work, scenarios can becreated and presented in a variety of formats.Generally, it is difficult for people, especially in alarge room, to distinguish fine differencesbetween scenarios. If the drawings look toosimilar, take a step back and either enlarge thearea of concern, or use a different technique, suchas a model or diagram rather than three differentcolored plans (tools 18, 19, 20).
Existing Conditions (40 mph ‘A’ Minor
Arterial Highway)
West Broadway Avenue Extension (35
mph Town Center Avenue)
Terrace Transit Village (45 mph
Community Boulevard)
Crystal Lake Road and Business
Campus (55 mph Subregional
Expressway)
Composite Scenario: Crystal
Lake Terrace Neighborhood
(35mph Town Center
Avenue)
This pizza box model
shows the final composite
scenario in place, after
groups had discussed
three alternatives, shown
to the right, that explore
least area of change to
most change, as well as
land use mixes and
different designs for the
main roadway running
through the area.

Chapter Two: Planning and Design Process 21
Agreeing on design principlesWhat is our conceptual vision for this place?What design and planning principles will guide future efforts?
Between the planning and implementation stagesof any community redesign, many variables canchange. For example, the site boundaries mayexpand or an expected funding stream may dryup. Because such variables shift, it is important toagree upon a solid base of planning or designprinciples that can be adhered to, but achieved ina variety of ways and hold up over a long period.Design principles typically define preferredrelationships between uses and outcomes that aremore specific than general goals, but less specificthan guidelines addressing the details of site orbuildings. Every design scenario is based uponprinciples of some sort, whether explicit orimplicit. Making the underlying designprinciples explicit is not only needed for creatinga good set of alternatives, but also for coming toagreement on the set of principles that will guidethe selection of developer teams, the review ofplans and the judgment of success orshortcomings of the final results.
Tool 21: Small group discussion
Principles from each scenario are discussed by
category and the small group agrees on a composite
list of principles to bring forward to a larger group. The
larger group can then discuss and agree upon
principles that are common. For areas of less
agreement, these results can be carried forward to the
decision-making body as-is, or a simple straw poll can
be held to demonstrate levels of support for different
principles.
Tool 22: Decision-maker review
Results of design scenario forums or meetings are
summarized, focusing on issues, pros and cons that
surfaced. This report is shared and discussed, with
decision-makers then going through their own selection
process. A simple technique is to go around the room
asking each decision maker to select a preferred
principle from each topical category. The subsequent
speakers add items missing from the developing list, or
propose an alternative selection. A full-group discussion
can then focus on the areas of difference, with a show
of hands determining the final list.
Less specific More specific
Goals
Prin
ciple
s
Guid
elines
Desired outcome:This step will yield a set of principles that will guidethe implementation and evaluation of the project.
Task: Gather and assess feedback on designprinciples.In the earlier stages of a community planningprocess, it is important to encourage people toevaluate the principles rather than the picturesthemselves. The scenario illustrations are usefultools to picture the implications of designprinciples. However, the many variables thatcome between early planning and ultimateproject initiation will make the image rapidlyobsolete as a design concept. The time fordetailed scrutiny of plans is during later stages ofthe project, when the design concept comes in formore formal review in front of planningcommissions and city councils. Tools 21-23 areuseful for focusing feedback on the principlesrather than the plan.
Task: Summarize and illustrate the results.Based upon the results of feedback, a new set ofprinciples can be demonstrated with a newscenario and illustrated with diagrams to helpvisualize words into physical forms (tool 24).

22 Community Redesign
Tool 23: Menu of principles
Principles from the various design scenarios are listed,
and participants then circle or check-off preferred
principles. Typically space is provided to allow re-writes
or edits. These responses are tallied and used as a basis
for discussion or are passed to a decision making group
as further information for their own deliberations.
West Broadway Avenue Extension (35 mph Town Center Avenue)
Terrace Transit Village (45 mph Community Boulevard)
• Higher density housing near neighborhoodcenter
• American Legion & north CSAH 81 sitesredeveloped as retail & office
• Transit center at American Legion site• Terrace Mall/Wards is mix of retail and office• Extend downtown West Broadway, Hubbard
and 35th Avenues through Terrace Mall site• Concentrate retail between CSAH 81 and new
West Broadway Avenue• Frontage roads eliminated• Maximum CSAH 81 access points; every 1/8
mile
• Higher density housing near neighborhoodcenter
• American Legion & north CSAH 81 sitesredeveloped with new housing
• Focus retail along 36th Avenue• Transit center at Terrace Mall site• Terrace Mall converted to a mixed-use
neighborhood transit village• West Broadway Avenue cuts through Terrace
Mall• Frontage roads eliminated• CSAH 81 access every 1/4 mile – one access
between 36th Ave. & Lowry Ave./Oakdale Ave.
• Higher density housing around transit centerand all along 36th Avenue
• Transit center is along railroad• Focus retail and service businesses along 36th
Avenue; now Crystal Lake Road• Convert Terrace Mall & American Legion sites
to Crystal Lake Business Campus• North Memorial Medical Center campus
expansion into adjacent residential area• Keep some frontage roads• CSAH 81 access every 1/2 mile– no access
between 36th Ave. and Lowry Ave./Oakdale Ave.
Crystal Lake Road & Business Campus (55 mph Subregional Expressway)
Menu of Principles
This sheet shows how
scenarios taken from a
model can be used for
comment sheets.
These sheets can be
handed out to
participants. They can
rank the three
alternatives, or put
pluses and minuses
next to each principle
to show agreement or
disagreement.
Tool 24: Illustration of principles
After a discussion or survey of preferred principles, a
composite set of principles can be illustrated. Simple
diagrams that show one principle at a time are
particularly effective. The diagrams are based upon a
new scenario that demonstrates how the principles
could work together on the site.

Chapter Two: Planning and Design Process 23
Redesign the Crystal Lake segment of County
Highway 81 as a Town Center Avenue.
Create a neighborhood retail node at 36th
Avenue & County Highway 81 that is
complementary to nearby retail centers at 36th
Avenue & Highway 100 and downtown
Robbinsdale.
Integrate the Terrace Mall, Wards, and American
Legion sites into the surrounding street network
to improve local connectivity and identity.
Improve connections between Crystal Lake
Terrace neighborhood, Crystal Lake, and
nearby parks and trail systems.
Create a Crystal Lake Terrace Business Campus
between North Memorial Medical Center and the
36th Avenue retail node.
Add new housing options near transit,
neighborhood retail, and Crystal Lake open
space amenities.
Link neighborhood transit access to the planned
Northwest Corridor Busway and Robbinsdale’s
Hubbard Avenue Transit Station.
Illustration of Principles
This drawing shows the composite
set of principles that came out of
round-table discussions with civic
leaders and citizens discussing the
three scenarios shown on the
previous page.
24 Community Redesign
Moving forwardWhat are the critical next steps to move the project toward implementation?What resources might help steer these next steps?
At this point, there is a basis for moving forward.Potential opportunities have been fully explored,and there is some agreement about more specificprinciples regarding land use mix, naturalresources, transportation, social connections, andresidential neighborhood quality. Thisgroundwork prepares a community well fortaking next steps toward implementation, thoughthese steps may vary depending upon the sizeand scope of the program. Community redesignat all scales is typically a multi-year effort thatmight span the terms of different office holders.Typically they are complex, because the numberof affected and interested people is greater than asingle use project on one discrete site. Therefore itis important to not only record what was decidedin terms of design, but also what needs to bedone to make it happen. Specific roles,responsibilities, and timelines should also bedecided and recorded.
Desired outcome:The outcome of this process should be a roadmap that clearly articulates what needs to bedone, by what time, and by whom. This plan maybe modified or changed at the beginning of theimplementation process, but that discussionbenefits from a clear starting point or game plan.
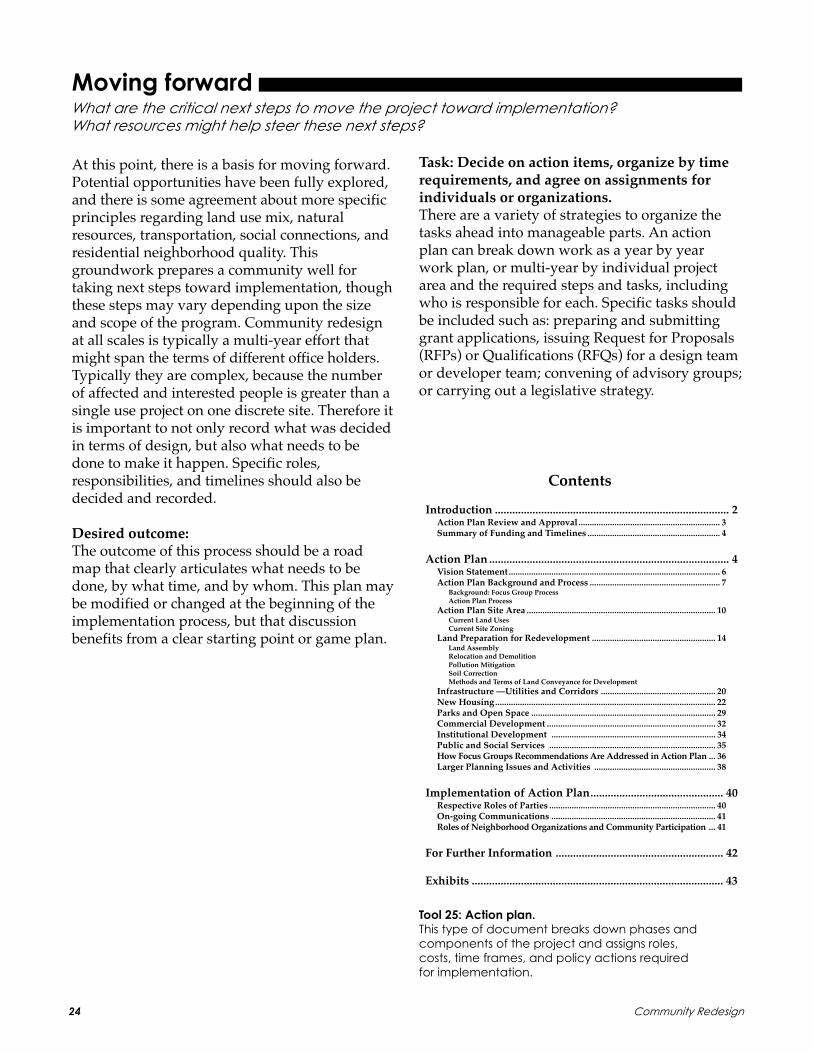
Tool 25: Action plan.
This type of document breaks down phases and
components of the project and assigns roles,
costs, time frames, and policy actions required
for implementation.
Contents
Introduction ................................................................................. 2Action Plan Review and Approval............................................................... 3Summary of Funding and Timelines ........................................................... 4
Action Plan ................................................................................... 4Vision Statement.............................................................................................. 6Action Plan Background and Process .......................................................... 7
Background: Focus Group ProcessAction Plan Process
Action Plan Site Area .................................................................................... 10Current Land UsesCurrent Site Zoning
Land Preparation for Redevelopment ....................................................... 14Land AssemblyRelocation and DemolitionPollution MitigationSoil CorrectionMethods and Terms of Land Conveyance for Development
Infrastructure —Utilities and Corridors ................................................... 20New Housing.................................................................................................. 22Parks and Open Space .................................................................................. 29Commercial Development ........................................................................... 32Institutional Development ......................................................................... 34Public and Social Services .......................................................................... 35How Focus Groups Recommendations Are Addressed in Action Plan ... 36Larger Planning Issues and Activities ...................................................... 38
Implementation of Action Plan.............................................. 40Respective Roles of Parties .......................................................................... 40On-going Communications ......................................................................... 41Roles of Neighborhood Organizations and Community Participation ... 41
For Further Information .......................................................... 42
Exhibits ....................................................................................... 43
Task: Decide on action items, organize by timerequirements, and agree on assignments forindividuals or organizations.There are a variety of strategies to organize thetasks ahead into manageable parts. An actionplan can break down work as a year by yearwork plan, or multi-year by individual projectarea and the required steps and tasks, includingwho is responsible for each. Specific tasks shouldbe included such as: preparing and submittinggrant applications, issuing Request for Proposals(RFPs) or Qualifications (RFQs) for a design teamor developer team; convening of advisory groups;or carrying out a legislative strategy.

Chapter Two: Planning and Design Process 25
Task: Propose an implementation governancestructure.Typically a two or three tier approach is used tocarry out projects that integrate land use,transportation, and natural resource components.For example an Implementation Committeemight be composed of decision-makers such asboard members, elected officials, or departmentheads. Supplying this committee withinformation are Technical Advisory Committees,composed of staff from different departments andagencies, or non-profit volunteers with relevantexpertise. A Citizen or At-Large AdvisoryCommittee could be made up of self-selectedvolunteers or appointed representatives fromdifferent neighborhood organizations or thegeneral membership of an advocacy group. It isuseful to outline or propose a communicationstrategy for keeping these various committeesinformed and aligned with each others work, aswell as the larger community of less involvedcitizens and advocates.
Task: Create a document summarizing theprocess, its results, and next steps.A brief report, summarizing major conclusions,can be supplemented by more detailedappendices of different process steps and results.Include graphics that can be easily reproducedand re-used for grant applications, RFPs, orlegislative briefings. Sometimes a morestreamlined, newsletter format report is mosteffective at communicating with a broad array ofaudiences, with the more detailed report reservedfor those more involved in the nuts and bolts ofthe project (tool 26).
Tool 26: Organization illustration.
Whether a fairly simple structure, (top illustration) or
more complex organization (bottom illustration), a
visual depiction helps sort out who is involved and how
they connect. These examples take the idea of a flow
chart one step further, as an memory aid and to help
distinguish roles and functions of various committees,
task forces, departments, or agencies.
Community Focus
Groups
Corridor
Technical
Studies
Northwest Corridor
Partnership
Technical Advisory
GroupDevelopers
Advisory Panel
Professional
Administration
Team

26 Community Redesign
Assessing the placeTask: Agree on general goals, work scope and
parameters of study or project (tool 1).Task: Discuss issues and review existing plans
and projects in the area of concern andsurroundings (tools 2, 3).
Engaging communitiesTask: Decide who should be involved and how
(tool 4).Task: Encourage productive discussion and
information gathering from a diversegroup of people affected by the project(tool 5).
Task: Create a communications plan (tool 6, 7, 8).
Taking inventory of the landscapeTask: Get out into the landscape (tools 3, 9, 10, 11).Task: Collect relevant studies and reports and
make data available to participants (tools12, 15).
Task: Take advantage of available mapped data(tools 13, 14).
Analyzing and interpreting the placeTask: Formulate questions for analysis (tool 16).Task: Create maps that locate where desired
improvements could be sited (tool 14).Task: Evaluate existing conditions with respect to
different physical, social, and economiccriteria (tool 17).
Exploring design scenariosTask: Use design scenarios throughout the
process (tools 18, 19, 20).Task: Propose a spectrum of design scenarios
that a design team or workshop groupcan apply to the site.
Agreeing on design principlesTask: Gather and assess feedback on design
principles. principles (tools 21, 22, 23).Task: Summarize and illustrate the results
(tool 24).
Moving forwardTask: Decide on action items, organize by time
requirements, and agree on assignmentsfor individuals or organizations (tool 25).
Task: Propose an implementation governancestructure (tool 26).
Task: Create a document summarizing theprocess, its results, and next steps.
Tool 1: A USGS quadrangle map
Tool 2: Annotated map
Tool 3: A walk-through or drive-through of the area
Tool 4: Process diagram
Tool 5: Interactive models or maps
Tool 6: Feedback or comment sheets
Tool 7: Project website
Tool 8: Briefing sheets
Tool 9: Aerial bird’s-eyed view photos
Tool 10: Windshield survey
Tool 11: Photography assignment
Tool 12: Precedent research
Tool 13: Overlay maps
Tool 14: Geographic information systems (GIS)
Tool 15: Menu of inventory options
Tool 16: Perspective drawings and diagramatic maps
Tool 17: Matrix
Tool 18: Initial stage concept diagram
Tool 19: Mid-stage concept scenario diagrams
Tool 20: Final-stage interactive models and mapsTool 21: Small group discussion
Tool 22: Decision-maker review
Tool 23: Menu of principles
Tool 24: Illustration of principles
Tool 25: Action plan
Tool 26: Organization illustration
Checklist of Tasks and ToolsThis list is a compilation of all the tasks and toolsdescribed in the process steps. While the tasksinclude suggestions for helpful tools, some of thetools are more universally useful in all stages.

Chapter Three: Neighborhood Scale 27
Chapter Three:
The Neighborhood Scale
Protect and Restore Natural Systems
Identify, preserve, or restore locally significant remnant natu-
ral resources, such as small woodlots and tributary
water features.
Strengthen Social Connections
Enhance the quality of everyday destinations, so they are
people attractors and make it easy to walk or bike be-
tween them, so people may meet and greet their neighbors.
Provide Transportation Choices
Identify and fill sites that can receive additional commercial
intensity without jeopardizing the quality of existing busi-
nesses or residences.
Enhance Homes and Neighborhoods
Intensify development along potential transit corridors and
make easy walking connections to surrounding land uses.
Integrate Land Uses and Economic Activity
Create programs to renovate and add to existing housing
types and, in newly developing areas, encourage a develop-
ment pattern with homes that are oriented toward a con-
nected network of streets and strategically located parks or
open spaces.
City boundaries
Small
commer-
cial
Garden
apart-
ments
Small
commercial
Primarily post-
war, smaller,
single family
homes,
Single
family
homes,
circa 1960
Office/
hotel
redevel-
opment
Neighborhoods can be defined in many ways: by natural or builtedges and boundaries; areas of similar building and developmentpatterns; or a central institution such as school or parish church. Inthis text, neighborhoods are focus areas that address issues block-by-block within a limited geographic area, typically less than amile square. Making desirable and vital communities at the neigh-borhood scale typically focuses on enhancing or maintaining localquality of life, community character, transportation connections,and convenient access to amenities. Although each neighborhood isunique based upon its location, local culture, and landscape, a vitaland sustainable neighborhood should integrate the various activi-ties and destinations of daily life, including a range of housingoptions, stores, services, recreation and natural areas, publicspaces, and transportation connections. If coordinated, local im-provement activities can create memorable places, while ensuringeconomic prosperity and efficient use of land resources. The fol-lowing principles, synthesized from the case studies that areprofiled in this chapter, are examples of how to make general goalsmore specific to neighborhood-level activities.
County road
slated for
improvements
County park
and beach
City
park
Truck
transport,
brown-
field sites
City park
This map shows a typical place settled
primarily in the post-war era. The area
will be used to illustrate the text that
describes principles for guiding
neighborhood development or
reinvestment. You will see this same
neighborhood shown within a larger
area in subsequent chapters that
address the town and subregional scale.
N1/4 mile

Community Redesign28
Identify, preserve, or restore locally signifi-
cant remnant natural resources, such as
small woodlots and tributary water features.
At the neighborhood scale, restoring and protect-ing natural resources means identifying, expand-ing, and connecting the local system of naturalresources, as well as protecting remnant featuresthat may remain. Natural areas are usuallytreasured by local residents, regardless of their“ecological significance” on a regional scale.Water quality issues tend to be an organizingforce and of intense interest, because residentscan see the negative effects that can be caused byurban runoff. Walking to and around lakes,wetlands, and streams is also an importantquality-of-life dimension, though often controver-sial if expanded public access is perceived to be atthe expense of privacy.
Enhance the quality of everyday destina-
tions, so they are people attractors and
make it easy to walk or bike between
them, so people may meet and greet
their neighbors.
Fostering social connections may be a matter ofpreserving the viability of local institutions orencouraging new relationships among neighborsaround local parks, roads, or other neighborhoodimprovements. For people to become familiarand feel connected to one another, neighborhoodscale design focuses on places that allow every-day, casual encounters, including face-to-faceconversations, a quick greeting, or simply eye-contact. Having citizen participation in the courseof planning neighborhood improvements cancreate a sense of identity and belonging, espe-cially in an area undergoing a shift in residents oremployees.
Intensify development along potential
transit corridors and make easy walking
connections to surrounding land uses.
Because major transit systems are decided at aregional level, providing travel options at theneighborhood scale is typically an access issue.Access to existing bus lines or regional trails maymean strategically locating new pathway links,calming traffic, and providing commuter parkingif transit service is located too far for a comfort-able walk.
Neighborhood Scale PrinciplesThe following text briefly describes the issues that frame the principles. Different neighborhood-scaleissues would likely result in modifications of the statements, better tailored to the project at hand.
The hatched areas
show more habitat-
friendly locations in the
neighborhood, where
tree canopy is
complemented by
understory vegetation
where migrant or
resident wildlife can
take refuge.
Many amenities
exist in the
neighborhood, but
not all are easily
accessed on foot
or by bicycle,
important for
children, but also
the employees,
seniors, and
exercise seekers in
the area.
Exis
ting s
idew
alk
or trail
Park
StoreCoffee
shop
Picnic
area and
beach
Park
Office/
hotel
Neighborhood
Commercial
Senior
Home
Twin Lakes
Over time this
neighborhood has
seen an intensification
of uses, as the hatched
areas show new
developments that
bring more people to
the area on a daily
basis. This intensification
increases opportunities
for transportation
alternatives, such as
buses, shuttles, and
foot travel between
locations, cutting down
the number of daily
auto trips.
Senior
home
Lake
Johanna
1/4 mile N
1/4 mile N
1/4 mile N

Chapter Three: Neighborhood Scale 29
Identify and fill sites that can receive additional
commercial intensity without jeopardizing the
quality of existing businesses or residences.
At the neighborhood scale, diversifying andincreasing the local economy can be a modestendeavor, aimed at retaining or attracting abusiness that can serve people within walkingdistance. Some neighborhood businesses have thepotential of a wider draw. Carefully designingand managing the traffic and parking generatedby an attractive local restaurant or store can beimportant when these businesses expand or locatein a predominantly residential neighborhood. Inneighborhoods that are primarily commercial innature, the goal may be to add housing that bringspeople to the area beyond the work day hours.From a transit perspective, this mix can be benefi-cial in generating transit riders going in twodirections that can attract more frequent servicethroughout the day.
Create programs to renovate and add to
existing housing types and, in newly develop-
ing areas, encourage a development pattern
with homes that are oriented toward a con-
nected network of streets and strategically
located parks or open spaces.
The goal of enhancing homes and creating neigh-borhoods is achieved at this scale with a carefulinventory of existing assets and gaps in the typeof homes available. Existing homes may benefitfrom fix-up grants or flexible zoning standards orbuilding code enforcement. Filling gaps in hous-ing types, or the addition of a local service busi-nesses such as video stores and coffee shops mayrequire more extensive site analysis and sitedesign guidelines to develop properties that havethe location to attract clientele while not nega-tively affecting neighboring homes. Looking up atthe town scale can place the neighborhood in acity-wide context that suggests creation of a largerscale program applicable to multiple neighbor-hoods facing similar issues.
County road
The intersections of
county roads were first
developed as service
stations. Now that new
senior housing and
offices are in the area,
these businesses have
additional local
clientele. Small
changes to the zoning
codes can help these
commercial areas
adapt.
The residential area of
this neighborhood has
a diverse mix of
housing types that can
be added to over time.
Larger home sites
along the collector
streets and locations in
the redevelopment
area are examples of
where these additions
can occur.
Brownfield and
greyfield
redevelopment
area
Co
lle
cto
r
Bik
ers
Ch
ild
ren
Re
sid
en
ts
Transit
RidersSe
nio
rs
Students
Clie
nts
Wo
rke
rs
Cty. Rd
.D
Fa
irv
iew
1/4 mile N
1/4 mile N

Community Redesign30
Near Northside
Repositioning and reconnecting a deteriorating
neighborhood to its surroundings
Brooklyn Blvd. &
Hwy. 81
Humboldt AvenueNear Northside
Humboldt Avenue, Minneapolis
Revitalizing a neighborhood with social and
environmental amenities
Brooklyn Boulevard & Highway 81
Creating a transit-supportive walkable center with
neighborhood amenities
Three local case studies of recent neighborhoodredesign projects in the Twin Cities help illustratelocal communities’ approaches to improving andredefining their neighborhoods:• Humboldt Avenue in Minneapolis• Brooklyn Boulevard & Highway 81 in Brooklyn Park• Near Northside in Minneapolis
This chapter begins with an overview of the casestudies and scale specific principles guiding theseholistic and integrated projects that also benefit theirlarger surroundings.
Humboldt Avenue neighborhood is a modest post-war suburban style development of small singlefamily homes typical of that era when housing needsoutweighed other considerations. This case studylooks at the strategic redevelopment of new housingalong a mundane roadway—redesigned to become agracious parkway-style boulevard that parallels apublic green complete with a creek, parks, andschools. This multi-phased, seven year initiative issubstantially complete, resulting in a significantdiversification in the types of housing availablewithin the neighborhood and a much stronger visualand physical connection to Shingle Creek—a previ-ously hidden asset.
Located further north and west of Humboldt Avenue,the case of Brooklyn Boulevard and Highway 81shows at how a transit investment—a bus corridor inthis case—can be the impetus for change. An intersec-tion is envisioned as the center of neighborhoodactivity rather than four corners of isolated, discon-nected land uses. At the beginnings of the process,this write-up summarizes the very early planningand discussions required for implementing this scaleof transformation.
Finally, the Near Northside case study looks at aneighty acre area near downtown Minneapolis thatrequired a substantial reworking of the terrain. Thisisolated neighborhood not only needed better homes,but also reconnection to its neighbors, and creativesolutions to significant soil and water issues that haveplagued homes and businesses since developmentfirst occurred hear one hundred years ago. In con-struction today, the case study also highlights theseries of steps required for successful implementation.
Neighborhood-Scale Case Studies

Chapter Three: Neighborhood Scale 31
Case Study
Creating a community parkway:New greenway and housing amenities for Humboldt
Avenue neighborhoods in Minneapolis, Minnesota
Assessing the PlaceHumboldt Avenue North lies within two northMinneapolis neighborhoods, Lind-Bohanon andShingle Creek, and has been experiencing dete-riorating housing, declining property values, andincreasing resident turnover. These neighbor-hoods are dominated by small Cape Cod andRambler style homes, mostly built in the 1950s,with many homes deteriorating due to poorquality design and inadequate maintenance.Hennepin County and the City of Minneapolisidentified this project as a partnership opportu-nity to link housing redevelopment with majorpublic reinvestments in infrastructure, includingroadways and open spaces. Consisting of eightblocks along Humboldt Avenue, from VictoryMemorial Parkway north to 53rd Avenue.
Engaging CommunitiesThis project sought to engage residents of theLind-Bohanon and Shingle Creek neighborhoodsin an effort to redesign and resituate their neigh-borhoods. Following large public discussionsheld by design consultants at several communitymeetings, many residents felt frustrated andsomewhat uninformed about the project. Inresponse to those sentiments, the project teamretooled the participation strategy. Instead of abroad-brush informational meeting format,residents had the opportunity to sign-up for oneof 40 workshops, using interactive models toexplore different configurations of blocks, homes,yards, and open spaces. A maximum of 12participants per workshop allowed each attendeeto have his or her voice heard. These communitydiscussions resulted in an expanded inventory ofideas, issues and opportunities, as well as greaterfeedback on three possible neighborhood designscenarios for the city and the county. In addition,phone interviews and comment cards providedalternate forums for residents to communicatetheir input.
Hu
mb
old
t A
ve
nu
e
Mississip
pi R
ive
r
52nd Avenue
46th Avenue
Victory Memorial Parkway
Looking north, Humboldt Avenue bisects a neighborhood of
single family homes that are close to parks and parkways, yet
feel disconnected from these amenities. The post-war building
boom left a pattern of smaller single family homes and little
diversity in the housing stock.
1920s era parkway
neighborhood
Industrial Area
Study Area
Lind-Bohanon Neighborhood
Shingle CreekNeighborhood
Sh
ing
le C
ree
k
Industrial Area
1/2 mile N

Community Redesign32
Commercial retail,restaraunt and lightindustrial area
Enhance image
Dicks DairyTransmis-sions
Engineering andPharmacy
Country Boy
CornerStore
Commercialspace
Total Gas Auto Repair
Flooring
Metal-matic
FormerWallboard
Ceramics
Stucco
BuildingContractor
Supermarket
AutoRepair
42nd andFremont Niche
Taking Inventory of the LandscapeA neighborhood inventory identified existingconditions, assets, and challenges:
HomesHousing types were generally limited to small,two-bedroom homes that were less able to com-pete within the metropolitan real estate market.Housing age, design, and construction methodsindicated a need for targeted renovation orreplacement with new housing.
BusinessesThe limited commercial areas were small, strug-gling, and often incompatible with adjacent uses.The industrial area was full, but presented anunattractive image toward the street and gener-ated unmanaged truck traffic.
1-story Rambler Home
1-story Cape Cod Home
1-story Bungalow Home
Shingle Creek
Movement networkA rail line that intersected Humboldt Avenuecreated a sense of disconnection between neigh-borhoods north and south of the tracks. Trucktraffic used arterial streets to access the industrialarea. Safety of pedestrian crossings was an issue,particularly for neighborhood children.
ParksExisting development patterns hid ShingleCreek’s natural corridor. Parks were isolated bydevelopment, poorly connected to the roadnetwork, and did not link to other natural openspaces, including the nearby Mississippi River.
Park Mis
siss
ippi
Riv
er
ElementarySchool
MiddleSchool
Shingle Creek
Free
way
Hu
mb
old
t Ave
nu
e
Parkway
IndustrialArea
Difficult crossing toschool and park
High speed truck traffic
Housing impacted byhigh volume andspeed of traffic
High traffic/speed street
High traffic/speed street
1/4 mile N

Chapter Three: Neighborhood Scale 33
Relate to BrooklynCenter project
Connect parkway to river
Connect schools Connect school to park
Connect parks Connect park to river Future desti-nation play-ground
New park building
Build housing onexisting park land
Connect parkto river
PotentialAquisitionAreas
PotentialAquisitionAreas
Street trees asopen space system
New NorthMississippiRegional Park
St. AnthonyParkway
Webber Park
Victory Memorial Drive
via
Bro
okda
le
Future Master Plan forShingle Creek Corridor
RestoreShingleCreek
CreekviewPark
ParkwayExtensionArea
New NorthMississippiRegional Park
Future Master Plan forUpper Mississippi
Urban design analysis uncovered importantorganizing features for revitalizing these neigh-borhoods. These features included: key connec-tion streets, the natural landscapes of ShingleCreek and the Mississippi River, local communityinstitutions, and the unique housing styles withinthe neighborhoods. These unique features offereda baseline for future urban design enhancementsthat better reflected the neighborhoods’ func-tional structure and unique identity.
Integrating various community systems intosignature amenities for the neighborhood pro-
Working with a market
consultant team, the
Humboldt Avenue
Reinvestment Area Study
was conducted to assess the
potential for attracting
private reinvestment in these
neighborhoods and
specifically what types of
public reinvestments would
attract private reinvestment.
Public space types
• key connection streets
• creek and river corridors
• community schools
• neighborhood parks
Private reinvestment types
• parkway homes
• river boulevard homes
• creekfront homes
• neighborhood loop homes
• interior block homes
Analyzing and Interpreting the Placevided new opportunities to add value to thecommunity. For instance, by linking the primaryroadway network with the park system, creationof a “parkway” community was possible.
Several distinct housing styles already existed inthese neighborhoods. New housing added to theneighborhoods could be compatible with theexisting types, identified as parkway homes, riverboulevard homes, creekfront homes, neighbor-hood loop homes, and interior block homes.
River boulevard homes
Creekfront homes
Par
kw
ay h
omes
Neighborhood loop homes
Interior blockhomes
Interior blockhomes
1/4 mile N

Community Redesign34
Exploring Design ScenariosFor the forty small group meetings, an interactive“pizza box,” a fairly flat portable model withmoveable sections, was used to discuss proposedreinvestment ideas. Because of county leadershipin the discussions, the redesign of HumboldtAvenue—a county road—became the centralorganizing feature of four potential design sce-narios.
• Bohanon Lake• Straight Parkway• Curving Parkway• Minimal Parkway
Each scenario illustrated the various options forredesigning Humboldt Avenue, encompassingroad redesign, connections to the school, newhousing types, stormwater ponding, ShingleCreek restoration, bike and pedestrian paths,reconfigured blocks, and creation of a neighbor-hood gateway. Although some residents wereskeptical about the project, they still stayed toparticipate in the meetings. The overwhelmingfeedback was that significant reinvestment wasneeded in these neighborhoods. Following thesmall group meetings and further research, aseries of design principles was proposed andused to guide the final plan development:
Place-Specific Design PrinciplesMake a parkway extension that highlights theShingle Creek corridor, and connect it to otherneighborhood institutions and amenities.
Reveal existing park and school facilities andconnect them with linear corridors to maximizethese existing public investments.
Retain the valued neighborhood commercialbusinesses, and plan housing, road, and amenitychanges that will attract more neighborhoodcommercial services and amenities.
Build a physical hierarchy of street corridors thatreflects all the roles they play in theneighborhood— as biking and walking ways; asneighborhood image communicators; as greencorridors; and as car and truck routes.
Add missing housing types to provide life-cyclehousing in the neighborhood, and renovateexisting homes where feasible. New homesshould reinforce the existing neighborhood fabric.
A model of existing conditions was created out of foam core,
with removable areas of change. Homes and other buildings
were cut from foam core in standard land use colors. The
three dimensional quality of the model helped people see the
existing neighborhood patterns and how modifications to the
area would work within the existing context.
Diversify and Increase the Local Economy
Provide TravelOptions
Enhance Homes andNeighborhoods
Protect and RestoreNatural Systems
Strengthen SocialConnections

Chapter Three: Neighborhood Scale 35
Moving ForwardThe final plan, generated by a team of consultantsand based upon the design principles, resultedfrom a series of design scenario reviews. Reviewsincluded decision-makers and those who wouldbe responsible for implementing and maintainingdifferent components of the project.
Implementation of this major neighborhoodredesign plan involved partnerships between theHennepin County’s Community Works Divisionand Transportation Department, MinneapolisCommunity Development Agency, neighborhoodassociations, the state, and Metropolitan Council.CommonBond Communities, a non-profitdeveloper and manager of affordable housing,developed a new apartment building for seniorresidents. Country Home Builders was selectedthrough an RFP process to develop the privatehousing, 20% of which was required to beaffordable, according to the city’s guidelines.
Public initiatives and financing were used toacquire redevelopment properties, relocateresidents, remove existing buildings, and upgradecity infrastructure, including the roadway,sidewalks, boulevard landscaping, stormwatermanagement, connections to public places, andenhancements to Shingle Creek drainage,vegetation, and trails. A total of 197 units wereacquired, accomplished without condemnationproceedings except in two unique cases.
Still under construction in 2002, eight new homestyles are being added, ultimately totalling up to120 detached homes and 80 attached townhomes.The new apartment building, called Shingle CreekCommons, has 75 housing units with undergroundparking and convenient access to the pathwaysalong Shingle Creek and the Greenway.
Demand for housing in the neighborhood hasrisen, as have home values. Many of the relocatedresidents bought other homes within theneighborhood or are interested in buying the newhomes as they become available. The addition ofnew housing, the parkway, and open spaceimprovements are expected to attract additionalprivate investment in the neighborhood’s housing.
The final plan included: redesigning Humboldt Avenue to a
gently curving parkway, reconfiguring street connections,
providing open space along the creek corridor, including a
broader mix of housing types, and increasing neighborhood
connections to local school campuses and the Mississippi River.
(Planning, Engineering, and Landscape Architecture consultant:
URS Corp)
The architectural
styles reflect the
traditional housing
styles of nearby
Victory Memorial
Drive. (Conceptual
Design by Aaron
Parker
Final Designs by
Nelson Tremain
Partnership)
UR
S C
orp
General Timeline:
1994 Initial meeting
with neighborhoods
1995 Inventory of a
larger project area
1996 Larger area
study
1997 Small Group
workshops of
Humboldt
Greenway study
area
1997 Design
concept created
1998 Financing/
Funding Efforts
1999 Design
roundtables to
refine concept plan
2000 Acquisition and
land assembly
2001Reconstruction
of Humboldt
Avenue
2001- Present,
Residential
constructions
2003 Scheduled
reconstruction of
East/West Roadways
1/4 mile N

Community Redesign36
Case Study
Creating a transit-supportive walkable center:New land use development patterns for the Brooklyn Boulevard & County
Highway 81 district in Brooklyn Park, Minnesota
Assessing the PlaceThis case study grew out a larger effort to exam-ine the implications of a significant investmentsin transit along a suburban highway. InvolvingHennepin County’s Department of Transit andCommunity Works, the Northwest CorridorPartnership, and local community groups, thislarger study identified the location where Brook-lyn Boulevard intersects with County Highway81 as an area that could become more transit-supportive over time. Lying just outside of themetro interstate beltway, land uses consist of alarge industrial business park, two nearby collegecampuses, auto oriented highway retail, fourresidential neighborhoods, and an undevelopedformer city golf course. Shingle Creek and itswetlands flow through the center of the district,although the creek is primarily hidden frompublic visibility and access. Low density residen-tial patterns, railroad and creek corridors, andlimited street connections, present challenges toachieve the intensity of land use and network ofstreets and walkways that facilitate transit use.
Engaging CommunitiesThis case study represents the very initial stagesof a potentially long-term redevelopment effort.Local stakeholders from Brooklyn Park wereinvited to participate in a series of three commu-nity design workshops over a three month pe-riod. Community representatives included plan-ning commissioners, elected officials, Citizen Long-Range Improvement Committee (CLIC) members,city staff, residents, and property owners.• Workshop #1 - Discovering the Corridor,
Existing Neighborhoods and Districts• Workshop #2 - Exploring Opportunities for
Improving Community Design• Workshop #3 - Summarizing District Planning
and Design PrinciplesThe results of workshops were presented to thecity’s Planning Commission for their review. Asimprovements or transit investments becomefunded, a planning process would take place,involving participants from each of the sub-areasidentified on the map above.
Brooklyn Boulevard
CSA
H 8
1
Sh
ing
le C
ree
k
Business
Park
Business
Park
GolfCourse(vac)
Hwy.Retail
Residential
Neighborhood
Residential
Neighborhood
Residential
NeighborhoodResidential
Neighborhood
Indust.
Area
Technical
College
Community
College
County Highway 81Bro
ok
lyn
Bo
ule
va
rd
Looking east, above, it is easy to see the auto-
oriented nature and large scale of development
around the of County Highway 81 and Brooklyn
Boulevard. Looking west, development has little
orientation toward the extensive wetlands and creek.
County Highway 81
1/2 mile N

Chapter Three: Neighborhood Scale 37
Taking Inventory of the LandscapeThe preliminary inventory of the BrooklynBoulevard/Hwy 81 neighborhood involvedtaking aerial photos and ground photos, anddrawing existing land use patterns. GIS land use,parcel, road right-of-way, railroads, creeks, lakes,and parks data was analyzed to gain an under-standing of existing patterns and activities. Forexample, the separation of different land uses isvery apparent as is the lack of good connections,which are limited by the railroad, the creek,wetlands, insufficient road network, and the largeblock structure.
At the first workshop, with the use of detailedaerial orthophotos and overlays and the secondworkshop through the use of design scenarios,additional data was gathered from participantsabout perceived issues, assets, and challengeswithin the area. This information was integratedwith other inventory data and summarized on amap, part of which is shown below.
Potential for park
and ride parking
ramp
Greenhaven
neighborhood is
very stable
ShingleCreekGreenway
could be an amenity for
businesspark employees
Createlandmark,
signature buildings
at intersections
Railroad limits
accessfrom west
side of County
Road81
Co Rd 81is
unattractive,
needfor land-
scaping
ConnectSumpter
Ave and Jolly
Lane
Potential
Candlewood Drive
extensionne
Soils
unsuitable for
development
Strong regional
commercial anchors:
Target and Cub
Limited road
connections
through
Starlite Village
Land intensive
industries near
transit center
Truck
traffic from
business
parkPoor
location
for
housing
land
oyees
Limited
connectionsto
large neighbor-
hood park
Pedestrian
crossingis
dif ficult
ShingleCreekcould
bea greenway that
crossesCo Rd 81
ShingleCreek
visible from Co
Rd 81
Soils
unsuitable for
development
Extend residential
neighborhood to “New
Candlewood”
Closedgolf course
land available for
development
Limited road
connections
through retail/
golf course
area
Existing
Starlite center
doesnot face
Co Rd 81
Potential new road
connecting73rd
Avenue
Road Networks
Bus Routes
Natural Systems
Recreational Trails
Parks & Open Spaces
Single-Family Residential
Multi-Family Residential
Commercial
Public
Industrial
Information from a variety of sources was compiled
into a standard format. The common frame of
reference is a 2000’ radius circle drawn from the
center point of a potential transit stop.
Locating issues, assets, and challenges on a map of the area
makes a firm connection between ideas and places for
implementation.
The existing intersections lack visual appeal and
pedestrian accommodation.
2000’

Community Redesign38
Walkability analysisUsing walkable area design analysis, the districtwas analyzed for potential walkable routes,walking accessible areas, land use mixes, andstreet network connectivity. Potential transit stoplocations were identified and then all possiblewalking routes within 1/4 and 1/2 mile wereidentified. The analysis showed that this area issignificantly challenged by inadequate streetnetwork, large-lot developments, lack of walkingaccessible residential land uses, and railroad andcreek barriers. Highway 81 itself is a majorbarrier to walkability within the district.
Locating a potential walkable center Identifying the location of a potential walkablecenter at this crossroads area involved assessmentof several variables, including future land usepatterns of the surrounding areas, redesign of theHighway 81 roadway, location of the proposedbusway and other transit services, and redevelop-ment opportunities of existing development inthe walkable area. Based on the presence ofmajor barriers on the west side of the intersection,primarily the railroad and creek, the east sideoffered greater potential for designing a walkablecenter. Brooklyn Boulevard, rather than Highway81, should be the district’s “Main Street” with thegreatest mix of land uses and plentiful roadconnections developed in this central area.
Analyzing and Interpreting the Place
Walkable Routes: Which streets enable walking
access to the proposed transit station area?
Walkable Areas: Which areas are within
convenient walking distance of the transit station?
Mix of Land Uses: What is the mix of existing land
uses in this area?
Priority Area and Street Connections: What are
the important connecting streets, public
spaces, and natural areas in this area?
Possible Transit-Oriented District Configuration: What could this
transit-oriented district look like?
1/2 mile N

Chapter Three: Neighborhood Scale 39
Protect and RestoreNatural Systems
Foster SocialConnections
Provide Travel Options
Enhance Homes andNeighborhoods
Integrate Land Uses andEconomic Activities
Exploring Design ScenariosTo explore alternative scenarios for futurechanges, a model of the Brooklyn Boulevarddistrict was built showing existing roads, build-ings, land uses, and natural systems. Threedesign scenarios for the potential walkable areawere created for workshop participants to discussand critique. Each scenario integrated conceptsfor roadway redesign, new road network connec-tions, changing and mixing land uses, intensify-ing development, and enhancing natural systems.Specifically, three road design speeds wereconsidered, using their corresponding allowabledriveway or intersection spacings: 35 mph (1/8mile), 45 mph (1/4 mile), and 55 mph (1/2 mile).*
Based upon input from the second workshopregarding the initial three design scenarios, theDesign Center created a composite scenario torepresent preferred concepts. The compositescenario illustrates a 45 mph roadway design,greatly expanded road network, a connectedShingle Creek Greenway, and a balance of newworkplaces, residences, and a clustered retailarea. These concepts were articulated in designprinciples that were reviewed and refined at thethird workshop as follows:
Place-Specific Design Principles
Create Shingle Creek Greenway as a connectedpark and trail amenity to enhance natural vegeta-tion, habitat, drainage, and recreational opportunities.
Redesign the Shingle Creek segment of CountyRoad 81 as a landscaped 45 mph CommunityBoulevard.
Convert existing auto-oriented retail develop-ments into a pedestrian-friendly retail village tosupport surrounding residential neighborhoods,business parks, and college campuses.
Expand the district network of streets, bike paths,and sidewalks to improve local access and safety.
Add a “New Candlewood” mixed-use, transit-supportive neighborhood between transit, retail,and Shingle Creek Greenway amenities.
Place larger landmark buildings on the east sideof Highway 81 and Brooklyn Boulevard intersec-tion to mark the gateway to the district.
Existing Conditions
Joyner’s Crossing: 45 mph
Community Boulevard scenario
Starlite Retail &
Business Center
Creek Haven
Business Park
Shingle Creek
Neighborhoods
*Both Brooklyn Boulevard (CSHA 152) and County Highway 81
(CSHA 81) are county roads that receive state funding
assistance and are therefore subject to state standards.

Community Redesign40
Moving ForwardBuilding upon the concepts of the walkablecenter urban design scenarios, the next phase ofplanning will focus on district planning anddesign with an increased level of leadership andinvolvement from Brooklyn Park stakeholders.District planning would involve representativesfrom each of the district’s subareas, including thefour residential neighborhoods, two collegecampuses, the industrial business parks, and localretailers. The goal of this planning effort will beto establish a local vision, possibly a small areaplan for the district, linked to the city’s compre-hensive plan. This planning will integrate Brook-lyn Park’s land use planning and reinvestmentstrategies with transportation planning at thelocal, county, and state level, especially regardingroadway redesign of Highway 81.
A preliminary analysis of the fiscal impacts andthe traffic impacts of changing land use patternsalong the corridor indicates that intensifying anddiversifying development patterns can providepositive impacts for local communities. Theseimpacts must continue to be explored and under-stood to validate the feasibility of implementingnew walkable center development patterns.
In order to design a successful corridor, districtplanning in Brooklyn Park must be coordinatedwith related district planning along the CountyHighway 81 corridor to the south and to thenorth, with the neighboring cities, HennepinCounty, the Northwest Corridor Partnership,Metro Transit, and other stakeholders.
This plan view drawing of a potential walkable center design
(approximately 150 acres) for the Brooklyn Boulevard
crossroads area illustrates connections and orientations for
blocks, streets, buildings, and natural systems. The walkable
area is defined as the area within approximately 2,000 feet or
a 5-10 minute walk from a possible transit station at the
Brooklyn Boulevard & County Highway 81 intersection.
Although Highway 81 is envisioned as a landscaped, multi-
modal boulevard, Brooklyn Boulevard is seen as the center’s
“main street” with the highest quality pedestrian designs
relating to building, street and public space design. Because
the east side of Highway 81 already contains a large retail
center and substantial redevelopable land, the walkable
center could be located primarily on the east side. The mixed-
use core area could be focused on Brooklyn Boulevard east of
Highway 81, encompassing approximately 38 acres of land,
indicated above by the blocks with building footprints and
street frontages.
Brooklyn
Boulevard
Hig
hw
ay 8
1
As another phase of planning is undertaken,
some of the same tools and techniques can
be updated and used to generate discussion.
1/4 mile N

Chapter Three: Neighborhood Scale 41
Case Study
Reconnecting a site to its surroundings:Community and environmental design of a
neighborhood in Minneapolis, Minnesota
Assessing the PlaceApproximately one mile west of downtownMinneapolis, the Sumner Olson Neighborhoodhas been the scene of much change and develop-ment over the last one hundred years. Originallya stream valley that carried Bassett’s Creek to theMississippi, by the late 1990s the site was entirelypublic housing projects built between the 1930sand 1960. The target of a lawsuit in 1993, a groupof residents and their attorneys argued that thepoor condition and concentration of housing inone area was discriminatory to those who hadlimited housing options. The parties settled thesuit, on the premise that an inclusive planningprocess would make recommendations for a newresidential development that would reconnectthis isolated piece of the city back into the fabricof the surrounding neighborhood.
Engaging CommunitiesInitially, the people engaged were a group ofresidents, the Public Housing Authority andother public officials. Attorneys on both sideswere also part of these discussions that set theframework for more detailed planning. As theprocess moved forward, broader groups ofstakeholder representatives were charged withmaking recommendations about how the projectarea should be rehabilitated or redeveloped andwhat criteria should guide that work. The compo-sition of the stakeholder groups (called FocusGroups in the process chart) was negotiated as partof a Consent Decree, and each stakeholder groupcould appoint their own representative.
After the stakeholder groups, which eventually metas one group, made their formal recommendationsto demolish the existing units and rebuild a mixed-income residential neighborhood, an action planningand implementation phase began, with staff propos-ing a framework for moving forward, in negotiationwith all the parties involved up to that point. In thefinal design phase the developer’s design teamconducted another round of community participa-tion events to create a development master plan,guided by the principles established by earlier work.
The initial planning process involved focus groups of designated
stakeholder representatives. Public presentations and open
forums were also held with public notifications in local
newspapers, flyers, and radio spots. Food, day care,
convenient after work-day hours, and translators were part of
the mix to attract as many people to the discussion as possible.
Mississip
pi R
ive
r
Hwy 55
Bassett Creek
Inte
rstate
94
Harrison
Neighborhood
Near North
Neighborhood
Sumner-
Glenwood
Neighborhood
Downtown
Minneapolis
Bryn Mawr
Neighborhood
Lowry Hill
Neighborhood
Walker Art
Center
1/2 mile N

Community Redesign42
Taking Inventory of the LandscapeAmong other things, the inventory for this projecthad to answer the question of what environmen-tal factors contributed to the poor quality of lifedescribed by residents of the housing projects. Asense of isolation, fear of crime, and chronicmaintenance problems had stigmatized the“projects” as the most undesirable in the city’spublic housing stock. In addition, the inventoryaddressed the question of what would constitutea quality environment, by which improvementsto the project would be judged. A history of landuse changes around the projects, summarized in aseries of diagrams, told the story of a publichousing complex increasingly cut off from thefabric of the surrounding neighborhoods. The landuse history also showed the area was on a creekand flood plain, long buried, but giving clues to thesubsurface problems that plagued the area.
Neighborhood Change Over Time
Circa 1850s The presettlement course of Bassett Creek is
superimposed on a turn of the century plat map. A
meandering prairie creek is all that remained of an ancient
lake that filled with clay sediments from the glacial-melts
flowing down the Mississippi River. From the earliest days of
Minneapolis, the creek was considered a health menace and
an impediment to development.
1912 Parts of the creek had been buried and after an initial
rush of middle-class suburban development, this
neighborhood became a refuge for recent immigrants
working in the nearby mill district. By the twenties the Sumner
neighborhood was considered one of the worst slums in the
city. Blocks were double loaded, with alleys acting as streets
and many small manufacturing businesses mixed in with
residential units.
1938 This map shows the footprints of Sumner Field Homes, the
first public housing project in the state. The neighborhood was
also one of the few places in the city where African Americans
could find housing. Sixth and Plymouth Avenues were active
commercial streets.
1990 Sumner Field Homes became surrounded by
manufacturing and a freeway to the east and a superblock to
the west with an assortment of schools, housing,
manufacturing, and churches. To the south, projects added in
the late fifties made this the highest concentration of public
family housing units in the city. Sixth Avenue became a
highway that divided the neighborhood. Virtually all
commercial was gone from Plymouth Avenue after race riots
in the sixties.
1990
1938
Circa 1850 (creek)
1912
Olson Highway
6th Avenue
Plymouth
Avenue
Original
channel
Built conduit Future site
of Sumner
1/2 mile N

Chapter Three: Neighborhood Scale 43
Looking at the underlying soil and water pat-terns, the analysis focused on the implications ofthe buried creek and deep valley of poor soils.Working with geotechnical expertise, the teamdiagrammed the implications for building on thesite, showing where more expensive pilings andother precautions would be required, addingexpense to the project. The other avenue ofanalysis focused on what could be done to resur-rect the creek as an asset to the neighborhood,because access to water features and open spaceclearly came up as a prime indicator of qualityneighborhoods in the Twin Cities. Analysisdiagrams showed how the Harrison and NearNorth Neighborhoods could relate to the valleyas well as similarly situated neighborhoods ofBryn Mawr and Loring Hill.
Analyzing and Interpreting the Place
The map on the left was used to depict
subsurface conditions that have made
building in this area problematic for the
past century. Layers of glacial drift, shown
in the section below, filled a deep valley
incised in bedrock. The clays were
particularly unstable, requiring buildings
and utilities to be supported by deep
pilings in areas throughout the grey zone. In
other words, it would be substantially more
expensive to rebuild here than in other
areas of the neighborhood.
This diagram shows how the Sumner Neighborhood could be
oriented to acknowledge the valley, staying out of the poorer
soils, similar to other valley neighborhoods.
1/4 mile N
Section Line
Section

Community Redesign44
Design Principles
Protect and RestoreNatural Systems
Foster SocialConnections
Provide TravelOptions
Enhance Homes andNeighborhoods
Integrate LandUses and
EconomicActivities
This series of scenarios is one of over twentydesign alternatives that were created over thecourse of the process. As the decision was madeto create a primarily residential neighborhood,the focus of alternatives shifted from land usescenarios such as these below, to more particularscenarios about the arrangement of open spaces,block layouts and the mix of housing. Within allthe scenarios, livable community principles wereapplied, though emphasized differently.
Park and ponds dominate, with infill
housing overlooking open space.
Housing borders a narrower park, with
some additional industrial development.Commercial and industrial business are
the predominate re-uses in this scenario.
Exploring Design ScenariosThe following principles were summarized fromFocus Group recommendations and were quoted inthe Action Plan Summary as the starting point formore detailed, subsequent planning and design:
There is a need for connections from the nearnorth side to other neighborhoods, especially tothe west and south. Both sides of Olson should belinked with a pedestrian bridge, and bus serviceshould be improved. An at-grade connectionshould link the parkland amenity to the largerparks system.
Housing should be built on the better soils on thesite. It must be mixed-income housing. Designmust emphasize defensible space and safety.Buffers should be provided between housing andnon-compatible land uses. All units designedshould have a high level of amenities. Housingfor elderly people should be provided on-site.The recommended housing income mix is 50%market-rate, 25% housing affordable to families at60% of area median income (tax credit housing),and 25% public housing. Part of the housingprovided should support a Campus of Learners,a HUD program aiming to improve education.
Open space should be created on the worst soilsin the area. There should be links between theopen space and Bethune School.
Commercial and retail uses should be exploredfor the Olson/Lyndale area, including the idea ofan ethnic or cultural marketplace. Institutionaluses should be encouraged as well as similareducational, job training, and social services.
New
Park
New
Housing
New Business
Local, successful
neighborhood models
were used to develop
more detailed guidelines
for the new housing. This
diagram focuses on the
importance of orienting
doors toward the street,
rather than the layout of
Sumner Field Homes where
backdoors sometimes
faced the street and the
relationship between
public and private space
was poorly defined. More
detailed open space and
restoration goals were also
articulated as part of the
Action Planning process.

Chapter Three: Neighborhood Scale 45
Moving Forward
Co
urt
esy
o
f U
rba
n D
esi
gn
Ass
oc
iate
s
This plan was prepared by Urban Design Associates for lead
developer McCormack Baron & Legacy Management. The
three design concepts were: “providing a mix of housing types
and designing for social integration” and “to fit in with the
existing neighborhood context;” “a street network that links
the site to adjacent neighborhoods and complements the
park system;” and creating “a strong parks and open space
system that provides linkages to adjacent amenities, creates
quality housing addresses around an open space network,
and designs for sustainability.” (Minneapolis Near NorthsideMaster Plan, May 2000, prepared by McCormack Baron &
Legacy Management, Urban Design Associates and SRF
Consulting Group, Inc.)
This process was lengthy, and at many timescontentious. The complexity of urban site rede-velopment was compounded by the extremeshortage of housing at the time that residentswere being relocated out of the projects. Once thedecision was made to demolish the existingunits, the recommendations of the Focus Groupshad to be translated into feasible developmentplans that had to be carried. The primary strat-egy for moving forward was an ImplementationCommittee providing policy oversight anddirection, a Community Advisory Committee,and Staff Steering committee. The decision wasmade to select a lead developer, rather thanmultiple developers, to build, own, and managethe rental components of the new neighborhood.The result of the many years of negotiation,decision-making, planning, and disruption willbe the replacement of 916 public housing unitswith 900 new residential units, of which 440 unitswill be rental, 360 for ownership, and 100 unitsfor elderly public housing residents. Two hun-dred of the rental units will be public housingreplacement units. A unique water collectionsystem will reanimate the site with filteredrainwater within a linear open space that alignsalong a continuous boulevard that will restorelost connections between north and south Minne-apolis neighborhoods.

Community Redesign46
Key Phases, 1993-2002
(Note: the Design Center for American Urban Landscape was
primarily involved in the early phases of the project, through
the Action Planning process. Early studies were completed by
the Design Center or by consultants with different areas of
expertise, such as market analysis, geotechnical, and
engineering issues.)
Early Negotiation-establishing planning scope, principles and
processes (1993-1995)
• Conduct research on neighborhood history, the project
buildings and site plan as well soil conditions.
• Survey residents about housing preferences.
• Design scenarios to remediate site conditions.
• Study surrounding area issues, opportunities, and projects
that could impact or be linked to the site.
• Identify potential sources of funds to frame different
design scenarios.
• Present and discuss findings with community
representatives, and officials using an interactive model.
• Conduct and assemble research on best practices for
multi-family and public housing.
• Propose planning principles to guide the planning
process and negotiate how process will be conducted.
Consent decree signed by all parties.
Focus Group Process- making big picture decisions (1996)
• Two groups consider different areas, each meeting once
a month, beginning with a visioning exercise.
• Present information gained in prior years.
• Co-mingle groups because projects are physically co-
mingled and cannot be considered separately.
• Make decision on the fate of existing buildings, decide to
tear down and start anew.
• Hold an all day land use workshop to determine overall
uses and potential planning guidelines.
Action Plan (1997-8)
• Conduct market studies and further soils investigations.
• Develop more detailed scenarios to understand site
capacity with program revised, based upon market
studies.
• Develop a detailed framework, including
implementation dimensions such as funding sources,
roles, responsibilities, governance and community
involvement.
• Establish firm site boundaries.
• Review draft plan with affected parties, revise and seek
necessary approvals.
• Relocate residents and begin demolition.
RFQ and Developer/Design Team Selection (1999)
• Develop a Request for Qualifications and select a
design team to design public infrastructure investments
to be implemented by city departments. Negotiate
agreements and terms.
• Develop an Request for Qualifications for a developer
team to implement the housing components.
Site Master Planning and Phase I Construction (2000-3)
• Developer design team conducts community
workshops to create a more detailed master plan.
Feasibility studies and market demand suggest more
housing units should be constructed to offset sit
preparation costs and to achieve critical mass.
• Plan reviews and completion of relocation and
demolition process. Construction of waterway, parks
and housing units in phase one area (north of Olson
Highway).
Phase II Construction (2003-5)
• Construction in the area south of Olson Highway

Chapter Four: Town Scale 47
The term “town” is used to refer to places that contain multipleneighborhoods or subdivisions that share community features suchas a commercial center or corridor, with an area roughly one mile tosix miles square. A typical town-scale area includes majortransportation corridors that provide access to regional systems, butcan also create barriers for local movement and natural resourcecorridors. Streets that carry larger volumes of traffic are importantsocial and commercial places, but have often been developedpiecemeal with little connection between sites. The center of a“town” may be a commercial area or corridor that servesneighborhoods in more than one jurisdiction. Parks are dispersedthroughout, but may not offer the full spectrum of open space thatmakes the community a desirable place to live. While exhibitinggreat variability themselves, approaches to studying and proposingtown-scale changes can be described. The following principles havebeen synthesized from the case studies that follow and othersimilarly sized projects. On the next pages, the principles areaccompanied by diagrams of an inner suburb example, as well astext describing the underlying rationale for each. Following theseprinciples, three case studies are described, putting the principles towork in a specific place.
Town Scale Principles
Protect and Restore Natural Systems
Preserve and shape natural areas and corridors that link
multiple neighborhoods, and protect area water bodies.
Strengthen Social Connections
Develop an interconnected trail and road network that makes
connections between neighborhoods, shared open spaces,
or community activity centers.
Provide Transportation Choices
Manage auto traffic to maximize existing road capacity and
enhance the comfort of commercial and collector streets and
thoroughfares for pedestrians, bicyclists, and transit users.
Integrate Land Uses and Economic Activity
Strategically locate diverse business centers to provide ac-
cess for multiple neighborhoods as well as regional transpor-
tation corridors.
Enhance Homes and Neighborhoods
Create a range of complementary neighborhood types to
create a diverse mix of housing and life-cycle housing
throughout the town area.
Chapter Four: The Town Scale
This inner suburban example is defined
by its proximity to an interstate
interchange. The borders of three cities
converge at this location. The gray box
shows the area highlighted in the
previous chapter. More information on
the area shown in the diagram can be
found in Engaging Communities forRegional Change, North Metro I-35WCorridor Coalition, April 2000.
Tank
Farm
Business
area
Post-war
homes
70’s era
homes
Inte
rsta
te
N
1/2 mile N

Community Redesign48
Preserve and shape natural areas and corri-
dors that link multiple neighborhoods, and
protect area water bodies.
At this scale, a natural resources inventory can beundertaken to understand the dynamics of waterand habitat flows between neighborhoods. Town-scale efforts focus on restoring missing linksbetween habitat areas such as wetlands andwoodlands and restoring native plant species inexisting open spaces. Often these activities can bedone in concert with water quality improvementprojects to treat runoff from several local neigh-borhoods that threatens local water bodies.
Develop an interconnected trail and road
network that makes connections between
neighborhoods, shared open spaces, or
community activity centers.
Fostering social connections may involve anassessment of community facilities such asmeeting places, recreation centers, and largerpark complexes with multiple ball fields or soccerfields. Facilities in one city may attract peoplefrom neighboring places, so joint planning andfeasibility studies and, at minimum, communica-tion with adjacent communities is necessary. Trailprojects that link these services are anotherlivable community activity at this scale of design.
Jones
Lake
Sandcastle
Park
Ballfields
T.
Schmidt
Park
Tra
il
County
Rd. D D &
FairviewD &
Cleveland
Manage auto traffic to maximize existing
road capacity and enhance the comfort for
pedestrians, bicyclists, and transit users on
busy streets and thoroughfares.
At the town scale, the goal of providing traveloptions can occur in two ways—by providing theservice itself such as a circulator or by concentrat-ing transit supportive development along corri-dors with existing or potential bus service or railservice. Unless a concentration of likely transitusers is located within a quarter mile of a transit,it is difficult to provide frequent and convenientservice. An option for more rural communities isthe use of park and rides in existing lots that areunderutilized during weekday hours such as achurch parking area. 1/2 mile N
Neighborhood habitat “stepping
stones” of tree cover and understory
D& Old
Hwy. 8
Areas that could be enhanced for use
by the surrounding residents and workers
Prin
cip
al A
rte
ria
l
Minor Arterial Lo
cal B
us
Rail
Min
or A
rte
ria
l
A variety of intersecting transportation
systems provides opportunities

Chapter Four: Town Scale 49
Manufactured
Multi-
Family
Single
Single
Create a range of complementary neigh-
borhood types to create a diverse mix of
housing and life-cycle housing throughout
the town area.
While the existing patterns may not be conduciveto diversifying at the neighborhood scale, a largerview can reveal opportunities to create thatdiversity across the town, particularly at theedges between neighborhoods. Edges tend tohave inherent diversity that can be encouragedby zoning the area for an even greater variety ofuses that attract activity and can be walkingdestinations for adjacent neighborhoods.
Strategically locate diverse business centers
to provide access for multiple neighborhoods
as well as regional transportation corridors.
Working toward a more diverse economic base atthe town scale means gathering information onexisting real estate markets and matching thatdata with information on different areas in thecommunity that are in transition or are presentlyundervalued based on current uses. At this scale,cities, either alone or in collaboration with abordering city, typically focus on older commer-cial streets that have an aggregation of sites readyto “turn over.”
West Lake
Johanna
Neighborhood
Commercial/
Industrial
Neighborhood
Commercial/
Industrial
Commercial/
Industrial
Existing mix of housing types
Generalized land use zones and
edges
1/2 mile N

Community Redesign50
Three town case studies in the Twin Citiesmetropolitan region show how cities have theopportunity to approach community design froma metropolitan town perspective, balancing theirlocal and metropolitan identities:• Farmington• Nicollet Avenue, Minneapolis• Northeast Blaine
As a former freestanding rural town now at thesouthern edge of the Twin Cities metro region,Farmington faces the pressures of majorsuburban growth all around its small towndevelopment pattern. This case study describeshow the City of Farmington worked with asubdivision developer to design a new residentialneighborhood that is compatible with the featuresof the natural landscape, the neighboringdowntown district, and the surroundingagricultural areas.
Nicollet Avenue is Minneapolis’s Main Streetboth downtown, where it is auto-free NicolletMall, and through all of south Minneapolis. Thiscase study focuses on Nicollet Avenue from LakeStreet to the city’s southern boundary, thesegment designated as a “community corridor”in the city’s comprehensive plan. Approximatelythree miles in length and running through fourneighborhoods, this case study describes how theneighborhoods and city planners workedcollaboratively to translate a corridor vision andrelated initiatives into a comprehensive designthat balances neighborhood activities andcitywide transportation goals.
The City of Blaine’s northeast corner,approximately eight square miles, lies outside theMetro Urban Services Area but within its UrbanReserve—areas reserved for population growth toat least 2040. Already facing urban developmentpressures, this case study explores possibilitiesfor development types that are more compact,mixed-use, accessible, and ecological thanconventional suburban development patterns.
Farmington
Building within the community watershed
Nicollet Avenue, Minneapolis
Redesigning a community corridor
Northeast Blaine
Integrating community growth and open
space goals
Farmington
Northeast
Blaine
Nicollet
Avenue
Town-Scale Case Studies
10 miles N

Chapter Four: Town Scale 51
Case Study
Building within the Community Watershed:
Designing waterways as an environmental framework for development in
Farmington, Minnesota
Assessing the PlaceFarmington is located approximately twentymiles south of the Twin Cities. Farmington has adistinct community identity built around its ruralheritage and its location on a fertile outwashplain between the north and south branches ofthe Vermillion River. In 1993 the city ofFarmington was approached by the SiennaCorporation, a land development group, with aproposal to build a new subdivision across theriver in the southeast corner of the city. Thedeveloper proposed variances from the zoningcodes to build a neo-traditional plan withgridded streets and smaller house lots to accom-modate affordable homes—primarily singlefamily. At the same time, the city was in theprocess of designing a significant flood controlproject in the vicinity. In the context of theseproposals, the challenge was to develop an urbandesign framework and principles that would bestleverage the public and private investments tocreate a more livable community for existing andfuture residents, as well as enhance the localnatural resources.
Engaging CommunitiesThe Design Center worked with the City ofFarmington Planning Study Committee, com-prised of community residents, city staff, andelected officials. In consultation with the commit-tee and the developer’s design team, the DesignCenter proposed a framework and set of designscenarios built around the goals of connecting thenew development to adjacent neighborhoods,improving water management for both waterquality gains and flood control, and creating anamenity-rich neighborhood that added to theexisting parks and open spaces of the community.The scenarios were the vehicle to create specificprinciples and concepts that would guide devel-opment in the southeast corner of town.
Hw
y 8
New
Development
Site
High
School
Agriculture
South Rural
Residential
Northwest Rural
Residential
Vermill
ion R
iver
A typical railroad town—two lines intersected here—
Farmington has the added attraction of the Vermillion River, a
vibrant urban forest, and healthy downtown, surrounded by
agriculture. Preserving and extending these assets into new
development was a goal of both the city and the developer.For more information on this case study, see BuildingCommunity Across the Corridor, 1993.
1 mile N

Community Redesign52
Taking Inventory of the LandscapeIn this study, material was not available electroni-cally, but hand-drawn maps can be equallyeffective for town-scale planning. The followingstrategies were used to collect and display infor-mation.
Walking tour of the city: Members of the Plan-ning Study Committee participated in a walkingtour of the city to reacquaint themselves with itsimportant environmental and urban features.Using disposable panoramic cameras, committeemembers photographed places that they felt wereimportant features of their city.
“Bird’s-eye” views of the city: To provide abroader perspective on how natural resources,existing land uses and the built environmentform the city’s urban fabric, the town and sitewas photographed and drawn in ways thatemphasized the three dimensional qualities of theplace. These overviews also allowed a betterperspective on how land uses were situated inrelationship to one another and where gaps in thestreet or habitat network occur.
Current vision for future land uses: The city’sexisting comprehensive plan, with its well-thought-out land uses and open spaces wasfocused mainly on the west side of town. Thelocation of the development site on the mapunderscored the question of how to extend thetown into the new addition.
Mapping water-saturated soils: While many intown were aware of the high water table thatcaused frequent flooding, this graphic vividlyshowed that the city was virtually an islandsurrounded by a below-ground lake with drasti-cally fluctuating water levels.
Map of Comprehensive Land Use Plan 2000
Drawing of water-saturated soils
Site
Study committee members photographed downtown
landmarks, residences and the Vermillion River.
1 mile N
1 mile N

Chapter Four: Town Scale 53
Analyzing and Interpreting the PlaceCivic officials, citizens, and staff were accustomedto viewing their city in certain ways. Often, it ishelpful to provide a new view that shows rela-tionships and patterns that can go unnoticed untilhighlighted by someone looking from the out-side. For example, the terrain map emphasizedthe subtle terrain and drainage pattern in thecontext of the existing land use pattern. The mapalso shows how a new drainage way to serve theproposed development could fit into the overallpattern. Similarly, the natural areas hubs andcorridors map vividly portrays natural resourcesas a system rather than a series of separate places.This drawing also emphasizes the primary streetsand natural corridors that could be extended andconnected to the new part of town. Analysisdrawings (below) were used to investigate alter-native stormwater and flood control strategies,diagrammatically showing how each wouldappear on the surface.Interpretive Terrain Map
The area was shaped by glacial outwash that
left deposits of gravel and sandy soils after the
water receded from the landscape of gentle
hills and shallow depressions.
Hilly Uplands
Hilly Uplands
Flat, outwash
plain
Wetlands
(typ.)
Downtown
Tributary
streams
(typ)
1 mile N
1 mile N
Natural Areas: Hubs and Corridors
This diagram highlights the location of
potential non-agricultural habitat areas where
wildlife may nest, live, and forage. Vegetation
along rivers and creeks is shaded, as are
wetland areas. The hatched lines represent
areas of urban tree canopy, places that can
play a supportive role for wildlife in the area.
Pipes and ponds. A
series of ponds and
underground pipes
would convey excess
water to the Vermillion
River.
pond
pond
pond
Prairie waterway. A
broad, vegetated
depression would
carry water to the
river, while creating
an recreation and
habitat corridor that
forms a strong edge
between town and
agricultural fields.
pip
es
open
waterway
1 mile N

Community Redesign54
Design PrinciplesEnhance Homesand
Neighborhoods
Protect andRestore
Natural Systems
Foster SocialConnections
Provide TravelOptions
Diversify andIncrease the Local
Economy
Exploring Design ScenariosA closer view of the proposed urban design framework showed how the newpart of town could become a part of the existing town. The following designprinciples were derived from the existing community landscape and thescenario proposed for the east addition to town. The principles, developed bythe Design Center with the planning study committee and the developer, wereused to guide the ultimate development plan for this site and could also guidefuture development in other areas adjacent to town.
Use the existing city grid pattern of square or rectangular blocks to shape thelayout of new development adjacent to downtown Farmington.
Construct new residential streets scaled to the existing 31-38 foot wide streets ofthe downtown area. New streets should be planted with lowland-forest, shadetrees which are tolerant of urban street conditions.
Use designated streets as pedestrian linkages between environmental corridors or“greenways” and civic places, especially developing pedestrian and bicycle con-nections between new developments, downtown businesses, and local schools.
Rebuild State Highway 3 into a new pedestrian-oriented parkway and residen-tial-scaled street.
Use native vegetation or plant forms combined with the stormwater collectionponds and drainage system to create outdoor rooms and corridors for recre-ation and pedestrian activities, as well as wildlife movement and habitat.
Use native vegetation and highway infrastructure to design unique city “gate-ways,” which will distinguish Farmington from other locations in the regional area.
This scenario suggests an easily
identifiable system of roads and a
waterway to provide community linkages
throughout Farmington. Important north/
south corridors include the Vermillion
River, which forms the western edge of
downtown, and the proposed prairie
waterway, which defines its eastern
edge. Spruce Street has been
designated as the most important east/
west pedestrian connector because it
serves to connect the prairie waterway
with the downtown commercial and
civic institutions as well as the Vermillion
River. Wide bands of vegetation create
greenway borders around the wetland
systems that lie north and south of the
proposed residential development.
Prairie
Waterway
Spruce Street
Downtown
Farmington
Verm
illion R
iver
1/2 mile N

Chapter Four: Town Scale 55
Moving ForwardPhase One and most of Phase Two have beenconstructed and sold, with strong buyer interestin the neighborly feeling of the traditional blocksplus innovative open spaces. The followingelements are some of the factors that helpedsuccessful implementation of the projects:
• The city and developer continued workingwith a team of landscape architects, engineersand an ecologist to refine and construct theprairie waterway.*
• The city allowed slightly smaller street widthsand created a Tax Increment Financing (TIF)district to support infrastructure investments. TIFis a program of the state legislature that allows acity to capture increased tax capacity from newdevelopment within the designated district andapply it toward district development costs, suchas installing utilities (Minnesota Journal, 2001).
• The developer worked with builders to designhomes that had street appeal and emphasizedfront door and front porch areas rather than thegarage. The developer’s design team created aninterior common space for each block that alsofunctions as temporary stormwater storage.
* Developer: Sienna Corporation Layout Concept: Derek Thompson, RLA Engineering: JR Hill Inc. Prairie Waterway Concept: DCAUL Prairie Waterway Design: Balmori and Associates with Paul Barten, hydrologist.
Looking west, Spruce Street makes a visible link to downtown.
The median of Spruce Street is planted with native wildflowers
and carries runoff to the Prairie Waterway.
The waterway is a sinuous channel, with side ponds that filter
runoff from backyards and streets. In a flood event, the entire
waterway fills.
Since these photos have been taken, trails meander along this
constructed waterway.

Community Redesign56
Case Study
A natural-resource based town plan:
Assessing the PlaceLocated on the edge of the urban servicearea, this 6000 acre area is fifteen milesnorth of Minneapolis. Recent trends in thelocal development market and smartgrowth policies at the regional level moti-vated the City of Blaine to reevaluate itsprevious assumptions about developmenttiming and land use patterns. Recognizingthe importance of an area of this size, theCity was interested in exploring the poten-tial of the area for a broader mix of landuses and home types than more conven-tional suburban development pattern. TheCity and its citizens also recognized theimportance of the large wetland complexesand high quality woodlands that had beenidentified in a recent Natural ResourcesInventory.
Engaging CommunitiesWhile more than half the area is comprisedof wetlands and extensive sod fields,approximately 190 homes were alreadylocated on five to forty acre parcels. Includ-ing these landowners in the process was ahigh priority. Some wanted to know howsoon they could develop; others wanted toknow how development would affect them;while others were adamantly opposed toany change in the status quo of low-density,un-sewered residential. All were interestedin an open process.
Integrating community growth and open space
goals in Blaine, Minnesota
Radis
son R
oad
Lexin
gto
n A
ven
ue
I-35W
Main Street
The aerial photo shows the subtle terrain of the Anoka Sand Plain:
small wooded hills surrounded by wetlands. Many of the wetlands
were ditched and drained, now sod fields, while others remain, with
rare remnants of pre-European settlement plant species.
Small groups of citizens worked
to create scenarios that
clustered residential
development.
1 mile NPattern of existing streets and natural areas, both
woodlands and uplands
North Woodlands
Neighborhood
West Meadows
Neighborhood
East
Meadows
Neighborhood
Lochness
Lake
Neighborhood

Chapter Four: Town Scale 57
Taking Inventory of the LandscapeLocated on the Anoka Sand Plain, this ancientlake bed is characterized by deep sands overlainby wetland soils interspersed with knolls thatgently rise above the flat terrain. Gathering dataon wetland locations became the key to under-standing what could happen in the area, in termsof development potential. Though the area has arelatively high water table, the area can be builton, as long as homes are raised above the 100year flood elevation. Wetlands are more of aconstraint, according to local watershed manag-ers, because if filled, they would need to bereplaced at a two for one acre replacement rate.
Locating and evaluating the natural resourceswas critical to this planning process. The citysought and received matching funds for a con-sulting firm to conduct a natural resource inven-tory that was to guide future open space andgreenway acquisitions in the community. Theinventory reviewed historic data, existing mapsand field reviewed many parcels that showedpotential for harboring high quality natural areasor species. The areas were ranked, based on theirresemblance to native plant communities. Thisinformation was overlaid on orthophotos, aerialphotographs that are scaled for use with mappeddata, that were provided at community work-shops. Presented in this manner, the developmentpattern could be shaped by the location of thesepre-identified environmental resources.
Wetland Inventory. This inventory combined data from various
information sources to create the most accurate base map,
for planning purposes, of land that was “developable” and
land that was protected by wetland regulations. More
detailed delineations would be required if a development
application was submitted to the watershed district and city.
(Source: City of Blaine Natural Resource Inventory 2000,
Peterson Environmental)
Natural Resource Inventory. This map is one of several
information layers from an inventory that identified and rated
the quality of remnant natural resources, including both upland
and wetland plant communities. (Source: City of Blaine NaturalResource Inventory 2000, Peterson Environmental)
1 mile N
public, upland
private, wetland
public, wetland
private, upland
1 mile N
Lexin
gto
n A
ven
ue
Main Street
Main Street
Lexin
gto
n A
ven
ue

Community Redesign58
This page shows how different interpretationsand representations of data can contribute to abetter understanding of different potential designscenarios. Small group work was summarized ona GIS map that served as an underlay for thediagram on the right. This diagram summarizesthe small group work in a more graphic way,more in keeping with the imprecise nature of theinformation gathered. The information gatheredbecame the basis for an open space and roadnetwork scenario that carries through the idea ofa linear central open space corridor with develop-ment clustered on either side of it.
Lochness
Lake Park
A
B
Analyzing and Interpreting the Place
GIS Summary Map.
Overlaid on an aerial orthophoto,
areas in light hatching are where at
least three of the five groups placed
development.
Graphic Summary Map.
The GIS data was analyzed and
summarized to describe how the groups
were generally describing four different
districts.
Open Space and Road Network
Scenario. The general information gained
from the small groups was then used as a
base to create several scenarios, such as
this example.
Finn Farm District
Greenway
System
Sunset
District
South
Village
Hupp Street
District
Main Street
Lexin
gto
n A
ven
ue S
un
set A
ven
ue
Main Street
Lexin
gto
n A
ven
ue
Su
nset R
oad
A
1-35W
Lochness
Lake Park
Main Street
Lexin
gto
n A
ven
ue
Su
nset A
ven
ue
N1/4 mile
N1/4 mile
N1/4 mile

Chapter Four: Town Scale 59
Exploring Design Scenarios
Overarching Design Principles
Protect and RestoreNatural Systems
Foster Social Connections
Provide Travel Options
Enhance Homes and Neighborhoods
Diversify and Increase theLocal Economy
Three scenarios. Each
column represents a
different approach to
achieving open space,
circulation, and land
use goals.
Protect natural resources.
Plan for urban services throughout.
Development pays infrastructure costs.
Designate areas for commercial/industrial uses.
Provide a diversity of residential types.
Situate land uses in ways that support transit.
Create an interconnected roadway network.
Information gained from the Lochness Neighbor-hood workshops was applied to the MeadowsNeighborhoods by the staff team. Residents and thecity council reviewed the illustrations and thedesign principles that guided each alternative, aswell as associated numbers, such as acreage andunit counts. Based upon their discussion of prefer-ences, a composite scenario for this area, as well asthe other neighborhoods was proposed along witha set of overarching design principles and moredetailed principles for each neighborhood.
Parkway Loop Scenario Neighborhood Network Scenario Connecting Parkway Scenario
Lan
d U
se M
ixC
irc
ula
tio
nO
pen
Sp
ace

Community Redesign60
Moving ForwardThe City of Blaine submitted a comprehensive planamendment that significantly increases the number ofhomes and businesses compared with their original fore-casts that assumed typical, larger lot single family residen-tial platting. By locating roadways and more intensedevelopment away from sensitive sites, the overall areacan accommodate more people and preserve importantnatural areas and systems. Key ingredients to achievingthe adoption of more sustainable development patternswere the following:
• Citizens had the opportunity to engage in hands-onplanning and have an extended, substantive discussionabout the future of their community. While some werenot happy with the outcome, they were informed andinvolved in the process, rather than waiting until apublic hearing to voice their concerns. A key result forproperty owners was an agreement by the currentcouncil that the costs for infrastructure improvementswill be born by the development requesting the hook-up, rather than everyone in the area.
• City staff and elected officials could see how develop-ment could look if guided by principles that beginwith an open space framework to arrange a diversityof transit-supportive land uses. These principles haveguided discussions and negotiations with a largescale development that came forward during theplanning process.
• The number of housing units increased and a greaterdiversity of land uses and housing types was accom-modated. The plan proposes to protect tracts of wood-lands that are adjacent to primary wetland corridors.Streets are connected, yet do not traverse high qualitynatural areas.
The city used the numbers generated from the designscenarios to formulate infrastructure plans. The scenarioswere also used to illustrate a design guide book that waspart of the comprehensive plan amendment. The guide-book spells out for each neighborhood more detaileddesign principles organized into three categories: naturalfeatures and open space, movement systems, and land usemix. In future negotiations with developers, the guidebook will be a document that communicates the intentionsand desires of the community for each of the four neigh-borhoods as they develop over time.
Sample Guidelines: West
Meadows NeighborhoodGoal for Natural Features and Open
Space: Design a connected system of
preserved and created natural areas
and parks throughout all land uses on the
site that are accessible by trails linking to
other existing open spaces.
Design Principles:
• Preserve woodlands where possible.
• Create a system of linear lakes and
larger ponds that are connected.
• Design a primary park as a central
community amenity.
• Allow public access to the water along
most edges.
• Locate new neighborhood parks
along the parkway system; include dry
areas for play.

Chapter Four: Town Scale 61
Case Study
Rethinking a community corridor:
Developing a common vision for Nicollet Avenue
in Minneapolis, Minnesota
Assessing the PlaceNicollet Avenue serves south Minneapolis as acommunity corridor. The roadway provides a north/ south connection for automobile traffic, frequenttransit service, and a pedestrian environment forsurrounding neighborhoods and adjacentbusinesses. Nicollet also functions as the identitystreet for four neighborhoods it passes through;Lyndale, Kingfield, Tangletown, and Windom.Nicollet Avenue and its surroundingneighborhoods are likely to be affected by a numberof outside forces in coming years. Access ramps toI-35W will be moved a few blocks to the east. Awide array of redevelopment proposals along thecorridor have been presented, and there is activeplanning to reconstruct portions of the avenue. Inlight of these activities a single comprehensive planfor the entire corridor was needed.
Engaging CommunitiesA group of concerned residents and businessowners, Citizens for a Sensible Nicollet AvenuePlan (CSNAP), formed to advocate for compre-hensive and coordinated revitalization of NicolletAvenue. The Design Center provided technicalassistance in this process, as well as an urbandesign analysis of the corridor. Design recom-mendations were formulated through review ofseveral iterations of road cross sections, intersec-tion designs, and neighborhood- scaled analysesof the corridor. The CSNAP committee providedinitial review and feedback, and then each neigh-borhood group along the corridor also reviewedand commented on the work.
Kingfield
Neighborhood
Lake Street
Hwy. 62
I-35
W
Downtown
Minneapolis
Nic
olle
t Ave
nu
e
Lake
Calhoun
Lake
Harriet
Lake
Nokomis
Lake of
the
Isles
46th Ave.
Ce
da
r Ave
nu
e
Hw
y 5
5
I-94
Minnehaha Creek
Members of CSNAP and additional neighborhood residents
took a stroll down the avenue to assess existing conditions and
concerns.
1 mile N
Lyndale
Neighborhood
Tangletown
Neighborhood
Windom
Neighborhood

Community Redesign62
Taking Inventory of the LandscapeThe project started by identifying and reviewingother planning initiatives, both completed andongoing, related to the South Nicollet Avenuecorridor, including: Nicollet Avenue Task Force,Minneapolis Public Works Department, I-35WAccess Project, MN DOT Crosstown CommonsProject, and neighborhood redevelopment projects.
Guiding plans and designationsAs an important north/south street in the city’sfabric, Nicollet Avenue was referenced in manydifferent plans. This project sought out all ofthese materials to better understand the differentconstraints, funding and design guidelines thatwould influence future changes. For example, aspart of the Minneapolis Plan, the city’s compre-hensive plan, Nicollet Avenue was designated asa Community Corridor from Lake Street to thecity’s southern boundary. This corridor designa-tion provided transportation and urban designguidelines. In transportation plans, NicolletAvenue was classified as a “B” Minor ArterialRoad and a Municipal State Aid street. Finally,this work used as its basis the Nicollet AvenueTask Force’s Revitalization Plan.
Roadway and traffic conditionsFrom Lake Street to Highway 62, the road’s right-of-way layout and dimensions were inventoried.Existing traffic conditions were obtained from theCity of Minneapolis, including existing averagedaily traffic counts, turning movement counts,spacing of signalized intersections, signal timing,and travel direction.
Walking survey of the street corridorCSNAP members, neighborhood residents, andbusiness owners participated in walking tours ofthe corridor in order to survey the street’s fea-tures, challenges, and opportunities as a group.Neighborhood residents from the Lyndale andWindom neighborhoods conducted trafficsurveys to better understand the type andvolume of automobile traffic and where pedes-trian traffic occurred.
Lyn
da
leK
ing
fie
ldTa
ng
leto
wn
Win
do
m
Lake
Street
35th
38th
42nd
50th
Diamond Lake
Road
Crosstown
(62nd)
35W
31st
60th
58th
36th
46th
I-35W Access
Project
Kingfield-Lyndale
Ad Hoc
Mitigation
Group
Kingfield
Neighborhood
Redevelopment
Project
TangletownNeighborhoodStreet & BridgePlanning
MN DOT
Crosstown
Commons
Project
Existing
Plans and
Projects
1/2 mile N

Chapter Four: Town Scale 63
Lake Street
35th and
36th
38th
46th
50th
60th
Crosstown (62nd)
35W
48th
58th
Diamond
Lake Road
42nd
43rd
31st
This study sought to redesign the roadway bysynthesizing urban design and transportationplanning into a livable street design. First, a streetanalysis was conducted focused on movementand activities at key intersections. The streetanalysis encompassed three street planning areas:roadway, sidewalk, and buildings. Three types of“organizing intersections” were defined and usedto categorize the key intersections along NicolletAvenue. Based upon review of the literature ontraffic management and creating safe, desirablepedestrian environments, key design strategieswere proposed for each type of intersection:
• Neighborhood Destina-tions: Lively business life,especially in early eveningand on weekends.
Key Design Strategies- Facilitate traffic flow to accommodate turning- Create safe pedestrian crossings- Maximize sidewalk width- Organize parking, control access points- Create a common identity with streetscaping
• Neighborhood Amenities:Places that blend residen-tial fabric yet have a fewnotable neighborhoodinstitutions.
Key Design Strategies- Calm traffic- Enhance pedestrian crossings- Create small areas for conversations and
outdoor eating
• Community Destinations:Large scale job and shop-ping hubs that generatehigh activity levels all weekand into the evening.
Key Design Strategies- Create clear internal circulation networks for
pedestrians, bicyclists, and vehicles- Maximize transit amenities- Limit access to parking lots1/2 mile N
Community
Destination
Community
Destination
Neighborhood
Destination
Neighborhood
Destination
Neighborhood
Destination
Neighborhood
Destination
Neighborhood
Amenity
Neighborhood
Amenity
Neighborhood
Amenity
Analyzing and Interpreting the Place

Community Redesign64
Design PrinciplesEnhance the urban forest by greening the avenue.
Ensure a high-quality pedestrian experience.
Balance the needs of residents and business enter-prises.
Balance traffic volumes with quality of life alongthe corridor.
Provide continuity for the driver, but respect theindividual character of neighborhoods and places.
Protect and RestoreNatural Systems
Foster Social Connections
Diversify and Increasethe Local Economy
Provide Travel Options
Enhance Homes andNeighborhoods
Exploring Design ScenariosThrough a series of meetings with individualneighborhoods and with members of Citizens fora Sensible Nicollet Avenue Plan, those inattendance provided feedback on possible plansfor the community corridor. Discussion focusedaround the satisfaction of several sets of criteria.The City of Minneapolis has formally classifiedNicollet as a Community Corridor and as MSA orMunicipal State Aid roadway, making it eligiblefor a certain set of funds. Nicollet is alsoconsidered a ‘B minor’ arterial in the largertransportation network. With each of theseclassifications comes a set of design guidelines forlane widths, turning lanes, setbacks, reactionzones, and speed suggestions. Of greatimportance to the residents and business ownerswere things such as transit access, parking,sidewalks, boulevards, and street trees. Thechallenge all along the corridor was to enhancethe livability of the roadway withoutcompromising its role in moving automobiletraffic north and south through Minneapolis.
Ultimately, the CSNAP committee agreed upon aset of overarching design principles that couldguide improvements along the entire corridor.The final document described the principleslisted below and illustrated more detailedscenarios for how each segment of road sectioncould be retrofitted, using these principles.
Existing tree canopy Boulevard trees-
one row
Boulevard trees -
double row
These scenarios examined the implications of adding street
trees to the area. Based upon an urban tree modeling
program, the biggest improvements in cooling and air
pollution reduction occurred with the addition of a single row
of trees on either side.
100’ N
Nic
olle
t A
ve
nu
e
Nic
olle
t A
ve
nu
e
Nic
olle
t A
ve
nu
e

Chapter Four: Town Scale 65
Moving ForwardCSNAP felt it was urgent to get in front of theseincremental changes with a commitment to along-range plan. To realize this goal and the morespecific improvements recommended in the plan,the committee recommended the following nextsteps:
1) Adopt the CSNAP plan as the blueprint forreconstruction of the avenue.
2) Develop and adopt a reconstruction timetablefor the avenue that is coordinated with otherprojects and plans.
3) Maintain the integrity of the CSNAP plan bycontinuing to involve neighborhoods andcitizens.
4) Select design elements that implement theplan. These include, but are not limited to: streettrees, lighting, street furniture, paving materials,and human-scale public art.
6’ 6’ 10’ 6’11’11’Parking Travel Lane Travel Lane ParkingSidewalk SidewalkBlvd. Blvd.
6’10’
ROW 66’42’G G’
West East
This section shows how a mid-block area could look, minimizing the amount of curb-to-curb paving and gaining room to
plant street trees in the boulevard.
Upon completion of this phase of the project, thecommittee felt that a key to the success of theprocess and future implementation was theinclusion of not only residents and businesses butalso city staff and elected officials. By involvingthese key players, CSNAP participants could hearabout citywide and engineering concerns, andbetter articulate their livability concerns as agroup of neighborhoods with similar goals.
p p y
10’ 11’ 10’ 7’52’
ROW 66’
Left-Turn LaneTravel Lane SidewalkParkingParking7’ 10’ 11’
Travel LaneSidewalkF F’West East
At a neighborhood amenity intersection (58th and Nicollet), elements such as a wider sidewalk and pedestrian scale lighting
are the key pedestrian elements, while a center left turn lane and bus pullovers are accommodated within the street itself.

Community Redesign66

Chapter Five Subregion Scale 67
Chapter Five: The Subregional ScaleIndividual communities can make great strides toward makinggreat places and connecting them, but sometimes critical linkagesand programs can only be achieved by a larger vision or actionplan. When several communities share a resource such as a trans-portation corridor, lake or river, they find great benefits workingtogether as a subregion. In the Twin Cities, subregions have beenself-defined by the communities themselves. The boundaries alsodepend upon the issue of concern. The nature of collaborationvaries from formal “joint powers agreements” to looser coalitionsor partnerships. This handbook highlights case studies from twodifferent subregional efforts that are working toward commongoals. They share the view that collective action is more productivethan competition for scarce resources for community improve-ments. The following principles have been generalized from theguiding ideas that have been developed by these two subregions,who in turn have been informed by other coalitions and partner-ships across the country. They can be a beginning point for newsubregional efforts, and customized for a better local fit. After adescription of subregional scale principles, two metro-area casestudies follow.
Subregional Scale Principles
Protect and Restore Natural Systems
Identify and protect or restore large scale natural assets and
expand linear connections between them where appropriate.
Strengthen Social Connections
Whenever possible, share facilities and services to create
connections between civic leaders and professionals, as well
as the people who use and staff these programs.
Provide Transportation Options
Leverage investments in road networks, transit systems, and
regional trails to maximize the range and efficiency of travel
options. Focus on linkages between town-scale and sub-
regional activity centers: places that have or could have a
high concentration of commercial, business, and housing.
Integrate Land Uses and Economic Activity
Strive to create a diversity of pedestrian and transit-friendly
centers within the subregion, while creating a balance be-
tween job-producing land uses and housing.
Enhance Homes and Neighborhoods
Analyze housing and demographic data across the subre-
gion to identify trends, gaps, and potential opportunities for joint
projects that support the vitality of homes and neighborhoods.
Four cities share a chain of lakes and a
freeway system that have shaped
development patterns. They face
common concerns of sustaining both
their economic vitality while preserving
the environmental features that
attracted homes and businesses to the
area. The box outline shows the location
of the prototypical town scale example
from the previous chapter.
1 mile N
Freeway
Chain
of La
kes

Community Redesign68
Identify and protect or restore large scale
natural assets and expand linear connections
between them where appropriate.
As many subregions seek to strengthen theirattractiveness as a business location, proximity ofenvironmental features to businesses and housingcan be a strong selling point to potential employ-ers. Though abundant locally, water bodies areoften impacted by upstream uses that are undermunicipal control. Cross-border efforts are some-times required to preserve or improve quality.Less obvious are the needs of migratory animalssuch as birds and butterflies that tend to followriver corridors and nearby habitat, without regardfor municipal boundaries. While natural resourceplanning agencies can identify the importantregionally significant natural areas, local collectiveaction is required to protect these assets.
Whenever possible, share facilities and ser-
vices to create connections between civic
leaders and professionals, as well as the
people who use and staff these programs.
Within a subregion, there is enough critical massto support arts organizations, jobs, and housingprograms. People tend to stay within a geo-graphic sector when making their housingchoices. By offering a rich array of cultural andsocial opportunities, a subregion can retain theircitizens, forging lasting ties and bonds to acommunity. This stability can increase the socialcapital of an area, in terms of strong volunteerismand participation—a traditional strength ofMinnesota communities.
Corridors of water and vegetation support the
vitality of regionally important resources.
Schools, shown in black, and lakes, toned in gray, are
often the centers of community life for area residents.
Leverage investments in road networks, transit
systems and regional trails to maximize the
range and efficiency of travel options. Focus
on linkages between town-scale and sub-
regional activity centers: places that have or
could have a high concentration of commer-
cial, business, and housing.
As projects at the neighborhood and town scalebecome more transit-supportive, the ability tohave a more fully integrated transportation systembecomes possible. Similarly, transit-supportivetowns and neighborhood scale development willresult from improvements in transit service.
1 mile N
Major and minor arterials, illustrated above, are
primary focus areas for transit improvements.
Regionally
significant
habitat

Chapter Five Subregion Scale 69
1 mile N
Areas of redevelopment in each city. The cross
hatch is commercial or mixed use, the diagonal
hatch is residential and the vertical hatch is civic.
Strive to create a diversity of pedestrian and
transit-friendly centers within the subregion,
while creating a balance between job-
producing land uses and housing.
There are few “stand alone” cities in the metroarea—most rely on the subregional area tosupply the full range of goods, services andhousing that a thriving economy needs. Theseland uses have been established over time, inresponse to local decisions and regional infra-structure investments such as highways. Com-munities can be more strategic in their develop-ment or redevelopment efforts by knowing whatis happening throughout the subregion andtargeting a unique niche that complements thedevelopment activities of their neighbors.
Analyze housing and demographic data
across the subregion to identify trends, gaps,
and potential opportunities for joint projects
that support the vitality of homes and neigh-
borhoods.
An examination of housing and demographicpatterns can yield information about a variety ofpotential interventions that may add livability tothese neighborhoods. It may be the addition ofmay be a home improvement program thatencourages renovations or maintenance on aparticular housing style that is prevalent, such asthe rambler or split-level walkout.
An inventory of existing housing types, with the darkest
hatch as multi-family, the medium hatch as medium
density, and the lightest hatch as low density
residential.

Community Redesign70
This section presents two case study subregions,each pursuing a more coordinated effort tochange outmoded land use patterns and bring amore diverse palette of investment and livingoptions to their areas. Both these efforts recognizethe need to ensure local or agency autonomywhile allowing the work of one entity to atminimum complement another’s work and atbest create a synergy between the multitude ofactivities taking place in the landscape.
The North Metro I-35W Corridor Coalition casestudy describes an initiative begun by seven citiesstraddling two counties who decided that work-ing together, rather than in competition, wouldprovide mutual benefits. As the name attests thefocus was initially on the transportation issues;however the current effort is a more comprehen-sive look at the entire area comprised by the citiesinvolved. The coalition’s work, guided generallyby livable community goals similar to the generalgoals described in this handbook, has a particularfocus on transportation, housing, and economicdiversification and the synergistic effects betweenthe three.
Initiated by county efforts, the Northwest Corri-dor Partnership is a consortium of cities, thecounty, and institutional entities along a pro-posed bus corridor that follows a county highwayalignment. The focus of this effort was to convenecommunities along the corridor, involving citi-zens and leaders, in a series of visioning andplanning steps targeted toward the intersectionsof each proposed transit stop. The goal was tosupport the transit system, while creating morehumane and diverse environments along acorridor that currently lacks or ignores culturaland environmental features. This process broughttogether partners for individual transit stopdistricts, while convening the entire partnershiptogether for the comprehensive view.
To this point both subregional efforts are rela-tively young but have already brought rewards toparticipating communities. The case studieshighlight the general organization, physicaldimensions, and project results to date of thesetwo efforts to implement strategic changes inland use pattern over a broader landscape.
North I-35W Corridor
Coalition
Northwest
Corridor
Partnership
Subregional-Scale Case Studies
St. PaulMpls.
10 miles N
Northwest Corridor Partnership
Transforming a Highway Corridor into a
Metropolitan Corridor of Districts, Walkable
Centers, and Greenways
North-Metro I-35W Coalition
Charting a new course for a subregion of
seven cities

Chapter Five Subregion Scale 71
Case Study
Northwest Corridor:Transforming a highway landscape to a metropolitan corridor
of districts, walkable centers and greenways
Assessing the SituationOriginally County Highway 81 was a statehighway connecting rural centers with Minne-apolis. Now its role has been supplanted by thenearby freeway system and its adjacent landscapea collection of piecemeal, incremental develop-ment, with little new investment. With the recentturn-back of the road from the state to the county,an opportunity arose to not only reconstruct theroad itself, but to realize long-term visions of thehighway as a transit corridor. At the same time,the county and corridor cities wanted to attractnew investment and accommodate a share of theprojected regional population growth. To reachthis potential, a collaborative process exploredCounty Highway 81 as a metropolitan corridor ofdiverse, walkable centers linked by transit androads, that leveraged strengths, reclaimed naturalresources, offered new housing options, strength-ened neighborhoods, and provided new jobs. Tocoordinate future planning, design and invest-ment in the corridor, an organizational structureemerged and proposed a framework of prin-ciples, strategies, and actions.
Engaging CommunitiesThe process was led by the Northwest CorridorPartnership (NCP), and involved local commu-nity groups as well as the Design Center andtransportation and economic consultants. TheNorthwest Corridor Partnership is a public-private partnership of corridor interests (see mapcaption for the list) chaired by a county commis-sioner. The partnership guided the parameters ofreports and studies, the work of committees, andconsultants. A community advisory committee,made up of official and unofficial city leaders,appointed by each partner, provided feedback oncommunity issues, complemented by technicaladvisory committee made up of staff from part-nership entities. As part of the larger effort,individual workshops were held in each focusarea, with a broader group of local interest groupsinvited to participate. Public open houses were heldon special topics, such as a busway proposal.
The County Highway 81 corridor extends from just north of
downtown Minneapolis through the northwest suburbs,
somewhat parallel to the Mississippi River. Northwest Corridor
Partners include Hennepin County, the cities of Maple Grove,
Osseo, Brooklyn Park, Crystal, Robbinsdale, and Minneapolis,
as well as the Metropolitan Council, North Metro Mayors
Association, four private corporations, and two semi-public
institutions.
Hassan Township
Rogers
Dayton
Champlin
Maple Grove
Brooklyn
Center
Osseo
Crystal
Robbinsdale
Minneapolis
Mississippi River
Brooklyn Park
CSAH 81
“Natural systems have been covered by roads and
buildings. Leftover frontage roads and at-grade freeway
intersections create traffic congestion. Building types
from every era are scattered loosely along the highway.”
(Northwest Corridor Planning & Design Framework, 2002).
5 miles NC
ou
nty
Hig
hw
ay
81

Community Redesign72
Taking Inventory of the LandscapeThese drawings are two examples of the subre-gional scale inventory that was conducted as partof the Planning and Design Framework. The fivecategories of data included: natural systems, roadnetworks, transit services, land use patterns andcommunity jurisdictions.
Public open spacesA survey of the corridor’s existing and proposedpublic parks, open spaces, and trails highlightsboth assets and opportunities for improvement.
While large regional parks anchor each end of thecorridor, the remainder of the corridor containsfragmented parks and natural systems. Corridorredevelopment could reconnect some of theseplaces with the addition of linear open spaces.
A regional trail that connects the large parks isplanned to follow along the County Highway 81alignment. Implementation of the plan requirescities working together in a cooperative agree-ment with the county park district. Links fromthe regional trails through redevelopment areasto existing parks would further leverage existingand proposed investments for parks and trails.
Transit accessAn inventory of existing bus routes and services,as well as regional plans for new transit develop-ment and service restructuring, identified severalopportunities to improve local and corridortransit services. Key opportunities are a pro-posed exclusive busway, increased suburb-to-suburb connections, and TOD.
Existing bus service on CSAH 81 is minimal withnearby West Broadway Avenue serving as theprimary transit corridor, except in Minneapoliswhen the two roads are one and the same.
Urban residential densities and the local streetsystem in Minneapolis support the greatesttransit services. North of Minneapolis, transitserves regional destinations such as colleges andbusiness parks.
elm creek
park reserve
grand rounds
scenic byway
theodore
wirth park
crystal lake
shingle creek
open spaces
Adapted from Metropolitan
Council GIS data 2000.
1 mile N
1 mile N
H
P
Local bus route
CSHA 81
Express bus route
Park and rides
Transit hubs

Chapter Five Subregion Scale 73
Analyzing and Interpreting the PlaceAnalysis of the inventory data revealed thataccess to the corridor is limited by the railroad onthe west side of the road, nearby lakes and creeks,and major land uses including the Crystal Airportand industrial areas. Twelve potential crossroaddistricts represented the highest activity areasalong the corridor, including four suburbandowntowns and the commercial segment of WestBroadway in Minneapolis. Because the corridorstretches across six cities, each potential crossroaddistrict has unique character, issues and opportu-nities, based upon existing development patternsand each city’s future land use plans and reinvest-ment goals. The study reviewed and compared alltwelve districts, then selected four districts toexamine in more depth, including the BrooklynBoulevard case study profiled in neighborhood.
The analysis also revealed the opportunity toreveal many hidden and buried natural resourcesin the process of redevelopment.
Natural resource corridors
that could be highlighted
along the corridor.
osseo district
shingle creek district
ryan creek district
crystal lake district
west broadway
district
ce
ntra
l
brooklyn
bass lake
42nd
em
erso
n
hwy 610h
wy 1
69
I - 94/694
hwy 100
gra
nd
I - 94
Four focus districts, shown in
black, were selected for
more detailed explorations,
to better understand how
local issues intersected with
overall corridor goals.
1 mile N
1 mile N

Community Redesign74
Protect and RestoreNatural Systems
Foster SocialConnections
Diversify and Increasethe Local Economy
Provide Travel Options
Enhance Homes andNeighborhoods
Exploring Design OptionsDesign scenarios in this project were primarilyfocused at the neighborhood or walkable centerscale to gain a comprehensive understanding ofthe diversity of places and issues within this largecorridor. Exploration of alternative urban designoptions at the neighborhood or walkable centerscale provided valuable information for thepossibilities of the overall corridor. Options forthe corridor encompassed:• A proposed busway with alternative right-of-
way alignments and station location,
Corridor Design Principles
Reclaim, enhance, and connect natural systems toincrease local quality of life, sense of place, andenvironmental quality.
Engage regional and local stakeholder groups in amulti-jurisdictional collaborative process toconnect regional system and local place changes.
Create walkable mixed-use district centers atmajor crossroad areas to improve neighborhoodlivability, strengthen surrounding areas, provideemployment growth, and leverage transit devel-opment.
Expand public transit access, options, and con-nections to support evolving land use patterns.
Redesign County Highway 81 as a landscapedmulti-modal boulevard and expand adjacent roadnetworks to increase local connectivity.
Roadway and busway design alternatives
• Roadway redesigns encompassing roadwayspeeds, access, lane configurations, drainage,landscaping, etc.,
• Natural systems enhancements includingdaylighting creeks, greenway development,parks and trails connections, stormwater runoffdesign, and water quality improvements,
• Patterns and types of redevelopment atstrategic locations along the corridor, espe-cially in potential walkable centers at cross-road areas.
20 FEET
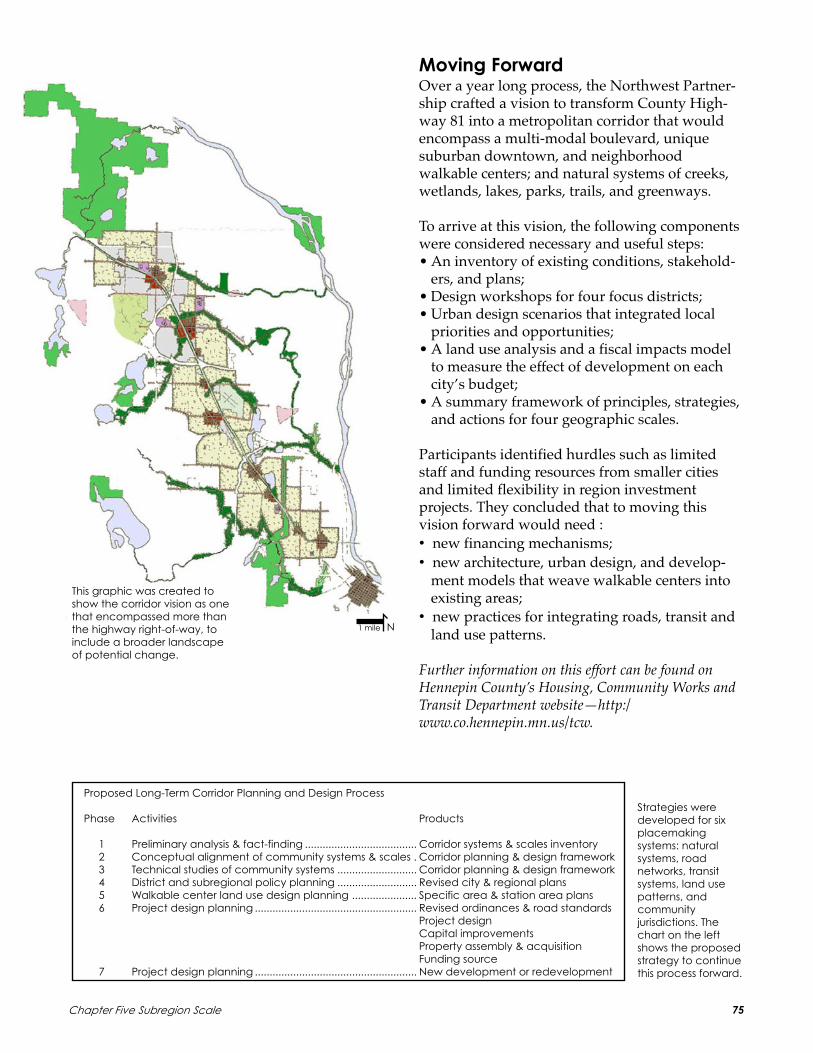
Chapter Five Subregion Scale 75
Moving ForwardOver a year long process, the Northwest Partner-ship crafted a vision to transform County High-way 81 into a metropolitan corridor that wouldencompass a multi-modal boulevard, uniquesuburban downtown, and neighborhoodwalkable centers; and natural systems of creeks,wetlands, lakes, parks, trails, and greenways.
To arrive at this vision, the following componentswere considered necessary and useful steps:• An inventory of existing conditions, stakehold-
ers, and plans;• Design workshops for four focus districts;• Urban design scenarios that integrated local
priorities and opportunities;• A land use analysis and a fiscal impacts model
to measure the effect of development on eachcity’s budget;
• A summary framework of principles, strategies,and actions for four geographic scales.
Participants identified hurdles such as limitedstaff and funding resources from smaller citiesand limited flexibility in region investmentprojects. They concluded that to moving thisvision forward would need :• new financing mechanisms;• new architecture, urban design, and develop-
ment models that weave walkable centers intoexisting areas;
• new practices for integrating roads, transit andland use patterns.
Further information on this effort can be found onHennepin County’s Housing, Community Works andTransit Department website—http:/www.co.hennepin.mn.us/tcw.
Proposed Long-Term Corridor Planning and Design Process
Phase Activities Products
1 Preliminary analysis & fact-finding ...................................... Corridor systems & scales inventory
2 Conceptual alignment of community systems & scales . Corridor planning & design framework
3 Technical studies of community systems ........................... Corridor planning & design framework
4 District and subregional policy planning ........................... Revised city & regional plans
5 Walkable center land use design planning ...................... Specific area & station area plans
6 Project design planning ....................................................... Revised ordinances & road standards
Project design
Capital improvements
Property assembly & acquisition
Funding source
7 Project design planning ....................................................... New development or redevelopment
Strategies were
developed for six
placemaking
systems: natural
systems, road
networks, transit
systems, land use
patterns, and
community
jurisdictions. The
chart on the left
shows the proposed
strategy to continue
this process forward.
This graphic was created to
show the corridor vision as one
that encompassed more than
the highway right-of-way, to
include a broader landscape
of potential change.
1 mile N

Community Redesign76
Case Study
North-Metro I-35W Coalition:Charting a new course for a subregion of seven cities
Assessing the SituationJust north of Minneapolis and St. Paul, sevencities, varying in size, demographic profiles, andland development histories, came together in1996 to sign a joint powers agreement to “jointlyand cooperatively plan for and maximize theopportunities for regional community develop-ment, quality growth, and diversification....” Thegroup was spurred to action by similar issues,such as rising congestion, changing demograph-ics, aging housing stock, diminishing environ-mental quality, and a highly competitive regionaleconomic development market place. Initiallycoming together over issues related to the inter-state that traverses the seven cities, the groupquickly realized that their common desire tomaintain and enhance their city’s quality of liferequired solutions that crossed boundaries anddefied solutions within the purview of each city.At the same time, the challenges seemed ripe forresponse with a livable communities approach, inwhich land use, transportation, housing, social,and environmental issues could be tackled to-gether and in concert with neighboring cities.
Engaging CommunitiesComing together as a group was in some sense aformalization of ongoing collaborations in andamong the cities as well as counties. Sharing ofservices and facilities often took place, but in anad hoc manner. A more formal structure wasdeveloped through the leadership of city mayorsand managers, who received grants from localfoundations and government programs such asthe Metropolitan Council’s Livable CommunityDemonstration Program and collected pro-rateddues from member cities. This seed moneyenabled the coalition to retain an administratorand work with consultants.
A board, with a rotating chair, was composed ofthe mayors and city managers and city adminis-trators. This group met and continues to meetregularly to carry out business and workshops onspecial topics. At the staff level, communitydevelopment directors met monthly to share
The North Metro I-35W Corridor extends from the northern
border of St. Paul in the city of Roseville along actual I-35W
Corridor to the city of Blaine, a developing outer suburb.
Members include the cities of New Brighton, Roseville, Arden
Hills, Shoreview, Mounds View, Blaine, and Circle Pines.
Community partners include Minnegasco, Excel Energy, and
William Energy Services. Ramsey County and Anoka County
have also supported and participated in the coalition since its
inception.
Blaine
Arden Hills
New
Brighton
Circle
Pines
Roseville
Shoreview
Mounds-
View
Mississip
pi R
ive
rRice Creek
I-35W
Lexin
gto
n A
ve
nu
e
I-694
Hwy 10
Hwy 36
information, discuss projects, and review thework of the Design Center and other consultantswho researched and formulated proposals forprojects and future action. Additional task forcesmade up of city staff and elected officials focusedon topics such as GIS coordination, housing,communications, and transportation. The Coali-tion Institute was a later addition—a time whenall participants could gather and focus on a topicfor in-depth discussion not possible at monthlyboard meetings. In addition, city-level briefingsoccur periodically to update councils and plan-ning commissions about coalition initiatives.
5 miles N
ANOKA COUNTY
RAMSEY COUNTY

Chapter Five Subregion Scale 77
���������
�
Existing Land Use of the Coalition
This map combined data from each city
into one coherent base. The capacity of
each city for this work varied widely.
Ultimately a consultant was hired to
implement the project, with an advisory
group of technical staff from the cities
and outside advisors.
Proposed or Recent Developments and
Redevelopments
This inventory was not drawn from
ready-made information. It was based
upon discussions and interviews with
each city, a time consuming but critical
process for future planning. It was later
put into electronic format (digitized).
Neighborhood Centers
This inventory brings together features
such as parks, lakes, and schools—focal
points for community life activity in this
subregion. These locations are of
particular interest when prioritizing
investments for transportation, trail, and
street projects, and reviewing their design.
Inventories are challenging at the subregionalscale, especially when multiple jurisdictions areinvolved, such as counties and school districts.For instance, in the Twin Cities, counties holdparcel data such as land valuations. While twocounties may both use Geographic InformationSystems(GIS), they may use different formats thatare not compatible or have different rules withregard to access and use of their files. While someof the commonly used data is readily available,such as census tract information, it may be out-dated, or not aggregated in a fashion that isuseful for integrated land use, natural resource,and transportation planning.
Creating a common data set underpinned thecoalition work. The data layers were provided byeach city, obtained from public sources, or gath-
Taking Inventory of the Landscape
2 miles N 2 miles N
ered as part of the planning process. The invento-ries became underlays for analyzing wherestrategic investments could be made or whereareas were lacking in amenities that could retainor attract businesses and residents.
There were challenges in creating this sharedinventory. For instance, each city used differentland use designations. To bring them all togetheron one map, a global system was created, witheach city’s designators translated into moregeneral categories. Some of the information wassimply not available in digital form, such ascurrent development projects or locations of trailsand sidewalks. The inventories below representsome of the inventories that were useful in laterstages of planning.
2 miles N
Schools
Lakes
Parks
Housing
Mix of
Land Uses
Community/
Civic
Long
Range

Community Redesign78
Areas and Corridors of Grasslands,
Woodlands, Wetlands and Lakes
Aerial photography showed where
water and vegetation remained in the
coalition area. This analysis suggested
how individual resources could expand
or connect in the future, if restoration
occurred.
Housing Distribution
This analysis sought to determine where
more affordable housing was distributed
across the coalition and where higher
intensity residential was located. This
was used to help determine where
activity centers were located.
Activity Centers
Existing activity centers that could
further be enhanced were identified by
using a screening criteria for each scale
of activity, including the type of existing
land use mix, access to transit or the
regional transportation network, and
intensity of development.
Composite Opportunity Areas
By combining different maps, a
composite picture of potential focus
areas was created. These outlined focus
areas became the starting point for
developing alternative future growth
scenarios for the coalition.
Analyzing and Interpreting the PlaceAnalyzing the information at a subregional scaleinvolved looking at the general goals of thecoalition and starting to answer how futuregrowth and investments could be structured toachieve the goals. The composite opportunitymap summarized different analyses of activityareas, natural resources, existing housing, and theproposed redevelopment areas. This picturestarted to suggest how different scenarios for newgrowth might be created.
2 miles N
2 miles N
2 miles N
NaturalResourceCorridors
Habitat
Patches
2 miles N
Multi-
family
Single
family ,
≤$120,000
Single
family ,
≤$120,000
Neighborhood
(1 mile circle)
Community
(2 mile circle)
Sub-regional

Chapter Five Subregion Scale 79
Coalition Scenario Design PrinciplesProtect and Restore
Natural Systems
Foster SocialConnections
Diversify andIncrease the Local
Economy
Provide TravelOptions
Enhance Homes andNeighborhoods
Balance development with natural resourcesrestoration and conservation.
Focus more intense development in mixed-usecenter and mixed-housing subdivisions.
Create a vertical as well as horizontal land use mix.
Emphasize walkability.
Create a high jobs/housing ratio, with excellentaccessibility and connectivity.
Locate higher densities in the mixed-use centers toincrease transit service, lifecycle housing, and adiverse business mix.
Exploring Design OptionsAfter determining where development or rede-velopment might occur, the study team ran twoscenarios for growth to the year 2020. The “Con-ventional Scenario” was based upon the city’sexisting comprehensive plans. Growth wasprojected as more dispersed, with primarilysingle-use zoning and an average residentialdensity of three units per acre and predominatelysingle-story commercial buildings that had anFAR of 1. The Coalition Scenario assumed transit-oriented development principles such as: moreintense growth along transit corridors, withmixed use zoning, an average housing density offive units per acre, and multi-story commercialbuildings with a Floor Area Ratio (FAR) of 1.5.This modeling was developed by the California-based architecture and planning firm Calthorpeand Associates, who worked with the coalitionand its partners. The Coalition Scenario resultedin a 13% increase in jobs and 23% more people. Ifmore land was protected as open space, then thesame number of people and jobs could be accom-modated on less land, if average residentialdensities increased and FARs increased. In terms oftransportation, while both scenarios increasedcongestion, the Coalition Scenario shows a moreefficient pattern of trip making by reducing thelength of trips, increasing walking trips and increas-ing the number of transit trips. The followingprinciples were used to create the Coalition Sce-nario model:
In the Conventional Scenario, the central area of the
coalition held scattered redevelopment sites that
had been planned as independent projects.
The Coalition Scenario assumed that redevelopment
sites located on transit corridors, represented by the
circles, could be more intensely redeveloped.
N2 miles
2 miles
Community Redesign80
Moving Forward
Creating a Collaborative Planning StructureThe coalition has successfully worked together asa group for several years. Many organizationsand agencies have given resources to this effort:member cities, foundations, local jurisdictions,regional and state departments, agencies, andpartnerships with higher education institutions.Some of the following strategies have created astructure that has survived the challenges of thefluid environment of small city governments.
• A paid, part-time executive director providescontinuity.
• Rotating chairs for board and committeesavoids burn-out and builds ownership.
• Partnership with the university is mutuallybeneficial, by providing on-the-ground testingof innovative ideas.
• Tapping into the unique talents of city stafferson committees and task forces improves thequality and usefulness of consultant work.
• Agreeing upon a shared set of goals andprinciples is a slow process, but a necessarystep to develop, prioritize, and evaluate futureprojects and programs.
Exchanging Information Across MunicipalBoundariesTypically, city staffers and leaders have little timeto look outside the boundaries of their city, butthe monthly community development committeeand board meetings provide a structured settingfor an ongoing dialogue with neighbors.
The shared GIS system is another avenue forinformation exchange now available to large andsmall cities in the coalition. Each city maintainsits own land use classifications that can be foldedinto a common system. The coalition has alsocontracted for more detailed and up-to-datedemographic information than typical censusdata. This information is useful in planning jointprograms that address common problems, suchas housing rehabilitation projects or transitsystems, that are difficult to resolve with theresources of only one city.
Creating a Livable SubregionThe coalition and another adjacent city havepartnered with a non-profit agency to establish ahousing resource center—a one-stop location forinformation on planning, financing, and complet-ing home renovation projects. Because a majorityof housing in the coalition area was built forty tofifty years ago, maintaining and improving thisaging housing stock is a key strategy to maintain-ing metropolitan competitiveness.
Understanding more about the business andemployment dynamic has been another impor-tant task undertaken by the coalition. Gaining up-to-date information, incorporated with betterdemographic data, allows detailed analysis of therelationship between jobs, housing, and transitthat are important to make the network of livablecommunities function together.
The coalition also commissioned a build-outstudy to determine the implications of futuregrowth strategies. This study is paired with astudy that refines the regional transportationmodel used by the metropolitan planning agencyto better measure the effects of different land usestrategies. Overall, the coalition is gaining abetter picture of future alternatives when livablecommunity strategies are deployed across asubregion. The cumulative benefits to all thecities include a larger growth capacity within thesame land area, while preserving important greenspace corridors and open spaces.
Next StepsAs the coalition moves from an organizing andbackground research mode into an action-ori-ented organization, work will continue throughthe “Coalition Institute.” Similar to city councilworkshop sessions, the institute will cover topicsof interest more in-depth than a board or shortcommittee meeting.
The coalition has gained much knowledge abouttheir natural, economic, and human resources.They know how a livable community approach todevelopment and redevelopment can affect theirfuture. Transmitting this information to citycouncils, planning commissions, and citizens willbe the next important step, so that each city’sdecisions on individuals will add up.
For more detailed and up-to-date information on thiseffort, see http:/www.i35w.org

Glossary 81
Glossary
Affordable Housing
Housing that has a sales price or rental value that is accessible to middlemoderate, or low income households. Incomes are defined as a percentageof an area’s median income, so it varies according to that definition fromone area to another. Some subsidies are used to make housing that otherwisewouldn’t be affordable, but not all affordable housing developments aresubsidized (Meck, 2002).
Affordable Housing Development
“Any housing subsidized by the federal, state or local government, or anyhousing in which at least 20 percent of the dwelling units will be sold orrented at prices within the affordable housing standards, for a period of atleast 15 years” (Meck, 2002).
Low-Income Housing
“Housing for rental or ownership purposes whose value is within theaffordable patterns according to the Federal Department of Housing andUrban Development. The price cannot exceed a specified low percentageof the median gross household income (comparing to the same householdsize, in the same region)” (Meck, 2002).
Middle-Income Housing
Housing for rental or ownership purposes that is for occupancy byhouseholds with a gross household income that is greater than a minimumspecified percentage but does not exceed the specified maximum comparingto the median gross household income for households of the same size inthe same region (Meck, 2002).
Moderate-Income Housing
Housing for rental or ownership purposes that is for occupancy byhouseholds with a gross household income that is in between a specifiedmoderate percentage of the median gross household income for householdsof the same size in the same region (Meck, 2002).
Auto-Oriented Development
Urban development based on the use of cars as the main transportationsystem. It commonly includes building orientation to the parking lot andlarge blocks with wide streets (Puget Sound Regional Council, 1999).
Average Daily Traffic (ADT)
“The mean number of vehicles per day passing a given point or using agiven stretch of road” (http://www.planning.org).
This glossary clarifies terms used in the text and in urban planning anddesign more generally.

Community Redesign82
Big Box Retail
Large-scale retail stores, usually one story buildings from 20,000 to 200,000square feet, with a large, adjacent surface parking lot. These stores offerdiscount prices, derived from the centralization of the distribution, and drawcustomers from large surrounding regions. Examples of big box retailinclude: discount department stores, category killers, outlet stores, andwarehouse clubs (Duany Plater-Zyberk & Company, 1999).
Brownfield
Abandoned industrial and commercial sites where redevelopment isimpeded by real or perceived environmental contamination(http://www.sustainable.doe.gov/landuse/infill.shtml).
Bus Rapid Transit (BRT)
A system of buses intended to reduce the travel time as much as possibleby prioritizing their use of the road system. They are more frequent thanregular buses, stop only on a limited number of strategic points, and forcethe traffic lights to be green when they pass by (http://www.mta.com).
Central Business District (CBD)
The business core of a city where retail, offices, and services are mainlyconcentrated it is normally referred to as downtown, but can also be calleduptown or midtown (The Department of Research and Planning, 1954).
Commuter Rail
A rail system using heavy gauge vehicles and tracks that access significantlocations like employment centers or residential areas. It may be local orexpress and it may be accessed by pedestrians and automobiles(U.S. DOT, Federal Transit Administration, 1994).
Comprehensive Plan
A document adopted by a local or regional government that sets forth thegoals, policies, and guidelines that will direct the future physical, socialand economic development of the entire community (Meck, 2002).
Core Commercial Area
Mixed-use commercial areas immediately adjacent to a transit stop. Thecore area should provide small retail stores and local services. A larger coremay include a wider range of commerce and services. A core commercialarea is often associated with a Transit Oriented Development area, but ismore generally just a central shopping area (Calthorpe, 1993).
Density
A term to describe intensity of development that can be measured in a varietyof ways. There are no consistent measures for density and so care must betaken to be sure what is being counted in the land area.
Dwelling Units/Acre
The number of household units per acre of land (The Department of Researchand Planning, 1954).

Glossary 83
0.5 FAR 1 FAR 1.5 FAR
Floor Area Ratio (FAR)
The ratio of total building floor area to parcel area not including the streetarea (Meck, 2002).
Gross Residential Density
The number of household units per total land area including streets, parks,and open spaces (Meck, 2002).
Net Area
The total area of a residential or non-residential zone excluding street rights-of-way, parks, open space, and other public improvements. It is expressedin acres or square feet (Meck, 2002).
Net Residential Density
The number of household units divided by the Net Area in a given area(Net Density=Units/Net Area) (The Department of Research and Planning,1974).
Total Area
The total area of a residential or non-residential zone including street rightof way, parks, open space, and other public improvements. It is expressedin acres or in square feet (Meck, 2002).
Design Speed
The speed selected by planners for a specific intersection or section of roadthat considers the relationship between design features and the plannedfunctions for the road. Influencing characteristics include: the density andcharacter of adjacent land uses; the functional classification of the road;traffic volumes expected to use the road; character of the terrain; andeconomic and environmental considerations (U.S. DOT, Federal HighwayAdministration, 1997).
GreenwayNational Definition: A corridor composed of natural vegetation that canbe used to create connected networks of open space. Greenways helpmaintain ecological integrity in human-dominated landscapes and also helppreserve biological diversity and high-quality water resources (Smith &Hellmund, 1993).
Local Definition: A corridor of open space protected and managed forconservation and/or recreation purposes. They often follow natural landor water features and link natural areas, parks, cultural features, historicsites, and populated areas with each other (Allmann, 1997).
Grayfield
Retail facilities, parking facilities, or areas with a large amount of paving,usually in fairly developed areas, which are in decline and in need ofredevelopment (Congress for New Urbanism and PricewaterhouseCoopers, 2001).
High Occupancy Vehicle (HOV)
A vehicle carrying two or more individuals. Some highways have dedicatedlanes to HOVs during peak commuting hours. HOVs include buses,vanpools, and carpools (Bragado et al, 2001).

Community Redesign84
cluster typical
Housing Definitions
Ancillary Units
A secondary building associated with a residential building on the samelot, or an apartment within a house. The ancillary unit may be rented, butcannot be sold separately. Granny flats, backyard cottages, and garageapartments are different types of ancillary units (Duany Plater-Zyrberk &Company, 1999).
Cluster Development
Neighborhood development in which the lot size is reduced from standardzoning requirements in order to preserve surrounding open space(Department of Research and Planning, 1974).
Large Lot Housing
Single family homes sited on parcels larger than 1 acre resulting inrelatively low densities. Many times these developments have on-siteseptic and water systems.
Live-Work Units
A building in a residential area containing commercial or office spaceslocated on the ground floor and residential units above. The commercialor office space may be leased to others or a home-based business(http://www.lcinitiative.org).
Small Lot Housing
A good way of increasing density is to develop small lot housing. The sizeof the housing unit may be the same as in a regular large lot situation, butthe reduction of the lot size permits a more efficient use of land. There areseveral examples of small lot housing: narrow-lot, wide-lot, twin-homes,and zero-lot-line.
Narrow-Lot Concept
The narrower side of the lot and consequently the narrower sideof the house are facing the street.
Wide-Lot Concept
The wider side of the house and consequently the wider side ofthe lot face the street.
Zero-Lot-Line
One side of the house is attached to the side lot limit (Arendt, 1994).
Twin-Homes
Two individually owned houses are placed on the limit of the lotsand share a wall (Arendt, 1994).
Town Homes
A single family house that shares walls on the side lot lines. The facades ofseveral homes are continuous as a single street wall and are sometimesserved by alleys on the backside.
Household
The individual or individuals (related or not) living in a common dwellingunit (Meck, 2002).

Glossary 85
Infill Development
The development of new homes, commercial and retail buildings, and publicfacilities on unused or under-utilized lands in pre-existing urbancommunities (Urban Land Institute, 2000).
Land-Use
A classification of a portion of land based on the buildings and/or theactivities on it. “Usually classified as either residential, commercial,industrial, public, or open space” (SNO-TRAN, 1993).
Light Rail Transit (LRT)
High speed, high capacity, and frequent rail service of shorter passengertrain units. This rail system has shorter units on lighter gauge rails than theheavy gauge rail system (Tri-Met, 1995).
Livable Communities
A community that possesses many of the characteristics of livability (seebelow) (National Academy Press, 1997).
Livability
Characteristics in a community that affect quality of life such as adequateand affordable housing, safe neighborhoods, a clean and healthy environment,sustainable employment, transportation options, recreational opportunities,and a sense of place (Transit Cooperative Research Program, 1997).
Mixed-Use Development
Development that assembles various land-uses into the same area in orderto increase density, reduce the use of cars, bring a more diverse group ofusers, and increase transit ridership (http://www.sustainable.doe.gov).
Natural Areas
A natural site largely unaltered by modern activity where native vegetationis distributed in naturally occurring patterns (Allman, 1997).
Neighborhood
a) A geographic area delineated by physical boundaries that containscontiguous residential lots where people live in close proximity each otherb) The social interaction of people who live in close proximity and alsoparticipate within the same social institutions (The Department of Researchand Planning, 1974).
Neighborhood Center
The focal point of an urban neighborhood. The neighborhood center comesin various shapes and sizes, but is generally a neighborhood with a mixeddevelopment including housing, local businesses, and jobs.
Overlay District
A zoning process in which the allowable land uses are modified or replacedby specific requirements in addition to established ones in order to getspecifically oriented development. This new district is overlaid on existingzoning - hence the name (Bragado et al, 2001).

Community Redesign86
Parking Management
Active management of the supply, operation, and parking demand in a givenarea (SNO-TRAN, 1993).
Parking minimums and maximumsParking Minimums
The amount of parking developers are required to provide as specifiedby zoning codes (Metropolitan Council, 2000).
Parking Maximums
Limits the amount of parking developers may provide as specified byzoning codes (Metropolitan Council, 2000).
Parking TypesBuildingside Parking
Parking adjacent to the building which it serves (Duany Plater-Zyrberk &Company, 1999).
Park-n-Ride
Facilities that provide a large amount of parking for transit users. They areusually located along major arterial roads, and close to transit hubs (U.S.DOT, Federal Transit Administration, 1994).
Shared Parking
Parking facilities shared by multiple users during different periods of theday or week. The several users’ need for the parking space is coincidentalin location but not in time, so their interests in sharing it are assured (e.g.church and office building) (U.S. DOT, Federal Transit Administration, 1994).
Street Parking
A single line of parking along a curb, between the street and the sidewalk,and accessible directly from the traffic lane (Duany Plater-Zyrberk &Company, 1999).
Structured Parking
Two or more decks of parking either alone or integrated into a building.Structured parking greatly increases parking density over surface lots andfrees up land for other uses (U.S. DOT, Federal Transit Administration, 1994).
Pedestrian Oriented Development (POD)
Process of urban development in which the main concerns are to givepedestrians enough street quality for walking and to provide public transitas an alternative to driving (SNO-TRAN, 1993).
Ped Shed
A mapping of the area accessible within a five or ten-minute walk from anactivity center or transportation stop (http://www.cnu.org).
Planned Unit Development (PUD)
An area that is planned with a mix of uses or intensities that vary from asingle zoning designation. PUDs are intended to allow enough flexibility togain environmental or other quality of life benefits that wouldn’t be possiblewith standard zoning classifications (Meck, 2002).

Glossary 87
Public Housing
Public housing provides safe and sufficient rental housing for eligiblehouseholds including low-income families, the elderly, and the disabled.The U.S. Department of Housing and Urban Development (HUD) givesfunds to local housing agencies and they manage housing for residents inneed of public housing (http://www.hud.gov).
Public Space/Use
Land used for recreation by the public. This space can help give a communityidentity and has both economical and aesthetic benefits. Some examples ofpublic space include: playgrounds, sports fields, parks, beaches, and publicgardens (Western Australian Planning Committee, 1997).
Residential Areas
Areas dominated by housing.
Right-of-Way (ROW)
The portion of public land reserved for road circulation, rail service, or otherutility services (U.S. Department of Transportation, Federal TransitAdministration, 1994).
RoadsBoulevard
a) A large street usually with green medians and flanked by parking,sidewalks, and parkways (Duany Plater-Zyrberk, 1999).b) The strip of land between the edge of the street and the sidewalk that isoften planted with grass, trees, and other types of vegetation is also calledboulevard or parking strip (Duany Plater-Zyrberk, 1999).
Parkway
Public roadway planned as an extensive park. It serves both the routefunction and the recreational one. It’s right-of-way width may vary and bewider than a typical street to accommodate more greenspace in a medianor along the side of the road. Typically truck or bus traffic is not allowed(The Department of Research and Planning, 1974).
Sense of Place
A sense of place includes the unique physical and sound qualities that setone place apart from other parts of the world (http://www.smartgrowth.org).
Setback
The distance between the property line and the edge of a building. It isgenerally regulated by local zoning codes (Bragado et al, 2001).
Shopping Center
A large building incorporating multiple stores with shared side walls andwith at least one anchor store. The surface parking is usually located betweenthe building and the street. More generically, a shopping center can be acluster of shops (SNO-TRAN, 1993).
Power Center
A large shopping center, ranging from 250,000 to 750,000 square feet, withlarge stores taking up from half to all of the center (SNO-TRAN, 1993).

Community Redesign88
Lifestyle Center
An open air shopping center, ranging from 150,000 to 500,000 square feet,with at least 50,000 square feet devoted to national chain stores. Many ofthese centers do not have an anchor store and attempt to recreate amarketplace or “Main Street” atmosphere (http://www.icsc.org).
Regional Center
A very large shopping center, usually over 400,000 square feet, includingat least two anchor stores. Regional malls usually have two or three floors,and the arcades are enclosed. Regional malls are usually located near amajor freeway and offer a large range of parking (SNO-TRAN, 1993).
Strip Mall
Auto-oriented, single-story shopping center located along a major arterialroad. Strip malls offer a large amount of parking in front of the buildingstrip (SNO-TRAN, 1993).
Single Occupancy Vehicle (SOV)
A vehicle carrying one person, usually a private vehicle (Bragado et al, 2001).
Smart Growth
Process of urban planning based on taking advantage of the infrastruc-tures, protecting the natural environment, propelling public transit,getting cities to sharing interests, and engaging people from the variousfields of interest in the process of planning (Metropolitan Council, 2000).
Sprawl
Urban development usually around the edges of metropolitan areas. Sprawlgenerally contributes to increases in congestion and vehicle miles traveledbecause the distances between homes and services or commerce areextremely great, forcing people to rely solely on automobiles fortransportation (Bragado et al, 2001).
Standard Land Use Colors
A typical palette for land use maps is yellow and orange for residential,with yellow typically representing single family and shades of orangerepresenting higher densities. Red represents commercial. Gray representsindustrial and blue represents public or quasi-public uses such as churches.Green shades represent such categories as parks, open space, and agriculture(Urban Planning and Design Criteria, 1982).
StreetsArterial Streets
A street for high volumes of vehicular transit with controlled access andprohibited on-street parking. The right-of-way may be 80 to 100 feet wide.
Collector Streets
Streets that connect minor streets and arterial streets or highways andsometimes provide on-street parking depending on the street’s width. Theright-of-way may be 50 to 80 feet wide (U.S. DOT, Federal TransitAdministration, 1994).

Glossary 89
Local Streets
Streets that are mainly used to access neighboring properties and buildings,usually providing on-street parking. The right-of-way may be 50 to 60 feetwide (U.S. DOT, Federal Transit Administration, 1994).
Street Furniture
Public amenities, such as lights, benches, signs, bus shelters, kiosks, and thelike, which line streets (Department of Research and Planning, 1974).
Suburban Downtown
Commercial and residential districts that are built new or redeveloped toresemble city downtowns at a smaller scale (http://www.mnsmartgrowth.org).
Superblock
A neighborhood layout where the street grid is removed to create largeopen spaces between the buildings (Salama, 1999).
Sustainability
There are many definitions of sustainability but they generally involve theequitable preservation of quality of life for all the residents in a specific areathrough a focus on the sense of place, transit, walkability, and healthydevelopment of the area and achieved by planning and maintaining overtime (http://www.mnplan.state.mn.us).
Traditional Neighborhood Development (TND)
Development based on human scale design with concerns for walkability,increasing density, a mix of uses, and reducing automobile usage (State ofNorth Carolina Department of Transportation, 2000).
TransitBus Transfer Station
Transfer station in which users make connections from bus to bus (Calthorpeand Associates, Mintier and Associates, 1996).
Mass Transit
Transportation services that move large numbers of people. Routes usuallyfollow established schedules.
Transfer Station
A transit stop in which users shift from one type of transportation to another(Calthorpe and Associates, Mintier and Associates, 1996).
Transit Stop
A bus transfer station, a light rail stop, or a local transit center.
Transit Oriented Development (TOD)
Development that encourages more efficient use of land and publicinfrastructure in order to get people to walk or take transit. For TOD towork, distances between homes, commerce, and services must be within aquarter-mile walk of a transit stop and include mixed-use development(Calthorpe, 1993).

Community Redesign90
Trip
A one-way movement from a starting location to a final destination (U.S.DOT, Federal Transit Administration, 1994).
Trip Ends
The total number of trips entering and leaving a specific place in a givenperiod of time (U.S. DOT, Federal Transit Administration, 1994).
Trip Generation
The total number of trip ends produced by a specific place (U.S. DOT, FederalTransit Administration, 1994).
Trip Linking
A trip that includes stops in several intermediate locations before reachingthe final destination. Smaller trips included in a major one (U.S. DOT, FederalTransit Administration, 1994).
Urban Development
Development at an intensity such that land can no longer be considered usablefor agriculture or other natural resource-based production (Meck, 2002).
Urban Growth Area
A specific area where urban development is encouraged with concerns forfuture compatible uses. It usually follows the directions of a comprehensiveplan. Urban development is discouraged outside the delimited urbangrowth area (Calthorpe and Associates, Mintier and Associates, 1996).
Urban Growth Boundary
The perimeter delimiting an urban growth area (Meck, 2002).
Urban Services
Centralized facilities and utilities such as sewer and water that are providedto meet the needs associated with urban development (Meck, 2002).
Vehicle Miles Traveled (VMT)
An average number that translates the total number of miles traveled in anautomobile per individual in a given area. The higher the VMT value, themore pollution and traffic. In the past twenty years, VMT has increasedsignificantly as auto-oriented development has become predominant inmetropolitan areas (U.S. DOT, Federal Transit Administration, 1994).
Walkability
The provision of safe and comfortable walking facilities for pedestrians,such as sidewalks, as well as block configurations that allow a network ofconnections through a neighborhood rather than auto-oriented superblocks(http://www.smartgrowth.org).
Walkability Analysis
This analysis measures “the actual area within a five-minute walkingdistance as a percentage of the theoretical area within a five-minute walkingdistance” of a town center or transit stop. “The theoretical five-minutewalking distance is shown as a circle with a radius of a quarter mile (1320feet) drawn around a particular center. This is an area of 125 acres.Calculating a ten-minute walking distance, the radius used is half a mile or

Glossary 91
2640 feet, resulting in a circle with an area of 500 acres. The higher thepercentage, the better the walkability of an urban area. A good target for awalkable catchment is to have 60% of the area within a five-minute walkingdistance, or within ten minutes in the case of major transit stops.” To makethe calculation, starting from the center point of the half-mile radius, measureone quarter mile down the center lines of streets and mark. Shade areaswithin blocks that have access to these marked streets, and calculate thearea (Transportation Tech Sheets, Congress for the New Urbanism).
Walkable Area
An area that ensures the interests of pedestrians by providing the necessaryconditions for walking without obstacles (The Department of Research andPlanning, 1974).
Wetland
“Wetlands” means lands transitional between terrestrial and aquatic systemswhere the water table is usually at or near the surface or the land is coveredby shallow water. For purposes of this subpart, wetlands must: (1) have apredominance of hydric soils; (2) be inundated or saturated by surface wateror groundwater at a frequency and duration sufficient to support aprevalence of hydrophytic vegetation typically adapted for life in saturatedsoil conditions; and (3) under normal circumstances, support a prevalenceof hydrophytic vegetation (Minnesota Rules, chapter 8420.0103 subp. 52).
Wildlife Corridors
“An area of continuous vegetation designed to promote movement ofwildlife between isolated natural areas”; “a sense of patches of naturalvegetation that may serve as “stepping stones” that provide cover andpromote movement of wildlife between natural areas” (Allman, 1997).
Woodland
A large portion of land containing mainly trees and woody shrubs, grassand other types of vegetation. Woodlands are smaller than forests and mightbe inside urban areas (The Department of Research and Planning, 1974).
Zoning
“The division of a community by ordinance into zones or districts, prima-rily for the purpose of regulating the use of land. (…) Zoning is generallyundertaken by local governments under the authority of police power forthe purpose of promoting the health, safety, and general welfare of thepeople of the community” (Department of Research and Planning, 1974).

Community Redesign92

93Bibliography
1000 Friends of Oregon. 1997. Making the Connections: A Summary of the LUTRAQ Project Vol. 7.Portland, OR.
Allmann, Laurie. 1997. Natural Areas: Protecting A Vital Community Asset. Minnesota Departmentof Natural Resources, Natural Heritage and Nongame Research Program, Jamestown, ND.
American Planning Association. 1999. Planning Communities for the 20th Century. Washington, DC.
Appleyard, Donald. 1981. Livable Streets. University of California Press. Berkeley, CA.
Arendt, Randall et al. 1994. Rural By Design: Maintain Small Town Character. American PlanningAssociation. Chicago, IL.
Arendt, Randall G. 1996. Conservation Design for Subdivisions: A Practical Guide to Creating OpenSpace Networks. Island Press. Washington, DC.
Arendt, Randall. 1999. Growing Greener: Putting Conservation into Local Plans and Ordinances. IslandPress. Washington, DC.
Arrington, G. B. 1995. Beyond the Field of Dreams: Light Rail and Growth Management in Portland. Tri-Met. Portland, OR.
Batcholomew, Keith. 1995. Making the Land Use, Transportation, Air Quality Connection (LUTRAQ) -Freeways or Communities: It’s Your Choice. 1000 Friends of Oregon. Portland, OR.
Beimborn, E., H. Rabinowitz et al. 1991. Guidelines for Transit Sensitive Suburban Land Use Design.Center for Urban Transportation Studies. University of Wisconsin-Milwaukee. Milwaukee, WI.
Beyard, M. and M. Pawlukiewicz. 2001. Ten Principles for Reinventing America’s Suburban Strips.Urban Land Institute. Washington, DC.
Bragado, N., A. Perrle and P. Zykofsky. 2001. Building Livable Communities: A Policymakers Guide toInfill Development. The Center for Livable Communities, Local Government Commission. Sacra-mento, CA.
Bragado, Nancy, Alison Perrlee, and Paul Zykofsky. 2001. Building Livable Communities APolicymakers Guide to Infill Development. The Center for Livable Communities, Local GovernmentCommission. Sacramento, CA.
Burrington, S., B. Heart et al. 1998. City Routes, City Rights: Building Livable Neighborhoods and Envi-ronmental Justice by Fixing Transportation. Conservation Law Foundation. Boston, MA.
Calthorpe Associates and Mintier & Associates. 1990. Transit-Oriented Development Design Guide-lines. Sacramento County Planning & Community Development Department. San Francisco, CA.
Calthorpe, Peter. 1993. The Next American Metropolis: Ecology, Community and the American Dream.Princeton Architectural Press. New York, NY.
Bibliography

94 Community Redesign
Cambridge Systematics, Calthorpe Associates, 1000 Friends of Oregon et al. 1991-1997. Making theLand Use Transportation Air Quality Connection, Vol. 1-8.1000 Friends of Oregon. Portland, OR.
Capital Metropolitan Transportation Authority. 1995. Land Use and Transportation: Strategies for aSustainable Future in the Austin Metropolitan Area. Capital Metropolitan Transportation Authority.Austin, TX.
Carlson, D. and D. Billen. 1996. Transportation Corridor Management: Are We Linking Transportationand Land Use Yet? Institute for Public Policy and Management, Graduate School of Public Affairs,University of Washington. Seattle, WA.
Cervero, Robert. 1998. Transit Villages in California: Progress, Prospects, and Policy Reforms. Institute ofUrban and Regional Development, University of California Berkeley. Berkeley, CA.
City of Hutchinson, MnDOT, and R. Finn. 1993. Bicycle & Pedestrian Friendly Development: SeminarProceedings October 18-19, 1993. Hutchinson, MN.
City of Portland, DOT Engineering and Development. 1998. Portland Pedestrian Master Plan. Port-land, OR.
Clinton-Gore Administration. 2000. Building Livable Communities: Sustaining Prosperity, ImprovingQuality of Life, Building a Sense of Community.
Congress for the New Urbanism, Inner City Task Force. 2000. Principles for Inner City NeighborhoodDesign. San Francisco, CA.
Congress for the New Urbanism, Transportation Task Force. 1998. Transportation Tech Sheets. SanFrancisco, CA.
Congress of the New Urbanism and Pricewaterhouse Coopers. 2001. Greyfields into Goldfields: FromFailing Shopping Centers to Great Neighborhoods. San Francisco, CA.
Conrad, Lawrence M., S.N. Seskin and Parsons Brinckerhoff Quade & Douglas. 1998. The Costs ofAlternative Land Use Patterns with The Full Costs of Alternative Land Use Patterns. Portland, OR.
de Chiara, Joseph and L. Koppelman. 1982. Urban Planning and Design Criteria. Van NostrandReinhold Company. New York, NY.
Department of Planning and Development, City of Toronto. 1996. Preserving NeighbourhoodStreetscapes: Parking Solutions for Low Density Residential Neighbourhoods. Toronto, Canada.
Department of Public Works and the Environment, City of Toronto. 1996. Solutions for Front YardParking and Boulevard Parking to Preserve Neighbourhood Streetscapes. Toronto, Canada.
Department of Research & Planning, City of Duluth. 1974. The Language of Open Space: A Glossary tohelp you say exactly what you mean. Duluth, MN.
Design Center for American Urban Landscape, Meyer, Mohaddes Assoc.2001. Design and Develop-ment Principles for Livable Suburban Arterials. Minnesota Department of Transportation. St. Paul, MN.
Design Center for American Urban Landscape. 1993. Farmington, MN: A Case Study in IntegratingUrban Design and Ecology. DCAUL. Minneapolis, MN.

95Bibliography
Design Center for American Urban Landscape. 1993. Tracing the Community Connections of PhalenCreek and Trout Brook: A Case Study integrating Urban Design and Ecology. DCAUL. Minneapolis, MN.
Design Center for American Urban Landscape. 1994. Building Community Across the Corridor: A NewParkway Model for Chanhassen, MN. DCAUL. Minneapolis, MN.
Design Center for American Urban Landscape. 1996. Bassett Creek Wetland Park: Redevelopment in aLandscape of Wetland Soils. DCAUL. Minneapolis, MN.
Design Center for American Urban Landscape. 1996. Making Housing Home. DCAUL. Minneapolis,MN.
Design Center for American Urban Landscape. 1997. Crystal Greenway Neighborhood: A High Ame-nity Mixed Use Development. DCAUL. Minneapolis, MN.
Design Center for American Urban Landscape. 1999. Creating a Landscape in the Pleasure CreekNeighborhood. DCAUL. Minneapolis, MN.
Design Center for American Urban Landscape. 2000. 89th Avenue NE Road Design Initiative.DCAUL. Minneapolis, MN.
Design Center for American Urban Landscape. 2000. Engaging Local Communities for RegionalChange: North Metro I-35W Corridor Coalition. DCAUL. Minneapolis, MN.
Design Center for American Urban Landscape. 2000. I-35W Coalition Subregional Growth Study Vol.1,2 & 3. DCAUL. Minneapolis, MN.
Design Center for American Urban Landscape. 2000. Summary Report Blaine Dialogue on the North-east Corner: DCAUL. Minneapolis, MN.
Design Center for American Urban Landscape. 2002. Nicollet Avenue Urban Design and Transporta-tion Plan. DCAUL. Minneapolis, MN.
Design Center for American Urban Landscape. 2002. Northwest Corridor Planning & Design Frame-work: Transforming County Highway 81 into a Metropolitan Corridor. DCAUL. Minneapolis, MN.
Dramstad, W., J Olson and R. Forman. 1996. Landscape Ecology Principles in Landscape Architectureand Land-Use Planning. Island Press. Washington, DC.
Duany, Plater-Zyberk & Co. 1999. The Lexicon of the New Urbanism. Miami, FL.
Duany, Plater-Zyberk & Co. and Dover Kohl & Partners. 1998. Downtown Kendall Master Plan.Kendall Council of Chamber SOUTH. Kendall, FL.
Elkins, Scott and K. Hiller. 1999. Growing Smart in Minnesota: A preliminary report. 1000 Friends ofMinnesota. St. Paul, MN.
Ewing, Reid. 1996. Best Development Practices. American Planning Association. Chicago, IL.
Ewing, Reid. 1997. Transportation & Land Use Innovations: When You Can’t Pave Your Way Out ofCongestion. American Planning Association. Chicago, IL.

96 Community Redesign
Greater Minnesota Housing Fund and Cermak Rhoades Architects. 2001. Building Better Neighbor-hoods: Creating Affordable Homes and Livable Communities. St. Paul, MN.
Institute of Traffic Engineers. 1999. Traffic Calming. Washington, DC.
ITE Technical Council Committee 5A-5. 1994. Design and Safety of Pedestrian Facilities. Washington, DC.
ITE Technical Council Committee 5A-5. 1998. Design and Safety of Pedestrian Facilities. Washington, DC.
Kaplan, R., Kaplan, S. and R. Ryan. 1998. With People in Mind: Design and Management of EverydayNature. Island Press. Washington, DC.
Labaree, Jonathan. 1992. How Greenways Work: A Handbook on Ecology. National Park Service.Ipswich, MA.
Lalani, Nazir and ITE Pedestrian & Bicycle Task Force. 2001. Alternative Treatments for At-GradePedestrian Crossings. Washington, DC.
McCoy, D., Sanderson. L. and J.D. Goins. 2000. Traditional Neighborhood Development (TND) Guide-lines. North Carolina Department of Transportation. Raleigh, NC.
McNulty, Robert. 1999. Community Accomplishing a Place-Based People Strategy for Community Revi-talization: Empowerment Manual. Partners for Livable Communities. Washington, DC.
Meck, Stuart. 2002.Growing Smart Legislative Guidebook. American Planning Association. Wash-ington, DC.
Meeky, Blizzard. 1996. Creating Better Communities: The LUTRAQ Principles, Land Use, Transportation& Air Quality. Sensible Transportation Options for People (STOP). Portland, OR.
Metro Regional Services.1997. Creating Livable Streets: Street Design Guidelines for 2040. Metro Re-gional Services. Portland, OR.
Metropolitan Council. 2000. Planning More Livable Communities with Transit-Oriented Development:Guidebook on Smart Growth. St. Paul, MN.
Metropolitan Transportation Commission. 1996. Moving Toward More Community-Oriented Transpor-tation Strategies for The San Francisco Bay Area: A Resource Guide. Oakland, CA.
Minnesota Rules, chapter 8420.0103 subp. 52.
Minnesota Dept. of Transportation. 1996. Minnesota Bicycle Transportation Planning and DesignGuidelines. Minnesota Department of Transportation. St. Paul, MN.
Minnesota Planning Environmental Quality Board. 2000. From Policy to Reality: Model Ordinances forSustainable Development. St. Paul, MN.
Municipal Research & Services Center of Washington. 1995. Creating Transit Supportive Regulations:A Compendium of Codes, Standards & Guidelines. King County, WA.
New Urbanism News. 2001. New Urbanism: Comprehensive Report & Best Practices Guide. Ithaca, NY.

97Bibliography
Newman, Oscar. 1972. Defensible Space: Crime Prevention through Urban Design. The MacMillanCompany. New York, NY.
Oregon Department of Transportation and Oregon DLCD. 1999. Main Street when a highway runsthrough it: A Handbook for Oregon Communities. Portland, OR.
Otak. 1997. Pedestrian Facilities Guidebook: Incorporating Pedestrians Into Washington’s TransportationSystem. Washington State Department of Transportation. Seattle, WA.
Parsons Brinckerhoff Quade & Douglas and ECONorthwest. 1998. The Full Social Costs of AlternativeLand Use Patterns: Theory, Data, Methods and Recommendations. Portland, OR.
Partners for Livable Communities. 2000. The Livable City, Revitalizing Urban Communities. McGraw-Hill. New York, NY.
Project for Public Spaces. 2000. How Transportation and Community Partnerships are Saving America:Part II Streets and Roads. American Association of State Highway and Transportation Officials.Washington, DC.
Project for Public Spaces. 2000. How Transportation and Community Partnerships are Saving America:Part I Transit Stops and Stations. American Association of State Highway and Transportation Offi-cials. Washington, DC.
Puget Sound Regional Council. 1996. Developing Your Center: A Step-by-Step Approach. Seattle, WA.
Rabinowitz, Harvey et al. 1991. The New Suburb. Center for Urban Transportation Studies, Univer-sity of Wisconsin-Milwaukee. Milwaukee, WI.
Regional Plan Association. Regional Center Partnership of Somerset County. 1999. Somerset CountyRegional Center Vision Initiative. Regional Plan Association. Somerset County, NJ.
Regional Transportation Commission of Washoe County. 1992. Planning for Transit: A Guide forCommunity & Site Planning. Washoe County, NV.
Regional Transportation District (RTD). 1995. Creating Livable Communities: A Transit Friendly Ap-proach. Denver, CO.
Rood, Timothy. No date. Ped Sheds. In Transportation Tech Sheets. Edited by Transportation TaskForce, Congress for the New Urbanism. San Francisco, CA.
Salama, Jerry. 1999. Redevelopment of Distressed Public Housing, The: Early Results from Hope IV Projectin Atlanta, Chicago, and San Antonio. The Fannie Mae Foundation. Washington, DC.
Sauer, Leslie and Andropogon Associates. 1998. The Once and Future Forest. Island Press. Washing-ton, DC.
Seattle Planning Department. 1994. The Mayor’s Recommended Comprehensive Plan Toward a Sustain-able Seattle. Seattle, WA.
Sierra Business Council. 1997. Planning for Prosperity: Building Successful Communities in the SierraNevada. Sierra, NV.

98 Community Redesign
Skidmore, Owings & Merrill, Lehr & Associates et al. 1994. Planning for Transit-Friendly Land Use: Ahandbook for New Jersey Communities. Federal Transit Administration. Washington, DC.
Small Town Center, Mississippi State University. 1998. CREATE Common Ground: Promoting Collabo-ration Between Mississippi Communities. Jackson, MS.
Small Town Center, Mississippi State University. 2000. The Small Town Center. Jackson, MS.
Smith, D. and P. Cawood Hellmund, ed. 1993. Ecology of Greenways. University of Minnesota Press.Minneapolis, MN.
Smith, S., K. Opiela, L. Impett et al. 1987. Planning and Implementing Pedestrian Facilities in Suburbanand Developing Rural Areas Research Report: National Cooperative Highway Research Program Report294A, 294B. Transportation Research Board. Washington, DC.
Snohomish County Transportation Authority (SNO-TRAN). 1993. A Guide to Land Use and PublicTransportation, Volume II: Applying the Concepts. Lynnwood, WA.
Snohomish County Transportation Authority (SNO-TRAN). 1994. Creating Transportation ChoicesThrough Zoning. Lynnwood, WA.
State of North Carolina Department of Transportation. 2000. Traditional Neighborhood Development(TND) Guidelines. Raleigh, NC
Transit Cooperative Research Program. 1997. The Role of Transit in Creating Livable MetropolitanCommunities. TCPR Report 22. National Academy Press. New York, NY.
Transit Cooperative Research Program. 1997. The Role of Transit in Creating Livable MetropolitanCommunities: TCPR Report 22. National Academy Press. New York, NY.
Tri-County Metropolitan Transportation District of Oregon (TRI-MET). 1995. Planning and Designfor Transit Handbook: Guidelines for Implementing Transit Supportive Development. Portland, OR.
U.S. Department of Transportation, Federal Highway Administration. 1997. Flexibility in HighwayDesign. U.S. Department of Transportation, Federal Highway Administration. Washington, DC.
U.S. Department of Transportation, Federal Transit Administration. 1994. Planning for Transit-Friendly Land Use: A handbook for New Jersey Communities. Prepared for the Administration, Wash-ington, DC.
Untermann, Richard. 1984. Accommodating the Pedestrian: Adapting Towns and Neighborhoods forWalking and Bicycling. Van Nostrand Reinhold Company. New York, NY.
Urban Land Institute. 2000. The Smart Growth Tool Kit: Community Profiles and Case Studies to AdvanceSmart Growth Practices. Urban Land Institute. Washington, DC.
Vanderslice, Ellen et al. 1998. Portland Pedestrian Design Guide. City of Portland, Department ofTransportation, Engineering and Development. Portland, OR.
Weissman, S. and J. Corbett. 1992. Land Use Strategies for More Livable Places. Local GovernmentCommission. Sacramento, CA.

99Bibliography
Western Australian Planning Commission. 1997. Livable Neighbourhoods: Community Design Code,Edition 1. Western Australia
Weyrich, P. and W.S. Lind. 2001. Twelve Anti-Transit Myths: A Conservative Critique. Free CongressFoundation. Washington, DC.
Williams, K. and M. Marshall. 1996. Managing Corridor Development. Center for Urban Transporta-tion Research, University of South Florida. Tampa, FL.
Additional Helpful Web Links:
Innovative Stormwater Management – Metropolitan Councilhttp://www.metrocouncil.org/environment/Watershed/bmp/manual.htm
Minnesota Planning Model Ordinances – MN Planning Environmental Quality Boardhttp://www.mnplan.state.mn.us/pdf/2000/eqb/ModelOrdWhole.pdf
Tree Ordinance – International Society of Arboriculturehttp://www2.champaign.isa-arbor.com/tree-ord/index.htm
Shoreland Management – DNRhttp://www.dnr.state.mn.us/shorelandmgmt/index.html
Neighborhood Wilds program – DNRhttp://www.dnr.state.mn.us/neighborhood_wilds/index.html
Natural Resource Assessment – DNRhttp://www.dnr.state.mn.us/greenways/worthprotecting.html
Natural Areas: Protecting a Vital Community Asset – DNRhttp://www.greatplains.org/resource/1999/natural/natural.htm