community-wide hazmat risk assessment - uh
TRANSCRIPT

Hobby School of Public Affairs and the Houston Fire Department
January 2020
Community-Wide Hazmat Risk Assessment

1
Community-Wide Hazmat Risk Assessment
Research team members (listed in alphabetical order):
Maribel Burgos, Lauren Erickson, James Hannan, Will Janowski, Sara Moran, Amber Murray, Ja-Nessia Prince, and Samaree Warner.
Project Advisors:
Gail Buttorff, Pablo M. Pinto, and Sunny Wong
Acknowledgements:
We thank Diana Benitez, Leonard Chan, Captain James Coe, Chief Terry Colburn, Senior Captain Dexter Johnson, Amy Lipke, David McClendon, Captain Rodolfo Mier, Captain Kevin Okonski, Jeff Reichman, Captain Charles Rogers, Captain Jason “Bear”
Wilson, Celeste Zamora, and the Hazmat Team at Station 22 for their insights and assistance.

2
Report: Community-Wide Hazmat Risk Assessment
Executive Summary The Houston Fire Department hazmat team partnered again to Hobby School of Public Affairs at the University of Houston (Hobby School) to continue an analysis of the department’s hazmat risk and response to events. The purpose of this study is to provide an assessment of hazmat risk which builds upon more than just the volume of past incidents to actually predict non-historical risk and determine potential areas of improvement for the Houston Fire Department. This hazmat risk assessment creates a model that evaluates probability, severity, and vulnerability of community risk, as well as the intersection of risk and response times. The analysis shows that the Houston Hazmat Response Team at Station 22 in southeast Houston has not kept pace with the growth of the city itself in terms of resources and personnel. Despite having no increase in the number of employees at the station, Houston continues to grow as a city, as do the potential risks and responsibilities for the Houston Hazmat Response Team’s only unit. This report provides clear and convincing evidence of the importance of having an efficient and well-utilized hazmat team, and furthers the research of the 2016 Facet Report recommendations for the Houston Fire Department. By considering the locations of Tier II sites and their relationship with vulnerable community areas, as well as the intersection of response time and predicted community risk, this report has added further data for consideration in choosing a location for an additional Hazmat Response station and team.

3
1
Introduction Hazardous material incidents in the Houston region continue to rise, according to Houston TranStar statistics (Begley & Ward 2017). Houston TranStar reported 111 hazmat incidents involving heavy trucks in 2017 (Begley & Ward 2017). Since 2013, the number of hazardous spills and cleanups from trucks has more than doubled, though the spills are a minuscule fraction of the nearly 50,000 incidents on Houston area highways and major roads annually (Begley & Ward 2017). The graduate students at the Hobby School set out to create a community-wide risk assessment model which encompasses probability, severity, and vulnerability of the Houston area in order to provide the Houston Fire Department and the Hazmat team with a detailed view of potential risk within their service area, the City of Houston.
• We conducted a literature review was conducted looking at spatial distances from Tier II sites, demographics, and city growth.
• A two-step process used to measure high-risk areas from the Risk Assessment of the Area along the Highway (RAAH) helped to identify a model used to measure hazmat risk in transportation scenarios by measuring severity and vulnerability. Severity can be defined by accidental frequency and intensity. We discuss demographic and economic conditions in Houston, then look at national statistics on hazardous material incidents as they compare to Houston levels in order to frame the scope of the issue.
• We utilize the Kernel density approach to model the community-wide hazmat risk in Houston.
• We conclude with our recommendations based upon the findings of the analysis, and discuss limitations of this study.
1.2 The Hazmat Team at Station 22 The Houston Fire Department (HFD) is the fourth largest fire department in the U.S. when measured by total staffing (Facets Consulting 2016). One of the many department services provided by the Houston Fire Department is hazardous material response, handled by the Houston Fire Department Hazardous Materials Team (Hazmat Team) located at Station 22 (Facets Consulting 2016). Since its inception in 1979, the Hazmat Team in Houston has been considered one of the best Hazmat teams in the country and

4
has been used as a model for other fire departments seeking development of their own hazardous material response teams (Burke 2019).
The Hazmat Team, which operates out of a stand-alone unit solely dedicated to hazmat response and other hazmat duties, participates in Houston's Ride-Along Program, which allows visiting teams to experience more hazardous responses in a single week than they would experience in a month in their own department (Burke 2019). Houston’s high rate of hazardous material responses is partially a function of its heavy economic reliance on the energy industry, and partly a function of its being a major hub for national and international air, sea, and automobile transportation. The response area for the Hazmat team at Station 22 includes the entire city of Houston and all of Harris County, but they have also responded to hazardous events in Galveston, Montgomery County, and Austin County. Charles L. Rogers, the current captain of the “C” Shift with HFD, stated that the team has responded to an event in Victoria County, more than 120 miles away (Burke 2019).
A recent FACET report found that, “Houston has a relatively low number of trained on-duty hazmat responders, especially given the size of the city and the nature of the hazards found in Houston” (Facets Consulting 2016) . Currently, the capacity of the Hazmat team is a minimum of ten personnel-per-shift responding from their single station located at 7825 Harrisburg Street, close to the city's major petrochemical area (Facets Consulting 2016, Burke 2019). Because of the sophisticated equipment they use and the vast amount of chemical knowledge needed, Hazmat personnel must have extensive training to handle each emergency appropriately (Facets Consulting 2016).
Station 22 has two hazmat units on site, one of which is a foam engine (Burke 2019). Other engine companies throughout Houston carry 10 gallons of hydrocarbon dispersant, which is used for small fuel spills or fires; however, anything larger requires the Hazmat team’s unique skills and equipment. (Burke 2019). The Hazmat Team has occasionally taken longer than HFD’s 20-minute target time to arrive at the scene of a hazardous event (Facets Consulting 2016) because of physical distance challenges. So although the Hazmat team is centrally located near historic hazardous incidents, is staffed with highly trained and experienced personnel, is utilizing highly specialized equipment, and reaches all of the hazmat incidents that occur in Houston each year, they may need an additional Hazmat Station and Team to effectively account for the unique geographic coverage needs of Houston.

5
Tier II For this report, Tier II sites were used as indicators for hazardous materials and risk. The Tier II Chemical Reporting Program is the state-collected and stored chemical inventory reports which are required under several federal laws commonly referred to as “Community Right-to-Know Laws” (Texas Commission on Environmental Quality 2019). The Texas Commission on Environmental Quality (TCEQ) is the organization responsible in Texas for collecting, storing, and reporting Tier II reports and data (TCEQ 2019). Tier II Chemical Reports give information about the hazardous materials at a facility, its location, capacity, emergency contacts, and other information, which is then given to and used by emergency response professionals (TCEQ 2019). Once facilities store a certain threshold amount of hazardous materials, they must then submit a Tier II report (TCEQ 2018). A chemical is designated as hazardous if the facility is required to maintain Safety Data Sheets (SDS) under Occupational Safety and Health Administration (OSHA) regulations (TCEQ 2018). The reporting thresholds for these materials are 10,000 lbs. present in the facility. However, if the chemical is designated as an Extremely Hazardous Substance (EHS), then it must be reported at either the threshold planning quantity or 500 lbs., whichever is less (TCEQ 2018).
Hazardous Materials and Hazmat Response The Houston Hazmat Team faces unique challenges in comparison to other HFD teams. Hazardous materials spills and leaks across Houston can be lethal to people and damage the environment and require personnel with specialized training and equipment to deal with oil, other chemicals, and biological threats, as well as radioactive and nuclear materials (Burke 2019). The HFD website states that, “The primary purpose of a Hazmat unit is to define chemicals, what type of incident they are dealing with and stop the flow of the substance” (City of Houston 2019). This is a highly technical and nuanced task, as each chemical incident that the Hazmat Team responds to requires a unique response.
The OSHA Hazard Communication Standard requires that all chemical storage facilities, distributors, and manufacturers provide an SDS to communicate information including but not limited to the chemical properties, the physical hazards, protective measures, and safety precautions for handling the chemical (OSHA 2019). Common chemical exposures in Houston include chlorine, liquefied petroleum gas (LPG), ammonia, sulfuric acid (H2SO4), bleach, zinc, and combustible metals (Burke 2006). On the SDS sheet for Zinc, the precautions state that the dust may form an explosive mixture in the air (Chemical Safety 2019), whereas the SDS sheet for LPG warns that it is an extremely flammable gas and can explode if heated (Chemical Safety 2019). The SDS sheet for chlorine states that suitable extinguishing media are carbon dioxide (CO2), foam, and powder (Chemical

6
Safety 2019). Each of these chemicals requires different approaches for safety measures, containment, and immediate emergency services. The existence of only one hazmat station with full equipment and the necessary specialized training and knowledge limits prompt and well-equipped responses to hazardous incidents in all geographic areas of Houston.
7
2 Literature Review
Community risk assessment process is a systematic approach that identifies, assesses, and categorizes the probabilities and impacts of all hazardous risks, and designs an optimal system for mitigating those risks within a specific area (Center for Public Safety Excellence, 2016). The assessment of risks should include considerations relevant to critical infrastructures, population demographics, and area development (Center for Public Safety Excellence, 2016). Guided by these definitions, we have identified the following categories as community risks associated with hazmat incidents: Tier II Spatial Distance, Demographics, and Expansion.
2.1 Tier II Spatial Distance Spatial distance from Tier II sites can increase potential community risk when the amounts of stored hazardous chemicals climb above certain thresholds. Tier II sites are required to annually report facility identification profiles, stocking practices, and detailed chemical data. The locations of Hazmat facilities should be carefully considered because of the increased likelihood and significant consequences of an occurrence (Romero, Nozick & Xu, 2016). For example, Cedar Park Fire Department, in Central Texas, considers Tier II sites as additional hazards that affect the community, and identifies these sites in their Standards of Cover.
Additionally, the Environmental Protection Agency (EPA) and TCEQ require robust reporting for Tier II sites. First responders, emergency coalitions, and other groups use these reports in their planning to ensure the safety of their respective communities. We believe the fact that multiple regulatory agencies from the federal to the local level are concerned with what is contained in these sites makes it necessary for us to include them in our analyses (EPA, 2019; TCEQ, 2019).
There are almost 2,000 Tier II sites in the City of Houston. Furthermore, there are no zoning laws, which means that unknown numbers of people in the City of Houston may be living in close proximity to chemical sites. Any incident in the City of Houston, therefore, is likely to affect a much higher number of people than an incident in other parts of the country.

8
2.2 Demographics For the purposes of community risk, analyzing the population density can help to predict the impact of different numbers and types of hazmat incidents. Hazmat incidents are distinctive because they have a low probability of occurrence, but have can have highly catastrophic outcomes such as loss of life (Kang, Batta & Kwon, 2013; Desai & Lim, 2013). Demographics can have direct impacts on incidents and should be carefully considered when developing a model for community risk. It is necessary to consider demographics within a given area to ensure appropriate emergency response. Romero, Nozick and Xu (2016) also identify equity as a consideration for hazmat storage sites. They define equity, or income distribution, in terms of the Gini coefficient and no other factors. As a result, they identify a substantial variation in the exposure of different demographics to hazmat materials.
In Houston, the most reported hazmat incidents occur in East Houston. According to the 2010 U.S. Census, the population for this area increased from 14,479 to 14,777 within a span of 10 years. Additionally, the reported median household income is $33,138, and $27,920 is the average adjusted gross income. Approximately 89.2% of students attending public schools receive or are eligible to participate in free or reduced lunch programs.
2.3 Expansion Considerations of long-term development and actual city growth can be important for identifying community risk. Conditions like road closures or ongoing city developments can have direct impacts on communities by increasing risk in areas where risk may not have appeared significant before. Future development affects the probability of potential hazmat incidents and their consequences, and should be given weight in community risk determinations.
These considerations are pertinent to the effectiveness of a community risk model.
• For our approach, we plan to create a model that identifies high risk areas by measuring the severity of risk and the vulnerability of the community.
• Second, using a model that has identified high risk areas, we plan to draw conclusions on how outcomes compare to the growth of Houston, using historical data.
• With our project, we hope to develop a framework for hazmat risks that can be used for further research models.
We have identified a two-step process to measure severity and vulnerability for high risk areas. Our model stems from the RAAH, developed by Huang et al. (2018). RAAH identifies a model to measure hazmat risk in transportation scenarios by measuring

9
severity and vulnerability. Huang et al. defines severity in two categories: accidental frequency and intensity. Frequency of hazmat accidents is characterized by road conditions and intensity related to hazmat characteristics. For our approach, we plan to measure severity by frequency of hazmat incidents in Houston and intensity of hazmat characteristics by hazardous class code.
In Huang et al., vulnerability is divided into three criteria: Exposure, Sensitivity, and Adaptive Capability. Each criterion is further divided into sub-criteria, each of which is assigned a weight based on factor extraction of importance determined by expert discussion. Stemming from this idea, our approach defines vulnerability by the distance between Tier II sites, various facilities such as hospitals and schools, and residential areas. All areas will be divided by zip codes within and surrounding the Houston area. Finally, the areas identified as being more vulnerable are examined in conjunction with historical incidents and traffic data. In this assessment, the model will examine probability, severity, and vulnerability using distance and density. Presence of a community indicator, such as a residential home, school, or hospital will indicate vulnerability in the area analyzed. Distance of Tier II sites to those indicators indicating severity and probability will be shown by how dense, or frequent, these occurrences are within the examined area.

10
3 Demographic and Economic Conditions in Houston
3.1 Houston Growth Houston is the 4th largest city in the United States and continues to see growth. Figure 1 illustrates this growth from 2010 to 2017 and Table 1 shows the growth in terms of the Houston area where we see a population growth rate of 38% from 2000 to 2017 for the Greater Houston Area, which includes the city and surrounding unincorporated areas.
Figure 1: Houston Population Growth
Source: World Population Review

11
Table 1: Growth Since 2000
Source: Texas Workforce Commission
Along with its size, Houston is also consistently ranked among the most diverse cities in the country. A 2017 report conducted by the Houston-Galveston Area Council (HGAC) used Census data to create the following graphs which illustrate Houston’s demographic diversity and the ways it has changed over time. Their graphs also show their expected projections for the Houston region into 2050.
Ethnically, Houston is becoming more diverse. Shown in Figure 2, the percentage of Houston’s population identifying as Hispanic has increased greatly over time and is expected to continue increasing to the point that Houston’s population is expected to be more than 40% Hispanic by 2040. Figure 3 shows that the age composition in Houston is also changing. HGAC expects that the share of older cohorts in the population will increase, and the median age of the population will increase from 33 in 2010 to almost 38 by 2040. The share of people 65 years and older will more than double, increasing from 9% in 2010 to about 18% by 2040.

12
Figure 2: Ethic Composition of the Population
Source: Houston-Galveston Area Council
Figure 3: Age Composition of the Population
Source: Houston-Galveston Area Council
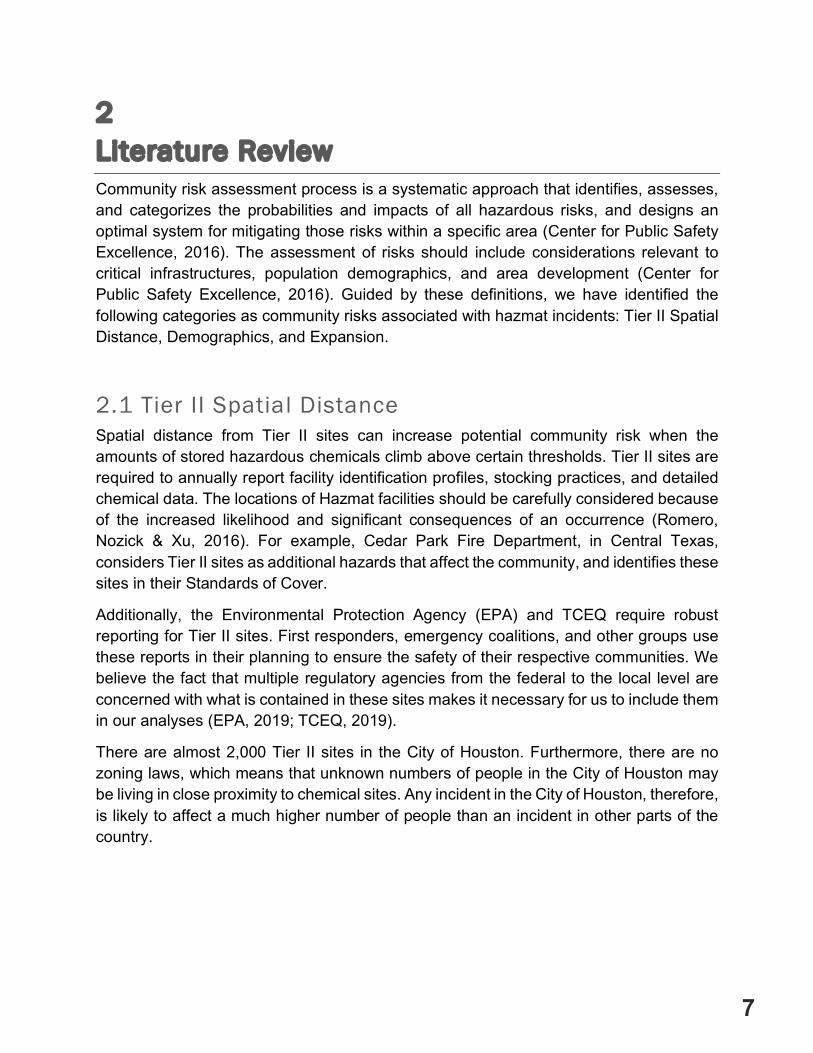
This report also documents the changes is Houston’s population relative to the area of the city. Most heavy increases in population have been on the West side of the city, as shown in Figure 4.
13
Figure 4: 1980-2015 Population Change
Source: Houston-Galveston Area Council
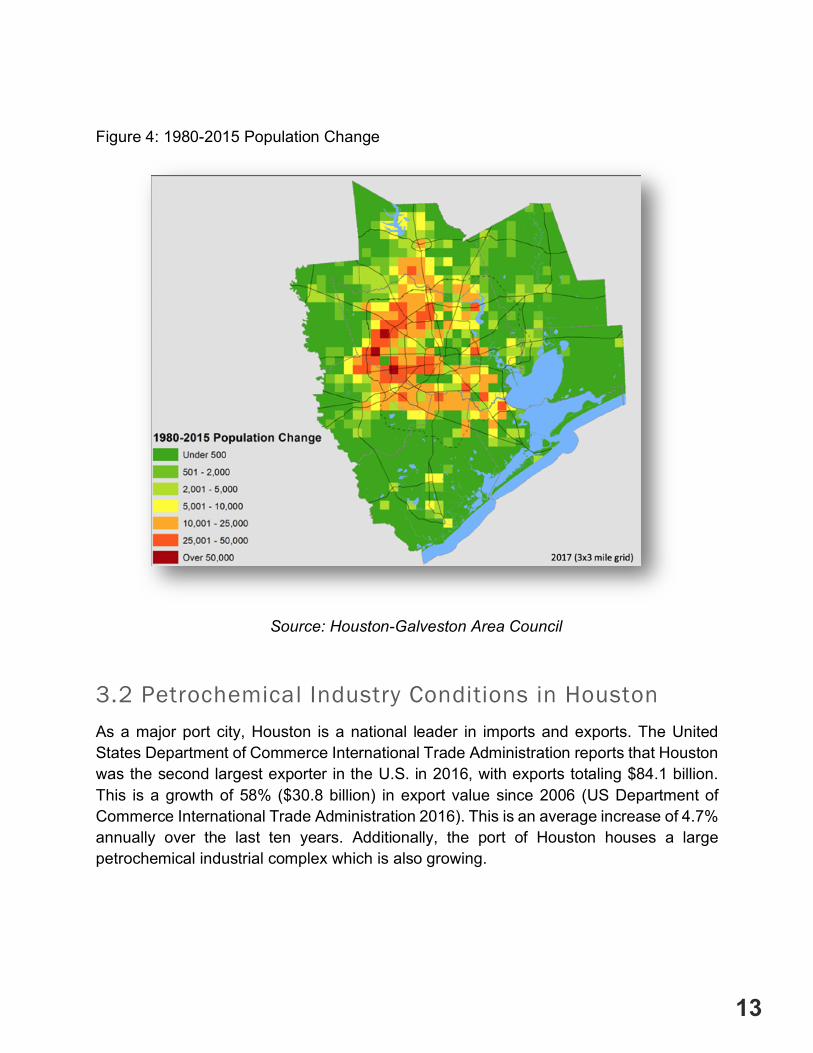
3.2 Petrochemical Industry Conditions in Houston
As a major port city, Houston is a national leader in imports and exports. The United States Department of Commerce International Trade Administration reports that Houston was the second largest exporter in the U.S. in 2016, with exports totaling $84.1 billion. This is a growth of 58% ($30.8 billion) in export value since 2006 (US Department of Commerce International Trade Administration 2016). This is an average increase of 4.7% annually over the last ten years. Additionally, the port of Houston houses a large petrochemical industrial complex which is also growing.
14
Figure 5: Gross Output by Industry
Source: United States Bureau of Economic Analysis
Figure 6: Projected Employment by Industry
Source: Texas Workforce Commission
These factors are important to note when considering the potential challenges and hazards of a dynamic city like Houston. HFD’s Hazardous Materials team at Fire Station

15
22 in southeast Houston has not kept pace with the growth of the city itself. October 2019 marks 40 years since the creation of this team, which currently operates with 4 shifts consisting of 10 firefighters, with a total of 44 fire fighters available. This number has not changed in the last 20 years. Meanwhile, Houston continues to grow, and so do the potential risks and responsibilities of HFD’s only hazmat unit.
3.3 Hazard Incidents in the Nation and in Houston
Figure 7: U.S. Department of Transportation Pipeline and Hazardous Materials Safety Administration Office of Hazardous Material Safety – All Incidents
Source: Hazmat Intelligence Portal, U.S. Department of Transportation. Data as of 3/3/2019
Figure 7 illustrates the total number of hazmat incidents reported throughout the U.S. by year, classified by mode of transportation. The reported modes of transportation include air, highway, railway and water. An incident is defined as an event resulting in the unintended and unanticipated release of a hazardous material, or an event meeting incident reporting requirements in §171.15 or §171.16 of the chapter relating to Pipeline and Hazardous Materials Safety Administration, Department of Transportation (49 CFR

16
Part 171). As Table 2 shows, the majority of hazmat incidents reported from 2009 to 2018 occurred during highway transportation.
Table 2: Incidents by Mode and Incident Year
Source: Hazmat Intelligence Portal, U.S. Department of Transportation. Data as of 3/3/2019
Table 2 describes the number of hazmat incidents. Hazmat incidents occurring during water transportation has steadily declined since 2009, whereas hazmat incidents occurring during highway transportation has steadily increased since 2009. Incidents occurring during air and railway transportation have fluctuated throughout the years. The highest number of incidents during air transportation occurred in 2012, when 1,460 incidents were reported, and the lowest number occurred in 2015, when 1,130 incidents were reported. The highest number of incidents during railway transportation occurred in 2010, when 747 incidents were reported, and the lowest number occurred in 2018, when 497 incidents were reported.

17
Figure 8: U.S. Department of Transportation Pipeline and Hazardous Materials Safety Administration Office of Hazardous Material Safety – All Incidents
Source: Hazmat Intelligence Portal, U.S. Department of Transportation. Data as of 3/3/2019
Figure 8 shows the total dollar amount of damages classified by mode of transportation in the U.S. from 2009 to 2018. The highest reported dollar amount of damages overall occurred in 2011 during highway transportation. In 2013, hazmat incidents occurring during railway transportation had the highest dollar amount of damages.
Table 3: Damages by Mode and Incident Year
Source: Hazmat Intelligence Portal, U.S. Department of Transportation. Data as of 3/3/2019

18
Table 3 provides the exact dollar amount of damages illustrated by Figure 8. In 2018, nine hazmat incidents occurred during water transportation, which amounted to $32,500 worth of damages. In addition to national reporting, Pipeline Hazardous Materials Safety Administration (PHMSA) collects information from the Hazardous Material Incident Report (Form 5800.1). This database stores information on the size, frequency, and impacts of hazardous material releases during transportation. From this database we were able to extract a sample size of 2384 observations of hazmat incident reporting in Houston from 2009 to 2018.
Figure 9: Total Hazmat Incident Frequency in Houston by Year (2009-2018(
Source: Houston incident reporting from 2009 to 2018. Pipeline Hazardous Materials Safety Administration, U.S. Department of Transportation
Figure 9 shows the total reported hazmat incident frequency in Houston by year from 2009 to 2018. In 2014, a total of 370 hazmat incidents were reported in Houston, which is the highest number reported during that time. The fewest reported hazmat incidents occurred in 2016, with a total of 165 incidents reported.

19
Figure 10: Cumulative Hazmat Incident Reporting in Houston 2009-2018
Source: Houston incident reporting from 2009 to 2018. Pipeline Hazardous Materials Safety Administration, U.S. Department of Transportation
Figure 10 shows the areas of Houston with highest concentrations of reported hazmat incidents from 2009 to 2018. Zip codes with less than 100 reported hazmat incidents are not shown. The most frequent hazmat incidents appear to occur within the 77078 zip code area. This area, also known as East Houston, is primarily located in Harris County, and is considered to be within Houston’s metro area.
20
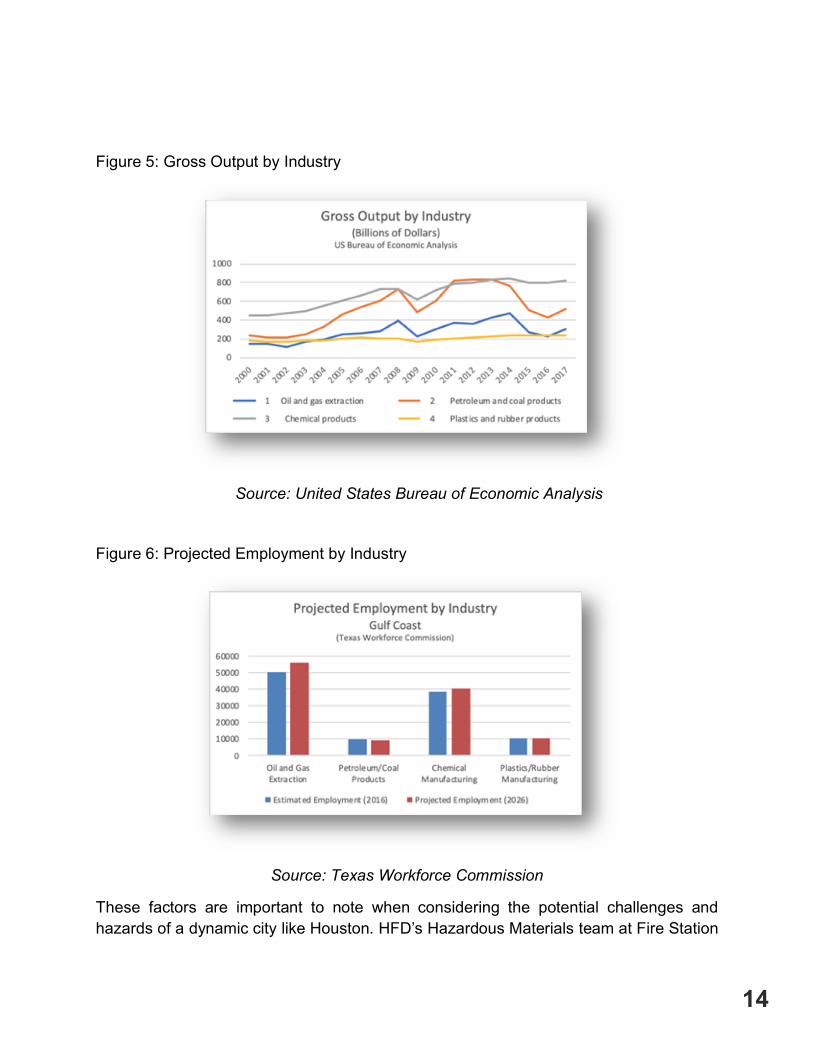
Figure 11: Common Reported Hazard Class in Houston 2009
Source: Houston incident reporting from 2009 to 2018. Pipeline Hazardous Materials Safety Administration, U.S. Department of Transportation
Figure 11 pictures the most common classes of hazardous materials reported incidents in Houston from 2009 to 2018. Hazardous classes with less than 100 reported incidents are not shown.
• Corrosive materials (class 8) are defined by federal regulations as a liquid or solid that causes full thickness destruction of human skin at the site of contact within a specified period of time (CFR 49 Part 173.136). A common example is hydrochloric acid, which is used in creating batteries, photoflash bulbs, and fireworks.
• Flammable - combustible liquids (class 3) are the most commonly reported material for hazmat incidents in Houston.
o A flammable liquid means a liquid having a flash point of not more than 140 degrees Fahrenheit, or any material in a liquid phase with a flash point at or above 100 degrees Fahrenheit that is intentionally heated and offered for transportation or transported at or above its flash point in bulk packaging (CFR 49 Part 173.120).
o A combustible liquid means any liquid that does not meet the definition of any other hazard class specified in subchapter C (Hazardous Materials Regulations) and has a flash point above 140 degrees Fahrenheit and below

21
200 degrees Fahrenheit (CFR 49 Part 173.120). A common example is butyne which is a colorless gas.
• Miscellaneous hazardous material (class 9) refers to a material which presents a hazard during transportation but which does not meet the definition of any other hazard class (CFR 49 Part 173.140). Some examples are solid dry ice and lithium batteries.
Figure 12: Total Amount of Damages from Hazmat Incident in Houston
Source: Houston incident reporting from 2009 to 2018. Pipeline Hazardous Materials Safety Administration, U.S. Department of Transportation
Figure 12 shows the trend for total amount of damages as a result of a hazmat incidents in Houston from 2009 to 2018. Costs from hazmat incidents increased significantly from 2017 to 2018. A total of 303 incidents were reported in Houston that year, amounting to a total of $982,086 worth of damages. According to the incident data from the PMSA, in February 2018 a railway tank car transporting corrosive materials was punctured. There was no release to storm water outfall of the ship channel and no injuries, but the hazardous material accident alone resulted in $680,000 worth of damages.

22
4 Risk Analysis To expand on the 2016 Facet Report Recommendations for the Houston Fire Department, this hazmat risk assessment predicts non-historical risk, and highlights potential areas of concern that have not historically had high incident volumes. This research can further add to the data for future decision-making by HFD in regards to the Hazmat Team. This community-focused assessment brings new perspective to existing data and findings from previous industry-focused research. By examining potential hazards near residential homes, schools, and hospitals, the Hazmat team can plan ahead for future incidents.
4.1 Overview of process The Near Analysis function in Geographic Information System (GIS) is used to calculate the straight-line distance from specific features to their nearest neighboring features. Specifically, the distance of Tier II sites to schools, hospitals, and occupied residential homes will be examined. The bandwidths of the risk areas for each Tier II site are designated using the buffer tool in GIS. Finally, the risk is calculated using Kernel Density Analysis. One aspect of the risk measurement is areas of vulnerability such as schools, hospitals, and occupied residential housing within the boundaries of zip codes. Risk, in this analysis, is determined by the proximity of vulnerable sites to Tier II sites. The calculated risk is aggregated at the zip code level for comparative analysis. Maps displaying the demographic makeup of each zip code indicate areas of higher risk by showing which populations/neighborhoods may have higher community risk.
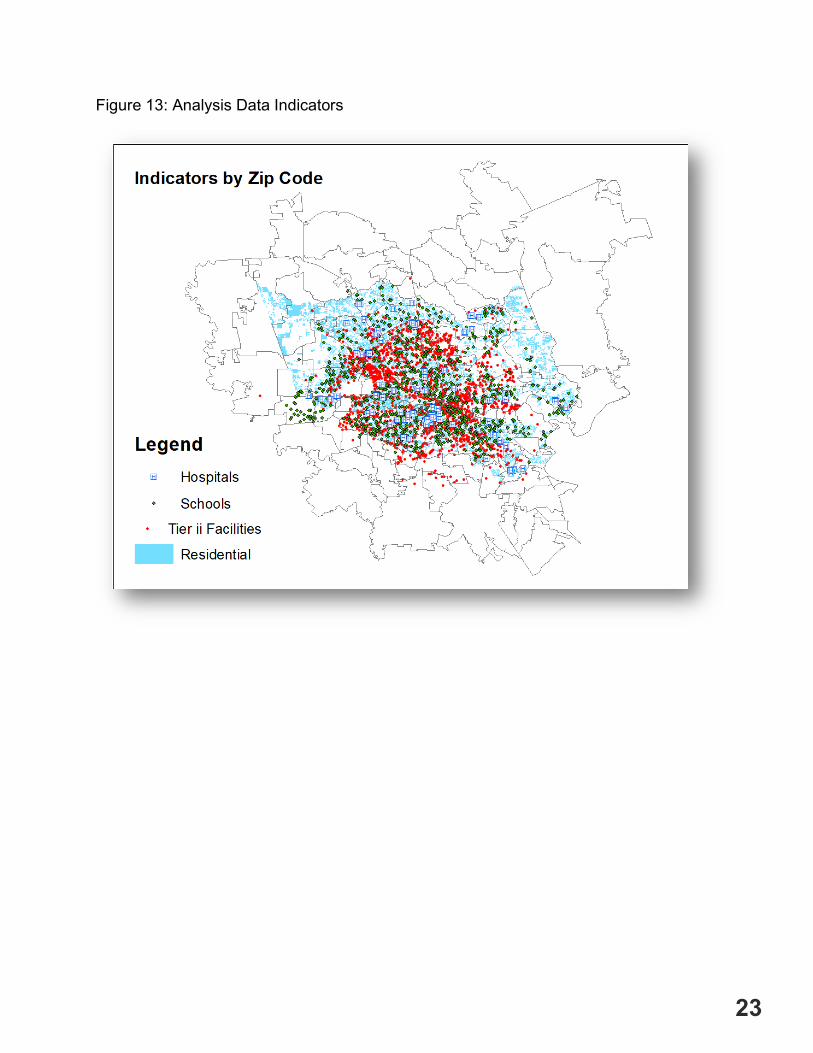
Figure 13 shown below visualizes the data used for the community risk assessment and for the impact risk assessment. The map shows the locations of vulnerability indicators used to create the community risk measurement. The risk indicator is the location of Tier II sites that will be used to measure distance between vulnerability indicators and areas with hazmat materials. The data in this map that are used in the analysis consist of 1,948 Tier II sites, 1,052 schools, 108 hospitals, and 1,122,994 occupied residential homes within the area of interest for this study.
23
Figure 13: Analysis Data Indicators

24
4.2 Kernel Density Approach: Community Risk In order to determine key areas of interest for the Hazmat Team, and to help HFD decide where best to invest resources to better serve the people of Houston, this assessment identifies frequency of potential incidents for use in future planning. This analysis creates data that will be a useful cross reference for future researchers by calculating the spatial frequency of community risk in Houston.
Utilizing near analysis and buffer tools in GIS, the spatial interpolation kernel density method was used to generate maps and to calculate risk, which are displayed in the form of a heat map. The map shows kernel density of hospitals, schools, and populated residential housing by nearness to Tier II.
To create the heat map of community risk, the vulnerability indicator variable was coded by level of risk according to our model. To create this model, two buffers were placed around Tier II sites – if indicators of vulnerability fall within one of these buffer areas, then they are coded as higher risk. There are two bandwidths around the Tier II site: the first buffer area is one quarter mile (.25 miles) or less, away from the Tier II site, and the second buffer is between .26 and .3 miles away from the Tier II site. Indicators of vulnerability within a quarter mile of a Tier II site were determined to be at a high risk due to the geographical proximity to the hazmat materials. This nearness could result in incidents of property damage, human injury, or death; traffic problems are also associated with nearness to potential hazmat events. Anything outside the quarter mile bandwidth and inside the .3-mile bandwidth was determined to be at a moderate risk level due to the geographical proximity to Tier II sites for similar reasons--particularly property damage and traffic issues. Any location further than the second bandwidth was determined to be at a relatively low risk.
The risk variable for this analysis was created using a coded score for each geoid in our centroid data that represents one of our vulnerable locations, i.e., hospitals, schools, and residential homes. A score of 1 shows the presence of a vulnerability, 2 shows that the vulnerability indicator falls within the .26 - .3-mile nearness range of the Tier II site, and 3 shows that the vulnerability indicator falls within a quarter mile of the Tier II site. This coded risk variable is used to calculate a ratio to create the heat map. The sample map shows how density is calculated using point data. Figure 14 below shows a before-and-after image of a hypothetical data set kernel density analysis:

25
Figure 14: Example of Points to Raster Transformation through Kernel Density Analysis
After the density map is calculated for the Greater Houston Area, the zip code boundary was layered over this map to better highlight higher-risk areas. Then to better highlight the at-risk zip codes, the raster data from the kernel density analysis was aggregated to the zip code level using the zonal tool in the GIS spatial analysis toolbox. These steps were then replicated with city council boundaries layered in instead of zip code boundaries. These City Council District maps are included in our conclusion to highlight certain districts that are higher risk.
4.3 Results The initial output from the spatial analysis using Kernel Density is shown in Figure 15 below. Figure 15 is a heat map of Tier II hazardous materials risk to the community. Where the redder area is, the higher the risk, and more yellow areas represent a lower level of risk. The zip codes with the most red have the most Tier II sites near to hospitals, residential homes, and schools. Areas of the map that are mostly yellow do not have vulnerable indicators as close to Tier II sites as redder areas do.

26
Figure 15: Community Risk Heat Map
To better determine which zip codes have higher risk than others, an aggregate risk map was created. The output for this map is shown in Figure 4 below. A choropleth map was created to show the average level of risk in each zip code. The darker brown the area, the higher the level of average risk. This analysis revealed some key zip codes to monitor for potential hazmat-related risks. The five zip codes with the highest community risk are the following (ordered from highest to lowest risk): 77010, 77002, 77054, 77027, and 77003.
Figure 16: Aggregate Community Risk Map

27
Table 4 below shows the estimated drive times from Station 22 to each of the top five highest designated-risk zip codes according to the analysis done here. The estimated drive times were found using Google Maps traffic and mapping data through the map directions feature online. In this table it is clear that of all the high-risk zip codes examined, 77027 has the longest drive times from Station 22.
Table 4: Drive Times (According to Google Traffic and Mapping Data):
Zip Code Min Drive Time Max Drive Time
77010 12 minutes 28 minutes
77002 12 minutes 35 minutes
77054 14 minutes 40 minutes
77027 22 minutes 1 hour
77003 12 minutes 20 minutes
Figures 17, 18, and 19 are demographic maps, with information aggregated to the zip code level. Figure 17 shows racial breakdown by neighborhood in the form of a choropleth map of counts by race. The darker the color in the map, the higher density of that group of people. The zip codes found to have the highest risk are marked in a lined layer over the choropleth map to better show the intersection between race and risk.

28
Figure 17: Asian Demographics by Zip Code
Figure 18: Black Demographics by Zip Code
Figure 19: White Demographics by Zip Code
The five zip codes with the highest risk are the following (ordered from highest to lowest risk): 77010, 77002, 77054, 77027, and 77003.
There were no immediate trends in how community risk was distributed by race in Houston when looking at the choropleth maps by race. Three out of five of the high-risk zip codes had unemployment rates greater than 6%. Of the highlighted areas in figure 18, only one of the zip codes was made up of majority black neighborhoods: 77054. The rest of the zip codes were majority white neighborhoods as illustrated in figures 17-19.
By region, the west side of town had a trend of slower response times. Out of the five highest-risk zip codes, 77027, the most western of the high-risk areas, had the longest estimated response time, with a potential drive-time range of between 22 minutes and an hour.
Historical incident trends show high incident rates in different zip codes than the ones we mapped based on our indicator of risk. It is possible that the isolated high-risk areas we mapped are potential problem areas that could have hazmat incidents in the future but have not historically had high numbers of incidents.
The City Council Districts with the highest risk in our analysis are as follows (ordered highest to lowest): District I, District C, District K, District H, and District J.
29
5
Concluding Remarks and Recommendations
The University of Houston Hobby School of Public Affairs conducted this research for the Houston Hazmat Response Team. We studied various supporting documents on risk assessments, and utilized data to produce maps, an analysis of the Harris County census, and incident reports. The primary focus of this report is to provide clear and convincing evidence of the importance of having an efficient, well-utilized hazmat team. The Houston Hazmat Response Team at Station 22 in southeast Houston has not kept pace with the growth of the city itself in terms of resources and personnel. Houston’s continuing growth as a city, and the corresponding increase in potential risks and responsibilities for the Houston Hazmat Response Team’s only unit, have not been accompanied by a corresponding increase in employees. This report furthers the research of the 2016 Facet Report recommendations for HFD.
Suggestion number 20 of the Facet Report proposes a new hazmat facility on the west side of the city (Facets Consulting 2016) ; however this suggestion was solely based on historic incident data. By considering the locations of Tier II sites and their relationship with vulnerable community areas, as well as the intersection of response time and predicted community risk, this report has added further data for consideration in choosing a location for an additional Hazmat station and team.
Specific areas and communities in Houston face particularly high risk from Tier II sites, as was shown in this report. Advocating for further Fire Department resources could prove challenging in the current political climate. To better communicate this need to politicians, Figures 8 and 9 below show community risk broken down by City Council District. As shown below, some City Council Districts have higher risk than others. The City Council Districts with the highest community risk in our analysis are as follows (ordered from highest to lowest risk): District I, District C, District K, District H, and District J. When working towards policy solutions, it may be useful to consider these districts while talking with policy makers.

30
Figure 20: Risk Level by City Council District
Figure 21: Aggregate Community Risk Map

31
6 Limitations and Future Study
6.1 Limitations Several limitations of this study should be mentioned here. First, in the zip code aggregate process, information loses a lot of context in terms of concentration of risk inside each zip code. This is especially true in Houston where there are no zoning laws, and very high-income neighborhoods may be almost on top of low-income neighborhoods. By looking at the big picture, we are getting a good snapshot, but we may be missing smaller trends in the process. Additionally, we don’t know the chemical makeup of each individual Tier II site, so we used a predetermined range-of-risk and did not tailor buffers to their particular Tier II site. This could have caused an under emphasis or overemphasis of risk for individual sites.
6.2 Research suggestions The range of potential studies concerning the challenges faced by HFD’s Hazmat Unit are too varied and considerable for just one capstone project; especially when utilizing preliminary unfamiliar data and methodologies from scratch. Going forward, however, this project could launch into a diverse array of more in-depth analysis subject to the Hobby School lengthening their capstone schedule - to allow supplementary time for data collection, review from our clients at HFD, and the general trial and error found when completing a project of this scope. The future recommendations section provides a guideline for potential investigations regarding significant challenges the research group discovered during the initial exploratory investigation of the Hazmat Unit; the available timetable limited the scope of the presentation.
6.3 Future Recommendations Finding a potential contemporary location for a second Hazmat Unit by looking at the community risk factors and considering the growth of West Houston over the past decade would be ideal. Influences that led to the original choice of Station 22 should be considered as well, such as proximity to the Ship Channel and Ellington Field Joint Reserve Base.
32
Taking the new findings into consideration, along with the original thinking regarding location, we suggest the following areas for further study:
• The potential of an additional Hazmat location to cut down the tremendous drive-time to West Houston. (Some firefighters were against this because after each Hazmat Event, an after-action review takes place. If two locations are utilized, then some firefighters will miss the discussion due to being spread out.)
• The creation of a centralized location in Houston from where response times would be equalized throughout the city, based on relative risk found in this paper and response times.
• Alternatively, whether keeping the Hazmat Unit in Station 22 would be sufficient, considering risk and response?
• Expanding the community risk factor by including airports, Port of Houston, or other factors, to provide a more comprehensive risk of Houston when factoring Tier II sites next to those variables.
• Factoring the rail system/ hazardous automotive transportation (hazmat container trailer) is one major factor of Hazmat responsibility not studied in the paper (Highly recommended starting point for analysis.)
• Funding issues plague the Hazmat Unit; grants are the vital source of funding for training recruits. A comparison of financial measures between how other large cities fund their hazmat team could be beneficial to HFD.

33
7 Appendices 7.1 Data Sources Census boundary data for zip code areas (2017)
Census boundary data for zip code areas (2017) and city council districts (2012) were both taken from the City of Houston’s (COH) Open Data Portal. These files contain geographic boundary lines for Houston zip codes, as well as geographic boundary lines for Houston’s city council districts, which were used in the analysis for aggregating risk as well to provide further context as to which communities in Houston are most affected by risk.
American Community Survey Demographic Data (2017)
Our Houston demographic data was gathered from the U.S. Census Bureau for the year 2017. Our scale is census tract, which is a relatively small unit, and gives the option to plug into larger area maps to understand the demographics of all of Houston in a more precise way. It is also informative to note that each one of these breakdowns is done by the total number of people or houses that fall in said category. We decided to look at six separate categories in demographics. First is race; which was broken down into categories of “White,” “Black,” “American Indian,” “Asian,” and “Native Hawaiian.” Under age, we categorized by 18 separate 5-year spans, starting from birth and ending with 85+. We also felt it was necessary to understand the level of poverty, so we added a variable that illustrates how many houses within that tract number are below the national poverty line. We also chose to use the unemployment rate and were able to divide it into two categories: “16 and older” and “20-64 years old.” Next, we wanted to look at education. The breakdown for this is age groups 18-24, 25+, and 65+; these were further separated by “no high school diploma,” “high school graduate,” “bachelor’s degree,” and “graduate degree.” Lastly, we wanted to know the exact household types. The types of households we list here are “nonfamily,” “married couple,” “single female,” “single male,” and “household with children.” Using these variables, we hope to create a more defined vision of the demographics of Houston, and to see which groups are most affected by or at risk of hazardous material incident.
34
Harris County Appraisal District Residential Housing Parcel Data (2018)
As one of the indicators for vulnerability, occupied residential housing data were acquired for this analysis. The data used were pulled from the Harris County Appraisal District website for the most up-to-date year, 2018. The occupied residential housing data set has a sample size of 1,122,994. The explanatory variable utilized from this resource was the geographic parcel data of Housing type, specifically occupied residential properties. In GIS this was polygon level data, which was then transformed into point data for our analysis using the Polygon to Point tool.
City of Houston’s Open Data Portal: Houston Hospital GIS Data (2018)
Houston’s hospital locations were taken in the form of point data from the City of Houston’s Open Data Portal. The data set is from 2018 and has a sample size of 108. These points were used as another vulnerability indicator for analysis and measurement of risk.
Texas Education Agency Data on School locations (2015)
The 2015 data set containing geographic locations of all K-12 schools in Texas was obtained from the TEA (Texas Education Agency) Data Center. The school locations consist of point data across Texas. The data set was clipped to include only Houston data for analysis, leaving the sample size at 1,052.
TCEQ Tier II Geography locations (2017)
Tier II site data for analysis were pulled from the TCEQ Data and Records Page. The data provided were Tier II point data for the year 2017, in which each observation in the data set represented a Tier II site. The number of Tier II sites in this data set is 1,948.
Incident Data from Pipeline and Hazardous Material Safety Administration (2009 – 2018)
U.S. Department of Transportation, Pipeline Hazardous Materials Safety Administration (PHMSA) generates a series of annual reports and statistical data information on incidents by type, year, geographical location, and other factors. We filtered the report to look at incident data reported in Houston from 2009 to 2018. The total number of observations from this dataset is 2,383.

35
7.2 GIS Instructions The software used in this study includes GIS, as well as Microsoft Excel and Access for cleaning data and preparation of descriptive statistics. More details will follow about the particular tools used in each of these programs. The following is the step by step guide to replicating this study in GIS:
The Kernel Density Approach of Risk Analysis
HCAD residential polygon data were transformed to point data.
All “vulnerable” factors (residential occupied housing, hospitals, and schools) were merged together into one layer for risk measurement.
A multiple ring buffer was used to isolate points within the following ranges of Tier II sites: 0 - .25 miles (coded as 3 or high risk relative to Tier II sites), .26 - .3 miles (coded as 2 for moderate risk relative to Tier II sites). To enable correct coding of these variables, points were selected in each buffer ring by location and exported to new layer. Then a variable was added for each layer called “weight”. This was coded as a 3 for the .25 range points, and as a 2 for .3 range points. Then these layers were merged together to create a new layer called “combined_weighted.”
The initial merged vulnerable layer had a variable added to create a weight which was coded to 1. Then the new “combined_weighted” variable was cross selected by location with the merge tool. This selection was then flipped. This new selection was exported and then merged with the “combined_weighted” to create the final layer called “Coded Risk”.
Kernel Density was calculated and output was transferred to a raster file for mapping. In this analysis we used the uniform kernel function for the Kernel Density analysis: K( u ) = 1 2 for| u | ≤ 1 First, several maps were made showing heat maps of risk. Then using the spatial analysis toolbox, specifically the zonal tool, aggregate (mean) risk levels were created for each zip code and city council district (extent set to ZCTA).
The highest group was isolated according to the Jenkins segmentation (top fifth), and a layer was created to show what these are on top of demographic choropleth maps.
Demographic maps were created for various races by zip code using ACS data (total count), as well as for property values by zip, which were used from HCAD (aggregate).
High risk areas were designated over each choropleth maps via stripes in the top 5 highest risk zip codes to show the intersection between demographic variables and areas of high risk.

36
Table 5: Risk, Drive Times, and Historic Data
37
References Abbott, P. (2016) “Port of Houston builds on leadership in worldwide export of plastic resins.” American Journal of Transportation. Issue 634. September 26. https://www.ajot.com/premium/ajot-port-of-houston-builds-on-leadership-in-worldwide-export-of-plastic-re
Begley, D. & Ward, A. (2017). Uptick in hazmat spills adds to freeway woes. https://www.houstonchronicle.com/news/transportation/article/Uptick-in-hazmat-spills-add-to-freeway-woes-12390175.php
Burke, R. (2019) “Hazmat Studies: Inside the Houston Hazmat Team.” Firehouse. https://www.firehouse.com/rescue/hazardous-materials/article/21037353/hazmat-studies-inside-the-houston-hazmat-team.
Census Bureau (2010) “American FactFinder.” American Fact Finder, 5 Oct. 2010, factfinder.census.gov/faces/nav/jsf/pages/community_facts.xhtml.
Center for Public Safety Excellence (2016). Community Risk Assessment Standards of Cover.
Chemical Safety 2019 “Safety Data Sheet Search.” Chemical Safety. Accessed April 04, 2019.
City of Houston (2019) "Houston Fire Department: HFD Units and Terms.". http://houstontx.gov/fire/about/unitsandterms.html.
Desai, S. & G. Lim. (2013). Solution time reduction techniques of a stochastic dynamic programming approach for hazardous material route selection problem. Computers & Industrial Engineering, 65, 4, 634-645.
Environmental Protection Agency (2018) "Tier II Forms and Instructions." https://www.epa.gov/epcra/Tier-ii-forms-and-instructions.
Facets Consulting. (2016) “Response Time and Staffing Analysis Model for the Houston Fire Department.” City of Houston and Houston Fire Department. https://www.houstontx.gov/fire/hfd-response-time-model.pdf.
Firehouse (2006) “Hazmat Team Spotlight: Houston Fire Department.”. https://www.firehouse.com/rescue/article/10504627/hazmat-team-spotlight-houston-fire-department.
Kang, Y., R. Batta & C. Kwon (2013). “Value-at-risk model for hazardous material transportation.” Annals of Operations Research, v. 222, issue 1, p. 361-387.
38
Houston Fire Department Hazmat Team. (2018). History. https://www.houstonhazmat.com/history/
Houston-Galveston Area Council. (2017). “Regional Growth Forecast.” http://www.h-gac.com/regional-growth-forecast/default.aspx
Huang, X., X. Wang, J. Pei, M. Xu & Y. Luo (2018). Risk assessment of the areas along the highway due to hazardous material transportation accidents. Nat Hazards 93, 1181–1202
Occupational Safety and Health Administration (2019). “Hazard Communication Standard: Safety Data Sheets.” United States Department of Labor. Accessed April 04, 2019. https://www.osha.gov/Publications/OSHA3514.html.
Romero, N., L. Nozick & N. Xu. (2016). “Hazmat facility location and routing analysis with explicit consideration of equity using the Gini coefficient.” Transportation Research Part E: Logistics and Transportation Review, 89, 165-18.
Texas Commission on Environmental Quality (2019) “About the Tier II Chemical Reporting Program.” https://www.tceq.texas.gov/permitting/Tier2/about-Tier-2.html.
Texas Comptroller of Public Accounts. (2015). “Houston - Port of Houston, Economic Impact, 2015.” https://comptroller.texas.gov/economy/economic-data/ports/houston.php#endnotes
Texas Commission on Environmental Quality (2018) "Tier II Reporting: Am I Regulated?". https://www.tceq.texas.gov/permitting/Tier2/am-i-regulated.
U.S. Department of Commerce. (2016). “Houston-The Woodlands-Sugar Land, TX Merchandise Exports in 2016.” International Trade Commission. https://www.trade.gov/mas/ian/metroreports/Houston.pdf
U.S. Department of Transportation, PHMSA. (2009 – 2018). Hazmat Incident Report. Retrieved from https://cms.phmsa.dot.gov/hazmat-program-management-data-and-statistics/data-operations/incident-statistic
World Population Review. (2019). “Houston Texas Population 2019.” http://worldpopulationreview.com/us-cities/houston-population/