comp 776 computer vision - computer scienceleejswo/vision/project_final_report.pdf · comp 776 ‐...
TRANSCRIPT

COMP 776 ‐ Computer Vision Project Final Report
Distinguishing cartoon image and paintings from photographs
Sang Woo Lee 1. Introduction With overwhelming large scale images on the web, we need to classify these images in various ways. There are numerous classifiers, and especially it is very important that classifying photographs from non‐photographic images. Although there are some researches using painting or cartoon images, almost entire computer vision research are using pictures. Therefore, classifying photographs from non‐photographic images are very important for computer vision researchers. Because the most concurrent and biggest image dataset is the internet itself, automatic classification of an image as a photograph of a real‐scene or as a non‐photographic image is very useful when we harvesting image databases from web. My project topic is automatic classifier which distinguishes cartoon images and paintings from photographs. I focused on distinguishing on cartoon images from photographs, because there are numerous cartoon images on the web, so classifying cartoon images also useful for many purposes potentially. This project is mainly based on [1], which is distinguishing paintings from photographs. I added some idea of [2], which introduced some idea of distinguishing drawing and symbolic images from harvested web images. 2. Proposed distinguishing features Firstly, I implemented and used paper [1]’s visual features. Actually, [1]’s goal is distinguishing paintings from photographs, but I proposed that cartoon images shares same features with paintings, so I used same features in [1]. For cartoon specific features, I used [2]’s suggested features, which is very briefly described. I also thought about my own cartoon distinctive features, but my ideas ‐ like patches of uniform color, strong black/dark edges components ‐ are already included features in [1] and [2], so I preferred to optimized these features. 2.1 Visual features These features include four scalar values: the portion of color edges and intensity edges, spatial variation of color, number of unique colors, and pixel saturation. Firstly, they ([1]) think that removing color eliminates more visual information from painting, because painting used color from its generation. Therefore, they proposed that paintings have more color edges (which is an edge biased with one color channels) than photographs. This feature denoted as Eg. Secondly, they proposed that there are larger color changes in paintings than in photographs. They used a 5x5 kernel to check the changes, and used sum of the areas of the facets of the pyramid determined by calculated normals from each color channels(R, G, B). This feature denoted as R. Thirdly, they proposed that paintings have more unique colors than photographs. They used normalized unique color number. For cartoons, I thought there are small numbers of unique colors, but I can use this feature as distinguish feature for distinguishing cartoon images from photographs. This feature denoted as U. Finally, they proposed that painting has larger portion of highly saturated pixels. They made 20 bins of saturated pixels, and used the ratio of the count in the highest bin and the lowest bin. This feature denoted as S. I denoted classifier using these four values for features as C1. I implemented this features same as [1], because this features are also suitable for cartoon images, and my first small test set works well with these features.

2.2 Pixel distribution in RGBXY space This feature is 5‐dimension vector, which is singular vector of RGBXY pixel covariance matrix. With this singular vector, we can figure out the character of pixel distribution. I denoted classifier using these four values for features as C2. 2.3 Uniform texture information They proposed that texture elements in photographs tend to be more repetitive than painting, because hand‐crafted images might not maintain texel uniformly. They used Gabor function to detect texel information. They mention this method too briefly, so I read [3] to understand this features. For cartoon images, it is some complicated. Usually, cartoon images are using similar color in large patches, and do not have uniform texels. However, for gray cartoon images, they contain uniform texels (which called screen tone) to simulating color. I could not made guess for the values, but I thought that this feature is also useful to distinguish cartoon images from photographs. Therefore, I included and tested with this feature. I denoted classifier using these four values for features as C3. 2.4 Color Histogram In [2], they used color histogram for distinctive feature to classify drawing and symbolic images. They proposed this because symbolic images and drawing has only few colors in large areas. They used 1000 equally spaced bins for their purpose. However, I think that is too much for my small data set, so I used 50 bins; my data set is 1/20 of their ones, so I apply same ratio. I denoted classifier using these four values for features as C4. 2.5 Intensity Gradient Histogram In [2], they used L2‐norm of gradient histogram for distinctive feature to classify drawing and symbolic images. Similar to 2.4, they proposed this because symbolic images and drawing has only few colors in large areas. I also used 50 bins for this feature. I used Gabor function implementation from web. I denoted classifier using these four values for features as C5. 3. Image Set I used 100 training images for each category (cartoon, painting, picture), and I used 52 test images for each category. These images are classified with my criterions. I used Google image search, free art galleries, free photographs, cartoon blogs, and my own collections. I avoided some pictures which is rare case and difficult to classify, like a photograph of painting canvas in art gallery. Also, I tried to include a wide variety of styles and quality. For cartoon category, I include various styles of cartoons, from American news paper cartoons to Japanese Anime style. For picture, I include various quality and objects. For painting, I tried to include various artistic styles. Collecting images was hard and tedious task, so I could not scale up these data sets easily. Therefore, I focused on a variety within this small datasets. 4. Result 4.1 Classification in {Eg, U, R, S} visual feature space (C1) Graph of mean Eg : 1 represents cartoon images, 2 represents painting images, 3 represents picture images As you can see, cartoon and painting has less Eg value than picture images. This result suits my initial guess. Also, the different between painting and pictures are larger than cartoons and pictures. Therefore, this feature seems more effective for painting than cartoon, but it is still useful feature.

Graph of mean U : 1 represents cartoon images, 2 represents painting images, 3 represents picture images As you can see, cartoon and painting has less U value than picture images. This result suits my initial guess, and unlike [1]’s guess, it is less than picture even for painting. Also, the different between painting and pictures are larger than cartoons and pictures. Therefore, this feature also seems more effective for painting than cartoon, but difference between cartoon and painting is very slight.
Graph of mean R : 1 represents cartoon images, 2 represents painting images, 3 represents picture images Cartoon and painting has less R value than picture images, but it is very slight (catroon 0.5148, painting 0.5065, picture 0.5173). However, this result suits my initial guess, though very slight difference. Also, the different between painting and pictures are larger than cartoons and pictures.

Graph of mean S : 1 represents cartoon images, 2 represents painting images, 3 represents picture images Unlike Eg, R, and U, there are large difference between cartoon and painting. Painting is much bigger than picture and cartoon, and cartoon is smaller than picture value. However, the difference between cartoon and pictures are in proper scale, so this feature could be used for classifier.
Figure of {Eg, U, R, S} space: Cartoon, painting, and photograph data points presented separately in the same two‐dimensional space of first two principal components. Cartoon: Painting:
Picture:
Because of small scale data set, the graph is very sparse. However, we can see ball‐park figure of their distribution. Painting seems to be more declivity than others, and seems to distribute more largely in second largest principle component than others. Cartoon data points are also spread wider than picture, and distribute

more largely in first largest principle component. Figure of RGBXY space: Cartoon, painting, and photograph data points presented separately in the same two‐dimensional space of first two principal components. Cartoon: Painting:
Picture:
Also due to small scale data set, the graph is very sparse. However, we can see ball‐park figure of their distribution. Cartoon has less distribution of two dimensions than others, and painting is condensed in right‐down side. Picture seems to have most spreading distribution among 3 categories. Figure of mean and standard deviation of the Gabor filter output: red represent cartoon, green represent painting, blue represents picture. Four lines means four scale of Gabor filter. Horizontal means: Vertical means: Diagonal means:
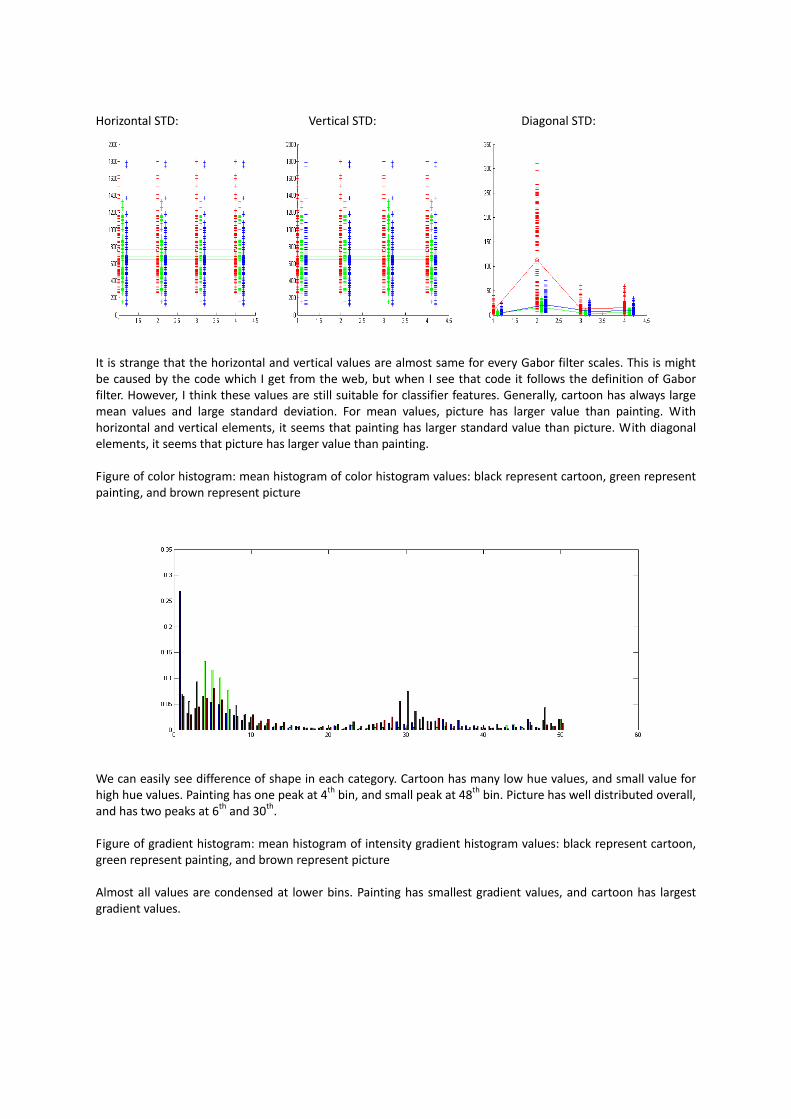
Horizontal STD: Vertical STD: Diagonal STD:
It is strange that the horizontal and vertical values are almost same for every Gabor filter scales. This is might be caused by the code which I get from the web, but when I see that code it follows the definition of Gabor filter. However, I think these values are still suitable for classifier features. Generally, cartoon has always large mean values and large standard deviation. For mean values, picture has larger value than painting. With horizontal and vertical elements, it seems that painting has larger standard value than picture. With diagonal elements, it seems that picture has larger value than painting. Figure of color histogram: mean histogram of color histogram values: black represent cartoon, green represent painting, and brown represent picture
We can easily see difference of shape in each category. Cartoon has many low hue values, and small value for high hue values. Painting has one peak at 4th bin, and small peak at 48th bin. Picture has well distributed overall, and has two peaks at 6th and 30th. Figure of gradient histogram: mean histogram of intensity gradient histogram values: black represent cartoon, green represent painting, and brown represent picture Almost all values are condensed at lower bins. Painting has smallest gradient values, and cartoon has largest gradient values.

5. Classifier Methods and Performances 5.1 Classifier methods I tried basically two hierarchy of classifier. Firstly, I made lower classifiers with features at first level. At second level, I made average classifier same as in [1]. For first level classifiers, I tried SVM, nearest‐neighbor, and K‐nearest‐neighbor with various feature combinations. For second level classifiers, I tried various combinations of different first level classifiers. I implemented nearest‐neighbor and K‐nearest‐neighbor classifier, and I used implemented SVM classifier from web. I could not find SVM toolkit for MATLAB which can be properly compiled at my computer, so I used WinSVM. It need text file as an input, so generating this files was very tedious and time‐consuming process. I tried many kernel functions, and I chose Gaussian kernel with gamma 3. The ultimate goal for this project is generating a classifier which distinguishing cartoon images from photograph, so I focused on the increasing hit rate for cartoon‐photograph classifier. 5.2 Classifier result for first level classifier To determine K in K‐nearest‐neighbor classifier, I tested with K=3~7 values, and 5 was optimal. I tested with C1, C2, and C3 features, and used cartoon‐photograph classifier. K=3 K=4 K=5 K=6 K=7 0.8381 0.8190 0.8476 0.8381 0.8000 Result of cartoon‐photograph classifier with various features Cartoon‐Picture K‐nearest Nearest SVM C1 0.5714 0.5429 0.6190 C2 0.6571 0.7048 0.6476 C3 0.8000 0.7048 0.6857 C4 0.6952 0.7143 0.5428 C5 0.7143 0.7429 0.7142 C12 0.6952 0.6762 0.5619 C23 0.8286 0.7714 0.4857 C45 0.7810 0.7619 0.4952 C123 0.8476 0.8476 0.5047 C1234 0.7810 0.7905C1235 0.7905 0.7429C12345 0.8000 0.7905 0.5047

Result of painting‐photograph classifier with various features Painting‐Picture K‐nearest Nearest SVM C1 0.6952 0.6857 0.7523 C2 0.7714 0.7619 0.7809 C3 0.7238 0.7810 0.6571 C4 0.6571 0.6190 0.5333 C5 0.7143 0.6571 0.7619 C12 0.8381 0.7905 0.6952 C45 0.7524 0.6857 0.5333 C123 0.8000 0.7905 0.5333 Surprisingly, SVM does not work well. Moreover, adding more feature make SVM work less successful. With more than three features, SVM make almost a random decision (closed to 0.5). For using just one features, SVM works well, except for C4. As you can see, C1, C2, and C3 works more well (over 70%) for Painting‐Picture than for Cartoon‐Picture. This result suits for my expectation with the mean values of that features. Generally, K‐nearest‐neighbor method is best classifier method. Most distinguishable and effective feature for Cartoon‐Picture classifier is C5. It results with over 70% with all method. C1 and C2 are not good by their own, but they work well if they are assimilated to other features. With using C1, C2, and C3, we can get over 80% for Cartoon‐Picture and Painting‐Picture, which means the features in [1] is also good for distinguishing cartoon images from picture. 5.2 Classifier result for second level classifier For average classifier, I used average value of K nearest‐neighbor’s value for K‐nearest‐neighbor classifier. Value 1 means cartoon or painting, and ‐1 means picture. I used reciprocal value of square root of distance for nearest‐neighbor classifier. Result of average cartoon‐photograph classifier with various first level classifiers Cartoon‐Picture K‐nearest Nearest SVM C123+C45 0.8762 0.8286 C1+C2 0.6857C123+C4 0.8857 0.8000 C1+C3 0.6476C123+C5 0.7905 0.7238 C1+C4 0.6095C123+C4+C5 0.8095 0.7524 C1+C5 0.7143C12+C45 0.8286 0.6762 C2+C3 0.6667C12+C4 0.7810 0.6857 C2+C4 0.6762C12+C5 0.7810 0.7143 C2+C5 0.7810C23+C45 0.8857 0.7524 C3+C4 0.5524C23+C4+C5 0.8190 0.7333 C3+C5 0.7143C2+C3+C4+C5 0.8000 0.7333 C1+C2+C3 0.6667C2+C3 0.7714 0.7143 C1+C3+C5 0.6857C2+C5 0.7333 0.7238 C1+C4+C5 0.7238C3+C4 0.8095 0.7143 C2+C3+C4 0.7048C3+C5 0.8000 0.6762 C2+C3+C5 0.7714C2+C3+C5 0.7905 0.7143 C1~3+C5 0.7333C2+C3+C4 0.8190 0.7333 C1~5 0.7429C1+C2+C3 0.7429 0.5714 I chose most good first level classifiers and make combination with those first level classifiers. Because SVM works so badly for using more than one feature, I only used SVM for single feature. SVM is getting better when average with other features, but not as well as K‐nearest and nearest. With nearest neighbor classifier, there are not many improvement of hit rate, actually almost same or even worse than better one of original first level

classifiers. However, K‐nearest‐neighbor classifier usually improves from original first level classifiers. Therefore, using K‐nearest‐neighbor as first level classifier and averaging them with average classifier, I can get hit rate of 88.57%. C123+C4 and C23+C45 has same hit rate, but C123+4 has the classifier values for misclassified images are more close to 0 than C23+C45, which means it is not sure for misclassified images, so it is better classifier. Therefore, with my experiment, I think C123+C4 with K‐nearest neighbor classifier is the best classifier for Cartoon‐Picture classification. Classification values for misclassified images C123+C4 Values C23+C45 Values goya_general.jpg ‐0.2000 Same ‐0.2000 lgfp1572+darth‐vader‐cartoon‐style‐star‐wars‐poster.jpg
‐0.4000 2차알파특전.jpg ‐0.4000
nightelfvsundead_preview.jpg ‐0.4000 Same ‐0.4000 zenga.jpg ‐0.4000 Same ‐0.4000
가오파이거.jpg ‐0.6000 Same ‐0.8000
섹시XP걸.jpg ‐0.2000 건담해머.jpg ‐0.4000
젠가.jpg ‐0.4000 image_0029.jpg 0
cheetah.jpg 0 leopard.jpg 0.2000 image_0001.jpg 0.6000 Same 0.4000 image_0053.jpg 0 Same 0 jenna‐jameson‐picture‐1.jpg 0 picture_lg_crowd.jpg 0.4000 kleinscamp135a.jpg 0.2000 Same 1.0000 5.3 Misclassified images Values are C123+C4 classifier, which is best. I would show that misclassified images both for C123+C4 and for C23+C45. Images of False positive: left‐top ‐0.2000, right‐top ‐0.4000, left‐bottom ‐0.4000, right‐bottom ‐0.6000 These cartoon images are classified as picture images. They share some properties: complex and detailed image. Also, except for left‐top images, they have unusual color distribution for cartoons. They have very bright and highly saturated color, and have numerous and various colors. Also, except for left‐bottom image, all the other images could be classified as painting in some cases. Therefore, with using my features, my classifier misclassified these images as pictures. As you can see, my classifier was not sure about left‐top image (with 20% probability), and a little certain about right‐bottom images with 60% probability. Here are scalar vectors (Eg, U, R, S) for this misclassified images. We can see left‐top image follow tendency to mean values of cartoons, but others are similar to the mean value of pictures in many dimensions. Right‐top images have larger intensity edges, bigger spatial variation of color, and more saturated colors than usual cartoon images. Left‐bottom images have also larger unique colors, bigger spatial variation of color, and more saturated colors than usual cartoon images Name Eg U R S goya_general.jpg 0.51382 0.0345 0.501015 0 nightelfvsundead_preview.jpg 0.618676 0.063 0.530122 1.4477 zenga.jpg 0.553905 0.5143 0.56253 7.14593
가오파이거.jpg 0.397916 0.2234 0.527749 0.484151
Mean value for cartoon 0.56072657 0.197882 0.51481055 1.045275211Mean value for picture 0.58124015 0.309608 0.51730436 54.92028512

This is color histogram of misclassified cartoon images. As you can see, except for sky blue one (right‐top image), all the images are similar to picture color histogram, which has two peaks at 6th and 30th bin.

This is intensity gradient histogram of misclassified cartoon images. As you can see, except for sky blue one (right‐top image), all the images have higher values at lower bins than usual cartoon images, and similar to the value of picture gradient histogram.
Images of False positive: left‐top 0.6000, right‐top 0, bottom 0.2000 At first, it is difficult to explain why left‐top image is classified as cartoon with a certainty of 60%. For the right‐top image, classifier say it is cartoon image with 0% certainty, and it has white background, so it has large patches of same color. Therefore, it is easily confused for my classifier. For left‐top and bottom images, it has less saturation color than usual pictures, therefore it could be confused with cartoon image. Here are scalar vectors (Eg, U, R, S) for this misclassified images. As you can see, right‐top and bottom image have less intensity edges than usual pictures have. Also, all the images have less saturated color than usual pictures have. Name Eg U R S image_0001.jpg 0.71961 0.5327 0.534042 0.534643 image_0053.jpg 0.515364 0.3516 0.520302 0.0537303kleinscamp135a.jpg 0.454213 0.5458 0.523824 0.0386103Mean value for cartoon 0.56072657 0.197882 0.51481055 1.045275211Mean value for picture 0.58124015 0.309608 0.51730436 54.92028512 This is color histogram of misclassified picture images. As you can see, all the images have just one peak at lower bins so different from picture color histogram, which has two peaks at 6th and 30th bin.

This is intensity gradient histogram of misclassified picture images. As you can see, all the images have lower values at lower bins than usual picture images, and similar to the value of cartoon gradient histogram.
Therefore, all the misclassified images are reasons related to features used by classifiers. 6. Conclusion In conclusion, my classifier for distinguishing cartoon images and paintings from picture. It can distinguish cartoon image from picture with 88.57% accuracy, can paintings from pictures with 83.81% accuracy. The features used in this project are eight features. They are good for distinguishing cartoon and paintings from pictures, even for the small scale data set. For my project, K‐nearest‐neighbor classifier is much better than SVM. Firstly, I expected that SVM works better

than nearest‐neighbor classifiers because of the small scale of data set, but it does not. It is also better for average classifier than nearest‐neighbor classifier. K‐nearest‐neighbor classifier is simple but powerful with large scale image dataset, so if I scaled up my data base, it became better and better. 7. References: [1] Florin Cutzu, Riad Hammoud, and Alex Leykin. Estimating the photorealism of images: Distinguishing paintings from photographs. CVPR 2003. [2] Schroff, F. , Criminisi, A. and Zisserman, A. Harvesting Image Databases from the Web, ICCV 2007 [3] B.S. Manjunath and W.Y. Ma. Texture features for browsing and retrieval of image data. IEEE Transaction on Pattern Analysis an Machine Intelligence, 18(8):837–842, 1996.